
Study of Human Visual Comfort Based on Sudden Vertical Illuminance Changes

Abstract
:1. Introduction
2. Literature Review
3. Methods
3.1. Study Overview
3.2. Experimental Methods
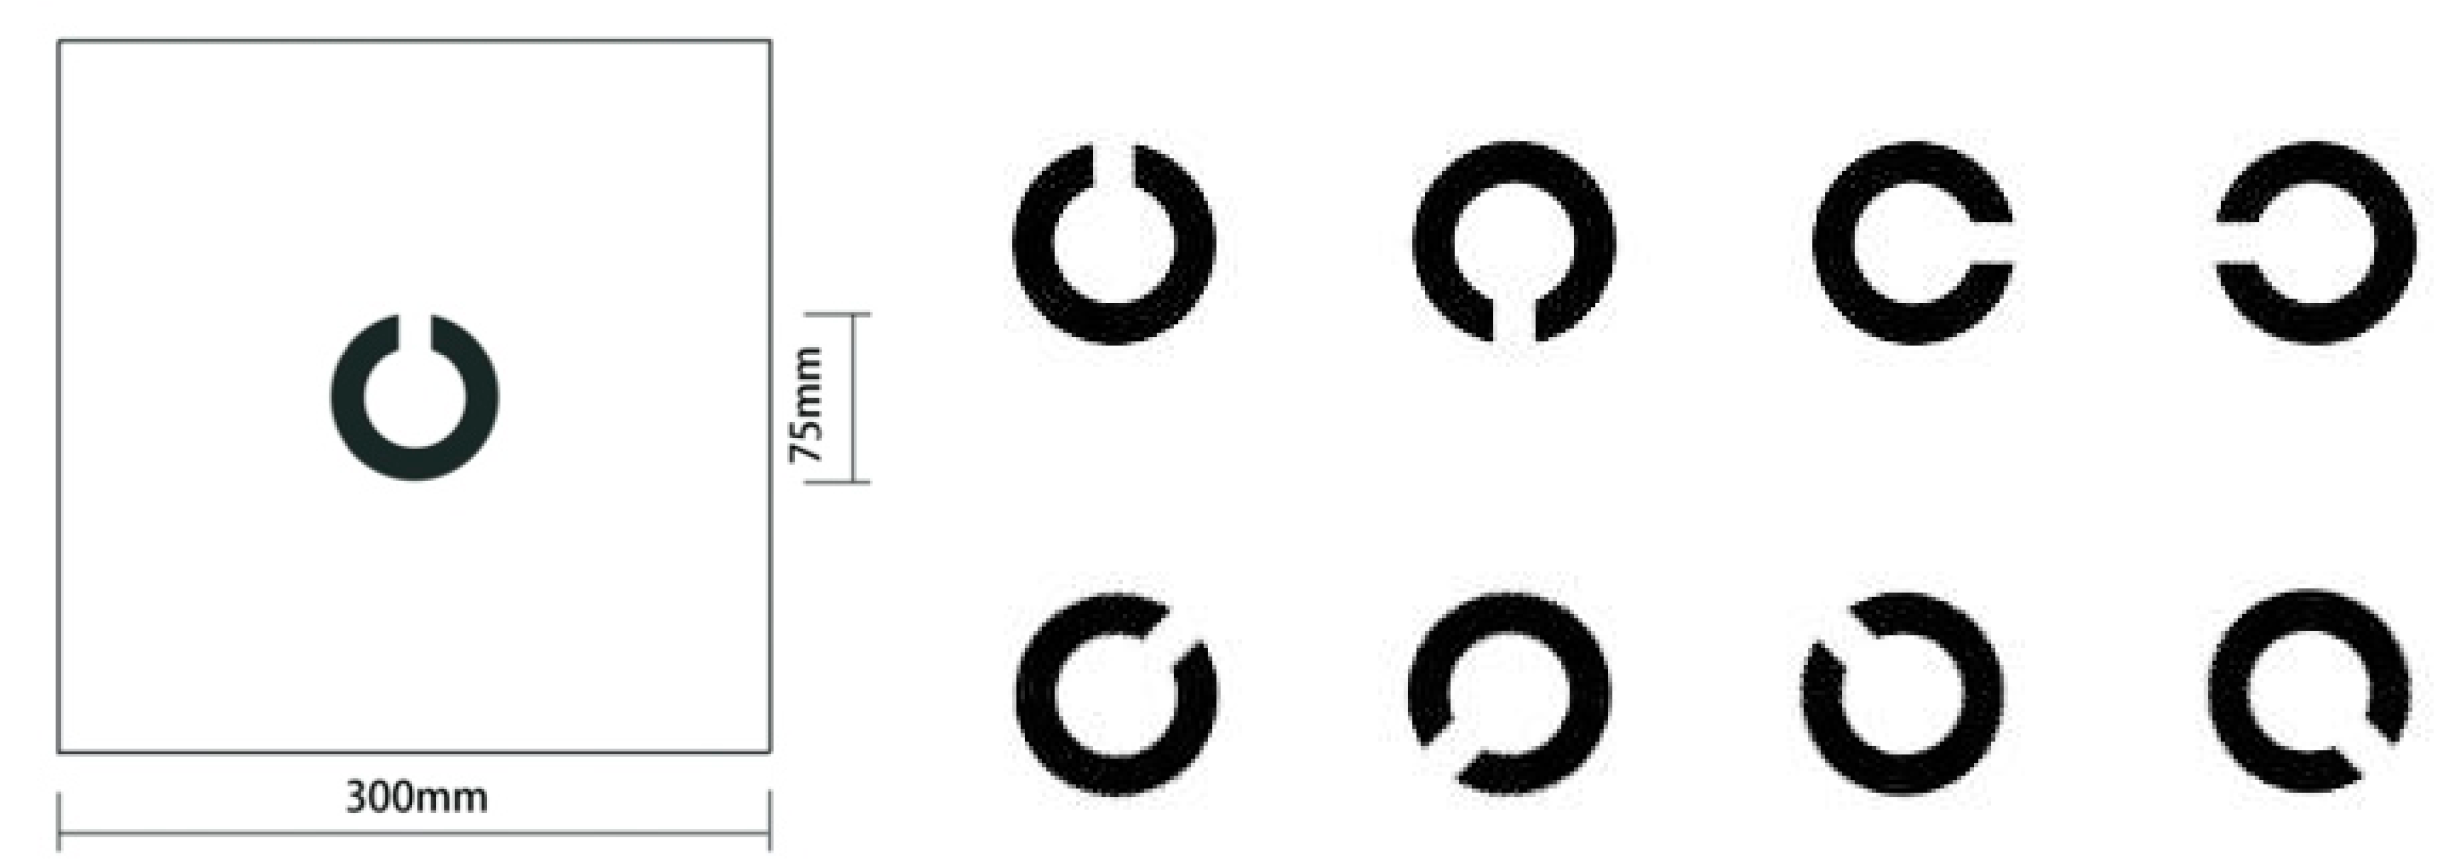
3.2.1. Subjective Evaluation
3.2.2. Subjective Evaluation
3.3. Experimental Design
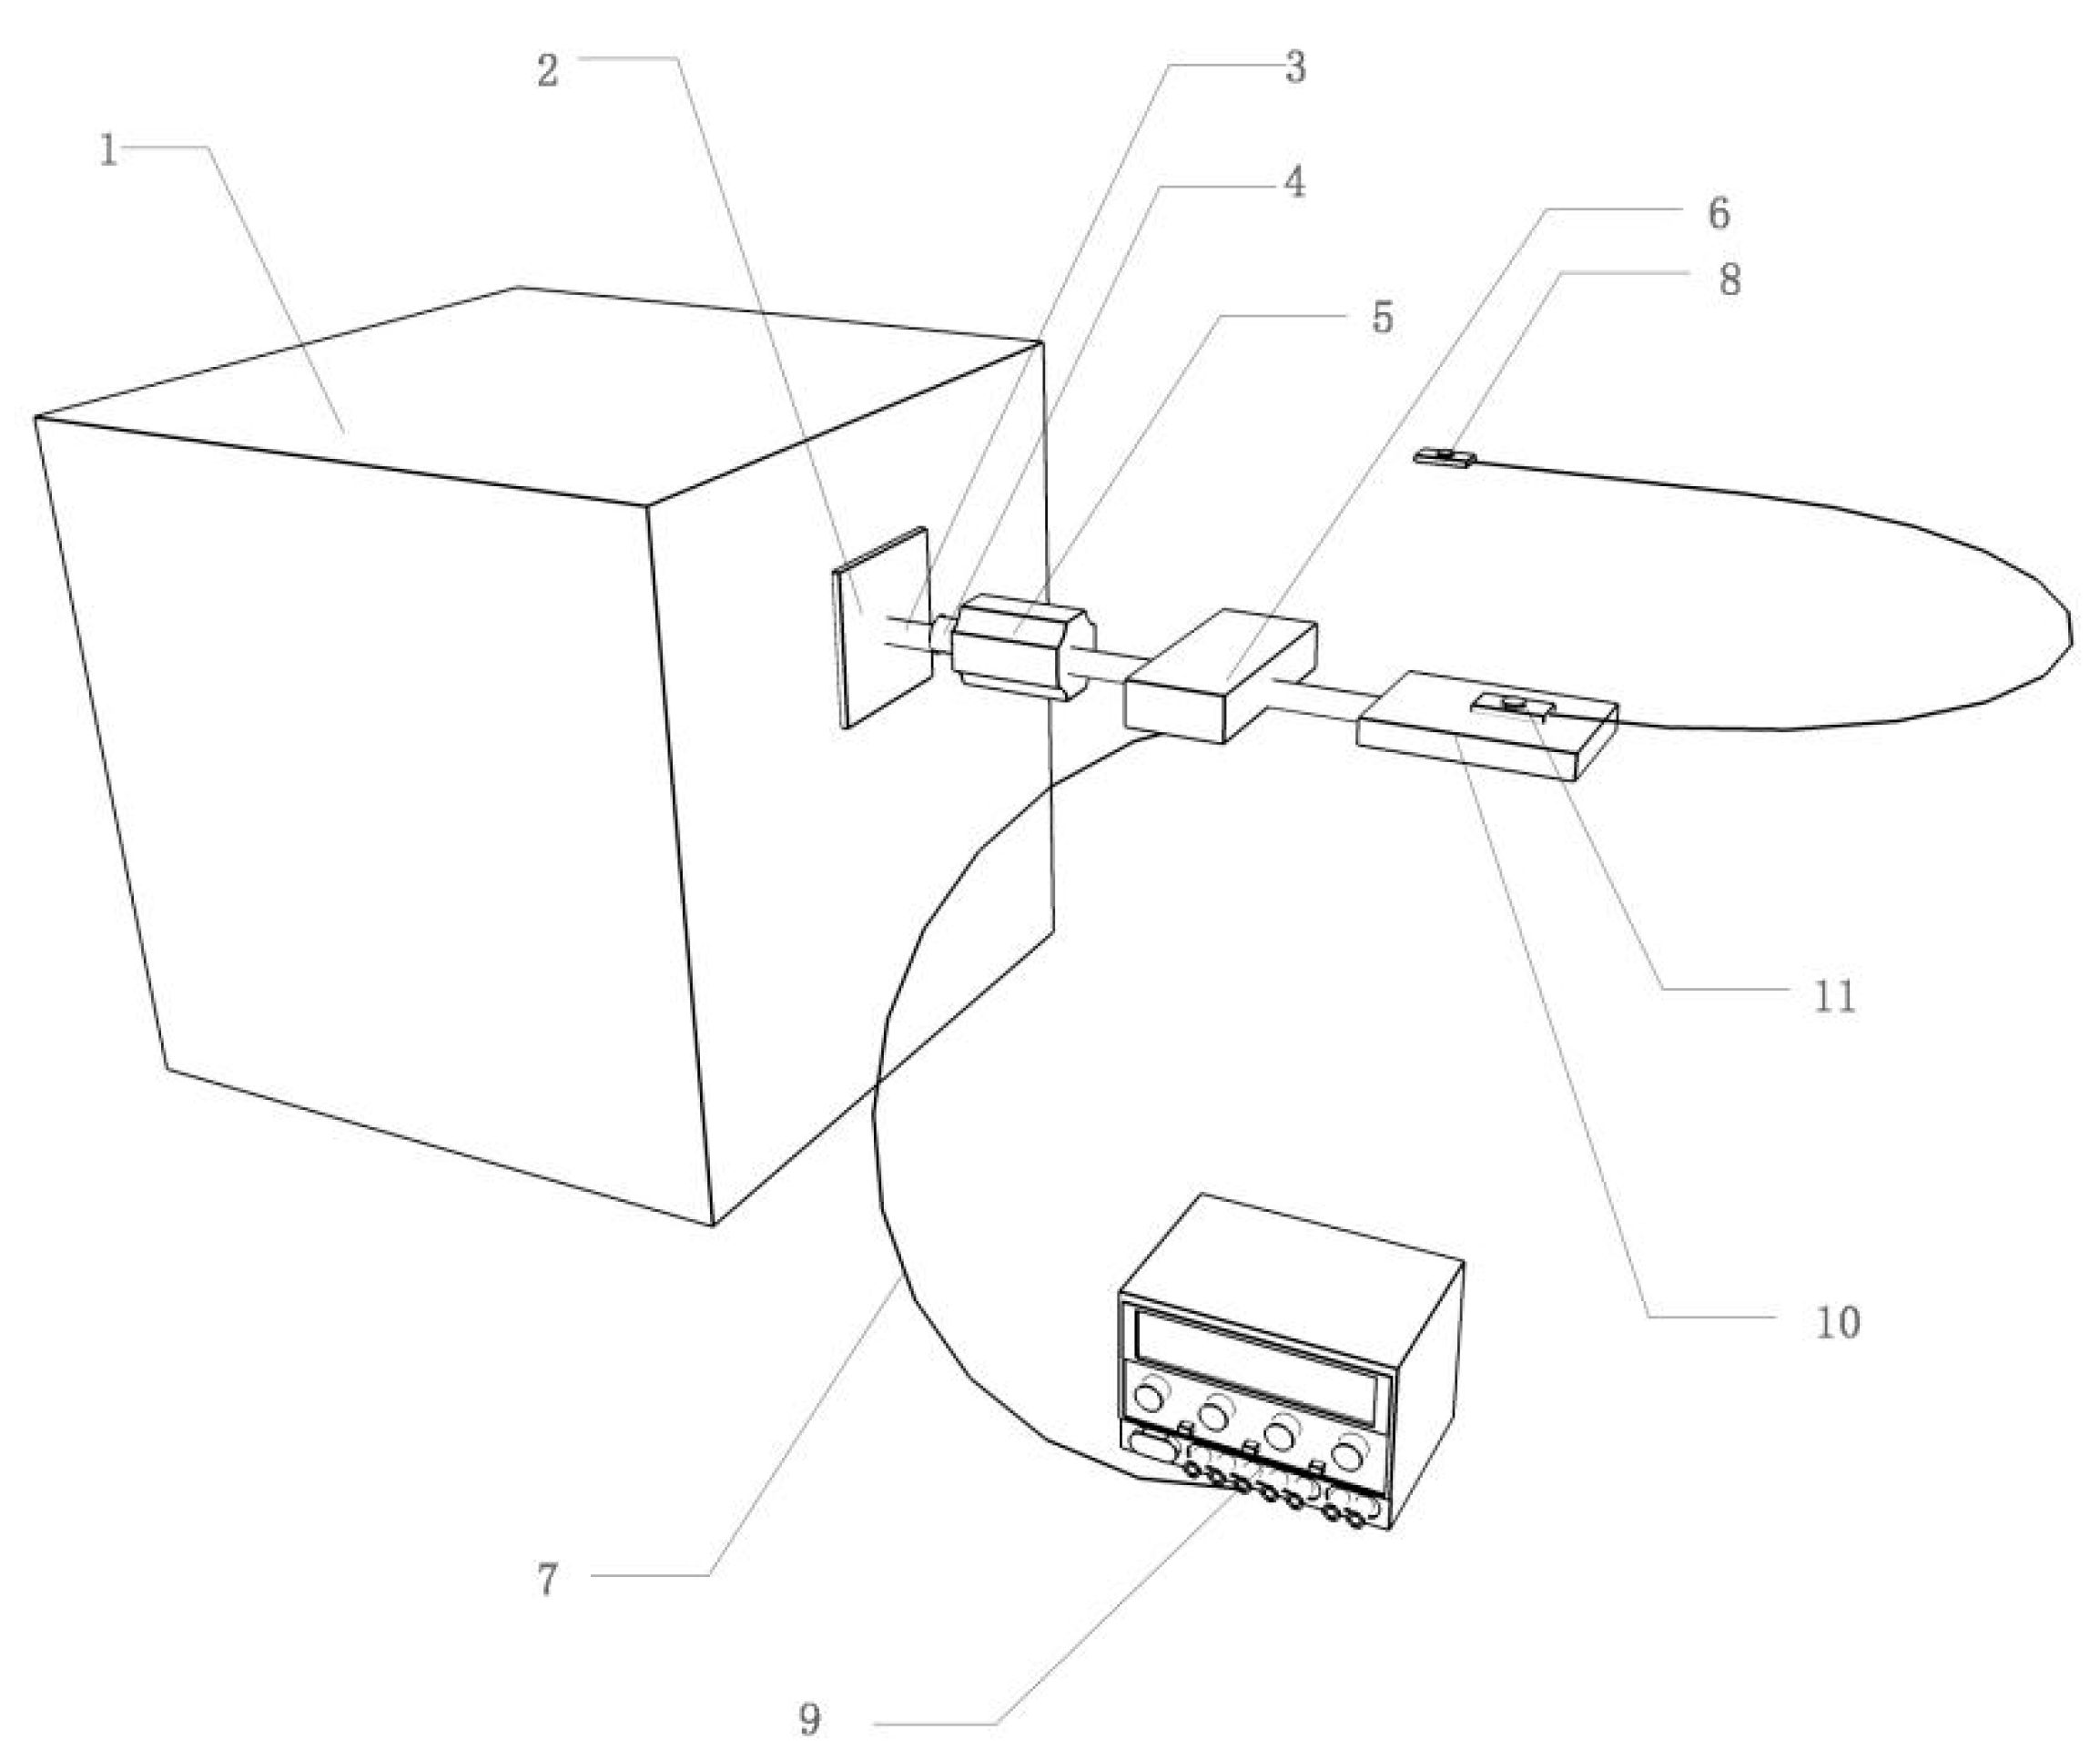
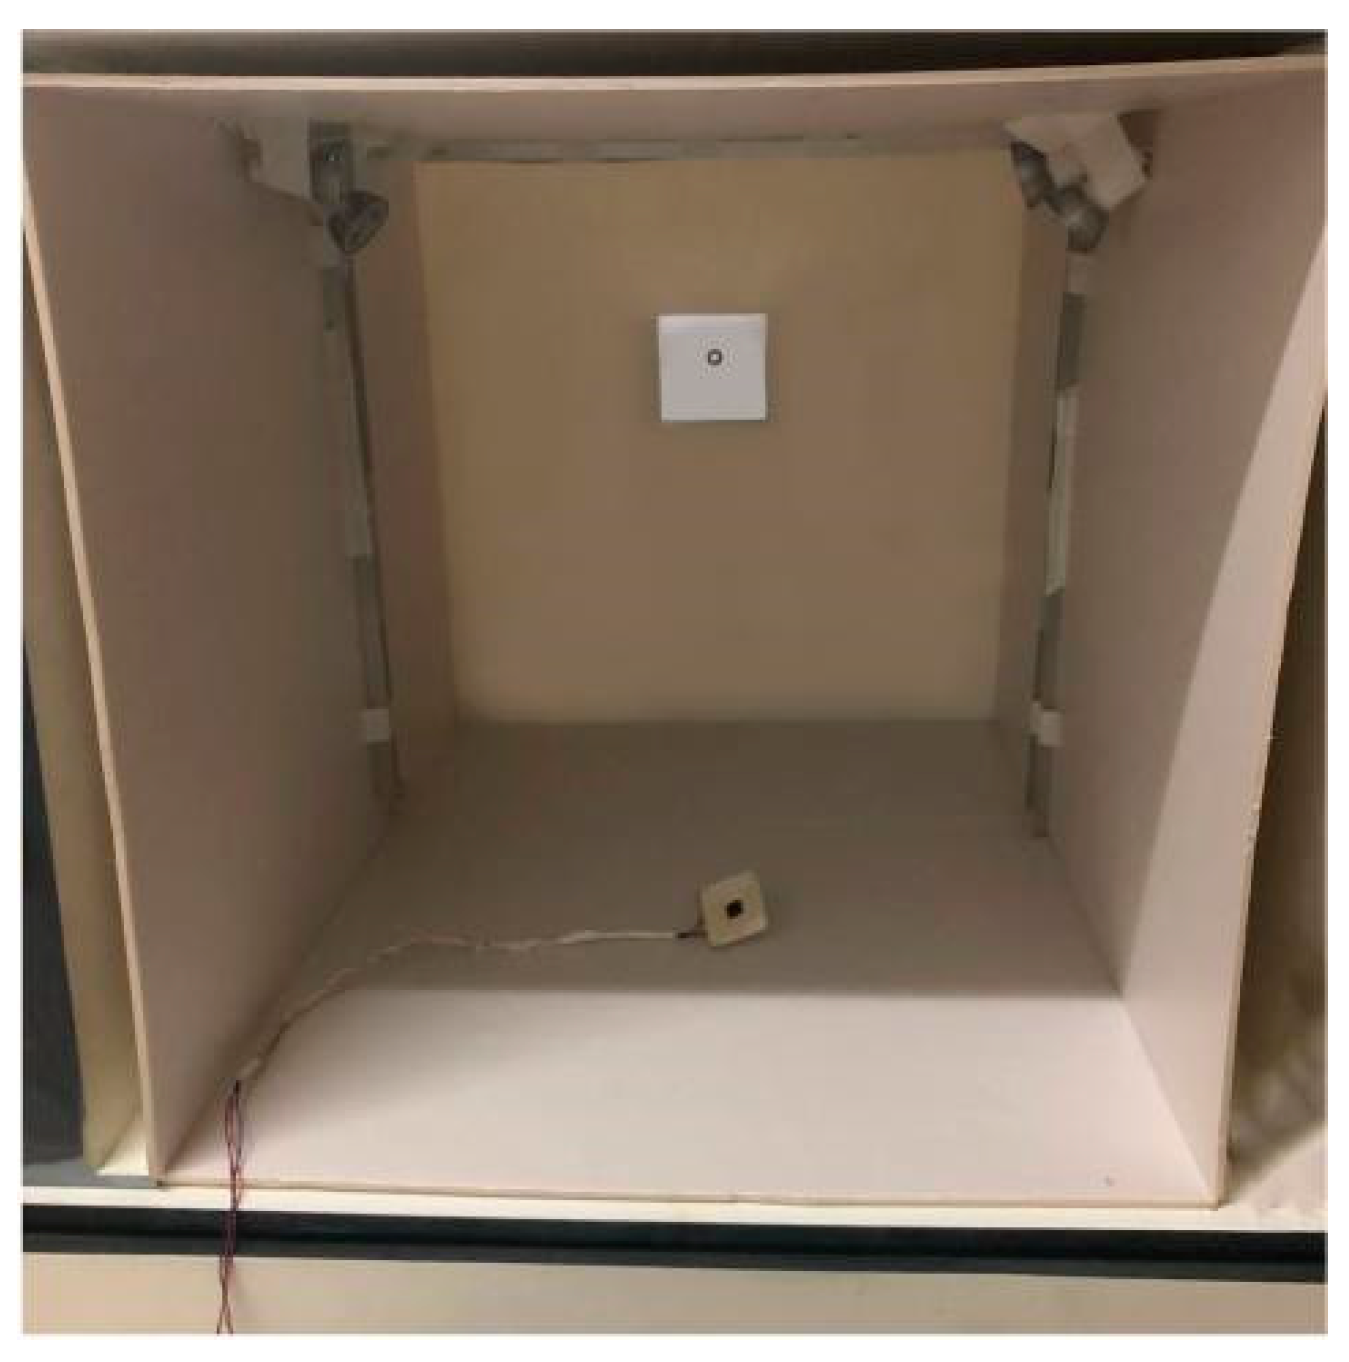
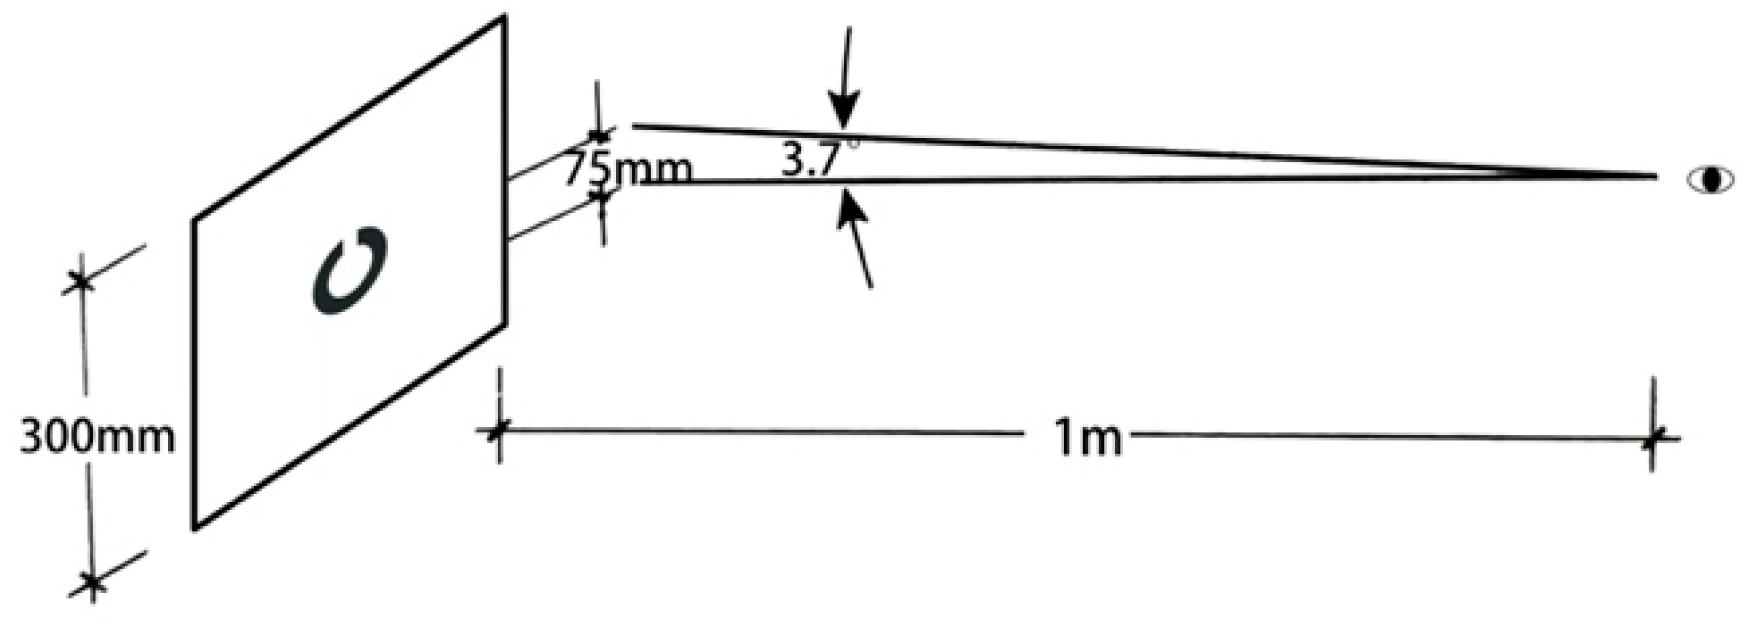
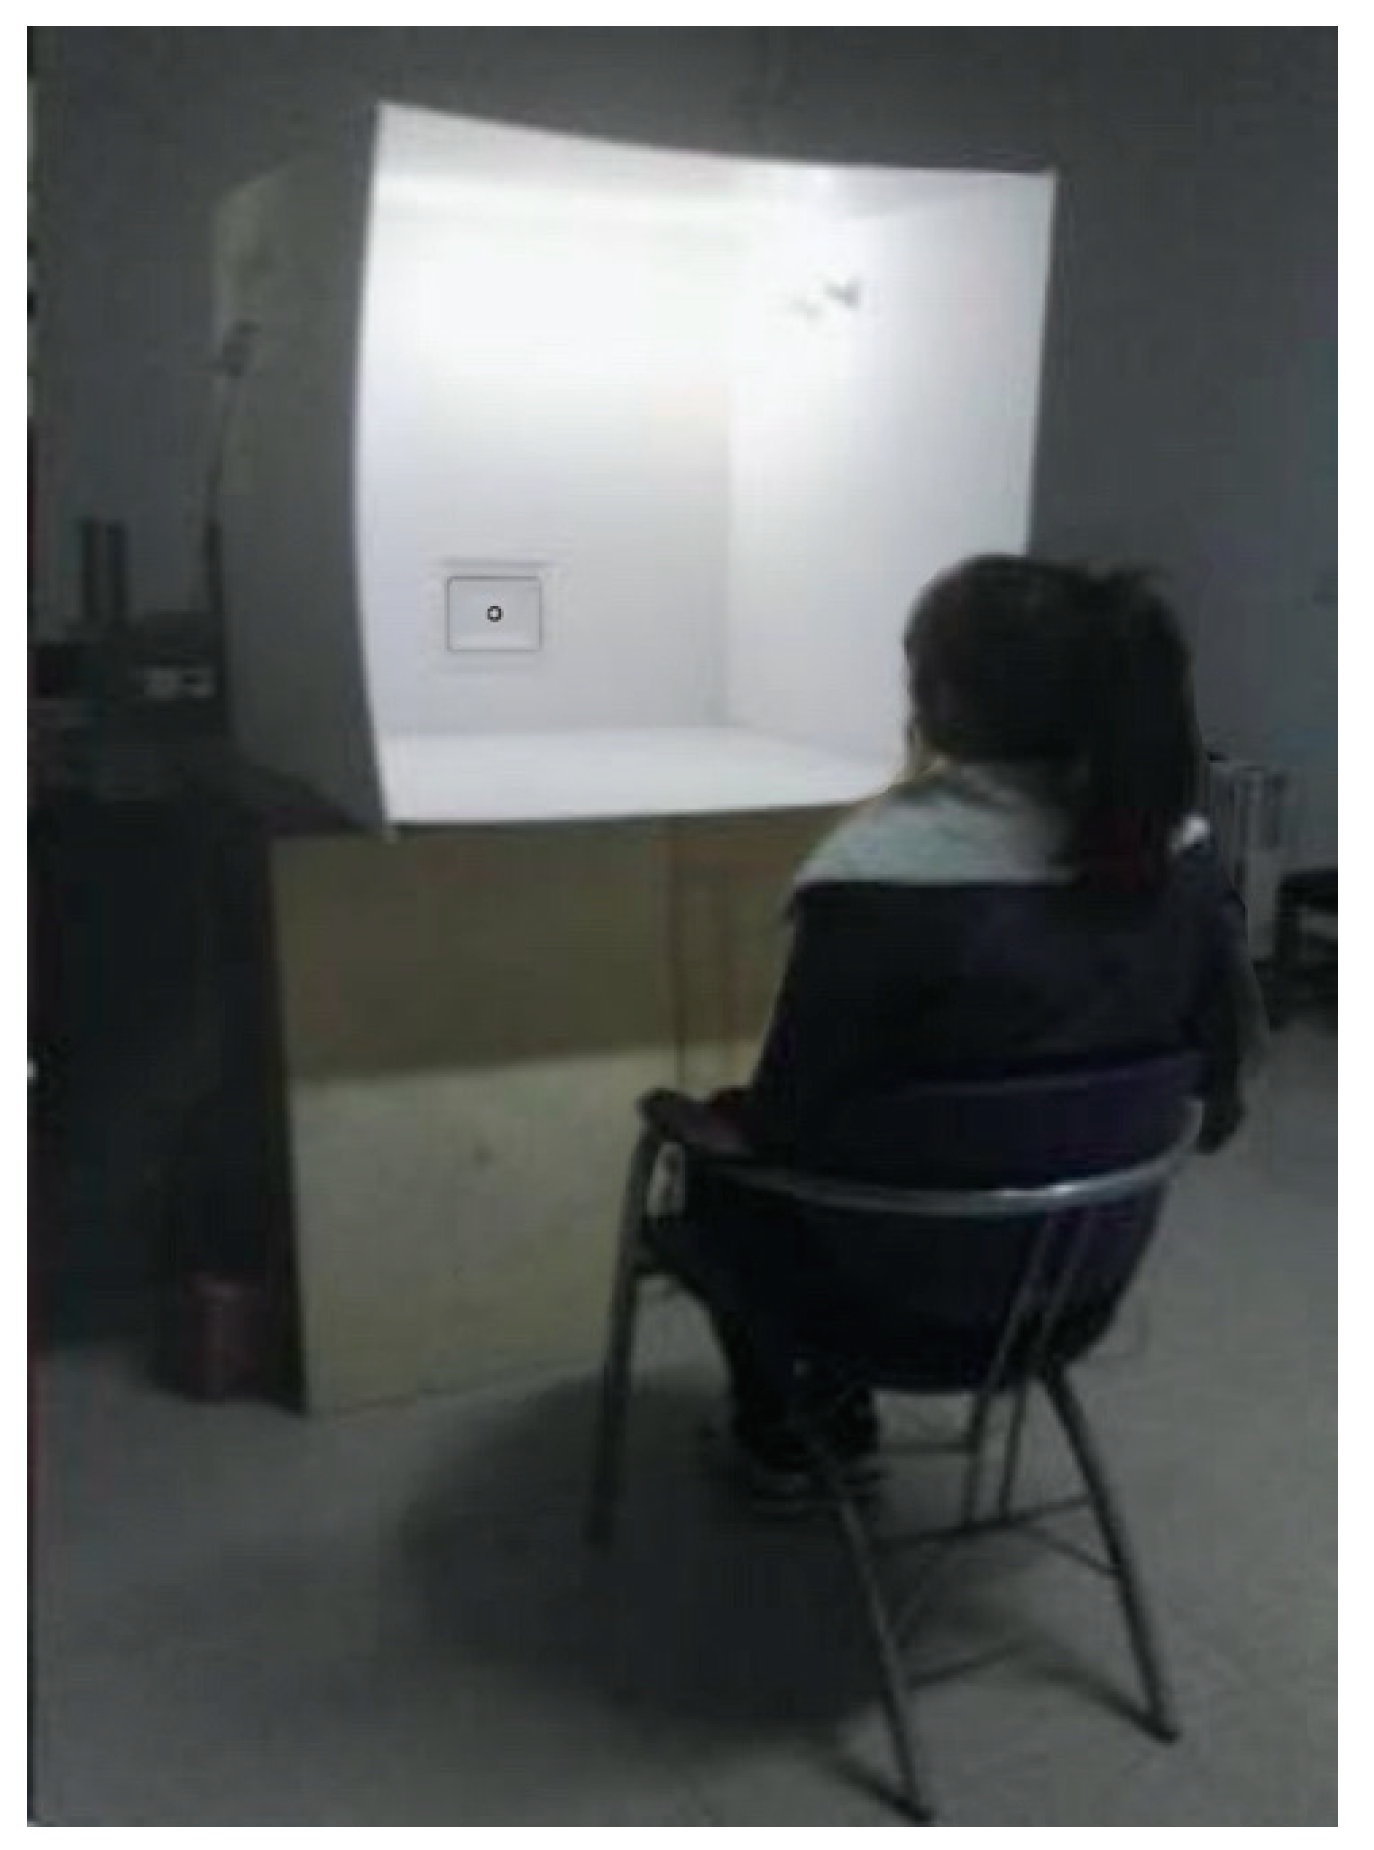
3.3.1. Experimental Setup
- 1.
- Test box part
- 2.
- Control section
3.3.2. Experimental Instrument
- 1.
- Full digital colorimeter and illuminance meter
- 2.
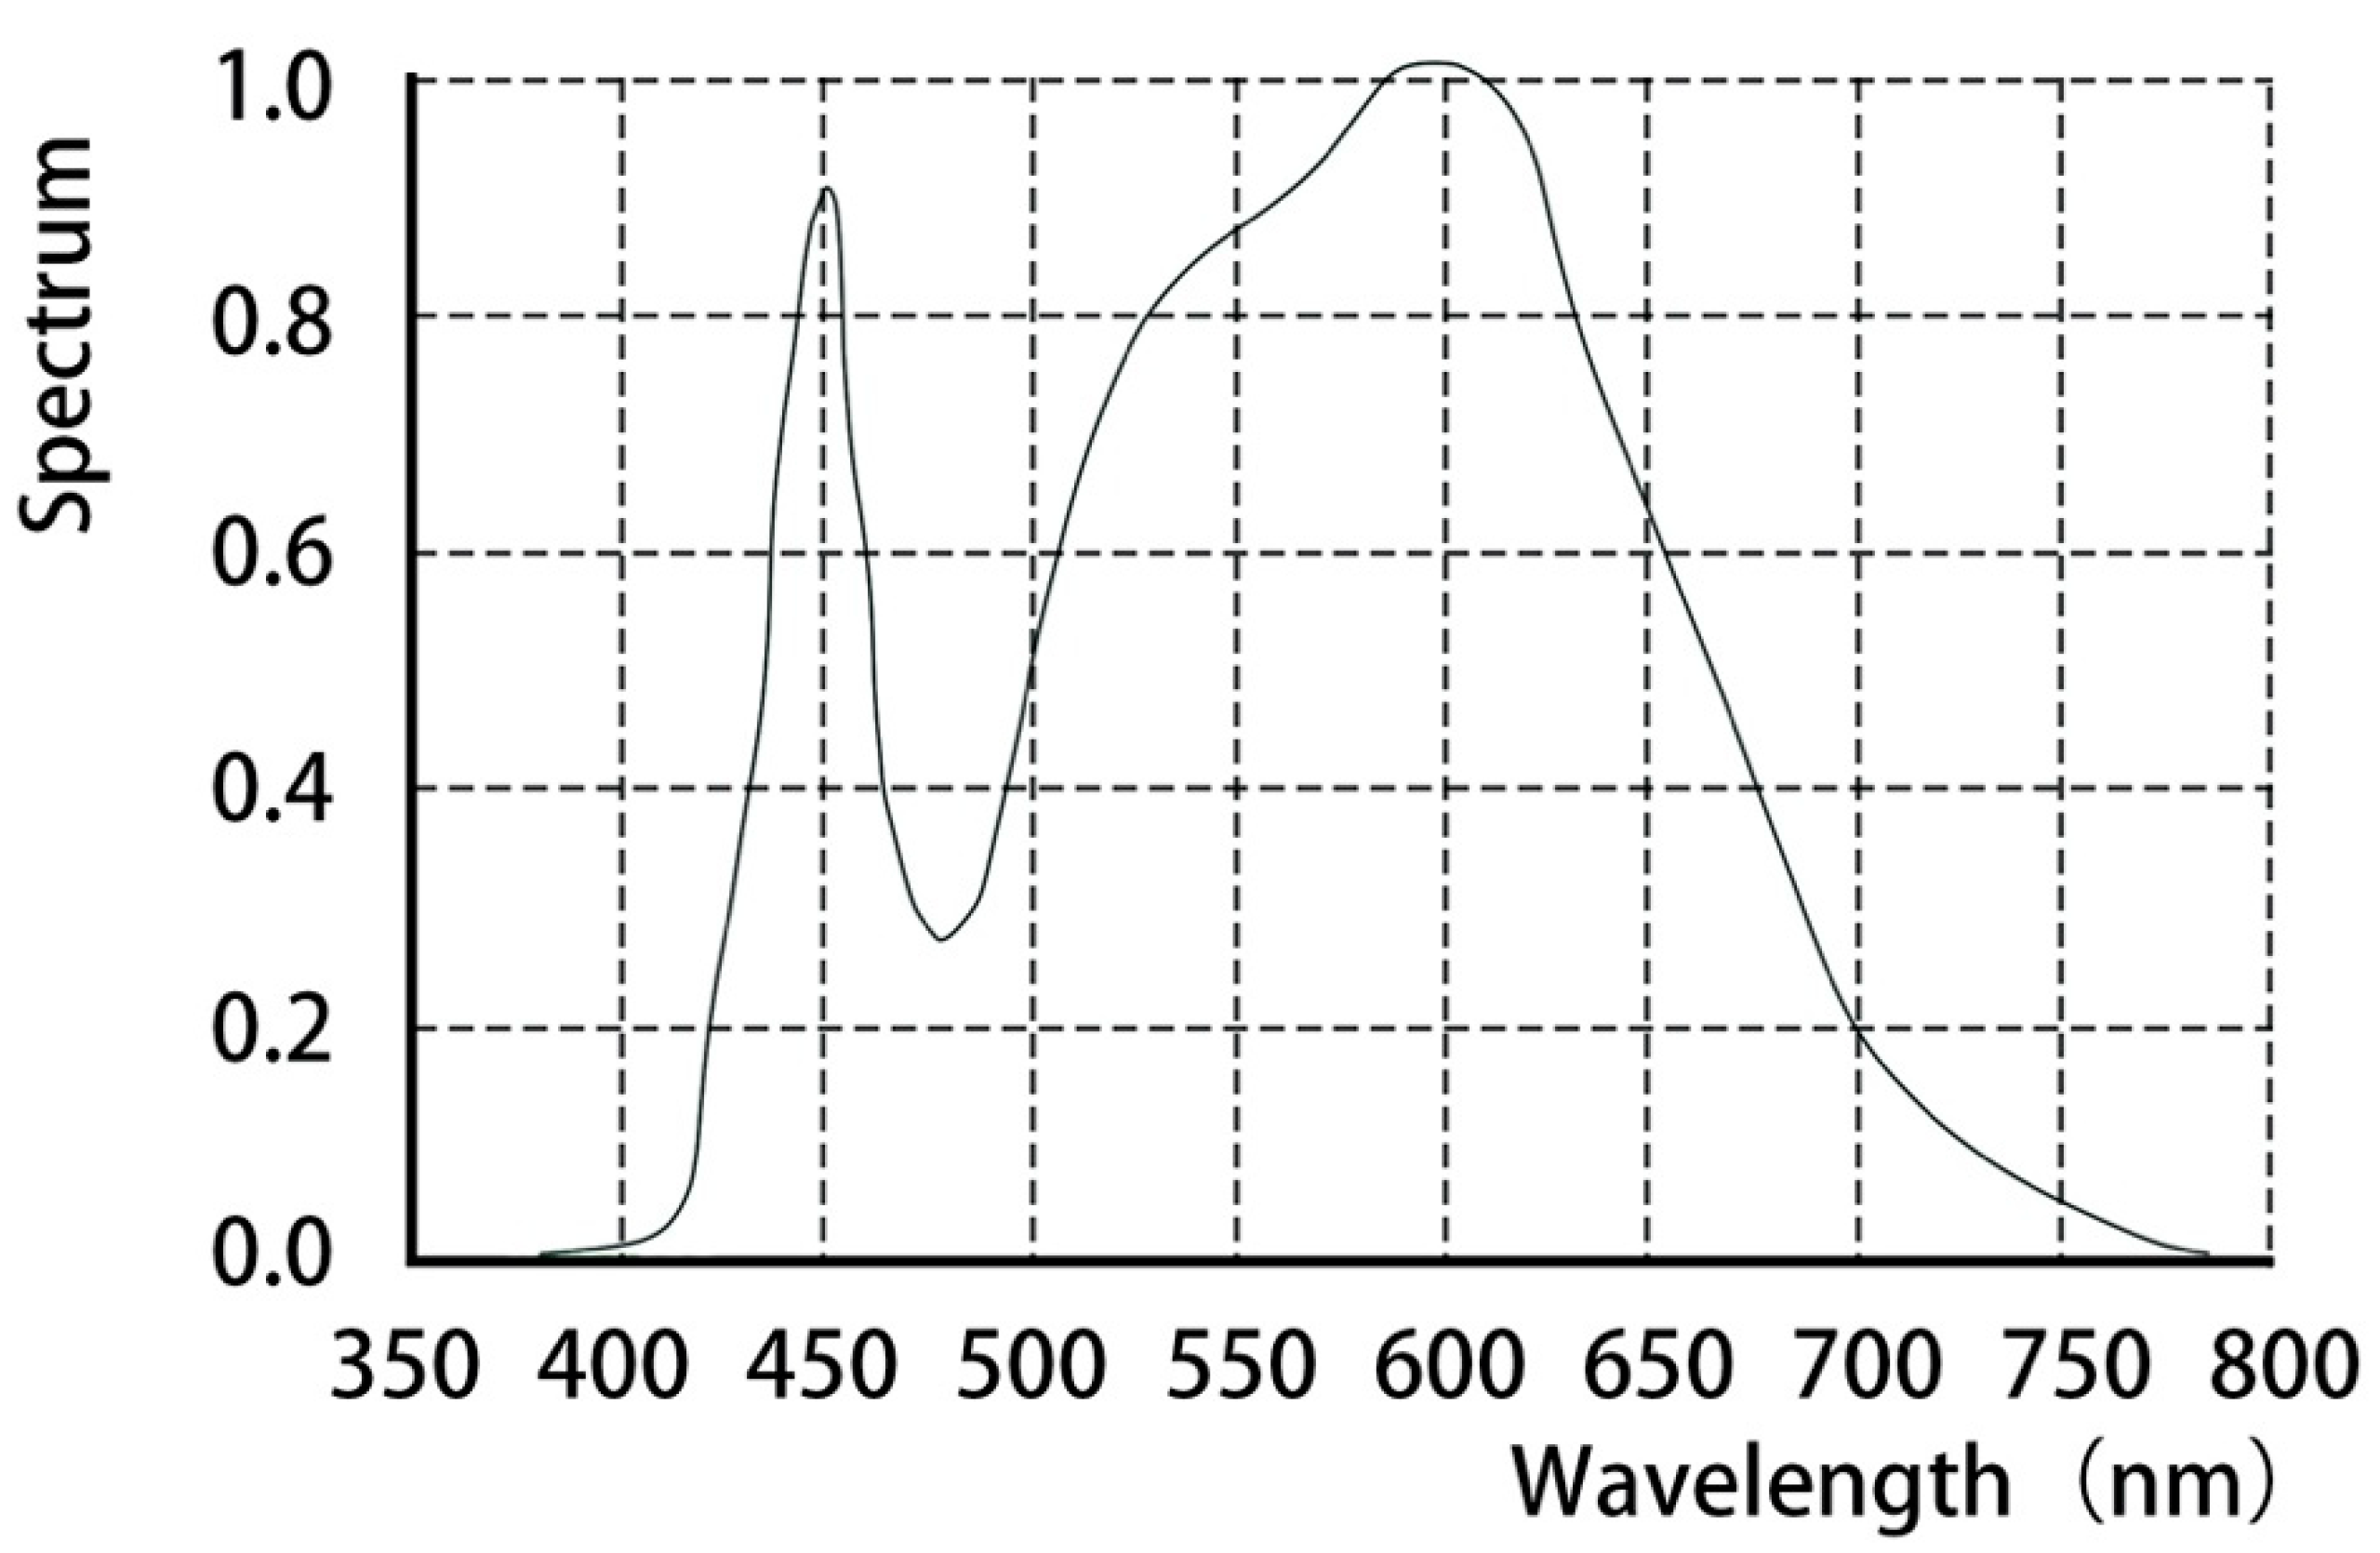
- Induction lamp
- 3.
- Physiological parameter meter
3.3.3. Experimental Parameter Setting
3.3.4. Experimental Procedures
4. Results
4.1. Correlation Analysis Methods
- 1.
- Pearson correlation analysis
- 2.
- Spearman correlation analysis
4.2. Normality Test
4.3. Correlation Analysis
5. Discussion
5.1. Effect of Gender on Visual Comfort
5.2. Effect of Starting Illuminance on Comfort Levels
5.3. Experimental Error Analysis
5.3.1. Practice Effect
5.3.2. Systematic Error
5.3.3. Behavioral Errors
6. Conclusions
- The human eye is an organ that receives light stimuli directly, so the visual adaptation time greatly affects visual comfort. The experimental study of visual adaptation and comfort combines the experimental method of subjective evaluation and objective measurement, which has the advantages of easy operation and analysis of subjective evaluation and the advantage of accurate objective measurement data. The conclusion that reaction time and subjective comfort score are negatively correlated under the condition that vertical illuminance is a single variable is drawn from the experiment, which means that visual comfort increases with the increase in reaction time, and reaction time can objectively reflect visual comfort.
- Through the comparison of the fitted curves of comfort scoring and reaction time for men and women, the mean comfort evaluation scores of men and women are not very different, and through the fitted curves, we can conclude that the reaction time is less than 0.96 s when the comfort score of men is greater than 0; while the reaction time is less than 1.03 s, when the comfort score of female participants is greater than 0. The reaction time and comfort scoring curve trends of men and women are the same; it can be said that female reaction time is slightly longer than male or the requirement for comfort is lower than male, but the difference is slight, indicating that gender has no significant effect on visual comfort.
- The data on blood pressure and heart rate did not change significantly before and after the experiment; we can conclude that there is no significant effect on blood pressure and heart rate when the range of illuminance changes within five times.
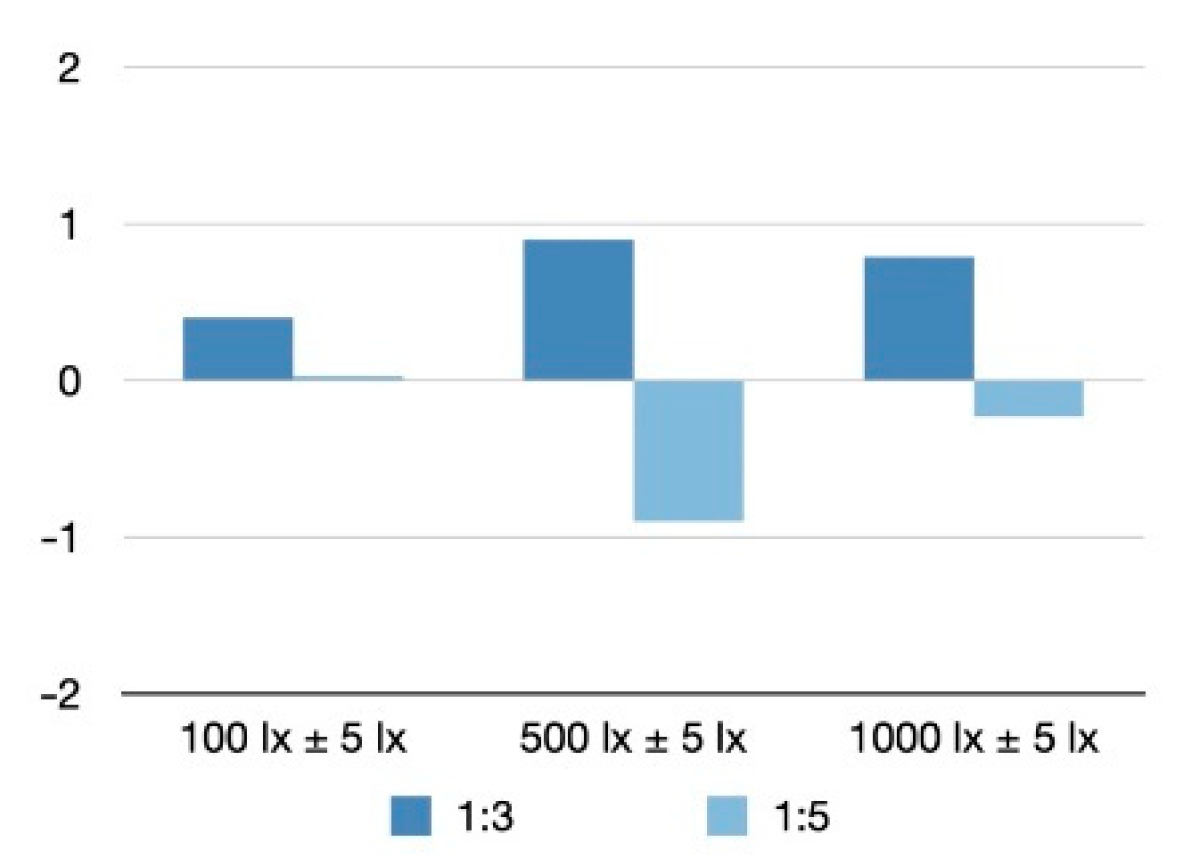
- In addition, too little vertical illuminance can cause a certain level of discomfort, so that the greater the illuminance difference, the greater the reaction time and the lower the comfort score, and controlling the illuminance ratio of adjacent spaces can ensure health and comfort. When comparing experimental groups with starting illuminances of 100 lx, 500 lx, and 1000 lx, it was found that the illuminance 1:3 change condition was more comfortable than the illuminance 1:5 change regardless of the starting illuminance, indicating that the smaller the illuminance change ratio the higher the comfort level, while the 500 lx starting illuminance scored better than the 1000 lx and 100 lx starting illuminance in the illuminance 1:3 change. When the initial illumination is 100 lx, the comfort is the lowest. We think that in the dark change interval, participants unconsciously score not only the change interval, but also the light environment. This study provides data reference for improving the light comfort of architectural space and creates a more comfortable and healthier light environment for people.
Author Contributions
Funding
Institutional Review Board Statement
Informed Consent Statement
Data Availability Statement
Conflicts of Interest
References
- Linhart, F.; Scartezzini, J.L. Evening Office Lighting—Visual Comfort vs. Energy Effic. Vs. Perform? Build. Environ. 2011, 46, 981–989. [Google Scholar] [CrossRef]
- Jones, N.L.; Reinhart, C.F. Experimental Validation of Ray Tracing as a Means of Image-Based Visual Discomfort Prediction. Build. Environ. 2017, 113, 131–150. [Google Scholar] [CrossRef]
- Flynn, J.E.; Spencer, T.J. The Effects of Light Source Color on User Impression and Satisfaction. J. Illum. Eng. Soc. 1977, 6, 167–179. [Google Scholar] [CrossRef]
- Slater, K. Discussion paper the assessment of comfort. J. Text. Inst. 1986, 77, 157–171. [Google Scholar] [CrossRef]
- Hertzberg, H.T.E. The Human Buttocks in Sitting: Pressures, Patterns, and Palliatives. SAE Trans. 1972, 39–47. [Google Scholar] [CrossRef]
- Iacomussi, P.; Radis, M.; Rossi, G.; Rossi, L. Visual Comfort with LED Lighting. Energy Procedia 2015, 78, 729–734. [Google Scholar] [CrossRef] [Green Version]
- EN12665 Light And Lighting—Basic Terms And Criteria For Specifying Lighting Requirements; European Committee for Standardization: Brussels, Belgium, 2011.
- Boyce, P.; Wilkins, A. Visual Discomfort Indoors. Lighting Res. Technol. 2018, 50, 98–114. [Google Scholar] [CrossRef]
- Hopkinson, R.G. Architectural Physics: Lighting; British Information Services: New York, NY, USA, 1963. [Google Scholar]
- Richards, L.G.; Jacobson, I.D.; Kuhlthau, A.R. What the Passenger Contributes to Passenger Comfort. Appl. Ergon. 1978, 9, 137–142. [Google Scholar] [CrossRef]
- Nazzal, A.A. A New Evaluation Method for Daylight Discomfort Glare. Int. J. Ind. Ergon. 2005, 35, 295–306. [Google Scholar] [CrossRef]
- Kim, W.; Kim, J.T. The Scope of the Glare Light Source of the Window with Non-Uniform Luminance Distribution. Indoor Built Environ. 2011, 20, 54–64. [Google Scholar] [CrossRef]
- Sapia, C. Daylighting in Buildings: Developments of Sunlight Addressing by Optical Fiber. Sol. Energy 2013, 89, 113–121. [Google Scholar] [CrossRef]
- Cantin, F.; Dubois, M.C. Daylighting Metrics Based on Illuminance, Distribution, Glare and Directivity. Lighting Res. Technol. 2011, 43, 291–307. [Google Scholar] [CrossRef]
- Huang, H. Biological Effects of Light in University Classroom Lighting. Ph.D. Thesis, Chongqing University, Chongqing, China, 2010. [Google Scholar]
- Nezamdoost, A.; Van Den Wymelenberg, K.G. Revisiting the Daylit Area: Examining Daylighting Performance Using Subjective Human Evaluations and Simulated Compliance with the LEED Version 4 Daylight Credit. Leukos 2017, 13, 107–123. [Google Scholar] [CrossRef]
- Chraibi, S.; Lashina, T.; Shrubsole, P.; Aries, M.; van Loenen, E.; Rosemann, A. Satisfying Light Conditions: A Field Study on Perception of Consensus Light in Dutch Open Office Environments. Build. Environ. 2016, 105, 116–127. [Google Scholar] [CrossRef] [Green Version]
- Chawla, A.S.; Samei, E. Ambient Illumination Revisited: A New Adaptation-Based Approach for Optimizing Medical Imaging Reading Environments: Optimization of Ambient Light Conditions in Reading Rooms. Med. Phys. 2006, 34, 81–90. [Google Scholar] [CrossRef]
- Ulrich, R.S. Natural Versus Urban Scenes: Some Psychophysiological Effects. Environ. Behav. 1981, 13, 523–556. [Google Scholar] [CrossRef]
- Even, C.; Schröder, C.M.; Friedman, S.; Rouillon, F. Efficacy of Light Therapy in Nonseasonal Depression: A Systematic Review. J. Affect. Disord. 2008, 108, 11–23. [Google Scholar] [CrossRef]
- Carlucci, S.; Causone, F.; Rosa, F.D.; Pagliano, L. A review of indices for assessing visual comfort with a view to their use in optimization processes to support building integrated design. Renew. Sustain. Energy Rev. 2015, 47, 1016–1033. [Google Scholar] [CrossRef] [Green Version]
- Loe, L.; Mansfield, K.P.; Rowlands, E. Appearance of Lit Environment and Its Relevance in Lighting Design: Experimental Study. Lighting Res. Technol. 1994, 26, 119–133. [Google Scholar] [CrossRef]
- Gang, L.; Mengliu, L.; Chen, L.; Rui, D. Research on the comfort level of office light environment based on evaluation experiment. J. Lighting Eng. 2017, 6, 48–51. [Google Scholar]
- Lu, M.; Hu, S.; Mao, Z.; Liang, P.; Xin, S.; Guan, H. Research on Work Efficiency and Light Comfort Based on EEG Evaluation Method. Build. Environ. 2020, 183, 107122. [Google Scholar] [CrossRef]
- Kompier, M.E.; Smolders, K.C.H.J.; Kort, Y.A.W.D. Abrupt Light Transitions in Illuminance and Correlated Color Temperature Result in Different Temporal Dynamics and Interindividual Variability for Sensation, Comfort and Alertness. PLoS ONE 2021, 16, e0243259. [Google Scholar] [CrossRef]
- Ren, H.; Su, Z.B.; Meng, F.; Li, H.; Chen, H.X. Subjective Evaluation Method of Stereoscopic Video for the Digitizing of Dynamic Culture Resources. AMM 2014, 513–517, 2782–2786. [Google Scholar] [CrossRef]
- Dugdale, J.H.; Sanders, D.; Myers, T.; Williams, A.M.; Hunter, A.M. A Case Study Comparison of Objective and Subjective Evaluation Methods of Physical Qualities in Youth Soccer Players. J. Sports Sci. 2020, 38, 1304–1312. [Google Scholar] [CrossRef] [PubMed]
- Cheng, J. A subjective degree based dual portfolio evaluation method and application. Stat. Decis. 2018, 34, 76–79. [Google Scholar] [CrossRef]
- Jebb, A.T.; Ng, V.; Tay, L. A Review of Key Likert Scale Development Advances: 1995–2019. Front. Psychol. 2021, 12, 637547. [Google Scholar] [CrossRef]
- Eloholma, M.; Viikari, M.; Halonen, L.; Walkey, H.; Goodman, T.; Alferdinck, J.; Freiding, A.; Bodrogi, P.; Várady, G. Mesopic Models—From Brightness Matching to Visual Performance in Night-Time Driving: A Review. Lighting Res. Technol. 2005, 37, 155–173. [Google Scholar] [CrossRef]
- Architectural Optics—Electrical Lighting; China Architecture and Architecture Press: Beijing, China, 1982.
- Ikeda, K.; Noda, K.; Yamaguchi, S. A Relation between Adaptation Luminancc and Visual Acuity for the Landolt Ring under the Uniform Background. J. Light Vis. Env. 1980, 4, 22–31. [Google Scholar] [CrossRef]
- Huang, H.J.; Gang, C. Visual efficacy of different light colors in classroom lighting environment. Light Lighting 2011, 35, 14–18. [Google Scholar]
- Lighting of Indoor Workplaces; International Commission on Illumination: Vienna, Austria, 2001.
- Qingxuan, Z. Architectural Light Environment; Tsinghua University Press: Beijing, China, 1988; ISBN 978-7-302-00148-5. [Google Scholar]
- Janosik, E. Adaptation capacity of the sight organ and factors causing its disorders. Klin Ocz. 2008, 110, 112–115. [Google Scholar]
- Ohno, Y. Practical Use and Calculation of CCT and Duv. Leukos 2014, 10, 47–55. [Google Scholar] [CrossRef]
- Song, W. SPSS Practical and Statistical Thinking; Tsinghua University Press: Beijing, China, 2019; ISBN 978-7-302-51322-3. [Google Scholar]
- Khatun, N. Applications of Normality Test in Statistical Analysis. OJS 2021, 11, 113–122. [Google Scholar] [CrossRef]
- Ma, X.; Ma, J.; Wang, L.; Yu, J. Evaluation of the impact of indoor vertical illumination on visual efficacy in office buildings. J. Hum. Settl. West China 2020, 35, 74–80. [Google Scholar] [CrossRef]
- Sun, L.Y.; Ma, J.; Xiao, J.H.; Zhang, M.Y. Experimental study on the perception of luminance of single landscape element landscape lighting. China Illum. Eng. J. 2008, 03, 8–11. [Google Scholar] [CrossRef]
- Huijuan, T.; Tao, G.; Minpeng, C.; Yang, H. Evaluation Model of VDT Visual Comfort Based on Pupil Diameter. Laser Optoelectron. Prog. 2020, 57, 153301. [Google Scholar] [CrossRef]


| Instrument Name | Colorimeter | Illuminometer | LED Step-Less Control Lamp | Blood Pressure Monitor |
|---|---|---|---|---|
| Pictures |  |  |  |  |
| Measurement range | 0.1–50,000 lx | 0.1–99,990 lx | 10–12,000 lx | Nominal pressure range is 0 to 299 mmHg (±3 mmHg), pulse rate 40 to 180 bpm (±5%) |
| Experimental Group | Starting Illuminance Value | Final Illuminance Value | Illuminance Ratio |
|---|---|---|---|
| 1 | 100 lx ± 5 lx | 300 lx ± 5 lx | 1:3 |
| 2 | 30 lx ± 5 lx | 90 lx ± 5 lx | 1:3 |
| 3 | 1500 lx ± 5 lx | 4500 lx ± 5 lx | 1:3 |
| 4 | 1000 lx ± 5 lx | 3000 lx ± 5 lx | 1:3 |
| 5 | 500 lx ± 5 lx | 1500 lx ± 5 lx | 1:3 |
| 6 | 300 lx ± 5 lx | 900 lx ± 5 lx | 1:3 |
| 7 | 300 lx ± 5 lx | 100 lx ± 5 lx | 3:1 |
| 8 | 90 lx ± 5 lx | 30 lx ± 5 lx | 3:1 |
| 9 | 4500 lx ± 5 lx | 1500 lx ± 5 lx | 3:1 |
| 10 | 3000 lx ± 5 lx | 1000 lx ± 5 lx | 3:1 |
| 11 | 1500 lx ± 5 lx | 500 lx ± 5 lx | 3:1 |
| 12 | 900 lx ± 5 lx | 300 lx ± 5 lx | 3:1 |
| 13 | 100 lx ± 5 lx | 500 lx ± 5 lx | 1:5 |
| 14 | 500 lx ± 5 lx | 2500 lx ± 5 lx | 1:5 |
| 15 | 1000 lx ± 5 lx | 5000 lx ± 5 lx | 1:5 |
| 16 | 150 lx ± 5 lx | 750 lx ± 5 lx | 1:5 |
| 17 | 750 lx ± 5 lx | 3750 lx ± 5 lx | 1:5 |
| 18 | 500 lx ± 5 lx | 100 lx ± 5 lx | 5:1 |
| 19 | 2500 lx ± 5 lx | 500 lx ± 5 lx | 5:1 |
| 20 | 5000 lx ± 5 lx | 1000 lx ± 5 lx | 5:1 |
| 21 | 750 lx ± 5 lx | 150 lx ± 5 lx | 5:1 |
| 22 | 3750 lx ± 5 lx | 750 lx ± 5 lx | 5:1 |
| Experimental Group | Starting Illuminance Value | Final Illuminance Value | Reaction Time (s) | Comfort Score | The Difference in Illuminance Variation (lx) | Illuminance Ratio |
|---|---|---|---|---|---|---|
| 1 | 98 lx ± 5 lx | 301 lx ± 5 lx | 0.647 | 1 | −203 | 1:3 |
| 2 | 30 lx ± 5 lx | 89 lx ± 5 lx | 0.826 | −1 | −59 | 1:3 |
| 3 | 1497 lx ± 5 lx | 4503 lx ± 5 lx | 0.924 | 0 | −3006 | 1:3 |
| 4 | 750 lx ± 5 lx | 3747 lx ± 5 lx | 0.656 | 2 | −2997 | 1:5 |
| 5 | 98 lx ± 5 lx | 502 lx ± 5 lx | 0.783 | 1 | −404 | 1:5 |
| 6 | 502 lx ± 5 lx | 2505 lx ± 5 lx | 0.95 | −1 | −2003 | 1:5 |
| 7 | 150 lx ± 5 lx | 750 lx ± 5 lx | 0.837 | 2 | −600 | 1:5 |
| 8 | 30 lx ± 5 lx | 98 lx ± 5 lx | 0.647 | 1 | 68 | 3:1 |
| Kolmogorov–Smirnov a | |||
|---|---|---|---|
| Statistic | df | Sig. | |
| Reaction time | 0.077 | 119 | 0.077 |
| Comfort Score | 0.177 | 119 | 0.000 |
| Illuminance difference | 0.293 | 119 | 0.000 |
| Kolmogorov–Smirnova | |||
|---|---|---|---|
| Statistic | df | Sig. | |
| Reaction time | 0.108 | 141 | 0.000 |
| Comfort Score | 0.192 | 141 | 0.000 |
| Illuminance difference | 0.315 | 141 | 0.000 |
| Reaction Time | Comfort Score | Illuminance Difference | |||
|---|---|---|---|---|---|
| Spearman Rho | Reaction time | correlation | 1.000 | −510 ** | 0.236 ** |
| Sig. (2-tailed) | 0.000 | 0.010 | |||
| N | 119 | 119 | 119 | ||
| correlation | −510 ** | 1.000 | −218 * | |
| Sig. (2-tailed) | 0.000 | 0.017 | |||
| N | 119 | 119 | 119 | ||
| correlation | 0.236 ** | −218 * | 1.000 | |
| Sig. (2-tailed) | 0.010 | 0.017 | |||
| N | 119 | 119 | 119 | ||
| Reaction Time | Comfort Score | Starting Illuminance | |||
|---|---|---|---|---|---|
| Spearman Rho | Reaction time | correlation | 1.000 | −527 ** | −232 ** |
| Sig. (2-tailed) | 0.000 | 0.006 | |||
| N | 141 | 141 | 141 | ||
| Comfort score | correlation | −527 ** | 1.000 | 0.052 | |
| Sig. (2-tailed) | 0.000 | 0.544 | |||
| N | 141 | 141 | 141 | ||
| Illuminance difference | correlation | −223 ** | 0.064 | 0.982 ** | |
| Sig. (2-tailed) | 0.008 | 0.448 | 0.000 | ||
| N | 141 | 141 | 141 | ||
| Starting illuminance | correlation | −232 ** | 0.052 | 1.000 | |
| Sig. (2-tailed) | 0.006 | 0.544 | |||
| N | 141 | 141 | 141 | ||
Publisher’s Note: MDPI stays neutral with regard to jurisdictional claims in published maps and institutional affiliations. |
© 2022 by the authors. Licensee MDPI, Basel, Switzerland. This article is an open access article distributed under the terms and conditions of the Creative Commons Attribution (CC BY) license (https://creativecommons.org/licenses/by/4.0/).
Share and Cite
Zhang, J.; Lv, K.; Zhang, X.; Ma, M.; Zhang, J. Study of Human Visual Comfort Based on Sudden Vertical Illuminance Changes. Buildings 2022, 12, 1127. https://doi.org/10.3390/buildings12081127
Zhang J, Lv K, Zhang X, Ma M, Zhang J. Study of Human Visual Comfort Based on Sudden Vertical Illuminance Changes. Buildings. 2022; 12(8):1127. https://doi.org/10.3390/buildings12081127
Chicago/Turabian StyleZhang, Jiuhong, Kunjie Lv, Xiaoqian Zhang, Mingxiao Ma, and Jiahui Zhang. 2022. "Study of Human Visual Comfort Based on Sudden Vertical Illuminance Changes" Buildings 12, no. 8: 1127. https://doi.org/10.3390/buildings12081127