1. Introduction
The history of “human progress” and development has often been linked to the availability and consumption of energy in ever more intensive ways [
1]. The policies, programs, and campaigns place energy consumption as an essential need or right that must be covered, indicating that energy and wellbeing are interconnected [
2]. Currently, there is a significant divide between approaches to conceptualize and monitor the relationship between energy and wellbeing, particularly between more and less developed regions [
3]. However, all these are linked to the concept of Energy Poverty (EP). EP, also known as “fuel poverty” (FP) and “energy vulnerability”, occurs when homes are not capable of maintaining minimum thermal comfort temperatures, having available energy services, or doing so at an affordable cost [
4,
5,
6,
7].
Measuring EP is a complex challenge due to its social and environmental variability, and temporal and dynamic nature [
5]. It is a relative concept where variables acquire greater or lesser relevance depending on the territory [
8]. For this reason, EP indicators are an important part of the research and political overview [
9]. Nowadays, there are several definitions and indicators developed by countries such as the United Kingdom, Ireland, France, Spain, and Slovakia [
10].
Different frameworks, approaches, and indicators have been proposed internationally. Many authors have associated EP with a low-income situation (monetary poverty), while others have suggested that energy expenditure influence the possibility of satisfying other basic needs [
11].
In 2014, the Chilean Energy Ministry presented the Energy Agenda, where one of the main tasks was designing and implementing a long-term Energy Policy that had a social, political, and technical validation [
12]. This policy, called “Energy 2050”, was published at the end of 2015, and is based on four pillars: (1) supply quality and security; (2) energy as the driver of development; (3) environmental compatibility; and (4) energy education and efficiency. Within the second pillar, one of the criteria was defining the concept and measurement of EP, with the goal of reducing EP ratios in 50% by 2035, and completely by 2050 [
2].
In Chile, the figures indicate that only higher income population can reach thermal comfort in their homes [
13], essentially due to multidimensional poverty (14%), among others, manifested in differences in heating systems, construction materials, or monthly income, thus causing an energy gap [
14,
15,
16].There is also a serious contamination problem associated to high levels of firewood burnt for heating, which increases Particulate Matter (PM) levels in the atmosphere [
17,
18].As a result, the Chilean Government signed an agreement in 2017 with the United Nations Development Program to prepare a conceptual and methodological framework to address EP [
19]. However, a methodological framework has not yet been determined, hence the Chilean Energy Poverty Network (RedPE) proposed, in 2019, a Three-dimensional and Territorialized Indicator (EPTTI, in Spanish) [
16]. The EPTTI is based on gaps found in international and domestic indicators to reflect local energy needs caused by a high level of economic inequality, low incomes, climate, and energy diversity [
16], resulting in a multidimensional indicator, composed of economic, social, environmental, and technological dimensions, with specific thresholds for Chile. The first step was generating the “Equitable Access to Quality Energy Standard” (EAQES), made up of four dimensions, which are subdivided into 18 indicators that allow evaluating the equitable access of homes to energy services to satisfy their needs (see
Appendix A). Then, based on the EAQES, a simpler and more practical instrument was proposed, using nine out of the initial eighteen indicators that allow quantifying EP in Chile (EPTTI) [
16] (See
Table 1).
The purpose of this research is to apply the EPTTI in a real case study, to empirically assess its capability to identify homes in EP and, consequently, to improve its sensitivity and soundness.
The paper is organized in five sections. The first presents the background of the Chilean energy poverty policy. The second shows the methodological aspects of the research related to the case study description, data collection, and evaluation and adaptation of the EPTTI. The third, presents, describes and summarizes results associated to each dimension of the EPTTI, including a comparison of results. The fourth section describes how the results have been compared and interpreted according to the case study. Finally, the main conclusions are outlined along with the implications of the results obtained in
Section 5.
2. Methodology
The methodological framework of this research included, first of all, the selection of an intentional sample of social housing, and secondly, collected relevant information for the EPTTI’s indicators. Thirdly, the applicability of EPTTI was assessed, proposing adaptations associated to the results. Finally, its sensitivity and soundness to identify EP situations was assessed in comparison to the results with the EPL established by MDS, considering that the indicators must be able to identify as EP to all those households who are income poverty at a country level.
2.1. Equitable Access to Quality Energy Standard
The first step was generating the “Equitable Access to Quality Energy Standard” (EAQES), made up of four dimensions, which are subdivided into 18 indicators that allow evaluating the equitable access of homes to energy services to satisfy their needs (see
Appendix A). The four dimensions in the EAQES are: (1) Food and hygiene; (2) Lighting and electrical devices; (3) Climate control of the Dwelling; and (4) Energy expenditure equality (based on energy expenditure), where each dimension comprises different indicators [
2,
16].
Dimension 1 (D1—Food and Hygiene) comprises the indicators, ‘Energy source and kitchen appliances’ (D1-I1), ‘Type of refrigerator associated to its Energy Efficiency (EE)’ (D1-I2), and “Domestic Hot Water System’ (DHW) (D1-I3). The EP thresholds defined for each indicator are the use of kerosene, coal, wet firewood, or waste from an open fuel source permanently inside the dwelling for the indicator D1-I1; having a refrigerator with an EE indicator of B or less for D1-I2; and not having DHW for D1-I3.
As for dimension 2 (D2—Lighting and electrical appliances), the indicators are: Access to electricity (D2-I1); System Average Interruption Duration Index (SAIDI) (D2-I2); System Average Interruption Frequency Index (SAIFI) (D2-I3); Supply Capacity (D2-I4); Electrical Installation (D2-I5); Voltage oscillations (D2-I6); and Lighting (D2-I7). Regarding the EP thresholds established for these indicators, we find that for D2-I1, it is established that a home is in EP if it is not connected to the grid, does not have an illegal connection, or uses its own generator, whose fuel is acquired at more than one hour’s trip from the device. For SAIDI, indicator D2-I2, a limit of one hour has been set; and for SAIFI, D2-I3, more than six interruptions a year. The inability to simultaneously turn on lights, low and high consumption devices, is established as the EP threshold for D2-I4. If the electrical installation does not meet that established in the Chilean NCh04/2003 standard, this home will be in EP as per D2-I5. Likewise, for D2-I6, the supply voltage must be regulated more than 95% of the time between ± 10%. Finally, for D2-I7, the existence of a single light source of at least 1000 lumens, with a use of under 4 h, is set as the threshold [
20].
Dimension 3 (D3—Climate control of the dwelling) has six indicators which are: Indoor temperature (D3-I1); Thermal Comfort (D3-I2); Thermal efficiency standard equivalent to the Housing Energy Rating (D3-I3); Energy source and heating devices (D3-I4); Intrahousehold contamination (D3-I5); and indoor humidity (D3-I6). To define the different thresholds, the requirements of Sustainable Dwelling Construction Standards (ECSV, in Spanish), have been used for D3-I1 and D3-I6 [
21]. In detail, according to D3-I1, a home will be in EP, if the percentage of time that the indoor temperature is outside the comfort range is lower than the one defined for the thermal zone where the dwelling is located (the comfort limit temperature may oscillate between 19 °C and 26 °C, and the minimum percentage of time between 30% and 70% respectively). Regarding D3-I6, the relative humidity levels inside the dwelling must be between 30% and 70% for a percentage of time associated to the thermal zone where the dwelling is located. Note that when there is no information about indoor temperature, it is possible to use D3-I2 instead, where the household is asked whether they feel cold inside during winter months or hot during the summer. With regard to D3-I3, an EP situation is established for those homes with an Energy Rating (ER) below F, which considers all dwellings built before 2001. D3-I4 considers the same threshold as D1-I1. The limit for D3-I5 has been determined from the recommendations of the World Health Organization (WHO) to setting limit values for PM, CO, and NO
2 [
16].
Dimension 4 (D4—Energy expense equality) has been formed by two indicators: the first, D4-I1, is based on the MIS, which uses the Equivalent Poverty Line (EPL) defined by the Social Development Ministry [
22] to determine the minimum cost of living of the home, establishing that the income minus the housing and energy costs of the household must be above the EPL. The second indicator, D4-I2, is based on the HEP indicator, which defines the EP threshold as half the average energy expenditure of those households with the same typology.
It is important to say that there is a lack of information in Chile to identify EP situations. For this reason, a set of minimal indicators was chosen to establish the EPTTI based on the EAQES explained above (See
Table 1). Ultimately, the methodology used by RedPE to define the overall threshold is similar to that used by the Chilean Social Development Ministry (MDS, Spanish) to measure Multidimensional Poverty [
22], establishing that a dwelling will be in EP when it does not exceed the deprivation threshold in four out of the nine indicators, regardless of the dimension this applies to, or if there is a complete dimension in deprivation. The only application of the EPTTI, due to the limited data availability, used different sources of information, hindering a national estimation of the number of homes that are in multidimensional EP. Furthermore, it did not allow measuring its sensitivity and soundness [
16], rather a general analysis of the EP prevalence.
2.2. Case Study Description and Data Collection
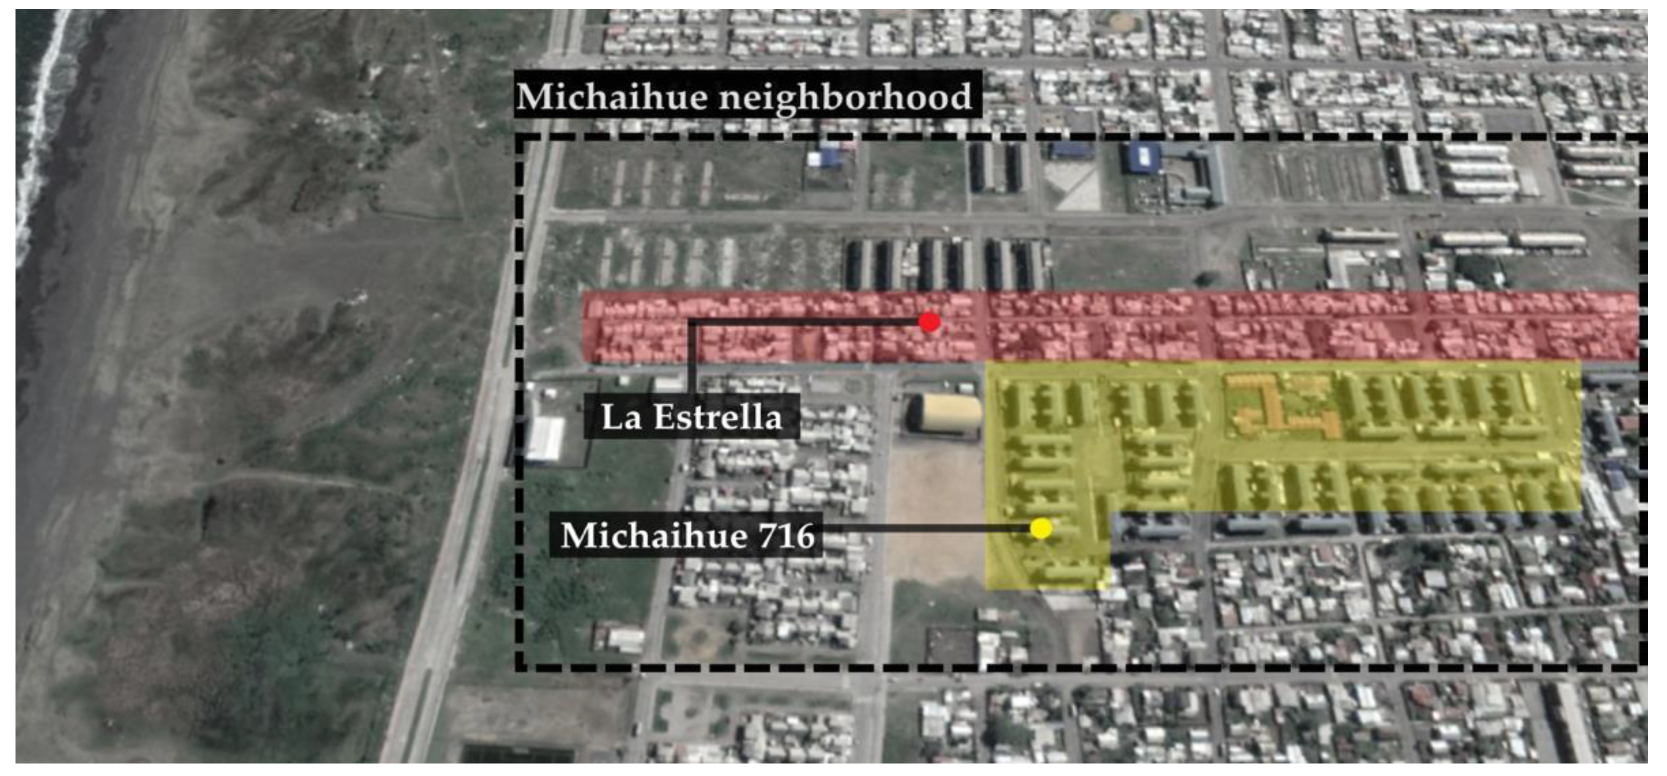
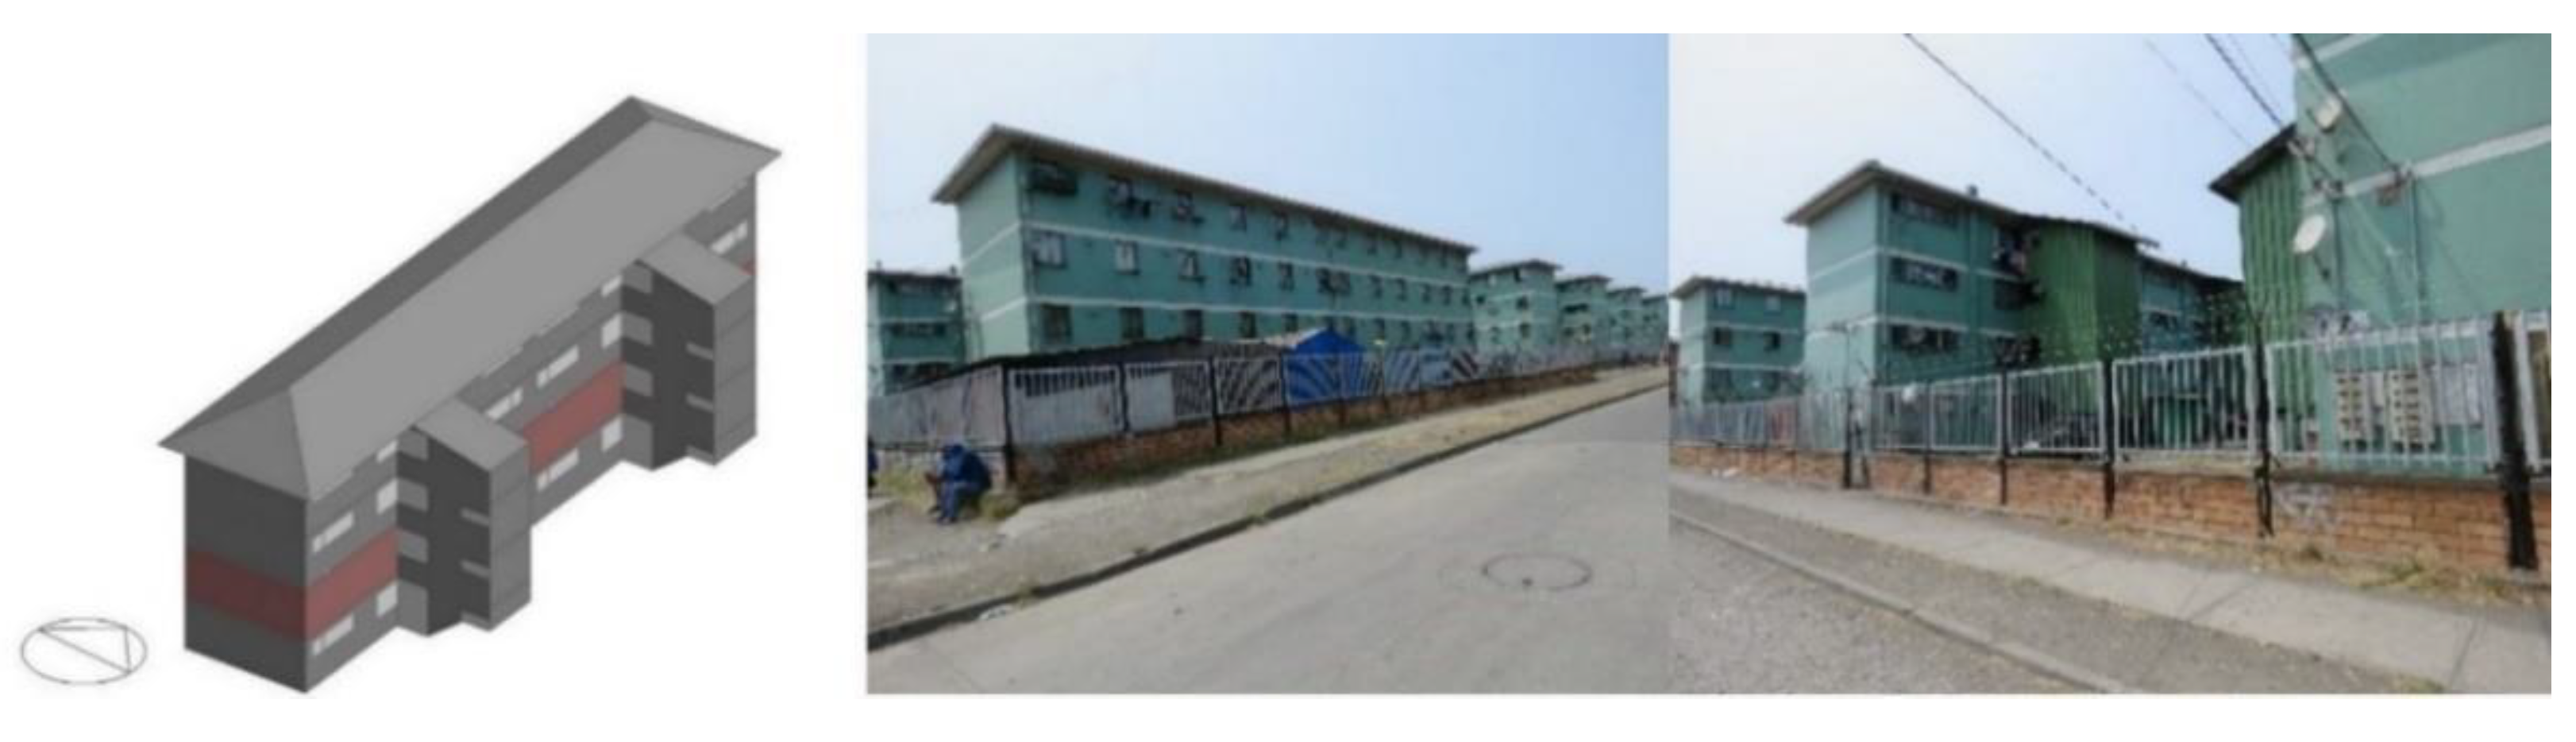
The area’s climate is Mediterranean, with an annual average temperature of 12.7 °C, and a minimum of 1 °C in winter. The relative humidity average is 84.2%, with a maximum of 95.1% (April) and minimum of 55.3% (January). The choice of the case study was made intentionally, with the goal of including in the sample, dwellings that would foreseeably have EP-associated issues. For this reason, the dwellings included in the “Study: improvement of the urban and living conditions of the Michaihue Housing Complex, San Pedro de la Paz” were chosen. The Chilean Ministry of Housing and Urbanism (MINVIU) identified, in this complex, problems associated to excessive density, insufficient size, construction flaws, and social problems, along with a high concentration of poverty [
23]. Consequently, the case study focuses on two Housing Complexes, Michaihue 716, built in 1999, comprising 45, 4-floor blocks (716 dwellings), and the La Estrella Complex, that comprises 274 houses built in the same period (See
Figure 1).
The construction projects were collated to identify their construction features, while staff with competences in the architecture and construction area carried out data collection. Onsite data collection was done door-to-door in January 2020, in the context of MINVU’s energy Retrofitting Plan. From the information collected, the questions considered relevant for the EPTTI’s application and assessment were chosen, obtaining 641 valid questionnaires (64.75% of the case study), 473 apartments (66.06% representativity for Michaihue 716) and 168 houses (61.31% representativity for La Estrella). The questions associated to the dimension and the indicator can be seen in
Table 2.
2.3. Evaluation and Adaptation of Three-Dimensional and Territorial Indicator
The evaluation and adaptation of the indicator was made based on the results of fieldwork and other information sources associated to each indicator (See
Appendix A). In addition, the indicators were evaluated depending on their effectiveness and applicability to the case study, identifying those gaps that could generate bias in their application, and assessing that the EPTTI provides substantial differences within the entire complex.
To analyze dimension D1, the data collected from question Q1 were used for D1-I1, Exempt Resolution 74 of 2015 [
24] for DI-I2, Q3 and legislative sources for D1-I3.
For D2, questions Q3 and Q4, associated to the existence of legal electrical installations and their safety, were used for D2-I1, while D2-I2, D2-I3, and D2-I6 were evaluated using data collected from the national monitoring system and from TSSQDS [
25,
26], The supply capacity, D2-I4, was analyzed using data collected from Q5; questions Q6 and Q7, and NCh 04/2003 [
27], for D2-I5; and finally, D2-I7 was evaluated based on the criteria set in the Multitier Framework for Energy Access [
20].
As for D3, D3-I1 was evaluated using the indoor temperatures of dwellings depending on their typology and orientation (Q8). The adaptative thermal-comfort standard of ASHRAE 55-2017 was used to establish comfort and discomfort probability distributions [
28] (see
Appendix B). D3-I2 was evaluated using the results obtained from the Fondecyt 3160806 project [
28,
29]. D3-I3 was analyzed considering the construction period (prior to the first energy-efficiency standard that came into force in Chile), and D3-I4 according to question Q10. D3-I5 and D3-I6 required contamination and humidity information collected through NAQIS [
30] to consider the environmental and climatic context the dwellings are in. In addition, D3-I5 was also analyzed based on the results of the Fondecyt 11150262 and 1190412 projects [
31].
The evaluation of D4 required collecting information associated to incomes (Q14), the rental or mortgage payments expenditure (Q16, Q17 and Q18), administration fees (Q19), and electricity, water, gas, and internet expenditure (Q20), which were collected for winter and summer. The average amount obtained from Q17, Q18, Q19, and Q20 represents households’ expenditure, and Q14 and Q15 the EPL of each household, which according to the MDS methodology is associated to the number of users (See
Table 3).
To analyze the importance of D4-I1 and D4-I2 in the EPTTI, cumulative distributions by using results from Q14, Q16, Q17, Q18, Q19 and Q20 were used depending on winter and summer periods. On the other hand, the MIS was used to evaluate whether the households were below the EPL (due to excessive energy expenditure) and the median households’ expenditure for the under-energy expenditure threshold.
To measure the soundness of the indicators, their capability to classify the households under the EPL as energy poor was evaluated through a comparative analysis between EP and poverty.
In those cases where it was seen that the indicators or thresholds established did not have sufficient sensitivity to detect EP situations, new thresholds or indicators were proposed based on data availability, adapting them to the environmental, climatic, constructive, and socioeconomic conditions of the case study, as well as their ability to identify EP situations in the application context (See
Table 4).
Finally, the results obtained from the Original EPTTI and the Adapted EPTTI were compared to discuss the main differences in their application, as well as the possibilities of their use in other contexts.
3. Results
3.1. Dimension 1: Food and Hygiene
Dimension D1 of EAQES comprises three indicators (see
Appendix A). However, the original EPTTI only uses two (D1-I1 and D1-I3). The indicators have been evaluated considering the pertinence of their application to identify EP situations. In this sense, D1-I1 is found to be relevant, as cooking food is one of the essential needs that is most acknowledged at an international level [
16,
33] and, on the other hand, it has already been shown that, at a domestic level, the use of certain types of fuels causes important environmental contamination episodes that affect people’s health [
34]. With regard to D1-I2, it is necessary to bear in mind that since 2015, the sale of appliances with a certification of B or lower is illegal in Chile [
24].To avoid the exclusion of those households who had to renew the appliance due to its deterioration or span-life end, this indicator is not included, just as in the original EPTTI. As for D1-I3, it is proposed to modify the deprivation threshold, assessing whether households have an electrical system that is not authorized by the Superintendence of Electricity and Fuels (SEC) [
27] (17.32% of households in the case study) (see
Table 5).
Table 5 below presents a comparison between the adapted and original version of EPTTI for D1. As can be seen, modifying the D1-I3 deprivation threshold allows identifying 111 cases whose climate systems do not meet safety standards [
27] (they cannot afford to install a new one), improving its sensitivity to identify further EP situations.
3.2. Dimension 2: Electrical Devices and Lighting
This dimension of the EAQES comprises seven indicators (see
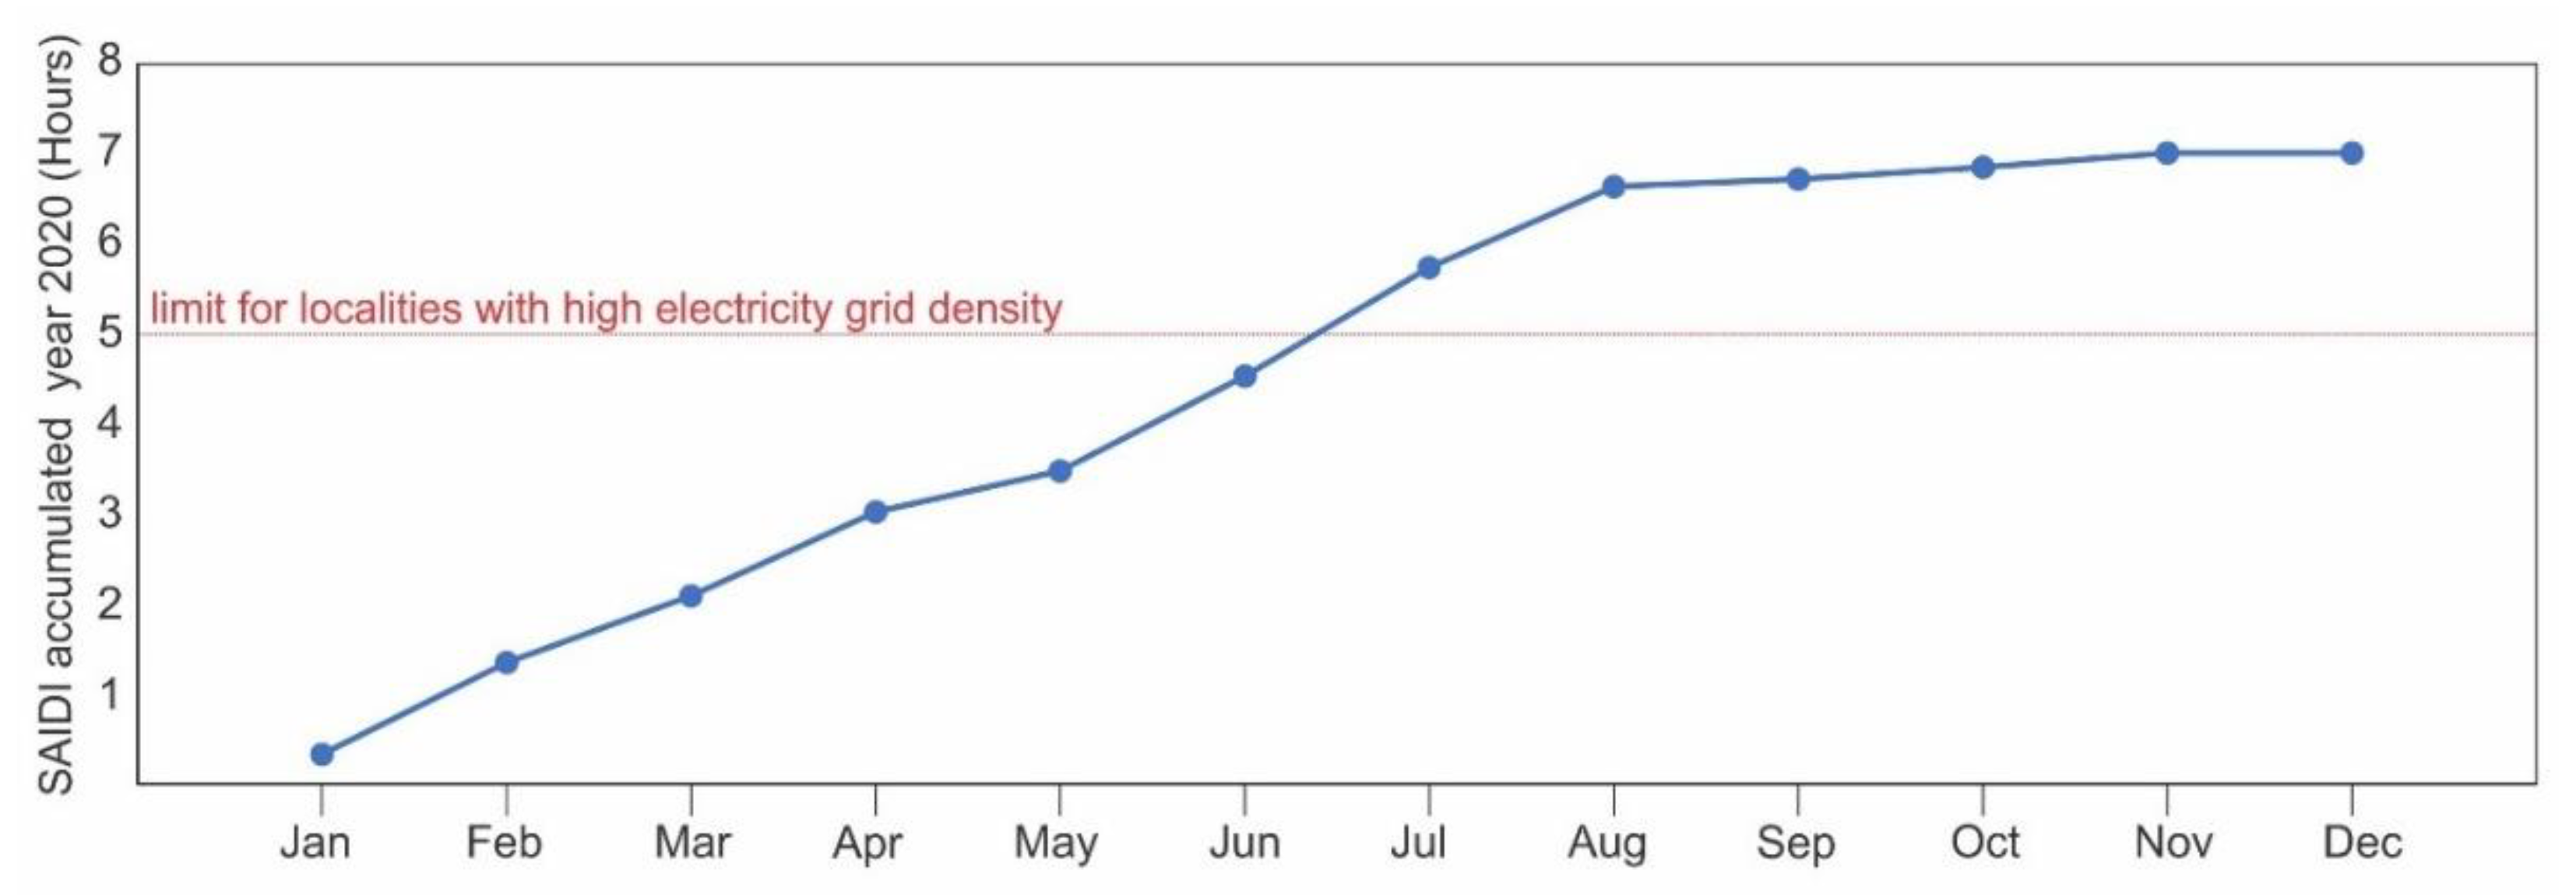
Appendix A). However, the original EPTTI only uses two of them (D2-I1 and D2-I2). The revision process reveals that it can be complex to identify whether there is an illegal connection in the dwelling (D2-I1’s threshold; access to electricity) and hence it appears suitable to include the term “Home-made modified panel” as a complement to the indicator, understanding that the hand-made modification of electrical panels limits equitable access to a quality electrical connection. With regard to D2-I2 (SAIDI), the Service Quality Technical Standard for Distribution Systems establishes as a limit, from 2020 onwards, a value of 5 h for communes with a high grid density, and the value obtained for the case study was 7.01 h in 2020, which is above the standard’s limit value since July (see
Figure 2).
As the threshold is set at the commune level, it does not affectively assess the real situation at the neighborhood level, leading the overall indicator to lose sensitivity. For this reason, its use is discarded. D2-I3 (SAIFI) and D2-I6 (voltage oscillation) have similar connotations to SAIDI (lack of reliable data to identify the situation of the household), which is why, just as in the original EPTTI, these are not incorporated. D2-I4 (capacity of supply) is complex to measure in dwellings where there are few high consumption electronic devices (e.g., HVAC equipment, electric oven, etc.). For this reason, using the survey results, where 25.5% of dwellings had one circuit, 51.3%, two, 14.9%, three, and 7.4%, four or more, it is proposed to establish the deprivation level according to the number of circuits the dwelling has, establishing that below three could impede connecting two or more pieces of high consumption equipment simultaneously. As for D2-I5 (electrical installation), associated to the compliance or not of NCh 04/2003 [
27], 100% of the dwellings surveyed did not comply with this standard, on being built before this came into force. Thus, adjusting the deprivation threshold, evaluating the ‘existence of irregular or home-made electrical installations within the dwelling’ is proposed. Overall, 40.52% of dwellings had these conditions, overlooked in the original EPTTI. This shows the potential of this new threshold to improve the indicator’s sensitivity, on more effectively identifying conditions that can jeopardize people’s health.
Regarding D2-I7 (lighting), this has components that are complex to measure, since they are associated to aspects related to the intensity of use, lighting requirements, number of occupants, delay between times of sunlight and official times, subjective aspects of users, among others [
35]. This means that the deprivation threshold set at 1000 lmhr during 4 h is difficult to apply, as this value varies depending on the number of inhabitants, but only applicable in homes with five people [
20]. Because of this, it has not been included in the adapted indicator.
Table 6 below presents a comparison of the results obtained by the D2’s indicators between the original and adapted EPTTI versions.
It can be seen that the modification of the thresholds of D2-I1 and D2-I5 improve sensitivity when it comes to identifying situations that endanger people’s health and life, identifying situations that were previously overlooked, but that represent an important percentage of the case study (20.28% and 28.86%, respectively), just like the elimination of D2-I2 (SAIDI) and D2-I3 (SAIFI). On the other hand, the incorporation of supply capacity (D2-I4), associated to the number of circuits, allows the establishment of an objective criterion for its application, identifying 492 homes whose electrical system had difficulties to simultaneously support the connection of high consumption electronic devices.
3.3. Dimension 3: Climate Control of the Dwelling
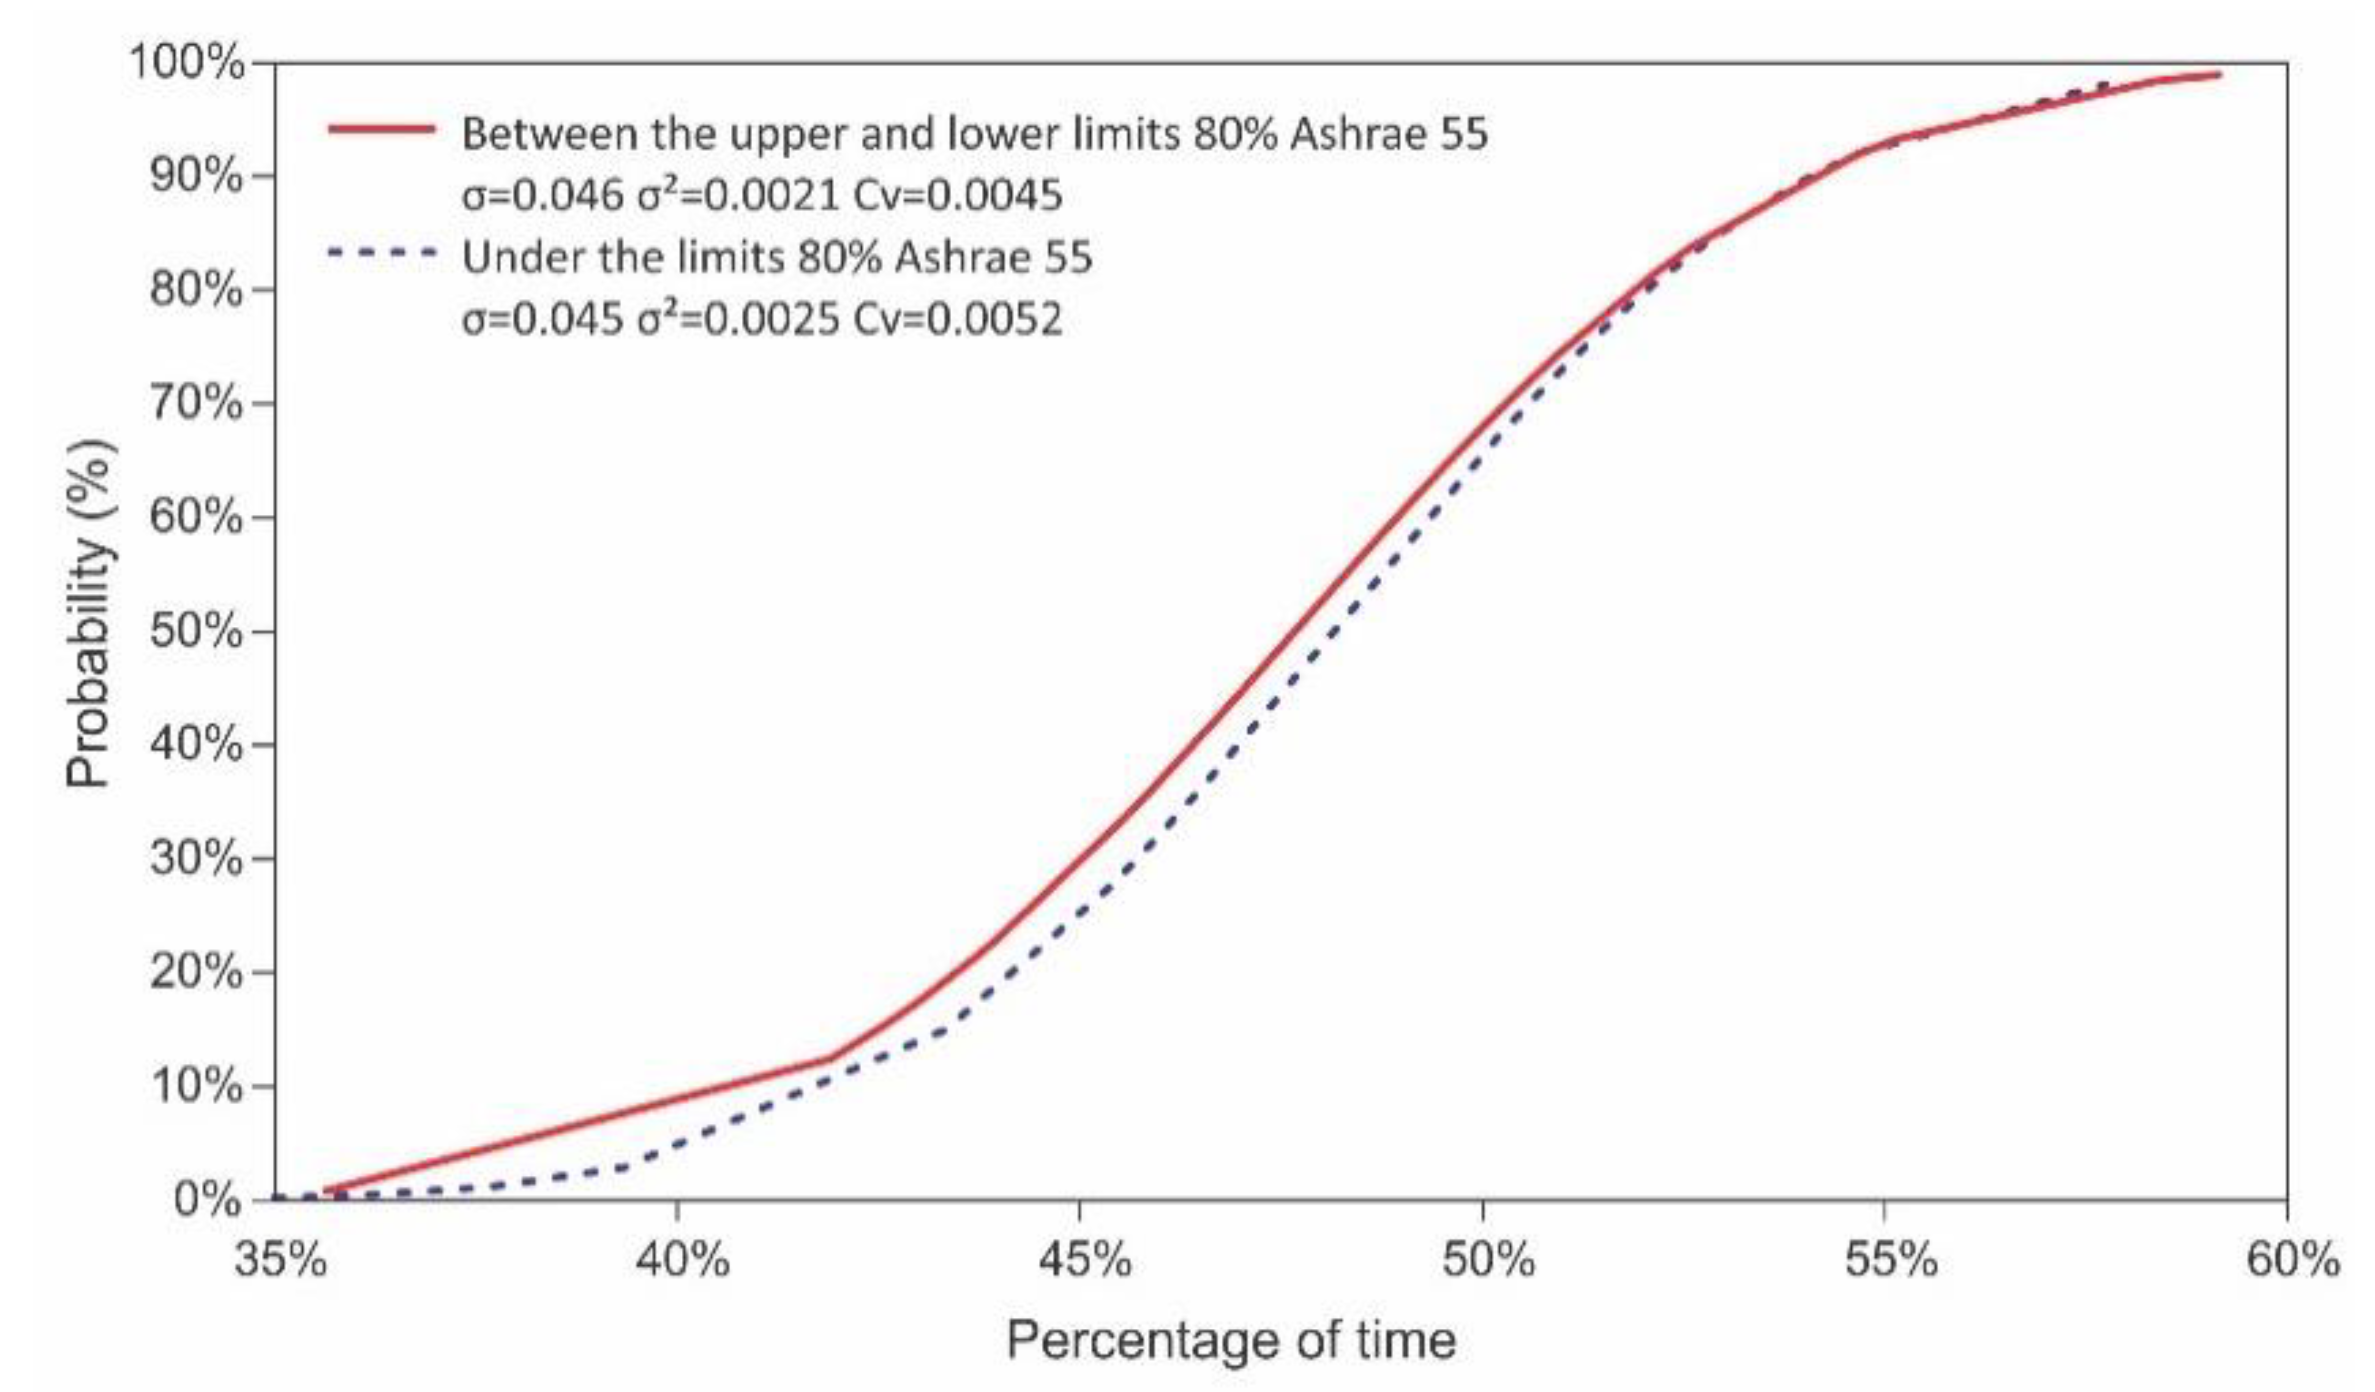
EAQES D3, on climate control of the dwelling, comprises six indicators, while EPTTI only uses three (D3-I2, D3-I3 and D3-I4). D3-I1 (Indoor temperature) and D3-I6 (Indoor Humidity) establish the deprivation threshold associated to the number of hours (percentage) the home is within the limits defined in the ECSV, which depends on the thermal zone the dwelling is located in. Indoor temperature limits can range between 30% and 70% of the occupation time (for the study area, it is 40%), with a comfort temperature range between 19 °C and 26 °C for the threshold of D3-I1, and between 30% and 70% of relative humidity for the threshold of D3-I6, being able to use heating systems. When there is no information on the dwelling’s indoor temperature, it is possible to use D3-I2 instead, a subjective indicator where the home states being cold or hot during winter or summer months. Data collection onsite and energy simulations have allowed showing that, despite low construction quality, indoor temperatures are often within thermal comfort ranges more than 40% of annual hours (
Appendix B), with an 87% probability of these being in a discomfort situation (see
Figure 3). However, it must also be highlighted that in cold periods, there is a relevant percentage of hours (48% on average) whose probability of being below thermal comfort limits for more than 40% of annual hours is 95%. However, other research projects made in this type of social housing and climate have shown that people are comfortable at much lower indoor temperatures, even 14 °C [
28,
36].
Based on the ambiguity commented above, it was decided to modify the deprivation threshold for D3-I1, establishing as a threshold the median time percentage that the housing complex is under the lower adaptative thermal comfort model limit of ASHRAE 55:2017, which establishes a thermal acceptability of 80%. With this, the new threshold defined for D3-I1 is 46.8% of the time.
Regarding D3-I6 (Indoor Humidity), the results obtained show that outdoor relative humidity is above the limits, 65.9% of the year (see
Figure 4) which, added to the low heating intensity in this type of dwelling [
29] and other activities (drying clothing, cooking, electric kettles and occupation), generate high indoor humidity rates during winter. Because of this, and bearing in mind that 58.3% of homes have stated having mold in bedrooms and other rooms, 51.3% water leaks, 30.1% leaks in windows, 20.3% problems due to flooding, 40.7% presence of mold on north-facing walls, and 31.4% on south-facing walls, it is considered to not include this indicator and instead the adapted D3-I6, which can improve the sensitivity and soundness of the overall indicator, associating this indicator to moisture resulting from leaks and condensation, that favor the presence of mold.
D3-I3 (thermal efficiency standard for Housing Energy Rating—CEV, in Spanish), considers a G or F energy rating as the EP threshold, which is difficult to apply in the case study because none of the homes have one, and if this were applied, they would obtain a G or F rating. Because of this, its inclusion within the analysis would not improve the sensitivity of the original indicator. On the other hand, a rating of E or higher would not be directly associated with a low energy consumption or a high thermal comfort [
28,
37], given that vulnerable households cannot afford equip their dwellings [
38]. Furthermore, the energy rating is associated to indoor temperature (D3-I1), and to excessive energy expenditure (even in D4-I1), which is why including it within the analysis could imply a simultaneous penalization in three indicators. Therefore, its application as an EP indicator is discarded.
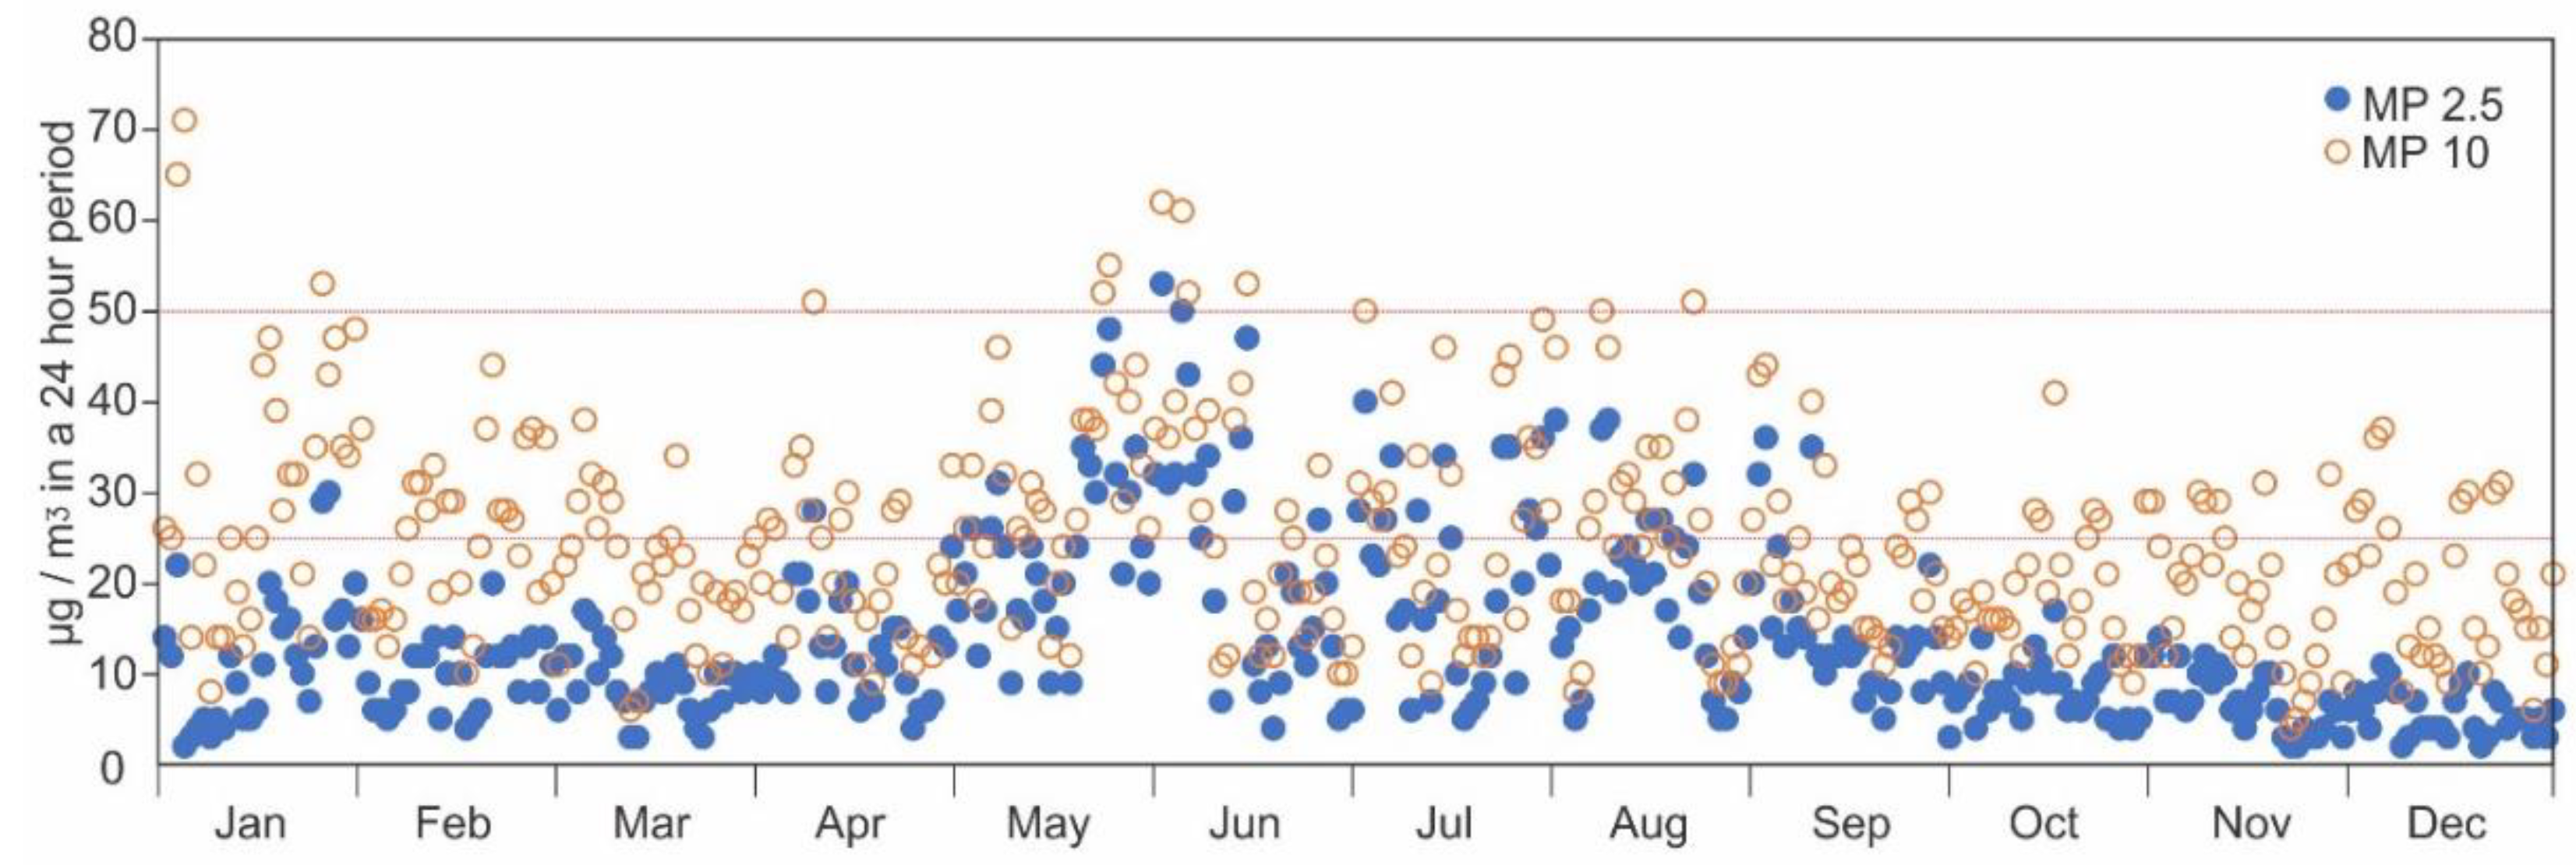
With regard to intra-household contamination, evaluated using D3-I5, it has been seen that during 2020, outdoor contamination values were obtained for a period longer than 24 h for the limits established in D3-I4 (see
Appendix A), during 49 days for PM
2.5, and 13 days for PM
10 (see
Figure 5), while the maximum CO and NO
2 values were never exceeded.
As a result, it can be foreseen that intrahousehold contamination in the case study exceeds the established PM levels, as the dwelling’s leak levels do not allow that this external contamination significantly differs from the indoor one, just as has been shown in other research projects [
31]. In this sense, it is considered that D3-I5 does not provide a real evaluation of the EP situation but more about the environmental contamination of the area the dwelling is located in; this is an aggravating circumstance of the EP situation, not a cause thereof. On the other hand, the thresholds of DI-I1 and D3-I4 are maintained, as they consider as an EP situation the energy sources that give off emissions within the home. In this respect, including D3-I5 would imply a double or triple penalization depending on the case study, it was therefore decided not to include this indicator in the adapted version.
In
Table 7, it can be seen that modifying the threshold of D3-I1 improves its sensitivity when it comes to identifying situations associated to low temperatures in critical periods, that are also linked to the generation of indoor contamination caused by using systems and fuels that emit contaminants within the dwelling. On the other hand, the modification of the threshold associated to indoor humidity (D3-I6) improves the identification of those households that, due to low maintenance, the low quality of their construction materials, or indoor uses that favor the generation of humidity and the possible presence of mold. Finally, the elimination of D3-I1 allows increasing the sensitivity of EPTTI in neighborhoods built in the same period or before the standards associated to energy efficiency came into force.
3.4. Dimension 4: Equality in Energy Expenditures
EAQES D4 on energy expenditure equality comprises two indicators (see
Appendix A), and the EPTTI uses both (D4-I1 and D4-I2) (see
Table 8).
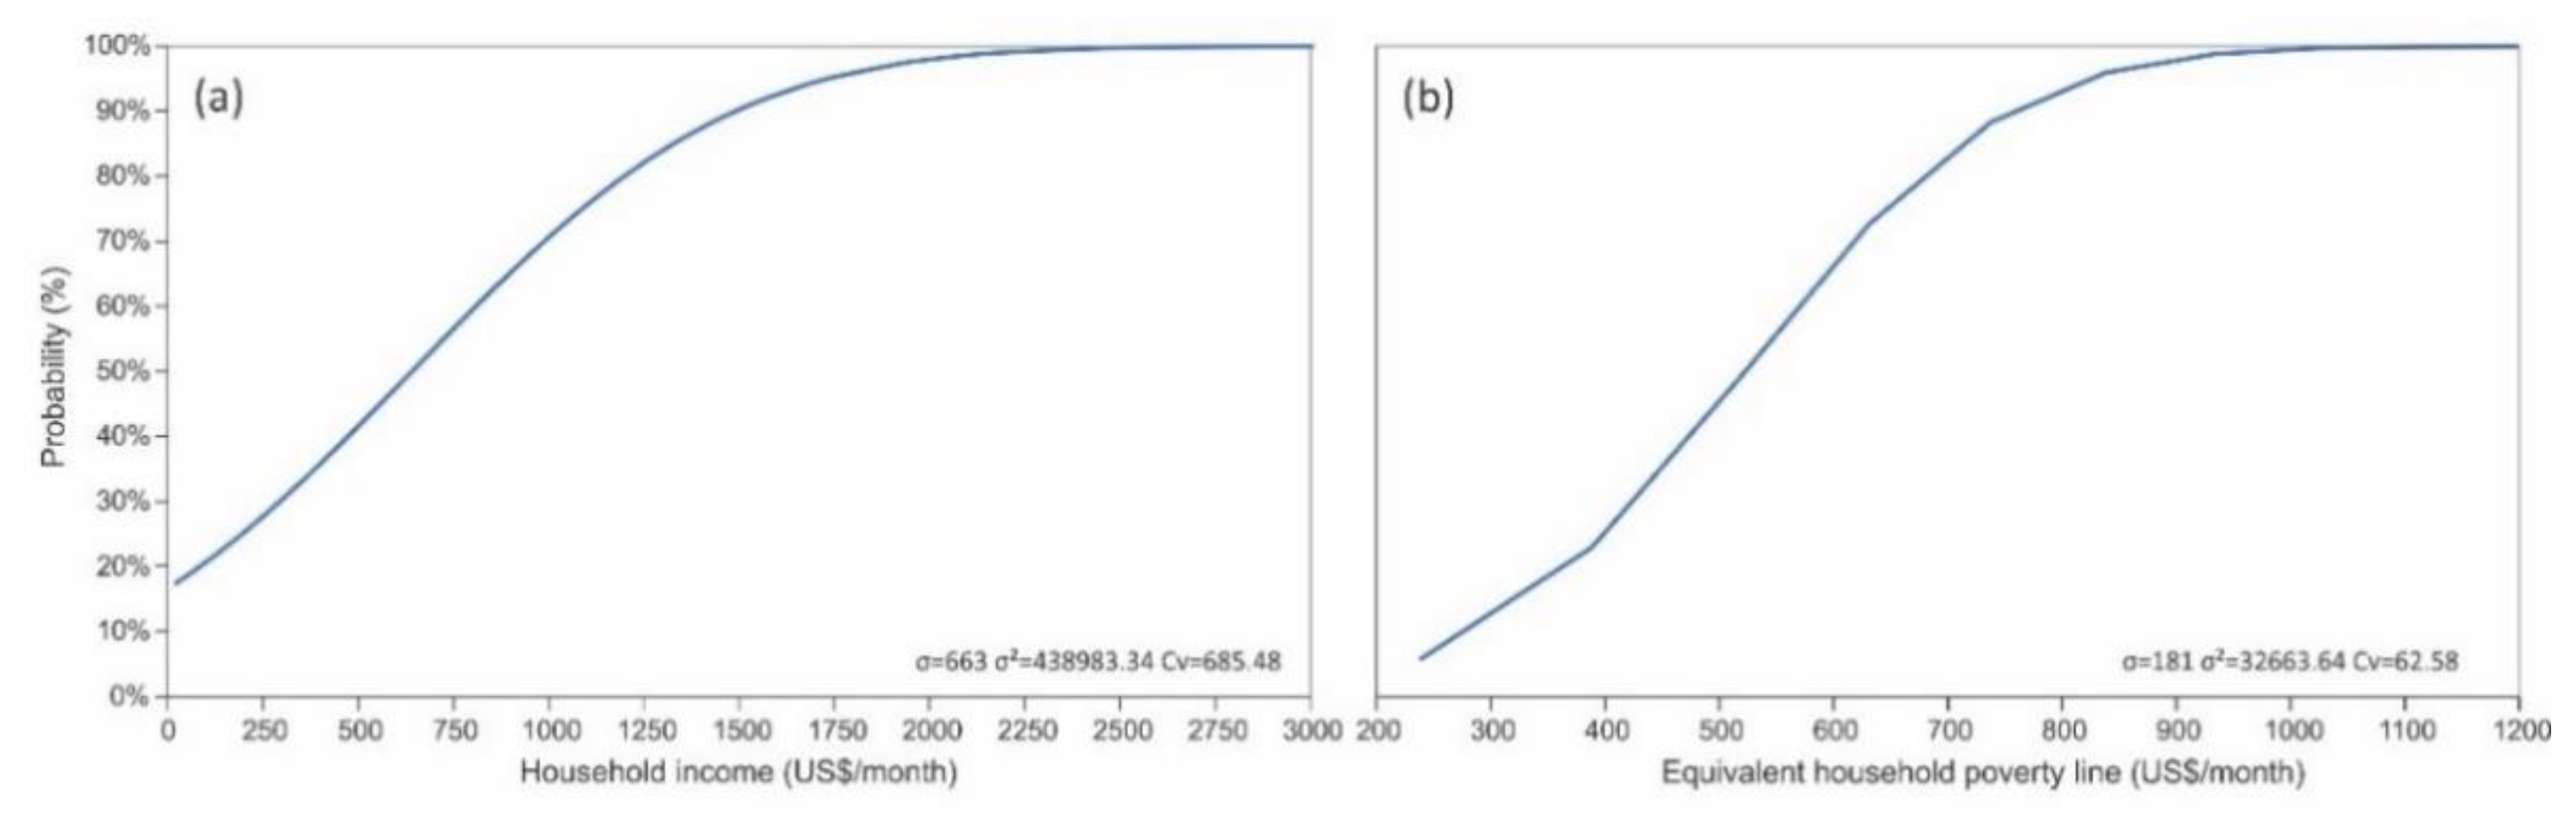
Regarding this indicator, the high probability (50%) has to be considered of finding an income below US
$640 within the sample and a 30% probability of having a monthly income between US
$640 and
$1199, resulting in the US
$640 average income (see
Figure 6). Furthermore, it is necessary to highlight that there is a 73% chance within the group for the EPL (set by the Social Development Ministry) to be US
$631. This shows that there is a high number of households that are considered poor due to their income level and the number of people (46.3%), demonstrating the vulnerability of social housing.
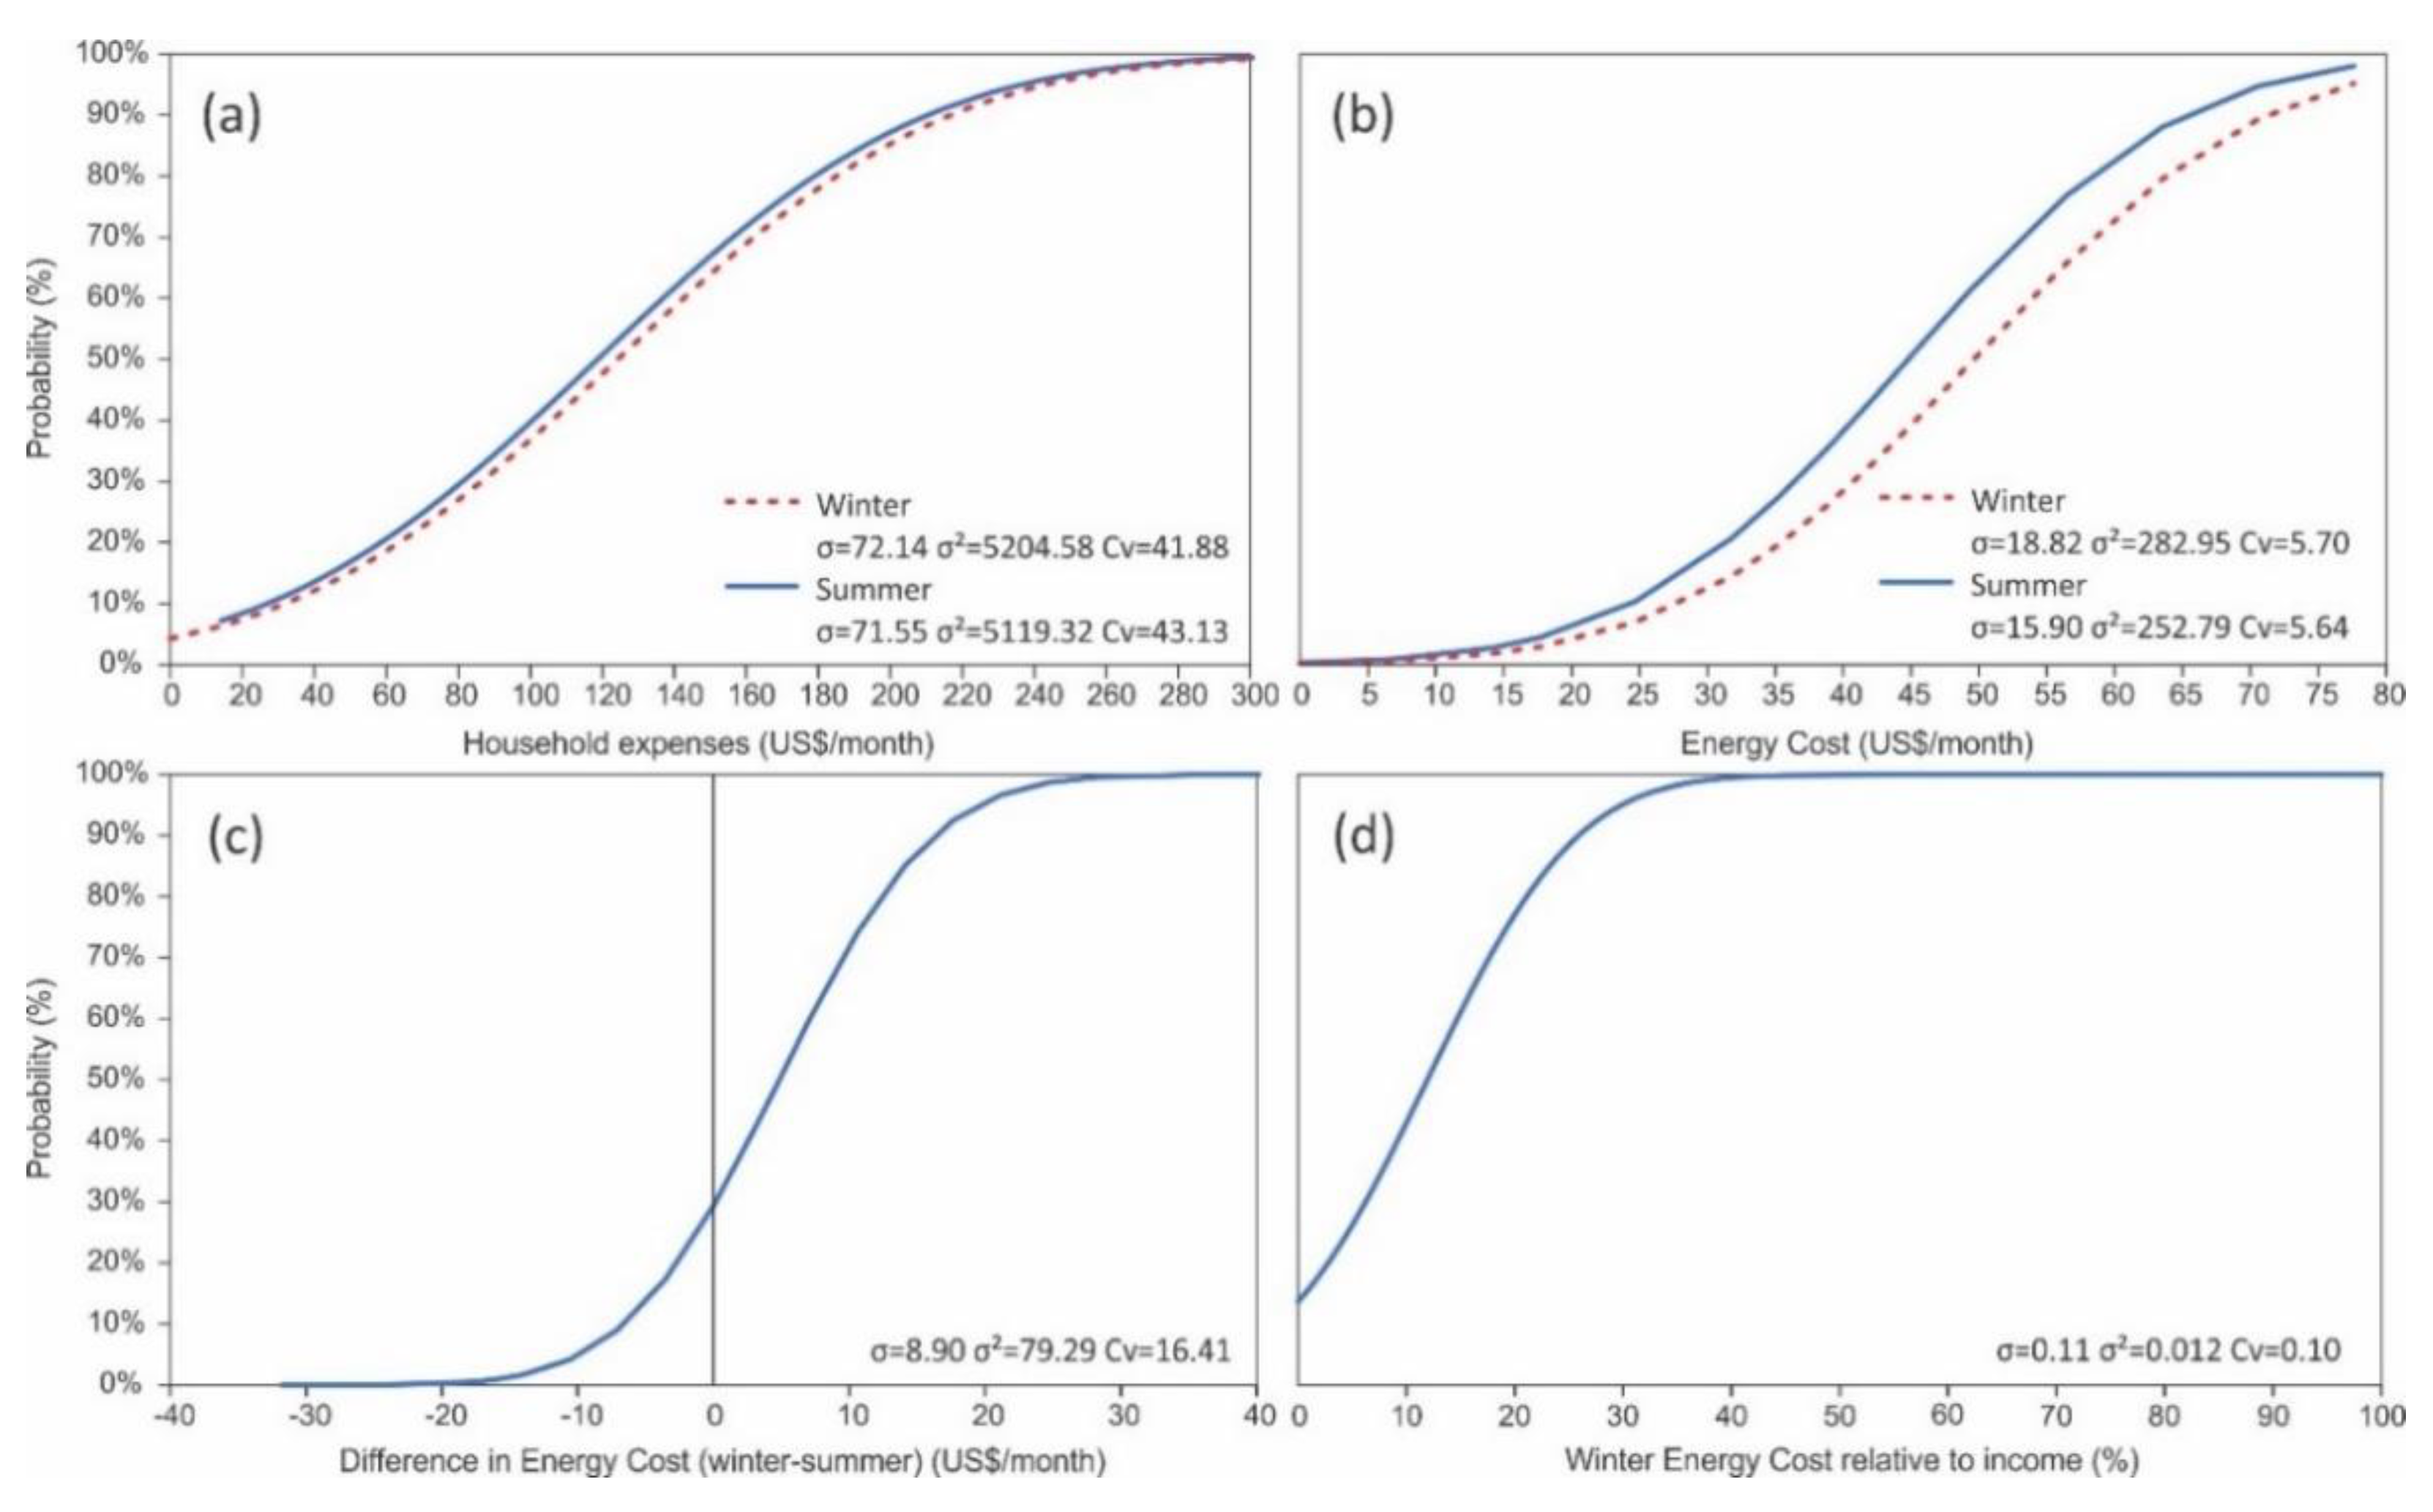
As for expenditure, bearing in mind rental or mortgage payments, administration fees, and consumption in electricity, gas, water, and Internet or telephone, it can be seen that both in winter and summer, there is a 50% probability that families spend over US
$120 in summer and US
$127 in winter (see
Figure 7). Regarding consumption in electricity and gas, the consumption levels do not show great differences, with the probability of consuming more than US
$38.8 in summer being 75%, and 80% in winter. It is important to highlight that, although consumption levels are not high, their relationship compared to the household income represents an important percentage, over 10% in 57.5% of the households in winter. Meanwhile, it is necessary to indicate that not all households increase their expenditure on electricity and gas in winter, 30% either maintain or reduce them, which indicates that perhaps other expenditures associated to other energies (i.e., firewood), which have not been collected due to their difficult quantification, are generated.
Based on this, it is considered that using the Minimum Income Standard (MIS) in D4-I1, established by RedPE based on EPL [
22,
39], and the income and expenditures declared by the household, is relevant to identify households in EP [
15,
16]. On the other hand, the under-expenditure in energy (D4-I2) has been determined from the median of the group of households in the sample, which belongs to the first eight income deciles. The indicator has identified 75 households whose energy expenditure was below half the median of energy poor household expenditures. It has been seen that D4-I2 is complex to apply and, in combination with the other indicators, it is unable to identify as energy poor those homes that are below the equivalent poverty line (see
Table 9). For this reason, the inclusion of a new indicator, D4-I3, is proposed (see
Table 8), related to said situation so that those homes, despite not being in EP according to other indicators, are classified as energy poor on being below the EPL, and therefore, not including D4-I2 as this does not increase the overall sensitivity of the indicator.
3.5. Comparison of Results
Finally, based on the previous evaluation, the adapted EPTTI comprises nine indicators, categorized into four access dimensions: Food and Hygiene (D1); Lighting and Electrical Devices (D2); Climate control of dwelling (D3), and Equality in Expense (D4) (see
Table 9 and
Appendix C).
It is necessary to indicate that the incorporation of D4-I3 is important when it comes to identifying homes that are under the EPL (70%) and that are not detected by the rest of the indicators jointly (they only identify 10.9%). Therefore, it is considered that the valid results are those obtained by the Adapted EPTTI when it includes D4-I3 (Adapted EPTII+D4-I3). However, the original indicator does not have any criterion for the identification of households under EPL as an energy poor household, due to the overestimation the indicator currently has associated to D2-I2, D2-I5 and D3-I3, simultaneously penalizing 100% of the sample. In addition, it has been possible to see that the adapted indicators have a greater sensitivity to detect the dimension that can produce a future EP situation, something that is not possible with the original one. Specifically, 107 homes (16.7%) have been identified that have three indicators under the exceedance threshold, 54 (8.4%) with two, and 21 (3.3%) with one. On the other hand, it has been seen that the adaptation of the deprivation threshold has improved the sensitivity to more accurately identify complete dimensions that generate EP situations (D1, improves by 0.3%, and D3, improves by 0.8%).
4. Discussion
The results obtained from the original EPTTI in the case study show important differences regarding the application that researchers made with national and regional databases for Central-Southern Chile [
16]. On comparing EP values between the adapted three-dimensional indicator with those obtained from the proposed original, and its measurements at a national level, it is seen that all indicators increase the percentage of families in EP. However, the indicators that show a greater difference compared to the national and regional values are D2-I2 and D3-I3, with an increase of 81.90% and 33.79% versus the national value, reaching in both cases, 100%. This shows that although indicators such as SAIDI or the Energy Rating can be interesting at a country level, they lose their efficacy when applied locally or at a neighborhood level, where dwellings have generally similar values in both indicators. Meanwhile, an increase of close to 40% is seen in D3-I4 and D4-I1, rising from 3.98% nationally to 46.65% in the case study for D3-I4, of 22.66% to 63.18% for D4-I1. D3-I2 compared to D3-I1 also sees an increase of 29.09%, and D1-I1 and D2-I2, around 4%. These differences are essentially due to the social level of the case study households for the energy sources and expenditure indicators, and the climate and construction standard of dwellings for the thermal comfort case.
Income poverty at a national level is 8.6% and extreme poverty 2.3%. These values are much lower than those obtained in the case study, where poverty levels are 64.75% and 39.34% of the population is below the extreme poverty line by equivalent person, showing that the socioeconomic situation of the housing complex’s inhabitants is vulnerable. Hence, it is inferred that energy needs are less relevant, when having to choose in winter between paying for food for the home or heating it.
The results obtained regarding the percentage of energy expenditure compared to income, show that in this social class, the 10% value is relevant [
37], as most households have other aspects which lead to them being considered energy poor. This shows that the Boardman indicator should be studied regarding multidimensional indicators, to expand upon their simplification as has already been done in the FPPRI [
6,
7]. This could also be analyzed regarding the 2M indicator but bearing in mind a local or regional median [
40], because as has been observed, there is a great difference compared to the national results. On the other hand, it is important to highlight that the use of the MIS [
39], adjusted with the EPL of the MDS, and complemented with other indicators, generates a broad perspective of EP in the case study. This fact shows the need to further study other indicators such as the LIHC, AFCP or HEP, since as it has been seen in the LIHC, its use may leave groups considered more vulnerable (elderly, chronically ill, disabled, small children) outside of an EP situation [
41], just as occurs with MIS in the case study. Regarding the use of surveys such as the European one [
42], the results show that identifying deficiencies of the dwelling, associated to both construction and energy systems, is relevant.
The results associated to D3-I3 have shown that, although energy ratings can be interesting at national or regional scales, in the specific case study they lose sensitivity on finding a homogeneous sample for construction quality. Meanwhile, EP indicators based on thermal comfort must be complemented with other indicators, as they underestimate other aspects related to access or equality in expenditures [
6,
7,
43].
As for identifying hidden EP situations, i.e., situations which are not identified by current indicators, it is seen that the Adapted EPTTI, unlike other current indicators (see
Table 1), through ID4-I1 and ID4-I3 allows, on one hand, avoiding the oversizing of households in EP (the households with higher income have a higher energy expenditure), and on the other, identifying homes that are not reaching a minimum energy consumption due to their low incomes. However, unlike the IVH [
44], developed in Spain and applied in Europe, the Adapted EPTTI does not provide an evaluation of the health status that households in EP may be in. This is a point to be addressed in future research, once the potential of the Adapted EPTTI to make an EP situation evaluated at a local level has been demonstrated. Another limitation found is the availability of data, as the lack of reliable data in Chile complicates its applicability. A final limitation, and one to improve in future research, is the impossibility of analyzing the different EP situations found in terms of gender [
45].
However, it can be said that the Adapted EPTTI is an important contribution to the Original EPTTI, allowing making a more accurate and detailed evaluation of the EP situation, as well as highlighting the need of case specific indicators to assess EP at the local level.
5. Conclusions
There are multiple indicators around the world to measure EP, however, most of them either have been created in countries where there is less social inequality than in Chile or are adaptations of previous versions. In this sense, the discussion about their pertinence to countries with similar social characteristics to those of Chile gains relevance.
The goal of this research has been the evaluation and adaptation of the EP indicator elaborated by RedPE (national network leading EP studies in Chile), the EPTTI, applying it in social housing, so that its sensitivity and soundness can be improved. It is worth indicating that the EPTTI has only been applied nationally, without taking into consideration the particular aspects of each region. The results have shown that the original indicator is applicable to social housing complexes, as long as the information needed to measure EP is available. However, the deprivation indicators and thresholds established can be adjusted to improve its sensitivity and soundness. In this sense, indicators such as SAIDI (D2-I2), SAIFI (D2-I3) or the thermal EE equivalent to CEV (D3-I3), that may be of interest at a country scale, lead the indicator to lose sensitivity when it is applied to a reduced set of dwellings built in the same period of time. On the other hand, it can be concluded that there are other indicators whose thresholds must be adjusted to improve their capacity to identify EP situations associated to health risks of people in social housing, namely the ACS System (D1-I3), Access to electricity (D2-I1), Capacity of Supply (D2-I4) or Electrical installation (D2-I5). Meanwhile, there are indicators that must be included and adapted to climatic and environmental conditions to avoid that EP-related situations are under or overestimated. Among these indicators are Indoor Temperature (D3-I1), Intrahousehold Contamination (D3-I5), and Indoor Humidity (D3-I6). It has to be underscored that Lighting (D2-I7) and Thermal Comfort (D3-I2), related to environmental comfort, are of high interest. However, their use requires going further into social and cultural aspects that users have about their environments. This research opens up the debate on using deprivation thresholds in low income households, as the evaluation is going to be negative in most cases, leading public funding not to be effectively deployed and optimal solution inefficiently implemented.
The main contribution of this research is the application of an indicator to a specific real case study in order to identify more accurate methods to measure EP in central-southern Chile. By using results obtained in the Adapted EPTTI, it is possible to prepare questions for future censuses, and obtain relevant information to prepare public policies focused on the reduction and eradication of EP in the most vulnerable sectors. In addition, the results of this study also allow establishing action priorities when it comes to generating public policies, establishing which are the most relevant dimensions.
The main limitations of this study are associated to the case study, and its representativity within a broader social and climatic context. However, the methods to obtain the data used in this work have allowed reducing subjectivity, both of the interviewer and interviewee, focusing on observations and measurable data. Thus, it is considered relevant to prepare new applications of the indicator in other climatic and social contexts, as well studying the inclusion of other indicators associated to access to technology and information, such as the Internet, entertainment, telephone, work, educational, and health factors.
In conclusion, it can be said that the Adapted EPTTI proposed by this work provides a greater understanding of the EP situation at a local level, identifying the dimensions that require greater attention, and, consequently, helping policymakers develop effective measures to mitigate EP in Chile.
Author Contributions
Conceptualization, M.L.-V. and A.P.-F.; methodology M.L.-V. and A.P.-F.; software, M.L.-V.; validation, R.C.-R., A.P.-F. and P.W.; formal analysis, M.L.-V., R.C.-R. and A.P.-F.; investigation, M.L.-V. and A.P.-F.; resources, A.P.-F.; data curation, A.P.-F.; writing—original draft preparation, M.L.-V.; writing—review and editing, A.P.-F. and R.C.-R.; visualization, M.L.-V. and A.P.-F.; supervision, A.P.-F. and P.W.; project administration, A.P.-F.; funding acquisition, A.P.-F. All authors have read and agreed to the published version of the manuscript.
Funding
This research was funded by National Research and Development Agency of Chile (ANID), FONDECYT research project 1200551.
Institutional Review Board Statement
The study was conducted in accordance with the Declaration of Helsinki, and approved by the Institutional Ethics Committee of University of Bío-Bío (protocol code FONDECYT research project 1200551, 19 June 2020).
Informed Consent Statement
Informed consent was obtained from all subjects involved in the study.
Data Availability Statement
Not applicable.
Acknowledgments
The authors they would like to acknowledge the research group “Confort ambiental y pobreza energética (+CO-PE)” of the University of the Bío-Bío for their support with this research.
Conflicts of Interest
The authors declare no conflict of interest.
Appendix A. Dimensions and Thresholds of the Equitable Access to Quality Energy Standard
Table A1.
Dimensions and thresholds of the Equitable Access to Quality Energy Standard, created by RedPE.
Table A1.
Dimensions and thresholds of the Equitable Access to Quality Energy Standard, created by RedPE.
| Dimension | Indicator | EP | EP Exceedance |
|---|
Food and Hygiene
(D1) | Energy source and kitchen appliances (D1-I1) | Kerosene, coal, wet firewood or waste with open combustion | Gas, electricity, firewood, pellet, solar energy and closed combustion |
| Refrigerator EE (D1-I2) | <B | A, A+ o A++ |
| ACS System (D1-I3) | Does not have ACS. | Has ACS. |
Lighting and electrical devices
(D2) | Access to electricity
(D2-I1) | Not connected to grid, illegal connection or uses own generator whose fuel is bought more than an hour away. | Connected to the grid or has autonomous systems that ensure supply |
| System Average Interruption Duration Index (SAIDI) (D2-I2) | >1 h | <1 h |
| System Average Interruption Frequency Index (SAIFI) (D2-I3) | >6 interruptions | <6 interruptions |
Supply Capacity
(D2-I4) | Non-simultaneous connection of high consumption electronic devices | Simultaneous connection of high consumption electronic devices |
Electrical installation
(D2-I5) | Does not comply with NCh 04/2003 | Complies with NCh 04/2003 |
Voltage oscillations
(D2-I6) | Grid voltage regulated less than 95% of the time ± 10% | Grid voltage regulated 95% of the time ± 10% |
Lighting
(D2-I7) | One light source below 1000 lmhr | Multiple light sources of required lmhr |
| < 4 h of lighting at nighttime | >4 h of lighting at nighttime |
| Climate control of the dwelling (D3) | Indoor Temperature
(D3-I1) | Is kept above the comfort temperature less than the % of time of use according to ECSV Thermal Zone | Is kept above the comfort temperature for the same or most of the % of time of use according to ECSV Thermal Zone |
Thermal Comfort
(D3-I2) | Home states being cold during winter months or hot during summer months. | Home states not being cold during winter months or hot during summer months. |
| Thermal efficiency standard equivalent to the Dwelling Energy Rating (D3-I3) | Rating of F or lower | Rating of E or higher |
| Energy source and heating (D3-I4) | Kerosene, coal, wet firewood or waste for heating and with open combustion | Gas, electricity, firewood, pellets, logs and/or solar energy, and combustion is closed |
Intrahousehold contamination
(D3-I5) | Intrahousehold contamination exceeds:
CO: 7 mg/m3 in a 24-h period
PM2.5: 25 µg/m3 in a 24-h period
PM10: 50 µg/m3 in a 24-h period
NO2: 200 µg/m3 in a 1-h period | Intrahousehold contamination does not exceed the established levels |
Indoor humidity
(D3-I6) | Humidity and condensation levels that favor presence of mold indoors | Humidity and condensation levels that avoid the presence of mold indoors |
| Relative humidity levels between 30% and 70% lower than established time of use | Relative humidity levels between 30% and 70% during the established time of use |
Energy expense equality
(D4) | Excessive expense in energy, based on Minimum Income Standard (MIS)
(D4-I1) | Available income of home − (costs of dwelling + energy expense of home) < equivalent poverty line | Available income of home − (costs of dwelling + energy expense of home) > equivalent poverty line |
Under-expense in energy, based on Hidden Energy Poverty
(D4-I2) | Energy expense of the home < 0.5 of the median expenses of dwellings of the same type and composition (within the first 8 deciles) | Energy expense of the home > 0.5 of the median expenses of dwellings of the same type |
Appendix B. Evaluation of the Thermal Comfort of Dwellings
The evaluation of the thermal behavior of the envelope has been based on two analyses: a first analysis based on the calculation of the thermal transmittance values (U Value), determined for each construction element of the dwellings and blocks as per NCh853; and a second analysis, focused on evaluating the thermal behavior of the envelope for the operation of the dwelling under free oscillation. The thermal performance analyses have been made using an energy simulation according to that stated in the following sections.
Appendix B.1. Geometric Definition of the Blocks
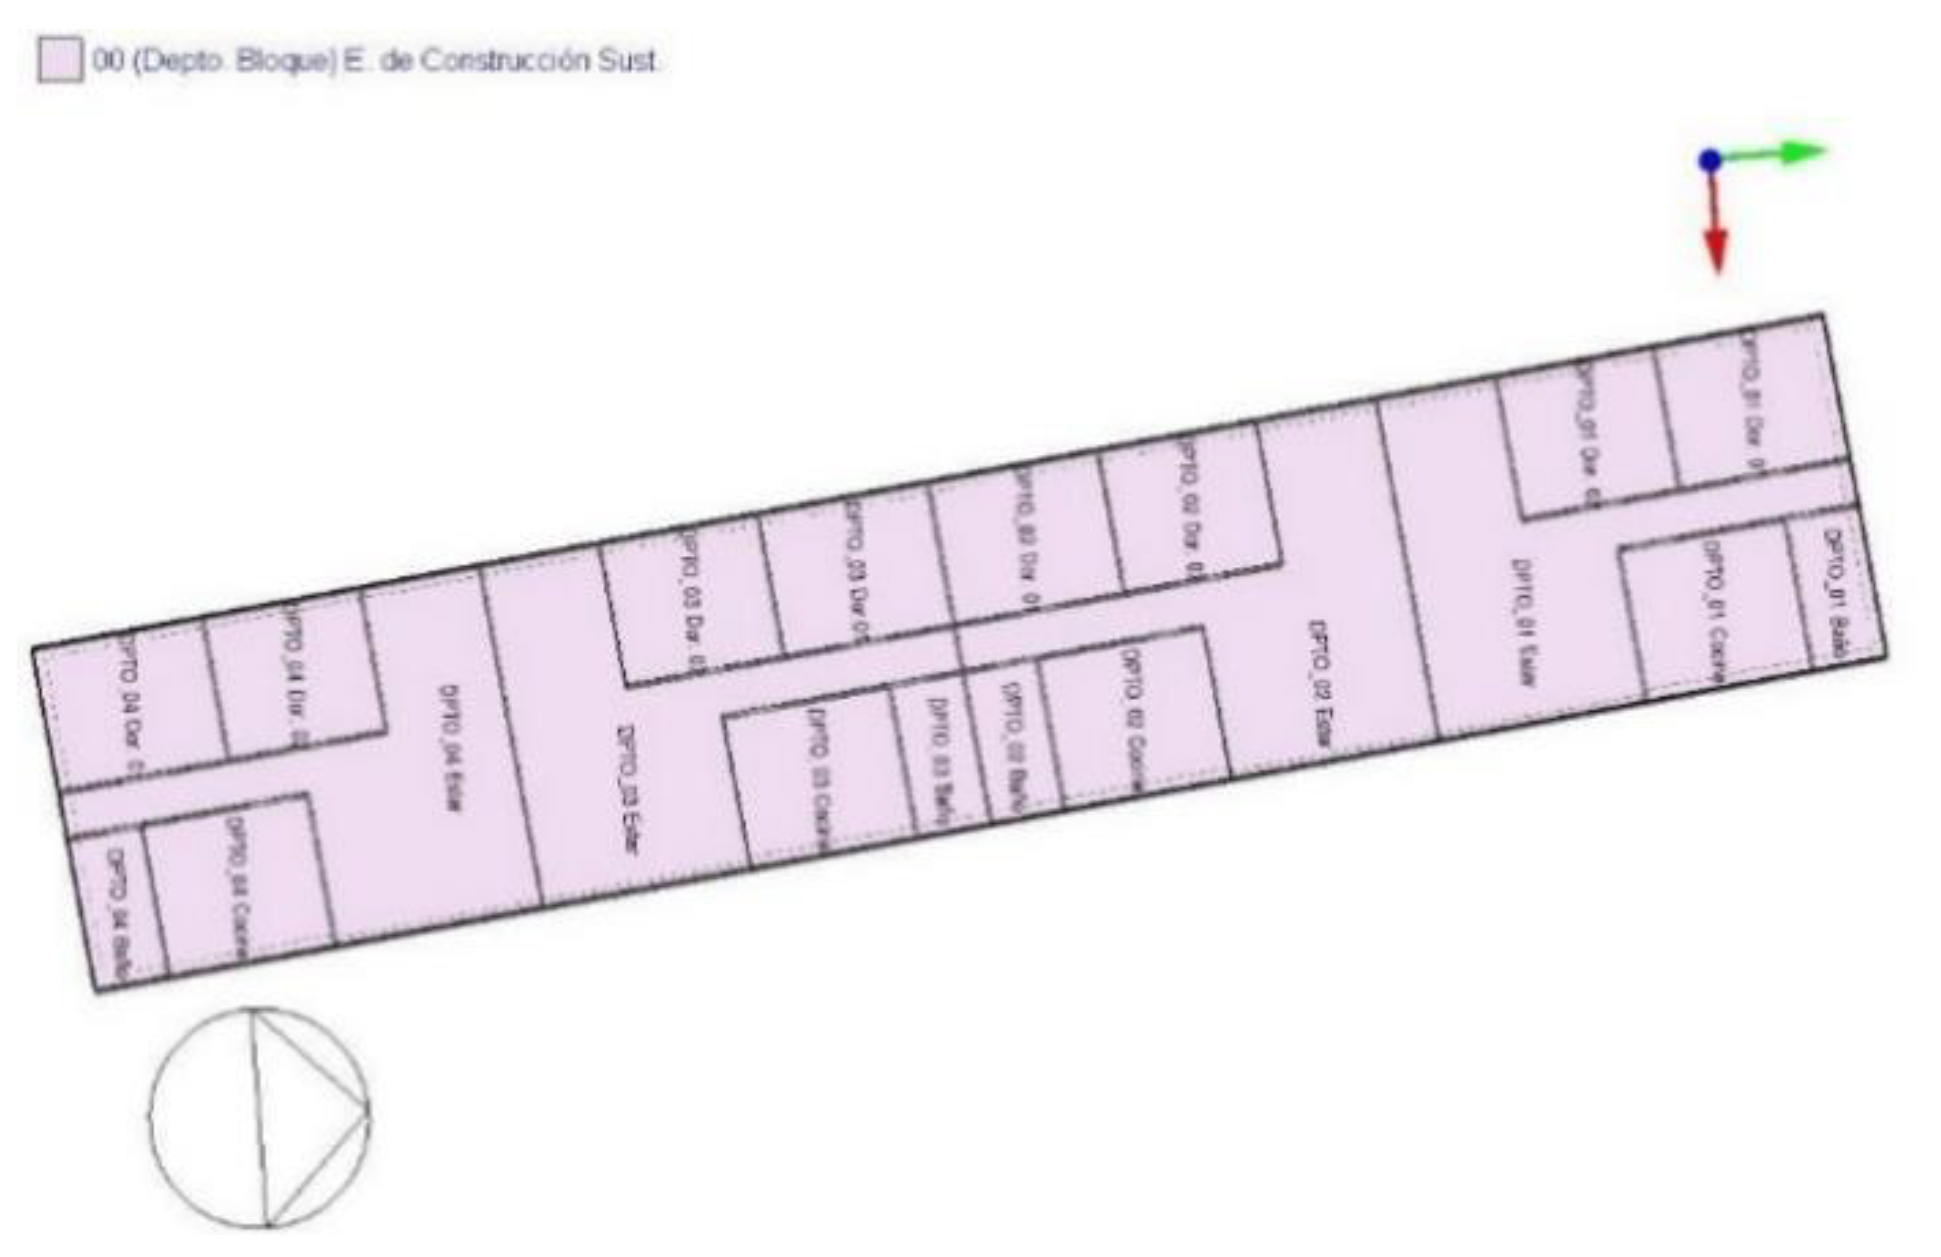
The geometric definition of buildings has been made based on the available material and onsite visits. In the case of the apartments, this has been simulated considering that most of these have 2 bedrooms, with an approximate surface area of 38.4 m
2 per apartment, and an occupation of 4 people per apartment (See
Figure A1 and
Figure A2).
Figure A1.
Geometric definition of block in DesignBuilder and terrain pictures (authors’ own preparation).
Figure A1.
Geometric definition of block in DesignBuilder and terrain pictures (authors’ own preparation).
Figure A2.
Floorplan Blocks (authors’ own preparation).
Figure A2.
Floorplan Blocks (authors’ own preparation).
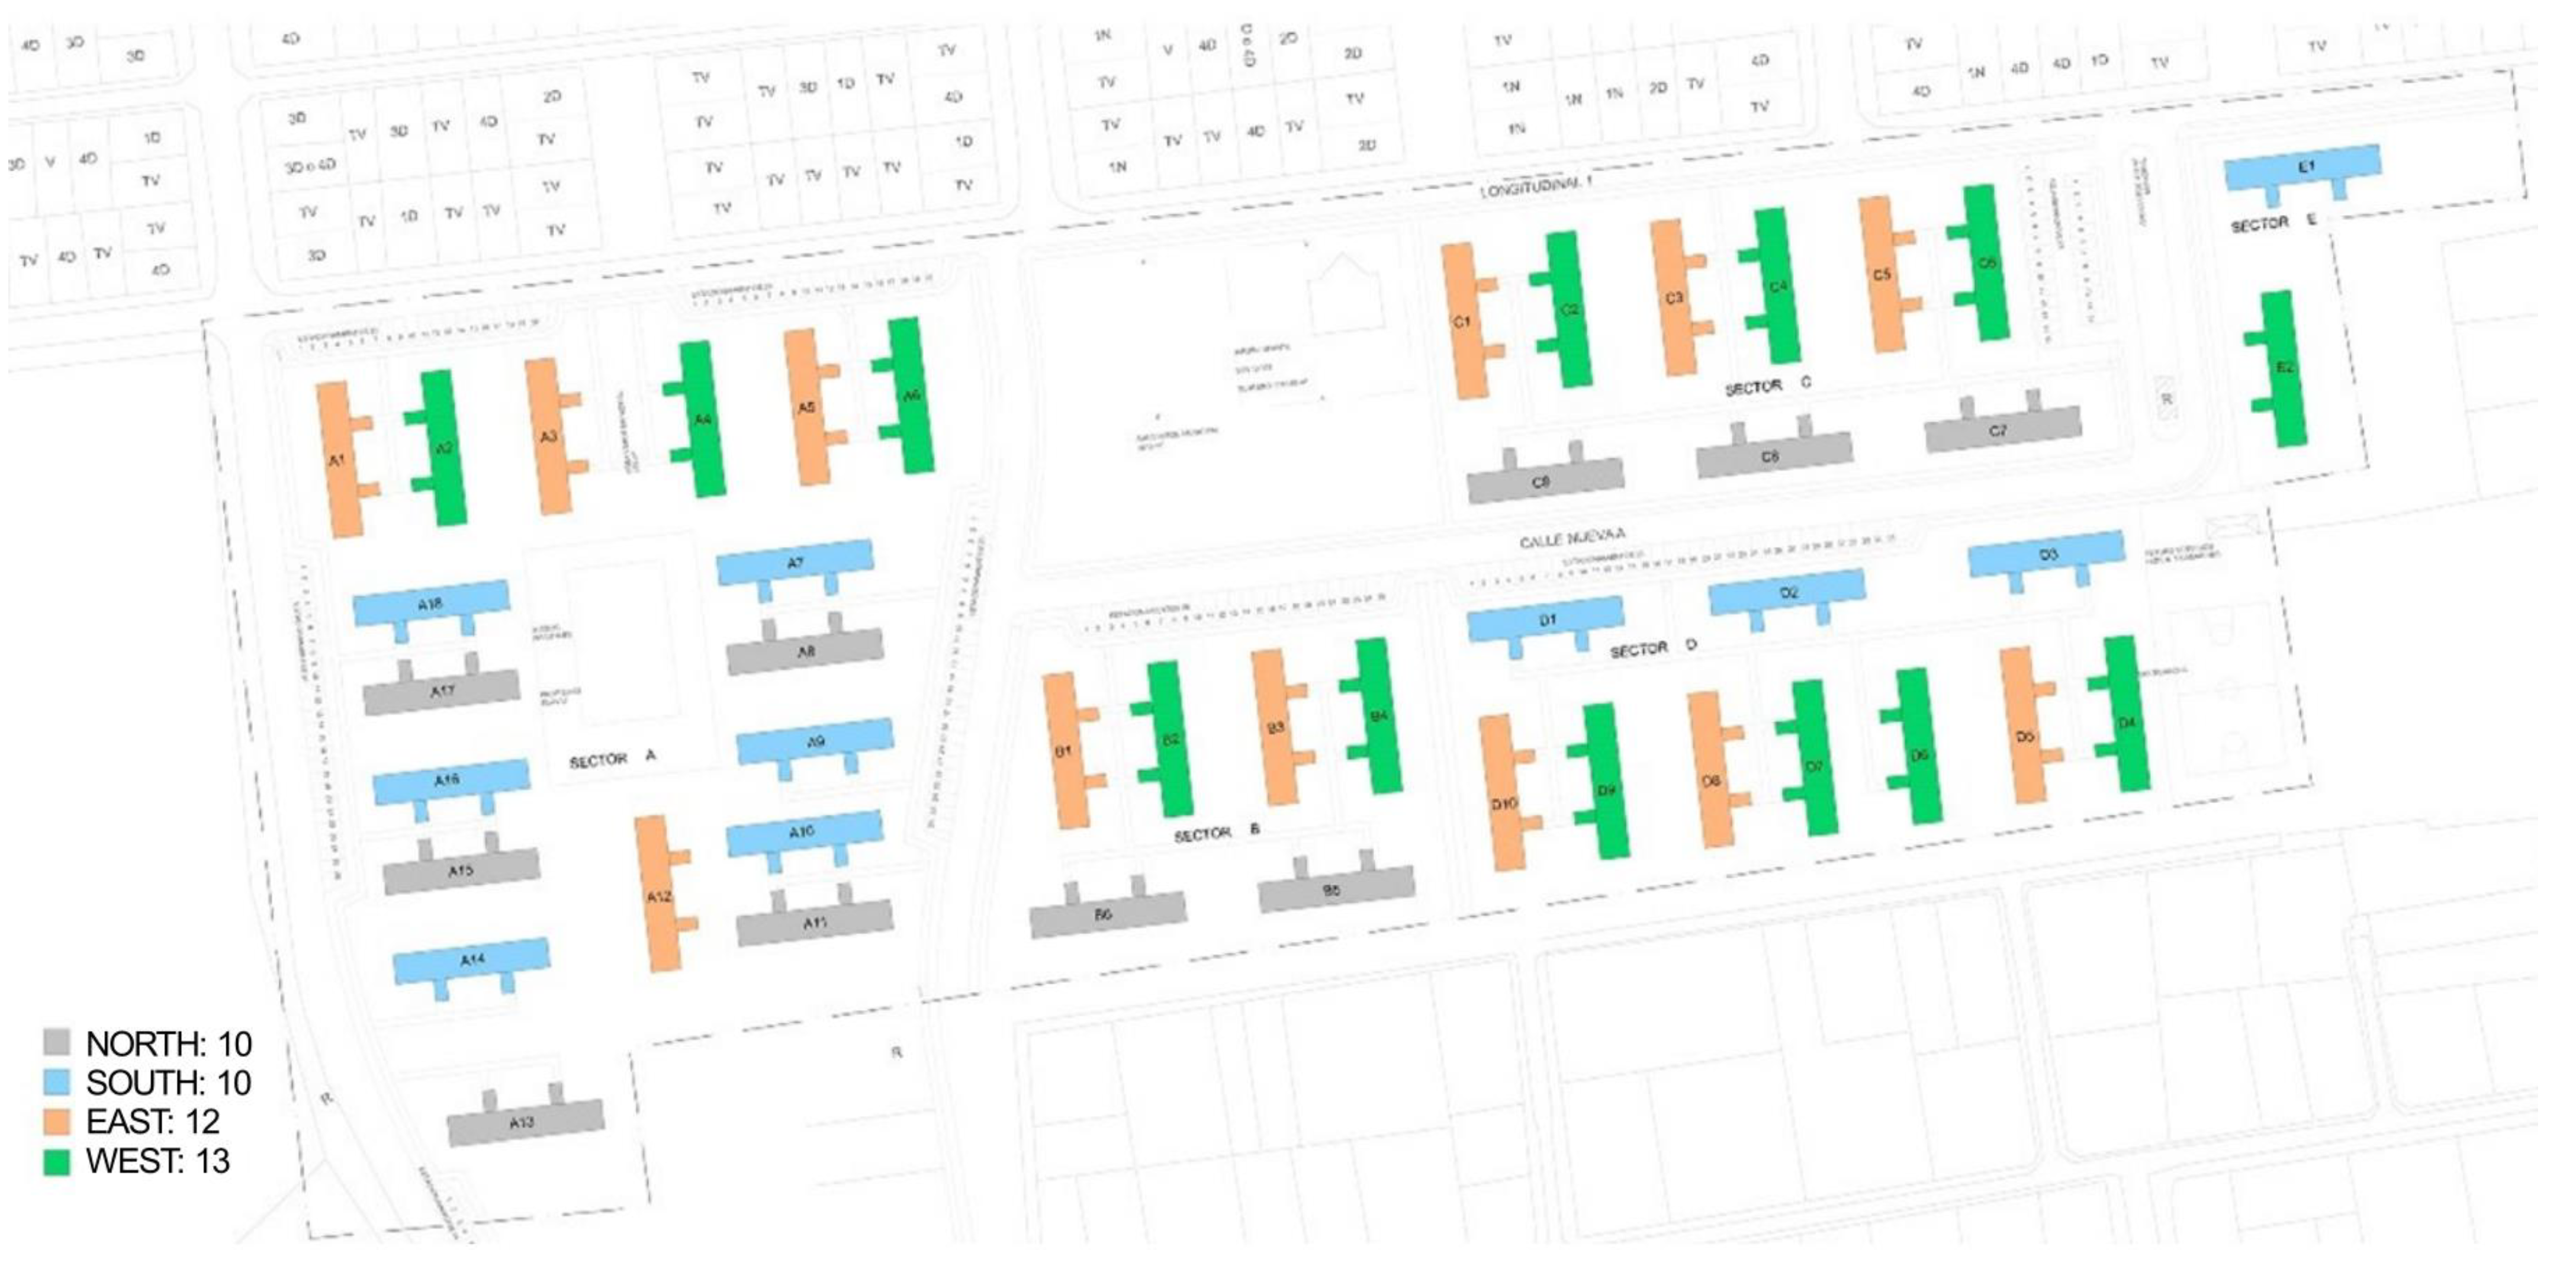
The blocks have been classified by orientation, to be able to analyze them and assign the results to the database considering the typologies. Block A3 (EAST), Block A7 (SOUTH), Block A8 (NORTH), and Block E2 (WEST) were chosen as characteristic blocks by orientation. In
Figure A3, the distribution of the blocks by orientation can be seen, with 10 blocks facing north, 10 to the south, 12 to the east, and 13 to the west.
Figure A3.
Blocks urban distribution (authors’ own preparation).
Figure A3.
Blocks urban distribution (authors’ own preparation).
Appendix B.2. Geometric Definition of the Dwellings
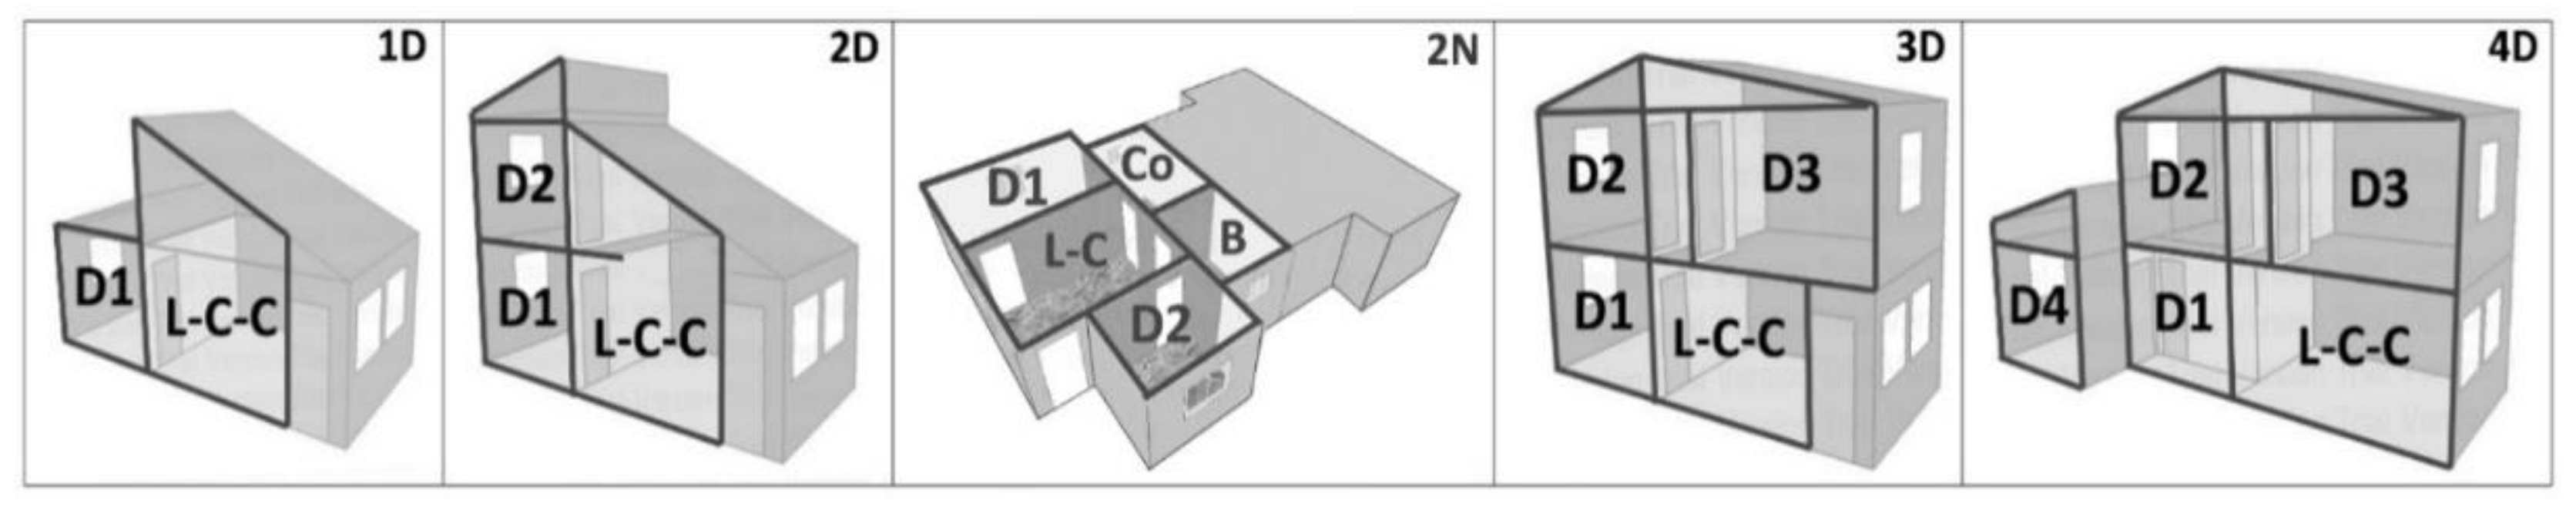
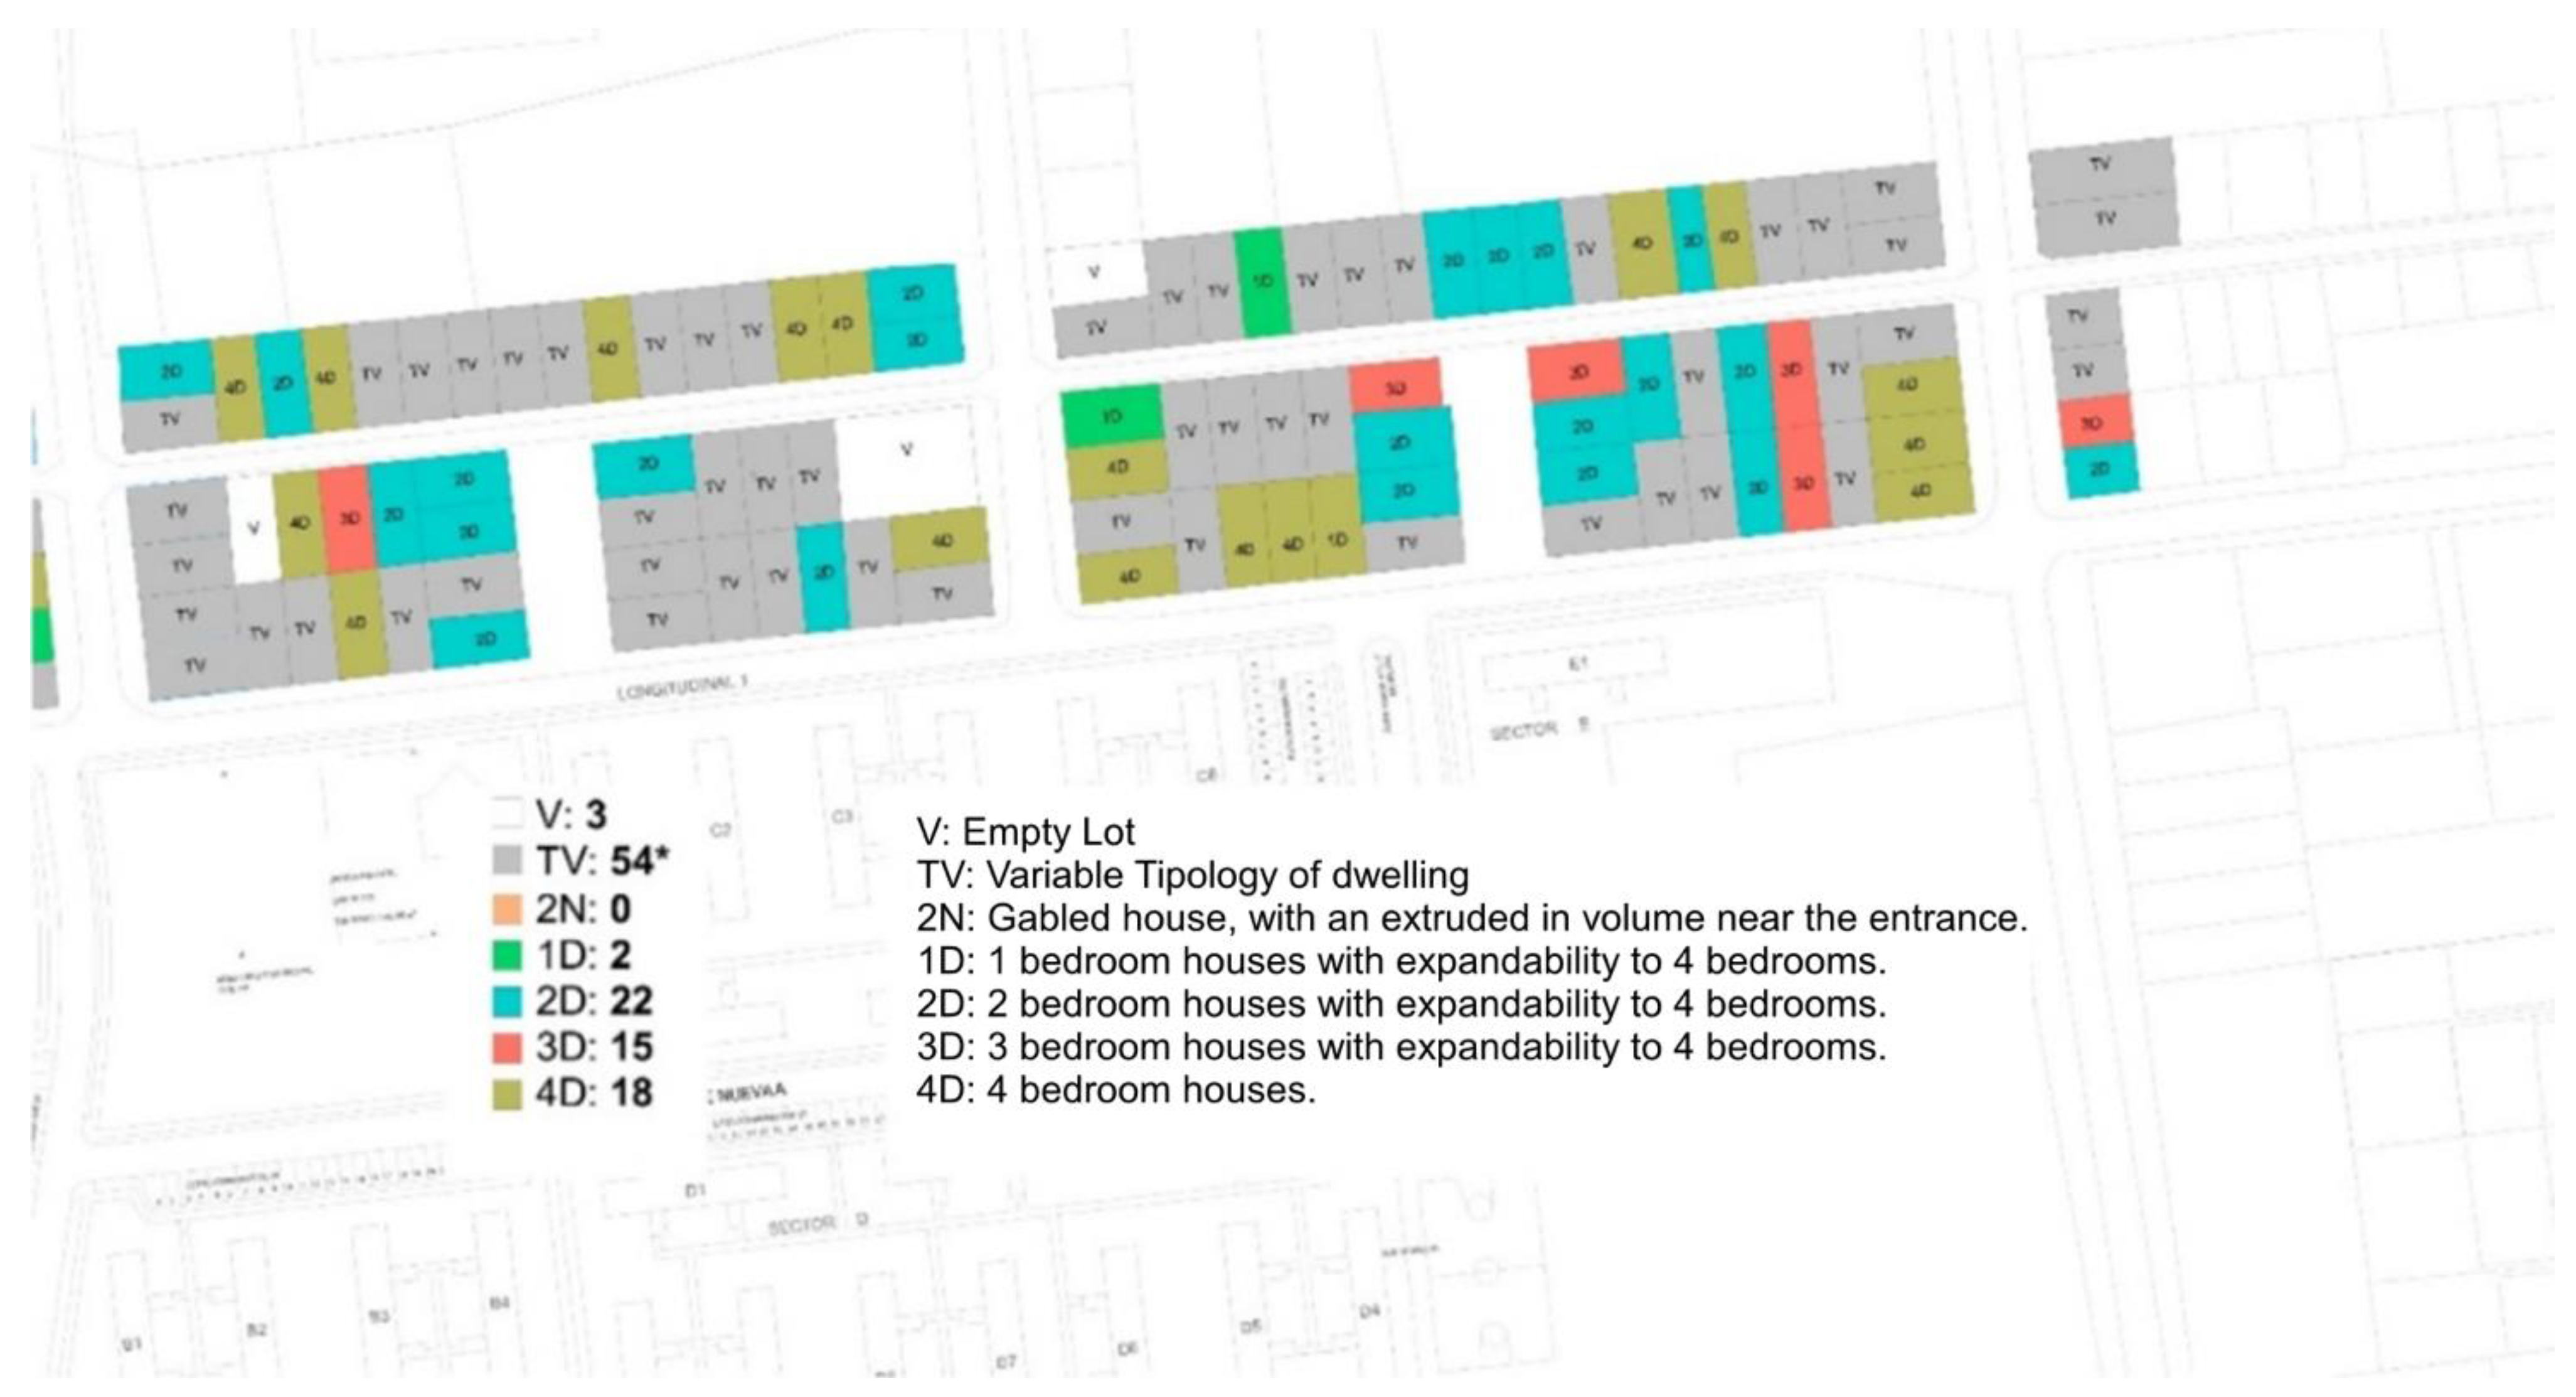
The dwellings modeled in DesignBuilder represent 5 different typologies, which vary in surface area and the number of available bedrooms. As it can be seen in
Table A2 and in
Figure A4, the five dwelling typologies are classified with a representative code for the number of bedrooms that the dwelling has (1D, 2D, 2N, 3D, and 4D). The number of inhabitants was assigned according to that defined in the Sustainable Construction Standards for Chilean Dwellings, i.e., the number of inhabitants of each dwelling consists in the number of bedrooms plus two additional people (See
Table A2).
Table A2.
Typologies of housing, surface, number of bedrooms, and inhabitants.
Table A2.
Typologies of housing, surface, number of bedrooms, and inhabitants.
| Dwelling | Surface Area (m2) | Bedrooms | Inhabitants |
|---|
| 1D | 24.78 | 1 | 3 |
| 2D | 35.42 | 2 | 4 |
| 2N | 35.98 | 2 | 4 |
| 3D | 45.65 | 3 | 5 |
| 4D | 52.83 | 4 | 6 |
Figure A4.
Classification of interior areas in housing models (authors’ own preparation).
Figure A4.
Classification of interior areas in housing models (authors’ own preparation).
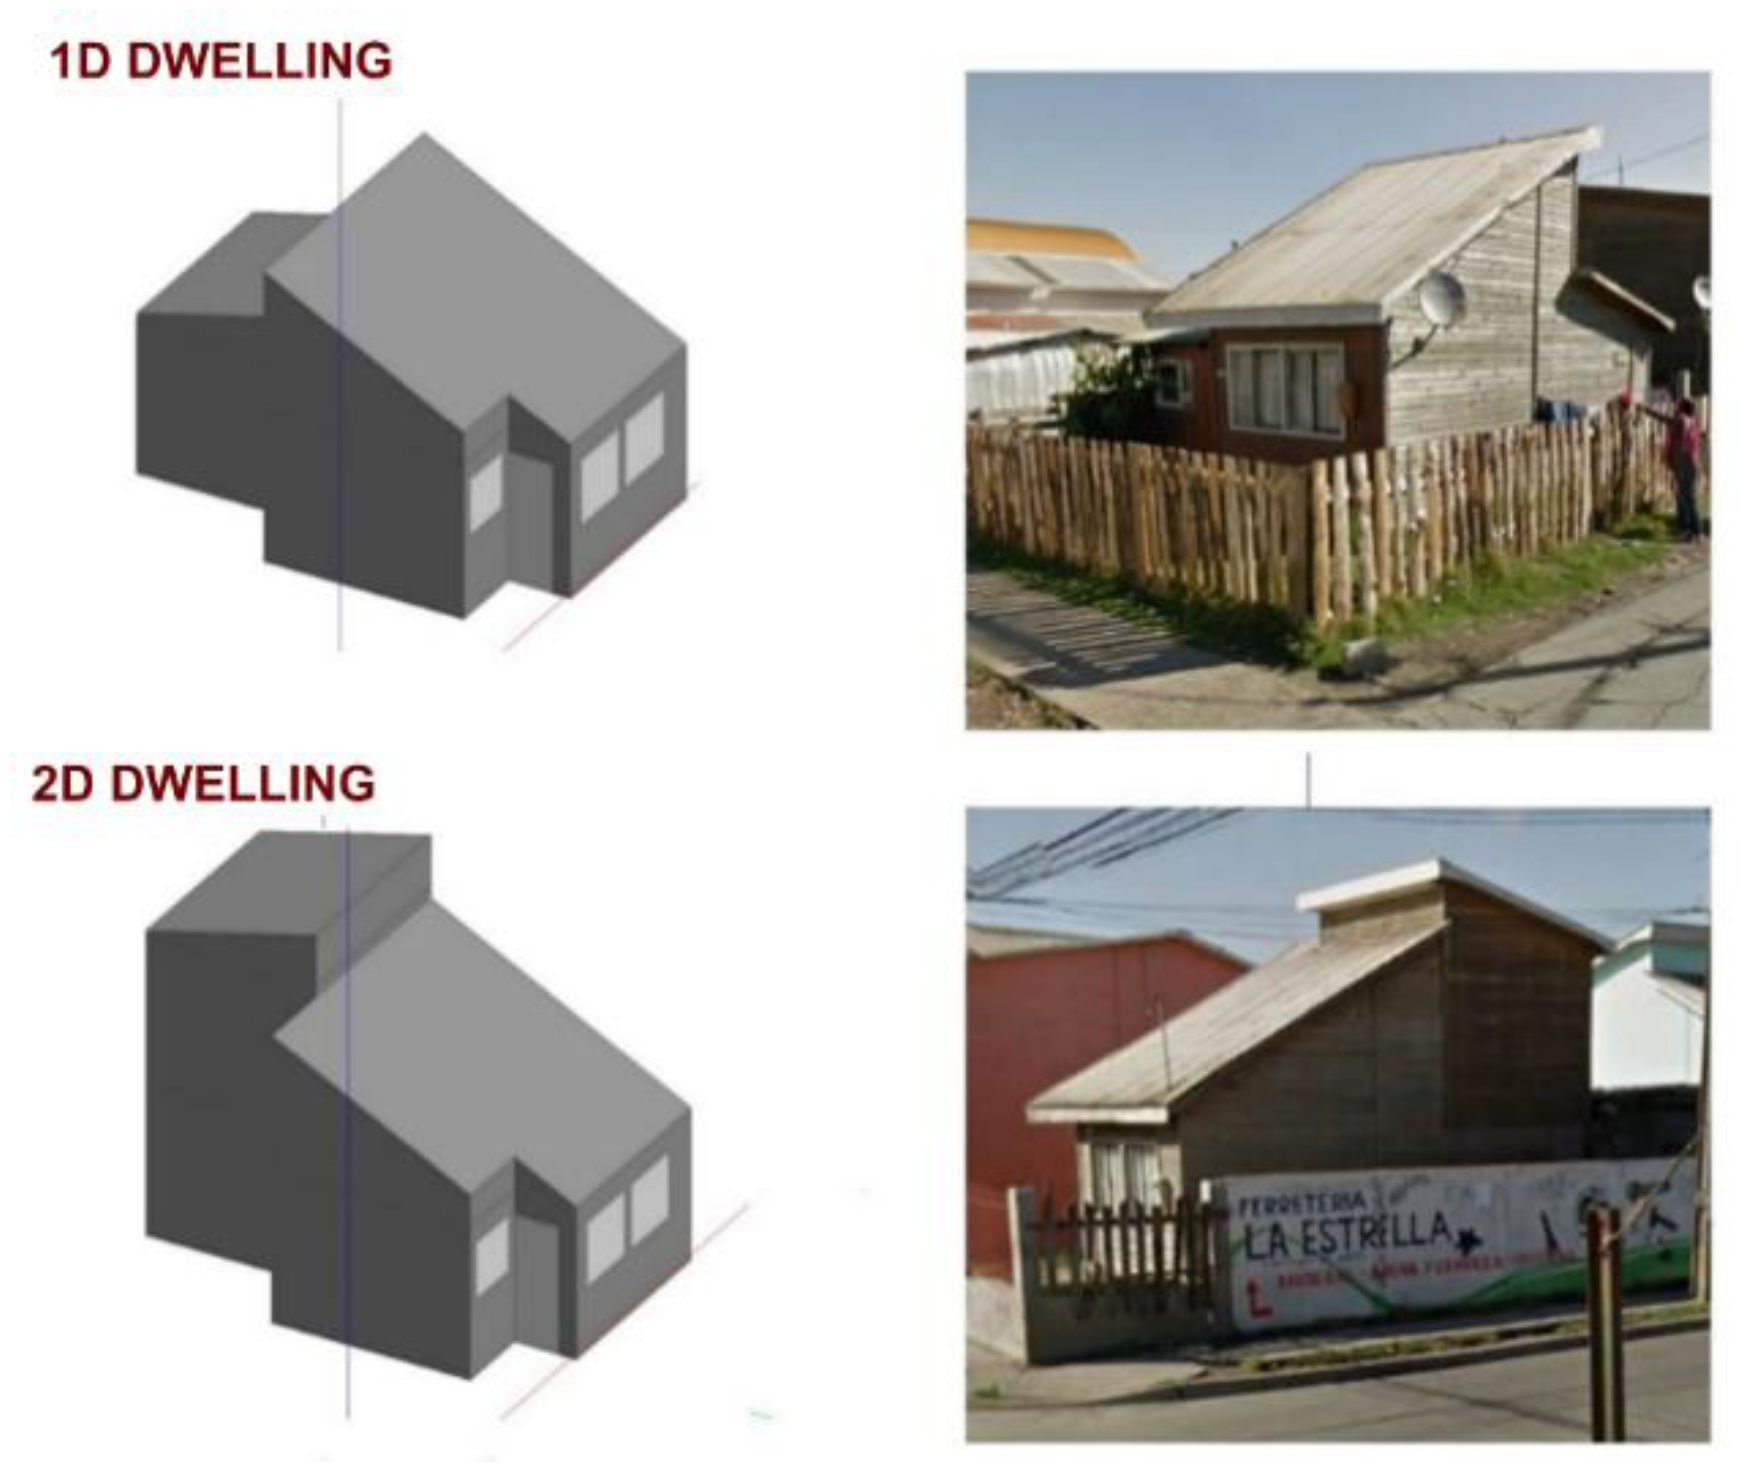
Figure A5.
Geometry and pictures of the 1D and 2D dwellings (authors’ own preparation).
Figure A5.
Geometry and pictures of the 1D and 2D dwellings (authors’ own preparation).
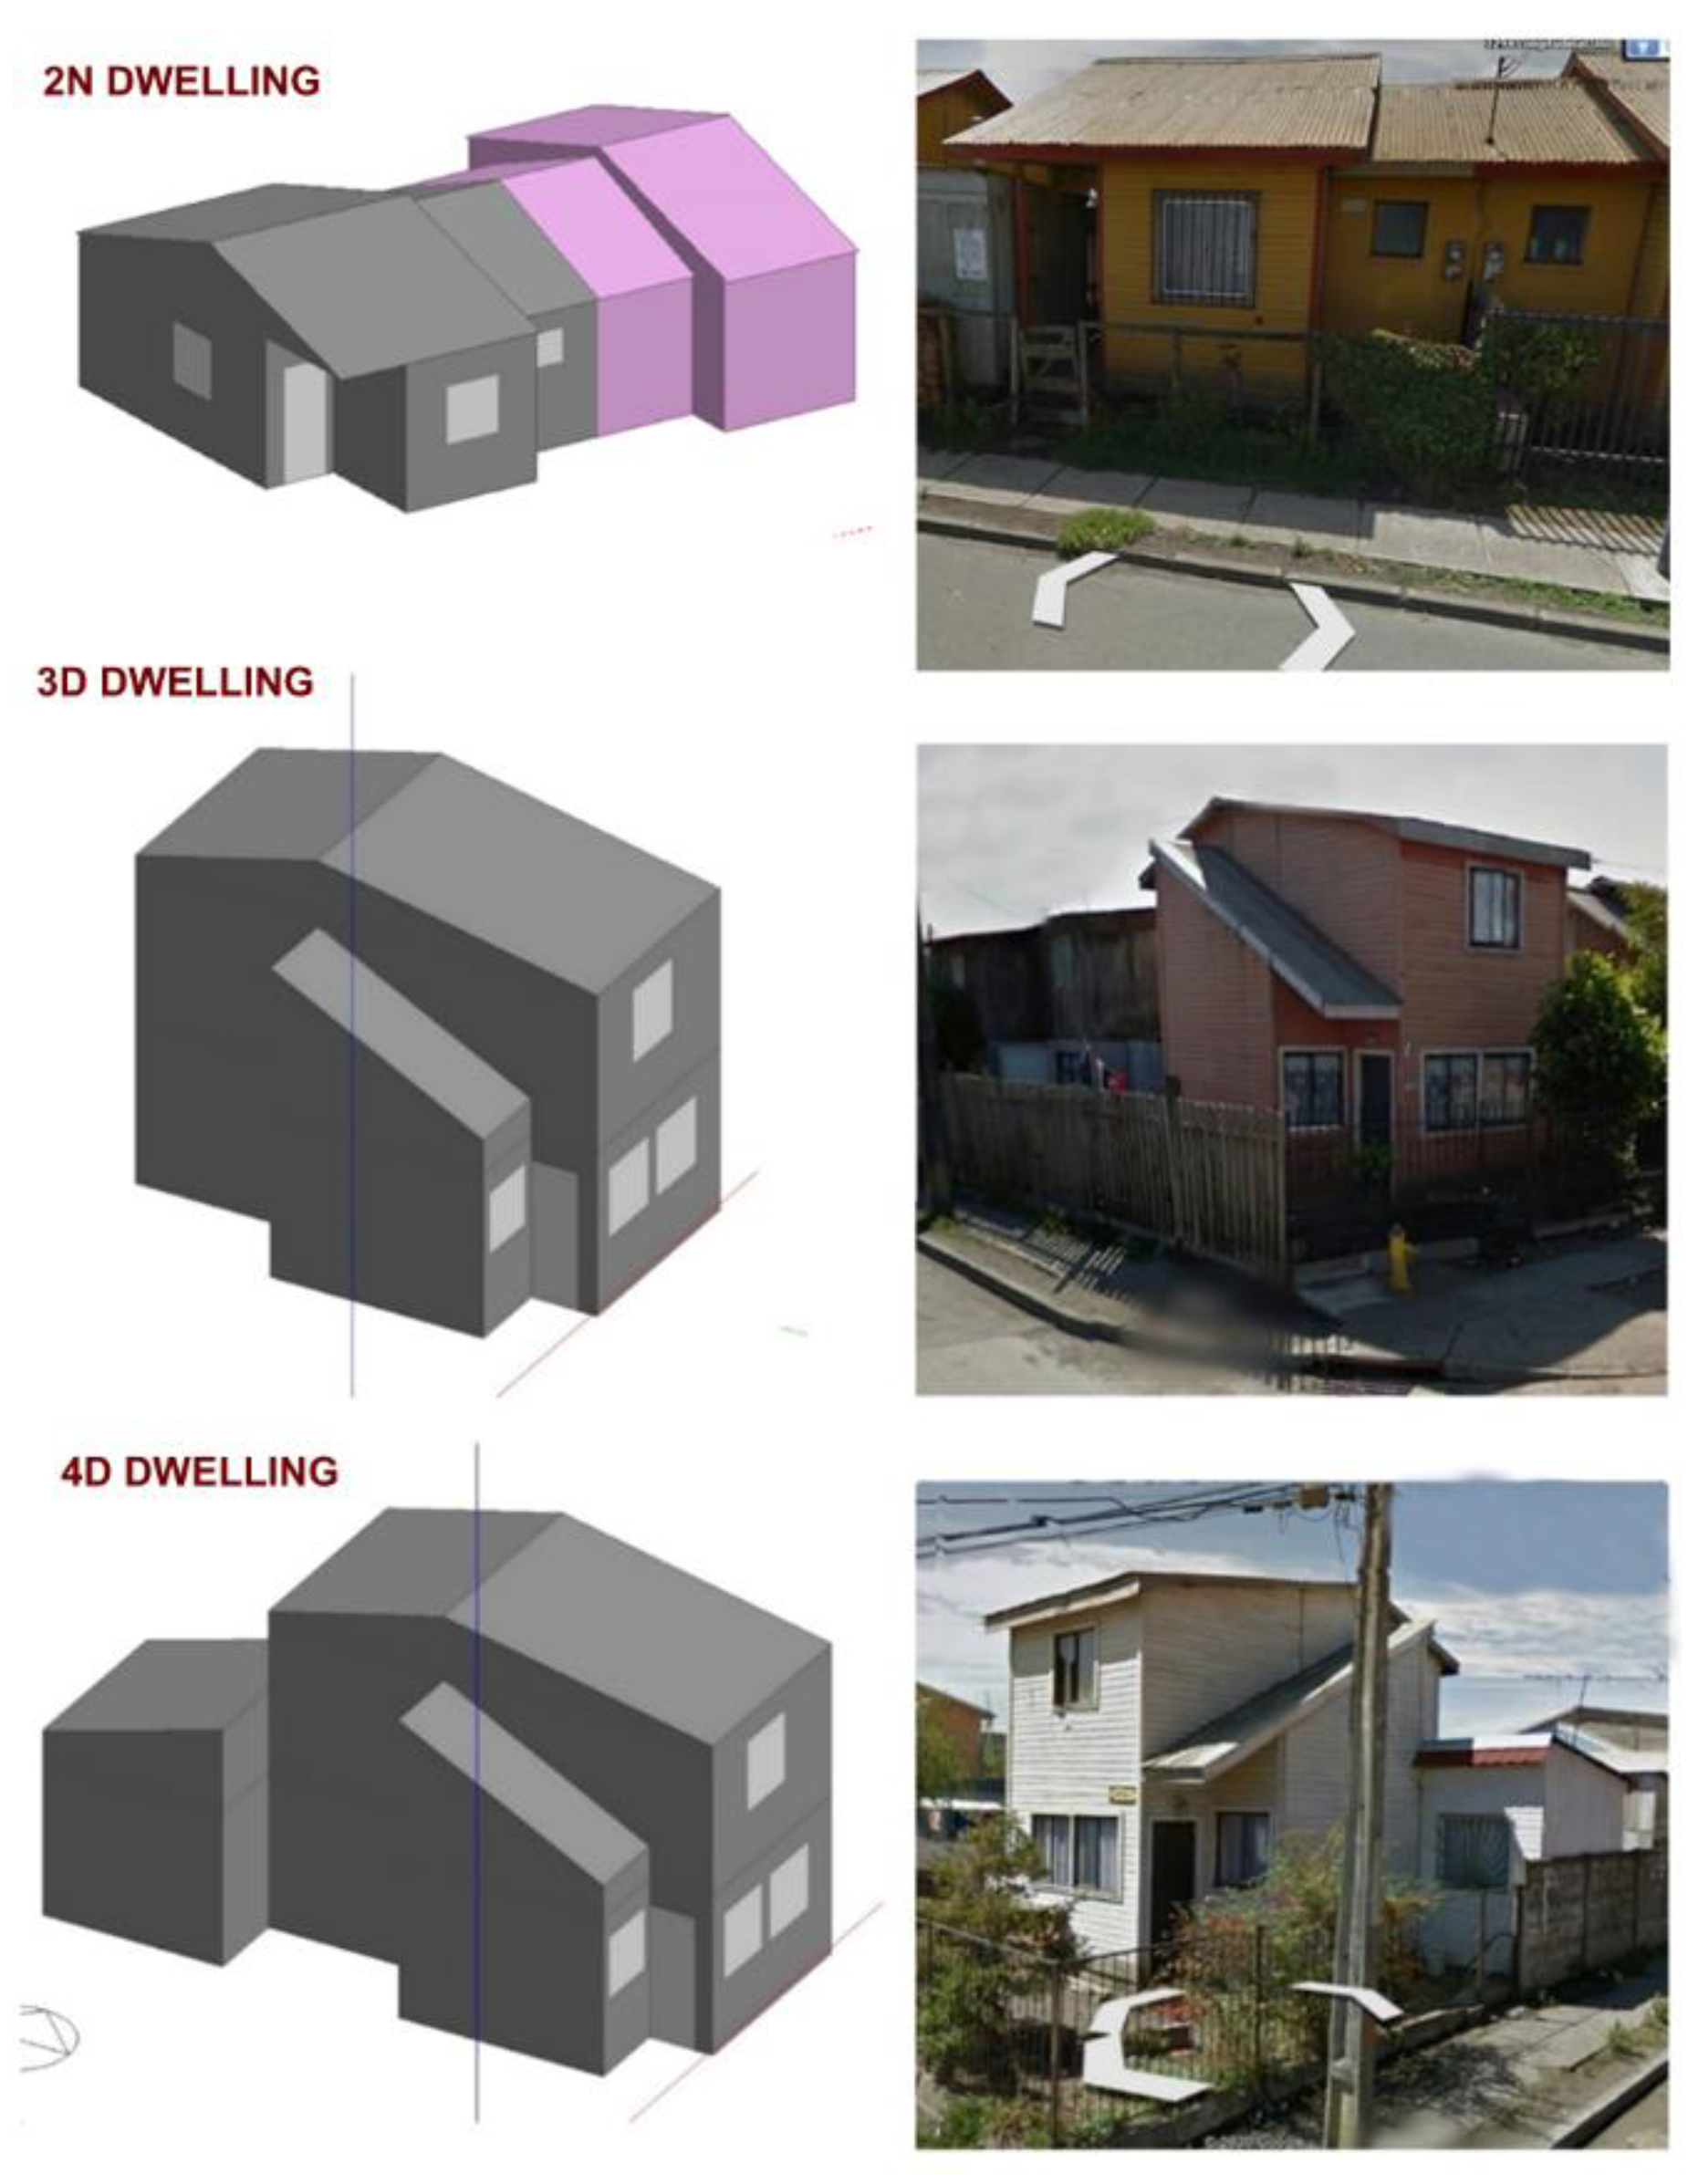
Figure A6.
Geometry and pictures of the 2N, 3D, and 4D dwellings (authors’ own preparation).
Figure A6.
Geometry and pictures of the 2N, 3D, and 4D dwellings (authors’ own preparation).
Figure A7.
Dwellings urban distribution by typology—part 1 (authors’ own preparation).
Figure A7.
Dwellings urban distribution by typology—part 1 (authors’ own preparation).
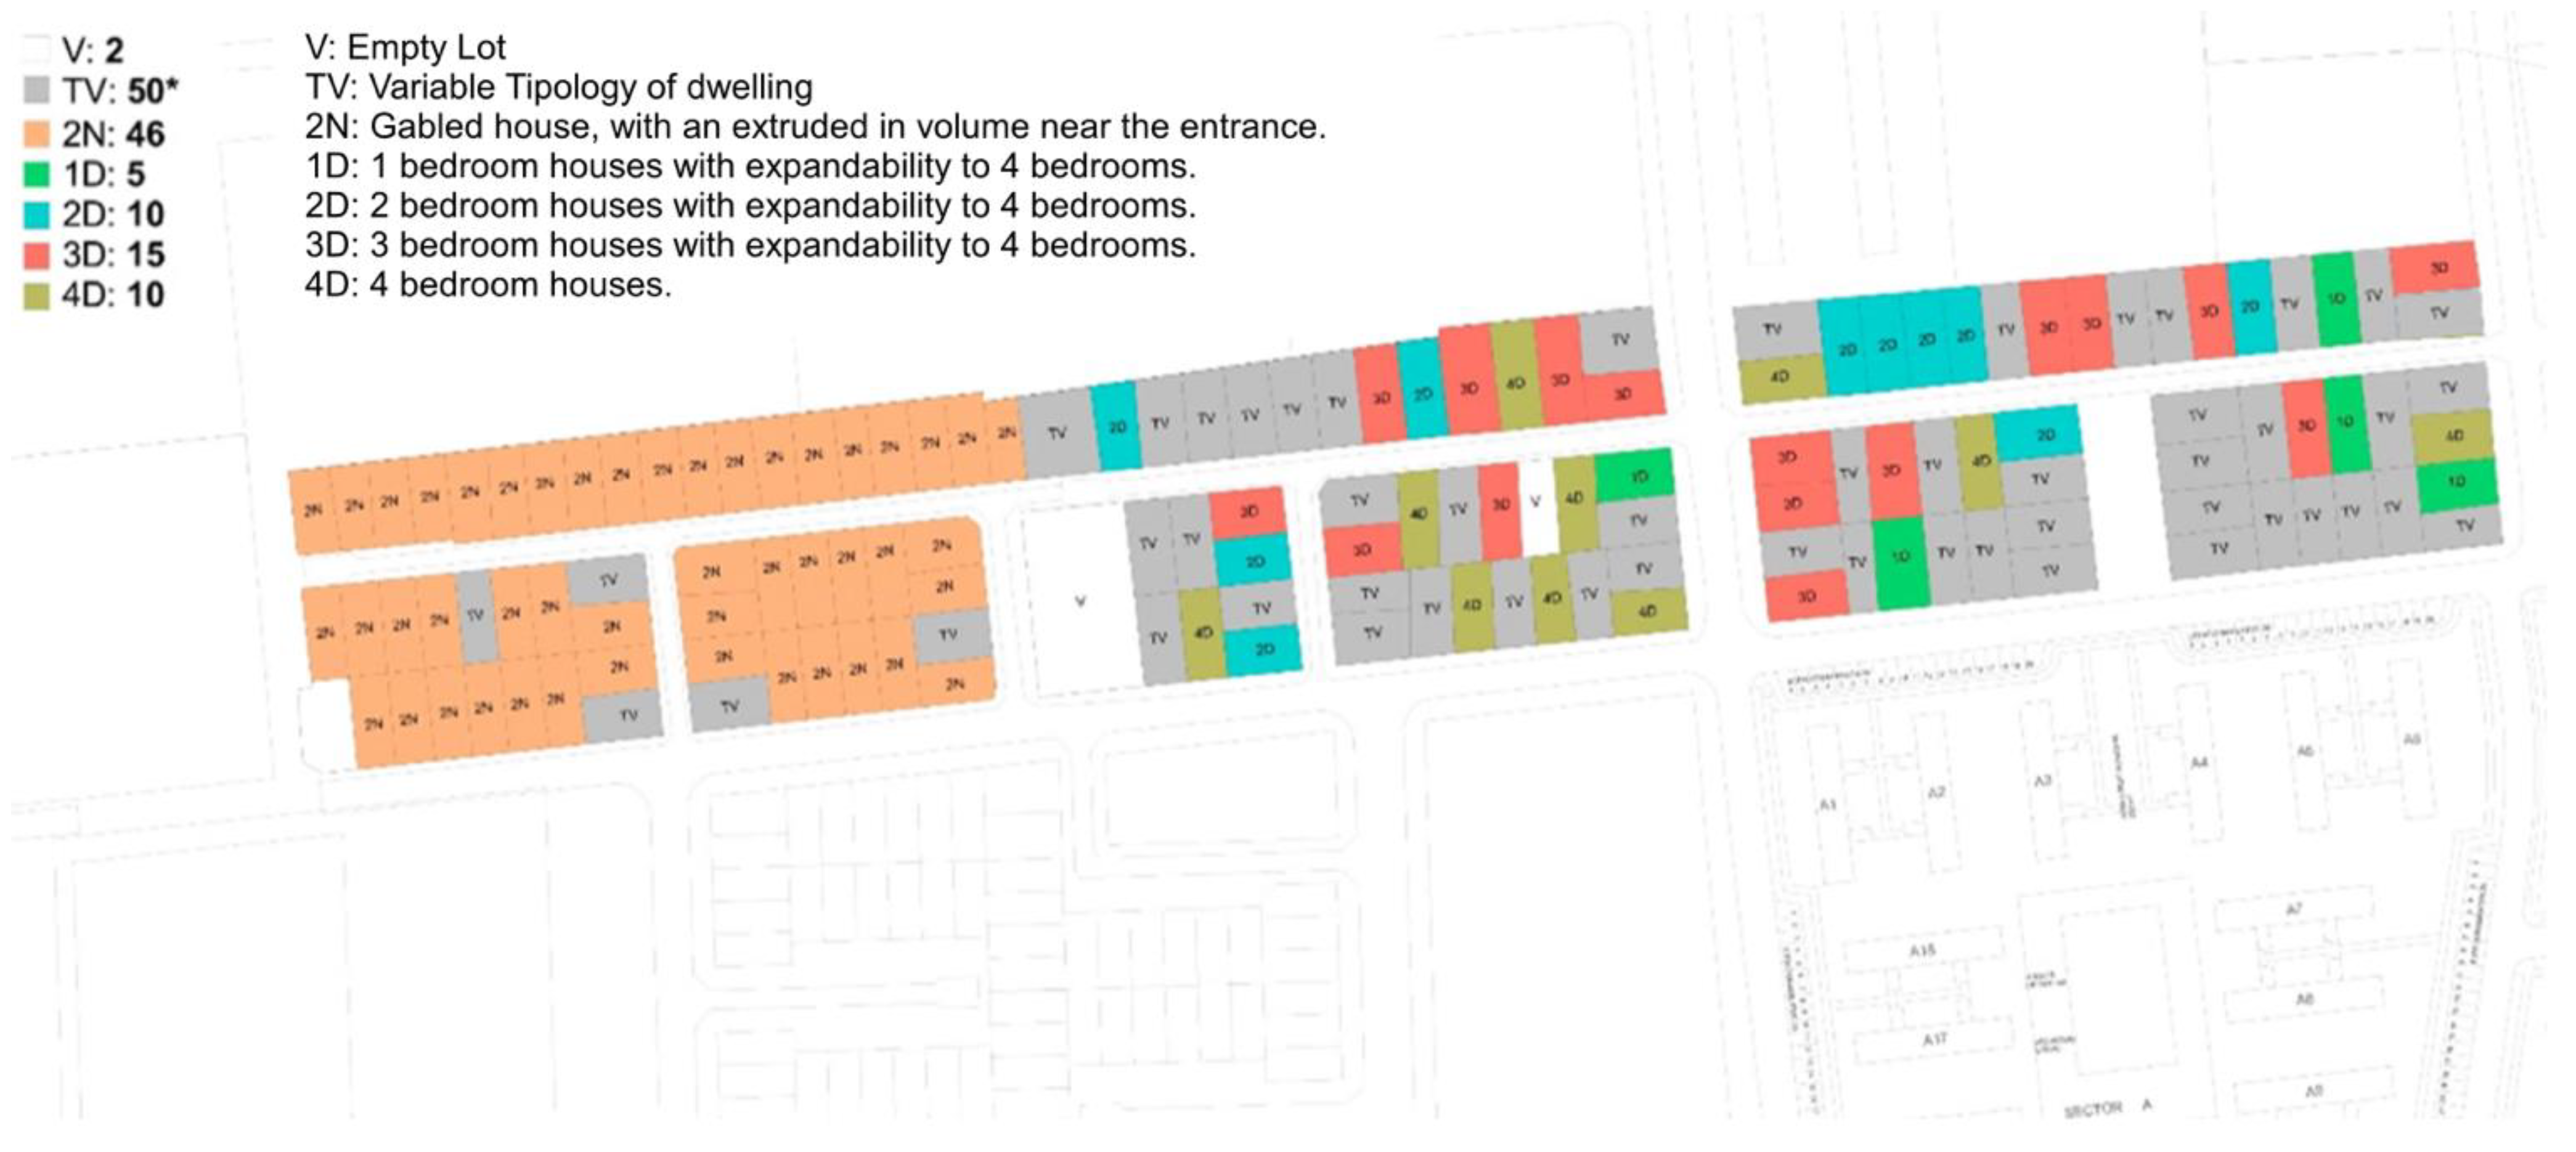
Figure A8.
Dwellings urbandistribution by typology—part 2 (authors’ own preparation).
Figure A8.
Dwellings urbandistribution by typology—part 2 (authors’ own preparation).
Appendix B.3. Simulation Parameters
In
Table A3, the data used in the simulation for the loads of devices, lighting, occupation, ventilation, and heating setpoints can be seen. The values have been obtained and configured using the Sustainable Construction Standards for Dwellings (
Estándares de Construcción Sustentable Para Viviendas En Chile, 2016). Therefore, the devices have not been considered as an internal load.
Table A3.
Loads for devices, lighting, occupation, ventilation, and slogans for simulations.
Table A3.
Loads for devices, lighting, occupation, ventilation, and slogans for simulations.
| Item | Unity | Blocks | 1D | 2D | 2N | 3D | 4D |
|---|
| Device load | W/m2 | 0 | 0 | 0 | 0 | 0 | 0 |
| Ventilation | L/s | 18 | 14 | 18 | 18 | 21 | 31 |
| Lighting load | W/m2 | 5.0 | 1.5 | 1.5 | 1.5 | 1.5 | 1.5 |
| Occupation load | m2/person | 8.94 | 8.26 | 8.85 | 8.99 | 9.13 | 8.81 |
| Heating setpoint | °C‘ | 18 | 18 | 18 | 18 | 18 | 18 |
The occupation, ventilation, lighting, and heating loads have been considered active throughout all the months of the year, and all the days of the week, with the schedules described in
Table A4.
Table A4.
Monthly, daily, and hourly load profiles.
Table A4.
Monthly, daily, and hourly load profiles.
| | Occupation | Ventilation | Lighting | Heating |
|---|
| Schedule | | | Nov.–Feb. | Mar.–Apr. | May–Aug. | Sept.–Oct. | |
|---|
| 00:00–01:00 | 80% | 100% | 0% | 0% | 0% | 0% | 100% |
| 01:00–02:00 | 80% | 100% | 0% | 0% | 0% | 0% | 100% |
| 02:00–03:00 | 80% | 100% | 0% | 0% | 0% | 0% | 100% |
| 03:00–04:00 | 80% | 100% | 0% | 0% | 0% | 0% | 100% |
| 04:00–05:00 | 80% | 100% | 0% | 0% | 0% | 0% | 100% |
| 05:00–06:00 | 80% | 100% | 0% | 0% | 0% | 0% | 100% |
| 06:00–07:00 | 80% | 100% | 0% | 0% | 0% | 0% | 100% |
| 07:00–08:00 | 80% | 100% | 0% | 100% | 100% | 100% | 100% |
| 08:00–09:00 | 90% | 100% | 0% | 0% | 0% | 0% | 100% |
| 09:00–10:00 | 40% | 100% | 0% | 0% | 0% | 0% | 100% |
| 10:00–11:00 | 30% | 100% | 0% | 0% | 0% | 0% | 100% |
| 11:00–12:00 | 30% | 100% | 0% | 0% | 0% | 0% | 100% |
| 12:00–13:00 | 30% | 100% | 0% | 0% | 0% | 0% | 100% |
| 13:00–14:00 | 30% | 100% | 0% | 0% | 0% | 0% | 100% |
| 14:00–15:00 | 30% | 100% | 0% | 0% | 0% | 0% | 100% |
| 15:00–16:00 | 30% | 100% | 0% | 0% | 0% | 0% | 100% |
| 16:00–17:00 | 30% | 100% | 0% | 0% | 0% | 0% | 100% |
| 17:00–18:00 | 50% | 100% | 0% | 0% | 0% | 0% | 100% |
| 18:00–19:00 | 90% | 100% | 0% | 0% | 100% | 0% | 100% |
| 19:00–20:00 | 90% | 100% | 0% | 0% | 100% | 0% | 100% |
| 20:00–21:00 | 90% | 100% | 0% | 100% | 100% | 100% | 100% |
| 21:00–22:00 | 90% | 100% | 100% | 100% | 100% | 100% | 100% |
| 22:00–23:00 | 80% | 100% | 0% | 0% | 0% | 0% | 100% |
| 23:00–00:00 | 80% | 100% | 0% | 0% | 0% | 0% | 100% |
The airtightness values have been established based on the predominant material of each building, bearing in mind the values established by the Building Airtightness Manual (Trebilcock, 2014).
For the dwellings analyzed, the value established for light wooden framework for the inhabited areas, 24.4 air renewals per hour at 50 pascals, while for uninhabited areas (attics), a value of 45 air renewals per hour at 50 pascals has been used.
In the blocks, it was considered that floors 1 to 3 present a leak of 9 air renewals per hour at 50 pascals, associated to the masonry; and on the 4th floor, a leak of 11 air renewals per hour at 50 pascals. The difference occurs because the top floor is a light structure roof, which increases the leaks in the joints between the walls and the cracks.
Appendix B.4. Evaluation of the Thermal Comfort and Heating Energy Demand
The evaluation of the thermal comfort has been determined using the simulation results from the EnergyPlus
® dynamic thermal analysis software, using indicators associated to the ASHRAE 55-2017 adaptative thermal comfort model (American Society of Heating, 2017). The comfort indicators have been obtained by simulating the typical apartments and dwellings of both housing complexes under free oscillation. With the results of the hourly operational temperatures, the number of annual hours that are within the adaptative thermal comfort (ATC) limits of the model defined in ASHRAE 55-2017 (American Society of Heating, 2017) have been quantified. For this evaluation, the limits defined for a thermal acceptance of 80% and 90% of the ASHRAE 55-2017 standard have been used. The determination of the thermal comfort ranges for the ASHRAE adaptative model, is a result of obtaining the neutral temperature (T_n), with the mean outdoor temperature T_(pma(out)), applying the following equation and establishing the ranges of ± 3.5 °C for a thermal acceptance of 80% and ± 2.5 °C for a thermal acceptance of 90%.
where T_(pma(out)) is the average outdoor operational temperature calculated from the mean outdoor temperature of the previous 7 days, just as is described in the following equation, where T_e(d − 1) is the average outdoor temperature of the previous day, T_e(d − 2) is the average outdoor temperature of two days before, and so on and so forth; and α is a constant that depends on the climate, assuming α=0.8 (American Society of Heating, 2017).
The standard establishes that, in order to apply the adaptative comfort limits determined with the previous equations, the average outdoor operational temperature (T_pma(out)) must be between 10.0 °C and 33.5 °C. When outside these values, the comfort limits will assume the constant conditions, taking the values determined by the previous equations for 10.0 °C and 33.5 °C.
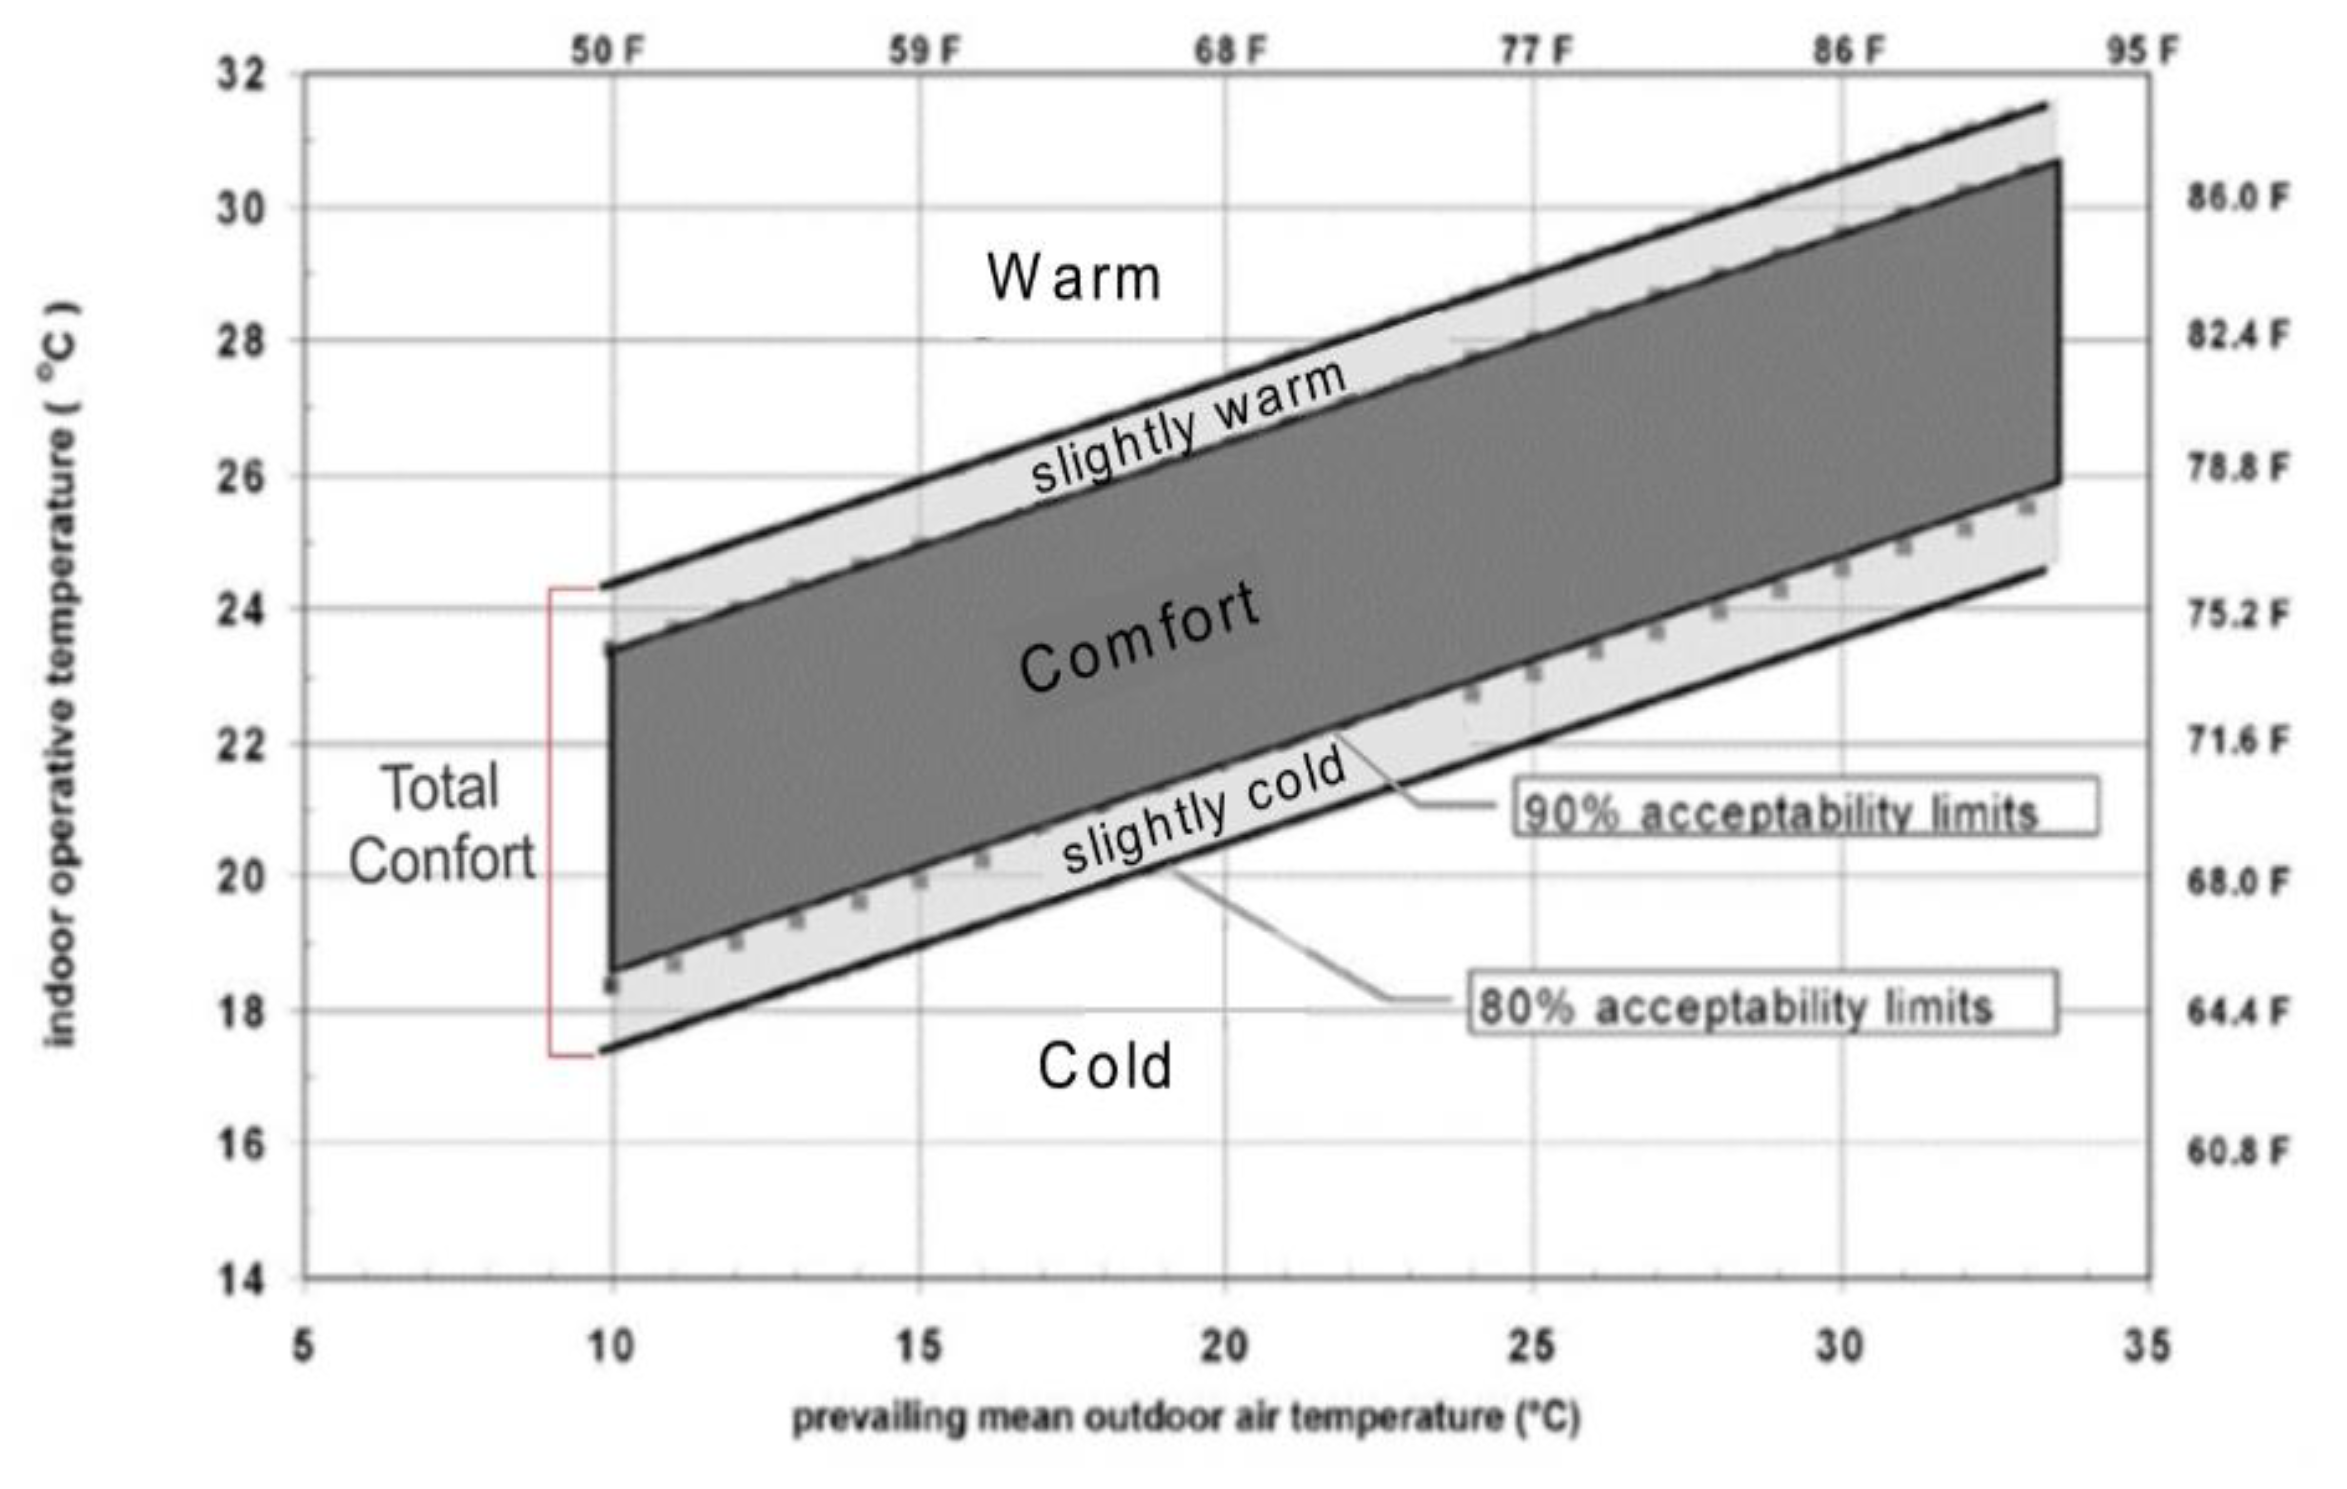
The hourly temperatures were classified based on the terms: comfort, slightly warm, slightly cold, warm, and cold, considering their situation facing the limits of the comfort model (see
Figure A9). The percentages of time in comfort, slightly warm, or slightly cold terms were grouped as “Total comfort”, for their analysis.
Figure A9.
Adaptative Thermal Comfort limits ASHRAE 55-2017 (own preparation based on the ASHRAE 55-2017 model).
Figure A9.
Adaptative Thermal Comfort limits ASHRAE 55-2017 (own preparation based on the ASHRAE 55-2017 model).
Appendix B.5. Results
Appendix B.5.1. Thermal Transmittances
The thermal transmittance values (U value) are shown in the following tables, determined for each construction element of the dwellings and blocks, following the calculation procedure defined in NCh853 (See
Table A5).
Table A5.
Transmittance values in walls, roofs and floors.
Table A5.
Transmittance values in walls, roofs and floors.
| Element | Construction Elements | U Value (W/m2K) |
|---|
| Outside Walls (Blocks) | Brickwork Mq Hv (140 mm) and Plasterwork (25 mm) | 1.75 |
| Division Walls (Blocks) | Brickwork Mq Hv (140 mm) | 2.07 |
| Dwelling walls (1D, 2D, 2N, 3D & 4D) | OSB Smart panel (11 mm) + Struct. Pine 2″× 3″ + Indoor drywall | 2.69 |
| Roof (Blocks) | Pine structure (1 × 4′) + Mineral Wool (40 mm) | 0.744 |
| Roof (Dwellings) | Zinc lining + Struct. Pine (1″ × 4″) + Mineral Wool (40 mm) | 0.849 |
| Floors (Blocks) | Reinforced concrete (80 mm) | 3.71 |
| Floors, concrete (Dwellings) | | 3.315 |
The windows have a thermal transmittance of 3.8 (W/m2K), and a solar factor of 0.70.
Appendix B.5.2. Thermal Comfort Analysis
The thermal comfort of the dwellings has been evaluated starting from the dynamic thermal simulation results, aiming at analyzing the behavior of the rooms of the dwellings in the different layouts (orientations, position in the building, and others) possible, hour by hour, to assign to the study sample, comfort values considering their similarity to the simulated models. Finally, the percentages of time in the year when each one of the dwelling typologies falls within each one of the previously defined zones, has been determined.
The blocks have been grouped for their evaluation depending on the orientation. For each one of the four predominant orientations in the complex, one block (A3, A8, A2, and A7) has been chosen, and within the block, two apartments have been chosen to analyze the thermal behavior of their rooms on presenting the most unfavorable conditions: one on floor 1 (Apt. 01), and another on floor 4 (Apt. 12). The results of these apartments have been extrapolated to the rest of the apartments of the block, establishing as the average of the results for the apartments on floors 2 and 3.
As can be seen in
Table A6, the analysis indicates that the spaces would have very low temperatures (without using heating systems), with the percentage of hours in discomfort due to cold being between 39.33% and 57.73% of the time.
Table A6.
Percentage of time in different thermal situations of the spaces by apartment, floor, and block.
Table A6.
Percentage of time in different thermal situations of the spaces by apartment, floor, and block.
| Orientation | Apartment | Cold | Slightly Cold | Comfort | Slightly Warm | Warm | Total Comfort |
|---|
| East (A3) | 01–04 | 46.40% | 7.50% | 38.20% | 3.80% | 4.13% | 49.50% |
| East (A3) | 05–12 | 52.07% | 6.87% | 32.20% | 3.50% | 5.35% | 42.57% |
| East (A3) | 13–16 | 57.73% | 6.23% | 26.20% | 3.20% | 6.57% | 35.63% |
| North (A8) | 01–04 | 47.33% | 7.03% | 44.50% | 1.07% | 0.07% | 52.60% |
| North (A8) | 05–12 | 51.00% | 7.12% | 38.17% | 2.43% | 1.27% | 47.72% |
| North (A8) | 13–16 | 54.67% | 7.20% | 31.83% | 3.80% | 2.47% | 42.83% |
| West (E2) | 01–04 | 43.33% | 5.30% | 35.90% | 8.00% | 7.50% | 49.20% |
| West (E2) | 05–12 | 46.78% | 5.43% | 33.88% | 6.23% | 7.67% | 45.55% |
| West (E2) | 13–16 | 50.23% | 5.57% | 31.87% | 4.47% | 7.83% | 41.90% |
| South (A7) | 01–04 | 39.33% | 6.80% | 46.60% | 4.97% | 2.30% | 58.37% |
| South (A7) | 05–12 | 45.40% | 7.12% | 40.42% | 4.60% | 2.47% | 52.13% |
| South (A7) | 13–16 | 51.47% | 7.43% | 34.23% | 4.23% | 2.63% | 45.90% |
The dwellings have been grouped for their evaluation based on their typology (see
Figure A5,
Figure A6,
Figure A7 and
Figure A8). Each typology has been evaluated in the four predominant orientations in the complex, and results associated to each one of the spaces have been obtained, obtaining the percentage of the dwelling as an average of the spaces. For the variable typology (VT) dwellings, the average value has been determined by orientation of the set of typologies identified, to establish their representative values.
As can be seen in
Table A7, the analysis indicates that the spaces would have very low temperatures (without using heating systems), with the percentage of hours in discomfort due to cold being between 33.60% and 52.65% of the time.
Table A7.
Percentage of time in different thermal situations for the spaces in each type of home.
Table A7.
Percentage of time in different thermal situations for the spaces in each type of home.
| Orientation | Typology | Cold | Slightly Cold | Comfort | Slightly Warm | Warm | Total Comfort |
|---|
| East | 1 Bedroom (1D) | 51.10% | 20.65% | 26.05% | 1.85% | 0.40% | 48.55% |
| North | 1 Bedroom (1D) | 52.65% | 18.95% | 26.35% | 1.50% | 0.55% | 46.80% |
| West | 1 Bedroom (1D) | 50.95% | 19.95% | 26.85% | 1.70% | 0.50% | 48.50% |
| South | 1 Bedroom (1D) | 52.75% | 18.40% | 26.90% | 1.55% | 0.40% | 46.85% |
| East | 2 Bedrooms (2D) | 52.87% | 11.43% | 28.67% | 2.77% | 4.20% | 42.87% |
| North | 2 Bedrooms (2D) | 53.87% | 11.13% | 29.77% | 2.83% | 2.40% | 43.73% |
| West | 2 Bedrooms (2D) | 52.57% | 11.43% | 29.23% | 3.30% | 3.50% | 43.97% |
| South | 2 Bedrooms (2D) | 52.17% | 11.13% | 30.00% | 2.80% | 3.90% | 43.93% |
| East | 2 Bedrooms (2N) | 54.05% | 12.30% | 28.23% | 2.50% | 3.00% | 43.03% |
| North | 2 Bedrooms (2N) | 54.00% | 12.33% | 28.28% | 2.50% | 3.00% | 43.10% |
| West | 2 Bedrooms (2N) | 52.58% | 12.55% | 31.98% | 2.60% | 0.30% | 47.13% |
| South | 2 Bedrooms (2N) | 52.65% | 12.53% | 31.90% | 2.60% | 0.30% | 47.03% |
| East | 3 Bedrooms (3D) | 37.80% | 13.50% | 37.25% | 3.93% | 7.48% | 54.68% |
| North | 3 Bedrooms (3D) | 37.58% | 13.45% | 37.70% | 4.00% | 7.30% | 55.15% |
| West | 3 Bedrooms (3D) | 37.13% | 13.33% | 37.20% | 4.08% | 8.25% | 54.60% |
| South | 3 Bedrooms (3D) | 37.53% | 13.30% | 37.38% | 4.03% | 7.75% | 54.70% |
| East | 4 Bedrooms (4D) | 33.60% | 13.08% | 43.74% | 4.00% | 5.58% | 60.82% |
| North | 4 Bedrooms (4D) | 36.04% | 12.68% | 42.36% | 3.58% | 5.28% | 58.62% |
| West | 4 Bedrooms (4D) | 33.70% | 12.64% | 43.42% | 4.32% | 5.94% | 60.38% |
| South | 4 Bedrooms (4D) | 34.98% | 12.46% | 42.38% | 4.30% | 5.88% | 59.14% |
| East | Variable Typology (VT) | 45.88% | 14.19% | 32.79% | 3.01% | 4.13% | 49.99% |
| North | Variable Typology (VT) | 46.83% | 13.71% | 32.89% | 2.88% | 3.71% | 49.48% |
| West | Variable Typology (VT) | 45.38% | 13.98% | 33.74% | 3.20% | 3.70% | 50.91% |
| South | Variable Typology (VT) | 46.01% | 13.56% | 33.71% | 3.06% | 3.65% | 50.33% |
Appendix C. Adapted Deprivation Thresholds and Indicators
Table A8.
Summary of dimensions and thresholds adapted for EPTT.
Table A8.
Summary of dimensions and thresholds adapted for EPTT.
| Dimension | Indicator | EP | EP Exceedance |
|---|
Food and Hygiene
(D1) | Energy source and kitchen appliance
(D1-I1) | Kerosene, coal, wet firewood or waste with open combustion | Gas, electricity, firewood, pellet, solar energy, and closed combustion |
ACS System
(D1-I3) | Does not have ACS or has an electrical system not authorized by the SEC | Has ACS. |
Lighting and electrical devices
(D2) | Access to electricity
(D2-I1) | Not connected to grid, illegal connection or uses own generator whose fuel is bought more than an hour away. | Connected to grid with an unaltered panel |
Supply Capacity
(D2-I4) | Has 2 or fewer electrical circuits | Has 3 or more electrical circuits |
Electrical installation
(D2-I5) | Irregular or home-made electrical installations | There are no irregular or home-made electrical installations |
Climate control of the dwelling
(D3) | Indoor Temperature
(D3-I1) | The home is not kept under the lower limit of ASHRAE 55:2017 adaptative thermal comfort model, more than 46.8% of the year | The home is kept under the lower limit of ASHRAE 55:2017 adaptative thermal comfort model, less than 46.8% of the year |
Energy source and heating devices
(D3-I4) | Kerosene, coal, firewood or waste for heating | Gas, electricity, dry firewood, pellet, logs and/or solar energy |
Indoor humidity
(D3-I5) | There are floods, leaks or presence of humidity inside the dwelling, that favor the presence of mold. | There are no floods, leaks or presence of humidity inside the dwelling, that favor the presence of mold. |
Energy expense equality
(D4) | Excessive expense in energy, based on Minimum Income Standard (MIS)
(D4-I1) | Available income of home − (costs of dwelling + energy expense of home) < equivalent poverty line | Available income of home − (costs of dwelling + energy expense of home) > equivalent poverty line |
Income below the Equivalent Poverty Line
(D4-I3) | Income of home is below equivalent poverty line | The rest of the indicators must be assessed together |
References
- Sorensen, B. A History of Energy: Northern Europe from the Stone Age to the Present Day; Routledge: London, UK, 2013; ISBN 1136487891. [Google Scholar]
- Ministerio de Energía de Chile. Energía 2050. Política Energética de Chile; Misterio de Energía: Santiago de Chile, Chile, 2017; pp. 7–91. [Google Scholar]
- Day, R.; Walker, G.; Simcock, N. Conceptualising Energy Use and Energy Poverty Using a Capabilities Framework. Energy Policy 2016, 93, 255–264. [Google Scholar] [CrossRef]
- Bouzarovski, S.; Petrova, S. A Global Perspective on Domestic Energy Deprivation: Overcoming the Energy Poverty-Fuel Poverty Binary. Energy Res. Soc. Sci. 2015, 10, 31–40. [Google Scholar] [CrossRef]
- Thomson, H.; Bouzarovski, S.; Snell, C. Rethinking the Measurement of Energy Poverty in Europe: A Critical Analysis of Indicators and Data. Indoor Built Environ. 2017, 26, 879–901. [Google Scholar] [CrossRef] [Green Version]
- Pérez-Fargallo, A.; Rubio-Bellido, C.; Pulido-Arcas, J.A.; Trebilcock, M. Development Policy in Social Housing Allocation: Fuel Poverty Potential Risk Index. Indoor Built Environ. 2017, 26, 980–998. [Google Scholar] [CrossRef]
- Pérez-Fargallo, A.; Rubio-Bellido, C.; Pulido-Arcas, J.A.; Javier Guevara-García, F. Fuel Poverty Potential Risk Index in the Context of Climate Change in Chile. Energy Policy 2018, 113, 157–170. [Google Scholar] [CrossRef]
- Scarpellini, S.; Rivera-Torres, P.; Suárez-Perales, I.; Aranda-Usón, A. Analysis of Energy Poverty Intensity from the Perspective of the Regional Administration: Empirical Evidence from Households in Southern Europe. Energy Policy 2015, 86, 729–738. [Google Scholar] [CrossRef] [Green Version]
- PNUD. Pobreza Energética: Análisis de Experiencias Internacionales y Aprendizajes Para Chile; Programa de las Naciones Unidas para el Desarrollo: Santiago de Chile, Chile, 2018. [Google Scholar]
- Thomson, H.; Snell, C.; Liddell, C. Fuel Poverty in the European Union: A Concept in Need of Definition? People Place Policy Online 2016, 10, 5–24. [Google Scholar] [CrossRef]
- Raúl, C.-R.; Jaime, S.-G.; Madelyn, M. Midiendo La Pobreza Energética. Una Revisión de Indicadores. Revista Hábitat Sustentable 2020, 10, 8–21. [Google Scholar] [CrossRef]
- Ministerio de Energía. Agenda de Energía. Un Desafío País, Progreso Para Todos; Ministerio de Energía: Santiago de Chile, Chile, 2014. [Google Scholar]
- Reyes, R.; Schueftan, A.; Ruiz, C.; González, A.D. Controlling Air Pollution in a Context of High Energy Poverty Levels in Southern Chile: Clean Air but Colder Houses? Energy Policy 2019, 124, 301–311. [Google Scholar] [CrossRef]
- Amigo, C.; Calvo, R.; Cortés, A.; Urquiza, A. Pobreza Energética. El Acceso Desigual a Energía de Calidad Como Barrera Para El Desarrollo En Chile. Policy Pap. 2019, 3, 59. [Google Scholar]
- Calvo, R.; Amigo, C.; Billi, M.; Marchant, G.; Urquiza, A. Alcances y Limitaciones de Indicadores Internacionales Para Chile; Red de Pobreza Energética: Santiago de Chile, Chile, 2018. [Google Scholar]
- Calvo, R.; Amigo, C.; Billi, M.; Cortés, A.; Mendoza, P.; Tapia, R.; Urquieta, M.A.; Urquiza, A. Acceso Equitativo a Energía de Calidad En Chile. Hacia Un Indicador Territorializado y Tridimensional de Pobreza Energética; Red de Pobreza Energética: Santiago de Chile, Chile, 2019; ISBN 9789563988260. [Google Scholar]
- CDT. Medición del Consumo Nacional de Leña y Otros Combustibles Sólidos Derivados de la Madera. Informe Final; Ministerio de Energía: Santiago de Chile, Chile, 2015; p. 302. [Google Scholar]
- CDT. Informe Final Uso de La Energía Hogares Chile 2018; Corporación de Desarrollo Tecnológico: Santiago de Chile, Chile, 2019; ISBN 2007041715. [Google Scholar]
- PNUD. Documento de Proyecto. Desarrollo de Un Marco Conceptual y Metodológico Para Abordar La Pobreza Energética En Chile; Programa de las Naciones Unidas para el Desarrollo: Santiago de Chile, Chile, 2016. [Google Scholar]
- Bhatia, M.; Angelou, N. Beyond Connections Energy Access Redefined. In Energy Sector Management Assistance Program (ESMAP); World Bank: Washington, DC, USA, 2015; pp. 1–224. [Google Scholar]
- MINVU. Estándares de Construcción Sustentable Para Viviendas de Chile. Tomo N° 1 Salud y Bienestar; Ministerio de Vivienda y Urbanismo: Santiago de Chile, Chile, 2018; ISBN 9788578110796. [Google Scholar]
- Ministerio de Desarrollo Social. Nueva Metodología de Medición de La Pobreza Por Ingresos y Multidimensional Serie Documentos Metodológicos No28 Versión Revisada: 26 de Enero de 2015 Nueva Metodología de Medición de La Pobreza Por Ingresos y Multidimensional 2 Contenidos; Ministerio de Desarrollo y Urbanismo: Santiago de Chile, Chile, 2015. [Google Scholar]
- Novoa, J.O.; Contreras, R.S. Percepción de Seguridad Pública En San Pedro de La Paz: Principales Variables Que La Configuran. Tiempo Y Espac. 2017, 39, 35–50. [Google Scholar]
- Ministerio de Energía. Resolución 74 Exenta—Fija Estándar Mínimo de Eficiencia Energética Para Refrigeradores de Uso Doméstico; Ministerio de Energía: Santiago de Chile, Chile, 2015; pp. 5–7. [Google Scholar]
- Comisión Nacional de Energía Calidad Del Servicio—SAIDI Anual Nacional Comisión Nacional de Energía. Available online: http://datos.energiaabierta.cl/dataviews/251842/calidad-del-servicio-saidi-annual-nacional/ (accessed on 8 May 2021).
- CNE. Norma Técnica de Calidad de Servicio Para Sistemas de Distribución; CNE: Santiago de Chile, Chile, 2019. [Google Scholar]
- SEC. NCh Elec. 4/2003, Electricidad—Instalaciones de Consumo En Baja Tensión; INN de Chile: Santiago de Chile, Chile, 2003; pp. 1–137. [Google Scholar]
- Pérez-Fargallo, A.; Pulido-Arcas, J.A.; Rubio-Bellido, C.; Trebilcock, M.; Piderit, B.; Attia, S. Development of a New Adaptive Comfort Model for Low Income Housing in the Central-South of Chile. Energy Build. 2018, 178, 94–106. [Google Scholar] [CrossRef] [Green Version]
- Porras-Salazar, J.A.; Contreras-Espinoza, S.; Cartes, I.; Piggot-Navarrete, J.; Pérez-Fargallo, A. Energy Poverty Analyzed Considering the Adaptive Comfort of People Living in Social Housing in the Central-South of Chile. Energy Build. 2020, 223, 110081. [Google Scholar] [CrossRef]
- Sistema de Información Nacional de Calidad Del Aire. Available online: https://sinca.mma.gob.cl/ (accessed on 8 May 2021).
- Boso, À.; Álvarez, B.; Oltra, C.; Garrido, J.; Muñoz, C.; Galvez-García, G. The Grass Is Always Greener on My Side: A Field Experiment Examining the Home Halo Effect. Sustainability 2020, 12, 6335. [Google Scholar] [CrossRef]
- Ministerio de Desarrollo Social. Valor de La Canasta Básica de Alimentos y Líneas de Pobreza; Ministerio de Desarrollo Social: Santiago de Chile, Chile, 2020; Volume 1. [Google Scholar]
- Reicks, M.; Mlis, M.K.; Reeder, J. Impact of Cooking and Home Food Preparation Interventions Among Adults: A Systematic Review (2011–2016). J. Nutr. Educ. Behav. 2018, 50, 148–172.e1. [Google Scholar] [CrossRef] [PubMed]
- Boso, À.; Álvarez, B.; Oltra, C.; Garrido, J.; Muñoz, C.; Hofflinger, Á. Out of Sight, out of Mind: Participatory Sensing for Monitoring Indoor Air Quality. Environ. Monit. Assess. 2020, 192, 1–15. [Google Scholar] [CrossRef]
- Garrido, C.; Piderit-Moreno, M.B. Factores de Diseño de La Iluminación Que Intervienen En El Estímulo Circadiano En Oficinas. AUS [Arquitectura/Urbanismo/Sustentabilidad] 2020, 27, 59–65. [Google Scholar] [CrossRef]
- OMS. WHO Indoor Air Quality Guidelines: Household Fuel Combustion Review 5: Population Levels of Household Air Pollution and Exposures; WHO: Geneva, Switzerland, 2014. [Google Scholar]
- Boardman, B. Fixing Fuel Poverty: Challenges and Solutions; Earthscan: London, UK, 2010. [Google Scholar]
- Castaño-Rosa, R.; Solís-Guzmán, J.; Marrero, M. Energy Poverty Goes South? Understanding the Costs of Energy Poverty with the Index of Vulnerable Homes in Spain. Energy Res. Soc. Sci. 2020, 60, 101325. [Google Scholar] [CrossRef]
- Moore, R. Definitions of Fuel Poverty: Implications for Policy. Energy Policy 2012, 49, 19–26. [Google Scholar] [CrossRef]
- Schuessler, R. Energy Poverty Indicators: Conceptual Issues—Part I: The Ten-Percent-Rule and Double Median/Mean Indicators. SSRN Electron. J. 2014, 14-037. [Google Scholar] [CrossRef] [Green Version]
- Middlemiss, L. A Critical Analysis of the New Politics of Fuel Poverty in England. Crit. Soc. Policy 2016, 37, 425–443. [Google Scholar] [CrossRef]
- European Comission European Union Statistics on Income and Living Conditions (EU-SILC). Available online: https://ec.europa.eu/eurostat/web/microdata/european-union-statistics-on-income-and-living-conditions (accessed on 28 July 2022).
- Sánchez-Guevara, C.; Gonzalez Neila, F.J.; Hernández Aja, A. Towards a Fuel Poverty Definition for Spain. World Sustain. Build. Conf. 2014, 11–17. Available online: https://core.ac.uk/download/pdf/148671685.pdf (accessed on 28 July 2022).
- Castaño-Rosa, R.; Solís-Guzmán, J.; Marrero, M. A Novel Index of Vulnerable Homes: Findings from Application in Spain. Indoor Built Environ. 2018, 142. [Google Scholar] [CrossRef]
- Robinson, C. Energy Poverty and Gender in England: A Spatial Perspective. Geoforum 2019, 104, 222–233. [Google Scholar] [CrossRef]
| Publisher’s Note: MDPI stays neutral with regard to jurisdictional claims in published maps and institutional affiliations. |
© 2022 by the authors. Licensee MDPI, Basel, Switzerland. This article is an open access article distributed under the terms and conditions of the Creative Commons Attribution (CC BY) license (https://creativecommons.org/licenses/by/4.0/).


 ,
, 


