Article

Evaluation and Factor Analysis for Urban Resilience: A Case Study of Chengdu–Chongqing Urban Agglomeration

1
School of Civil Engineering and Architecture, Southwest University of Science and Technology, Mianyang 621010, China
2
College of Environmental and Civil Engineering, Chengdu University of Technology, Chengdu 610059, China
3
School of Management, University of Science and Technology of China, Hefei 230026, China
*
Authors to whom correspondence should be addressed.
Buildings 2022, 12(7), 962; https://doi.org/10.3390/buildings12070962
Submission received: 1 June 2022 / Revised: 1 July 2022 / Accepted: 4 July 2022 / Published: 6 July 2022
(This article belongs to the Collection Strategies for Sustainable Urban Development)

Abstract

:
Resilient cities provide a new operating mechanism for sustainable urban development and can effectively reduce urban disaster losses. Urban resilience has become an important research topic, but few scholars focus on the urban resilience of urban agglomerations in western China. Therefore, this paper takes the Chengdu–Chongqing urban agglomeration of China as the study area and aims to evaluate the resilience level of cities in typical regions of western China. This study uses multiple interdisciplinary methods, such as the entropy weight method, Theil index, and geographically and temporally weighted regression, to evaluate the resilience levels of 16 cities in the region and discuss the influencing factors of regional urban resilience. The results show that the urban resilience of cities in the Chengdu–Chongqing urban agglomeration has evolved from a low to high level. Additionally, there are significant spatial differences in urban resilience in the Chengdu–Chongqing urban agglomeration, and the resilience levels of cities in the east and west of the region are relatively high, while the resilience levels of cities in the south and north are relatively low. Further research found that factors such as administrative level, marketization level, industrial structure, population density, urbanization level, and emergency facility level all have a significant positive impact on the improvement of urban resilience, but this impact has spatial and temporal heterogeneity. Based on the above research results, the strategies have been proposed from the perspective of sustainable urban development to provide a new theoretical support and decision-making reference for improving the resilience level of urban agglomerations in western China.

1. Introduction

The city is an important part of human society and an important carrier of human activities, and its sustainable development is an important guarantee for the progress of human society. As a complex system integrating economy, society, ecology, and infrastructure, urban sustainable development means that a city can better solve the problems encountered in the process of development, and its core lies in coordinating the relationship between urban development and urban resources, environment, and security [1]. However, the continuous expansion of urban scale and the high concentration of the population make the contradiction between urban development and urban resources, environment, and security increasingly prominent [2]. High-intensity economic activities and frequent emergencies have caused excessive consumption of urban resources and substantial damage to the environment, which has brought serious challenges to the sustainable development of cities [3]. The potential impact and catastrophic consequences of emergencies such as earthquakes, floods, and COVID-19 in recent years have become increasingly significant, severely restricting the sustainable urban development [4].
Fortunately, due to the direct relationship between urban resilience and sustainable urban development, the proposal of resilient cities provides a new operating mechanism for sustainable urban development [5]. Resilient cities aim for the sustainable development of cities, can improve the speed of disaster response, and reinforce the disaster operation mechanism of cities through the preparation work before emergencies [6]. Therefore, resilient cities can quickly adapt to and absorb the hazards of disasters, effectively reduce the potential impact of disasters, reduce the disaster losses of cities, and enhance the sustainable development capacity of cities [7].
In recent years, facing the threat of escalating emergencies, building resilient cities has become a key issue of international concern [8]. China established the Ministry of Emergency Management and included resilient cities in its long-term development plan [9]. The United Nations [10], the Rockefeller Foundation [11], and other relevant international institutions are also constantly promoting the development of resilient cities. Simultaneously, urban resilience research has also become the theme of current urban governance research [12], but few scholars have paid attention to urban resilience in relatively backward areas in western China.
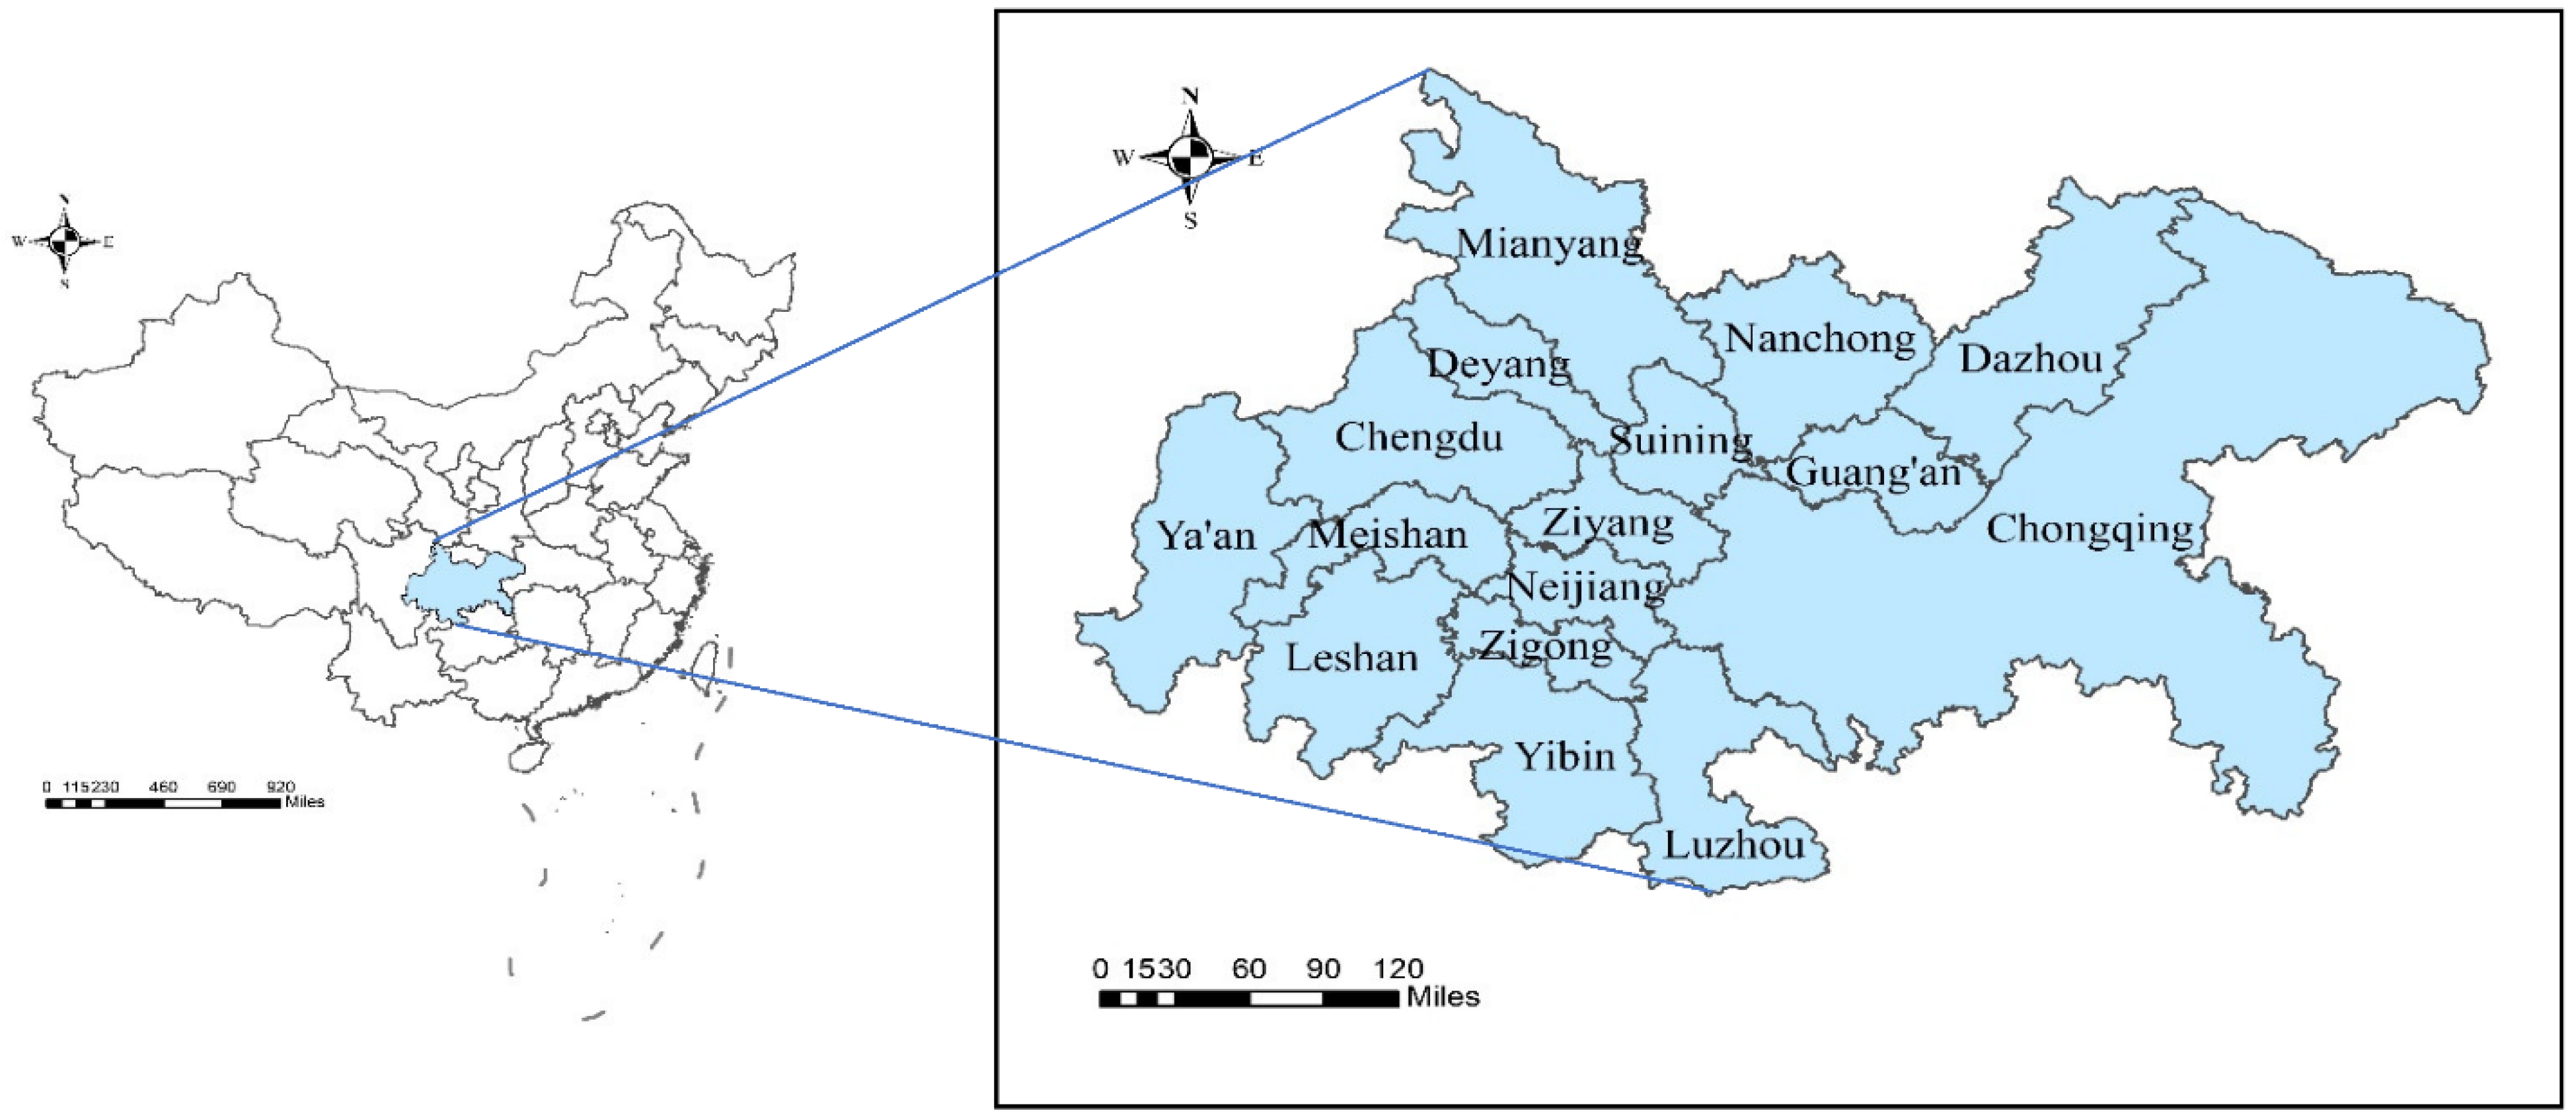
Therefore, we take the Chengdu–Chongqing urban agglomeration in western China as the research area and aim to explore the resilience improvement strategies and enhance the sustainable development capabilities of cities. In this study, we summarize the current research progress on urban resilience in Section 2, and present the general research area, framework, and methodology of this paper in Section 3. We analyze the level of urban resilience and the influencing factors of urban resilience in the Chengdu–Chongqing urban agglomeration in Section 4. In Section 5, We discuss theoretical contributions and development proposals. In Section 6, we summarize the main conclusions of this study and point out aspects that can be further explored by subsequent research.

2. Research Review

At the end of the last century, resilience theory was first used to study the problem of complex urban systems responding to natural disasters [13] and emergencies [14]. At the beginning of this century, the International Council for Local Environmental Initiatives (ICLEI) first proposed the concept of urban resilience and incorporated it into urban sustainable and healthy development policies, promoting the application of resilience theory in urban ecosystem research [15]. By reviewing the existing international research on urban resilience, it is found that domestic and foreign scholars have carried out rich research on urban resilience from multiple backgrounds, multiple perspectives, and multiple regions. These studies mainly concentrate on three aspects: theoretical research on the concept and features of urban resilience; empirical research on the evaluation and evolution mechanism of urban resilience; and exploratory research on the improvement paths of urban resilience level.
In terms of theoretical research, existing research first discusses the connotation of urban resilience. Due to different research perspectives, the definition of urban resilience can be divided into two categories: anti-stress protection theory and capacity improvement theory. The theory of anti-stress protection defines urban resilience as the ability of a city to achieve public environmental security, social order stability, and normal operation of the economic system when faced with internal and external sudden disasters [16,17]. The theory of capacity improvement defines urban resilience as a sustainable development ability of a city to protect the normal operation of internal systems during disasters and reorganize internal systems to improve overall resilience after disasters [18,19]. Second, in terms of theoretical research, scholars also discussed the characteristics of resilience cities. Scholars have discussed the characteristics of resilient cities in terms of their premise [20], effect [21], mechanism [7], and purpose [22].
In terms of empirical research, scholars mainly evaluate the resilience level of cities in specific regions from three perspectives: the disaster response perspective, urban composition perspective, and urban resilience characteristics perspective [23]. From the perspective of disaster response, scholars have mainly evaluated the disaster response capacity of different urban systems with the background of specific disasters, such as climate change [24], earthquakes [25], flood disasters [26], and economic crises [27]. From the perspective of urban composition, relevant scholars mainly evaluate the level of urban resilience from four dimensions: society, economy, ecology, and organization [28]. On this basis, related scholars continue to expand the evaluation dimension, such as system and culture [29]. From the perspective of urban resilience characteristics, scholars mainly evaluate the urban resilience level of a specific region based on the combination characteristics, such as the combination characteristics of “scale density form” [30], the combination characteristics of “response, recovery and adaptability” [31] and the combination characteristics of “prediction, adaptation and recovery” [32].
In terms of exploratory research, scholars mainly focus on the research theme of analyzing the influencing factors of urban resilience and explore ways and methods to improve urban resilience [33]. Das et al. (2020) [34] found through a questionnaire survey that the education level, economic development level, and infrastructure level of local people are important factors affecting the urban resilience of the east coast of the Indian Ocean, and put forward urban resilience improvement strategies, such as improving insurance policies and smart asset investment. Liu et al. (2021) [35] used a spatial econometric model to study and discover that factors such as urbanization rate and administration all had an important impact on urban resilience in Henan, China, and proposed urban resilience improvement ways, such as continuously promoting the level of new urbanization and optimizing the industrial structure. Khan et al. (2021) [36] used structural equation modeling to study and discover that geographic location, government decision-making, and urban financial conditions have a significant impact on urban resilience and gave related methods to improve urban resilience. Moradi (2021) [37] used the expert scoring method to find that economic indicators and physical environment conditions are all important factors for improving the urban resilience of Iran’s second-largest city, and also put forward suggestions for improving urban resilience.
However, due to the late start of the research on urban resilience, the existing research still has some limitations. In the selection of a study area, the existing research is mainly limited to the relatively developed coastal areas of the global economy, and lacks the resilience research of relatively backward inland cities. In terms of research methods, exploratory research is mostly limited to econometric methods such as linear regression, structural equations, and spatial econometric models, and new research methods need to be introduced. In terms of research content, most studies are limited to the measurement and evolution mechanism of urban resilience, lacking more in-depth research on regional spatial optimization and coordinated improvement of regional urban resilience.
Compared with existing research, this paper is the first to comprehensively evaluate the urban resilience level of the Chengdu–Chongqing urban agglomeration in western China, which provides a decision-making reference for enhancing the urban resilience of the area and driving the improvement of urban governance level in western China. Second, this paper combines the methods of econometrics and geography, improves the traditional entropy weight method by adding time variables, and introduces the geographically and temporally weighted regression model into the field of urban governance research, which innovates the research method. Finally, on the basis of evaluating the level of regional urban resilience, this study analyzes and puts forward the improvement strategy of urban resilience coordinated development, which broadens the theoretical boundary and scope of application.

3. Materials and Methods

3.1. Study Area

This study chooses the Chengdu–Chongqing urban agglomeration in western China as the study area, which consists of 16 cities as shown in Figure 1. It has the unique advantage of connecting southwest and northwest China and connecting East Asia, Southeast Asia, and South Asia [38]. Firstly, it is the region with the strongest industrial foundation, the broadest market space, and the highest degree of openness in western China. In 2021, the total economic volume of the Chengdu–Chongqing urban agglomeration will account for 6.5% of the national total and 30.8% of the western region [39]. Secondly, it is another major coordinated development area following the three major coordinated development areas along the eastern coast of China. It is an important economic center with national influence and has a unique strategic position in driving the overall development of western China. Thirdly, the Chengdu–Chongqing urban agglomeration is adjacent to many countries in Southeast Asia, and is also inhabited by ethnic minorities. The geographical environment is special and complex, and public events occur frequently. According to the data of the Ministry of National Emergency Management, in recent years, the incidence of earthquake disasters, traffic accidents, man-made damage, and public emergencies in the study area has remained high, showing the characteristics of complex composition, widespread, and severe social impact, which seriously threaten the safety and the sustainable development of regional cities [40].

3.2. Data Sources

3.2.1. Statistical Data

This study takes the statistical data of 16 cities in the study area from 2005 to 2019 as the study sample. The data mainly come from the relevant statistical yearbooks and statistical bulletins of the country, province, and city. For individual missing and wrong values, this paper uses the mean value method of adjacent years to interpolate and correct, so as to guarantee the completeness and authenticity of the data.

3.2.2. Geographic Data

The geographic data in this paper are mainly from the National Basic Geographic Information Center of China and the National Geographic Information Resource Catalog Service System of China. After screening and processing, the geographic data conforming to the study area are obtained. Meanwhile, in this paper, after processing, the resolution of the processed geographic data is 1000, which can better present the research content.

3.3. Methodology

3.3.1. Entropy Weight Method

The entropy weight method (EWM) is a weight calculation and evaluation method. Compared with the subjective weighted scoring methods, the entropy weight method can make a more objective and real evaluation of the object, and it is simple and easy to operate [41]. Based on the traditional entropy weight method, this paper adds the time variable of different years for improvement, which makes the evaluation of urban resilience more accurate and comprehensive. This paper uses MATLAB (Version 2018a, MathWorks, Natick, Massachusetts, United States), a programming calculation software, for calculation and the specific process is as follows:
(1)
Assuming there are n cities, m years, and s indicators, the original indicator matrix is X = {Xaij} m × n × s (0 < i < n, 0 < a < m, 0 < j < s). Then, the j-th index of the city i in the a-th year can be expressed as Xaij, and in this paper n, m, and s are 16, 15, and 25, respectively.
(2)
Indicator data standardization:
1.
Positive indicator:
X a i j = X a i j min X j max X j min X j
2.
Negative indicator:
X a i j = max X j X a i j max X j min X j
(3)
Indicator data normalization:
Y a i j = X a i j a = 1 m i = 1 n X a i j
(4)
Calculating the entropy value of the indicator:
e j = 1 ln ( m n ) a = 1 m i = 1 n Y a i j ln ( Y a i j )
(5)
Calculating the redundancy of the index entropy value:
g i = 1 e j
(6)
Calculating indicator weights:
W j = g j j = 1 s g j
(7)
Calculating urban resilience scores:
R = j = 1 s X a i j W j

3.3.2. Theil Index

The Theil index is an indicator that uses the concept of entropy in information theory to evaluate the development gap between individuals or regions [42]. This study takes the Theil index to describe the spatial imbalance characteristics of urban resilience development in the study area.
T = i = 1 n P i x i u ln x i u
Among them, n refers to the number of cities, Pi represents the proportion of the population of the i-th city to the total urban population, xi represents the resilience level of the i-th city, and u represents the weighted average of all observed urban resilience levels.

3.3.3. Geographically and Temporally Weighted Regression

It is a local linear regression model, which can combine temporal information and spatial information and consider both time and space non-stationarity. It can estimate the effect of influencing factors in different regions and different times, so that the relationship between variables can change with the change of time and spatial position, and the result is more in line with the objective reality [43]. This paper uses ArcGIS10.7 (Version 10.7, Environmental Systems Research Institute, Redlands, CA, USA), a geographic data analysis software, for calculation and analysis, and its model structure is as follows:
Y i = β 0 ( u i , v i , t i ) + k β k ( u i , v i , t i ) X i k + ε i
Among them, Yi is the explained variable and (ui, vi, ti) is the spatiotemporal dimension coordinate, where ui is the longitude coordinate, vi is the latitude coordinate and ti is the time coordinate of the i-th sample point. β0(ui, vi, ti) is the constant term (intercept), while βk(ui, vi, ti) is the regression coefficient of the k-th explanatory variable.
Among them, the regression coefficient adopts the local weighted least squares estimation, and the method is as follows:
(1)
Calculating the space–time distance:
d i j S T = λ u i u j 2 v i v j 2 + μ t i t j 2
where d i j S T is the space–time distance and λ and μ are the weights of the Gaussian function method.
(2)
Calculating the space–time weight function:
W i j = exp d i j S T 2 h 2
where Wij is the space–time weight function and d i j S T is the space–time distance. h is the spatiotemporal bandwidth, selected according to the minimum cross-validation (CV) value, and is the sum of the squared errors between the actual value yi and the predicted value y ^ i ( h ) , and the formula is as follows:
C V ( h ) = i y i y ^ i ( h ) 2
(3)
Constructing the space–time weight matrix:
W ( u i , v i , t i ) = d i a g W i 1 , W i 2 , , W i j , W i n
where the space–time weight matrix W(ui, vi, ti) is an n × n diagonal matrix, where Wij(1 ≤ jn) is the space–time weight function.
(4)
Calculating the regression coefficient:
β ^ ( u i , v i , t i ) = X T W ( u i , v i , t i ) X 1 X T W ( u i , v i , t i ) Y

3.4. Index System and Weight

3.4.1. Index System

Through the above review of existing research, this paper considers urban resilience as the degree to which a city can endure, adapt, and absorb hazards when faced with various disasters, and as the recovery capability after the disaster. From the perspective of urban resilience composition and urban resilience characteristics, this paper designs an evaluation index system with three levels: target level, criterion level, and index level [44]. This paper takes overall resilience as the target layer and chooses economic resilience, social resilience, ecological resilience, and infrastructure resilience as the criterion layers from the perspective of urban resilience composition and characteristics. Additionally, combined with domestic and foreign urban resilience evaluation index systems [45], this paper selects 25 specific indicators to build the evaluation index system (as in Table 1).

3.4.2. Indicator Weight

Based on the assessment file framework built over, this study employs the improved entropy weight method to compute the weight value of the urban resilience evaluation index of the study area after collecting the data. Through MATLAB calculation, the weight coefficients of the criterion layer and indicators are obtained, as appeared within the taking after Table 2:

3.5. Study Variables and Test

3.5.1. Study Variables

(1)
Explained Variable.
This paper takes the urban resilience level as the explained variable. Based on the previous construction of an urban resilience level evaluation index system, this study will utilize the improved entropy weight method to evaluate the urban resilience level of 16 cities in the study area from 2005 to 2019, which will be used as the explanatory variable.
(2)
Explanatory Variables.
After comprehensively considering the connotation and characteristics of urban resilience, combined with existing investigations, this paper selects the explanatory variables from the aspects of society, environment, economy, population, and facilities that affect the urban resilience. The explanatory variables selected in this paper are as follows: (1) administrative level. Government departments are the direct leading departments of urban planning and development. The administrative level of government departments is directly related to the urban resilience. This paper uses the extent of public monetary use to GDP to measure the urban administrative level. (2) Open level. The opening level of the city will affect the development of the industry, technology, economy, and employment of the city; therefore, the level of urban openness has a great impact on the urban resilience of the city. This paper uses the proportion of the total import and export trade to GDP to measure the opening level of the city. (3) Marketization level. The market level reflects the consumption power and economic vitality of the city, can invigorate the development of the city’s economy to a certain degree, and also has an imperative effect on the resilience. This paper adopts the marketization level of the per capita retail quota of social consumer goods. (4) Science and education level. The level of science and education is the driving drive for the sustainable improvement of cities and has an imperative effect on the level of urban resilience. This paper selects the extent of science and instruction uses in fiscal expenditures to measure the level of science and education in cities. (5) Industrial structure. Industrial structure is the embodiment of the city’s economic and social stability and is an important guarantee for the city to resist shocks. This paper selects the extent of the tertiary industry in GDP to measure the city’s industrial structure. (6) Credit level. The credit level reflects the financial development potential of the city and has a great effect on the city’s ability to resist economic shocks. This paper uses the ratio of the total deposits and loans of financial institutions to GDP to measure the city’s credit level. (7) Population density. Population density directly affects the distribution and use of urban labor resources and plays an important role in urban economic and social development. This paper uses the proportion of population to urban area to measures population density. (8) Urbanization level. Urbanization can better integrate market resources, create a better urban development environment, and play an important role in the level of urban resilience. This study selects the urbanization rate to measure the urbanization level of a city. (9) Emergency facility level. The level of urban emergency facilities is an important criterion to measure the urban emergency response capability and determines the level of urban resilience. In this paper, the level of urban emergency facilities is measured by the urban per capita infrastructure investment quota.

3.5.2. Variable Test

In the geographically and temporally weighted regression model, when the variance inflation factor (VIF) of the explanatory variable is higher than 10, the model will become unstable. Before performing regression, it is necessary to verify the correlation and multicollinearity between variables. In this paper, the urban resilience scores of 16 cities in the study area from 2005 to 2019 are used as explanatory variables, and the data of the nine explanatory variables collected are standardized at the same time, so that the effect of influencing factors can be directly compared. Based on the statistical data analysis software SPSS (Version 25.0, IBMCorp, Armonk, New York, United States), the correlation and multicollinearity between variables were tested by the Pearson correlation coefficient and variance inflation factor, and key explanatory variables were screened. As can be seen from Table 3, among the nine explanatory variables selected in this study, except for the science and education level, which has no significant correlation with urban resilience, the rest of the explanatory variables are significantly related to urban resilience, and there is no multicollinearity.

4. Results

4.1. Evaluation Results of the Urban Resilience

This paper uses the interval taxonomy way to divide the urban resilience score into four grades between (0, 1): less than 0.25 is the low resilience level, between 0.25–0.50 (including 0.25) is the general resilience level, between 0.50–0.75 (including 0.50) is the medium resilience level, and greater than 0.75 (including 0.75) is the high resilience level. Based on this division of urban resilience levels, this study analyzes the urban resilience level and its influencing factors in the Chengdu–Chongqing urban agglomeration.

4.1.1. Urban Resilience Level

From the statistics of the urban resilience score in Table 4, it can be seen that, from 2005 to 2019, the resilience level of the 16 cities in the area showed a continuous upward trend. The urban resilience of Chengdu and Chongqing has increased from a general level of resilience to a high level of resilience, and the urban resilience of the remaining 14 cities has also increased from a low level of resilience to a medium level of resilience. Among them, Guang’an has the largest increase, and its urban resilience level rose from 0.131 in 2005 to 0.577 in 2019, and the annual growth rate reached 22.7%. As Guang’an is a low-resilience city, it is relatively easy to improve its resilience, and it is adjacent to Chongqing, which is driven by the radiation of Chongqing, and the growth rate is obvious. However, the resilience levels of cities such as Chengdu and Chongqing have improved relatively slowly, with a yearly increasing rate of only 6.7% and 8.9%, respectively. This is mainly due to Chengdu and Chongqing being provincial capitals with relatively large scales, and the improvement of urban resilience is affected by various factors, making it relatively difficult. In terms of rankings, the two provincial capitals, Chengdu and Chongqing, are firmly in the top two resilience levels, leading the construction and development of resilient cities in the area. Cities such as Mianyang, Deyang, Zigong, and Ya’an have also been ranked at the forefront, and they are the core forces for the construction and development of resilient cities in the region. The rankings of cities such as Luzhou, Yibin, and Guang’an are also rising, and their role in the construction and development of resilient cities in the region is becoming more and more important.

4.1.2. Temporal Evolution Characteristics of Urban Resilience

This paper uses the average resilience of 16 cities to measure the overall resilience level of the region. As shown in Figure 2, from 2005 to 2019, the overall regional resilience level of the Chengdu–Chongqing urban agglomeration grew from 0.206 to 0.6, and the resilience of the economy, society, ecology, and infrastructure also increased significantly. During the period, the ecological resilience level was obviously higher than that of other subsystems such as economy and society in the area, mainly because the urban agglomeration was located in western China, the economic and social level was relatively backward and increase slow, and the ecological environment was not overused, making the ecological resilience level in the region relatively high. In recent years, due to the rapid development of cities in western China, the Chengdu–Chongqing urban agglomeration has been utilizing a large amount of ecological and environmental resources, which has slowed down the improvement of regional ecological resilience, but the resilience of the regional economy, society, and infrastructure has improved rapidly. At the same time, the state has put forward a coordinated development plan for the Chengdu–Chongqing urban agglomeration, which means the overall resilience of the region still has a lot of room for improvement. In the future, the overall resilience of the area will continue to improve.

4.1.3. Spatial Evolution Characteristics of Urban Resilience

Influenced by geographical location, resource endowment, development level, and other factors, the urban resilience of the 16 cities in the region has significant spatial differences. Based on ArcGIS 10.7 software, this study conducted a spatial representation of the urban resilience of the 16 cities in 2005, 2010, 2015, and 2019. As can be seen from Figure 3: (1) the resilience level of Chengdu, Deyang, Mianyang, and Ya’an in the northwest of the region is relatively high, while the cities with low resilience level are concentrated in the southwest and northeast of the region, mainly Yibin, Zigong, Dazhou, and Guang’an, showing significant spatial differences. (2) In the region, the urban resilience level of Chengdu and Chongqing is much higher than that of other cities, and the core position of the two cities is obvious. Chongqing is located in the east of the region, bordering on the Central Plains urban agglomeration, and Chengdu is located in the west of the region, respectively leading and radiating the construction and development of resilient cities in the region. (3) The resilience level of the surrounding cities of Chengdu is also relatively high, with a good radiation-driven development effect. However, the resilience level of the surrounding cities of Chongqing is relatively low, showing a strong siphon effect, which is related to the fact that Chongqing lacks coordinated development with other cities.
In this paper, the Theil index of urban resilience is calculated as shown in Figure 4. It can be found that while the urban resilience of the cities is continuously improving, the gap in resilience levels between cities is decreasing, and the spatial differences and development imbalances are constantly weakening. Among them, the spatial difference between urban ecological resilience and infrastructure resilience is small, and the fluctuation changes are small, but the spatial differences of urban social and economic resilience are large, and the fluctuation changes are obvious, which makes the overall resilience level of regional cities have significant spatial differences and large changes. During the period, the Theil index of regional urban economic and social resilience dropped from 0.538 and 0.47 to 0.219 and 0.182, respectively, and the Theil index of overall urban resilience dropped from 0.205 to 0.117. Spatial differences in urban resilience are shrinking, mainly because of the implementation of the relevant strategies and plans, which accelerate regional economic and social development. Led by Chengdu and Chongqing, the social and financial level of each city has been continuously improved, narrowing the social and economic gap between the cities, and making the unbalanced development of the overall urban resilience weaken. Although the gap still exists, the gap still has a decreasing trend.

4.2. Results of Influencing Factors on Urban Resilience

4.2.1. Analysis of the Action Results of Influencing Factors

From the regression results in Table 5, we can see that for the overall resilience, apart from the level of openness and the level of credit that inhibit the improvement of urban resilience, other explanatory variables have obvious impacts on the improvement of urban resilience. (1) Among them, the marketization level has the most noteworthy effect on urban resilience, mainly because the area is located inland and the economic development is relatively backward, so that improving the level of economic development is a viable way to make strides in the level of urban resilience. (2) The impact of the urbanization level on urban resilience is second. In the study area, where the level of urbanization is relatively backward, the improvement of the urbanization level enables cities to more rationally allocate resources such as population, capital, technology, and information, and improve urban resilience. (3) Industrial structure also has a positive influence on the resilience of the city. The research object as a traditional agricultural area, optimizing the industrial structure can promote urban economic and social development, thereby enhancing urban resilience. (4) Simultaneously, the administrative level and the level of emergency facilities also have positive effects on urban resilience. Since the research object is located in an area prone to natural disasters, the improvement of the administrative level and the level of emergency facilities can promote the level of urban management, improve the speed of urban emergency response, and directly affect the improvement of urban resilience. (5) The study area is rich in population resources, but because of the backward economic and social level there is an excess of labor resources, so population density has little effect on the improvement of urban resilience. (6) The opening level and credit level have negative impacts on urban resilience, which shows that the economic system of the study area inland is relatively fragile and vulnerable to external factors, and it needs to adjust and innovate the opening-up mechanism and development mode to enhance urban resilience.

4.2.2. Temporal and Spatial Heterogeneity of the Results

From the statistical results in Table 5, it can be seen that there is obvious temporal and spatial heterogeneity within the effect of the influencing factors of urban resilience in the Chengdu–Chongqing urban agglomeration. This paper uses ArcGIS 10.7 software to spatially characterize the effect of the marketization level, industrial structure, urbanization level, and emergency facility level on urban resilience. As we can see in Figure 5: (1) the level of emergency facilities has a high degree of effect on the urban resilience of Chengdu and Chongqing in the eastern and western of the region, while it has a low degree of effect on the resilience of cities, such as Luzhou and Dazhou in the north and south; (2) the effect of industrial structure on the resilience of regional cities gradually weakens from southwest to northeast, and the impact on cities close to the Central Plains urban agglomeration is relatively low; (3) the urbanization level has a higher degree of impact on cities with higher resilience levels in the eastern and western of the area, and a lower degree of impact on cities with lower resilience levels in the northern of the area; and (4) the marketization level has a lower degree of impact on cities with higher resilience levels in the eastern and western regions, but has a higher degree of impact on cities with lower resilience levels in northern and southern cities.
In this paper, the effect of each influencing factor on cities with different resilience levels was calculated to analyze the temporal heterogeneity of the influencing factors of urban resilience. In Table 6, it can be found that with the improvement of urban resilience, the impact of urbanization level and emergency facilities’ level on urban resilience continues to increase, while the impact of the marketization level will gradually decrease with the improvement of urban resilience, which is consistent with the conclusion of spatial heterogeneity of influencing factors. The impact of administrative level, industrial structure, and population density on urban resilience fluctuates little with the improvement of the urban resilience level. However, with the improvement of the urban resilience level, the opening-up level and credit level have an increasingly obvious inhibitory effect on urban resilience. For sustainable urban development in the area, it is imperative to adjust the opening-up mechanism and development mode to improve the overall resilience of regional cities.

5. Discussion

5.1. Theoretical Contribution

With the continuous increase of urban disaster events and the increasing threat risk, building resilient cities and improving the level of urban resilience are becoming a new direction for the current sustainable development of cities. This study comprehensively evaluates the urban resilience level of the Chengdu–Chongqing urban agglomeration and explores the influencing factors of urban resilience. This can verify and enrich the related research on urban resilience of inland cities to a certain extent and broaden the theoretical boundary and application scope of urban resilience.
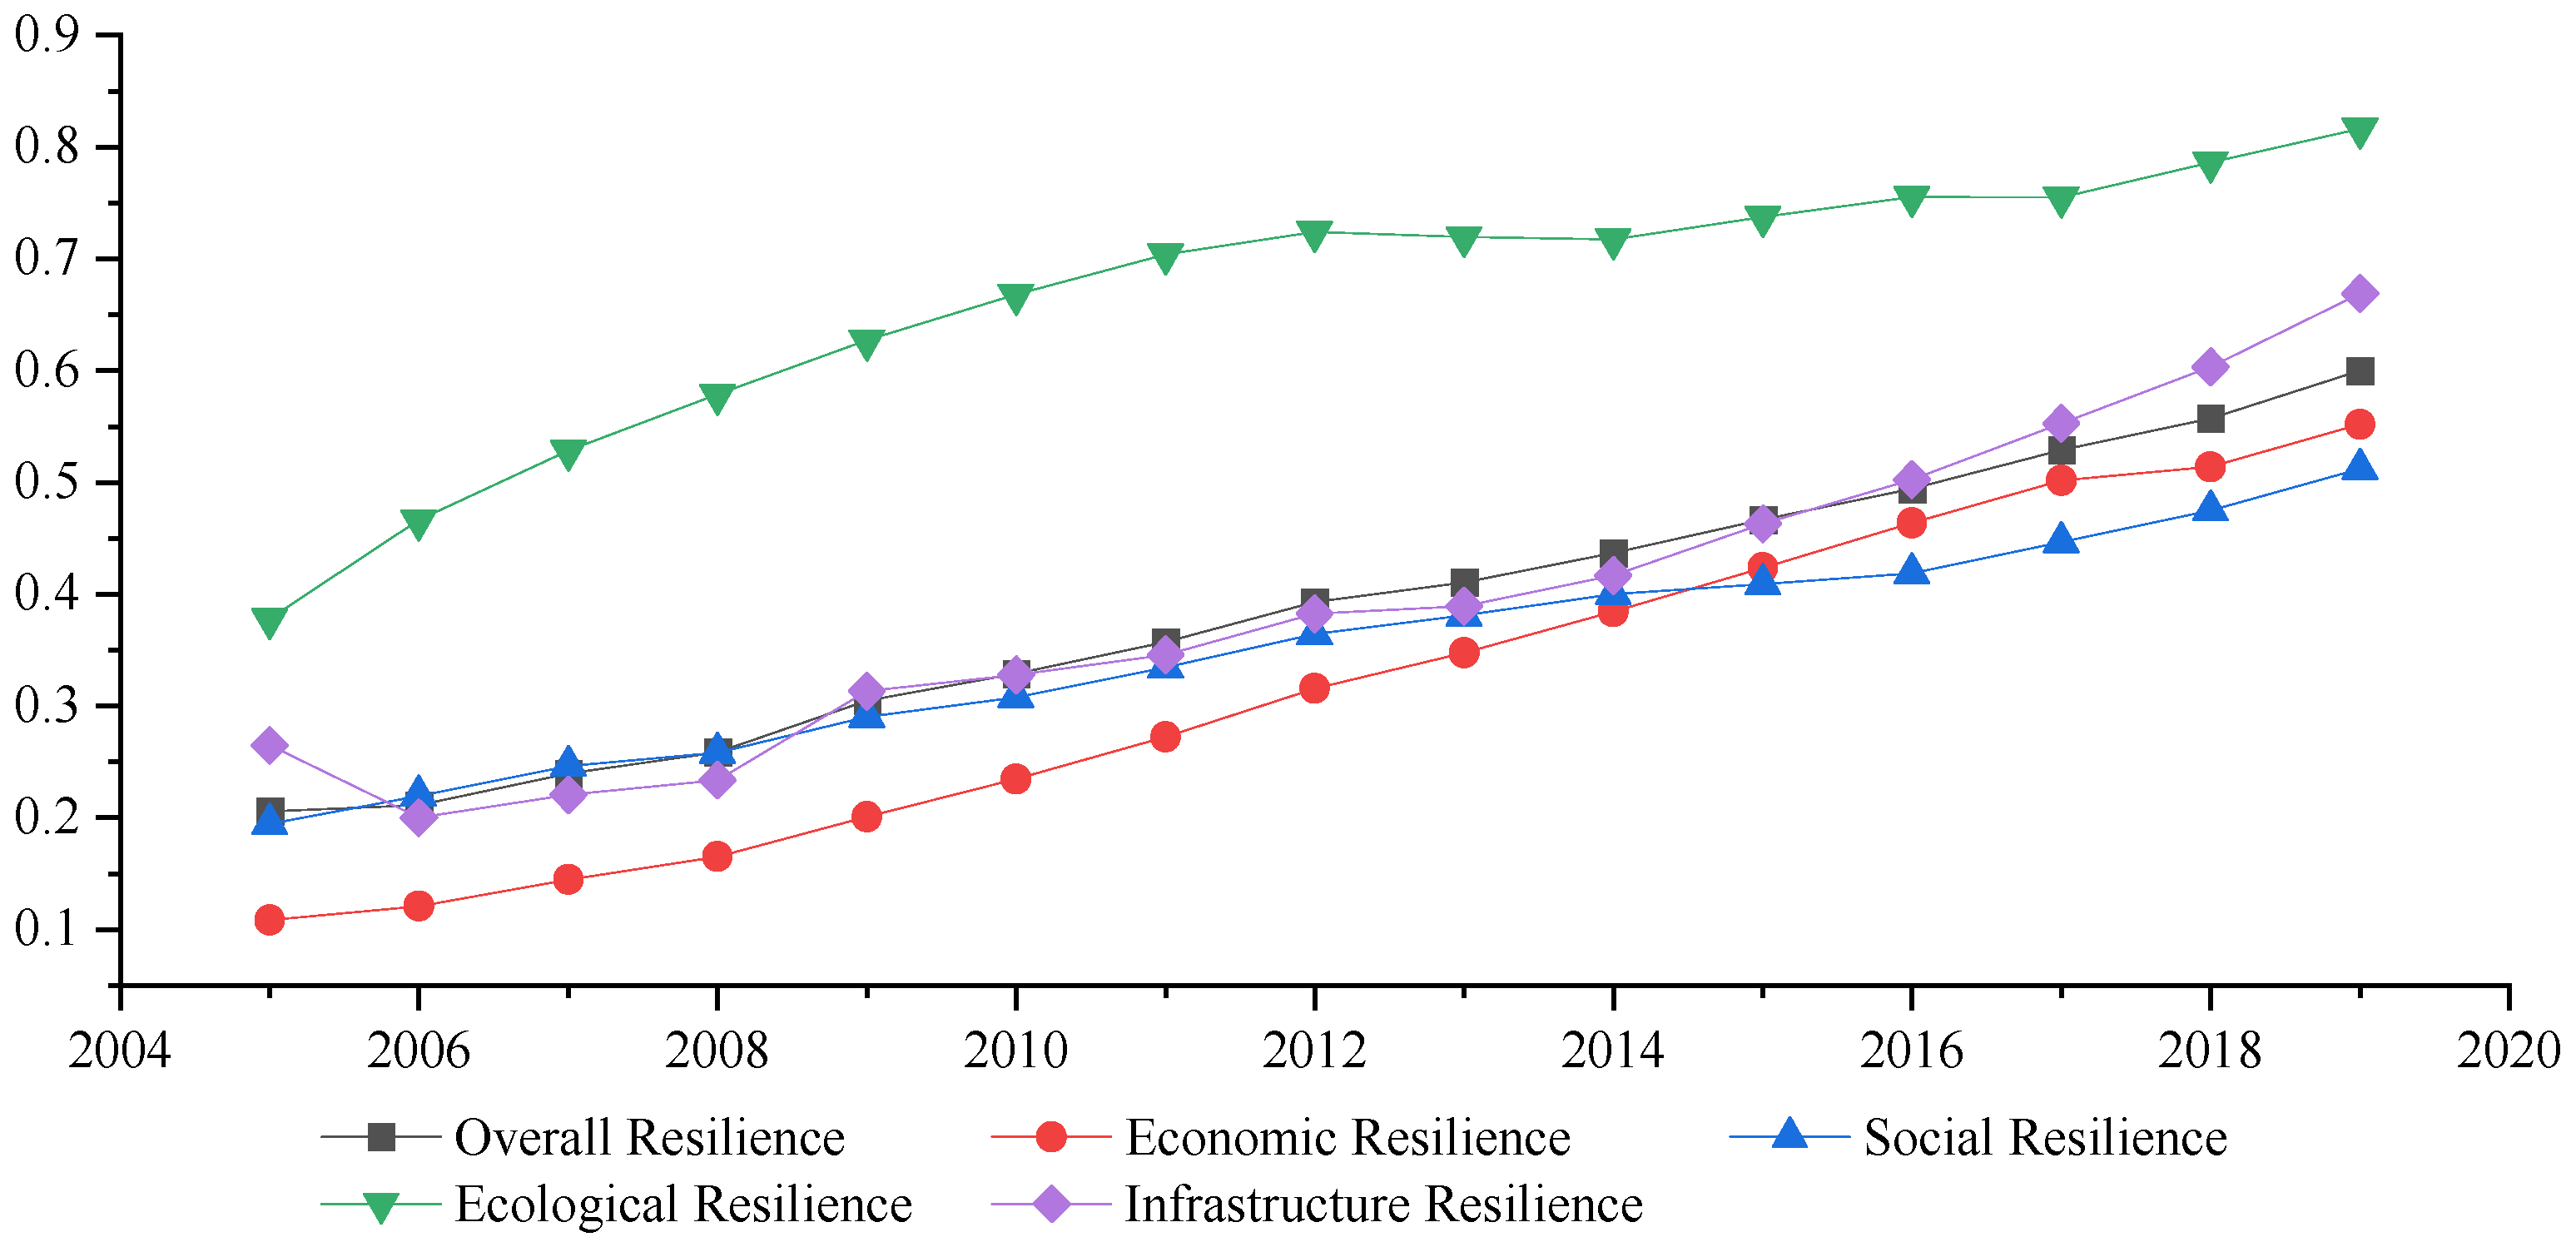
Firstly, through the measurement of the resilience level of the cities in the study area, this study finds that the level of economic resilience and social resilience is the key to determining the overall resilience level of the city. This confirms the research of Zheng et al. (2018) [57] and Ma et al. (2020) [58], arguing that economic and social levels are the main determinants of urban resilience. Cities with higher economic and social levels have relatively large resource investment in improving the level of urban resilience, making their level of urban resilience relatively high. However, cities with relatively low economic and social levels have failed to invest too many resources in improving urban resilience, and their resilience levels are relatively low. This also makes the social and economic level the main driving force for the improvement of the overall resilience level of the city.
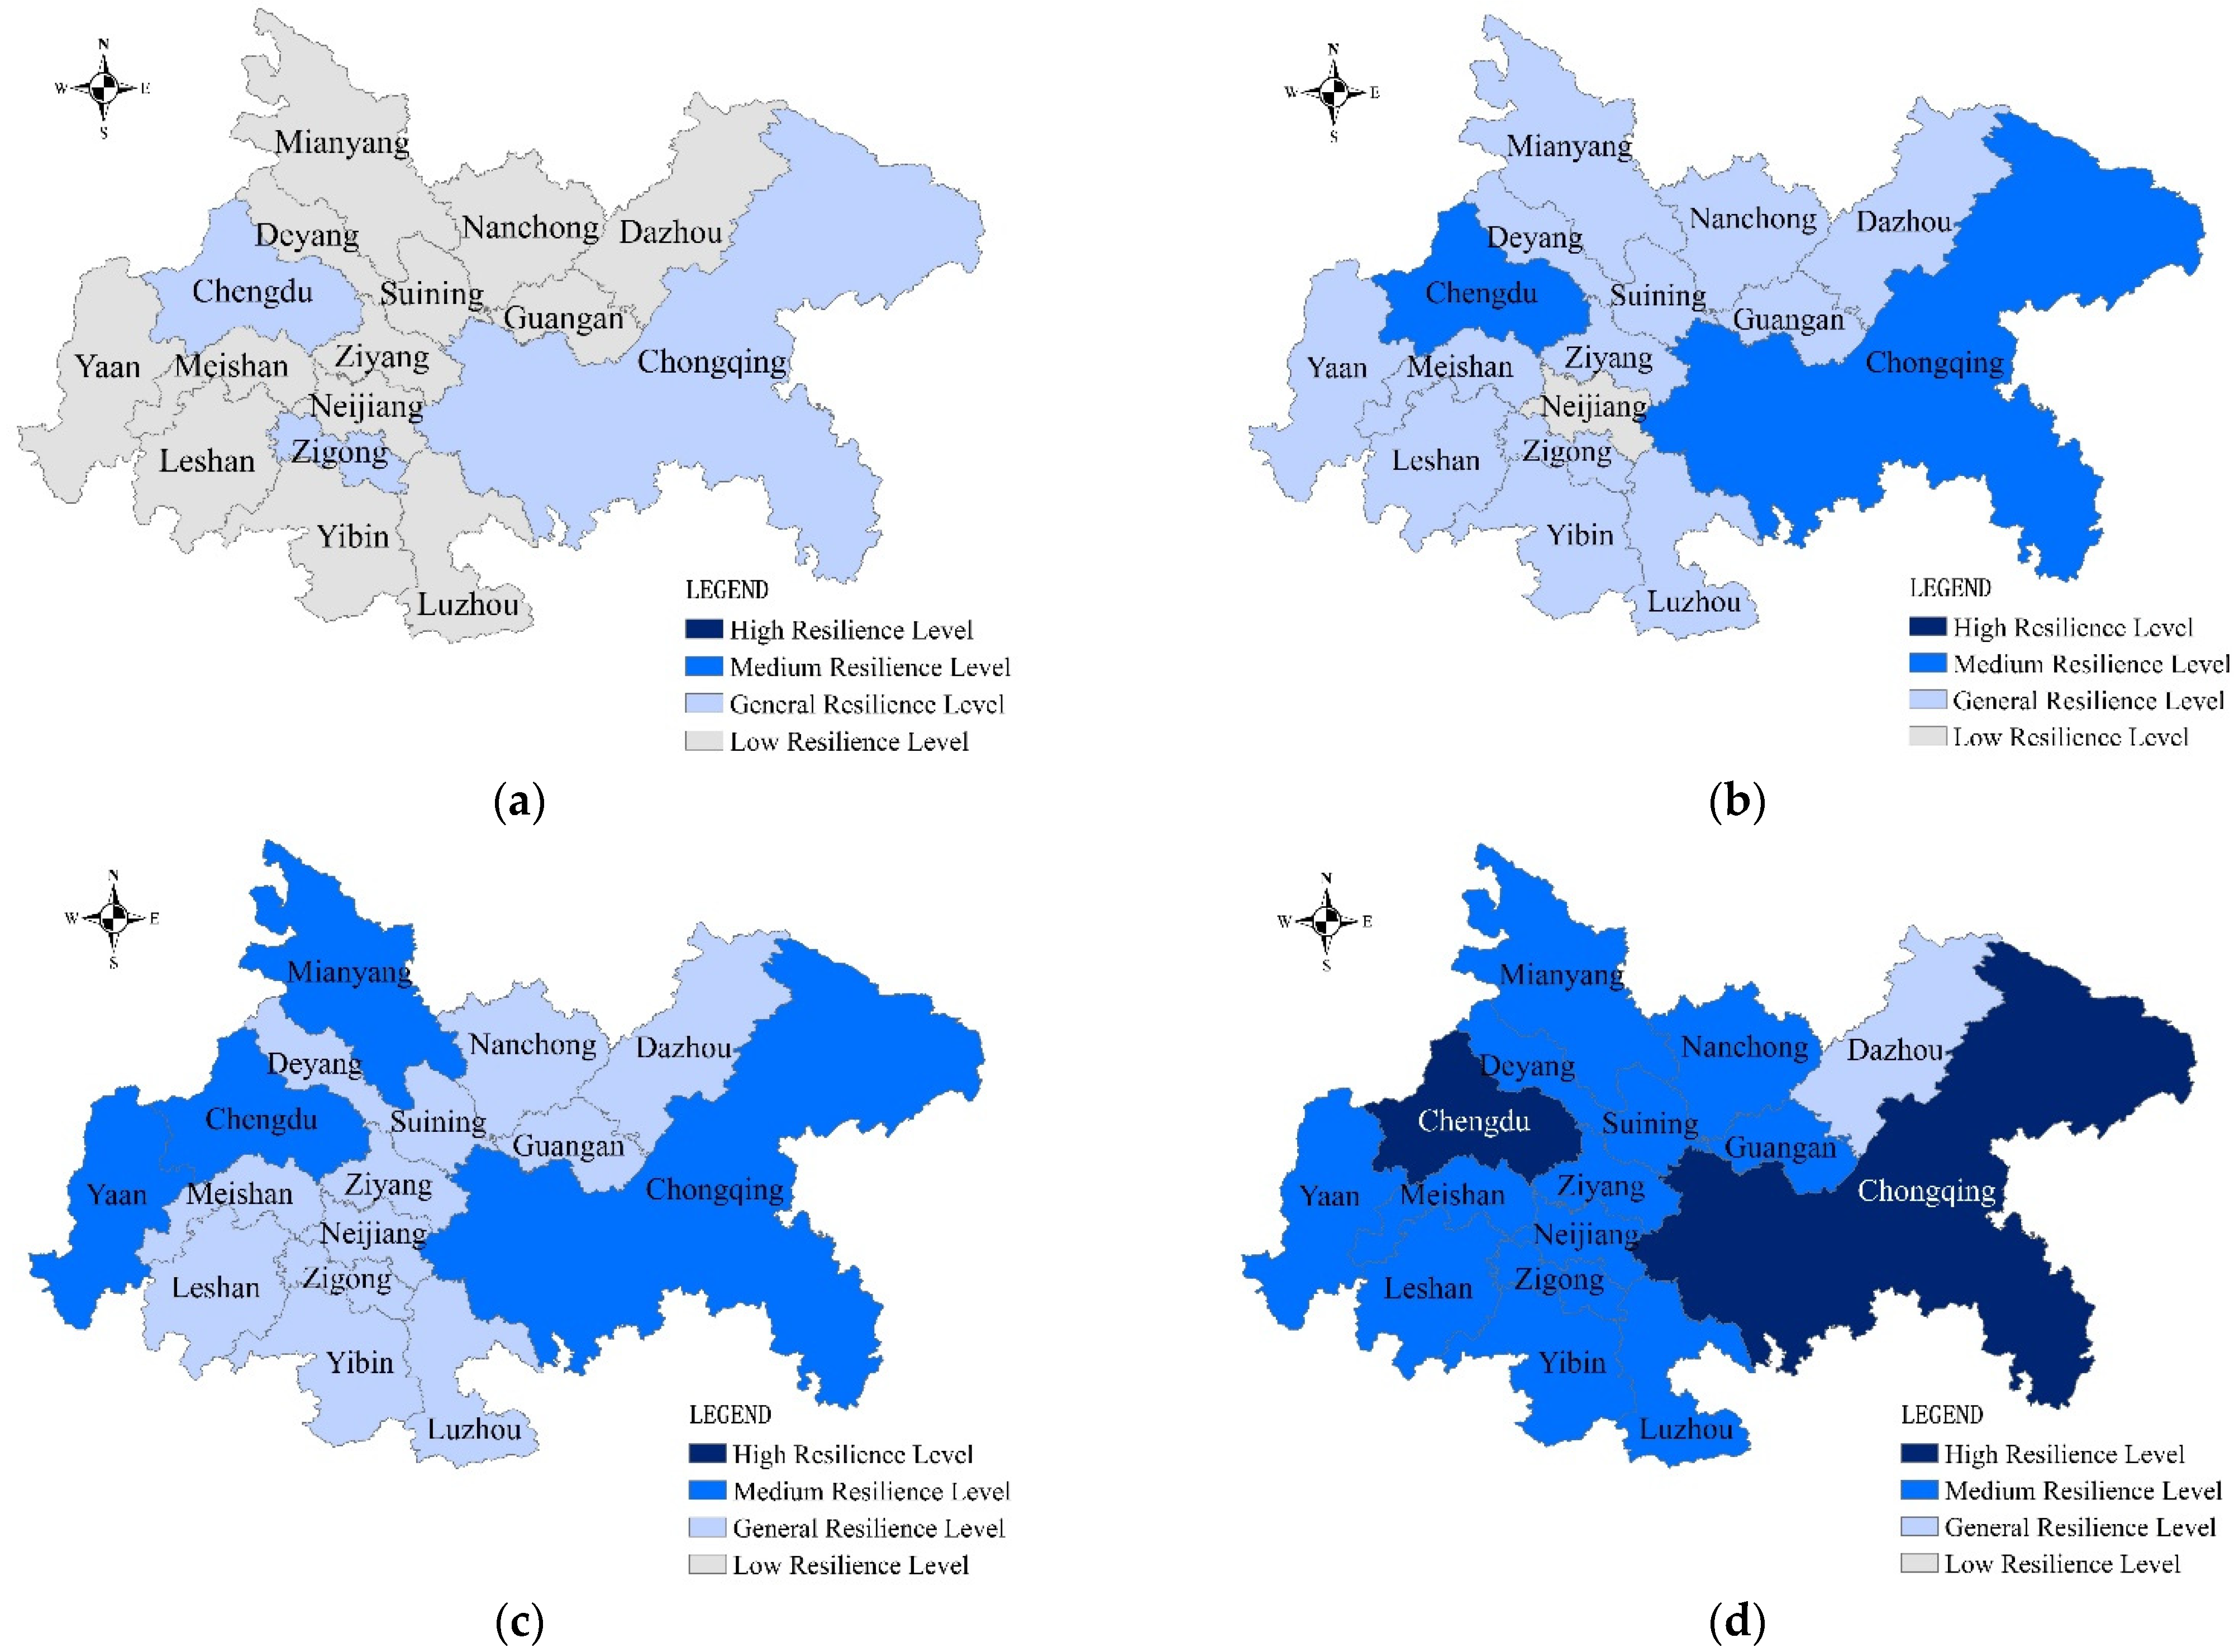
Secondly, through the analysis of the spatial differentiation characteristics of urban resilience in the study area, this study found that the level of urban resilience in the study area varies greatly, and there is an obvious siphon effect locally. This finding was also confirmed by Zhang et al. (2019) [59] and Liu et al. (2021) [35]. In the inland urban agglomeration, the scale of different cities varies greatly. Larger cities will absorb and utilize the resources of smaller cities, resulting in a siphon effect on the level of urban resilience in local areas. On this basis, this paper further explores and confirms that synergistically improving the economic and social development level of urban agglomerations can effectively reduce the gap in the resilience levels of cities in urban agglomerations and alleviate the siphon effect of urban resilience. This makes up for the lack of current scholars’ research on the siphon effect of urban resilience.
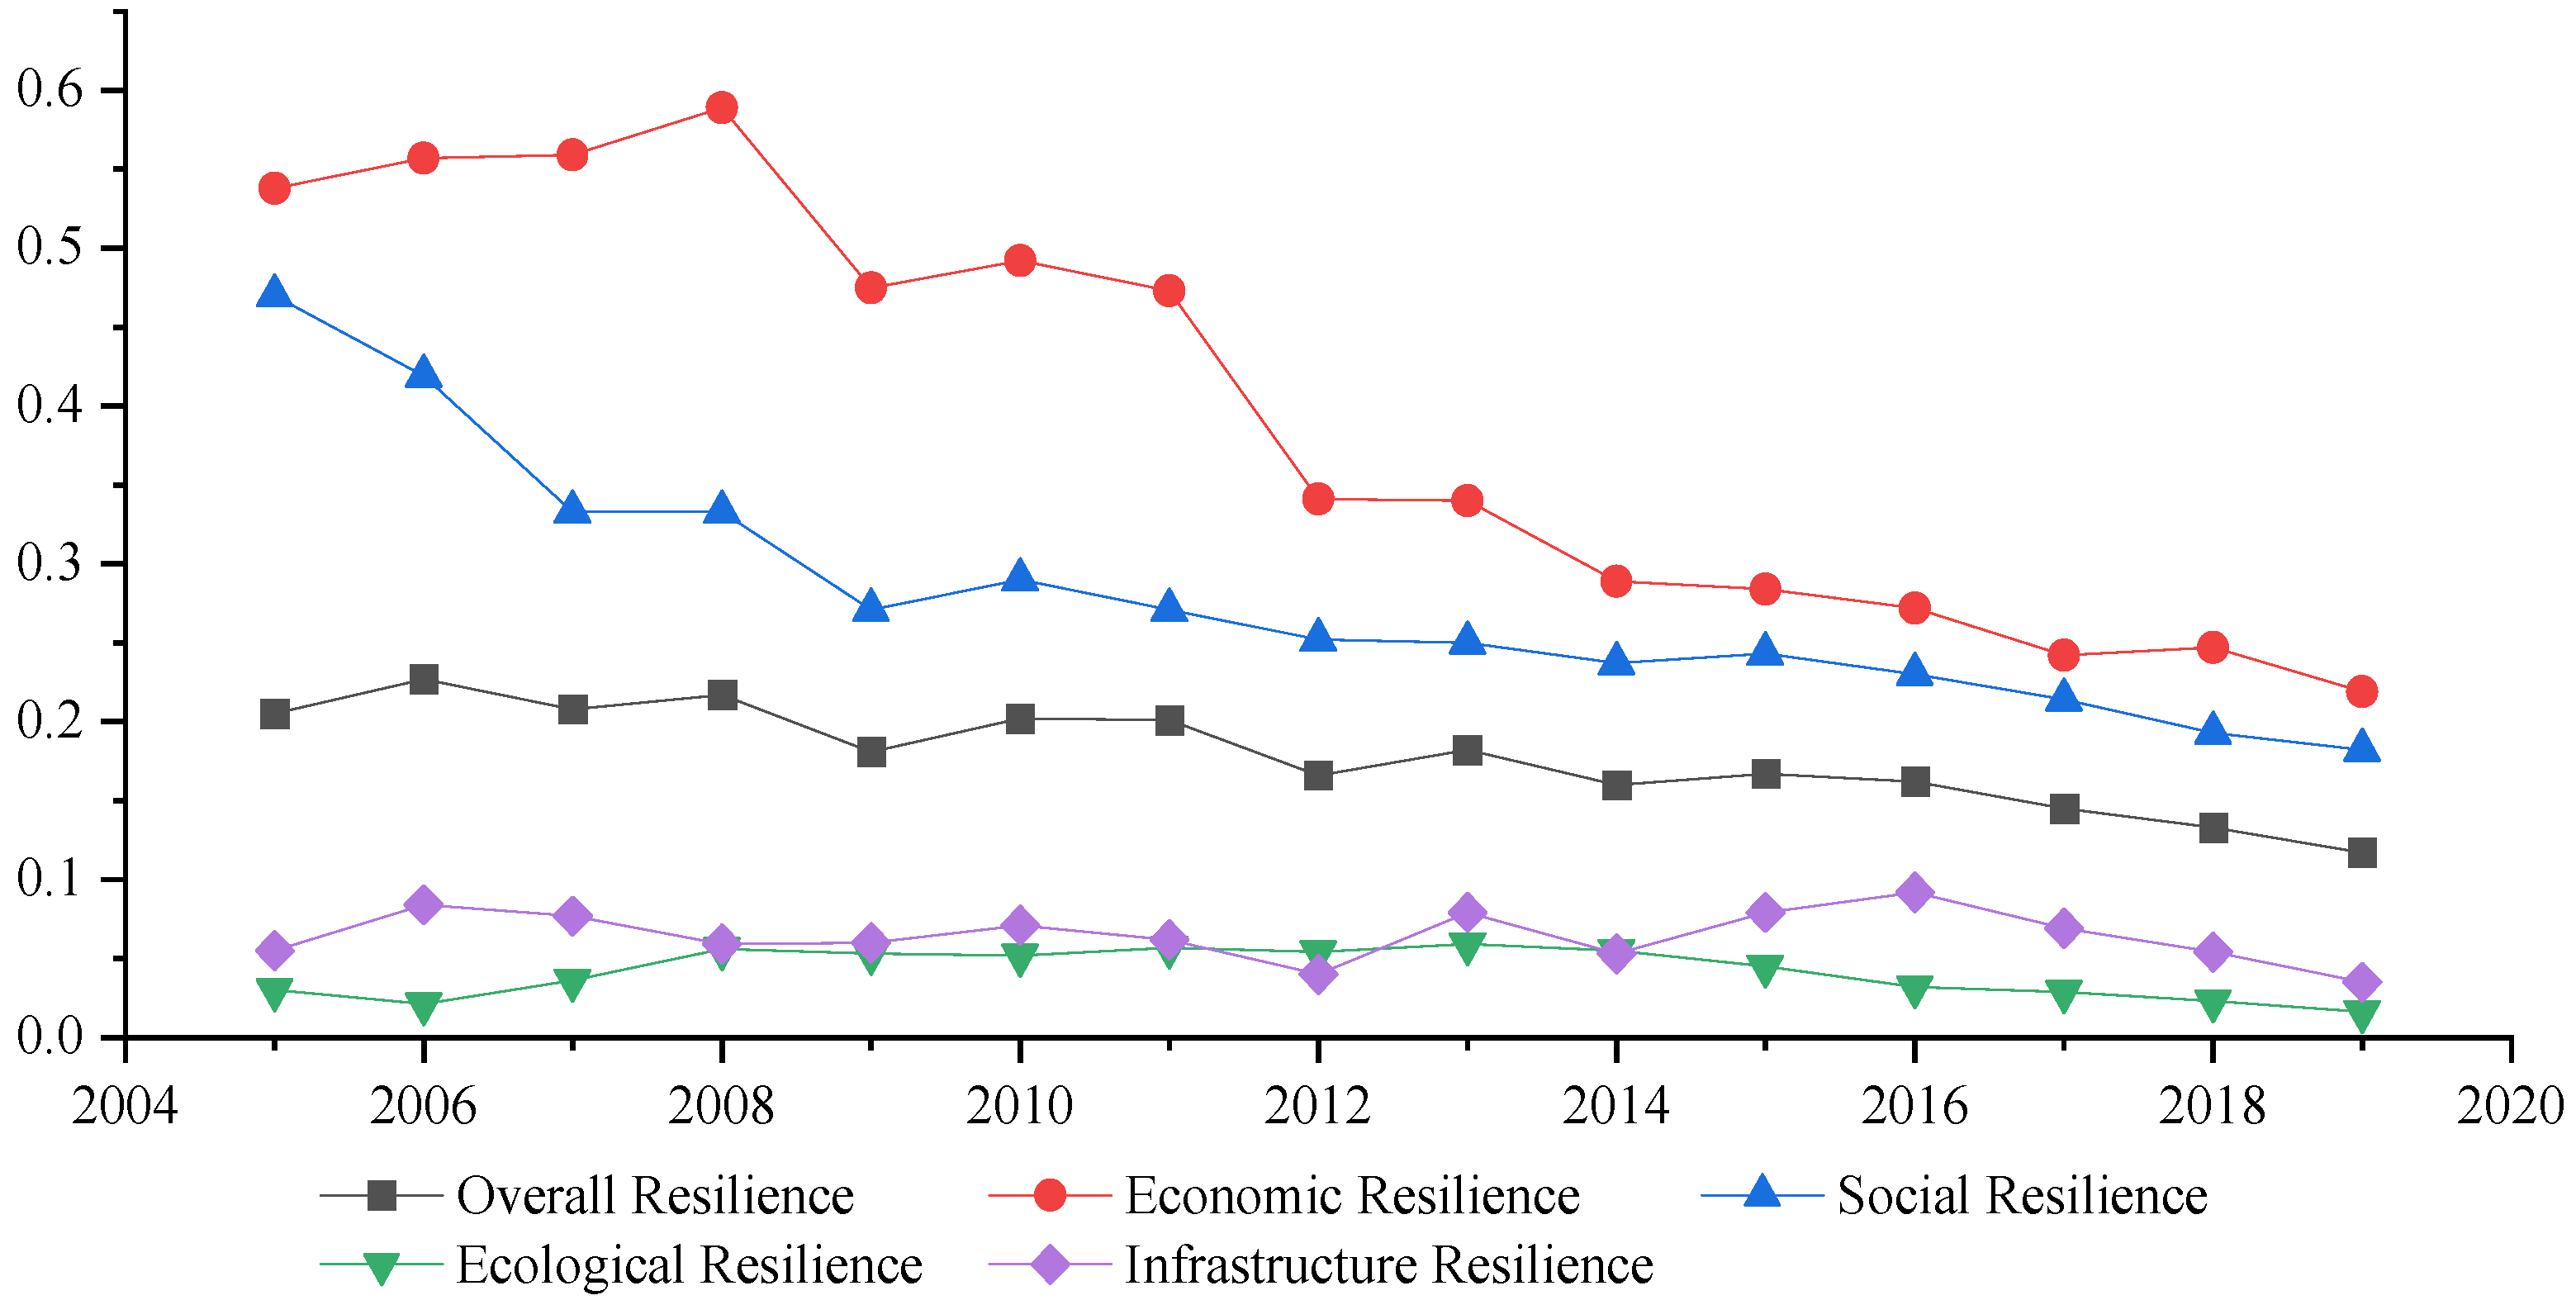
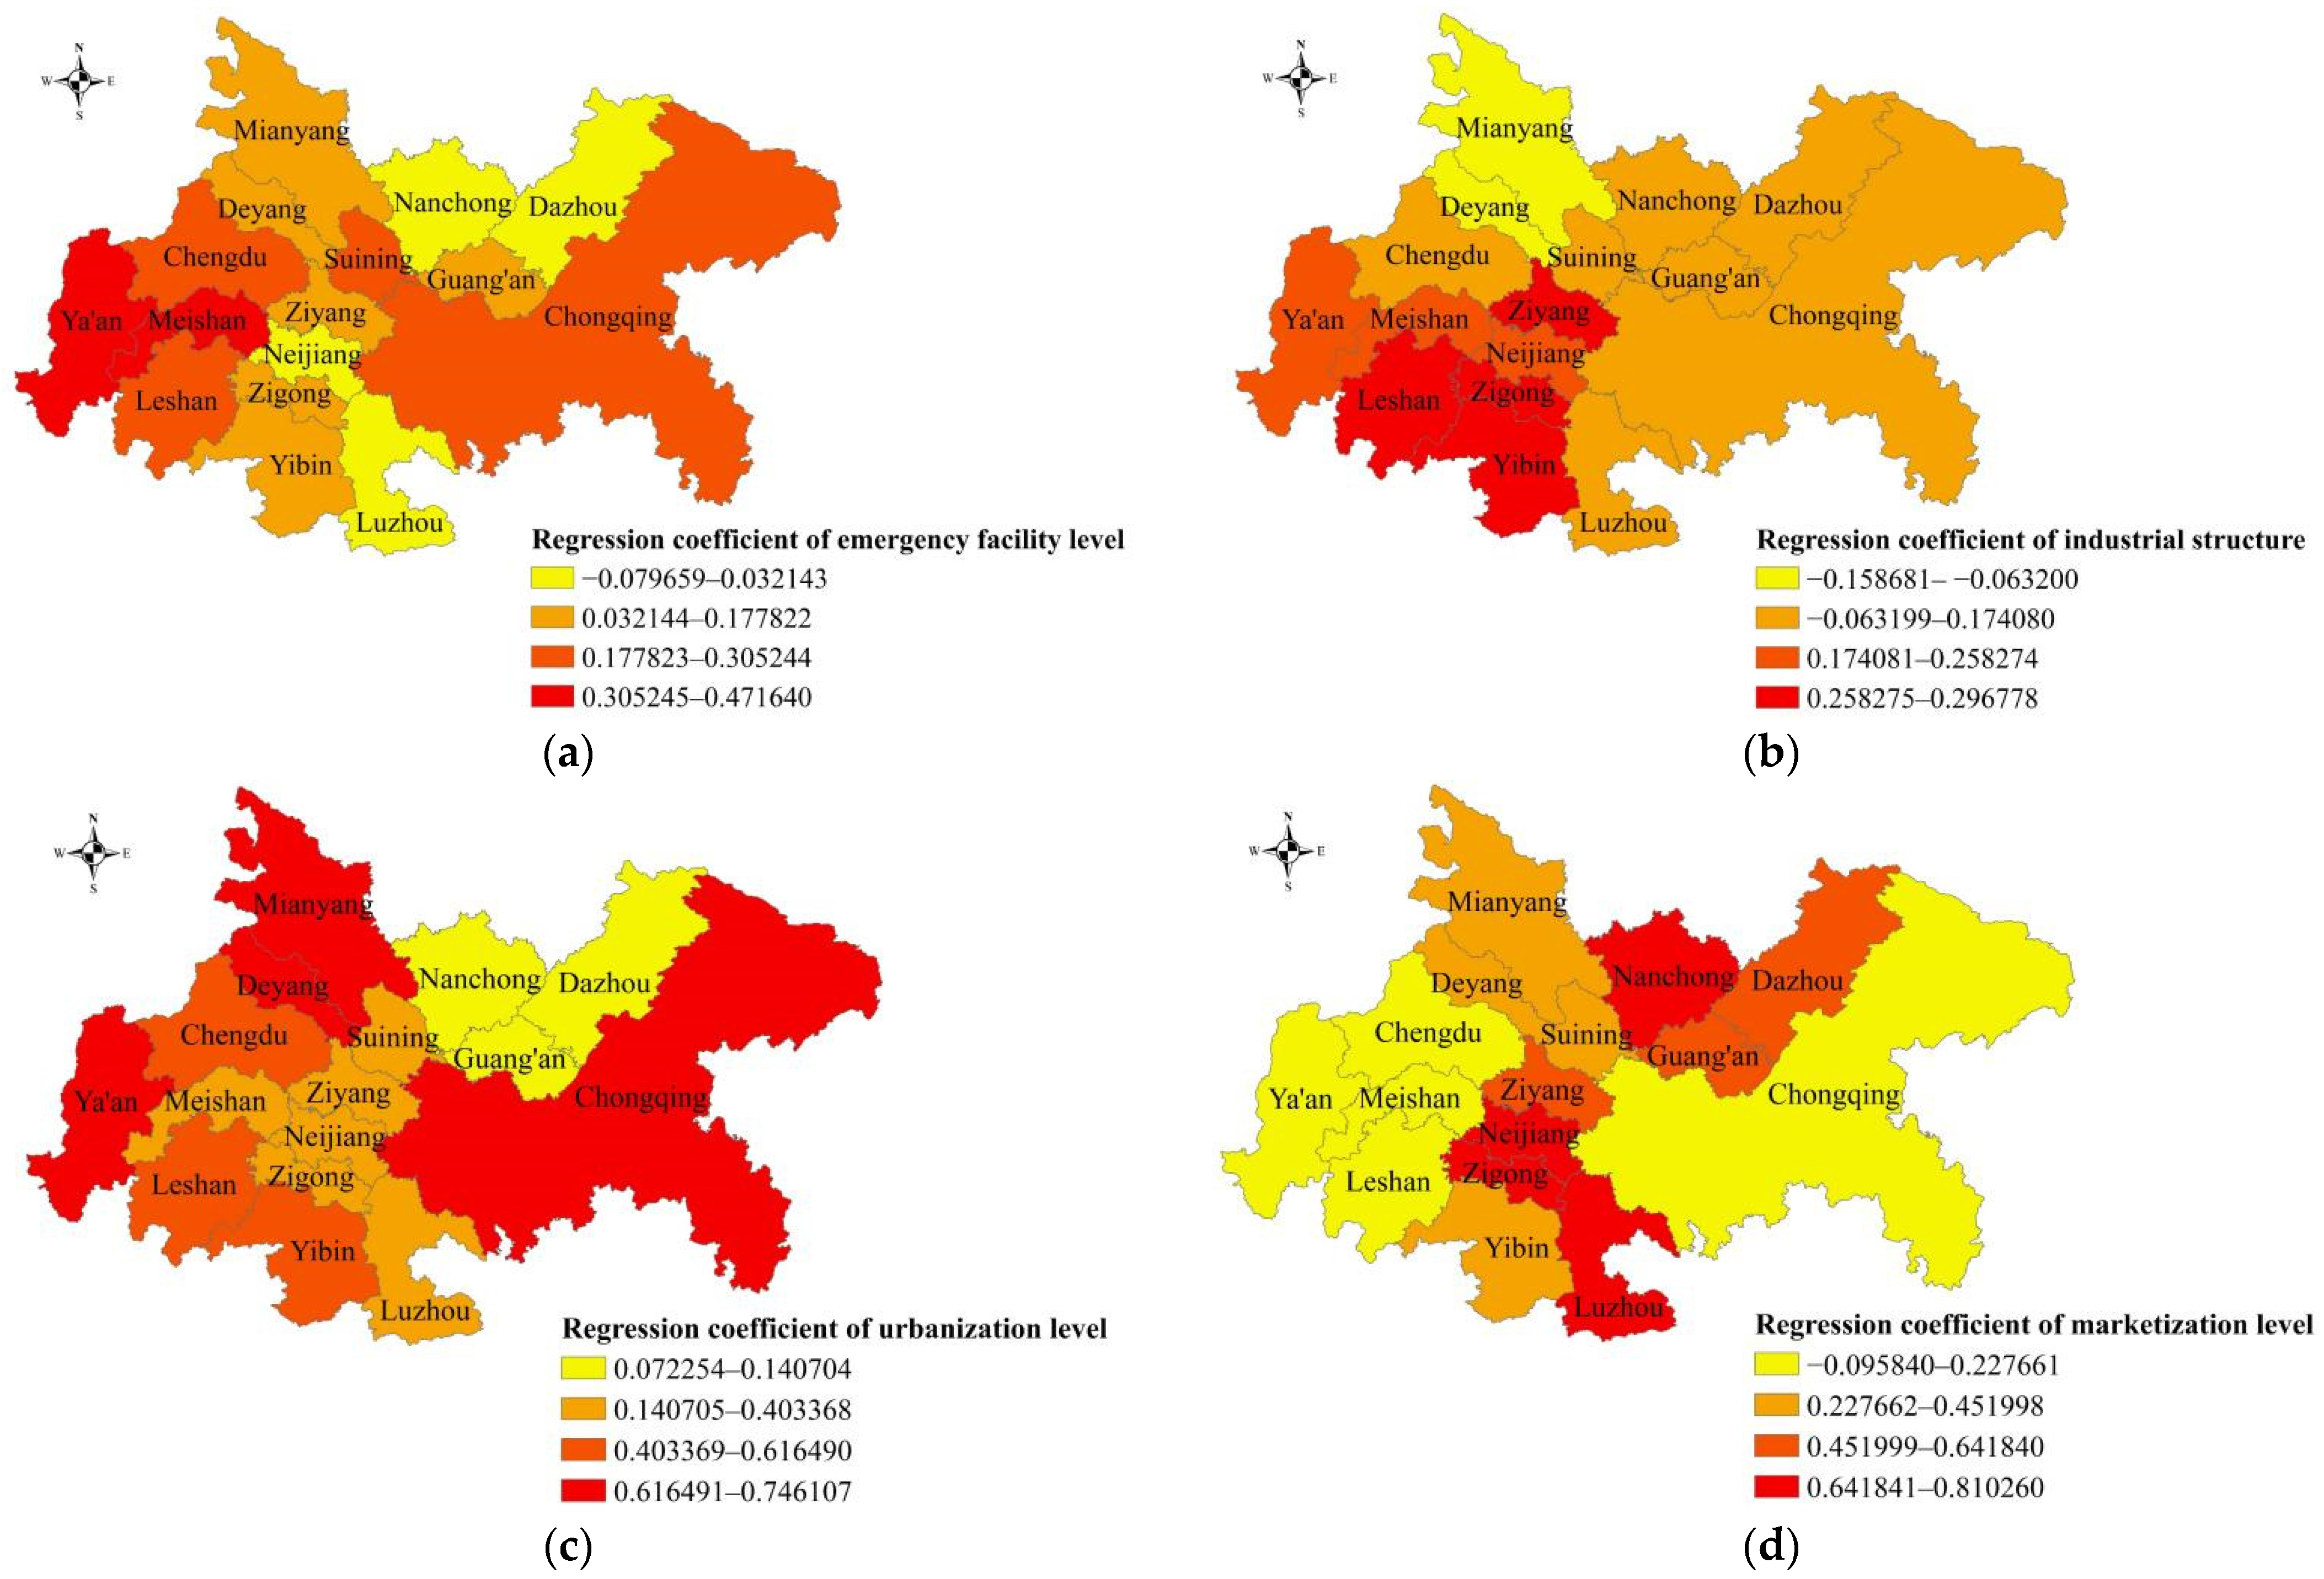
Thirdly, by exploring the influencing factors of urban resilience in the study area, this paper finds that the level of openness has a negative impact on urban resilience. The study by Ma et al. (2022) [55] also confirmed this finding, arguing that the level of opening to the outside world has a negative impact on inland cities. This is mainly due to the relatively low level of opening to the outside world in most inland cities, and the relatively single and fragile economic system. The increase in the level of openness will have an impact on the urban economic system and reduce the overall resilience of the city. Meanwhile, this paper also explores and finds that influencing factors such as urbanization level, emergency facility level, and industrial structure have positive impacts on the improvement of urban resilience, which is consistent with the findings of Dong et al. (2020) [60], Khan et al. (2021) [36], and Ghouchani et al. (2021) [61]. On this basis, this paper further explores the temporal and spatial heterogeneity of influencing factors on urban resilience. It makes up for the deficiency of Chen et al.’s (2021) [54] research on the influence of influencing factors on different resilience levels, deepens the research on the influencing factors of urban resilience, and enriches the research results of the influencing factors of urban resilience.

5.2. Development Proposals

Based on the above findings, aiming at the sustainable development of cities in the area, this paper proposes the following development recommendations:
Firstly, innovate the opening-up mechanism and development mode, and promote social and economic development. The study area is located in the western inland area, and the level of social and economic is the main driving factor of urban resilience. Actively implementing the strategy of expanding opening-up, innovating the opening-up mechanism, optimizing the internal industrial structure, and vigorously developing the inland open economy are effective ways to enhance urban resilience.
Secondly, accelerate the process of urbanization and improve the level of urbanization. For the cities in the area with a relatively low level of urbanization, promoting new urbanization can strengthen urban space design and planning, rationally allocate population and natural resources, and improve infrastructure construction, which is important for improving urban resilience.
Thirdly, give play to the leading role of the government and formulate urban development plans rationally. There is a large gap in resilience levels among cities in the region, and the effects of various influencing factors also have obvious spatial heterogeneity. Each city government should actively take the lead, correctly grasp their own level of resilience, and formulate urban development plans with different focuses. Chengdu, Chongqing, and other cities with high resilience levels in the region should focus on the urbanization development and emergency facility construction that have a great impact on them, while cities with relatively low resilience levels in the region, such as Luzhou, Dazhou, and Guang’an, should focus on the optimization of industrial structure and the promotion of social and economic levels to effectively improve urban resilience.
Fourthly, strengthen regional coordinated development and solve the problem of large gaps in urban resilience between different cities. For the coordinated development of urban resilience in the area, it is necessary to comprehensively consider the demands of various cities, build a regional spatial cooperation mechanism, enhance the spatial spillover effect of talents, technology, capital and other resources in Chongqing, Chengdu, and other high-resilience cities, and overcome the siphon effect to realize the integrated improvement of urban resilience within the Chengdu–Chongqing urban agglomeration.
Finally, put emphasis on scientific and technological innovation and speed up the improvement of urban resilience. Technological innovation is a boost to the improvement of urban resilience, but the technological innovation capability of the area is relatively low and has no significant effect on the improvement of urban resilience. It is necessary to increase policy support for scientific and technological innovation and build a promotion mechanism for scientific and technological innovation to improve urban resilience, so as to make urban governance more scientific and modern and help improve the urban resilience of the area.

6. Conclusions

This paper comprehensively evaluates the urban resilience and analyzes the relevant influencing factors of urban resilience in the Chengdu–Chongqing urban agglomeration. The study is concluded as follows: first, the urban resilience of the 16 cities has improved significantly, showing an evolutionary trend from low resilience to high resilience. Second, there are obvious spatial differences in the resilience levels of cities in the study area, but with the continuous narrowing of regional social and economic gaps, the spatial differences and uneven development of urban resilience have been weakening. Third, the city’s administrative level, marketization level, industrial structure, population density, urbanization level, and emergency facility level all play a significant role in promoting urban resilience, but the opening level and credit level inhibit the improvement of urban resilience in the area. Fourth, the effect of influencing factors has obvious temporal and spatial heterogeneity. The effect of influencing factors such as marketization level, industrial structure, urbanization level, and emergency facility level on urban resilience changes with time and space.
This research has a certain decision-making support for the improvement of the urban resilience level of the Chengdu–Chongqing urban agglomeration, has a certain reference significance for the resilience development of other cities in western and southwestern China, and has a certain reference value for the resilience research of inland cities. At the same time, follow-up research can explore urban resilience more deeply and comprehensively from the following aspects: first, follow-up research can further refine the research objects, locate the research objects in towns or communities, and conduct more in-depth research; second, follow-up research can fully consider the important components of the city such as policy, culture, and natural environment, and build a more comprehensive urban resilience assessment framework; and finally, follow-up research may not be limited to social and economic factors, and should further comprehensively explore the influencing factors of urban resilience and conduct more comprehensive exploratory research on effective ways to improve urban resilience.

Author Contributions

Conceptualization, B.W.; methodology, S.H.; software, S.H.; formal analysis, Y.A.; investigation, F.L.; resources, B.W.; data curation, F.L. and B.W.; writing—original draft preparation, S.H.; writing—review and editing, F.L. and B.W.; supervision, Y.A. All authors have read and agreed to the published version of the manuscript.

Funding

This research was funded by the Sichuan Science and Technology Program (2022JDR0229), National Natural Science Foundation of China (72171028), and Sichuan Mineral Resources Research Center (SCKCZY2022-YB001).

Institutional Review Board Statement

Not applicable.

Informed Consent Statement

Not applicable.

Data Availability Statement

Not applicable.

Conflicts of Interest

The authors declare no conflict of interest.

References

  1. Zanotti, L.; Ma, Z.; Johnson, J.L.; Johnson, D.R.; Yu, D.J.; Burnham, M.; Carothers, C. Sustainability, resilience, adaptation, and transformation: Tensions and plural approaches. Ecol. Soc. 2020, 25, 4. [Google Scholar] [CrossRef]
  2. United Nations Department of Economic and Social Affairs. World Urbanization Outlook Report: The World’s Urban Population Will Increase by 2.5 Billion by 2050. Available online: https://www.un.org/development/desa/zh/news/population/world-urbanization-prospects-2014.html (accessed on 16 March 2022).
  3. Guo, P.; Li, Q.; Guo, H.; Li, H.; Yang, L. A Bibliometric and Visual Analysis of Global Urban Resilience Research in 2011–2020: Development and Hotspots. Sustainability 2022, 14, 229. [Google Scholar] [CrossRef]
  4. Panda, A. Foreward. In Proceedings of the 8th International Conference on Building Resilience, ICBR, Lisbon, Portugal, 14–16 November 2018. [Google Scholar]
  5. Mallick, S.K. Prediction-Adaptation-Resilience (PAR) approach—A new pathway towards future resilience and sustainable development of urban landscape. Geogr. Sustain. 2021, 2, 127–133. [Google Scholar] [CrossRef]
  6. Cardoso, M.A.; Brito, R.S.; Pereira, C.; Gonzalez, A.; Stevens, J.; Telhado, M.J. RAF Resilience Assessment Framework—A Tool to Support Cities’ Action Planning. Sustainability 2020, 12, 2349. [Google Scholar] [CrossRef] [Green Version]
  7. Meerow, S.; Newell, J.P.; Stults, M. Defining urban resilience: A review. Landsc. Urban Plan. 2016, 147, 38–49. [Google Scholar] [CrossRef]
  8. Bruzzone, M.; Dameri, R.P.; Demartini, P. Resilience Reporting for Sustainable Development in Cities. Sustainability 2021, 13, 7824. [Google Scholar] [CrossRef]
  9. China Government Net. The 14th Five-Year Plan for National Economic and Social Development of the People’s Republic of China and Outline of the Vision for 2035. Available online: http://www.gov.cn/xinwen/2021-03/13/content_5592681.htm (accessed on 16 March 2022).
  10. United Nations Conventions and Declarations Retrieval System. New Urban Agenda: Quito Declaration on Sustainable Cities and Human Settlements for All. Available online: https://www.un.org/zh/documents/treaty/files/A-RES-71-256.shtml (accessed on 16 March 2022).
  11. PR Newswire. Rockefeller Foundation Launches 100 Cities Resilience Competition. Available online: https://www.prnasia.com/story/79454-1.shtml (accessed on 16 March 2022).
  12. Brunetta, G.; Ceravolo, R.; Barbieri, C.A.; Borghini, A.; de Carlo, F.; Mela, A.; Beltramo, S.; Longhi, A.; De Lucia, G.; Ferraris, S.; et al. Territorial Resilience: Toward a Proactive Meaning for Spatial Planning. Sustainability 2019, 11, 2286. [Google Scholar] [CrossRef] [Green Version]
  13. Jabareen, Y. Planning the resilient city:Concepts and strategies for coping with climate change and environmental risk. Cities 2013, 31, 220–229. [Google Scholar] [CrossRef]
  14. Lam, N.S.-N.; Arenas, H.; Brito, P.L.; Liu, K.-B. Assessment of vulnerability and adaptive capacity to coastal hazards in the Caribbean Region. J. Coast. Res. 2014, 70, 473–478. [Google Scholar] [CrossRef]
  15. Motesharrei, S.; Rivas, J.; Kalnay, E.; Asrar, G.R.; Busalacchi, A.G.; Cahalan, R.F.; Cane, M.A.; Colwell, R.R.; Feng, K.; Franklin, R.S. Modeling sustainability: Population, inequality, consumption, and bidirectional coupling of the Earth and Human Systems. Natl. Sci. Rev. 2016, 3, 470–494. [Google Scholar] [CrossRef] [Green Version]
  16. McGill, R. Urban resilience—An urban management perspective. Urban Manag. 2020, 9, 372–381. [Google Scholar] [CrossRef]
  17. Sarker, M.N.I.; Peng, Y.; Yiran, C.; Shouse, R.C. Disaster resilience through big data: Way to environmental sustainability. Int. J. Disaster Risk Reduct. 2020, 51, 101769. [Google Scholar] [CrossRef]
  18. Monstadt, J.; Schmidt, M. Urban resilience in the making? The governance of critical infrastructures in German cities. Urban Stud. 2019, 56, 2353–2371. [Google Scholar] [CrossRef] [Green Version]
  19. Bueno, S.; Bañuls, V.A.; Gallego, M.D. Is urban resilience a phenomenon on the rise? A systematic literature review for the years 2019 and 2020 using textometry. Int. J. Disaster Risk Reduct. 2021, 66, 102588. [Google Scholar] [CrossRef]
  20. Sharifi, A.; Chelleri, L.; Fox-Lent, C.; Grafakos, S.; Pathak, M.; Olazabal, M.; Moloney, S.; Yumagulova, L.; Yamagata, Y. Conceptualizing Dimensions and Characteristics of Urban Resilience: Insights from a Co-Design Process. Sustainability 2017, 9, 1032. [Google Scholar] [CrossRef] [Green Version]
  21. Serre, D.; Heinzlef, C. Assessing and mapping urban resilience to floods with respect to cascading effects through critical infrastructure networks. Int. J. Disaster Risk Reduct. 2018, 30, 235–243. [Google Scholar] [CrossRef]
  22. Tong, P. Characteristics, dimensions and methods of current assessment for urban resilience to climate-related disasters: A systematic review of the literature. Int. J. Disaster Risk Reduct. 2021, 60, 102276. [Google Scholar] [CrossRef]
  23. Mujuni, F.; Betts, T.; To, L.S.; Blanchard, R.E. Resilience a means to development: A resilience assessment framework and a catalogue of indicators. Renew. Sustain. Energy Rev. 2021, 152, 111684. [Google Scholar] [CrossRef]
  24. Grantham, T.E.; Matthews, J.H.; Bledsoe, B.P. Shifting currents: Managing freshwater systems for ecological resilience in a changing climate. Water Secur. 2019, 8, 100049. [Google Scholar] [CrossRef]
  25. Aoki, N. Adaptive governance for resilience in the wake of the 2011 great east Japan earthquake and tsunami. Habitat Int. 2016, 52, 20–25. [Google Scholar] [CrossRef]
  26. Ruan, J.; Chen, Y.B.; Yang, Z.W. Assessment of temporal and spatial progress of urban resilience in Guangzhou under rainstorm scenarios. Int. J. Disaster Risk Reduct. 2021, 66, 102578. [Google Scholar] [CrossRef]
  27. Hudec, O.; Reggiani, A.; Šiserová, M. Resilience capacity and vulnerability: A joint analysis with reference to Slovak urban districts. Cities 2018, 73, 24–35. [Google Scholar] [CrossRef]
  28. Suárez, M.; Gómez-Baggethun, E.; Benayas, J.; Tilbury, D. Towards an urban resilience Index: A case study in 50 Spanish cities. Sustainability 2016, 8, 774. [Google Scholar] [CrossRef] [Green Version]
  29. Joerin, J.; Shaw, R.; Takeuchi, Y.; Krishnamurthy, R. The adoption of a climate disaster resilience index in Chennai, India. Disasters 2014, 38, 540–561. [Google Scholar] [CrossRef] [PubMed]
  30. Xiu, C.L.; Wei, Y.; Wang, Q. Evaluation of urban resilience of Dalian city based on the perspective of “Size-Density-Morphology”. Acta Geogr. Sin. 2018, 73, 2315–2328. (In Chinese) [Google Scholar]
  31. Scherzer, S.; Lujala, P.; Rød, J.K. A community resilience index for Norway: An adaptation of the Baseline Resilience Indicators for Communities (BRIC). Int. J. Disaster Risk Reduct. 2019, 36, 101107. [Google Scholar] [CrossRef]
  32. Mallick, S.K.; Das, P.; Maity, B.; Rudra, S.; Pramanik, M.; Pradhan, B.; Sahana, M. Understanding future urban growth, urban resilience and sustainable development of small cities using prediction-adaptation-resilience (PAR) approach. Sustain. Cities Soc. 2021, 74, 103196. [Google Scholar] [CrossRef]
  33. Zhao, R.D.; Fang, C.L.; Liu, H.M. Progress and prospect of urban resilience research. Prog. Geogr. 2020, 39, 1717–1731. [Google Scholar] [CrossRef]
  34. Das, S.; Dsouza, N.M. Identifying the local factors of resilience during cyclone Hudhud and Phailin on the east coast of India, Ambio. J. Urban Plan. Dev. 2020, 49, 950–961. [Google Scholar] [CrossRef]
  35. Liu, L.; Luo, Y.; Pei, J.; Wang, H.; Li, J.; Li, Y. Temporal and Spatial Differentiation in Urban Resilience and Its Influencing Factors in Henan Province. Sustainability 2021, 13, 12460. [Google Scholar] [CrossRef]
  36. Khan, M.; Wu, Q.; Yan, S.Q.; Peng, J.C. Factors Affecting Urban Resilience and Sustainability: Case of Slum Dwellers in Islamabad, Pakistan. J. Urban Plan. Dev. 2021, 147, 040211053. [Google Scholar] [CrossRef]
  37. Moradi, A.; Bidhendi, G.R.N.; Safavi, Y. Effective environment indicators on improving the resilience of Mashhad neighborhoods. Int. J. Environ. Sci. Technol. 2021, 18, 2441–2458. [Google Scholar] [CrossRef]
  38. China Government Net. The Central Committee of the Communist Party of China and the State Council issued the “Outline of the Construction Plan for the Chengdu-Chongqing Economic Circle”. Available online: http://www.gov.cn/gongbao/content/2021/content_5649727.htm (accessed on 20 March 2022).
  39. Xinhua Net Sichuan. In 2021, the Chengdu-Chongqing Shuangcheng Economic Circle Will Achieve a Regional GDP of 7,391.92 Billion Yuan. Available online: http://sc.news.cn/content/2022-03/29/c_1128511978.htm (accessed on 20 March 2022).
  40. China Government Net. Ministry of Emergency Management of the People’s Republic of China: The Ministry of Emergency Management released the basic situation of national natural disasters in 2021. Available online: https://www.mem.gov.cn/xw/yjglbgzdt/202201/t20220123_407204.shtml (accessed on 20 March 2022).
  41. Kumar, R.; Singh, S.; Bilga, P.S.; Jatin; Singh, J.; Singh, S.; Scutaru, M.-L.; Pruncu, C.I. Revealing the benefits of entropy weights method for multi-objective optimization in machining operations: A critical review. J. Mater. Res. Technol. 2021, 10, 1471–1492. [Google Scholar] [CrossRef]
  42. Simmons, D.E.; Coon, J.P.; Datta, A. The von Neumann Theil index: Characterizing graph centralization using the von Neumann index. J. Complex Netw. 2018, 6, 859–876. [Google Scholar] [CrossRef]
  43. Taşyürek, M.; Çelik, M. FastGTWR: Hızlı coğrafi ve zamansal ağırlıklı regresyon yaklaşımı. Gazi Üniversitesi Mühendislik Mimar. Fakültesi Derg. 2021, 36, 715–726. [Google Scholar] [CrossRef]
  44. Hosseini, S.; Barker, K.; Ramirez-Marquez, J.E. A review of definitions and measures of system resilience. Reliab. Eng. Syst. Saf. 2016, 145, 47–61. [Google Scholar] [CrossRef]
  45. Shen, L.Y.; Ochoa, J.J.; Shah, M.N.; Zhang, X.L. The Application of Urban Sustainability Indicators—A Comparison between Various Practices. Habitat Int. 2011, 35, 17–29. [Google Scholar] [CrossRef]
  46. Xun, X.L.; Yuan, Y.B. Research on the urban resilience evaluation with hybrid multiple attribute TOPSIS method: An example in China. Nat. Hazards 2020, 103, 557–577. [Google Scholar] [CrossRef]
  47. Opach, T.; Scherzer, S.; Lujala, P.; Rød, J.K. Seeking commonalities of community resilience to natural hazards: A cluster analysis approach. Nor. Geogr. Tidsskr. Nor. J. Geogr. 2020, 74, 181–199. [Google Scholar] [CrossRef]
  48. Liu, X.L.; Li, S.J.; Luo, J.S. Integrated natural disasters urban resilience evaluation: The case of China. Nat. Hazards 2021, 107, 2105–2122. [Google Scholar] [CrossRef]
  49. Parsons, M.; Glavac, S.; Hastings, P.; Marshall, G.; McGregor, J.; McNeill, J.; Morley, P.; Morley, I.; Stayner, R. Top-down assessment of disaster resilience: A conceptual framework using coping and adaptive capacities. Int. J. Disaster Risk Reduction. 2016, 19, 1–11. [Google Scholar] [CrossRef] [Green Version]
  50. Javadpoor, M.; Sharifi, A.; Roosta, M. An adaptation of the Baseline Resilience Indicators for Communities (BRIC) for assessing resilience of Iranian provinces. Int. J. Disaster Risk Reduct. 2021, 66, 102609. [Google Scholar] [CrossRef]
  51. Rus, K.; Kilar, V.; Koren, D. Resilience assessment of complex urban systems to natural disasters: A new literature review. Int. J. Disaster Risk Reduct. 2018, 31, 311–330. [Google Scholar] [CrossRef]
  52. Fan, J.; Mo, Y.; Cai, Y.; Zhao, Y.; Su, D. Evaluation of Community Resilience in Rural China—Taking Licheng Subdistrict, Guangzhou as an Example. Int. J. Environ. Res. Public Health 2021, 18, 5827. [Google Scholar] [CrossRef] [PubMed]
  53. Kammouh, O.; Noori, A.Z.; Cimellaro, G.P.; Mahin, S.A. Resilience assessment of urban communities. ASCE-ASME J. Risk Uncertain. Eng. Syst. Part A Civ. Eng. 2019, 5, 04019002. [Google Scholar] [CrossRef] [Green Version]
  54. Chen, Y.; Zhu, M.; Zhou, Q.; Qiao, Y. Research on Spatiotemporal Differentiation and Influence Mechanism of Urban Resilience in China Based on MGWR Model. Int. J. Environ. Res. Public Health 2021, 18, 1056. [Google Scholar] [CrossRef]
  55. Ma, X.; Chen, X.; Du, Y.; Zhu, X.; Dai, Y.; Li, X.; Zhang, R.; Wang, Y. Evaluation of Urban Spatial Resilience and Its Influencing Factors: Case Study of the Harbin–Changchun Urban Agglomeration in China. Sustainability 2022, 14, 2899. [Google Scholar] [CrossRef]
  56. Chen, Y.; Su, X.; Zhou, Q. Study on the Spatiotemporal Evolution and Influencing Factors of Urban Resilience in the Yellow River Basin. Int. J. Environ. Res. Public Health 2021, 18, 10231. [Google Scholar] [CrossRef]
  57. Zheng, Y.; Xie, X.L.; Lin, C.Z.; Wang, M.; He, X.J. Development as adaptation: Framing and measuring urban resilience in Beijing. Adv. Clim. Change Res. 2018, 9, 234–242. [Google Scholar] [CrossRef]
  58. Ma, F.; Wang, Z.; Sun, Q.; Yuen, K.F.; Zhang, Y.; Xue, H.; Zhao, S. Spatial–Temporal Evolution of Urban Resilience and Its Influencing Factors: Evidence from the Guanzhong Plain Urban Agglomeration. Sustainability 2020, 12, 2593. [Google Scholar] [CrossRef] [Green Version]
  59. Zhang, M.; Chen, W.; Cai, K.; Gao, X.; Zhang, X.; Liu, J.; Wang, Z.; Li, D. Analysis of the Spatial Distribution Characteristics of Urban Resilience and Its Influencing Factors: A Case Study of 56 Cities in China. Int. J. Environ. Res. Public Health 2019, 16, 4442. [Google Scholar] [CrossRef] [PubMed] [Green Version]
  60. Dong, L.J.; Su, F.; Wen, Y.Q.; Wang, Y.C. Obstacle Factors and Evolution of Urban Economic Resilience of Fuxin Shrinking City and Its Obstacle Factors. Sci. Geogr. Sin. 2020, 40, 1142–1149. [Google Scholar]
  61. Ghouchani, M.; Taji, M.; Roshan, A.Y.; Chehr, M.S. Identification and assessment of hidden capacities of urban resilience. Environ. Dev. Sustain. 2021, 23, 3966–3993. [Google Scholar] [CrossRef]
Figure 1. Study area.
Buildings 12 00962 g001
Figure 2. Average value of regional overall resilience and subsystem resilience of the Chengdu–Chongqing urban agglomeration from 2005 to 2019.
Buildings 12 00962 g002
Figure 3. Spatial evolution of urban resilience in the Chengdu–Chongqing urban agglomeration. (a) 2005. (b) 2010. (c) 2015. (d) 2019.
Buildings 12 00962 g003
Figure 4. Theil index of urban resilience in the Chengdu–Chongqing urban agglomeration from 2005 to 2019.
Buildings 12 00962 g004
Figure 5. Spatial distribution of the mean value of regression coefficients of influencing factors from 2005 to 2019. (a) Emergency facility level. (b) Industrial structure. (c) Urbanization level. (d) Marketization level.
Buildings 12 00962 g005
Table 1. Evaluation Index System.
Target LayerCriterion LayerIndicator LayerIndicator Nature
Overall resilienceEconomic resiliencePer capita GDP (CNY) [46]+
Proportion of tertiary industry in GDP (%) [28]+
Per capita investment in fixed assets (CNY) [47]+
Dependence on foreign trade (%) [31]+
Proportion of fiscal revenue in GDP (%) [47]+
Per capita disposable income of urban residents (CNY) [37]+
Social resilienceUrbanization level (%) [48]+
Proportion of non-agricultural employed population (%) [29]+
Urban registered unemployment rate (%) [49]-
Number of college students per 10,000 (person) []+
Proportion of employees in public management and social organizations (%) [50]+
Number of hospital beds per 10,000 people (piece) [51]+
Ecological resilienceGreening coverage rate of built-up area (%) [52]+
Per capita green space area in municipal area (m2) [53]+
Industrial wastewater discharge per unit GDP (t) [54]-
Industrial sulfur dioxide emission per unit GDP (t) [54]-
Industrial smoke (dust) emission per unit GDP (t) [54]-
Centralized treatment rate of domestic sewage (%) [55]+
Comprehensive utilization rate of industrial solid waste (%) [52]+
Infrastructure resiliencePer capita water consumption (m3) [56]-
Per capita electricity consumption (kW·h) [56]-
Fixed Internet users per 10,000 people (households) [50]+
Gas penetration rate (%) [52]+
Per capita Road area (m2) [53]+
Density of drainage pipeline in built-up area (km/km2) [51]+
Table 2. Weights of Evaluation Indicators.
Target LayerCriterion LayerWeightIndicator LayerWeight
Overall resilienceEconomic resilience0.3549Per capita GDP (CNY)0.0818
Proportion of tertiary industry in GDP (%)0.0431
Per capita investment in fixed assets (CNY)0.0854
Dependence on foreign trade (%)0.0103
Proportion of fiscal revenue in GDP (%)0.0632
Per capita disposable income of urban residents (CNY)0.0711
Social resilience0.2979Urbanization level (%)0.0305
Proportion of non-agricultural employed population (%)0.0297
Urban registered unemployment rate (%)0.0286
Number of college students per 10,000 (person)0.1389
Proportion of employees in public management and social organizations (%)0.0112
Number of hospital beds per 10,000 people (piece)0.059
Ecological resilience0.1005Greening coverage rate of built-up area (%)0.0161
Per capita green space area in municipal area (m2)0.0287
Industrial wastewater discharge per unit GDP (t)0.0109
Industrial sulfur dioxide emission per unit GDP (t)0.0049
Industrial smoke (dust) emission per unit GDP (t)0.0045
Centralized treatment rate of domestic sewage (%)0.0245
Comprehensive utilization rate of industrial solid waste (%)0.0109
Infrastructure resilience0.2467Per capita water consumption (m3)0.0127
Per capita electricity consumption (kW·h)0.0099
Fixed Internet users per 10,000 people (households)0.1059
Gas penetration rate (%)0.0218
Per capita Road area (m2)0.0355
Density of drainage pipeline in built-up area (km / km2)0.0609
Table 3. Explanatory Variable Correlation and Multicollinearity Tests (Note: 1. The dependent variable is urban resilience; 2. ** implies critical at the level of 0.01; 3. According to the score of correlation coefficient, (0.7, 1) is strong correlation, (0.3, 0.7) is medium correlation, (0, 0.3) is weak correlation; 4. Referring to the judgment of ArcGIS on multicollinearity, when VIF > 10, the data index has multicollinearity).
VariableCorrelationMulticollinearity
Pearson CoefficientRelevance JudgmentToleranceVIFMulticollinearity Diagnostics
Administrative level (X1)0.171 **Significantly weak correlation0.5271.896No collinearity
Open level (X2)0.475 **Significant moderate correlation0.3263.066No collinearity
Marketization level (X3)0.934 **Significant strong correlation0.1337.520No collinearity
Science and education level (X4)−0.013No significant correlation0.7541.327No collinearity
Industrial structure (X5)0.750 **Significant strong correlation0.3033.305No collinearity
Credit level (X6)0.735 **Significant strong correlation0.2054.875No collinearity
Population density (X7)0.271 **Significantly weak correlation0.4362.294No collinearity
Urbanization level (X8)0.867 **Significant strong correlation0.1377.303No collinearity
Emergency facility level (X9)0.898 **Significant strong correlation0.1705.896No collinearity
Table 4. Urban Resilience Scores in the Chengdu–Chongqing Urban Agglomeration.
City2005201020152019
ScoresRankScoresRankScoresRankScoresRank
Chongqing0.33420.51420.67420.7812
Chengdu0.41410.56410.74410.8291
Zigong0.32230.39230.46260.626
Luzhou0.18980.28380.45270.5787
Deyang0.21550.34660.47350.6684
Mianyang0.22940.38140.53430.6763
Suining0.151100.264130.406130.52912
Neijiang0.15130.24160.369150.50815
Leshan0.17390.30670.42100.57510
Nanchong0.20170.28390.416120.52214
Meishan0.151110.276100.45180.5788
Yibin0.151120.275110.393140.53611
Guang’an0.131160.262140.418110.5779
Dazhou0.133150.257150.309160.44316
Ya’an0.21160.35750.51340.6555
Ziyang0.14140.268120.43490.52313
Table 5. Statistics of the effect of explanatory variables.
Average ValueMinimum ValueLower QuartileMedianUpper QuartileMaximum Value
X10.1224868−0.3816324−0.01350890.05446260.21021240.3274534
X2−0.0596576−0.5084665−0.2144015−0.07172840.05149280.4990566
X30.4984856−0.60777100.11694160.34064150.74091040.9372762
X50.1629620−0.22225580.04218960.16160270.26096060.7530721
X6−0.0913039−0.3589074−0.2115222−0.03240120.04460960.3195433
X70.0390264−0.4329643−0.1227017−0.02171100.07671050.3949507
X80.4631614−0.06548360.22033070.42604680.64253380.8057922
X90.1612041−0.07277280.04661730.14687030.29661930.5434512
Bandwidth0.114996N/AN/AN/AN/AN/A
AICc−271.289N/AN/AN/AN/AN/A
R20.9507N/AN/AN/AN/AN/A
Table 6. Mean Values of Regression Coefficients of Influencing Factors for Different Resilience Levels.
Low Resilience LevelGeneral Resilience LevelMedium Resilience LevelHigh Resilience Level
X10.160330.144110.142940.11298
X20.05192−0.05359−0.18342−0.27803
X30.636930.473390.104290.12712
X50.202460.138120.177770.25834
X6−0.09513−0.07018−0.13833−0.15987
X70.005000.08721−0.052800.04182
X80.206840.437470.798800.72370
X90.170990.180690.192080.26274
Publisher’s Note: MDPI stays neutral with regard to jurisdictional claims in published maps and institutional affiliations.

