Article

Using Machine Learning Method to Discover Hygrothermal Transfer Patterns from the Outside of the Wall to Interior Bamboo and Wood Composite Sheathing

1
Research Institute of Wood Industry, Institute of Ecological Conservation and Restoration, Chinese Academy of Forestry, Key Laboratory of Wood Science and Technology, National Forestry and Grassland Administration, Beijing 100091, China
2
School of Information Management, Dalarna University, 78189 Borlänge, Sweden
3
School of Software and Internet of Things Engineering, Jiangxi University of Finance and Economics, Nanchang 330013, China
4
Department of Bio-Materials, International Centre for Bamboo and Rattan, Key Laboratory of Bamboo and Rattan Science & Technology, National Forestry and Grassland Administration, Beijing 100102, China
*
Authors to whom correspondence should be addressed.
Buildings 2022, 12(7), 898; https://doi.org/10.3390/buildings12070898
Submission received: 26 May 2022 / Revised: 20 June 2022 / Accepted: 24 June 2022 / Published: 25 June 2022
(This article belongs to the Special Issue Engineered Wood and Bamboo Composites in Hybrid Buildings)

Abstract

:
To identify hygrothermal transfer patterns of exterior walls is a crucial issue in the design, assessment, and construction of buildings. Temperature and relative humidity, as sensor monitoring data, were collected from the outside of the wall to interior bamboo and wood composite sheathing over the year in Huangshan Mountain District, Anhui Province, China. Combining the machine learning method of reservoir computing (RC) with agglomerative hierarchical clustering (AHC), a novel clustering framework was built for better extraction of the characteristics of hygrothermal transfer on the time series data. The experimental results confirmed the hypothesis that the change in the temperature and relative humidity of the outside of the wall (RHT12) dominated the change of the interior sheathing (RHT11). The delay time between two adjacent peaks in temperature was 1 to 2 h, while that in relative humidity was 1 to 4 h from the outside of the wall to interior bamboo and wood composite sheathing. There was no significant difference in temperature peak delay time between April and July. Temperature peak delay time was 50 to 120 min. However, relative humidity peak delay time was 100 to 240 min in April, whereas it was 20 to 120 min in July. The impact formed a relatively linear relationship between outdoor temperature and relative humidity peak delay time. The hygrothermal transfer patterns were characterized effectively by the peak delays. The discovery of the hygrothermal transfer patterns for the bamboo and wood composite walls using the machine learning method will facilitate the development of energy-efficient and durable bamboo and wood composite wall materials and structures.

1. Introduction

Hygrothermal performance of exterior wall is a crucial issue in the design, assessment, and construction of energy-efficient buildings [1]. Because exterior wall assembly is an important part of the building envelope, its hygrothermal transfer patterns are closely related to building performance, including the building energy consumption [2,3], structural material corrosion resistance [4], comfort and health [5], and durability of materials [6]. When designing a building, it is necessary to conduct hygrothermal design and performance prediction for the exterior walls according to the climatic conditions of the building environment [7]. Consequently, developing hygrothermal transfer patterns for the buildings will support not only the architectural design but also a reasonable estimate of the building for life and maintenance.
To this end, sensor-based monitoring technology is used to efficiently collect the monitoring data of hygrothermal performance for a target building [8]. With a set of sensors installed at the different interfaces of the composite walls as a long-term field monitoring system [9,10,11], the data on temperature and relative humidity are collected to assist in continuously assessing hygrothermal performance of exterior walls in the field. The goal of the research on hygrothermal transfer patterns is to support the durability design of bamboo and wood composites walls so that this biomass building material can be used more sustainably in the future [12].
The prediction methods of hygrothermal performance mainly include theoretical models, software simulation, and machine learning. Developing models of hygrothermal prediction has been a research topic since the mid-20th century, and research on hygrothermal prediction in walls has focused on the development of simplified theoretical models based on certain assumptions about wall structure and materials, resulting in tractable physical models to solve hygrothermal problems [13,14,15,16]. Phillip and De Vries developed a hygrothermal prediction model based on the theory of soil moisture movement under temperature gradients [13]. Luikov proposed one-dimensional hygrothermal prediction governing equations, which more realistically reflect the hygrothermal transfer process in porous media [14]. To solve the discontinuity problem of wet capacity, many scholars have modified the Luikov model and used other driving potentials to replace wet capacity. For example, Pedersen used capillary pressure as driving potential [15] and Künzel used relative humidity as driving potential [16]. Heat transfer generally used temperature as the driving potential, while moisture transfer used many types of driving potentials, such as water vapor partial pressure, steam content, relative humidity, capillary pressure, and air moisture content. If the driving potential were different, the moisture transfer coefficient and other aspects would be quite different consequently. Although these models have relative limitations, the underlying logic is based on the same principles. Hygrothermal prediction models combine heat, moisture, and air transport through different mathematical equations, namely joint conservation of energy, conservation of mass, and conservation of momentum [17].
With the gradual maturity of the theoretical model of hygrothermal prediction, based on those theoretical models, hygrothermal prediction simulation software WUFI has been developed and widely used [18]. It has been proven that WUFI can be used in a wide range of building materials, such as lightweight timber-frame [19], cross-laminated timber [20], and bamboo-wood composite materials [21]. The physical parameters, such as water vapor diffusion resistance coefficient, heat transfer coefficient, and vacuum saturated water content, are used in the software to characterize hygrothermal dynamic variation, including moisture content, mold growth risk, and the building’s energy consumption of biochar-mortar composites [22]. Huang et al. studied the hygrothermal assessment of bamboo and wood envelope structures in different climatic zones using the WUFI program [23,24]. When bamboo is used as an envelope material, it has strong heat storage, vapor resistance, and weak heat transferability, which is suitable for use in hot and temperate regions. Therefore, hygrothermal transfer patterns need to be discovered and identified through the monitoring data analysis of bamboo composites wall.
However, few works have been done on the deep investigation of the hygrothermal transfer mechanism, particularly through big data analysis methods. Using the machine learning method to learn system behavior from observation data is an effective choice [25]. The artificial neural network (ANN) was widely used among several machine learning technologies because it has high precision to capture any physical process’s nonlinear and complex underlying characteristics. In many fields, artificial neural networks have been used successfully [26,27]. Neural networks have also played their advantages in building simulations. For example, Taffese et al. [4] used the NARX recurrent neural network structure and proposed a model to predict the hygrothermal performance of concrete with low error. The hygrothermal response of building components is transient and highly nonlinear. Astrid et al. [28,29,30] developed a meta-model to replace the hygrothermal model, and hygrothermal time series such as temperature, humidity, and moisture content can be directly predicted. The network reliably evaluated the future damage risks of walls and calculated the hygrothermal performance of 96 types of wood-frame walls.
Nowadays, machine learning methods have been widely applied to the construction fields. However, there is still a lack of sufficient applications to the hygrothermal transfer patterns based on the monitoring data from the sample buildings. Agglomerative hierarchical clustering (AHC) is one of the most popular clustering techniques in machine learning which provides a nice visualization tool, the dendrogram, where the dataset structure is explored and well understood. In addition, to tackle the clustering of multivariate time series (MTS) data, a novel approach, reservoir computing (RC), was proposed by Bianchi et al. [31]. RC generates MTS representations with an unsupervised procedure, which is called reservoir model space (RMS). The RMS can grasp the dynamic structure of MTS that is presented as data input, of which the outputs called the MTS representations to represent the input time series from the sequence of reservoir’s states. The representations were then used for AHC. However, it has not been verified whether these methods can extract hygrothermal transfer characteristics on time series data.
It is well known that the moisture content of the material is affected by the temperature and relative humidity of the interface layer of the wall, which is caused by the hygrothermal transfer of the building wall. Then, the major impact on the life of the building materials comes from the moisture and heat in nature. In this paper, the goal was to reveal the hygrothermal transfer patterns from the outside of the wall to interior wood and bamboo composite sheathing by analyzing the monitored data of temperature and relative humidity in the field. Firstly, a basic assumption is proposed that, given a strong change and impact of the temperature and relative humidity from the outside of the wall, the temperature and relative humidity interior of the wall will change accordingly. This change in temperature and relative humidity from the outside to the interior of the wall is caused by the hygrothermal transfer. Secondly, a certain time is required for the hygrothermal transfer from the outside to the interior of the wall. If it can be shown that any change in the temperature and relative humidity of the outside of the wall causes a corresponding change in the temperature and relative humidity of the interior wall, there is a hygrothermal transfer from the outside to the interior of the wall. An obvious way of proving this is to check the data on the temperature and relative humidity within a given day. Two questions need to be answered. The first one is if the two peak values can be monitored by two adjacent sensors, leading to a time difference between the two peak values for a given day. Another one is naturally in which direction, i.e., from the outside to the interior of the wall or the opposite, and for how long the hygrothermal transfer lasts, i.e., the peak delay time. If peak delay direction and delay time can be determined, then the hypothesis of the hygrothermal transfer pattern is valid, and the hygrothermal transfer pattern can be further quantified using the peak delay time.
Therefore, in this paper, combining the machine learning method of RC with AHC, a novel clustering framework was built for better extraction of the characteristics of hygrothermal transfer on the time series data. The existence of the hypothesis was proved. The direction of the hygrothermal transfer was determined. Peak delay times and the impact of the temperature on the relative humidity peak delay time were obtained to quantitatively reveal the hygrothermal transfer patterns. The research on hygrothermal transfer patterns is the basis for developing a hygrothermal prediction model based on the temperature and humidity dataset using machine learning methods in the next step. The ultimate goal of this research is to discover how and to what degree the environments (or climates) impact the building materials over a long period and hence to determine suitable guidelines of measures to sustain the building materials and prolong the life of buildings.

2. Experimental Dataset and Visualization

2.1. Description of Test Building and Wall Configuration

The building Hui-style (depicted in Figure 1a) is above Taiping Lake in Huangshan Mountain district, located in Anhui Province, China [11]. It has a beam and post structure (Figure 1b) with wood frame and brick walls fixed within the main structure. It is a demonstration of the modern Chinese Hui-style residential buildings, which is made of bamboo and Chinese fir building materials sourced from local forests. The building is completely in a natural state without heating and air conditioning to study the hygrothermal performance in the field under the regional climate conditions.
Wall assemblies were constructed with 40 mm × 90 mm Chinese fir lumber framing with studs spaced 400 mm (Figure 1c). The wall configuration included manufactured cladding, sheathing membrane, bamboo and wood composites sheathing, stud, insulation, and gypsum board (Figure 1d). All assemblies had structural panel sheathing consisting of 11 mm thickness bamboo and wood composites on the exterior of the framing and 10 mm interior gypsum board, which was finished with emulsion paint. The studs were filled with fiberglass insulation with an aluminum foil layer. The bamboo and wood composite sheathing of the exterior wall was covered with a vapor-permeable sheathing membrane to form the water-resistive barrier.

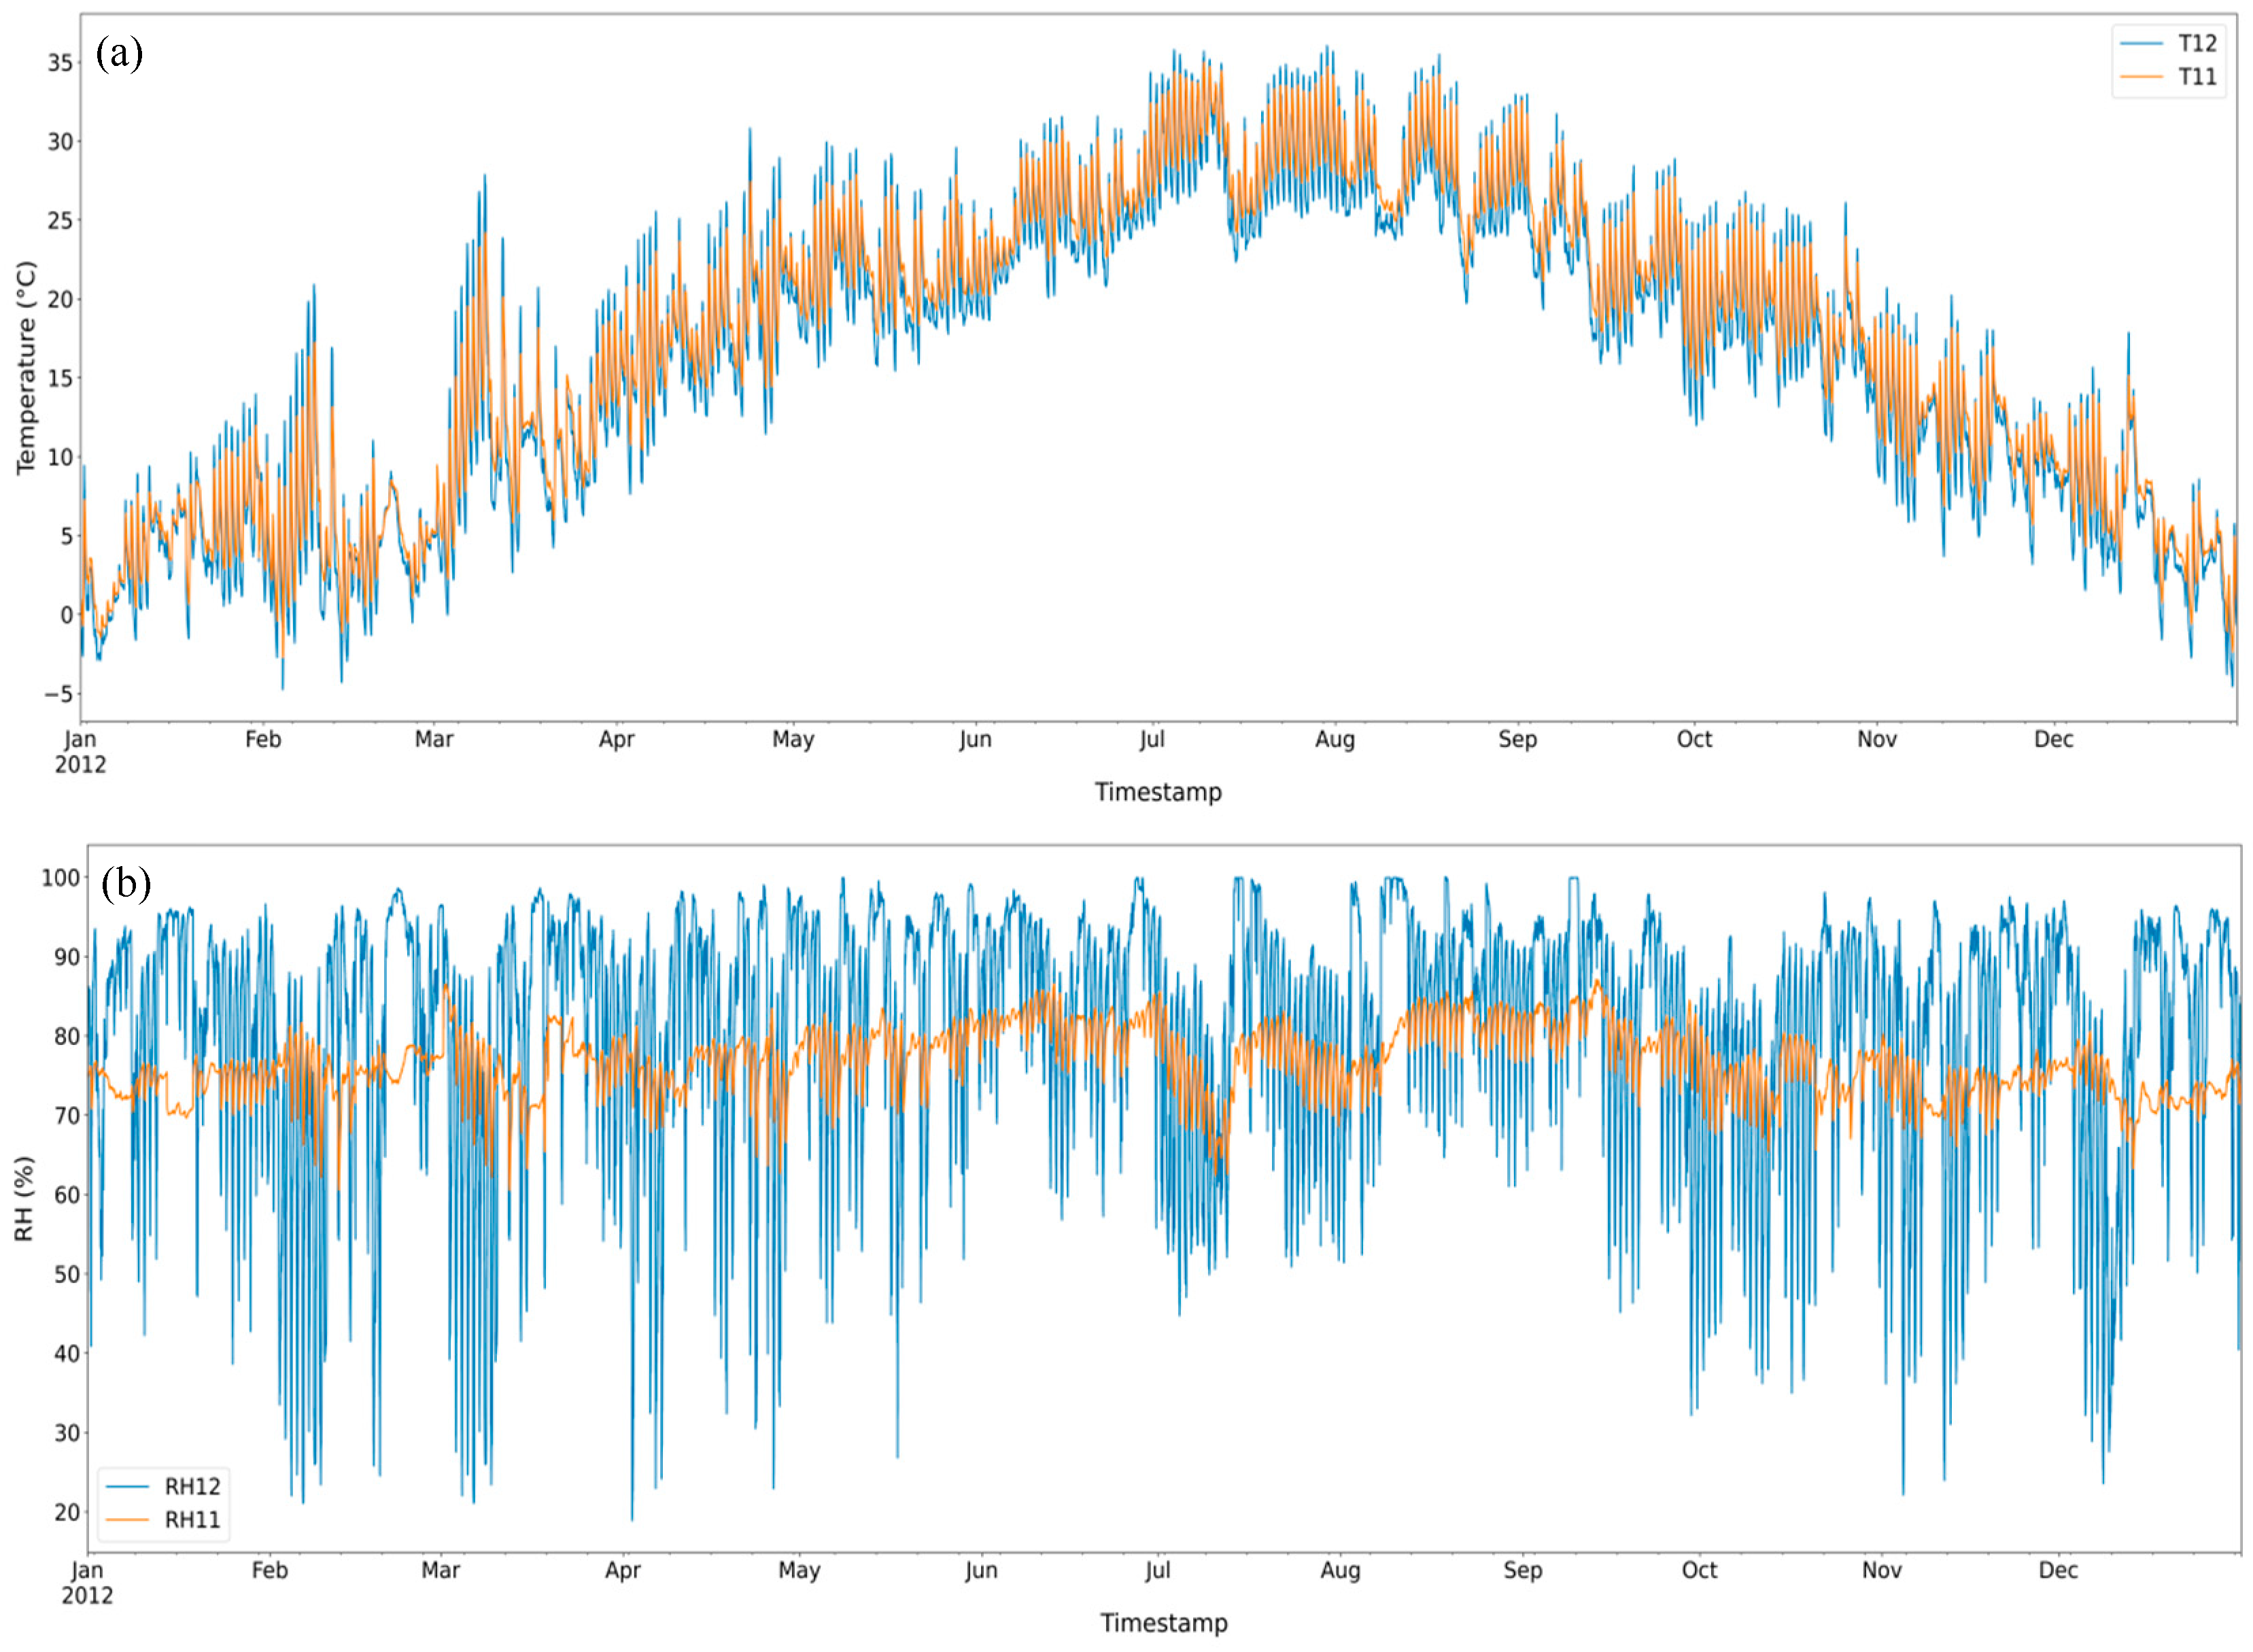
2.2. Temperature and Relative Humidity Measurements

A measurement system for the exterior wall in the field was established in 2012. The temperature and relative humidity of interface layers were measured by sixteen HygroClip S3 probes (0.1 °C and 0.1% resolution) at programmable 10 min intervals for each group (Figure 2). The sensor layout is shown in Figure 2a. The sensors have a temperature range from −40 °C to 60 °C and a relative humidity range of 0% to 100%. The sensors accuracy for temperature is ±0.4 °C and for relative humidity is ±1.5% at 23 °C. The monitoring data were collected and stored by Campbell’s CR1000 data collector.
Temperature and relative humidity sensors (RHT1–RHT16) were installed 300 mm from the top and bottom plates of the test wall in the different layers [8]. Three groups of sensors (RHT1–RHT12) were installed in three profiles of the north exterior wall on the first and second floors. One group of the sensor (RHT13–RHT16) was installed in one profile of the south exterior wall on the first floor. The data collected by RHT11 and RHT12 sensors (Figure 2a) in the north exterior wall on the first floor were analyzed in this paper. The locations of the sensors RHT11 and RHT12 in the field are shown in Figure 2b,c. The sensor layout of the outside of the wall is shown in Figure 2d. The monitoring data of sensors RHT11 and RHT12 were analyzed for the whole year 2012, to determine whether RHT12 dominated RHT11and how to evaluate the strength of the domination.

2.3. Visualization of the Experimental Dataset

The dataset used in this paper was collected from the two adjacent sensors RHT11 and RHT12 over the year 2012. Each sensor provides a pair of values of temperature and relative humidity. Considering the logging time of each sensor is 10 min, there are in total 144 observations a day, which means a total of 52,704 observations for the whole year. T11 and T12 are temperatures of the sensors RHT11 and RHT12. RH11 and RH12 are relative humidities of the sensors RHT11 and RHT12.
The whole year temperature and relative humidity are shown in Figure 3. Comparing temperature and relative humidity, T11 followed T12 (Figure 3a) closely while RH11 followed RH12 (Figure 3b) with a much smaller amplitude. Due to the barrier of materials and construction to heat and moisture, T11 and T12 were different at the same time, and so was RH11 and RH12. In addition, the drastic changes in temperature and relative humidity occurred in April and July, and the peak characteristics of temperature and relative humidity were more obvious every day, so the datasets of temperature and relative humidity in April and July as typical months were analyzed to provide a closer look at the hygrothermal transfer patterns to quantitatively characterize the transfer directions and the peak delay times.

3. Methodology and Data Analysis

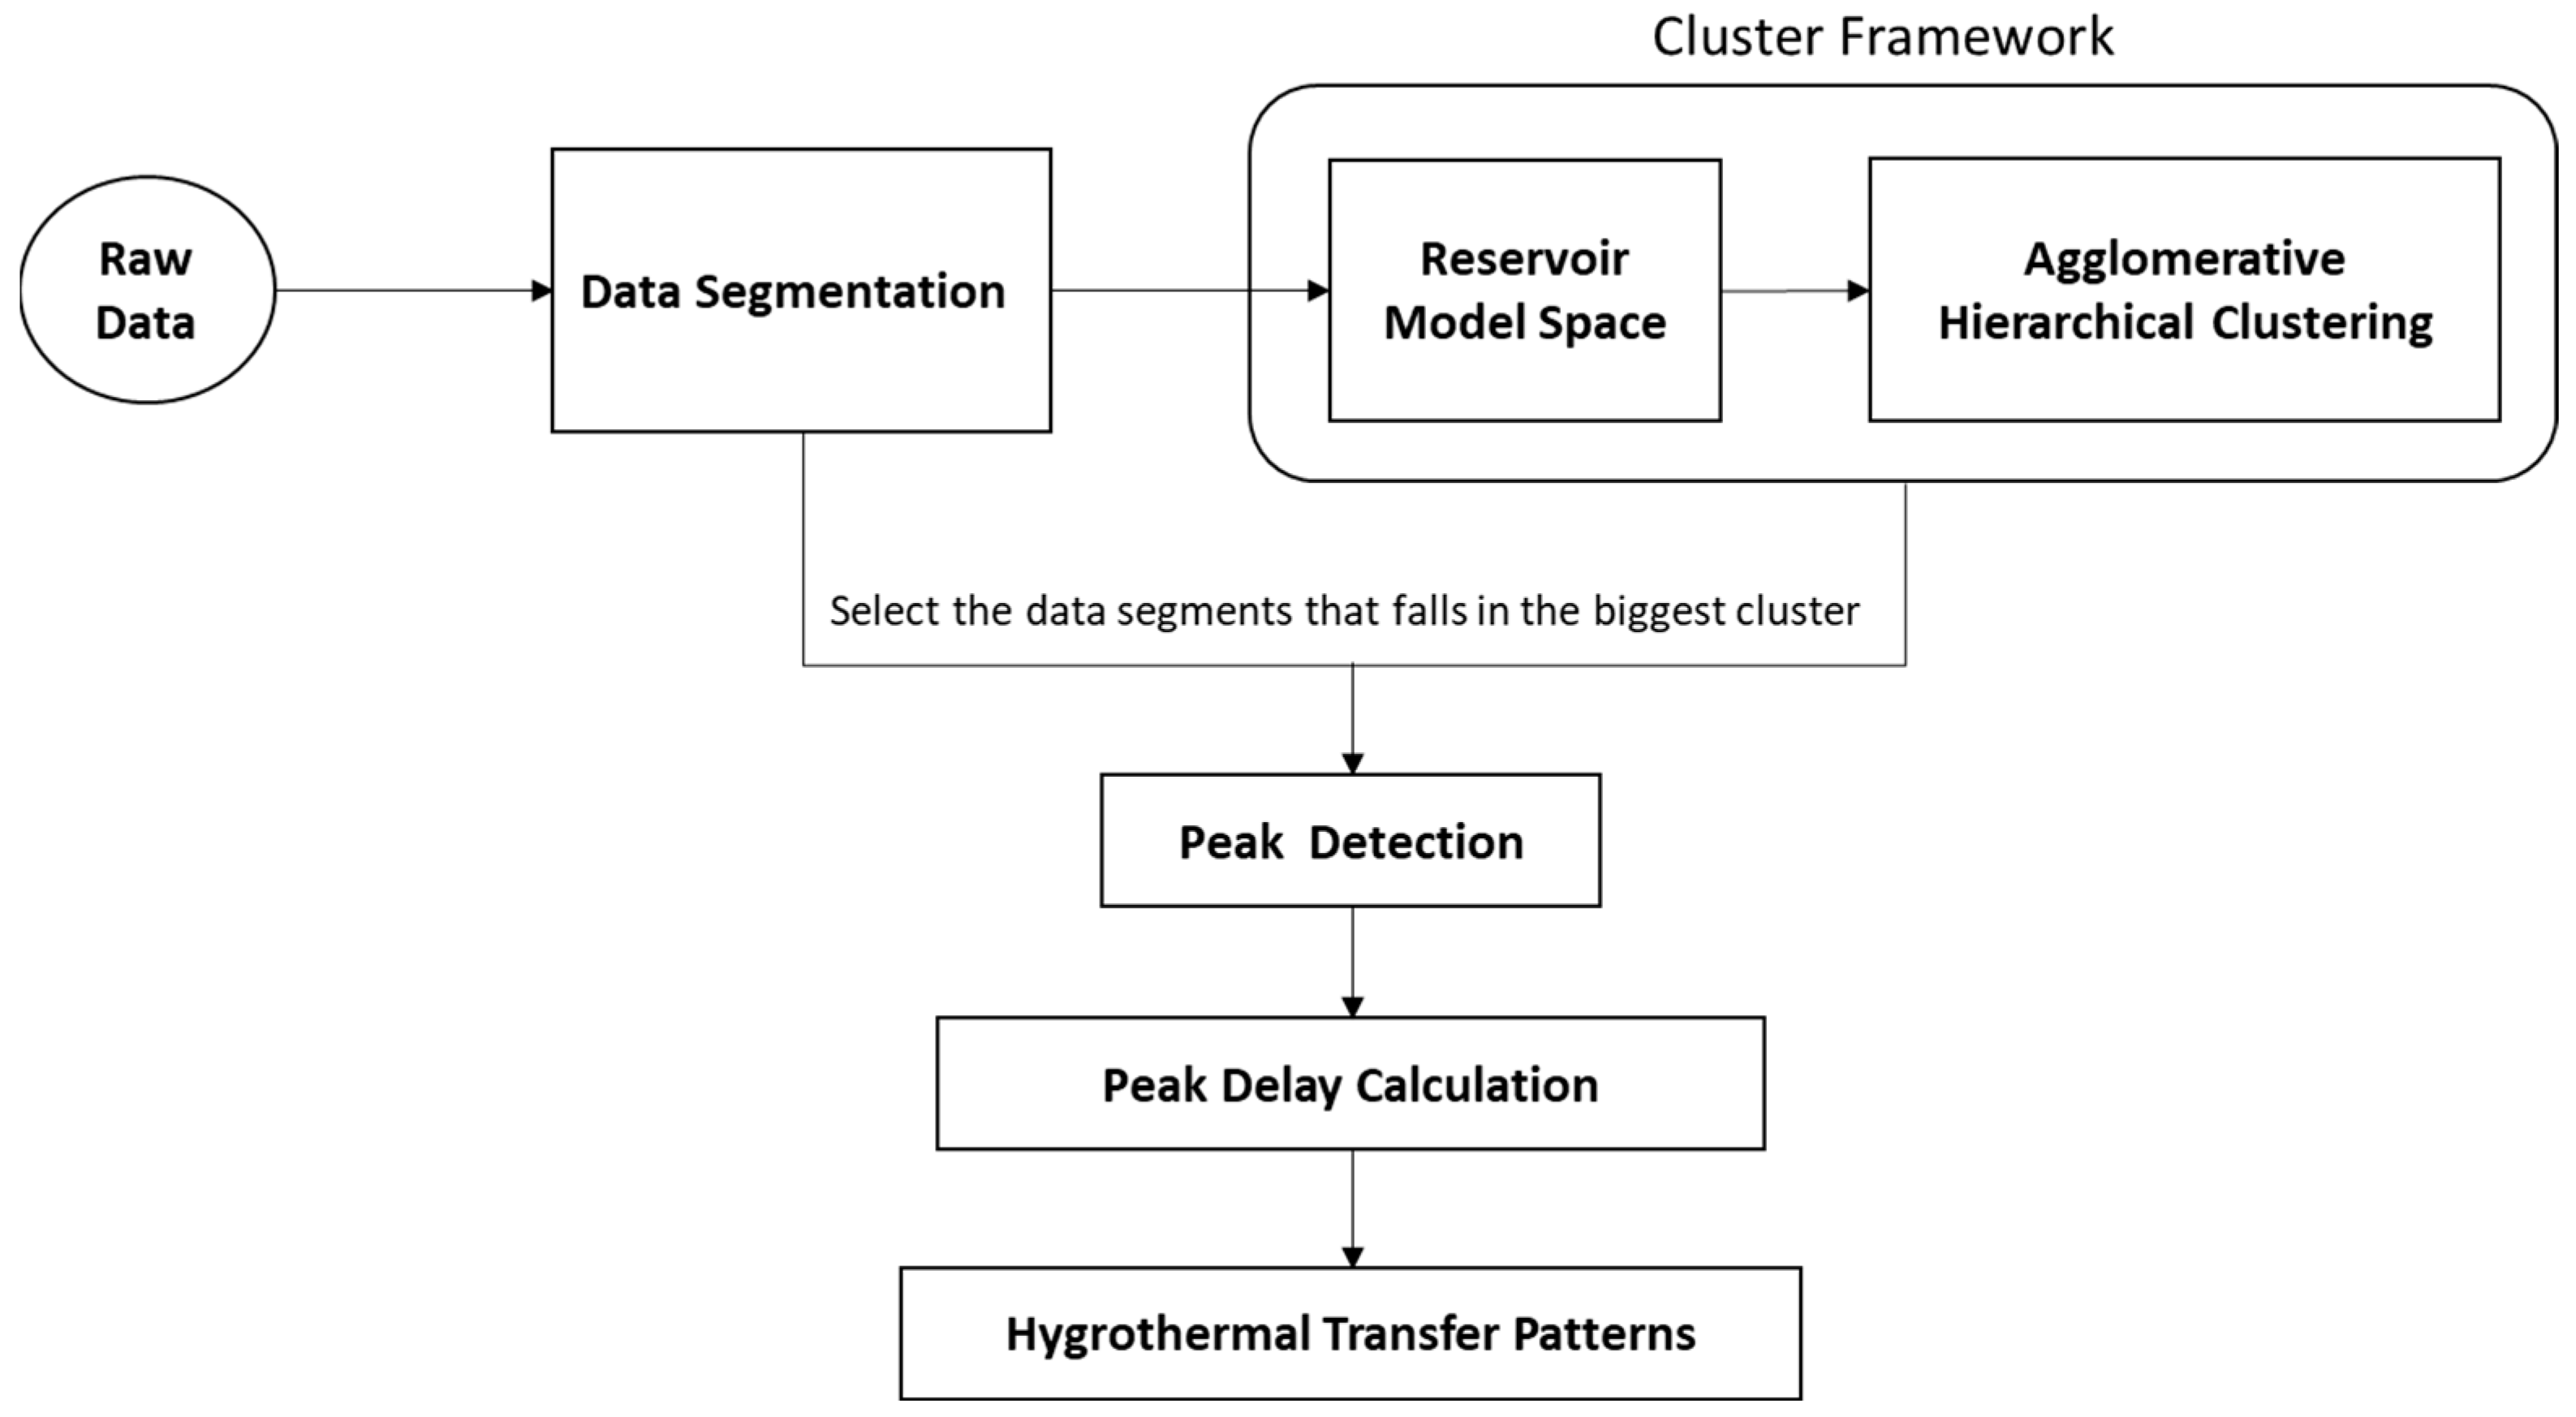
3.1. The Methodology Overview

The research workflow and methods are shown in Figure 4. Firstly, the dataset was segmented daily, of which the segmentation method is discussed in Section 3.2. Secondly, a clustering method was conducted on the data segments and the cluster with the most elements was selected for further analysis to find the general hygrothermal transfer pattern with better accuracy. The details can be found in Section 3.3. Thirdly, the peak detection methods were performed on the data segments that fall in the selected cluster to obtain the timestamp of detected peaks. The peak time differences between the sensor RHT11 and RHT12 were used as references for hygrothermal transfer through the exterior wall. A detailed explanation of peak detection methods can be found in Section 3.4. Subsequently, the time differences, namely delays in time, between the peaks of T11 and T12, RH11 and RH12, were calculated respectively, see Section 3.5. Finally, the hygrothermal transfer patterns were identified based on the peak delay derived from above.

3.2. Data Segmentation

Through the literal observation of the data of RHT11 and RHT12 over the year 2012, on most of the days, a “peak” (the maximum value) or a “high plateau” (the interval of maximum values) appeared in a day, and this observation provided the reasonable foundation to segment the whole period data into days. The data were split into a unit of day, i.e., each segment covered the data from hour 0 to hour 24 of a day. Subsequently, the data were arranged into a three-dimensional array of shapes [N, T, V], where N was the number of segments (in this case, N = 366), T was the number of observations in each segment (in this case, T = 24 × 6), and V was the number of variables in each segment (in this case, V = 4 for T11, T12, RH11, and RH12).

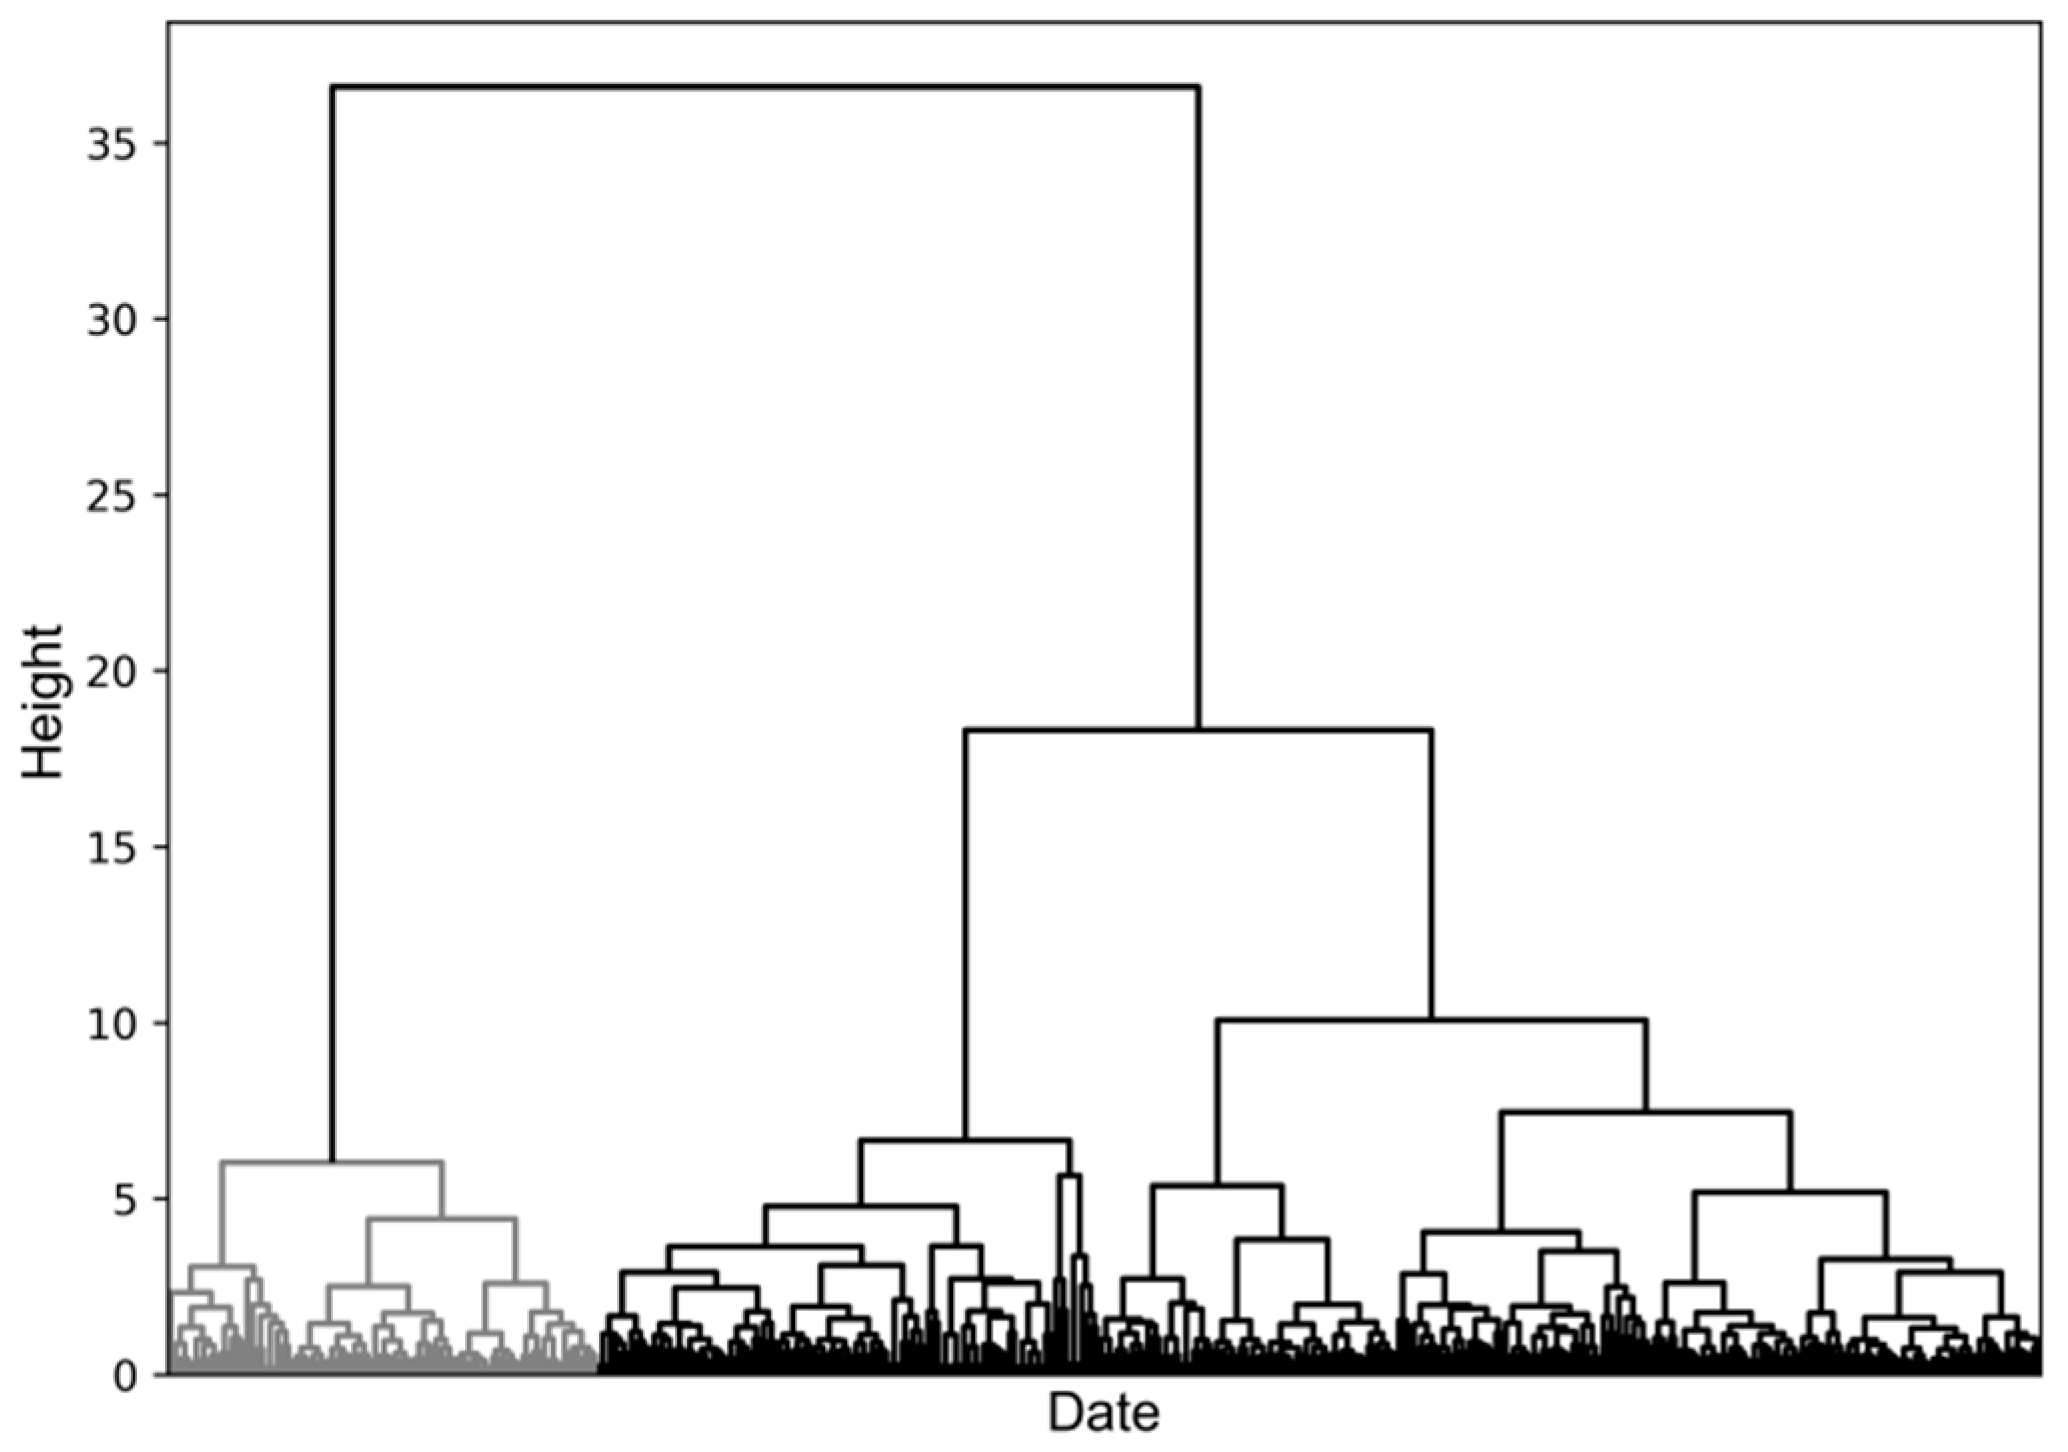
3.3. Clustering Framework

The clustering analysis is conducted to group the data segments so that the most representative group can be identified. Due to the data type of collected data being MTS, a novel approach RC was used in this study to tackle the clustering of MTS. With the help of the open-source Python library that is associated with the literature, and RMS configured with the hyperparameters defined in the literature [31], the RMS output the MTS representations which were then used as the input to the AHC. The basic algorithm of AHC is straightforward:
  • Start with each point in a cluster of its own;
  • Compute the proximity matrix;
  • Repeat: merge the closest pair of clusters and update the proximity matrix;
  • Until there is only one cluster;
  • Return the dendrogram.
Here, to compute the proximity matrix, the Euclidean distance was used to calculate the distance between two clusters. In addition, Ward’s method is used as the linkage criteria to analyze the variance of clusters, and it is acknowledged as the most suitable method for quantitative variables [32]. Ward’s method [33] specifying the distance between two clusters, X and Y , is how much the “error sum of squares” ( ESS ) will increase after merging the two clusters into a single one X Y . Moreover, it seeks to choose the successive clustering steps to minimize the increase Δ ( X ,   Y ) at each step. Mathematically, the Ward’s linkage function can be described by the following expression:
Δ ( X ,   Y ) = ESS ( X Y ) ( ESS ( X ) + ESS ( Y ) ) ,
where ESS ( · ) is the error sum of squares is described as:
ESS ( X ) = i = 1 N X | x i 1 N X j = 1 N X x j | 2 ,   where   | · | is the absolute value of a scalar value or the norm of a vector.
Eventually, based on the dendrogram, the number of clusters in the hierarchical algorithm can be obtained by setting a threshold. This threshold can be decided by looking at the dendrogram. The cluster with the biggest share was selected as the representative for further analysis, and the identification of hygrothermal transfer patterns was based on the data segments that fell in the selected cluster. The results of the clustering analysis can be seen in Section 4.1.

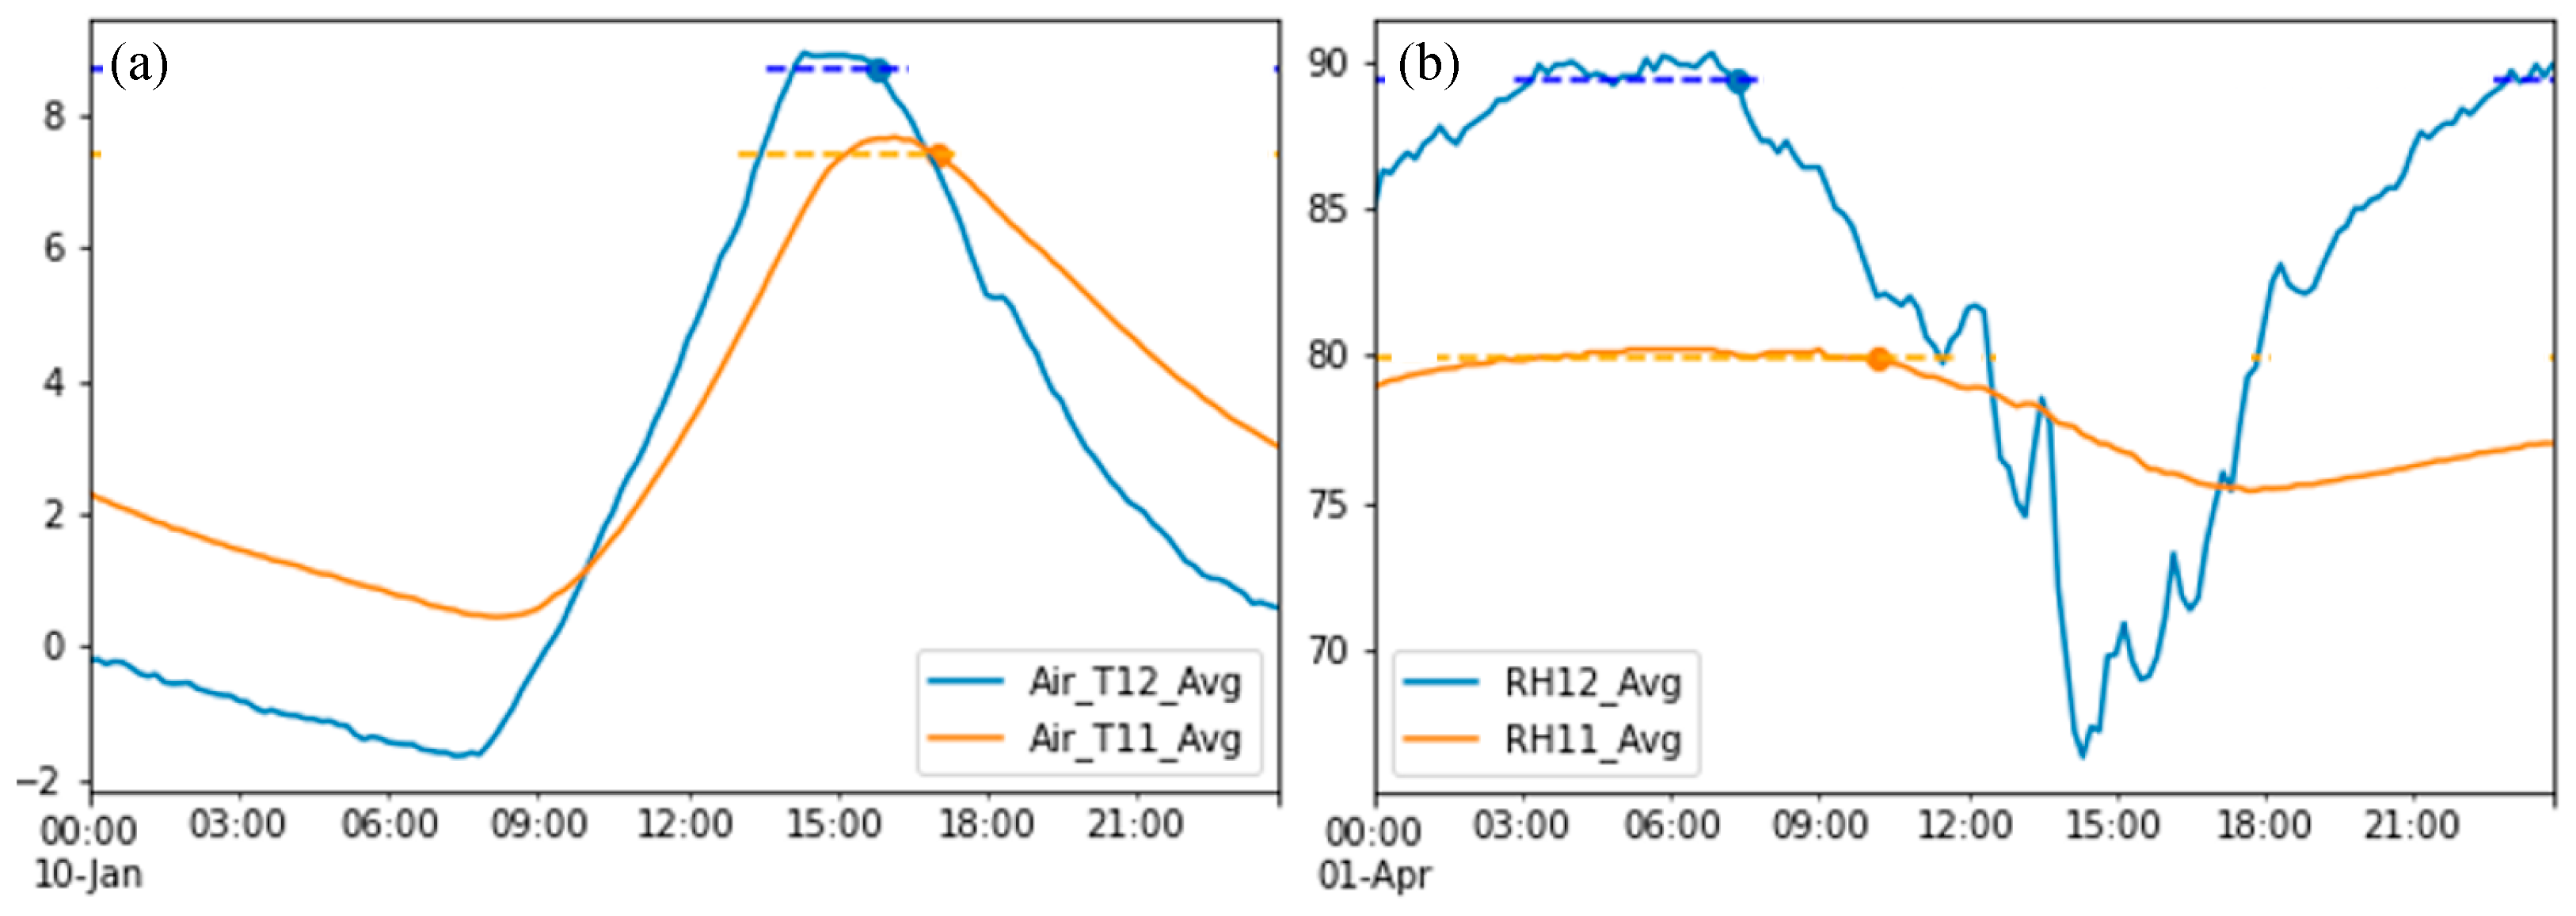
3.4. Daily Peak Detection and Selection

The peak delays between the adjacent sensors of a day were used as references for hygrothermal transfer through the exterior wall. Suitable peak detection methods were thus crucial for the accuracy of this study. Peaks, by definition, were local maxima. Intuitively, to detect the peaks of daily values of RH11, RH12, T11, and T12, the appropriate maximum value of RH11, RH12, T11, and T12 needed to be found in each value of the day. However, in practice, there was usually a plateau (a short period of consecutive reads, see the dashed lines in Figure 5, with small fluctuation) around the peak. In addition, RH increased again in the afternoon and sometimes it reached an even higher value than the peak that occurred in the first half of the day. To overcome these two problems mentioned above, the methods of detecting the daily peaks of RH11, RH12, T11, and T12 are as follows:
Method 1: For T11 and T12, firstly find the maximum value x p in the daily data. Then, given a fluctuation range δ , which is 2% of the magnitude of the difference between maximum and minimum values in the day, select the data point which occurs the latest in the time scale as well as its value and is in the range of [ x p δ ,   x p ] . Finally, the selected data point ( t p ,   x t p ) , where t p is the timestamp of the identified peak and x t p is the peak value. The mathematical expression is shown in Equation (2). As a demo, the dots in Figure 5a are the detected peaks for T12 and T11 on 10 January, respectively.
x t p = { x t :   x t [ x p δ ,   x p ]   and   t = max ( t ) }
Method 2: For RH11 and RH12, to overcome the second problem described above, firstly a range is defined, say the first half day (i.e., from 00:00 to 15:00), where the peak is being searched for. Then, apply Method 1 for the peak detection. The mathematical expression for the detected peak is shown below in Equation (3). As we can see from Figure 5b, the dots are the detected peaks for RH12 and RH11 on 1 April 2012, respectively.
x t p = { x t :   x t [ x p δ ,   x p ]   and   t = max ( t ) ,   where   t [ 00 : 00 ,   15 : 00 ] }

3.5. Peak Delay Calculation

From the peak detection methods, the timestamp t p of a detected peak for each selected day and each variable were obtained. Thus, the peak delay between RH12 and RH11 ( d rh ) was defined as: d rh = t p ( RH 11 ) i t p ( RH 12 ) i , where i is the ith day. Similarly, the peak delay between T12 and T11 ( d temp ) was defined as: d temp = t p ( T 11 ) i t p ( T 12 ) i . Finally, based on the distribution of d rh and d temp , the hygrothermal transfer patterns can be identified.
“Percentage of delay” (Tables 1 and 2) refers to the ratio of the number of days that sensor RHT11 peak value appears later than RHT12 to the total number of days. In addition, to deliver straightforward and clear information, “Range” refers to a range of time where the majority of time delay lies, and “Accuracy” is the percentage of the time delay that falls within the defined “Range”. See Section 4.2 and Section 4.3.

4. Results and Discussion

4.1. Clustering in Relative Humidity Data

The purpose of clustering analysis is to aggregate the daily time series with similar patterns into the same cluster to identify the general patterns with better accuracy. Performing the RC and AHC analysis on the preprocessed relative humidity data, the results are shown in the dendrograms below (Figure 6). The heights of the dendrogram reflected the distance between the clusters. In this case, the dendrogram showed that the biggest difference between clusters was when there were two clusters. Therefore, 366 daily time series were divided into two clusters, where 84 daily time series fell into the first cluster while 282 daily time series fell into the second cluster. Given that the second cluster held the largest share, accounting for 77.3% of the total days in the year, the second cluster was thus selected for analysis to obtain the hygrothermal performance transfer patterns.

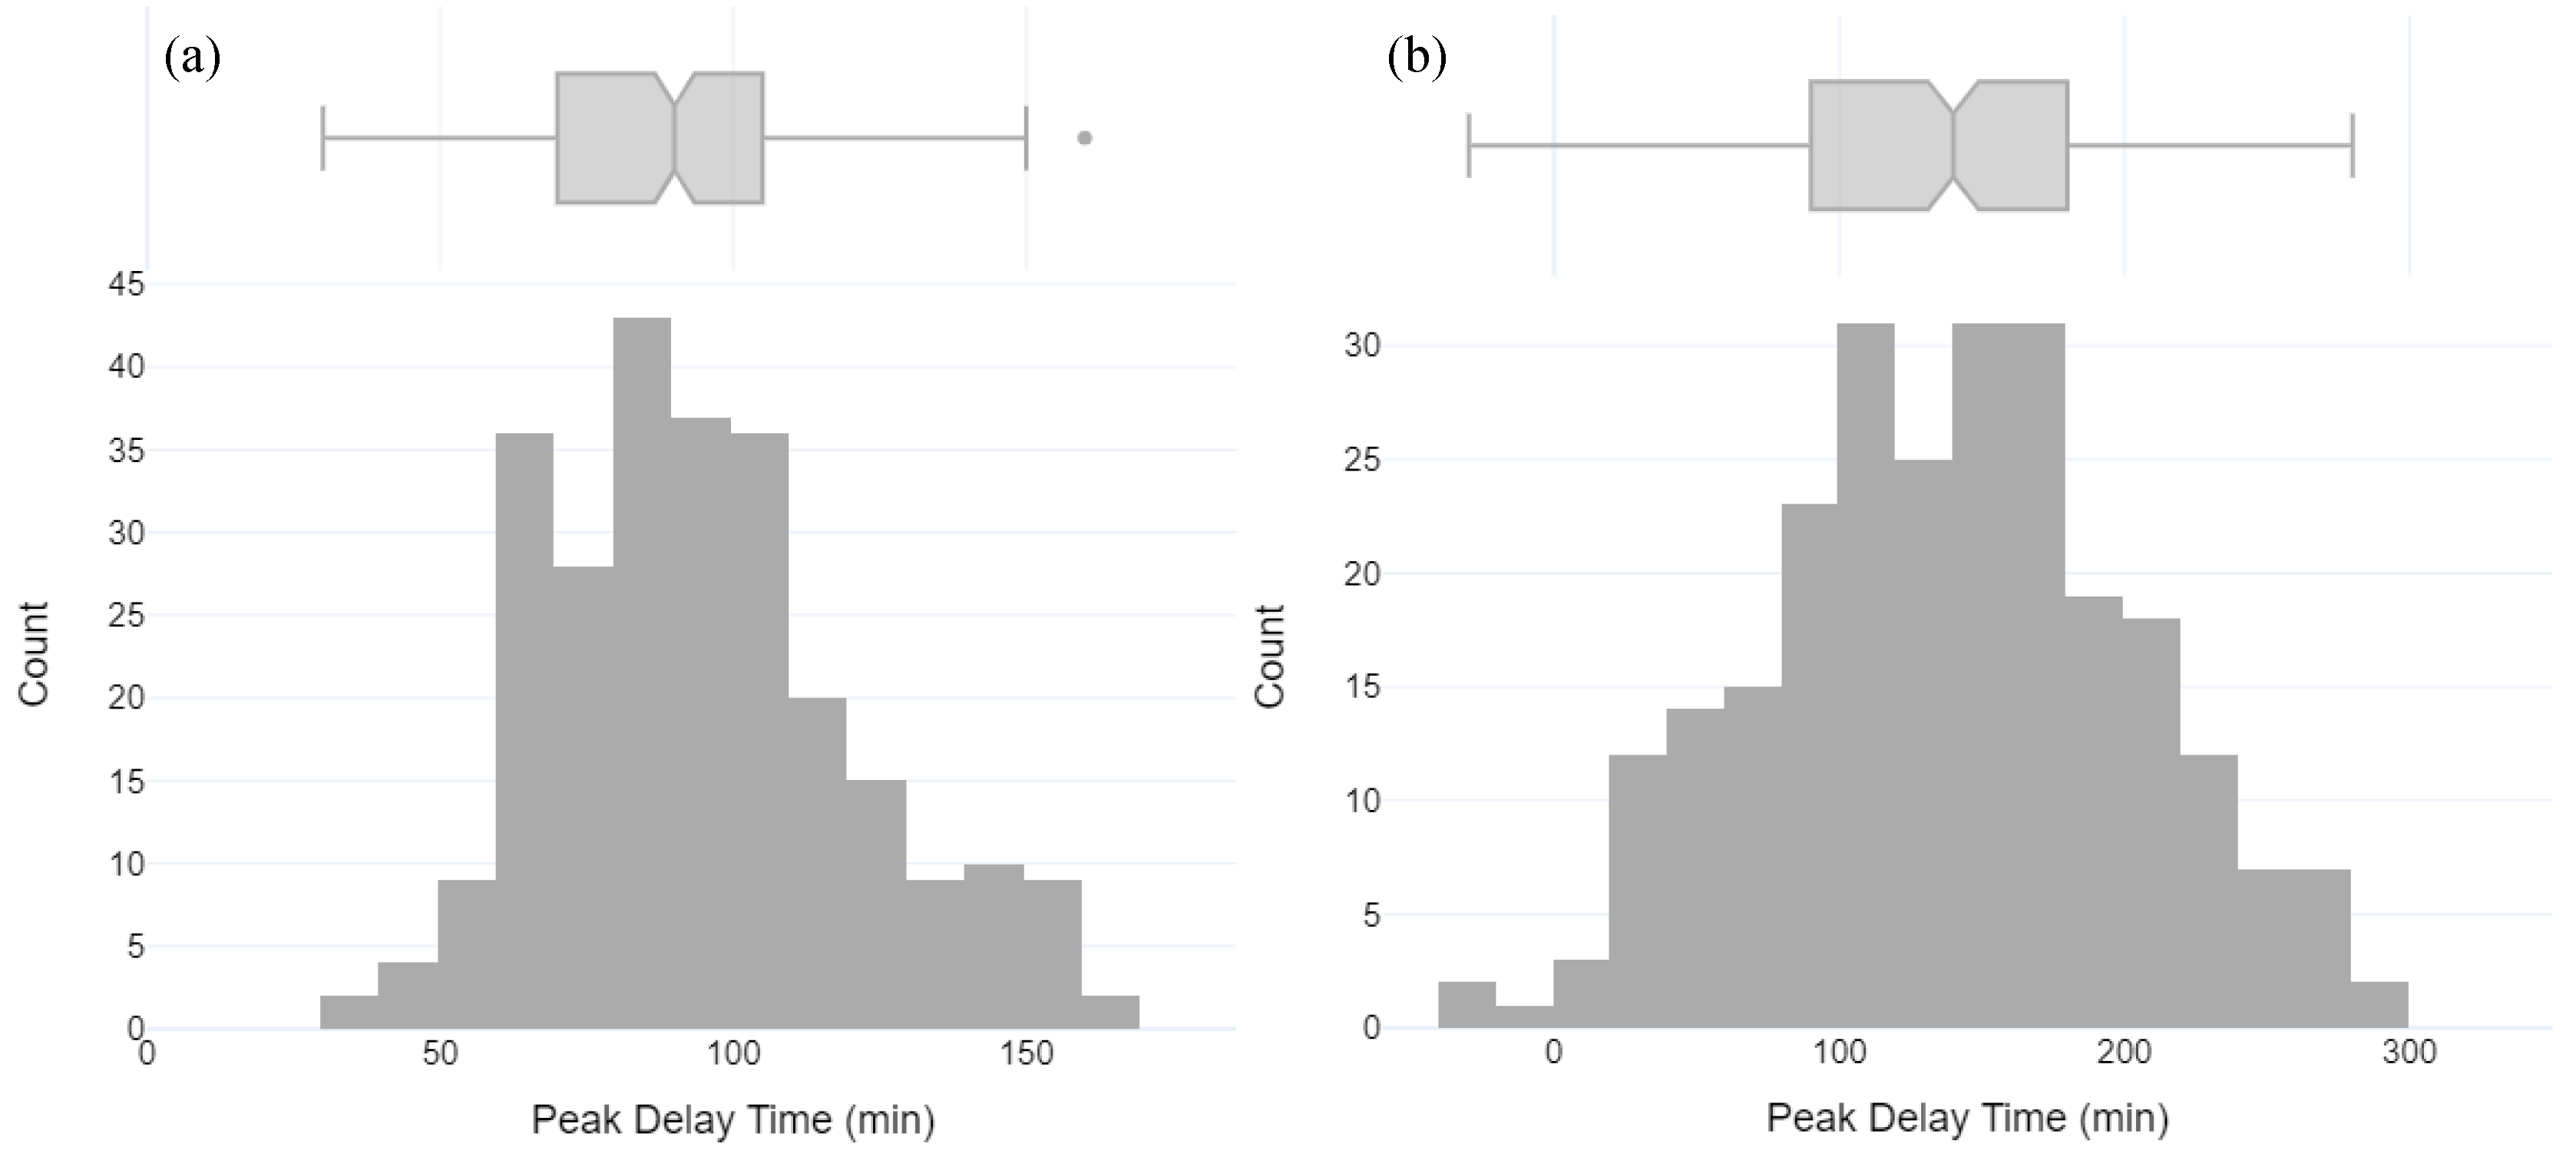
4.2. The Peak Delays in Temperature and Relative Humidity throughout the Whole Year

The corresponding peak detection analysis was conducted on RH12, RH11, T12, and T11, respectively. The timestamp t p of a detected peak was obtained for each selected day and each variable. The peak delay times for temperature and relative humidity were calculated respectively, shown in the histograms in Figure 7, and summarized in Table 1. The subplot on top of the histogram is a boxplot in Figure 7 which provides a different statistical representation than the histogram. The five vertical lines, from left to right, on the boxplot represent the minimum, first quartile, median, third quartile, and maximum of the dataset, respectively. The results showed that 100% of temperature peak delay was positive, which meant that, as the rise of outdoor temperature (T12) reached its peak, the temperature of interior bamboo and wood composite sheathing (T11) also gradually reached its peak, and the peak of T11 always appeared later than that of T12. In addition, 97.3% of relative humidity peak delay was positive too, which meant that, as the outdoor relative humidity (RH12) reached its peak, the relative humidity of interior bamboo and wood composite sheathing (RH11) also gradually reached its peak, and the peak of RH11 always appeared later than RH12. The percentage of delay days within a range of delay time was used to characterize the probability of hygrothermal transfer occurring. Therefore, the direction of the hygrothermal transfer was from RHT12 to RHT11 for 282 days in the daily time series dataset. Namely, the assumption of this study in Section 1 that RHT12 dominated RHT11was confirmed.
The results in Table 1 showed that 82.7% of the temperature peak delay time from T12 to T11 was 60 min to 120 min, while 81.3% of the relative humidity peak delay time from RH12 to RH11 was 60 min to 240 min. For 282 days of the daily time series dataset in the process of RHT11 and RHT12 rising and reaching the peak, the percentages of the peak delay times of the temperature and relative humidity were both higher than 80% within the above range (Figure 7a,b). Therefore, it can be concluded that the machine learning method of combining RC with AHC is effective for quantifying the hygrothermal transfer. The hygrothermal transfer performance can be characterized by the range of the peak delay time.

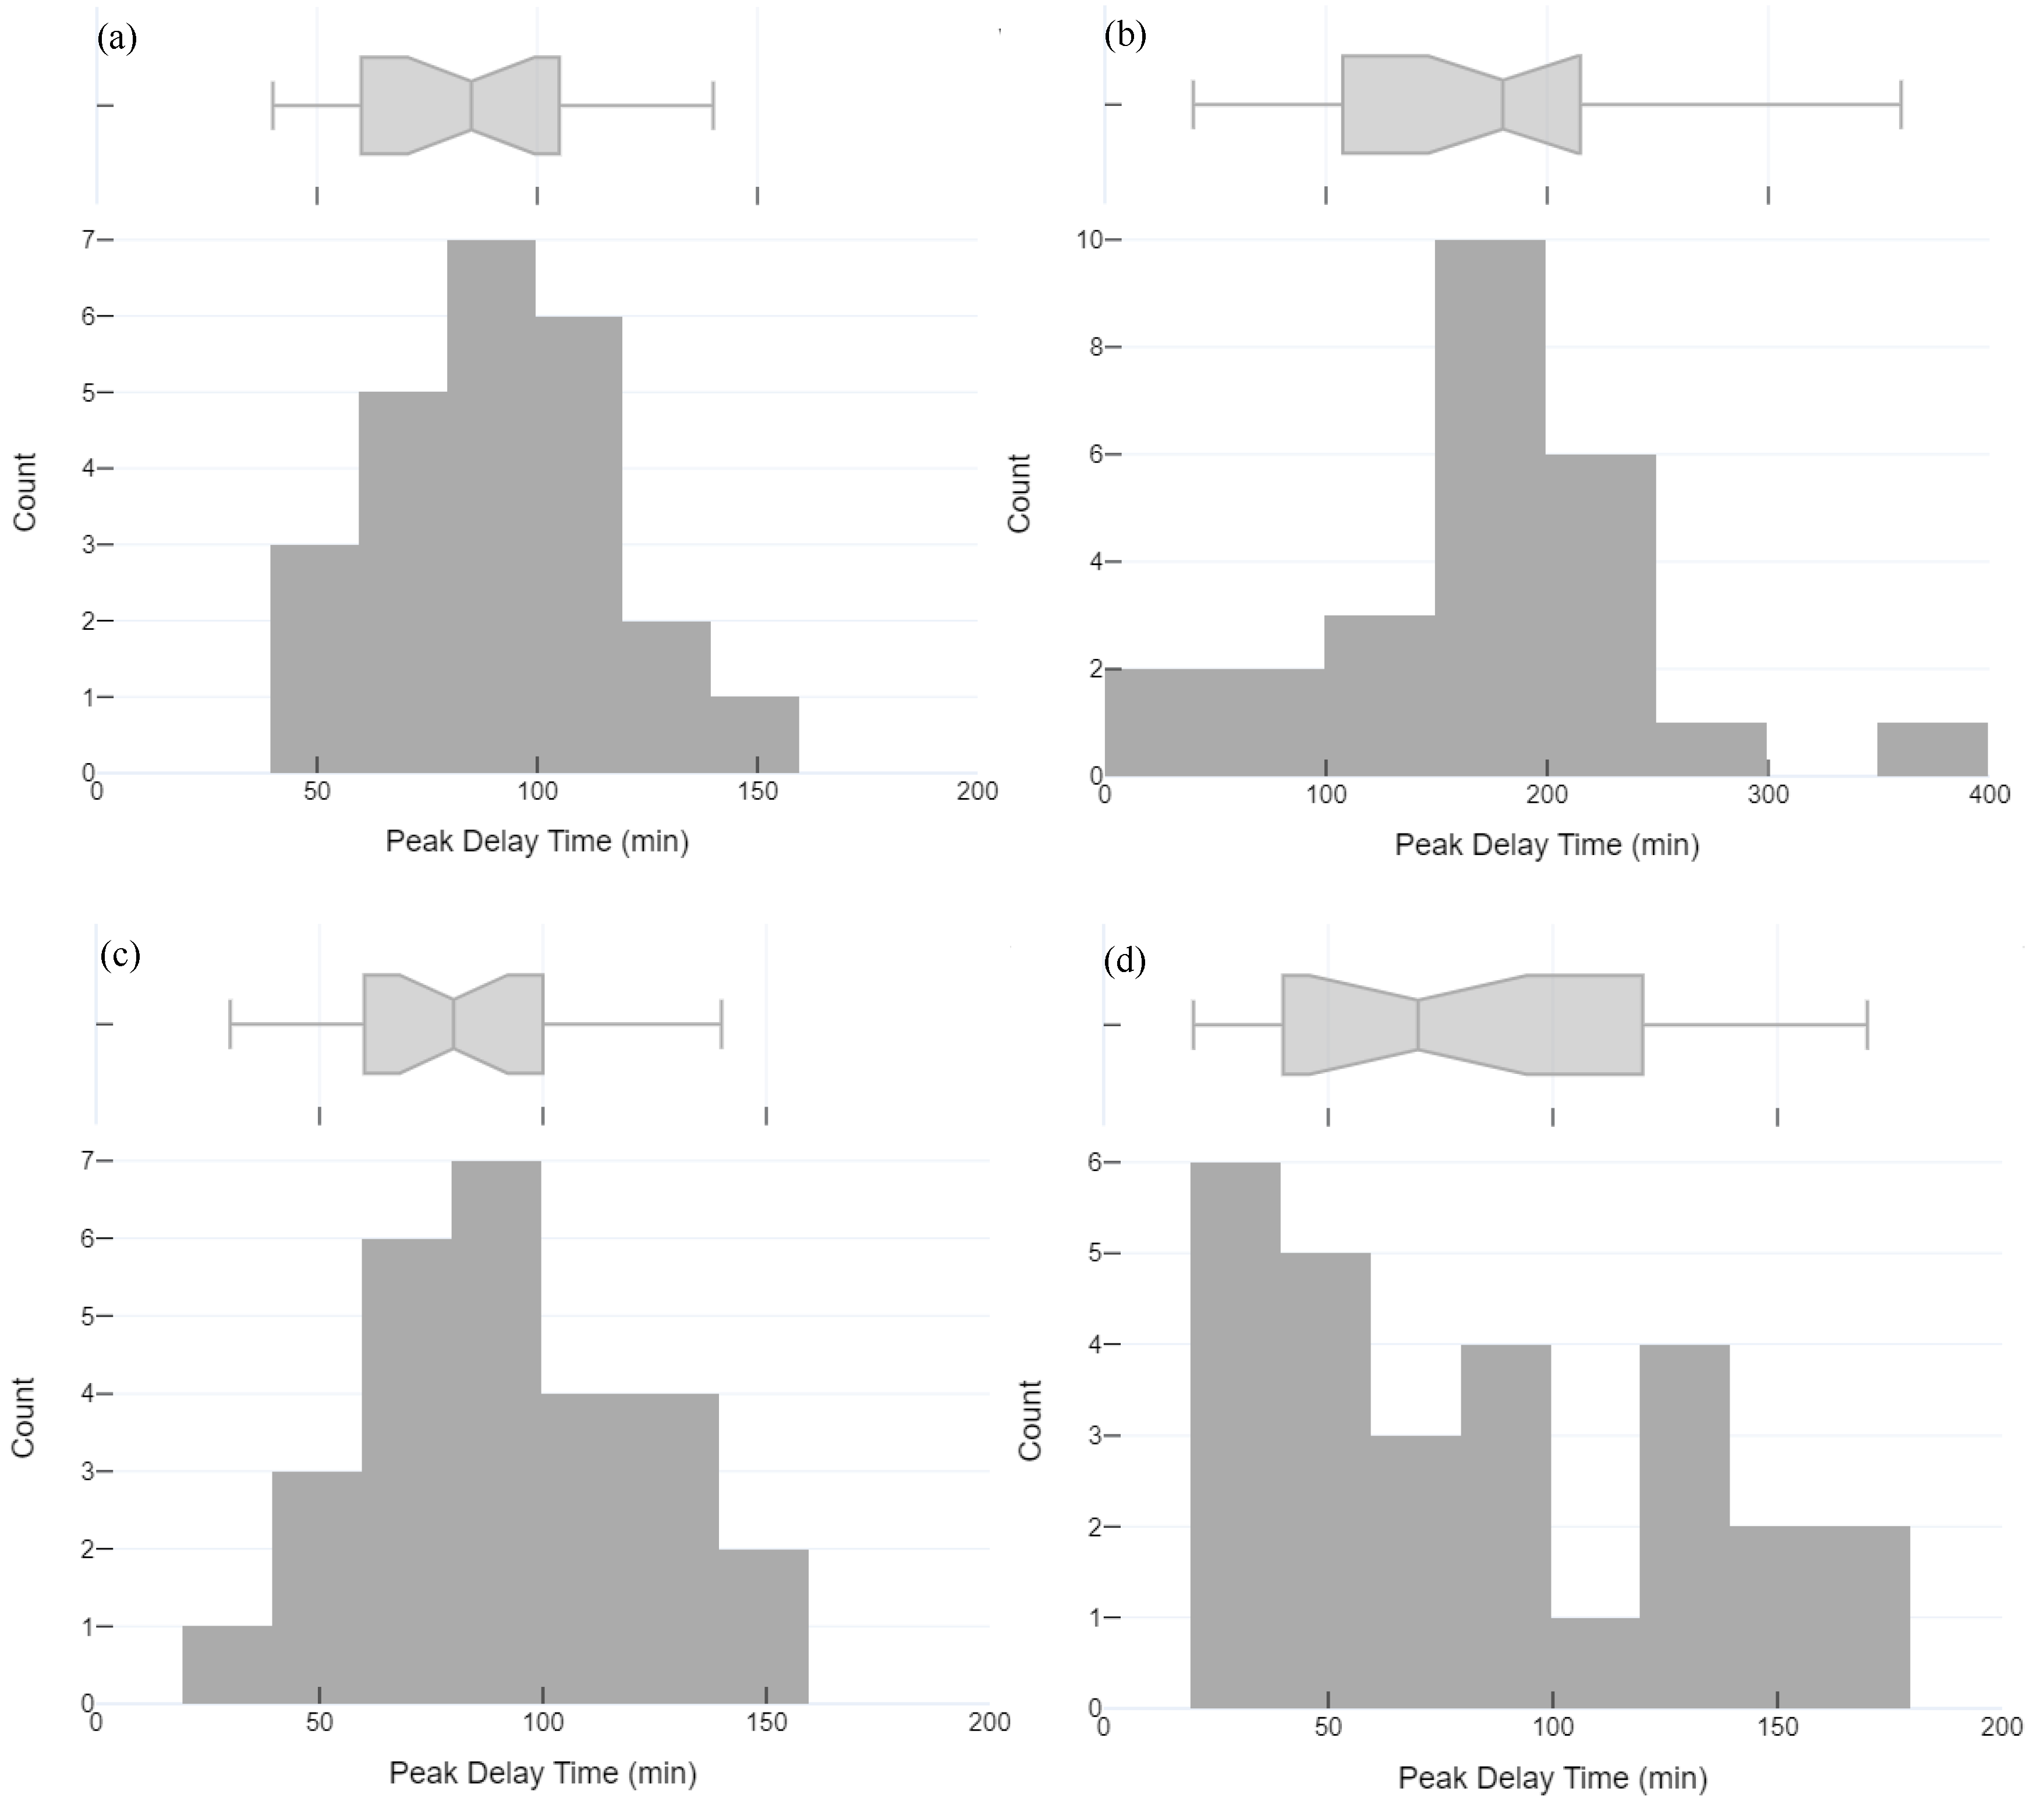
4.3. The Peak Delays in Temperature and Relative Humidity in April and July

The data segments in April and July were selected in the cluster, and then the results of d rh and d temp were shown in Figure 8 and summarized in Table 2. Note that the parameters in Table 2 are the same as in Table 1. The function of the boxplots in Figure 8 works the same as in Figure 7. The results showed that 100% peak delay in both temperature and relative humidity were positive, which once again confirmed that RHT12 dominated RHT11. The temperature peak delay times from T12 to T11 (Figure 8a,c) both were 50 min to 120 min in April and July. The relative humidity peak delay time concentrated between 20 min to 120 min in July, whereas it concentrated between 100 min and 240 min in April.
Furthermore, 91.7% of the temperature peak delay time from T12 to T11 was 50 min to 120 min in April (Figure 8a), while 76.0% of the relative humidity peak delay time from RH12 to RH11 was 100 min to 240 min (Figure 8b). It can also be seen from Figure 8b that the relative humidity peak delay time in April is very long, and the distribution of peak delay days is relatively scattered. In addition, 81.5% of the temperature peak delay time from T12 to T11 was 50 min to 120 min in July (Figure 8c), while 81.5% of the relative humidity peak delay time from RH12 to RH11 was 20 min to 120 min (Figure 8d). It can be seen from Figure 8b,d that the distribution of the relative humidity peak delay time in July is different from those in April.
There were ten days of the peak delay in relative humidity from 150 min to 200 min in April, and there were six days of the peak delay in relative humidity from 0 min to 30 min in July. Therefore, it can be concluded that the machine learning method of combining RC with AHC also accurately and effectively identified how many days happens long-term or short-term hygrothermal transfer in month. Identifying data characteristics accurately will be more helpful in determining the scope of application of the hygrothermal transfer model.
In addition, observing the range of temperature peak delay times in April and July, there was no significant difference. However, there was a significant difference in the range of relative humidity peak delay time in April and July. The results showed that the heat transfer from T12 to T11 was not greatly affected by season, while the moisture transfer from RH12 to RH11 was relatively slower in the springtime than in the summertime. Therefore, by comparing the differences in the relative humidity delay times over 12 months, the impact of temperature of the outside of the wall on the relative humidity delay was obtained, which was also important aspects of hygrothermal transfer patterns.

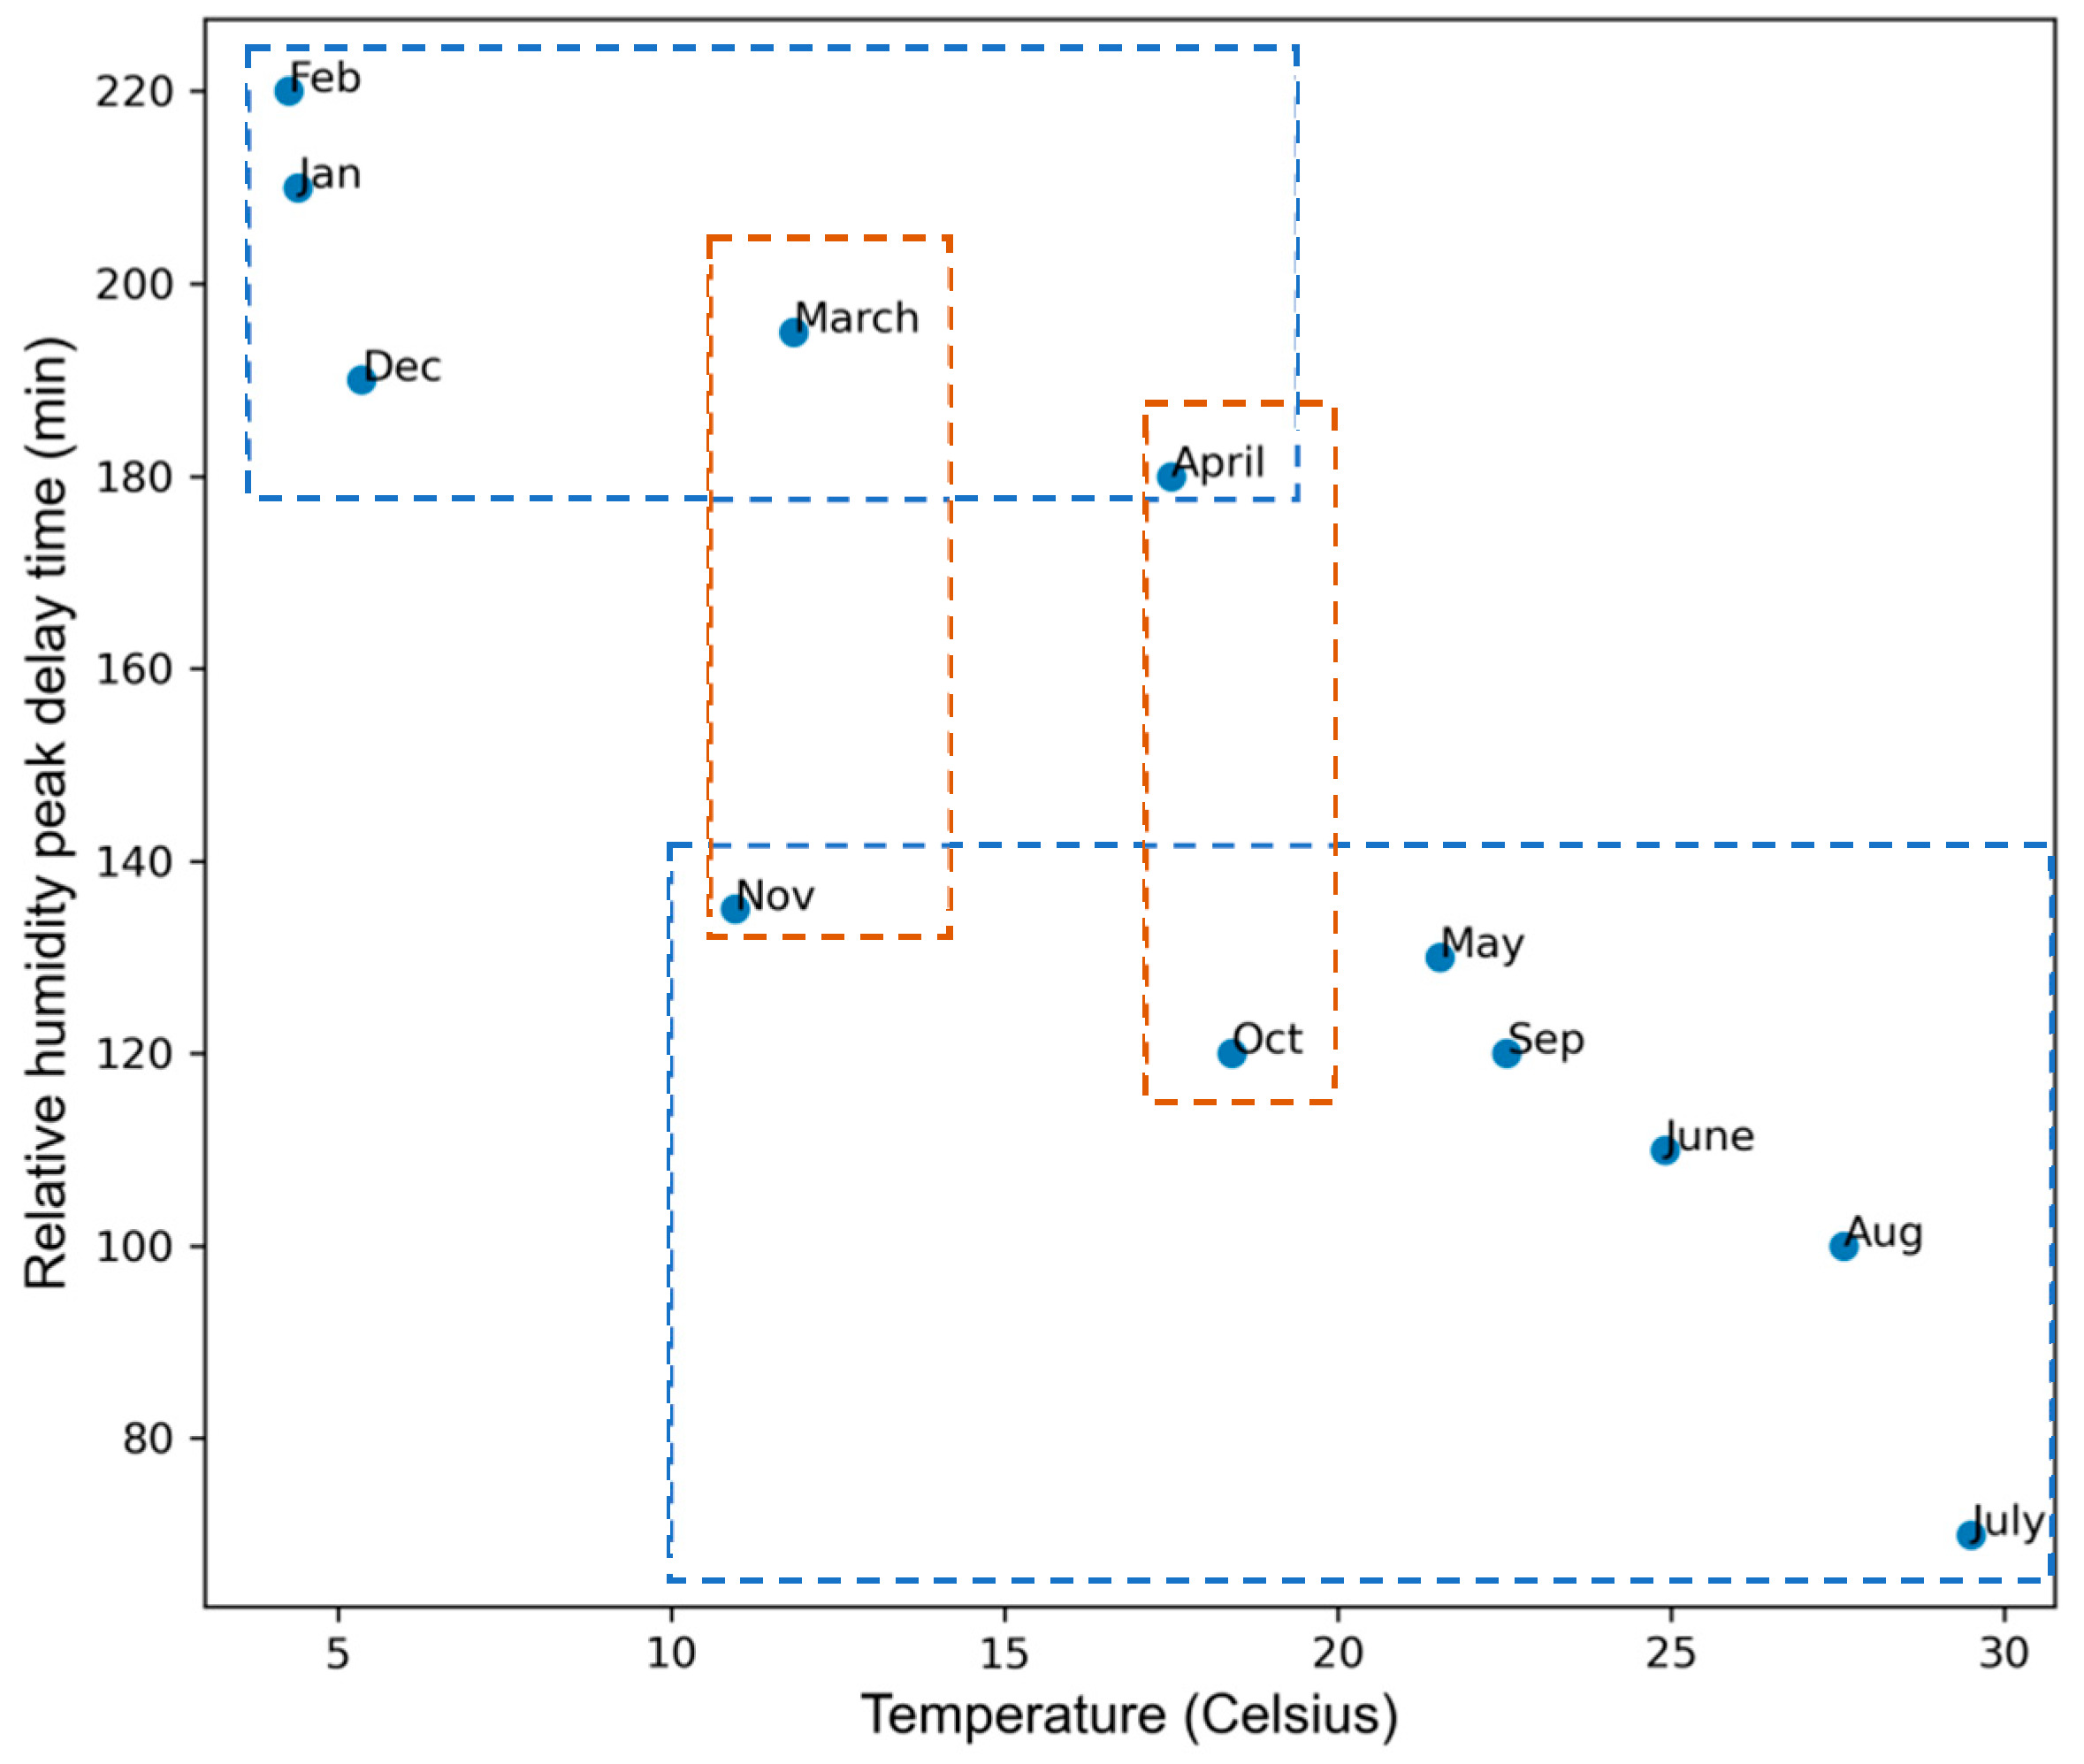
4.4. Impact of Monthly Average Temperature on Relative Humidity Peak Delay Time

Figure 9 shows the distribution of the monthly average relative humidity peak delay time under the outdoor monthly average temperature (T12) condition in a year. The results indicated that, as the outdoor monthly average temperature increased, the monthly average relative humidity peak delay time between RH11 and RH12 decreased. There was a relatively linear relationship between the outdoor monthly average temperature and the monthly average relative humidity peak delay time. In addition, the monthly average relative humidity peak delay time from May to September showed an obvious linear decreasing trend as the outdoor monthly average temperature increased. This result is very interesting. The peak delay time of temperature and relative humidity as an important indicator can be used to look for quantitative characterization of the hygrothermal transfer patterns, which forms a scientific basis for the analysis of moisture movement and storage in the bamboo and wood composite wall.
The monthly average peak delay time between RH11 and RH12 was about three or four hours in January, February, March, April, and December, but the monthly average peak delay time between RH11 and RH12 was about one or two hours from May to November. The results indicated that the wintertime and springtime moisture transfer from RH12 to RH11 was slow due to the cold and humid climate. The average temperatures of April and October were close, the same as of March and November, but their relative humidity peak delay times were significantly different (Figure 9). This means that outdoor temperature is not the only factor that affects the relative humidity peak delay in the transitional season of the year. Therefore, it is effective to use the peak delay time to characterize the hygrothermal transfer patterns.

5. Conclusions

To find out the hygrothermal transfer patterns of a wood and bamboo composite wall was an initial step toward the study of building construction materials maintenance. To this end, a scientific assumption was made to determine whether there exists a hygrothermal transfer of the temperature and relative humidity from the outside of the wall (RHT12) to interior bamboo and wood composite wall sheathing (RHT11). For the given dataset from the two adjacent sensors of RHT11 and RHT 12 over the year 2012, the machine learning methods of RC and AHC were applied as the explorative analysis approach to the segmented the dataset. In addition, based on the characteristics of the data, the peak detection method was developed to obtain the peak delay times of 282 days data of temperature and relative humidity. The assumption was confirmed by the analysis results of the datasets, that is, RHT12 dominated RHT11. Furthermore, there was an inevitable time delay during the hygrothermal transfer from RHT12 to RHT11. The transfer time required varies but within an interval of 1 to 2 h for temperature and 1 to 4 h for relative humidity. In addition, there was a relatively linear relationship between the outdoor temperature and relative humidity peak delay time, indicating a linear contribution of the temperature to the moisture transfer.
Two innovative research methods have been developed in this study. For the question of whether the data in the dataset demonstrate a kind of indeterministic features, the clustering framework system was built which integrated the machine learning method RC with the classic clustering method AHC. Based on the characteristics of the data, the peak detection method was developed which can specifically identify an appropriate and reasonable position of a high plateau (a subset of maxima) of the day to achieve better and more rational accuracy. These two methods play a vital role in quantitatively elucidating the properties of hygrothermal transfer. The data in the dataset demonstrate a kind of indeterministic features. Also because of this indeterministic, identifying a reasonable peak of the relative humidity curve in a day becomes difficult—not simply the maximum value of the day’s relative humidity. Furthermore, these innovative methods have laid a theoretical foundation for the hygrothermal performance models for the exterior wall, turning the hypothesis proposed in this paper into a basic scientific standing point for this serious investigation. Quantitative hygrothermal transfer patterns are needed for a given specific situation with advanced machine learning methods for a complicated form of hygrothermal transfer affected by regional climates and environments, wall construction materials, and configurations. There exists not a qualitative universal principle that is applicable everywhere and generates a general transfer pattern.
Our next study is to quantify the hygrothermal transfer patterns by establishing a set of rules to compute how much moisture content will be accumulated inside the wall and stored in the bamboo and wood composites through the exchange of hygrothermal air between the outside and inside the exterior walls using the data from the sensors ranging on various spots of the building over years. This quantitative result will be used for comparison with the theoretic results generated with the simulation by WUFI, and the comparison with WUFI will expectedly lead to a real estimate of the life cycles of the building materials. Meanwhile, we will develop a novel data explorative analysis approach based on an advanced machine learning method, which can better identify the characteristics of the sample dataset and generate more accurate quantitative hygrothermal transfer patterns. Looking further ahead, hygrothermal transfer patterns identified will provide guidelines for the durability design of bamboo, wood, and exterior wall configurations such that the sustainability of this kind of biomass building material will be maintained in the future. The efforts will achieve the ultimate goals of regulating the indoor temperature and relative humidity artificially to make the indoor environment comfortable and wall materials and structures more energy-efficient and durable.

Author Contributions

Conceptualization, W.W.S., B.F. and X.W.; methodology, W.W.S., B.F., Y.Z. and X.P.; software, Y.Z., Z.W., R.G.N. and H.X.; validation, Y.Z., Z.W. and H.X.; formal analysis, Y.Z., W.W.S., X.W. and X.P.; investigation, X.W. and H.L.; resources, B.F. and W.W.S.; data curation, Y.Z., W.W.S. and X.W.; writing—original draft preparation, X.W., H.L. and Y.Z.; writing—review and editing, W.W.S., B.F. and X.W.; visualization, Y.Z., W.W.S. and X.W.; supervision, W.W.S. and B.F.; project administration, X.W., R.G.N. and W.W.S.; funding acquisition, B.F., X.W. and W.W.S. All authors have read and agreed to the published version of the manuscript.

Funding

This research was funded by the Fundamental Research Funds for the Central Non-profit Research Institution of CAF, Grant No. CAFYBB2018GB001 and CAFYBB2019SZ012, the 13th Five-year Chinese National Major R&D Plan Project, Grant No. 2016YFD0600900, and the pilot study project Region Dalarna/Dalarna University, Förstudie forsknings–och innovationsnätverk, Grant No. 20302194.

Informed Consent Statement

Not applicable.

Conflicts of Interest

The authors declare no conflict of interest.

References

  1. Pihelo, P.; Kalamees, T. The effect of thermal transmittance of building envelope and material selection of wind barrier on moisture safety of timber frame exterior wall. J. Build. Eng. 2016, 6, 29–38. [Google Scholar] [CrossRef]
  2. Antonyová, A.; Korjenic, A.; Antony, P.; Korjenic, S.; Pavlušová, E.; Pavluš, M.; Bednar, T. Hygrothermal properties of building envelopes: Reliability of the effectiveness of energy saving. Energy Build. 2013, 57, 187–192. [Google Scholar] [CrossRef]
  3. Awad, H.; Gül, M.; Zaman, H.; Yu, H.; Al-Hussein, M. Evaluation of the thermal and structural performance of potential energy efficient wall systems for mid-rise wood-frame buildings. Energy Build. 2014, 82, 416–427. [Google Scholar] [CrossRef]
  4. Taffese, W.Z.; Sistonen, E. Neural network based hygrothermal prediction for deterioration risk analysis of surface-protected concrete façade element. Constr. Build. Mater. 2016, 113, 34–48. [Google Scholar] [CrossRef]
  5. He, X.; Zhang, H.; Qiu, L.; Mao, Z.; Shi, C. Hygrothermal performance of temperature-humidity controlling materials with different compositions. Energy Build. 2021, 236, 110792. [Google Scholar] [CrossRef]
  6. Kukk, V.; Kaljula, L.; Kers, J.; Kalamees, T. Designing highly insulated cross-laminated timber external walls in terms of hygrothermal performance: Field measurements and simulations. Build. Environ. 2022, 212, 108805. [Google Scholar] [CrossRef]
  7. Chang, S.J.; Wi, S.; Kang, S.G.; Kim, S. Moisture risk assessment of cross-laminated timber walls: Perspectives on climate conditions and water vapor resistance performance of building materials. Build. Environ. 2019, 168, 106502. [Google Scholar] [CrossRef]
  8. Straube, J.; Onysko, D.; Schumacher, C. Methodology and design of field experiments for monitoring the hygrothermal performance of wood frame enclosures. J. Build. Phys. 2002, 26, 123–151. [Google Scholar] [CrossRef]
  9. Tzuc, O.M.; Gamboa, O.R.; Rosel, R.A.; Poot, M.C.; Edelman, H.; Torres, M.J.; Bassam, A. Modeling of hygrothermal behavior for green facade’s concrete wall exposed to nordic climate using artificial intelligence and global sensitivity analysis. J. Build. Eng. 2020, 33, 101625. [Google Scholar] [CrossRef]
  10. Glass, S.; Kochkin, V.; Drumheller, S.; Barta, L. Moisture performance of energy-efficient and conventional wood-frame wall assemblies in a mixed-humid climate. Buildings 2015, 5, 759–782. [Google Scholar] [CrossRef]
  11. Wang, X.; Fei, B.; Liu, H.; Sun, F.; Zhou, H. Bamboo-beam-column structure Huizhou architecture. Constr. Sci. Technol. 2012, 3, 52–54. [Google Scholar] [CrossRef]
  12. Huang, P.; Chew, Y.M.J.; Chang, W.-S.; Ansell, M.P.; Lawrence, M.; Latif, E.; Shea, A.; Ormondroyd, G.; Du, H. Heat and moisture transfer behaviour in Phyllostachys edulis (Moso bamboo) based panels. Constr. Build. Mater. 2018, 166, 35–49. [Google Scholar] [CrossRef]
  13. Philip, J.R.; De Vries, D.A. Moisture movement in porous materials under temperature gradients. EOS 1957, 38, 222–232. [Google Scholar] [CrossRef]
  14. Luikov, A.V. Systems of differential equations of heat and mass transfer in capillary-porous bodies (review). Int. J. Heat Mass Transf. 1975, 18, 1–14. [Google Scholar] [CrossRef]
  15. Pedersen, C.R. Prediction of moisture transfer in building constructions. Build. Environ. 1992, 27, 387–397. [Google Scholar] [CrossRef]
  16. Künzel, H.M. Simultaneous Heat and Moisture Transport in Building Components; IRB-Verlag: Stuttgart, Germany, 1995; Volume 65, pp. 1–65. [Google Scholar]
  17. Hamdaoui, M.A.; Benzaama, M.H.; El Mendili, Y.; Chateigner, D. A review on physical and data-driven modeling of buildings hygrothermal behavior: Models, approaches and simulation tools. Energy Build. 2021, 251, 111343. [Google Scholar] [CrossRef]
  18. Defo, M.; Lacasse, M.; Laouadi, A. A comparison of hygrothermal simulation results derived from four simulation tools. J. Build. Phys. 2022, 45, 432–456. [Google Scholar] [CrossRef]
  19. Lee, J.; Wi, S.; Chang, S.J.; Choi, J.; Kim, S. Prediction evaluating of moisture problems in light-weight wood structure: Perspectives on regional climates and building materials. Build. Environ. 2019, 168, 106521. [Google Scholar] [CrossRef]
  20. Kordziel, S.; Glass, S.V.; Boardman, C.R.; Munson, R.A.; Zelinka, S.L.; Pei, S.; Tabares-Velasco, P.C. Hygrothermal characterization and modeling of cross-laminated timber in the building envelope. Build. Environ. 2020, 177, 106866. [Google Scholar] [CrossRef]
  21. Huang, Z.; Sun, Y. Hygrothermal performance comparison study on bamboo and timber construction in Asia-Pacific bamboo areas. Constr. Build. Mater. 2020, 271, 121602. [Google Scholar] [CrossRef]
  22. Park, J.H.; Kim, Y.U.; Jeon, J.; Yun, B.Y.; Kang, Y.; Kim, S. Analysis of biochar-mortar composite as a humidity control material to improve the building energy and hygrothermal performance. Sci. Total Environ. 2021, 775, 145552. [Google Scholar] [CrossRef]
  23. Huang, Z.; Sun, Y.; Musso, F. Assessment of bamboo application in building envelope by comparison with reference timber. Constr. Build. Mater. 2017, 156, 844–860. [Google Scholar] [CrossRef]
  24. Huang, Z.; Sun, Y.; Musso, F. Hygrothermal performance optimization on bamboo building envelope in Hot-Humid climate region. Constr. Build. Mater. 2019, 202, 223–245. [Google Scholar] [CrossRef]
  25. Gossard, D.; Lartigue, B.; Thellier, F. Multi-objective optimization of a building envelope for thermal performance using genetic algorithms and artificial neural network. Energy Build. 2013, 67, 253–260. [Google Scholar] [CrossRef] [Green Version]
  26. Sundermeyer, M.; Schluter, R.; Ney, H. LSTM neural networks for language modeling. In Proceedings of the Interspeech, Portland, OR, USA, 9–13 September 2012; pp. 194–197. [Google Scholar]
  27. Graves, A.; Schmidhuber, J. Framewise phoneme classification with bidirectional LSTM and other neural network architectures. Neural Netw. 2005, 18, 602–610. [Google Scholar] [CrossRef]
  28. Tijskens, A.; Roels, S.; Janssen, H. Neural networks for metamodeling the hygrothermal behavior of building components. Build. Environ. 2019, 162, 106282. [Google Scholar] [CrossRef]
  29. Tijskens, A.; Janssen, H.; Roels, S. The impact of a reduced training subspace on the prediction accuracy of neural networks for hygrothermal predictions networks for hygrothermal predictions. J. Build. Perform. Simul. 2020, 14, 20–37. [Google Scholar] [CrossRef]
  30. Tijskens, A.; Roels, S.; Janssen, H. Hygrothermal assessment of timber frame walls using a convolutional neural network. Build. Environ. 2021, 193, 107652. [Google Scholar] [CrossRef]
  31. Bianchi, F.M.; Scardapane, S.; Løkse, S.; Jenssen, R. Reservoir Computing Approaches for Representation and Classification of Multivariate Time Series. IEEE Trans. Neural Netw. Learn. Syst. 2020, 32, 2169–2179. [Google Scholar] [CrossRef]
  32. Saraçli, S.; Doğan, N.; Doğan, İ. Comparison of hierarchical cluster analysis methods by cophenetic correlation. J. Inequal. Appl. 2013, 203. [Google Scholar] [CrossRef]
  33. Szekely, G.; Rizzo, M. Hierarchical clustering via joint between-within distances: Extending ward’s minimum variance method. J. Classif. 2005, 22, 151–183. [Google Scholar] [CrossRef]
Figure 1. Test building and wall configuration: (a) the Hui-style demonstration building for the test; (b) indoor scene of beam and post structure; (c) stud and bamboo-wood sheathing; (d) configuration and materials. (The pictures in (ac) were taken by X.W.; (d) was drawn by H.L.).
Buildings 12 00898 g001
Figure 2. The sensor layout of (a) 2.8m high wall section; (b) RHT11; (c) RHT12; (d) the outside of the wall.
Buildings 12 00898 g002
Figure 3. Temperature and relative humidity throughout the year: (a) T11 and T12; (b) RH11 and RH12.
Buildings 12 00898 g003
Figure 4. An overview of the research workflow.
Buildings 12 00898 g004
Figure 5. Peak selection of (a) temperature; (b) relative humidity.
Buildings 12 00898 g005
Figure 6. Dendrogram of the clustering result.
Buildings 12 00898 g006
Figure 7. Histogram of peak delays of (a) temperature; (b) relative humidity.
Buildings 12 00898 g007
Figure 8. Histogram of the peak delays of (a) temperature in April; (b) relative humidity in April; (c) temperature in July; (d) relative humidity in July.
Buildings 12 00898 g008
Figure 9. A scatter plot of monthly temperature and relative humidity peak delay time.
Buildings 12 00898 g009
Table 1. Hygrothermal transfer with its peak delays.
TemperatureRelative Humidity
Percentage of
Delay
Range (min)AccuracyPercentage of
Delay
Range (min)Accuracy
100%[60, 120]82.7%97.3%[60, 240]81.3%
Table 2. Hygrothermal transfer with its peak delays at different months.
MonthTemperatureRelative Humidity
Percentage of
Delay
Range (min)AccuracyPercentage of
Delay
Range (min)Accuracy
April100%[50, 120]91.7%100%[100, 240]76.0%
July100%[50, 120]81.5%100%[20, 120]81.5%
Publisher’s Note: MDPI stays neutral with regard to jurisdictional claims in published maps and institutional affiliations.

