Article

Numerical Simulation of Flood Intrusion Process under Malfunction of Flood Retaining Facilities in Complex Subway Stations

1
School of Resources and Safety Engineering, Central South University, Changsha 410083, China
2
Nanning Rail Transit Co., Ltd., Nanning 530028, China
*
Author to whom correspondence should be addressed.
Buildings 2022, 12(6), 853; https://doi.org/10.3390/buildings12060853
Submission received: 6 May 2022 / Revised: 15 June 2022 / Accepted: 17 June 2022 / Published: 19 June 2022

Abstract

:
In recent years, heavy rain and waterlogging accidents in subway stations have occurred many times around the world. With the comprehensive development trend of underground space, the accidents caused by flood flow intruding complex subway stations and other underground complexes in extreme precipitation disasters will be lead to more serious casualties and property damage. Therefore, it is necessary to conduct numerical simulation of flood intrusion process under malfunction of flood retaining facilities in complex subway stations. In order to prevent floods from intruding subway stations and explore coping strategies, in this study, the simulation method was used to study the entire process of flood intrusion into complex subway stations when the flood retaining facilities fail in extreme rain and flood disasters that occur once-in-a-century. The three-dimensional numerical simulation model was constructed by taking a subway interchange station with a property development floor in Nanning as a prototype. Based on the Volume of Fluid (VOF) model method, the inundated area in the subway station during the process of flood intrusion from the beginning to the basic stability was simulated, and it was found that the property development floor has serious large-scale water accumulation under extreme rainfall conditions. Through the dynamic monitoring of the flood water level depth at important positions such as the entrances of the evacuation passages, and the analysis of the influence of the design structure and location distribution of different passages on the personnel evacuation plan, it was found that the deep water accumulation at the entrances of the narrow, long, and multi-run emergency safety passages are not conducive to the evacuation of personnel. Finally, the flow of flood water into the subway tunnel through the subway station was calculated. The research results provide certain reference and guidance for the safety design of subway stations under extreme rainfall climatic conditions.

1. Introduction

China has entered a period of rapid development of urban rail transit. As an indispensable part of the urban underground rail transit system, subway stations are also being constructed and utilized on a large scale. By the end of 2021, a total of 50 cities in mainland China had opened and operated 283 urban rail transit lines, with an operating mileage of 7209.7 km, an increase of 1237.1 km compared with last year. In 2021, a total of 585.98 billion CNY of urban rail transit construction investment was completed (Figure 1) [1]. However, because the subway station is located in the city’s underground, the space is semi-closed, and the flow of people is dense. The accumulated water is difficult to discharge, and it may cause serious consequences. Since 2000, disasters caused by climate change have caused traffic, economic, and even personal injury to urban residents. In the past 20 years, as many as 6681 related major natural disasters have occurred around the world [2]. The extreme rainstorms are characterized by high intensity and high frequency [3]. Urban waterlogging disasters caused by frequent heavy rainfall have caused major accidents and property losses of subway stations inundation disasters many times nationwide. In 2016, during the trial operation of Baihualing Station of Nanning Rail Transit Line 1, rainwater poured into the station through exits B and C; in 2020, there was a heavy rainstorm in Huangpu and Zengcheng in Guangzhou, Guangzhou Metro Line 13 was flooded with water, and the entire line was forced to suspend; in 2021, extreme rainstorms in Zhengzhou caused serious urban waterlogging and the flood destroyed the flood retaining wall and poured into the subway tunnel, causing heavy casualties. On the other hand, the urban underground space system presents a complex development trend; more and more underground spaces are built as multi-functional underground complexes. In recent years, the “Transit-Oriented Development (TOD)” model has become popular in China [4], and subway stations connected to property development areas are becoming more and more common [5,6]. Compared with other ordinary subway stations, subway stations with property development areas have more complex and diverse structures and passages, which will cause more complex flood intrusion paths and increase the vulnerability of subway stations to flooding. It can be seen that under the background of rapid urbanization, flooding disaster of subway stations has become a very prominent problem in urban public safety in China. China’s 14th Five-Year Plan for the first time proposes “building a resilient city”. The resilience of urban systems consists of a city’s ability to withstand a crisis, maintain its function, and restore it after a disturbance [7,8]. Infrastructure such as subway stations is the carrier of a resilient city. Once a waterlogging disaster occurs in a subway station, it will trigger a series of more serious chain reactions [9,10]. Although the water retaining facilities at the entrance and exit have an excellent flood control effect on flood disasters with small water head height, it is difficult to prevent the intrusion of large head height floodwater caused by extreme rainstorms. Therefore, studying the flood intrusion process of the subway system under malfunction of the water retaining facilities is conducive to improving the subway’s comprehensive disaster prevention and mitigation capabilities, and has very realistic economic and social benefits for promoting the sustainable development of the city.
At present, the research on flood disasters in subway stations mainly focuses on three aspects: the formation mechanism and influencing factors of flood disasters in subway stations [11,12,13], the flood vulnerability assessment of subway stations, and the simulation analysis of the flood disaster model of the subway station [14,15,16]. The simulation analysis of the flood disaster model of the subway station includes physical experiment research and numerical simulation research. In terms of physical experiments, Inone and Toda et al. [17,18] established a three-dimensional urban complex flood test model for the first time, using the central urban area of Kyoto as a prototype, and tested and analyzed the flood propagation process and flood flow characteristics of the ground flood intruding the 3-story underground space from multiple entrances. The aboveground part was constructed at a scale of 1:100, the underground part was constructed at a scale of 1:30. Ishigaki, Keiichi [19] used the Kyoto City three-dimensional urban space flood test model established by Inone et al. to conduct a flood test. The test results showed that the proportion of floods flowing into the underground space was as high as 50%. Shen [20] constructed a flood intrusion test model at a scale of 1:30 based on a station under construction in Tianjin and tested and analyzed the relationship between water depth and time at the characteristic points of the station hall and platform floor under the conditions of different intrusion unit-width flow rates and the opening and closing of the flood gates at both ends of the tunnel. Several scholars have tested and analyzed the influencing factors of personnel evacuation in underground space waterlogging disasters [21,22,23,24,25,26]. Numerical simulation method is also an effective method of engineering design [27,28,29]; Dutta, Takamura [30] used JAVA language program to establish a 2D flood diffusion model, simulated the water inflow in the underground space, and came to the conclusion that the surface water depth has a great influence on the water inflow rate of the underground space. Toda, Oyagi [31] proposed a “storage pond” model based on solving the shallow water wave equation to simulate the flood spread in the underground space: each underground space is equivalent to multiple cisterns, the flood water spreads in various underground spaces and is equivalent to circulating between various storage ponds, and stairs are simplified as connecting pipes between various underground spaces. Gotoh, Ikari [32] constructed a numerical model of the stair flow in the underground space based on the semi-implicit method of moving particles in the particle method, and obtained three typical stair flow patterns. Han, Kim [33] considered the influence of water capacity in the underground space and proposed to use the Link-Node model to simulate the evolution of water flow in the underground space, taking subway tunnels or pedestrian passages as links; underground space facilities, such as underground shopping malls, subway stations, etc., were taken as nodes, using open channel flow and empirical weir flow formulas to calculate the evolutionary flow of floods. Oertel [34] divided the underground space into multiple calculation modules such as underground space, stairs, and entrances and exits for calculation, and used the empirical weir flow formula to calculate the flow of floodwater. Yoneyama, Toda [35] simulated the floodwater flow on the straight stairs in the underground space based on the VOF method. Mo [36] simulated the flood intrusion of a proposed subway station in Hangzhou based on the standard turbulence model and the VOF method and deduced the relationship between the height of the surface water and the lifting speed of the water in the underground space, and the critical distance for the safe evacuation of people. Ishigaki, Asano [37] further improved the urban flood calculation model based on the “storage pond” model and the RM model by Toda et al., and realized the simulation calculation of the urban underground space inundation caused by the once-in-a-hundred-year rainstorm flood and the once-in-a-millennium tsunami flood. Shao, Jiang [38] used the VOF model and Realizable k-ε turbulence model in FLUENT software to simulate the characteristics of flood flow on stairs with different inclination angles and shapes, and compared the impact of rest platforms on flood flow and personnel evacuation.
The above research results show that the numerical simulation results are in good agreement with the model test results, and to a certain extent, high results have been obtained, which deepen the understanding of the flood intrusion process in the underground space [39,40,41]. However, most of the existing studies have focused on the study of waterlogging laws in urban underground space systems and local building structures. There are few studies on the rapid intrusion of floodwater into subway stations and flooding to subway tunnel in the event of flood retaining facilities malfunction. There are even fewer targeted studies for complex subway stations with property development areas. In order to study the flood intrusion flow process of the typical complex subway station in Nanning, and provide corresponding flood control reference for other subway stations, this study took a subway interchange station in Nanning City with a sunken underground square and an underground property development floor as the background; through numerical simulation methods, we researched and analyzed the whole process of flood flowing in from the entrances and exits, barrier-free elevators, and emergency safety passages, and flow out from the tunnels at both ends of the station under malfunction of flood retaining facilities in the event of extreme rainfall disasters that occur once-in-a-century, and provided some targeted suggestions for flood control and disaster mitigation of the subway stations.

2. Modeling

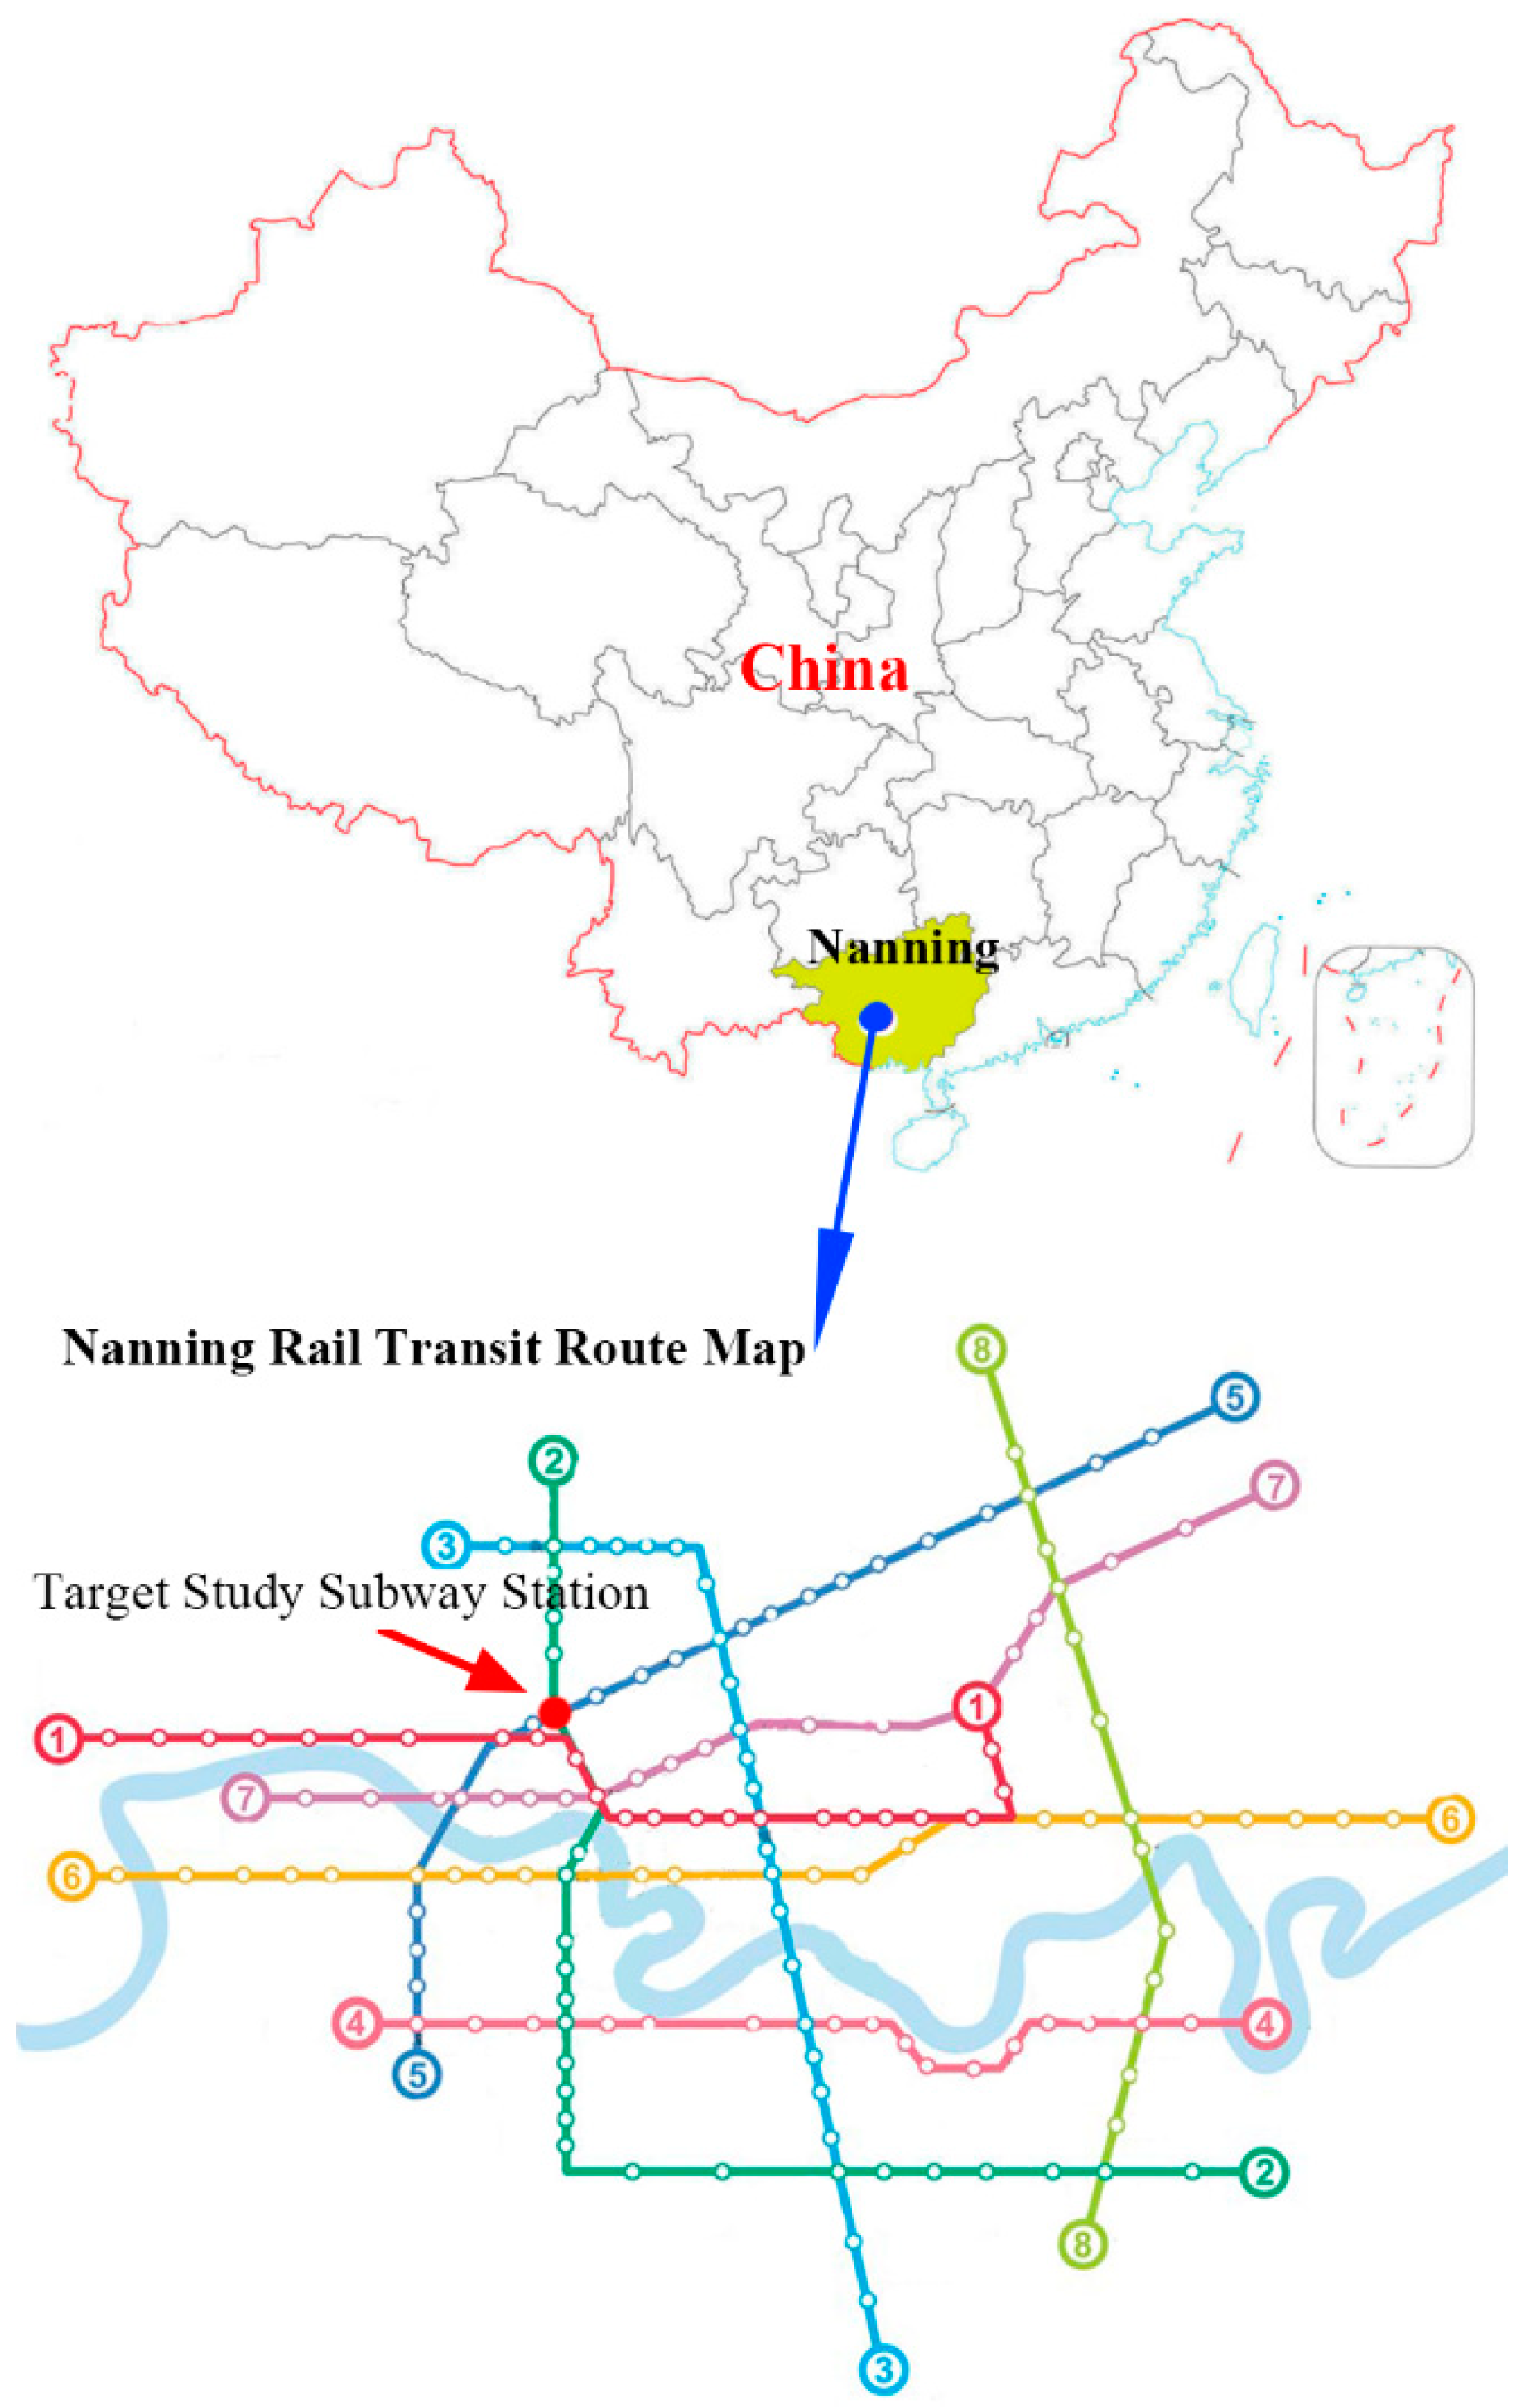
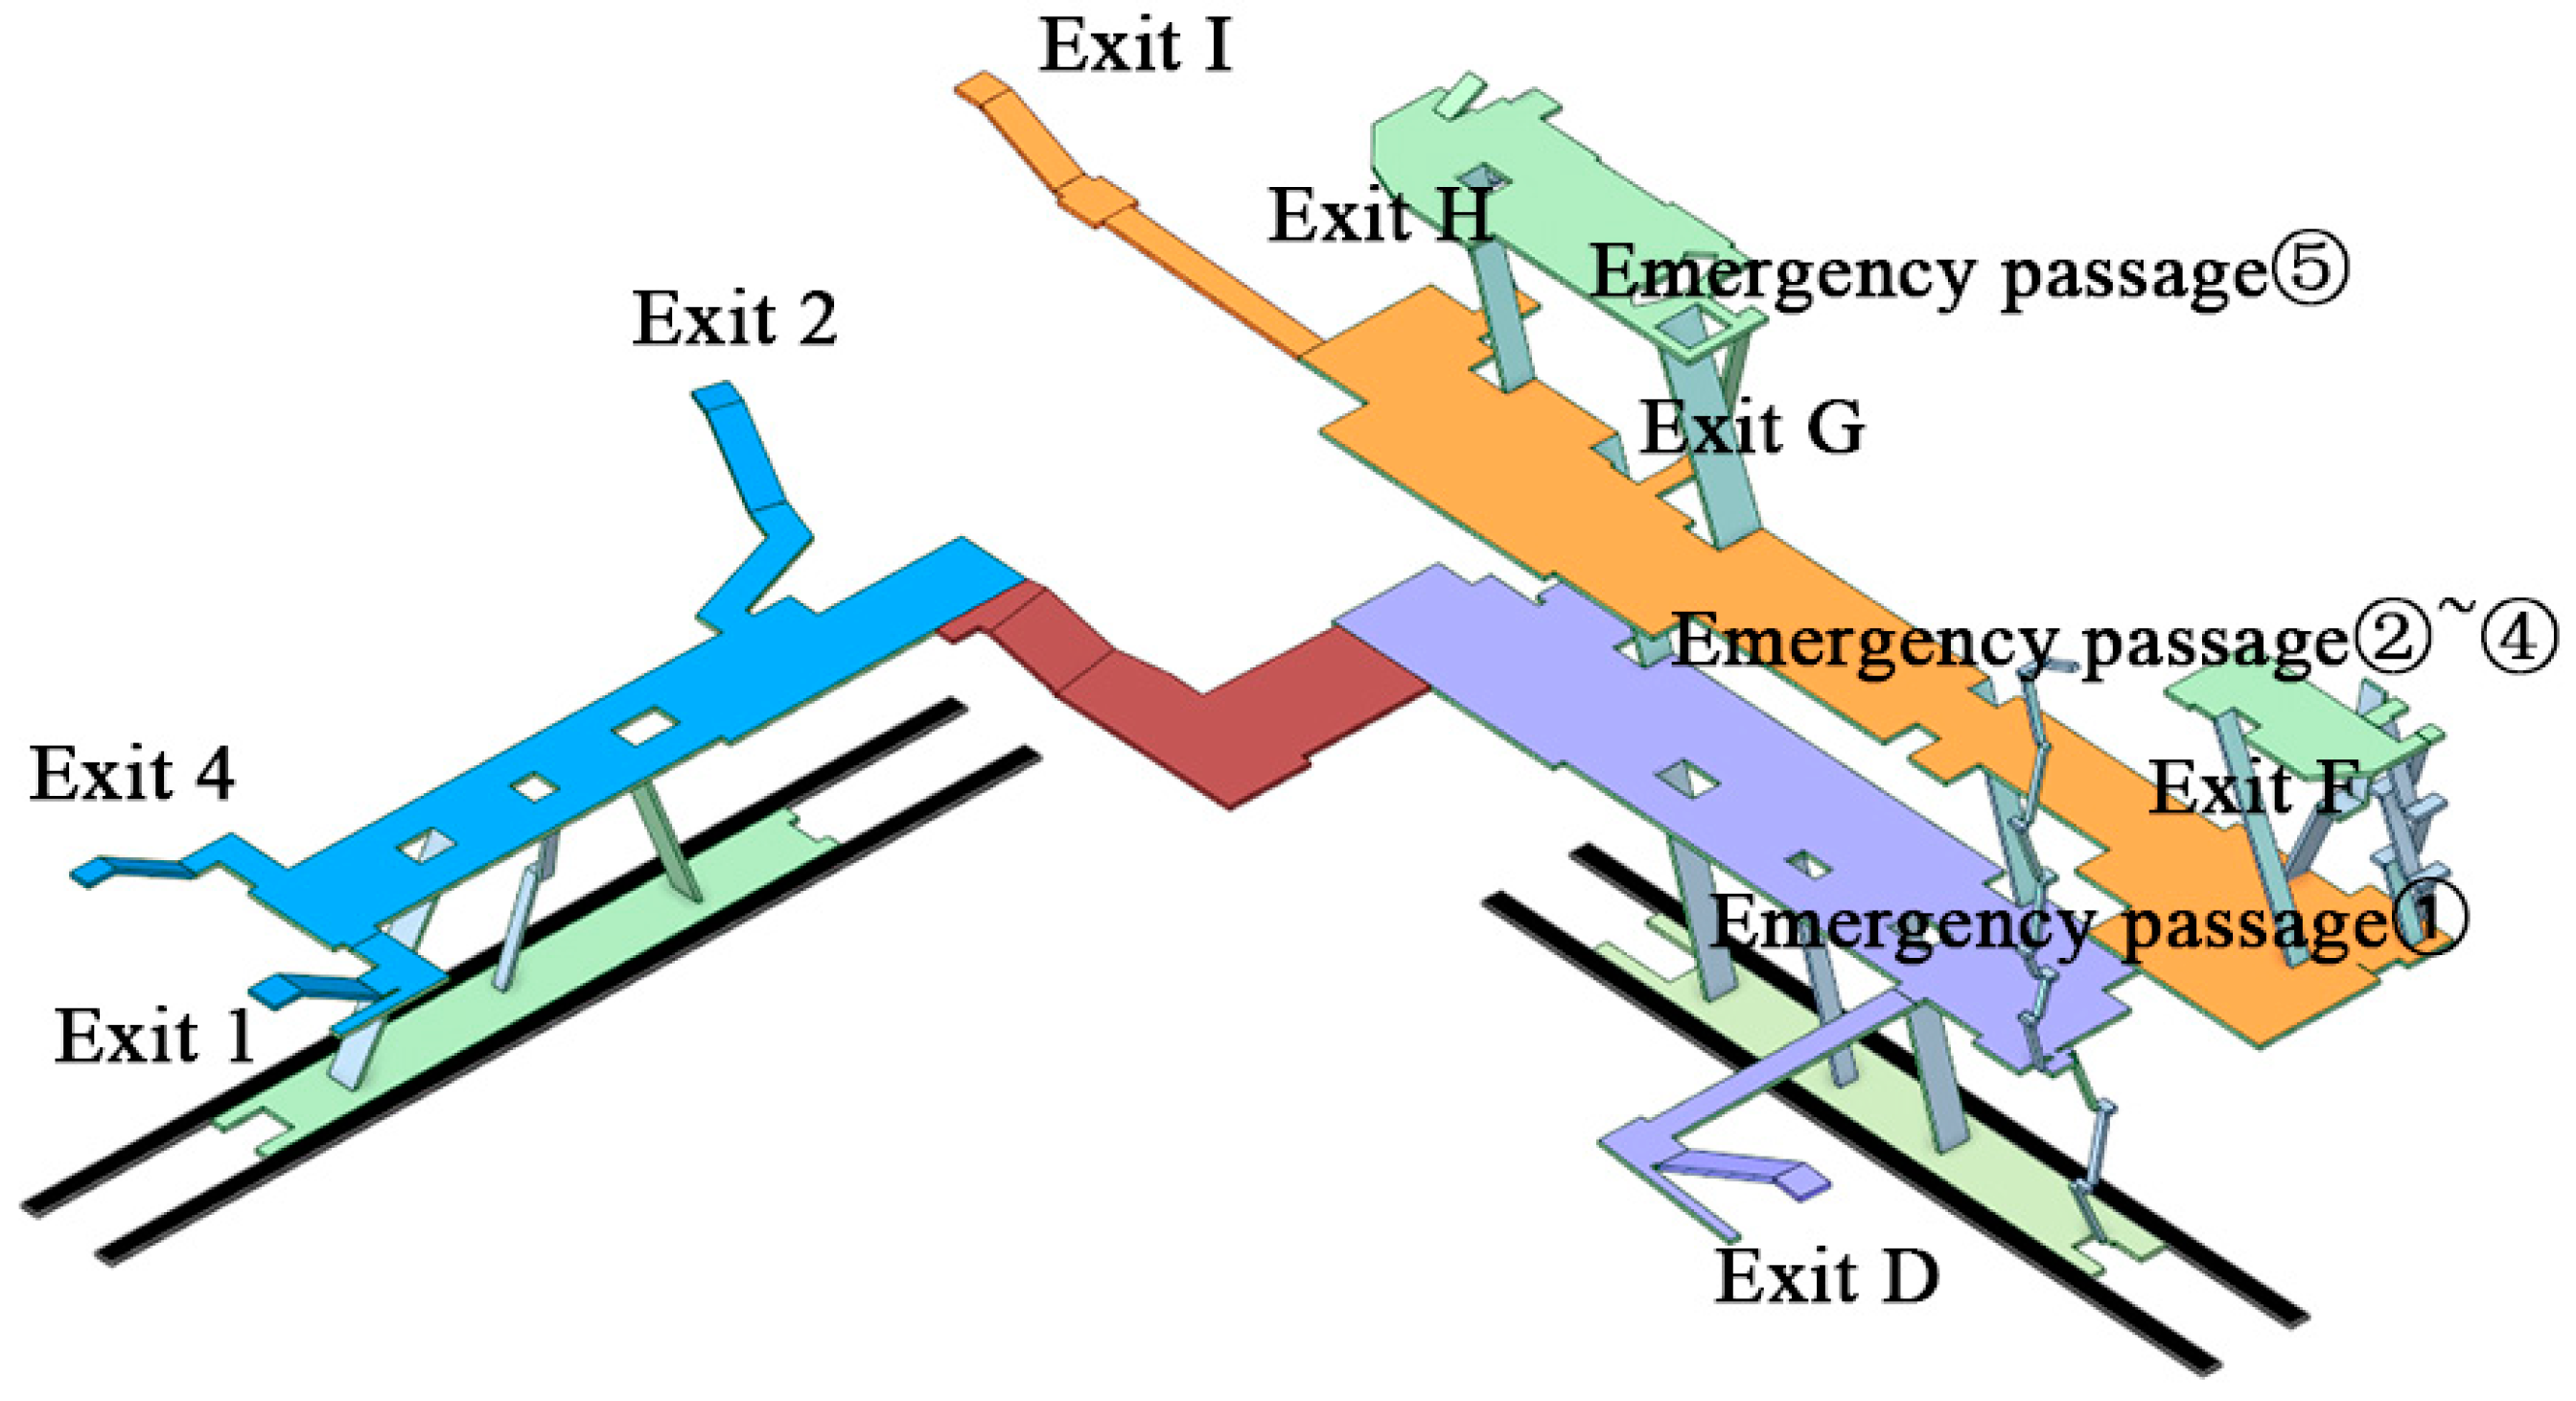
2.1. Target Study Subway Station Profile

Nanning City is located in the Yongjiang River Valley Basin, with abundant water resources and rainfall. It is prone to heavy rainfall disasters and urban waterlogging. This study took the underground building part of an interchange station of Nanning Rail Transit as the research object. The subway station is located in the old urban area of Nanning City (Figure 2). The terrain is low-lying, the passenger flow is large, the flood drainage facilities are old, and the surface road is prone to water accumulation. The calculated water level of the once-in-a-century flood is 76.95 m, which is higher than the subway station ground height of 75.84 m. The station entrances and exits are within the range of the once-in-a-century flood. The main structure of the subway station consists of the second-floor underground island platform station of Line 2 and the third-floor underground island platform station of Line 5, which is an “L”-shaped transfer (Figure 3). Line 2 has a total length of 218 m and a total width of 21.7 m, with 3 exits; Line 5 has a total length of 188 m and a total width of 31.5 m, with 5 exits and 5 emergency safety passages. Each exit is provided with a three-step platform and slot for flood baffle. The subway line follows the energy-saving design principle of “high station location, low interval”, and the overall tunnel in the interval has a “V”-shaped longitudinal slope. The Line 5 part of the subway station includes a sunken square and a large area of underground property development floor. There are many flood intrusion channels, and the building structure and flood intrusion paths are complex (Figure 4).

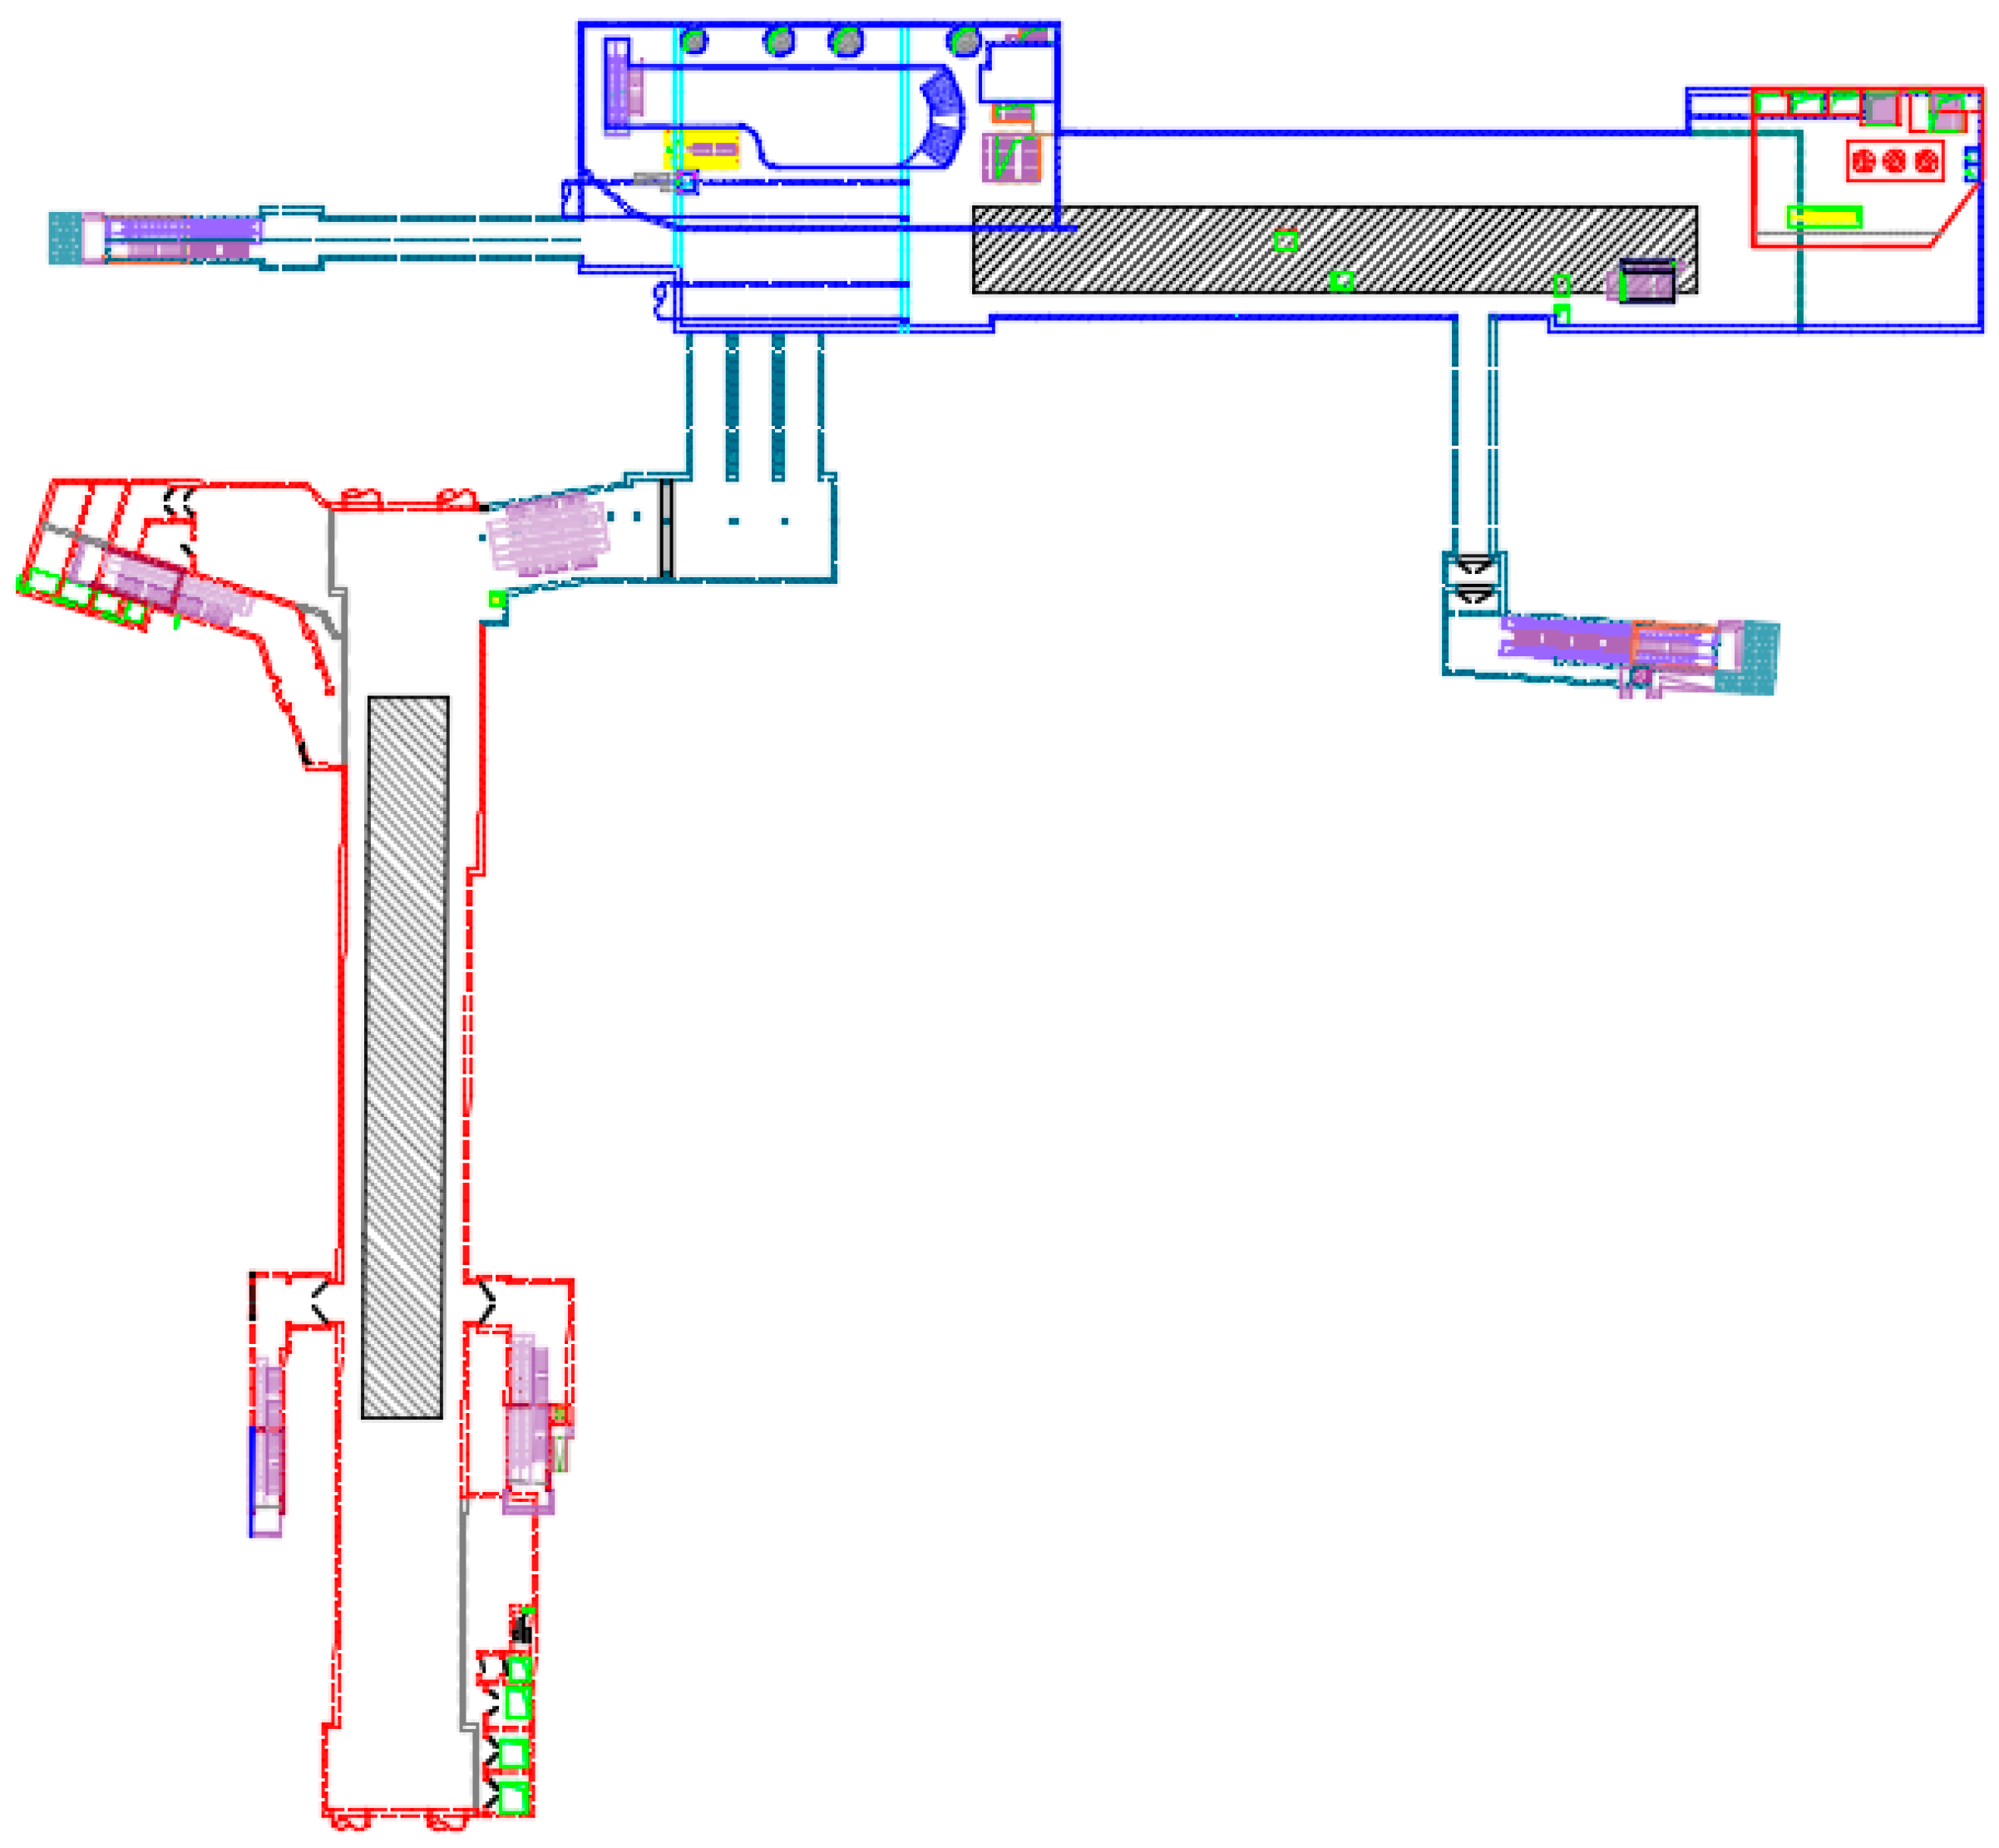
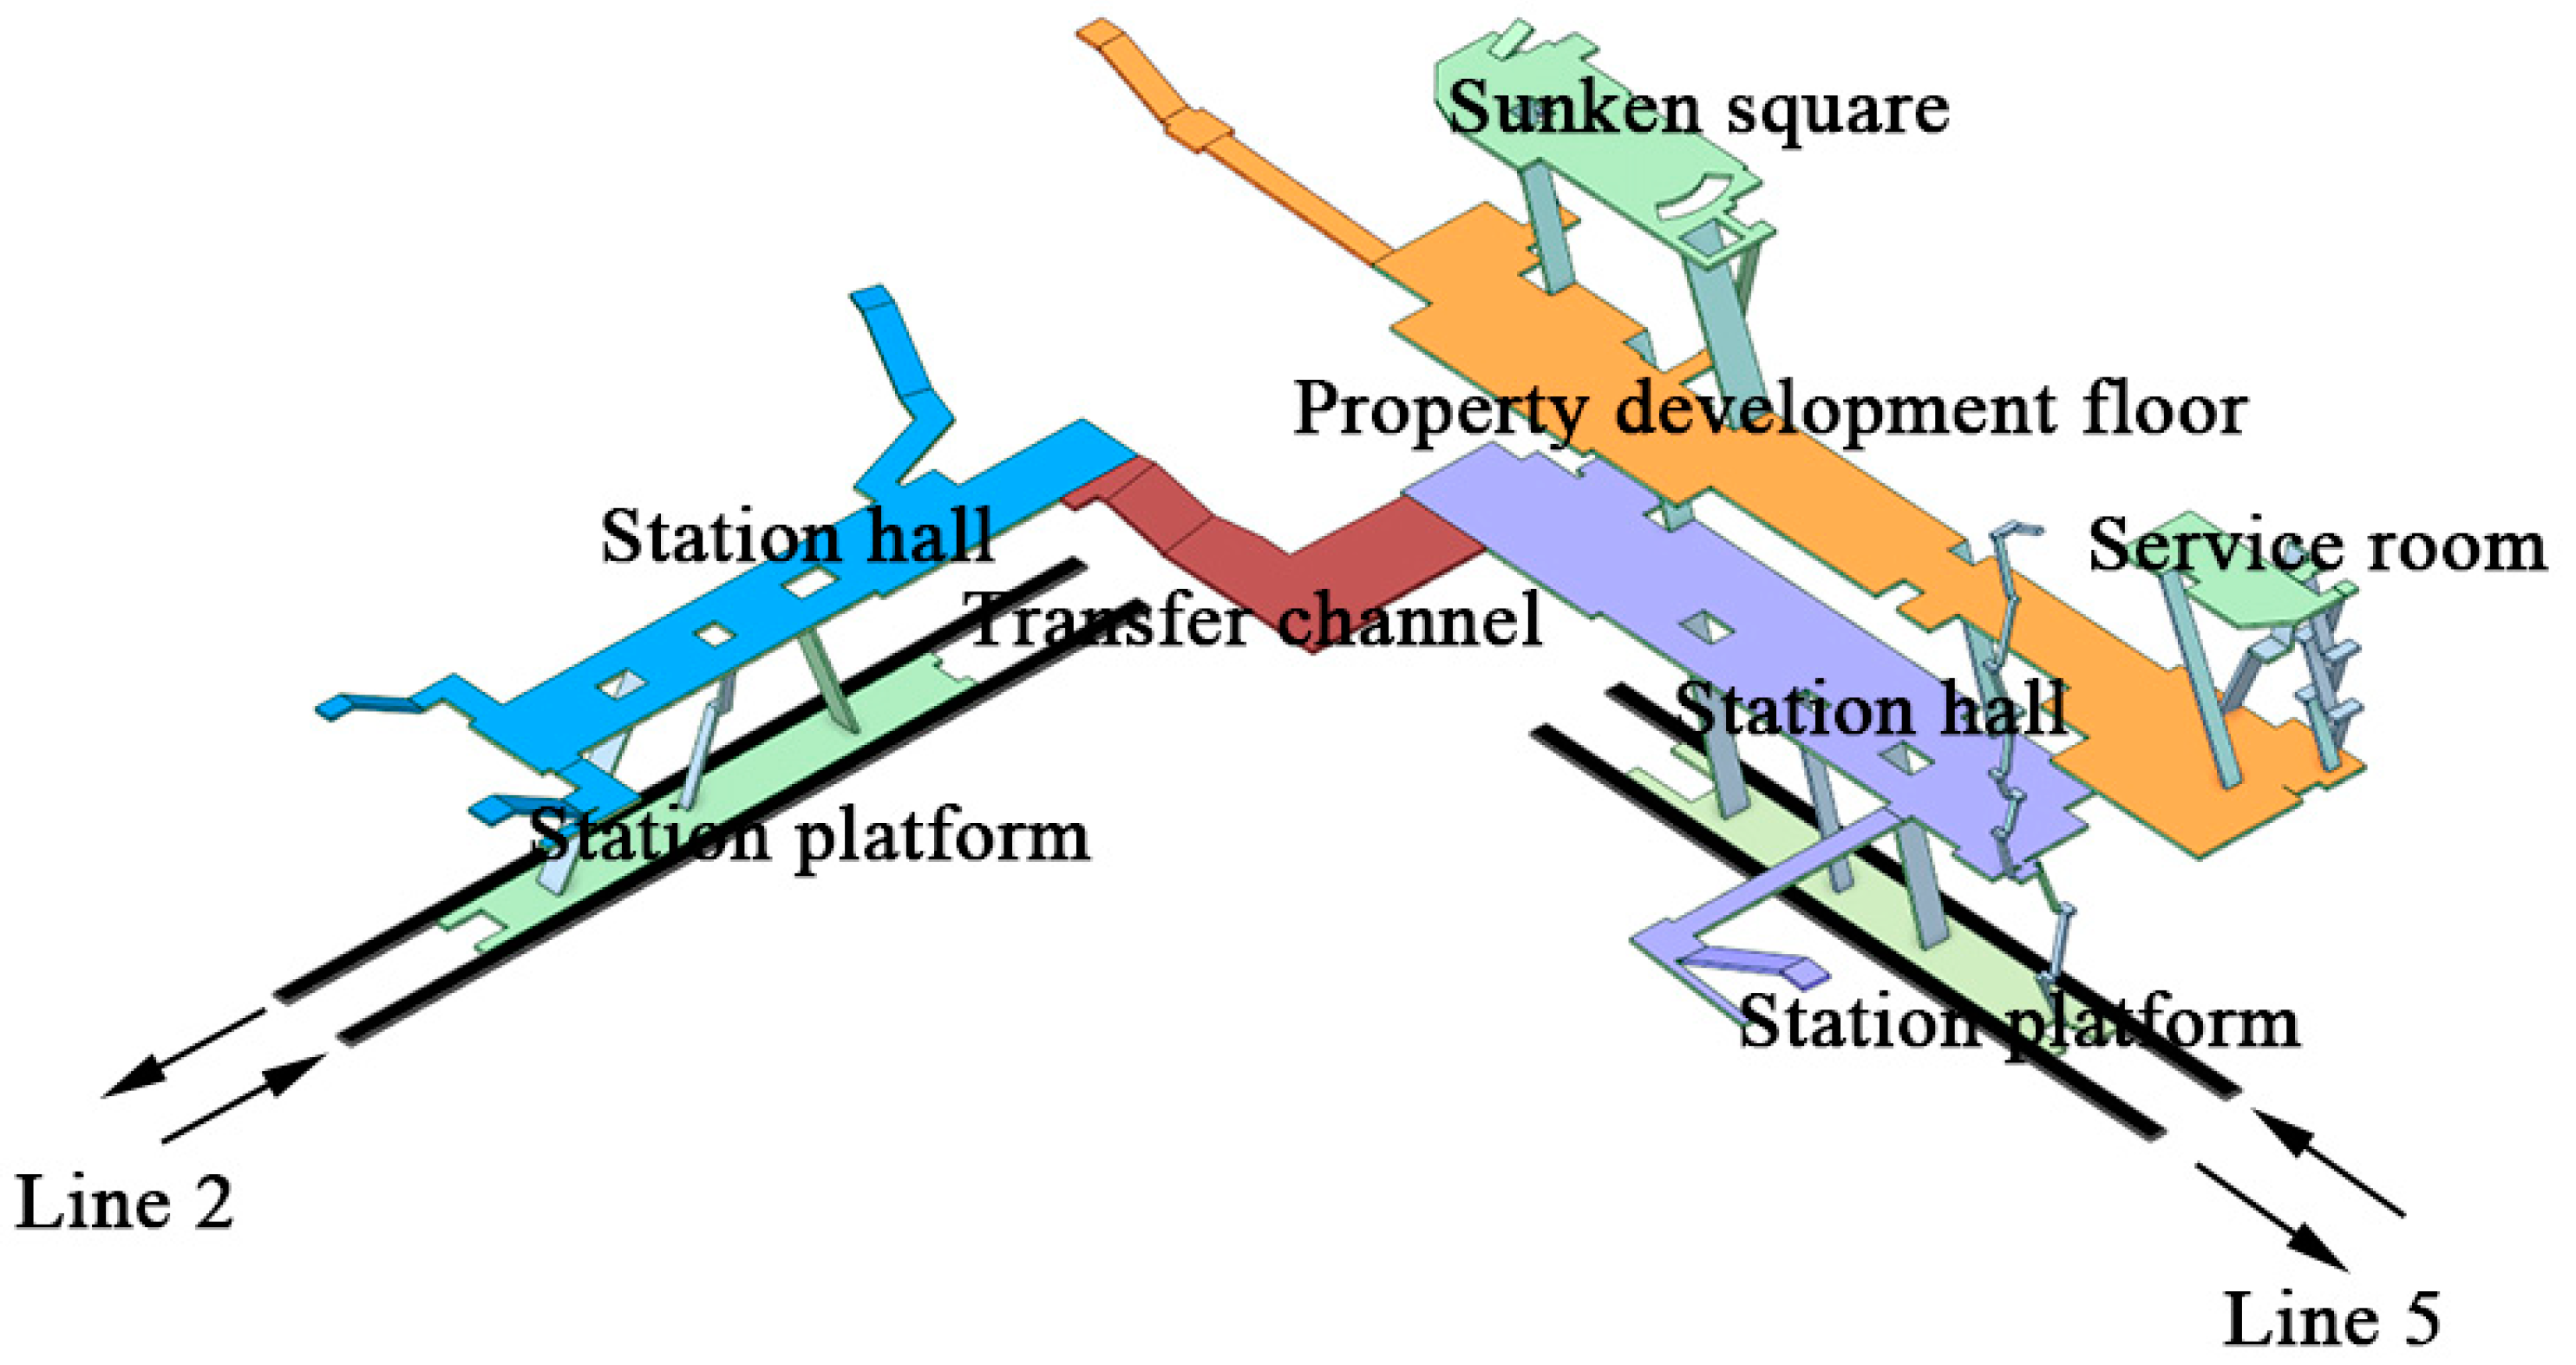
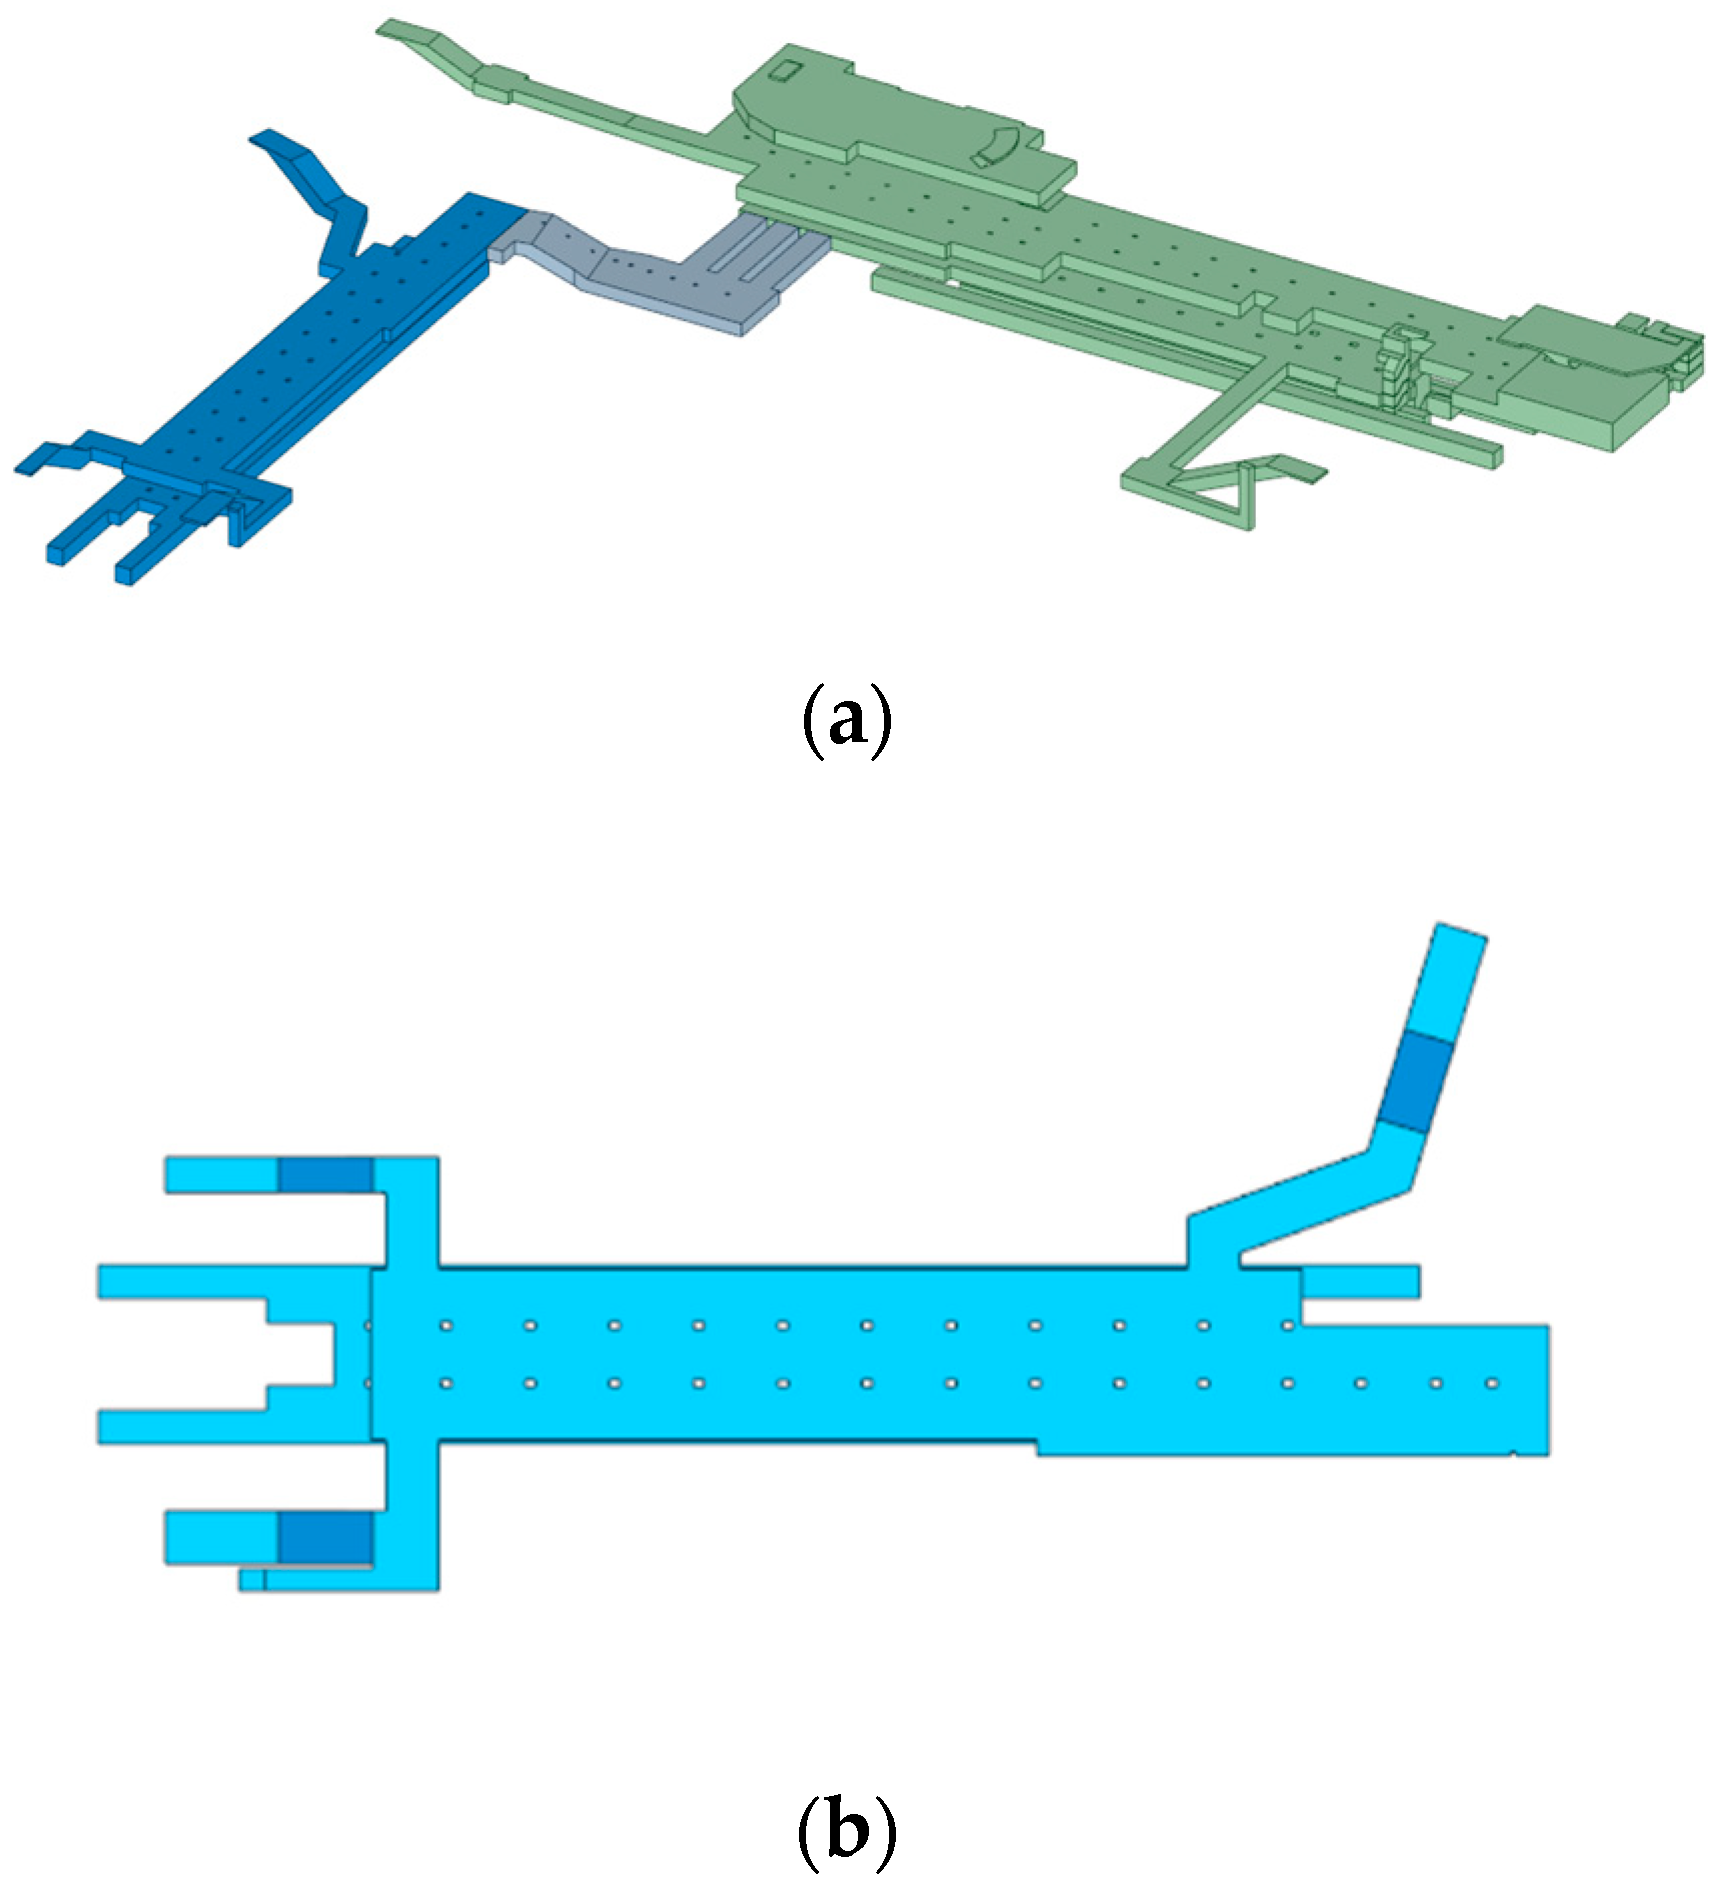
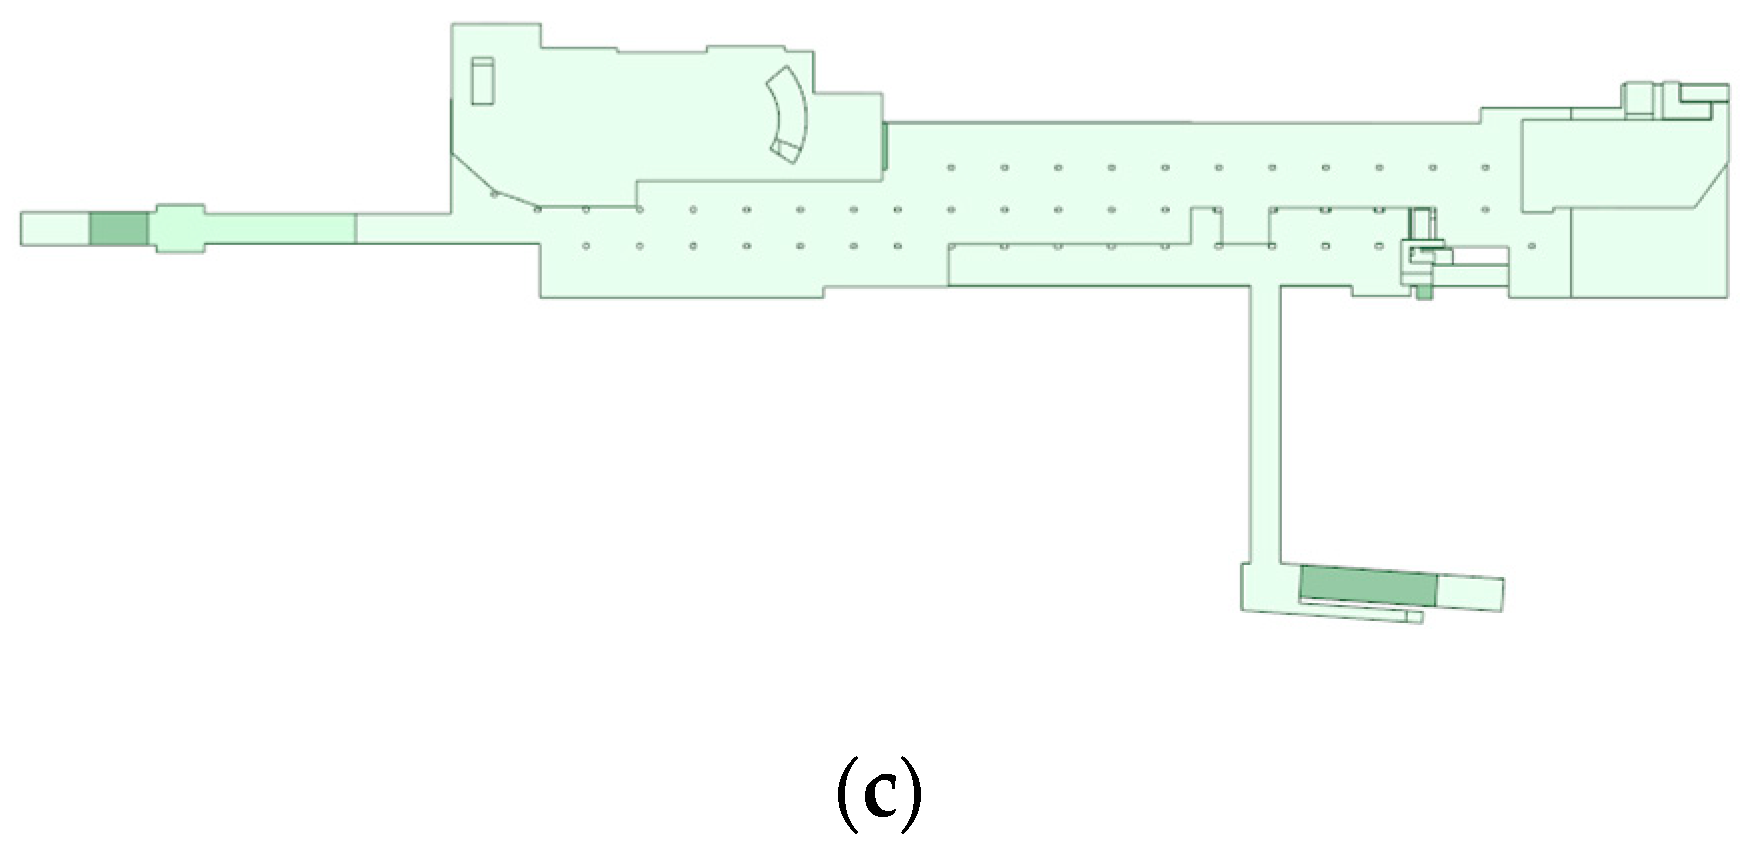
2.2. Geometric Model

The 3D geometric model of the subway station was established using geometric modeling software (Figure 5), and the flow field geometric domain modeling was completed for the space within the building decoration line through the volume extraction method. We included the Line 2 station hall floor and platform floor, Line 5 property development floor, station hall floor and platform floor, sunken square and station entrance service room, as well as transfer, entrance, and exit passages, barrier-free elevators, and emergency safety passages. In the modeling process of the numerical geometric model, only the process of flood intrusion into the public area was considered, while the influence of the equipment management room on the flood flow was not considered. The elevation of the entrance and exit was set to 76.29 m according to the ground elevation of 75.84 m plus the height of the three-level 0.15 m step. For simplification of the interior space of the subway station, the entrance and exit passages and the stairs of the internal passage were simplified as inclined planes. The influence of the station vent on the water flow during the water intrusion process was not considered, and small facilities such as ticket gates, ticket machines, etc. were ignored. The tunnel intercepts the part from the station to the floodgate.

2.3. Theoretical Background

This study focused on the flood flow process in the subway station, the point of which is on the capture of the free surface of the water flow. The VOF (Volume of Fluid) method is commonly used in the numerical simulation of free surface tracking. The VOF method was proposed by Hirt and Nichols [42] in 1981. The method simulates the motion of two or more fluids by solving a set of momentum and continuity equations, tracking the volume occupied by each fluid to determine the free surface. Due to its high accuracy, good stability, and flexible meshing, the VOF model has been widely used in the research of open channels, dams, valves, pumps, and other fields. For the gas–liquid two-phase flow model in this study, the core idea of the VOF model is that the sum of the volume fractions α of water and air in each unit is 1:
α w + α a = 1
If α w = 1 , it means that the unit is full of water; if α w = 0 , the unit is full of air; if 0 < α w < 1 , the unit is partly water and partly air, and the unit must contain free liquid surface. Taking water in the liquid phase as an example, the governing equation of its volume function is:
α w t + u i α w x i = 0
where: t is time; u i and x i are the velocity and coordinate components. In this study, the isosurface with a volume fraction of 0.5 was regarded as a free interface for water flow.
In this study, the target study station was an interchange station, and the influence of complex structures such as columns was considered. The water flow is complex and the streamline is curved. Therefore, the turbulence equation adopts the Renormalization Group k-ε model (RNG k-ε model) [43]. The k-ε model equation is as follows:
t ( ρ k ) + x i ( ρ k u i ) = x i [ α k μ e f f k x j ] + G ρ ε
t ( ρ ε ) + x i ( ρ ε u i ) = x i [ α ε μ e f f ε x j ] + C 1 ε * ε k G C 2 ε ρ ε 2 k
where, ρ is fluid density, k is turbulent kinetic energy, ε is turbulent dissipation rate, μ e f f is effective viscosity coefficient, μ e f f = μ + μ t ,   μ t = ρ C μ k 2 / ε , where μ is dynamic viscosity coefficient, μ t is the turbulent viscosity coefficient, C μ is the viscosity constant; G is the turbulent kinetic energy generation term caused by the average velocity gradient, C 1 ε * = C 1 ε η ( 1 η / η 0 ) / ( 1 + β η 3 ) , η = 2 S i , j · S i , j k / ε , S i , j = ( u i / x j + u j / x i ) / 2 , and α k and α ε are the inverse effective Prandtl numbers of turbulent kinetic energy and turbulent dissipation rate, respectively. The values of the above constants are C μ = 0.0845 , C 1 ε = 1.42 , C 2 ε = 1.68 , α k = α ε = 1.393 , β = 0.012 , and η 0 = 4.38 .

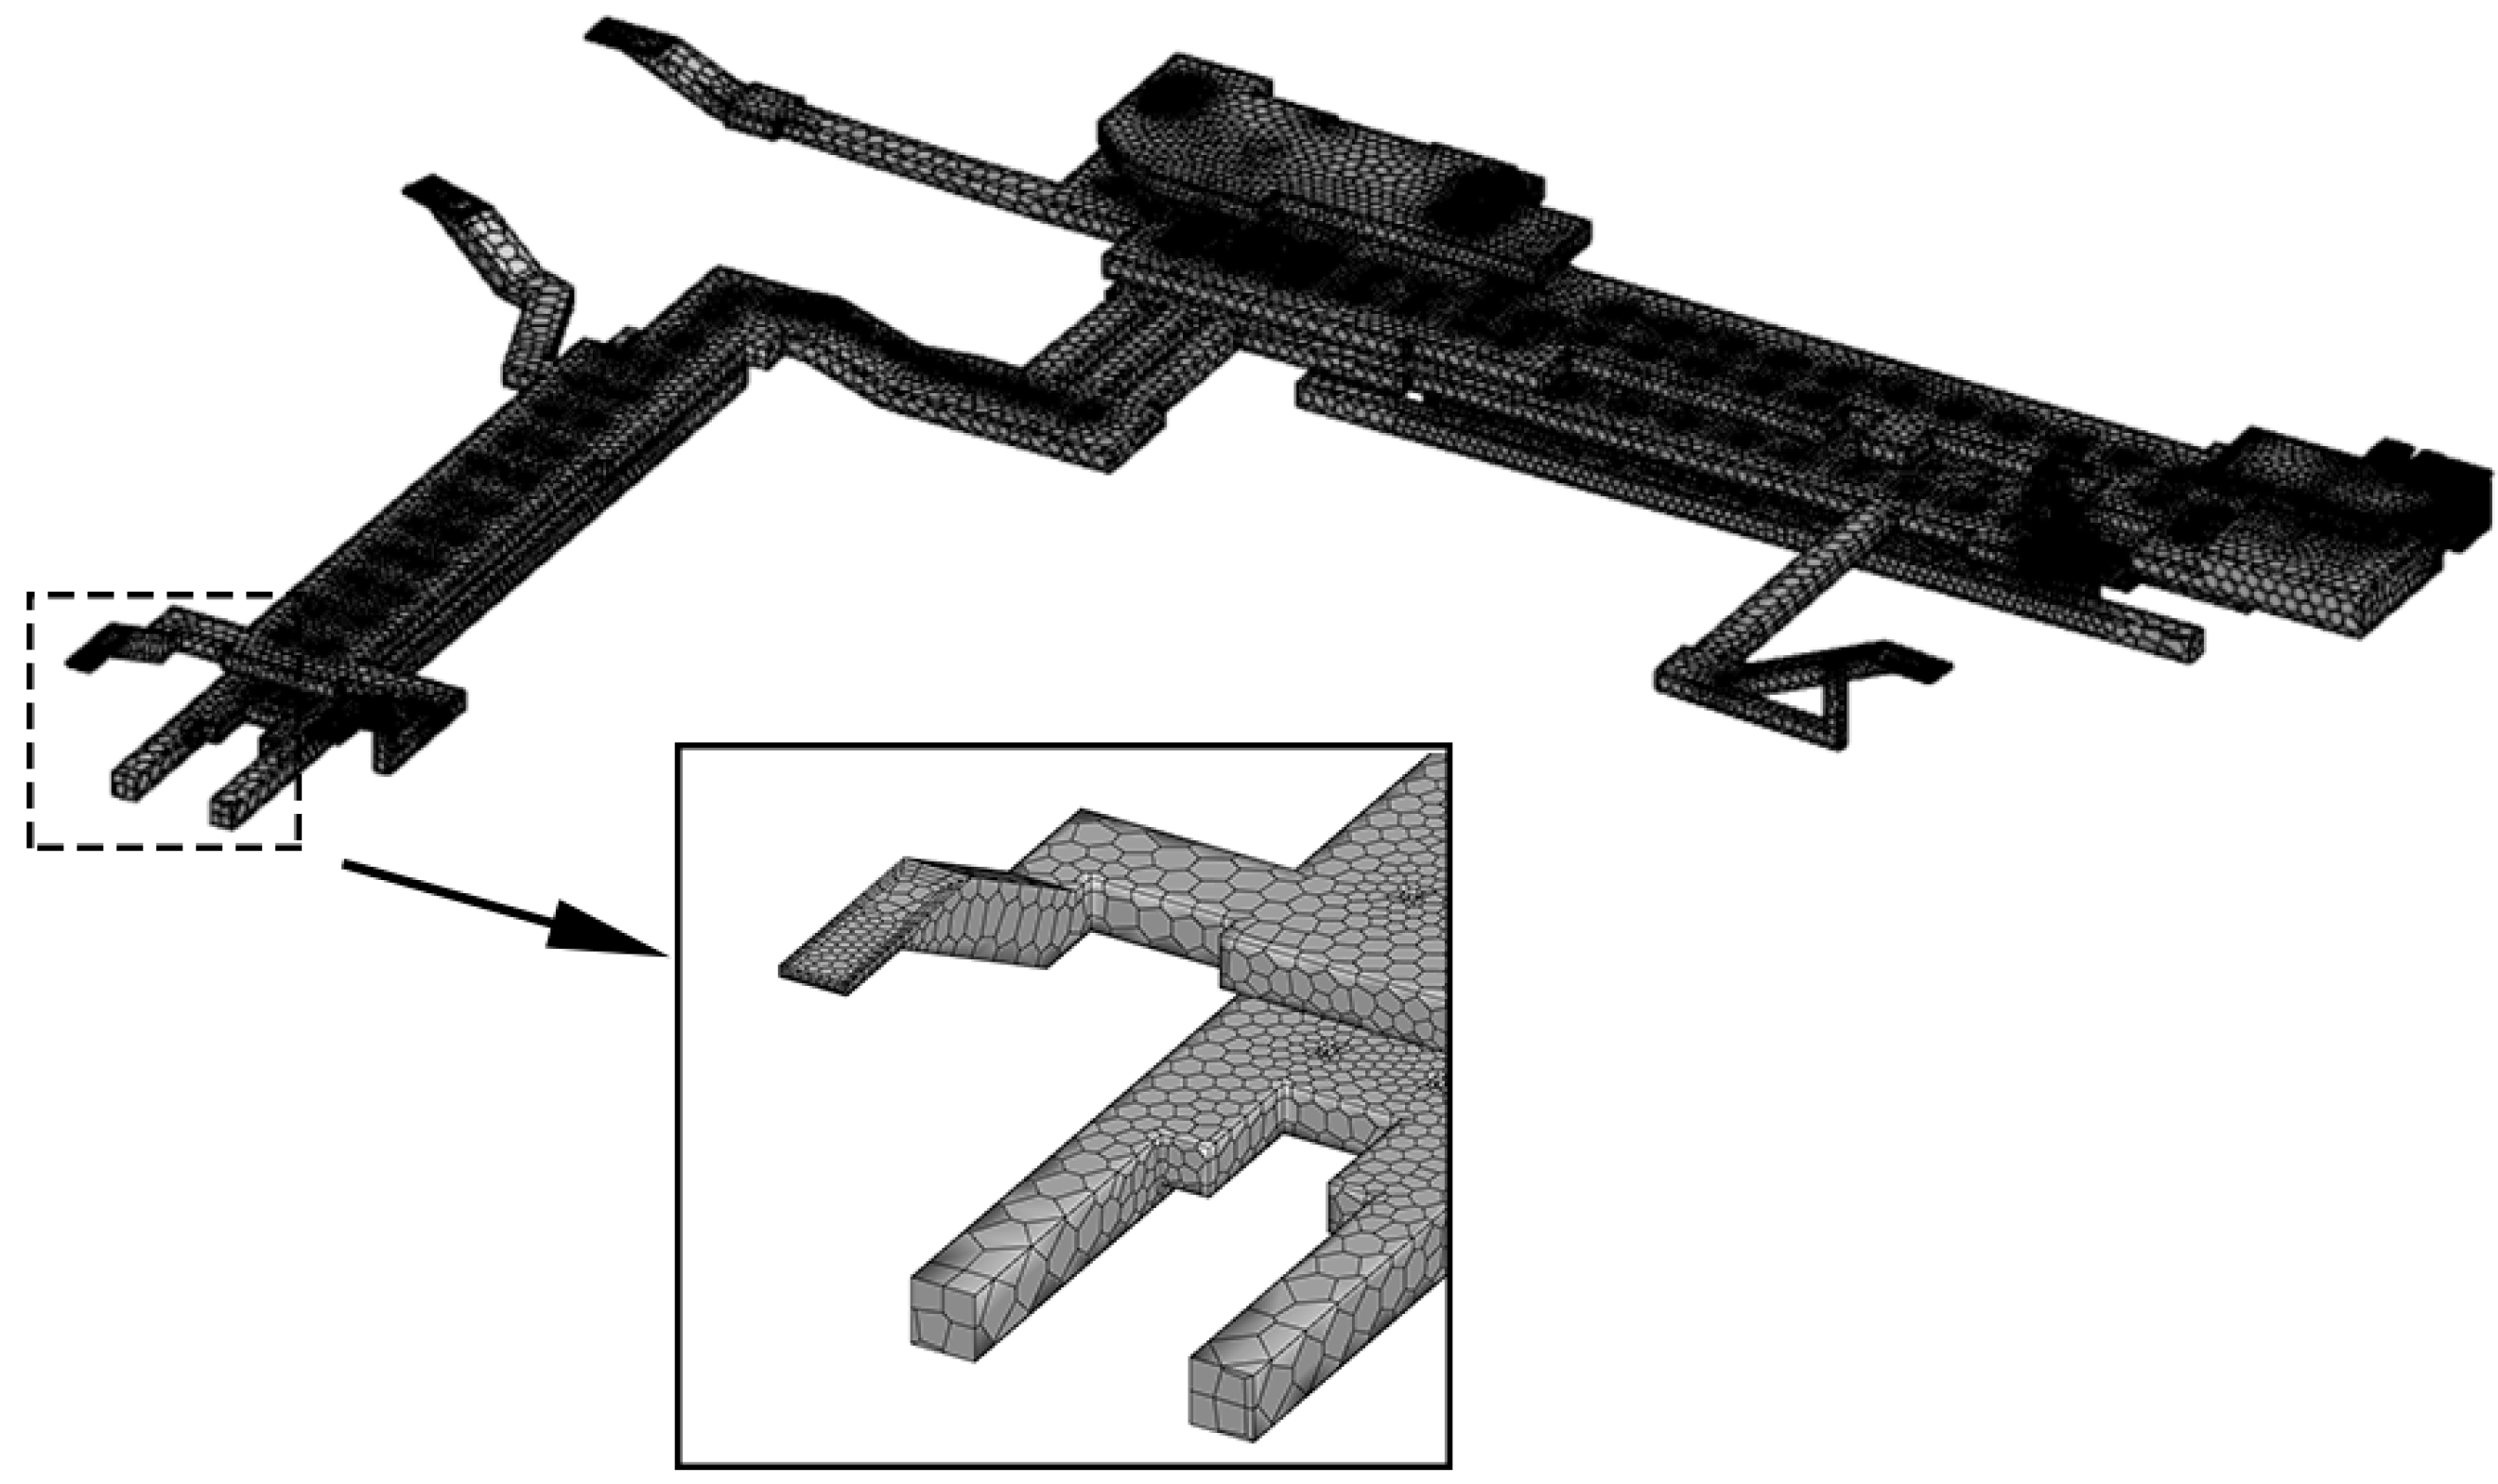
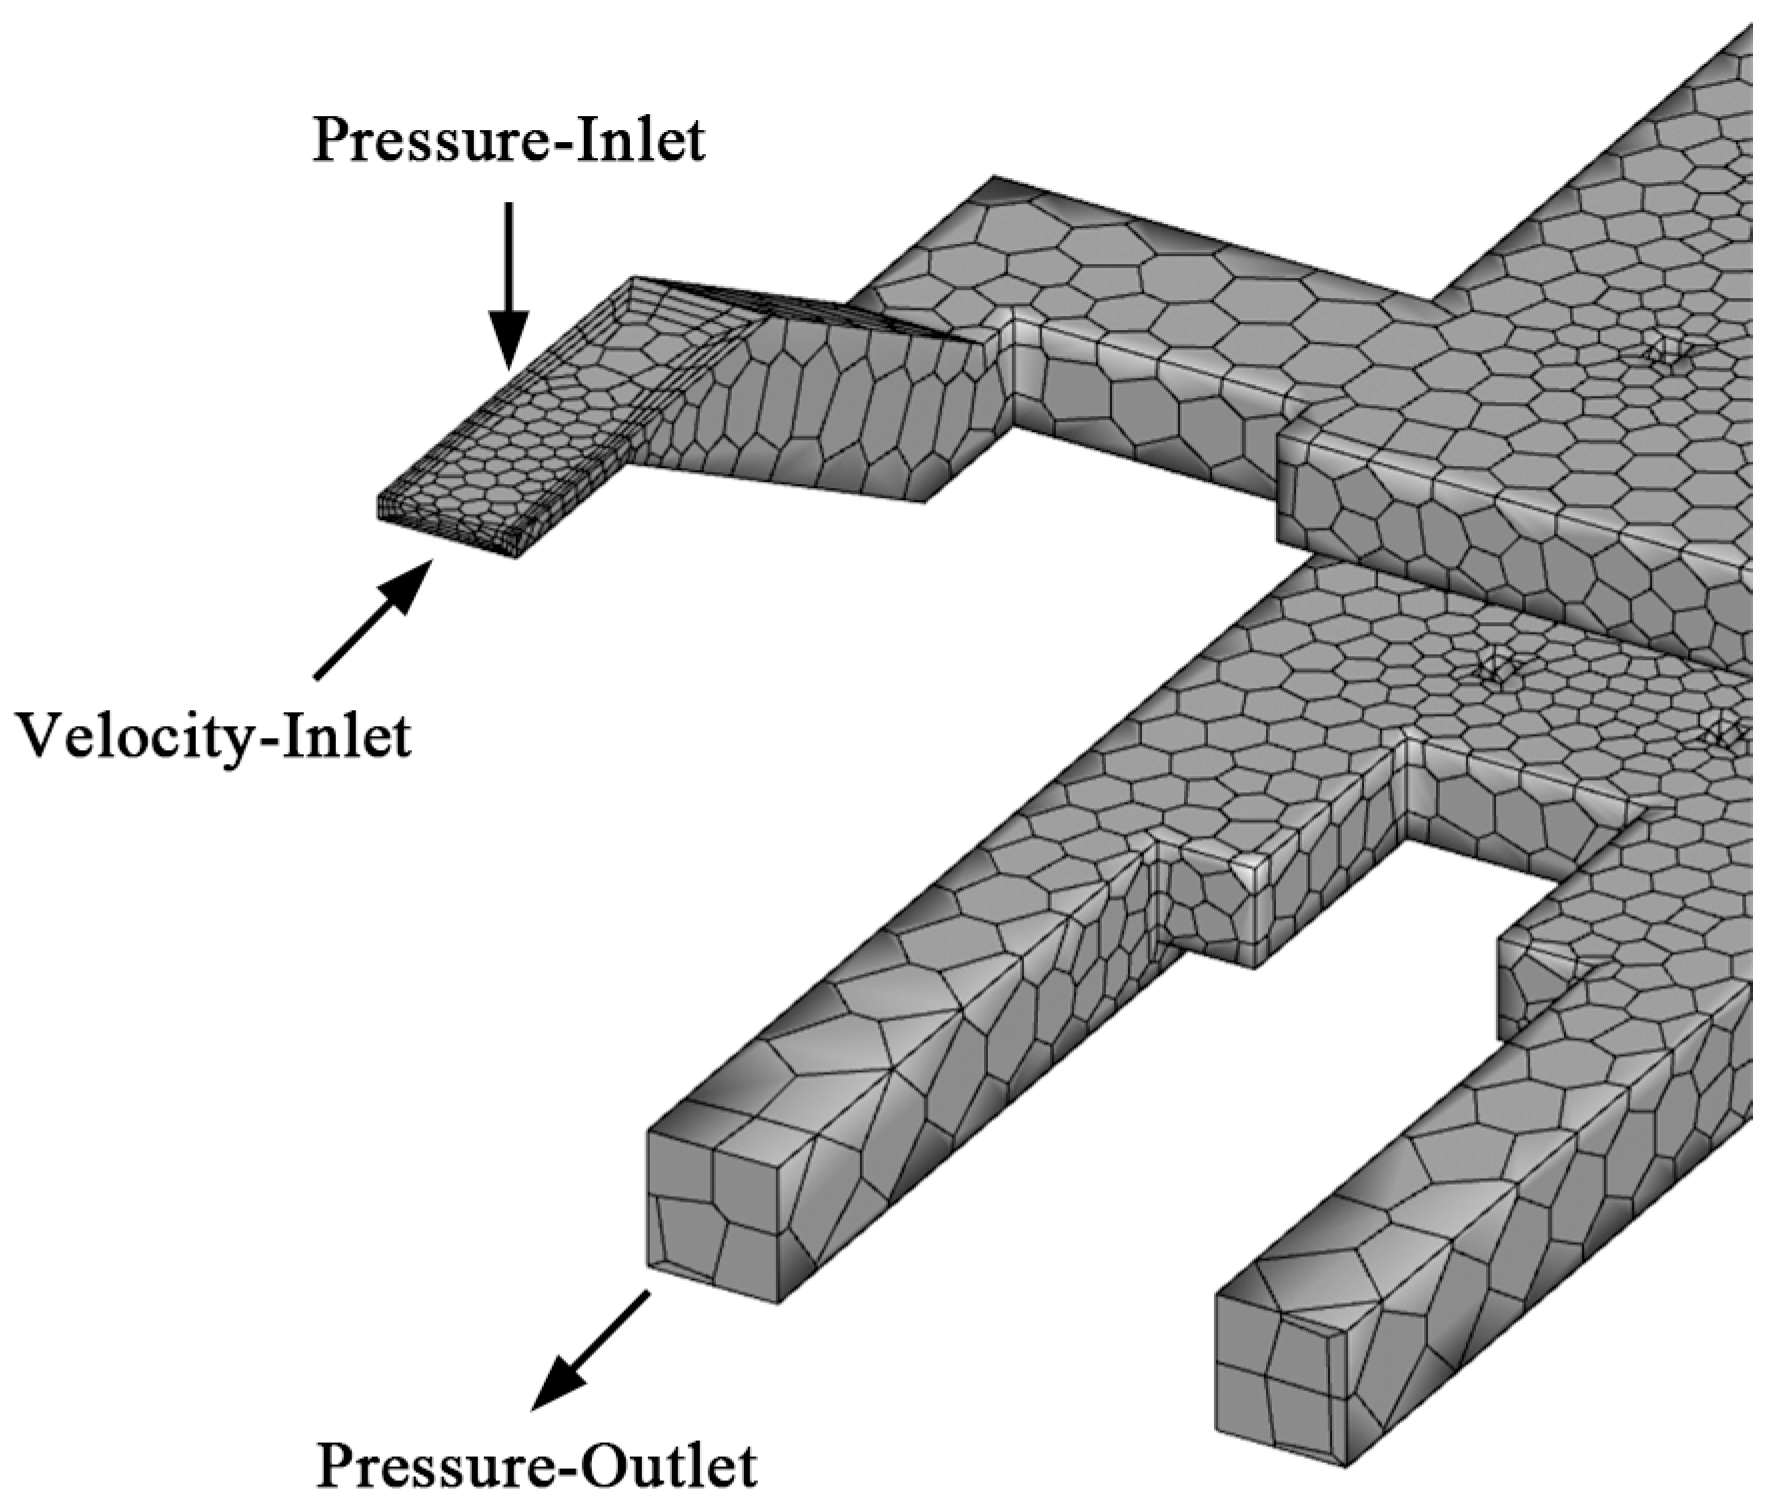
2.4. Meshing and Boundary Condition Setting

The Poly-Hexcore meshing method was used to divide the mesh (Figure 6). The Poly-Hexcore mesh consists of layered polyhedron grids, pure polyhedron grids, and hexahedral grids. The mesh surface of this method is generally honeycomb-shaped, the regularity of each element is high, and the connectivity between the elements is good. For the meshing of complex models, the Poly-Hexcore meshing method can better take into account the meshing efficiency and convergence speed than the traditional tetrahedral unstructured meshing method.
The most unfavorable situation in which the surface water intrudes the subway station from all entrances and exits, barrier-free elevators, and safety emergency safety passages (Figure 7) was simulated and studied under the condition of the calculated water level of the once-in-a-hundred-year flood, that is, the surface water height is 0.66 m. The relationship between intrusion flow and surface water height is given by Ishigaki et al. [44] through the flood intrusion test of the actual-size stairs model,
q = 1.98 h 1.621
where, q is the flood intrusion unit-width flow, m 2 / s and h is the water depth above the entrance and exit ground, m . According to Equation (5), the water flow velocity inlet boundary condition is set, and the flood flow mass intruding the subway station is controlled by the constant inflow velocity. The velocity inlet condition is controlled by the initial value of turbulent kinetic energy k 0 and the initial value of turbulent dissipation rate ε 0 . The calculation method is as follows.
The inflow turbulence intensity I is calculated as follows,
q = 1.98 h 1.621
The initial value of turbulent kinetic energy k 0 is calculated as follows,
q = 1.98 h 1.621
The initial value of turbulent dissipation rate ε 0 is calculated as follows,
q = 1.98 h 1.621
where, R e D is the Reynolds number calculated according to the hydraulic diameter D , the hydraulic diameter D is equal to 4 times the hydraulic radius in hydraulics, that is, D = 4 A / χ , A is the area of the water-passing section, and χ is the wetted circumference; u ¯ is the inflow velocity; C μ 0 is taken as 0.09; l   = 0.07 L , L is the length scale of turbulent flow, and, for fully developed turbulent flow, L = D is taken.
The upper boundary of the inlet was set as the gas-phase pressure boundary to ensure that the air pressure on the interface between the inside and outside of the model air was always the standard atmospheric pressure. The pressure outlet boundary was set at both ends of the tunnel to simulate the whole process of flood inflow under the condition of the floodgate being opened (Figure 8).

3. Result Analysis

3.1. Process of Water Intrusion

When the flood intruded for about 10 s, the floodwater quickly passed through the entrance passages due to the high intrusion water level and the acceleration of the flood on the entrance ramp under gravity (Figure 9a). When the flood intruded for about 30 s, the floodwater entered the first underground floor, namely the station hall floor of Line 2 station and the property development floor of Line 5 station. At the same time, water accumulated on the sunken square, and the floor of the station service room on the surface was almost completely inundated (Figure 9b). When the flood intruded for about 60 s, in the station of Line 2, a small amount of water accumulated on the station hall floor, and the flood water advanced to the platform floor through the internal passages and flowed out of the station from both ends of the tunnel of Line 2; a large area of water accumulated on the property development floor of the station of Line 5 (Figure 9c). When the flood intruded for about 120 s, the floodwater at the station hall floor of the Line 2 station began to flow into the lower-lying Line 5 station, and a large amount of flood water at the Line 5 station advanced to the platform floor through the internal passages and flowed out of the station from both ends of the Line 5 tunnel (Figure 9d). When the flood intruded for about 300 s, the flood inundated area tended to be stable, and most of the intruding floodwater flowed out of the station through the tunnel. The flood accumulation mainly occurred on the Line 5 station property development floor and the station hall floor area in the direction of the station entrance service room; the water volume fraction of most areas on the platform floor and hall floor of the Line 2 station was less than 0.5, which means that there was no water accumulation (Figure 9e). When the flood intruded for about 600 s, the outflow flood volume of the tunnel was close to the intrusion flow, and the overall inundation process of the station tended to be stable (Figure 9f).
Different from general subway stations, the property development floor in complex stations which combine subway and property development area tend to have more entrances and exits, so the vulnerability to flood inundation disaster on property development floor is often higher. The large-scale property development area reserved in Line 5 of the subway station studied in this study is the most important part of flood accumulation after flood intrusion. Setting up a water level monitoring point every 20~30 m on the property development floor, there were seven monitoring points in total (Figure 10). We monitored and drew a graph of the relationship between water depth and time (Figure 11), and a graph of the relationship between the growth rate of water depth and time (Figure 12). Within 1 to 3.5 min of the flood intrusion, the overall water accumulation on the property development floor increased rapidly. The water depth of No. 1~5 monitoring points exceeded 40 cm, and the water depth of No. 6 and No. 7 monitoring points exceeded 30 cm. The average growth rate reached 12 cm/min. About 3.5 min after the flood intrusion, the water depth of the monitoring point became stabilized. Zheng et al. [45] divided the movement behavior of evacuees into four stages according to the water depth. When the water depth is less than 10 cm, pedestrians can walk normally; when the water depth range is 10~50 m, pedestrians can walk slowly; when the water depth is in the range of 50~70 cm, the movement speed of pedestrians is seriously hindered, and it is necessary to proceed to the nearest exit or shelter with a shallow water level; when the water depth exceeds 70 cm, pedestrians are completely unable to walk and need to wait for rescue on the spot. The time when the water depth of each monitoring point exceeds 50 cm is shown in Table 1. Within 7 min of the flood intrusion, the water depth on most areas of the property development floor exceeded 50 cm, which seriously hindered the evacuation of personnel; personnel far from exits should seek shelter nearby. Since there are many entrances and exits near the No. 1 monitoring point, along the positive direction of the X-axis in Figure 10, the water level of the monitoring point generally tended to increase gradually, and the time the occurrence of water accumulation tended to gradually advance. It is recommended to choose the negative direction of x in Figure 10 for the evacuation direction of personnel on the property development floor. In addition, 7 min after the flood intruded, personnel on the platform floor of the station hall of Line 5 are recommended not to evacuate to the property development floor. For subway flood control design, it is necessary to consider setting up emergency shelters in the property development floor where far away from the exit, and pay attention to water retaining and drainage facilities in areas with multiple water flow channels, such as the station entrance service room.

3.2. Analysis of Evacuation Passages

In this study, there were eight exits and five emergency safety passages in the subway station studied (Figure 7). There were three entrances in the exits with a relatively large amount of flood water stagnant, namely Exit 4, Exit D, and Exit F. Setting up specific monitoring points 1 m before the entrance midpoint of all emergency safety passages and the three exits, we can monitor the relationship between the water depth changes within 10 min at the population of each evacuation passage. Based on Higo’s research on pedestrian movement in floods [46], the pedestrian movement speed v g is defined as follows:
v g = { v g 0 l < l l i t t l e [ v g 0 × ( 1 l / l max ) × λ ( w a l k , t ) ] l l i t t l e l l max
In the formula, the maximum walking speed of pedestrians is v g 0 = 1.5 m/s; the water depth where the flood has little effect on pedestrian movement was set as l l i t t l e = 0.1 m; the critical maximum water depth where pedestrians cannot walk was set as l max = 0.7 m; λ ( w a l k , t ) is the fatigue decay rate of pedestrian walking speed. In this study, it was assumed that pedestrians do not reduce their walking speed due to fatigue, that is, λ ( w a l k , t ) = 1.
The movement speed curve of pedestrians at the entrance of the three dangerous exits was calculated (Figure 13). The results showed that the depth of water accumulation at the entrance of Exit 4 was stable at about 30 cm, and the pedestrian’s moving speed was reduced by about half, which made it possible to evacuate slowly; the speed of water accumulation at the entrances of Exit D and Exit F was relatively faster, exceeding 50 cm in about 3 to 4 min, and the moving speed of pedestrians would be reduced to below 0.25 m/s, which would not be suitable for pedestrians to evacuate. Evacuating personnel should try to choose other exits.
All emergency safety passages entrances were inundated (Figure 14); emergency safety Passages ①~④ were designed to be long and narrow with multi-run stairs, so the flood stagnation phenomenon easily occurs at the entrance and rest platform. The flood water level at the entrance of Passage ① at the hall floor and the platform floor, and the Passage ② and Passage ③ connecting the service room were all more than 70 cm deep, which pedestrians would not be able to move through [45]. In the prevention of rainstorm and waterlogging disasters in subway stations, emphasis should be placed on strengthening the water blocking and drainage measures of emergency safety passages.
Passages with barrier-free vertical elevators will flood faster due to relatively large flood intrusion flows. Compared with the straight entrance passage, although the flood intrusion speed is slower in the entrance passages with corners, the high water level caused by the flood impact is prone to occur outside the corner (Figure 15), which is not conducive to people walking. Therefore, personnel should try to choose the line inside the corner of the passage when evacuating. In the simulation process of this study (Figure 9), there was less water accumulation at the entrances of subway station Line 2 exits, and people in subway station Line 2 are recommended to be evacuated by the nearest entrance and exit passages; people in subway station Line 5 are recommended to choose the relatively spacious Exit I and Exit D as evacuation passages.

3.3. Amount of Water Flowing into the Tunnel

The floodgate is mainly used to prevent the leakage of flood caused by the structural damage of the underground section of the subway. In this study, the two ends of the target study subway station tunnel were equipped with floodgates. In the results, the station hall floor and platform floor had less water accumulation area due to the influx of floodwater into the tunnel (Figure 9). It can be seen that compared with closing the floodgates in flood disasters, opening the floodgates is conducive to the discharge of intrusion floodwater in the subway station and the evacuation of station personnel. However, when the flood enters the tunnel, it may accumulate in the tunnel, threatening the safety of people and trains in the subway tunnel, and may even flow into other stations and cause more serious disasters. This study simulated and detected the mass flow rate of the flood flowing into the tunnels of Line 2 and Line 5 through the subway station under the most unfavorable working conditions (Figure 16), which can be used as a reference for the layout of tunnel drainage facilities. Calculated by the numerical integration method, a total of 3.59789 ×   10 5 L floodwater flowed into the tunnel in the first 10 min of the flood intrusion into the subway station, of which 1.77478 ×   10 5 L flowed into the tunnel of Line 2, and 1.82311 ×   10 5 L flowed into the tunnel of Line 5. After 10 min, the outflow and inflow mass flow rates of the station floodwater tended to balance. In order to prevent excessive accumulation of floodwater flowing into the tunnel, drainage facilities that match the calculated results should be installed in the tunnel.

4. Conclusions

Aiming at the current situation of frequent rain and flood inundation accidents in subway stations, this study built a three-dimensional numerical simulation model of a transfer station in Nanning, and simulated the entire process of flood intrusion into the station from all exits and emergency safety passages at the height of once-in-a-century surface water. The research conclusions are as follows:
(1)
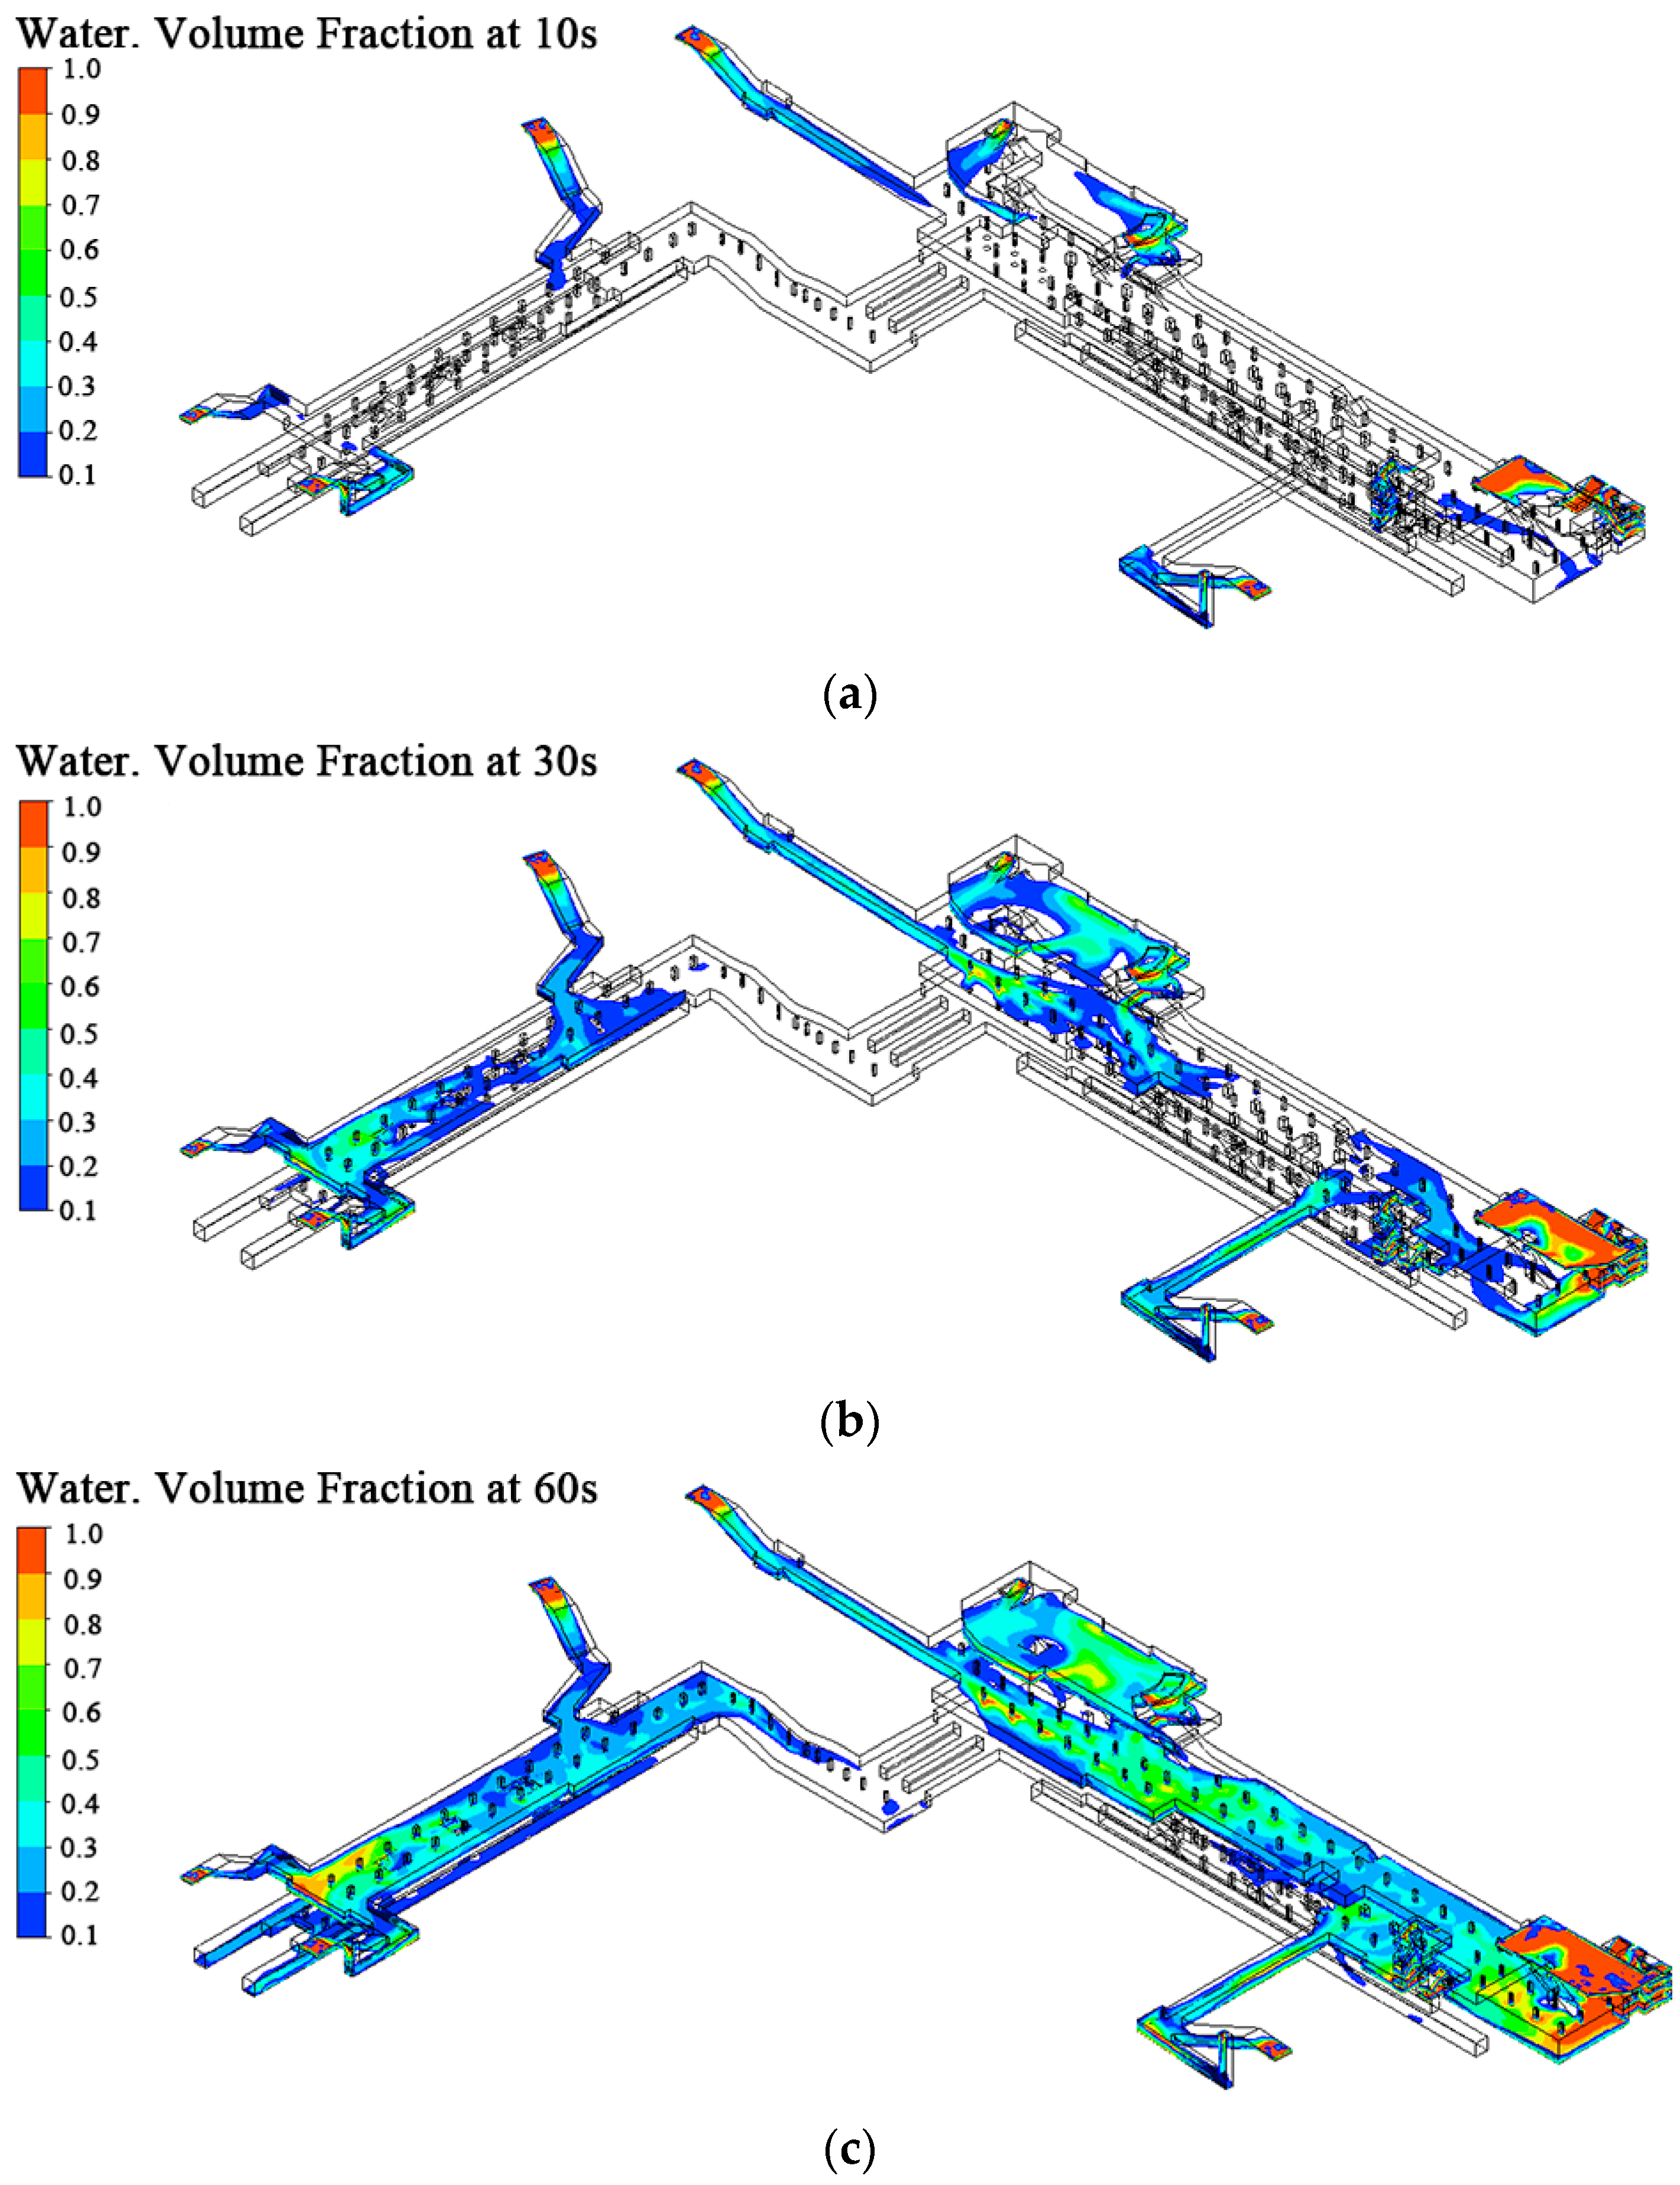
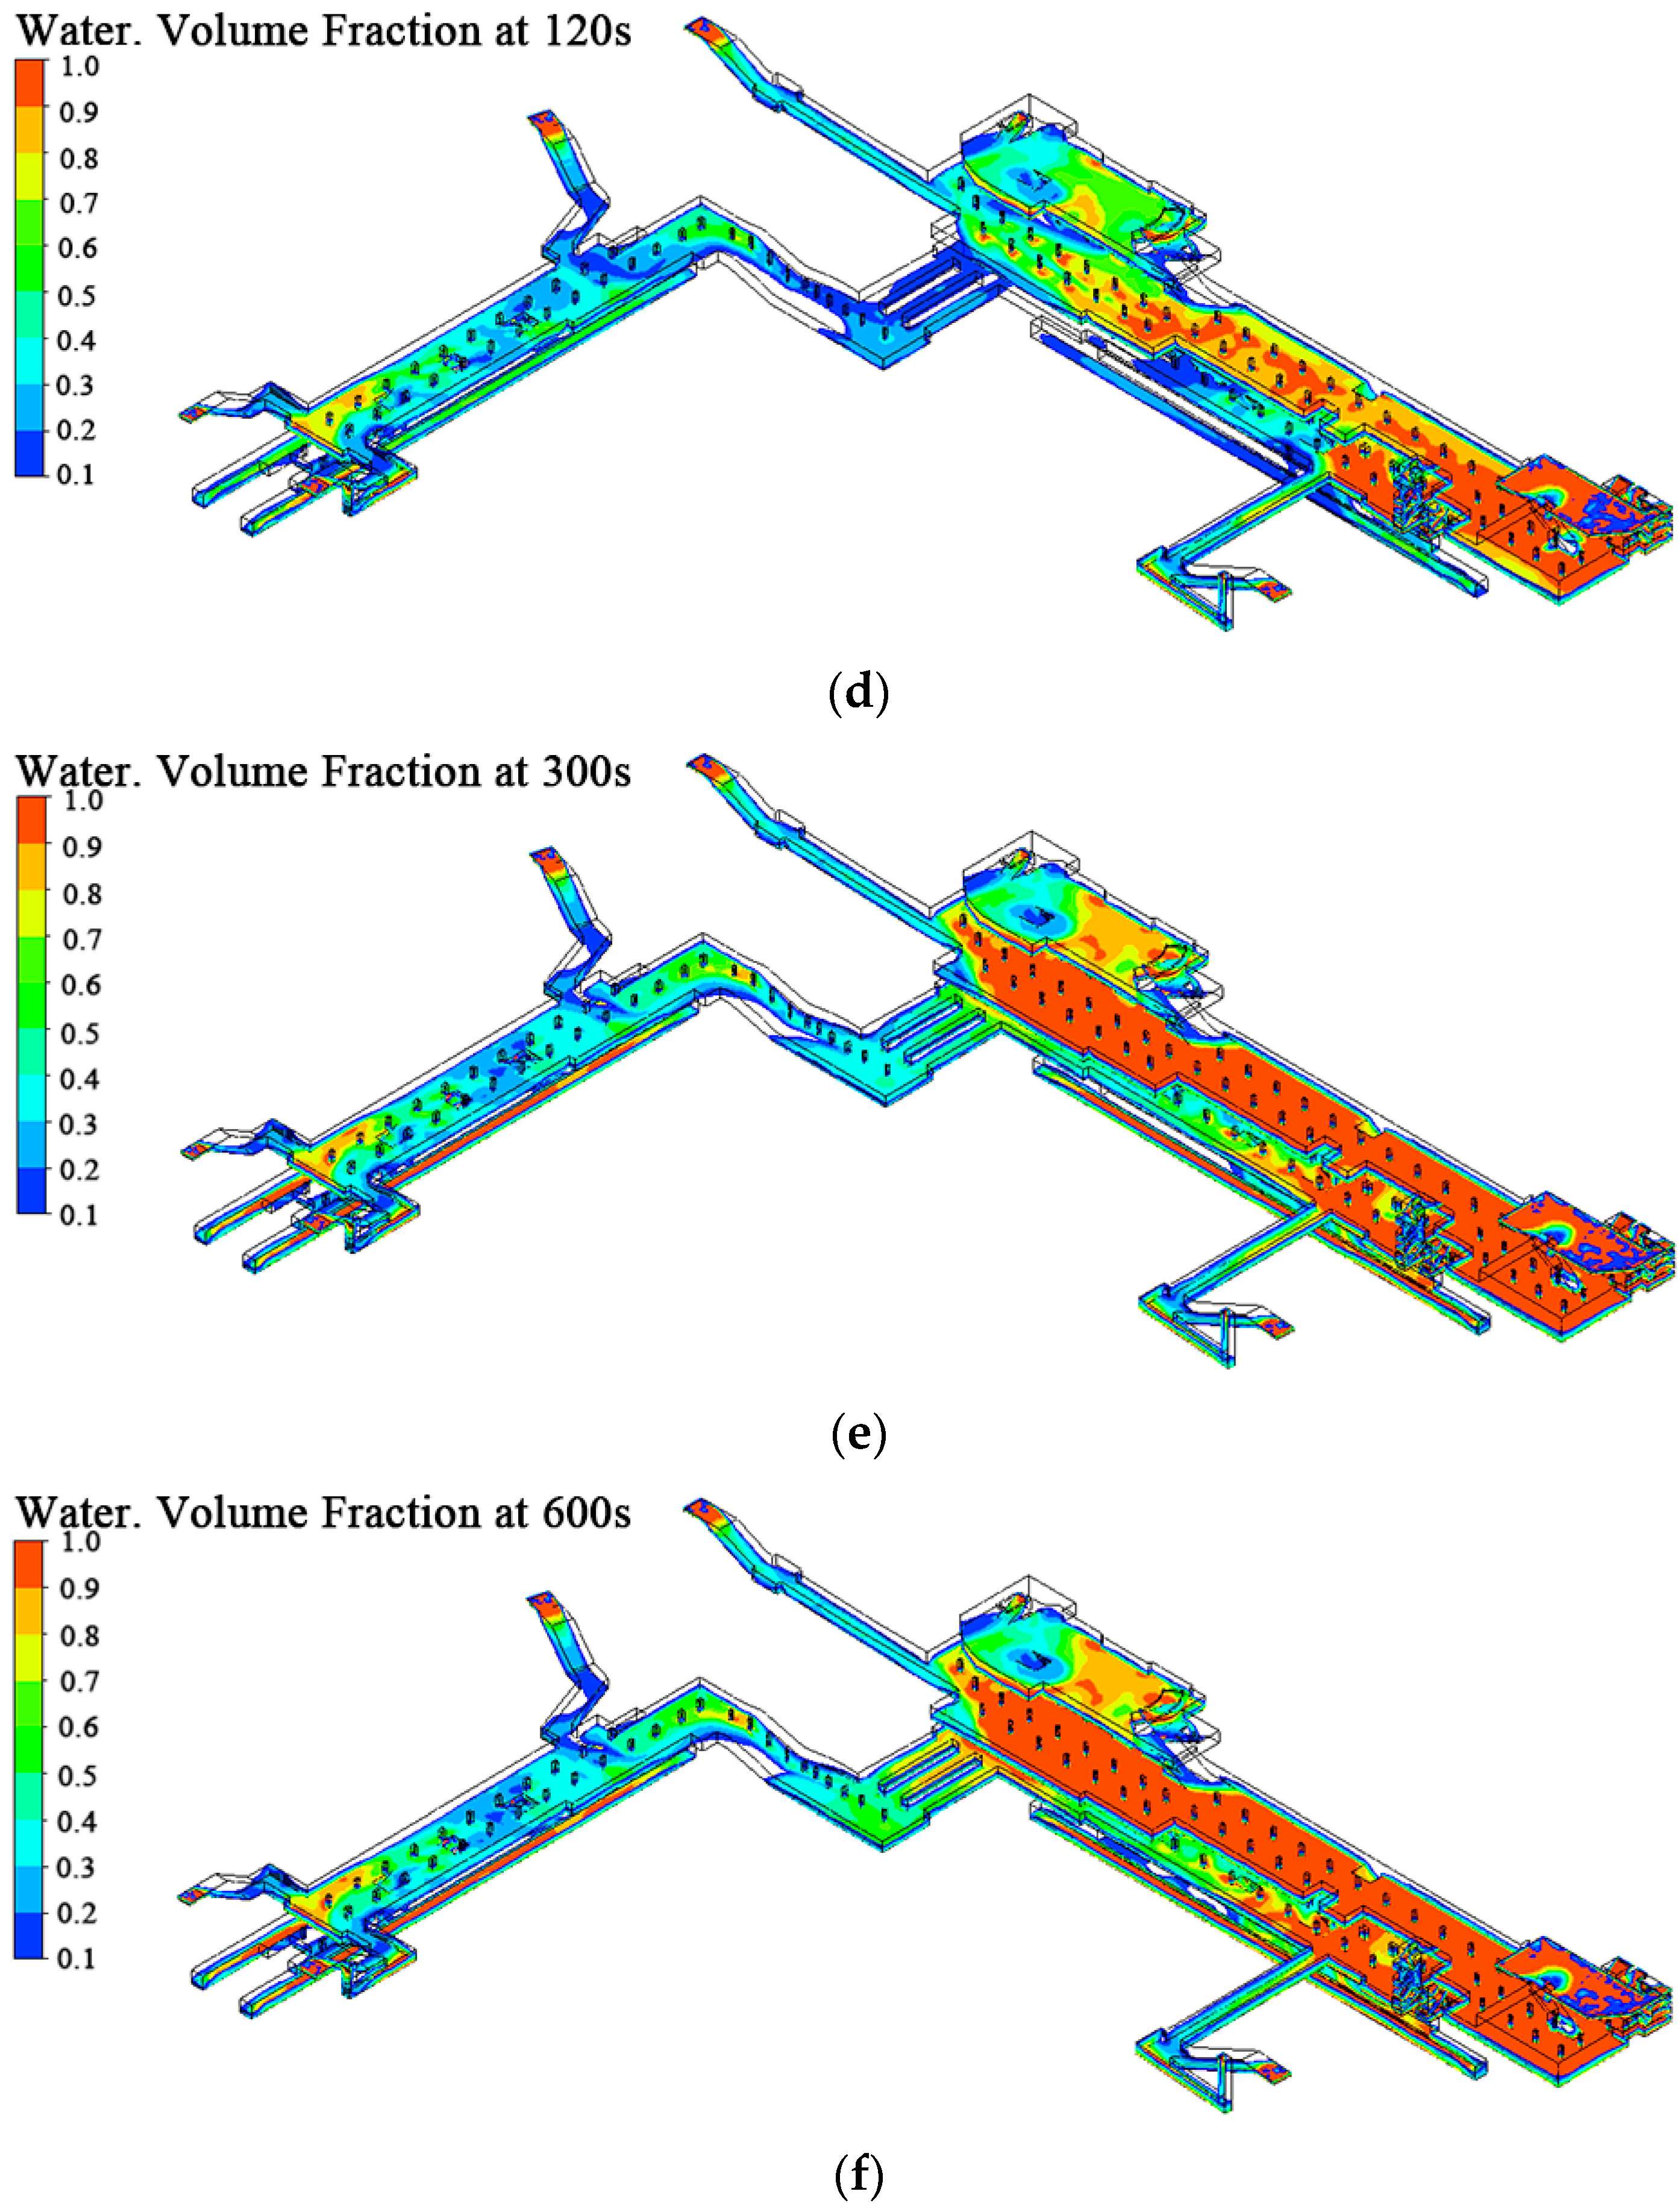
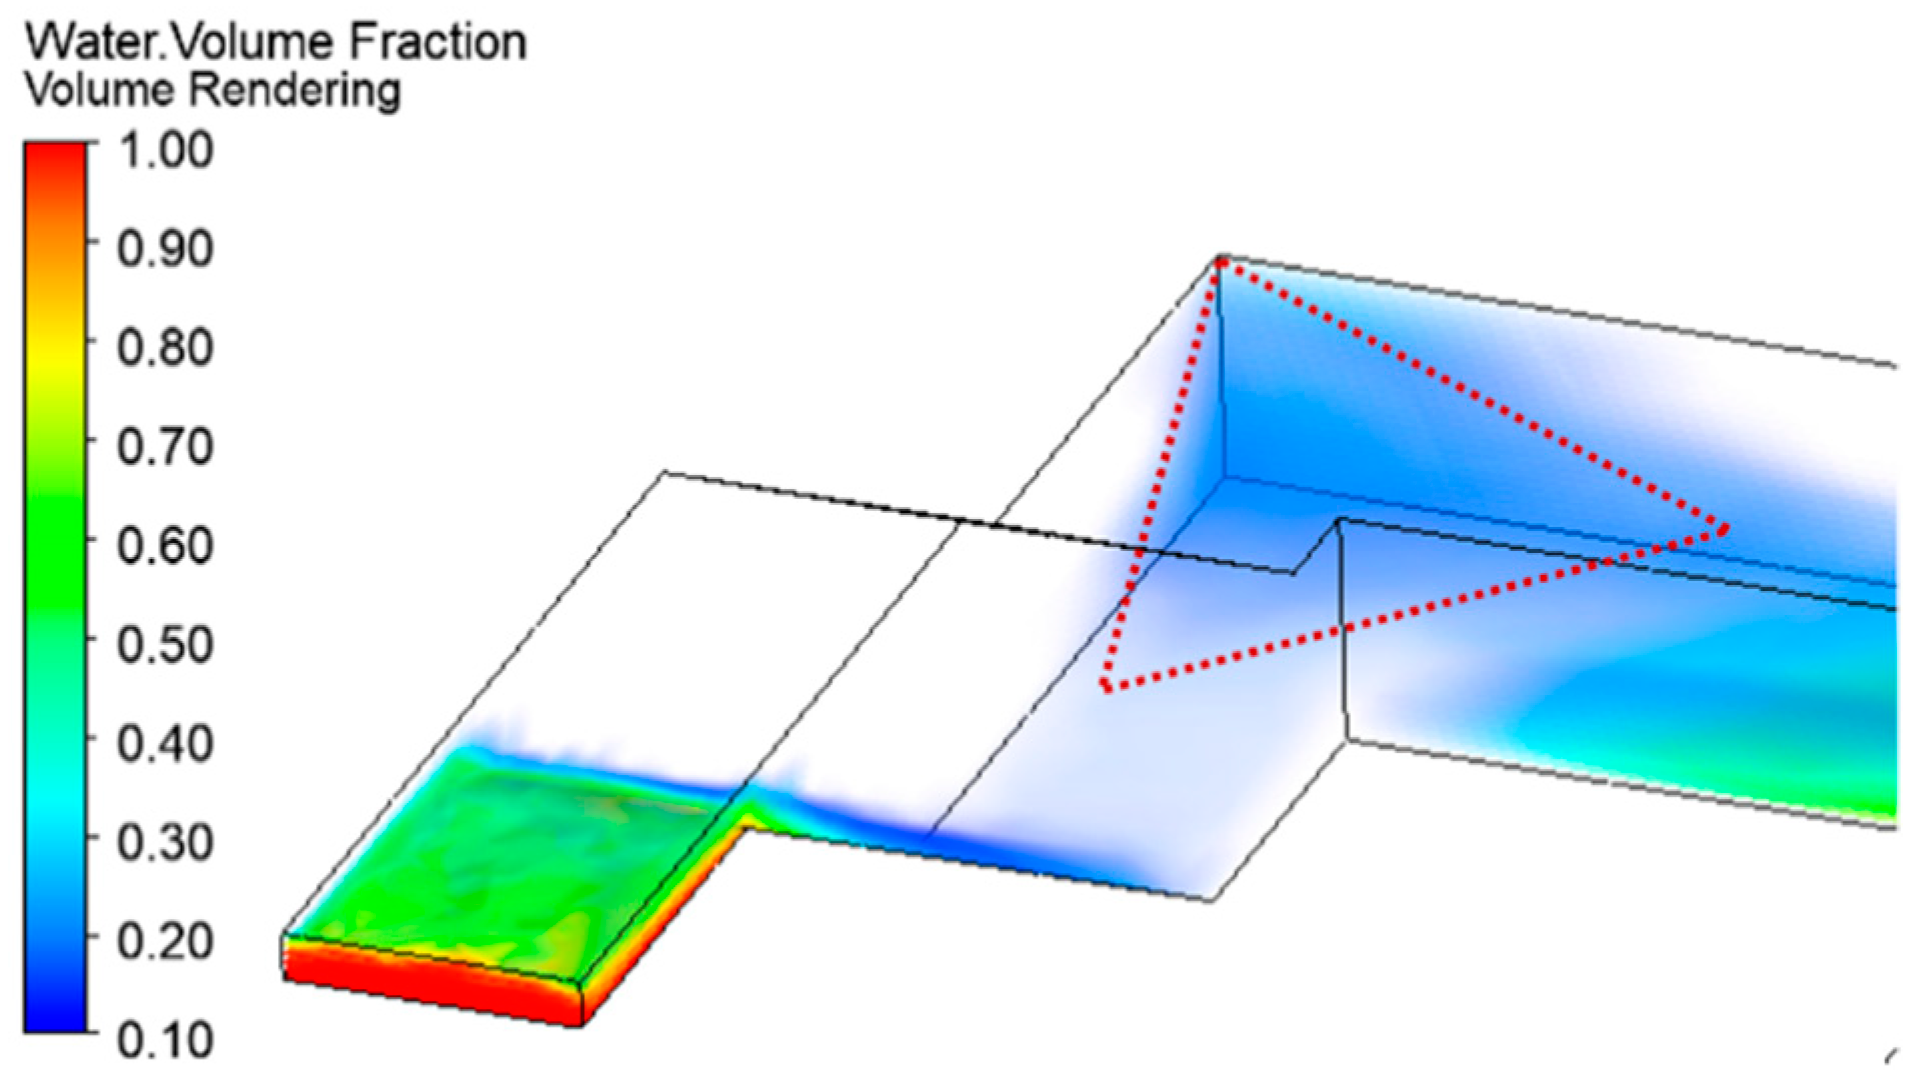
The simulation results of the whole process of flood intrusion showed that within 10 s, the flood flowed through the entrance and exit channels; within 30 s, the flood flowed into the underground flood; within 60 s, the flood water flowed into the second underground floor, and there was a large area of water accumulation on the property development floor of Line 5; within 120 s, the flood flowed into the third underground floor, and most of the flood water of Line 2 flowed out from the tunnel; within 300 s, most of the flood water of Line 5 flowed out of the tunnel, and then the inundated area of the subway station stabilized. Most of the stagnant water area exists in the property development floor.
(2)
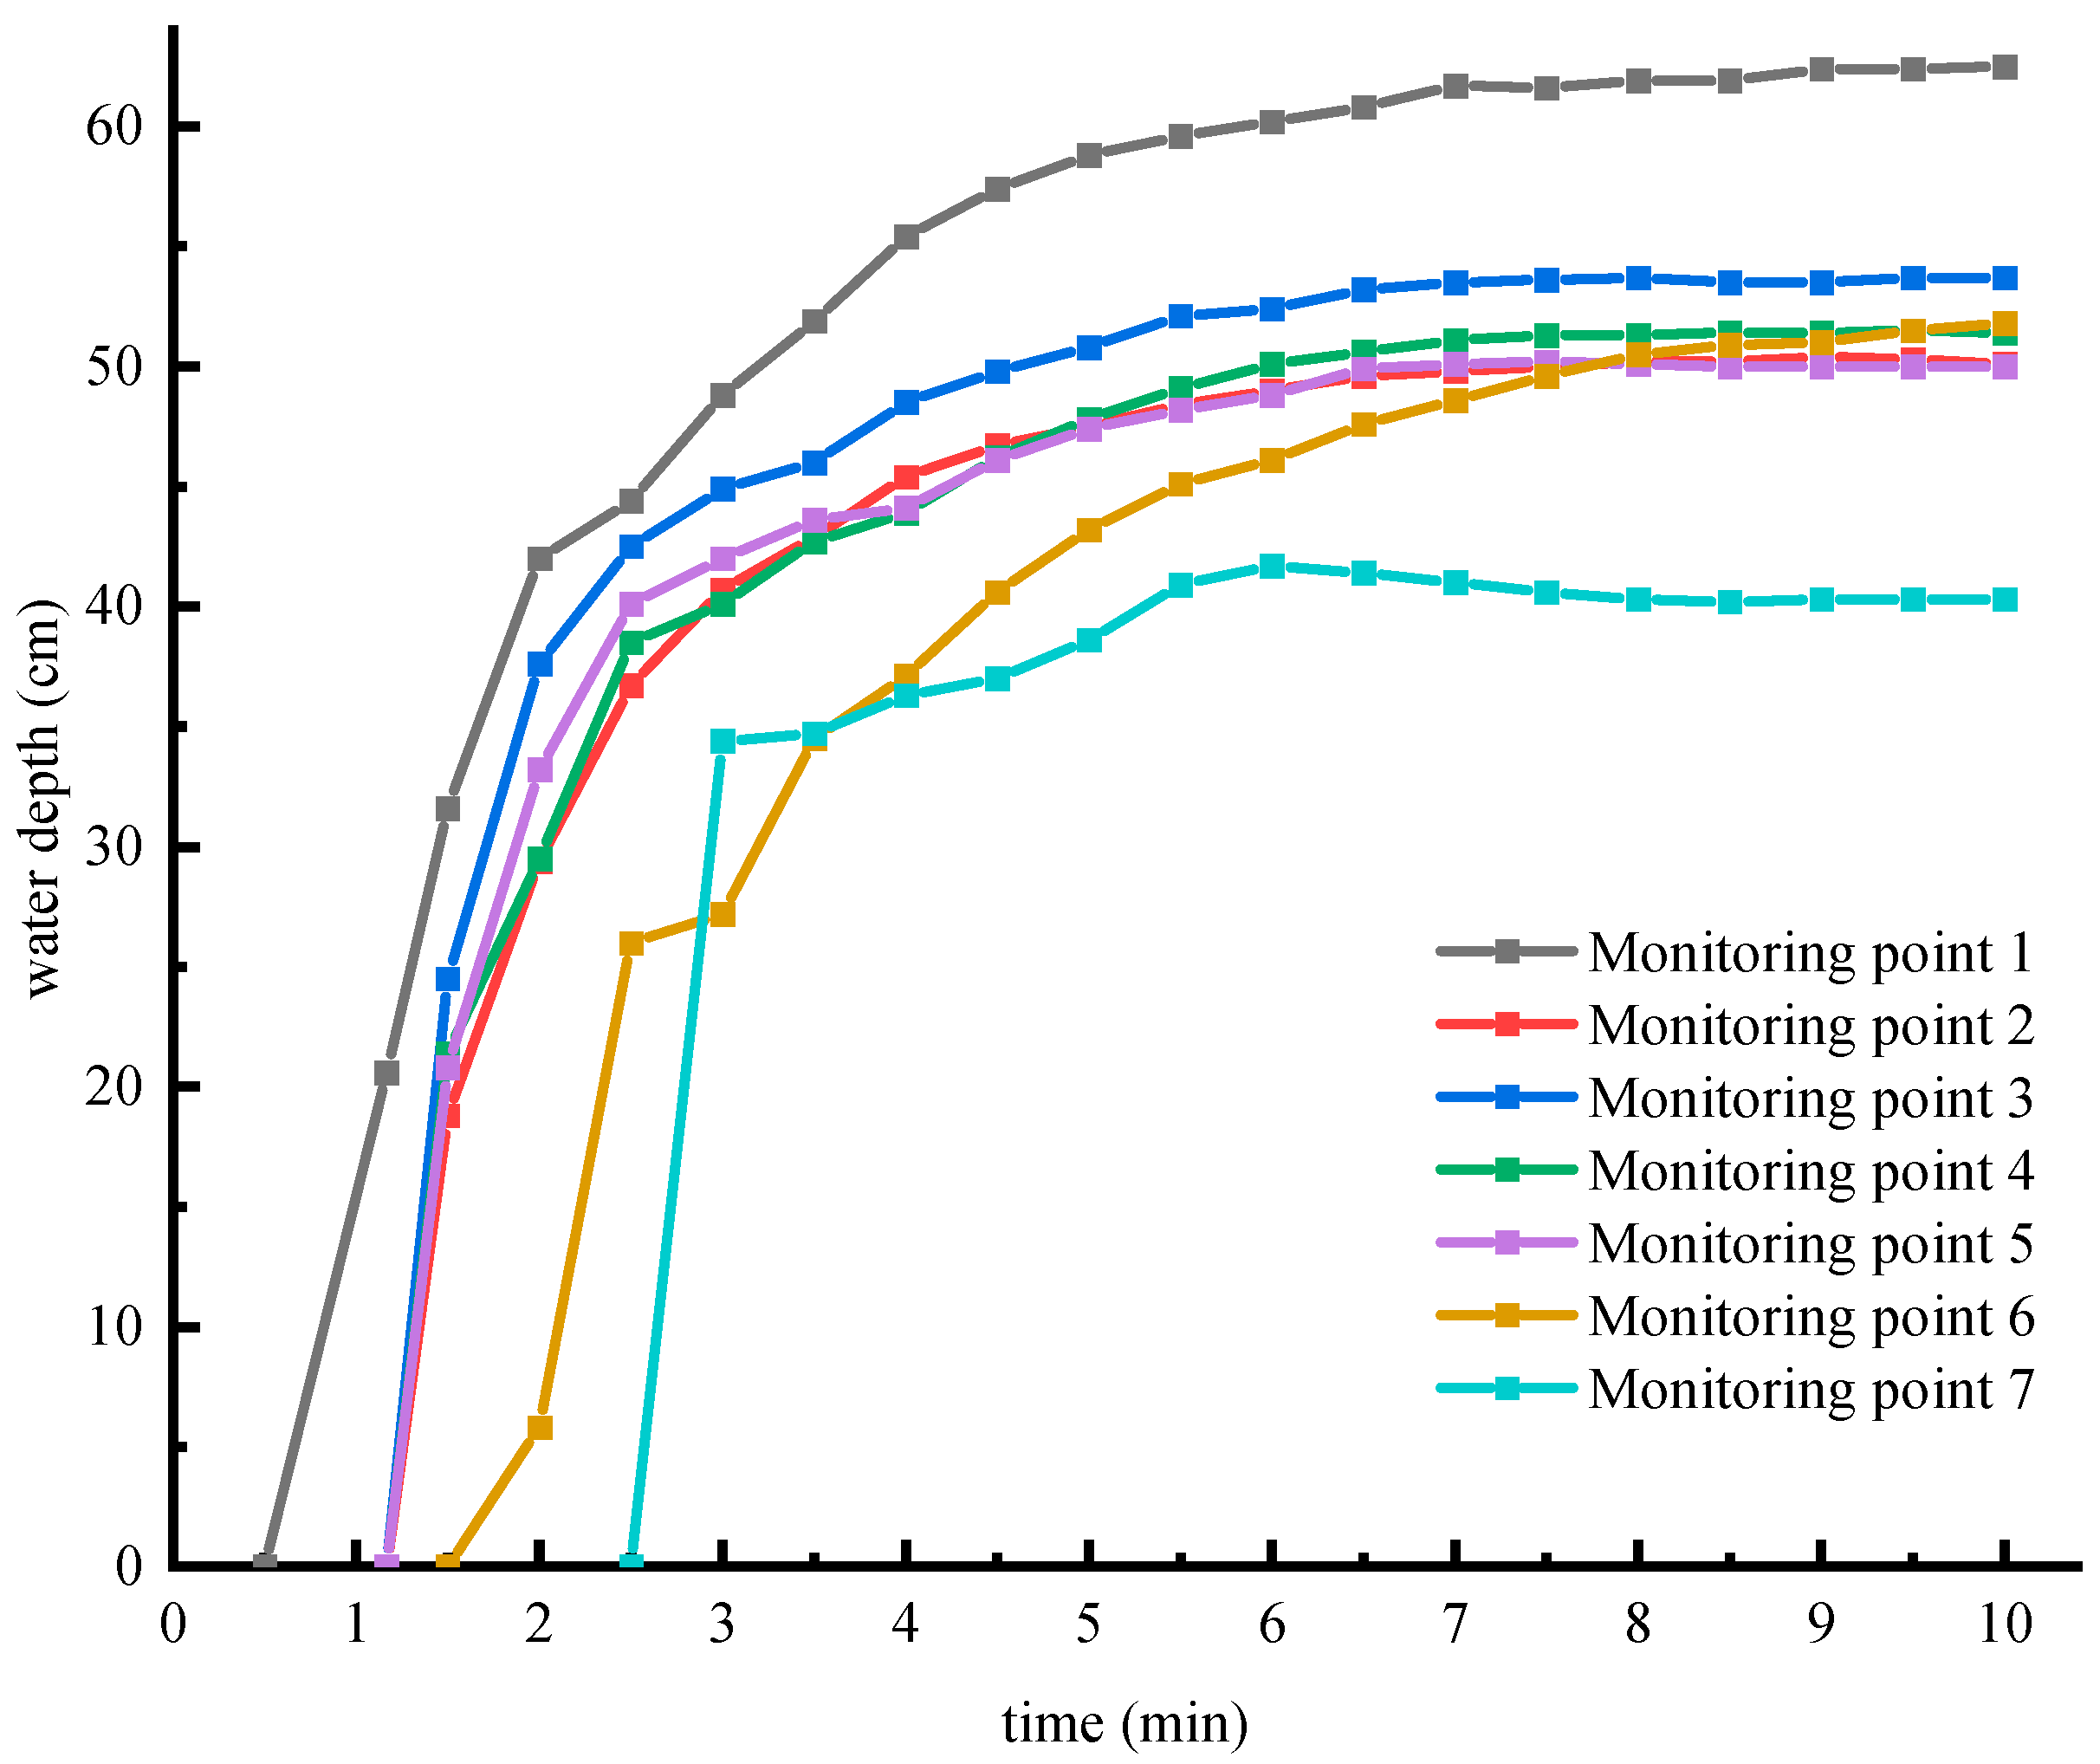
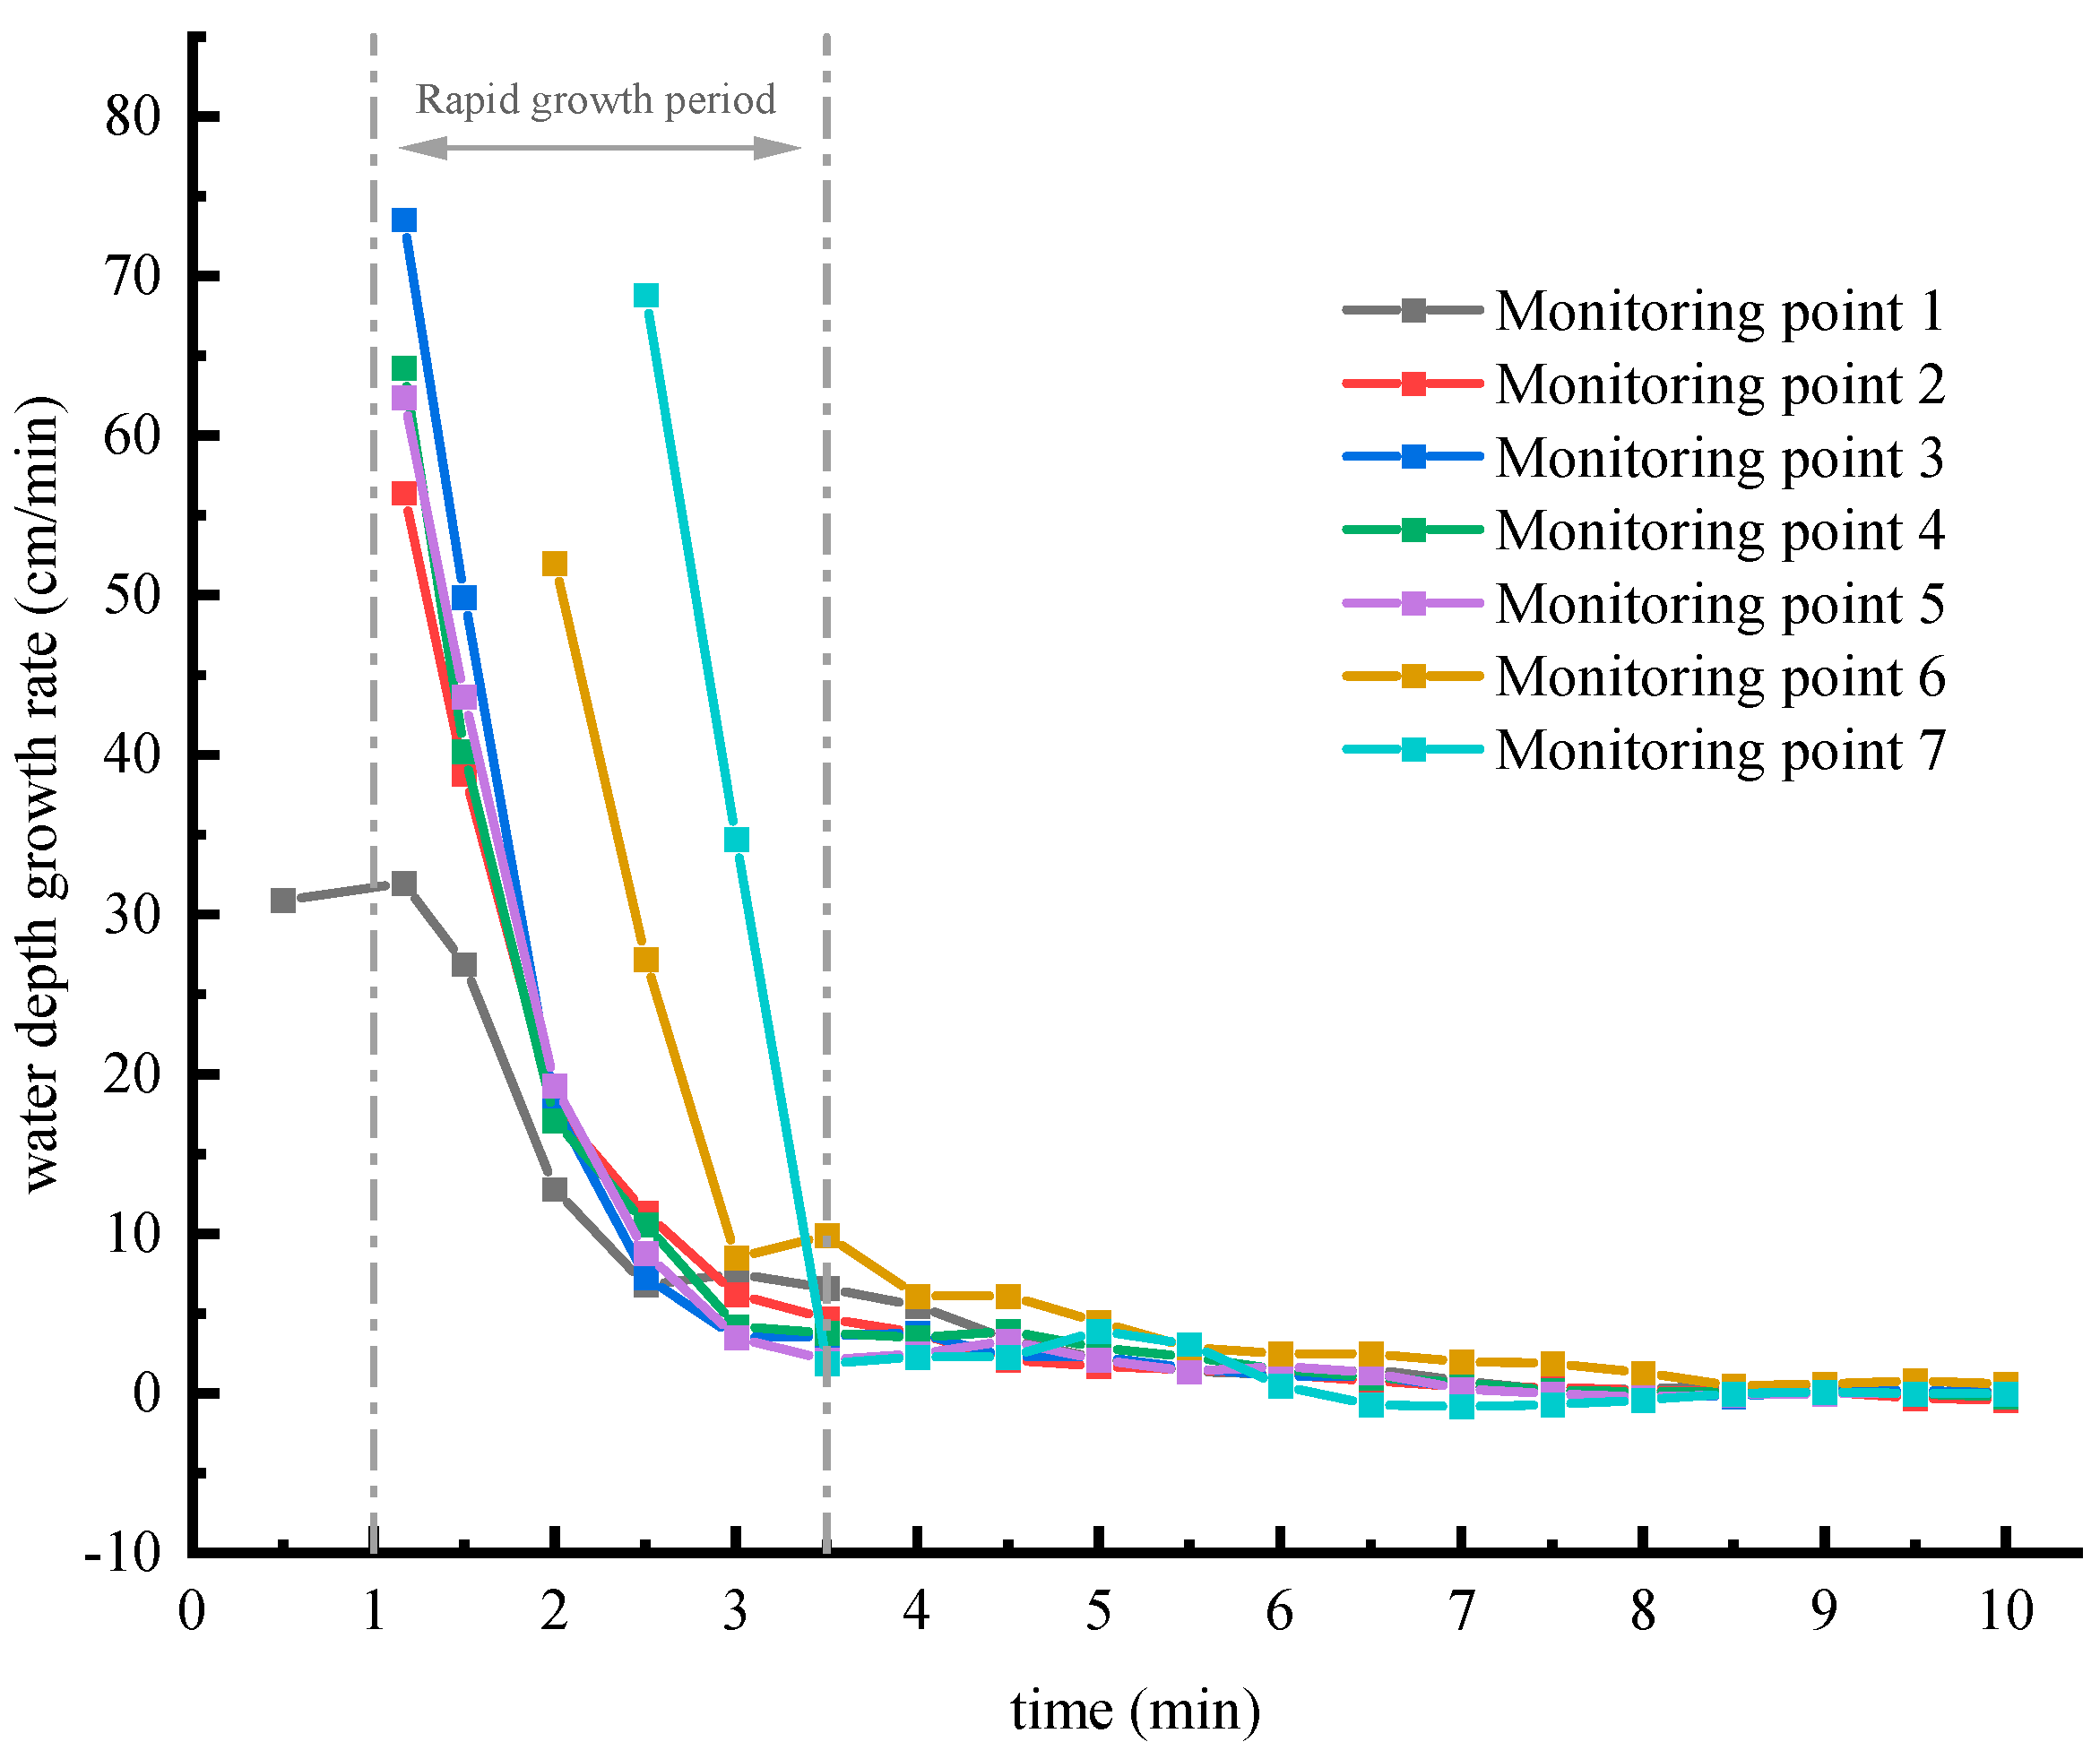
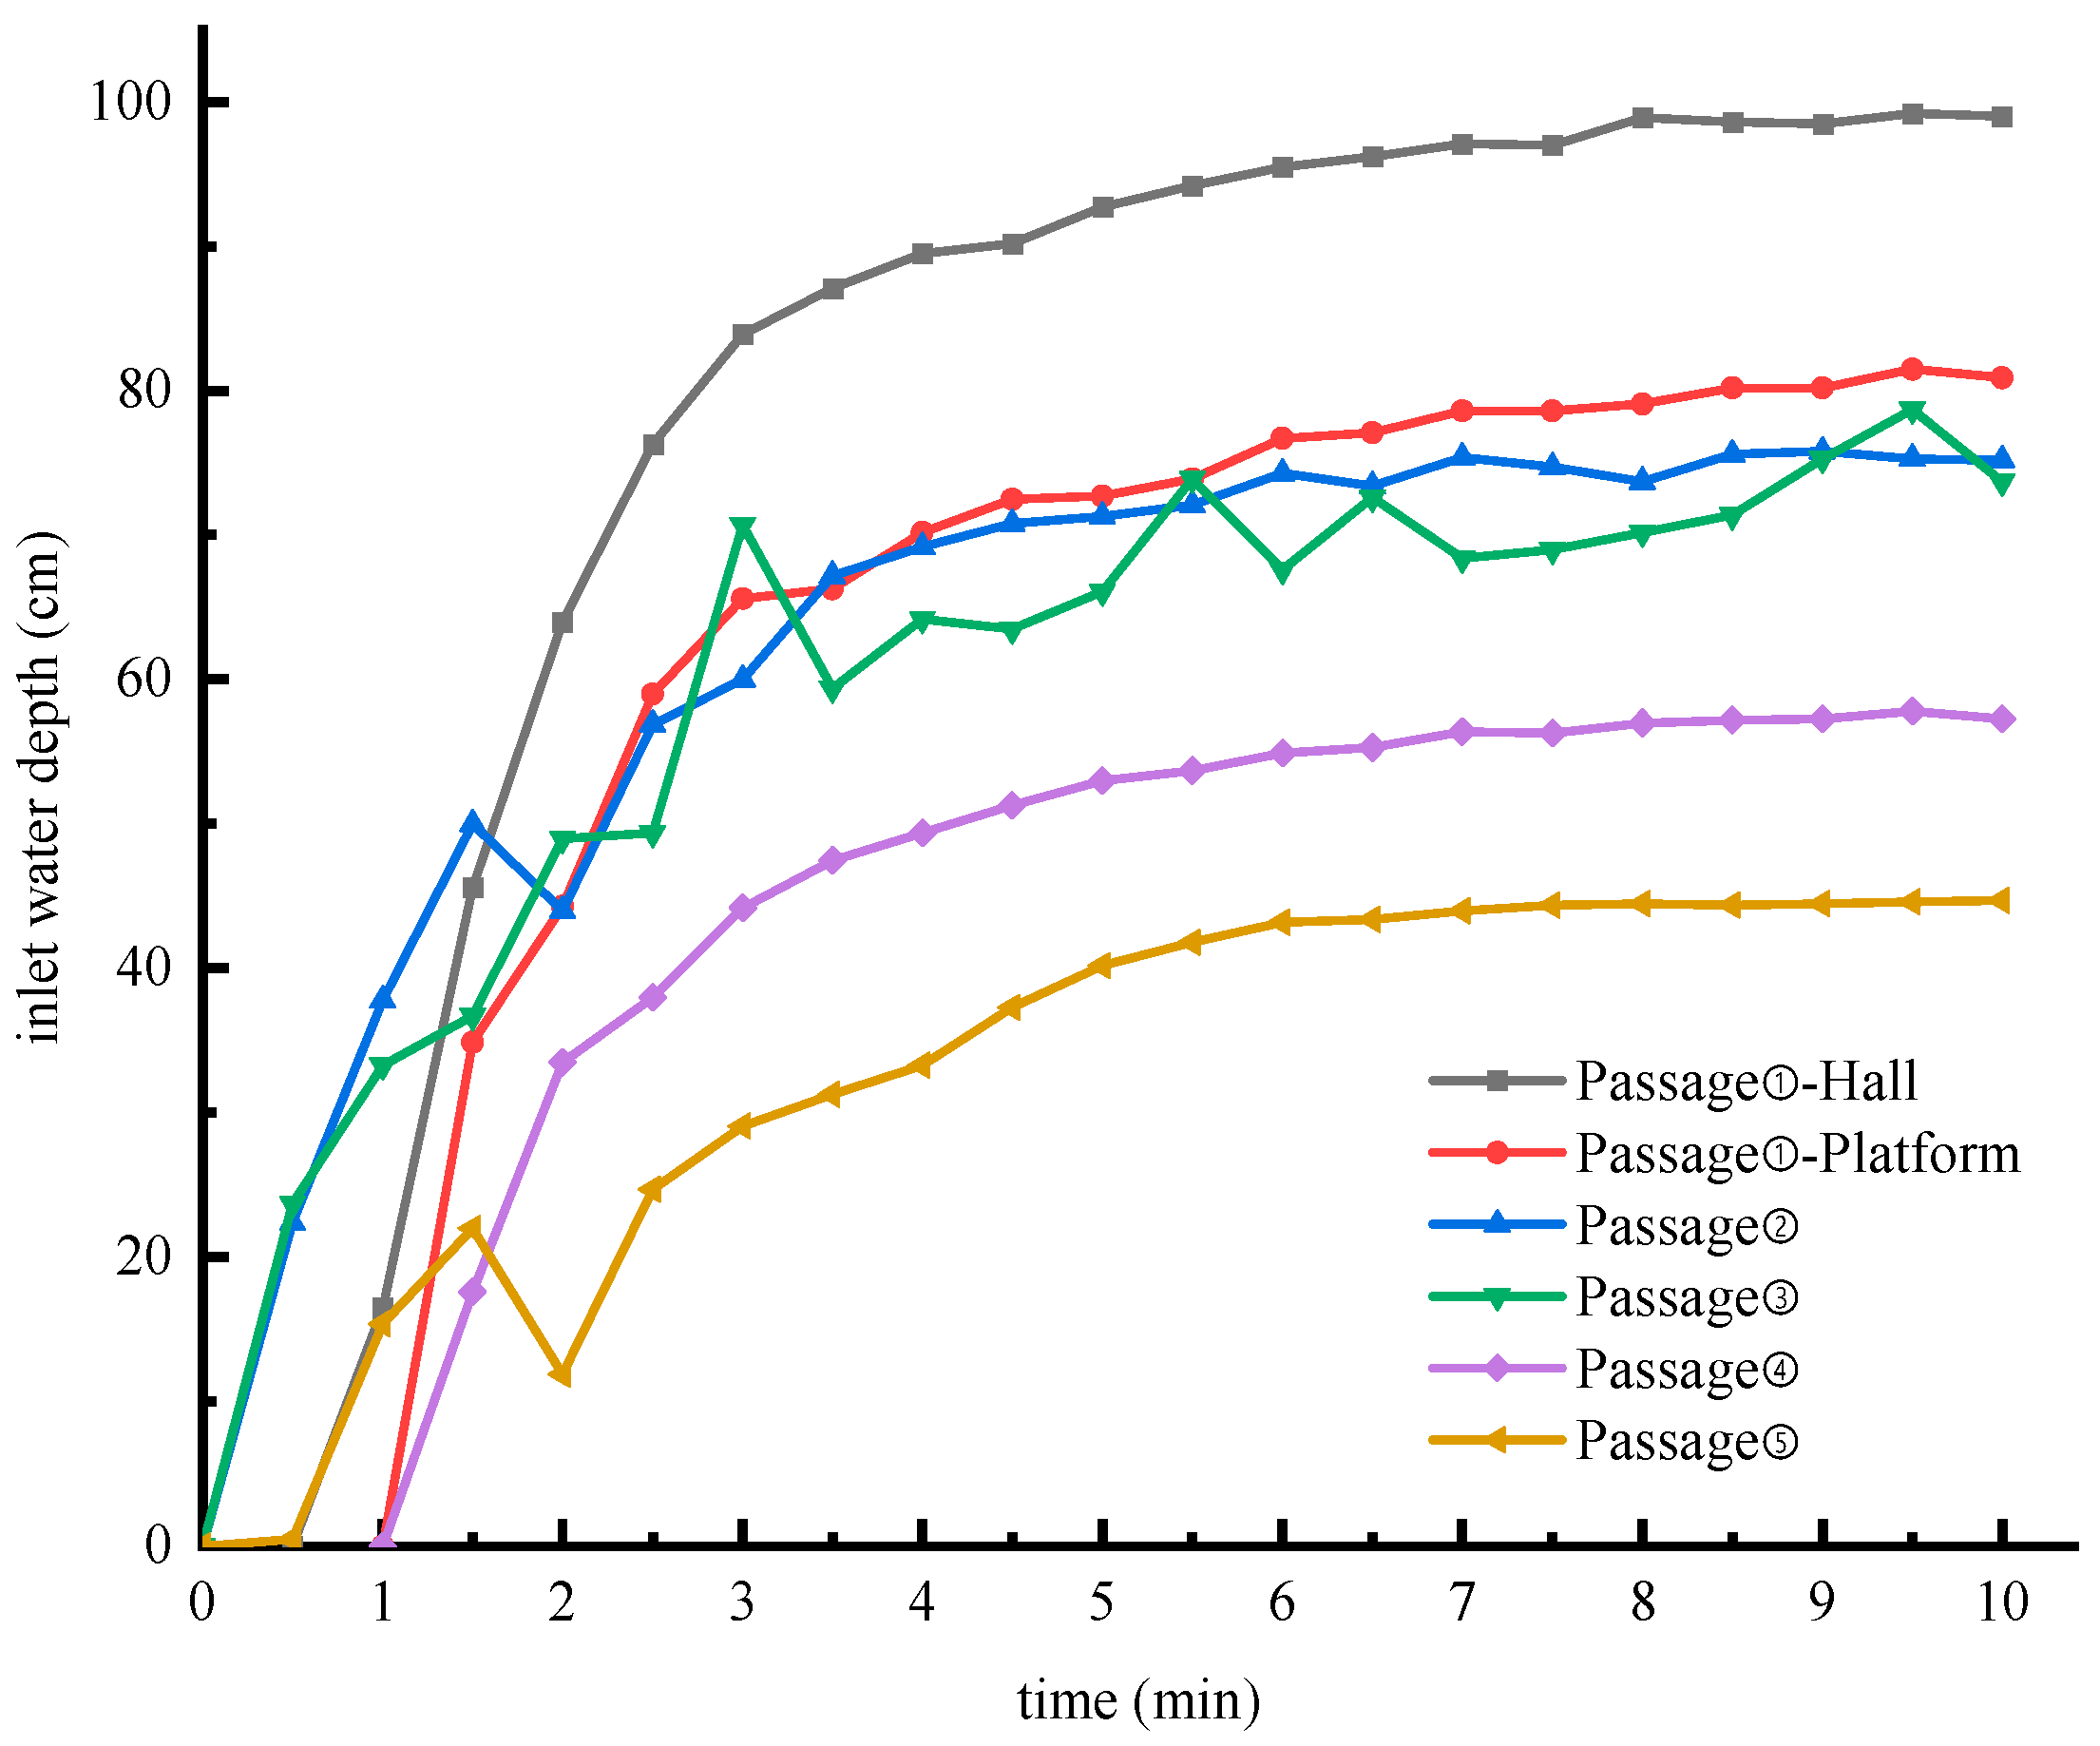
The dynamic monitoring of the water level during the inundation process of the station model showed that the water depth on most areas of the property development floor of Line 5 exceeded 0.5 m after 7 min, where personnel would be recommended to evacuate to the nearest entrance and exit or shelter. There was flood accumulation at the entrances of three exits passages, and there was serious water accumulation at the entrances of the emergency safety passages. Among them, the depth of water accumulation at the entrances of the four emergency safety passages exceeded 70 cm, which was difficult for people to pass. Therefore, personnel should choose other passages to evacuate.
(3)
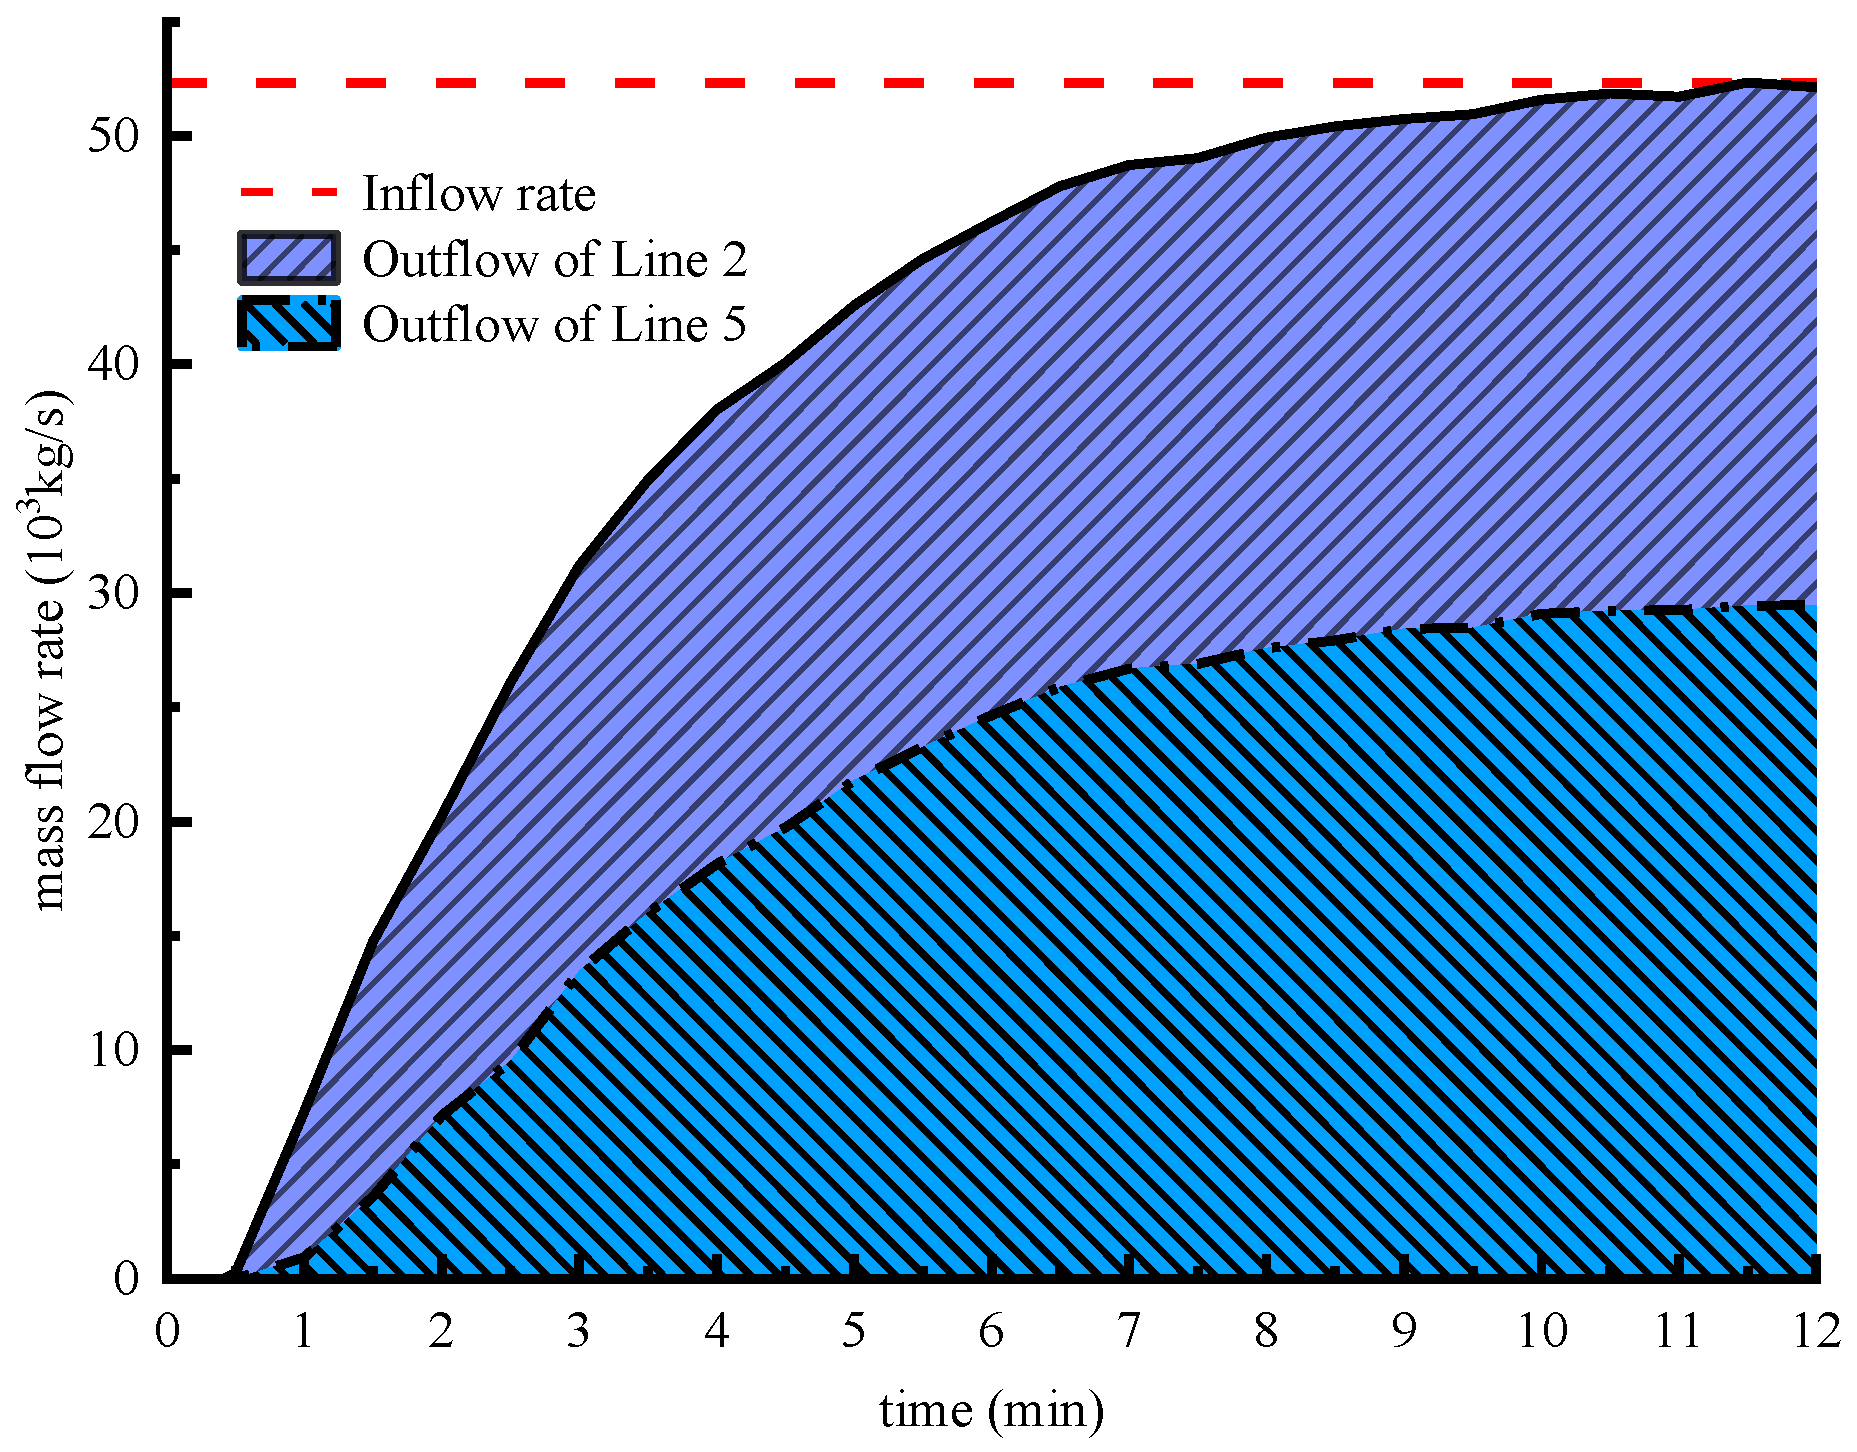
This study monitored and studied the flood flow into the tunnels of Line 2 and Line 5 through the subway station respectively, and found that a total of 3.59789 ×   10 5 L floodwater flowed into the tunnel in the first 10 min of the flood intrusion into the subway station, of which 1.77478 ×   10 5 L flowed into the tunnel of Line 2, and 1.82311 ×   10 5 L flowed into the tunnel of Line 5. These results provide the basis for the layout of tunnel drainage facilities.
(4)
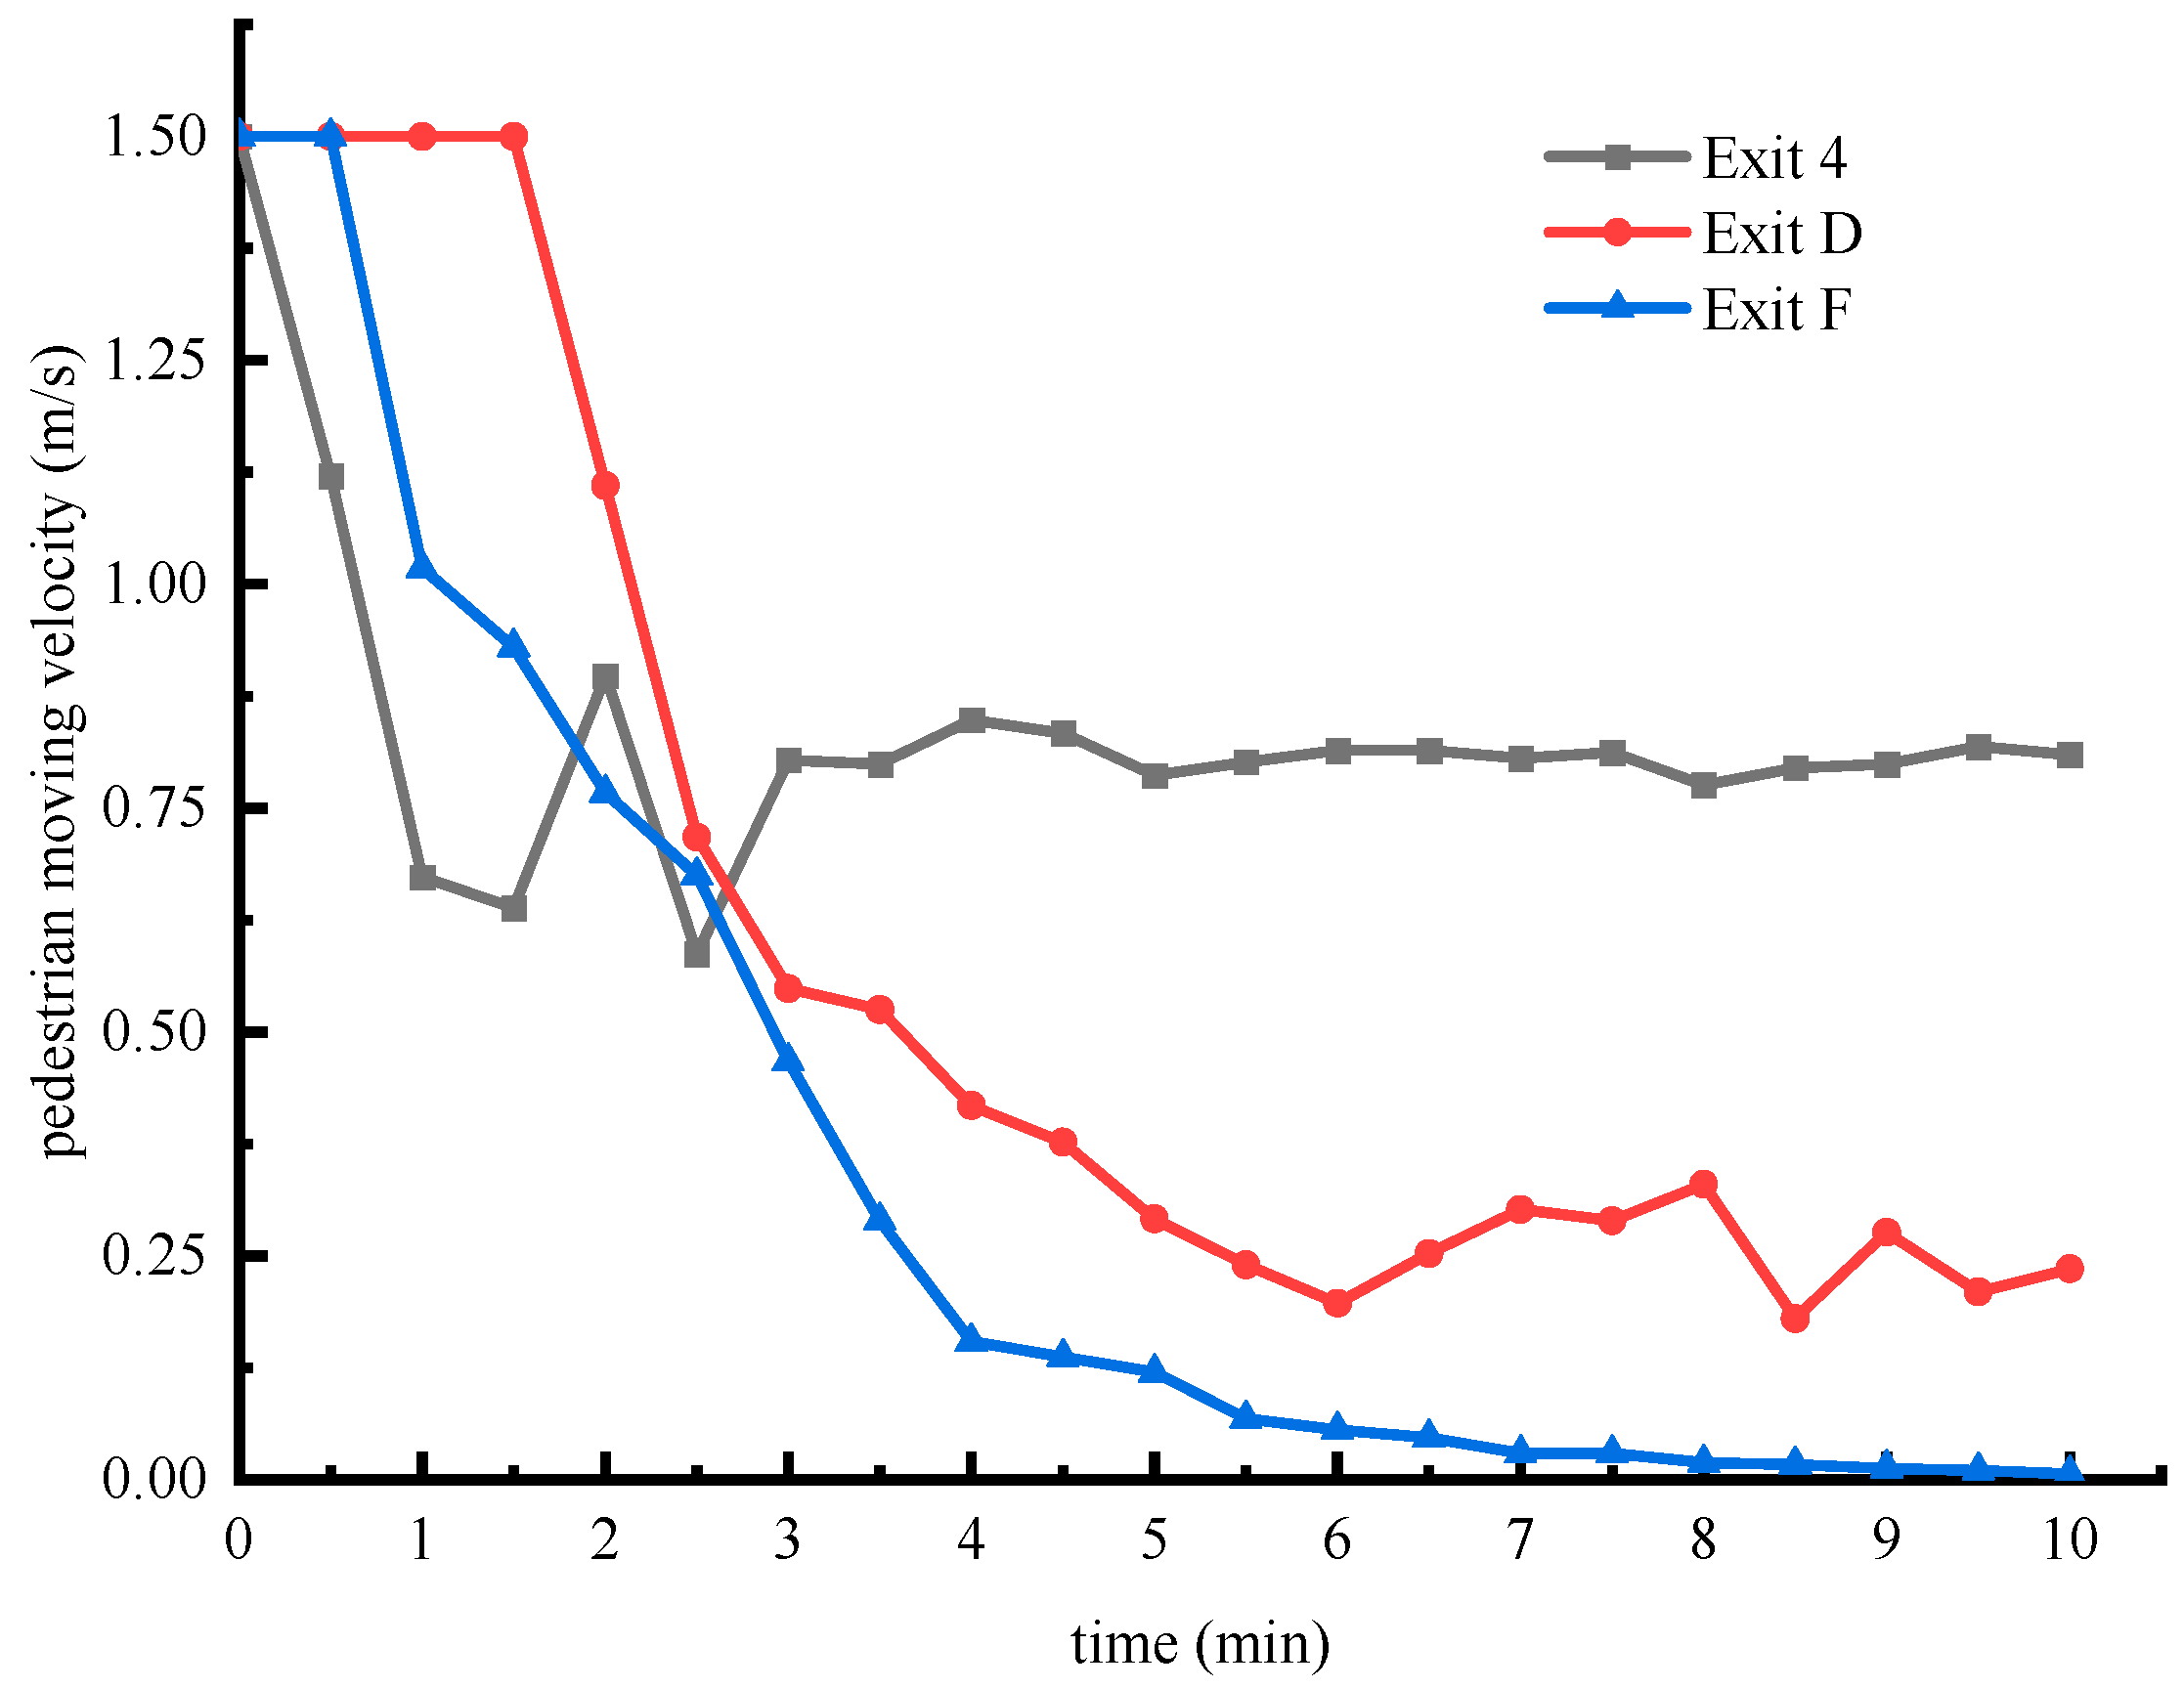
For the property development floor with severe flooding, we put forward suggestions on the establishment of emergency shelters and the direction of personnel evacuation. Through the comparison of different evacuation passages in the simulated flood situation, it is proposed that flood prevention measures can be taken for the narrow and long multi-run stair passages in a targeted manner, and the evacuation of people in the exit passages with corners is proposed. The reference basis for the flood pumping amount to control the flood level growth in the tunnel is given.

Author Contributions

Conceptualization, T.Z.; data curation, Y.Z. (Ye Zhu); formal analysis, S.H. and L.S.; investigation, Z.L., Y.Z. (Youxin Zhong) and H.L. All authors have read and agreed to the published version of the manuscript.

Funding

Science and Technology Hunan Civil Air Defense Research Project (HNRFKJ-2021-07); Project (2021) of Study on Flood Disaster Prevention Model of Nanning Rail Transit; Science and Technology Progress and Innovation Plan of Hunan Provincial Department of Transportation (201003); Science and Technology Progress and Innovation Plan of Hunan Provincial Department of Transportation(202120).

Institutional Review Board Statement

Not applicable.

Informed Consent Statement

Not applicable.

Data Availability Statement

Some or all data, models, or code that support the findings of this study are available from the corresponding author upon reasonable request.

Acknowledgments

This study gets its funding from Science and Technology Hunan Civil Air Defense Research Project (HNRFKJ-2021-07); Project (2021) of Study on Flood Disaster Prevention Model of Nanning Rail Transit; Science and Technology Progress and Innovation Plan of Hunan Provincial Department of Transportation (201003); Science and Technology Progress and Innovation Plan of Hunan Provincial Department of Transportation(202120). The authors wish to acknowledge these supports.

Conflicts of Interest

The authors declare no conflict of interest.

References

  1. Metros CAO. Urban Rail Transit 2021 Annual Statistics and Analysis Report; China Association of Metros: Beijing, China, 2022. [Google Scholar]
  2. Reduction UOfDR. The Human Cost of Disasters: An Overview of the Last 20 Years (2000–2019); UNDRR: Geneva, Switzerland, 2020. [Google Scholar]
  3. Liang, P.; Ding, Y. The long-term variation of extreme heavy precipitation and its link to urbanization effects in Shanghai during 1916–2014. Adv. Atmos. Sci. 2017, 34, 321–334. [Google Scholar] [CrossRef]
  4. Xu, W.T.; Guthrie, A.; Fan, Y.L.; Li, Y.L. Transit-oriented development in China: Literature review and evaluation of TOD potential across 50 Chinese cities. J. Transp. Land Use 2017, 10, 743–762. [Google Scholar] [CrossRef] [Green Version]
  5. Xing, J.; Xu, P.; Zhao, H.; Yao, S.; Wang, Q.; Li, B. Crashworthiness design and experimental validation of a novel collision post structure for subway cab cars. J. Cent. South Univ. 2020, 27, 2763–2775. [Google Scholar] [CrossRef]
  6. Li, W.; Liu, Y.; Chen, T.; Deng, J. An adaptive stable observer for on board auxiliary inverters with online current identification strategy. J. Cent. South Univ. 2017, 24, 819–828. [Google Scholar] [CrossRef]
  7. Barroca, B.; Serre, D. Behind The Barriers: A Resilience Conceptual Model. Surv. Perspect. Integr. Environ. Soc. 2013, 6, 1–10. [Google Scholar]
  8. Heinzlef, C.; Robert, B.; Hémond, Y.; Serre, D. Operating urban resilience strategies to face climate change and associated risks: Some advances from theory to application in Canada and France. Cities 2020, 104, 102762. [Google Scholar] [CrossRef]
  9. Gonzva, M.; Barroca, B.; Gautier, P.-É.; Diab, Y. Modeling disruptions causing domino effects in urban guided transport systems faced by flood hazards. Nat. Hazards 2017, 86, 183–201. [Google Scholar] [CrossRef] [Green Version]
  10. Robert, B.; De Calan, R.; Morabito, L. Modelling interdependencies among critical infrastructures. Int. J. Crit. Infrastruct. 2008, 4, 392–408. [Google Scholar] [CrossRef]
  11. Lhomme, S.; Serre, D.; Diab, Y.; Laganier, R. Analyzing resilience of urban networks: A preliminary step towards more flood resilient cities. Nat. Hazards Earth Syst. Sci. 2013, 13, 221–230. [Google Scholar] [CrossRef] [Green Version]
  12. Ding, Z.; Ban, H.; Zhang, H.; Guo, L.; Chai, Q. Study on key technology of mobile flood control wall for underground space entrance and exit. Arab. J. Geosci. 2021, 14, 152. [Google Scholar] [CrossRef]
  13. Serre, D.; Heinzlef, C. Assessing and mapping urban resilience to floods with respect to cascading effects through critical infrastructure networks. Int. J. Disaster Risk Reduct. 2018, 30, 235–243. [Google Scholar] [CrossRef]
  14. Zhu, H. Research on the Vulnerability Assessment of Heavy Rainfall in Beijing Subway Station. Master’s Thesis, Capital University of Economics and Business, Beijing, China, 2018. [Google Scholar]
  15. Martinez, E.; Hernandez, J.; Rodriguez-Nikl, T.; Mazari, M. Resilience of underground transportation infrastructure in coastal regions: A case study. In Proceedings of the International Conference on Transportation and Development 2018, Planning, Sustainability, and Infrastructure systems, Pittsburgh, PA, USA, 15–18 July 2018; pp. 223–230. [Google Scholar]
  16. Shi, Y.J.; Zhai, G.F.; Zhou, S.T.; Lu, Y.W.; Chen, W.; Deng, J.Y. How can cities respond to flood disaster risks under multi-scenario simulation? A case study of Xiamen, China. Int. J. Environ. Res. Public Health 2019, 16, 618. [Google Scholar] [CrossRef] [PubMed] [Green Version]
  17. Inoue, K.; Toda, K.; Nakai, T. Simulation on the Inundation Process in the Underground Space. In Annual Report of Disaster Prevention Research Institute, Kyoto University; Kyoto University: Kyoto, Japan, 2003; Volume 46, pp. 263–273. [Google Scholar]
  18. Toda, K.; Kuriyama, K.; Oyagi, R.; Inoue, K. Inundation analysis of complicated underground space. J. Hydrosci. Hydraul. Eng. 2004, 22, 47–58. [Google Scholar] [CrossRef]
  19. Ishigaki, T.; Keiichi, T.; Kazuya, I. Hydraulic model tests of inundation in urban area with underground space. In Proceedings of the Urban and Rural Water Systems for Sustainable Development, Kyoto University, Kyoto, Japan, 24–29 August 2003. [Google Scholar]
  20. Shen, R. Study on the Flood Invasion Mechanism and Countermeasures for Flood Control in Underground Space. Master’s Thesis, Tianjin University, Tianjin, China, 2012. [Google Scholar]
  21. Baba, Y.; Ishigaki, T.; Toda, K.; Nakagawa, H. Experimental studies on difficulty of evacuation from underground spaces under inundated situations using real scale models. J. Jpn. Soc. Civ. Eng. 2011, 67, 12–27. [Google Scholar] [CrossRef] [Green Version]
  22. Ishigaki, T.; Asai, Y.; Nakahata, Y.; Shimada, H.; Baba, Y.; Toda, K. Evacuation of aged persons from inundated underground space. Water Sci. Technol. 2010, 62, 1807–1812. [Google Scholar] [CrossRef]
  23. Jiang, L.; Shao, W.; Zhu, D.Z.; Sun, Z. Forces on surface-piercing vertical circular cylinder groups on flooding staircase. J. Fluids Struct. 2014, 46, 17–28. [Google Scholar] [CrossRef]
  24. Toda, K.; Ishigaki, T.; Baba, Y.; Ozaki, T. Educational Activities for Urban Flood Damage Reduction using Unique Facilities; International Association of Hydrological Sciences: Tokyo, Japan, 2013. [Google Scholar]
  25. Toda, K.; Kawaike, K.; Yoneyama, N.; Fukakusa, S.; Yamamoto, D. Underground inundation analysis by integrated urban flood model. In Advances in Water Resources and Hydraulic Engineering; Zhang, C., Tang, H., Eds.; Springer: Berlin/Heidelberg, Germany, 2009; pp. 166–171. [Google Scholar]
  26. Shao, W.; Jiang, L.; Zhang, Y.; Zhu, D.Z.; Sun, Z. Hydraulic features of air-water mixture flow on a staircase with rest platforms. J. Hydraul. Eng. 2014, 140, 1–9. [Google Scholar] [CrossRef]
  27. Chen, Y.; Lin, H.; Xie, S.; Ding, X.; He, D.; Yong, W.; Gao, F. Effect of joint microcharacteristics on macroshear behavior of single-bolted rock joints by the numerical modelling with PFC. Environ. Earth Sci. 2022, 81, 276. [Google Scholar] [CrossRef]
  28. Yang, H.; Lin, H.; Chen, Y.; Wang, Y.; Zhao, Y.; Yong, W.; Gao, F. Influence of wing crack propagation on the failure process and strength of fractured specimens. Bull. Eng. Geol. Environ. 2022, 81, 71. [Google Scholar] [CrossRef]
  29. Xie, S.J.; Lin, H.; Chen, Y.F.; Wang, Y.X. A new nonlinear empirical strength criterion for rocks under conventional triaxial compression. J. Cent. South Univ. 2021, 28, 1448–1458. [Google Scholar] [CrossRef]
  30. Dutta, D.; Takamura, H.; Herath, S. Understanding flood behavior in underground facilities for urban flood risk management. In Proceedings of the Second International Symposium on New Technologies for Urban Safety of Mega Cities in Asia, Tokyo, Japan, 30–31 October 2003. [Google Scholar]
  31. Toda, K.; Oyagi, R.; Inoue, K.; Aihata, S. On the inundation process in the underground space in urban flooding. Disaster Prev. Res. Inst. Annu. 2004, 47, 293–302. [Google Scholar]
  32. Gotoh, H.; Ikari, H.; Sakai, T. Numerical simulation of stream over staircase by 3D particle method. In Proceedings of the MPMD-2005, Kyoto, Japan, 12–15 January 2005; pp. 185–190. [Google Scholar]
  33. Han, K.Y.; Kim, G.; Lee, C.H.; Cho, W.H. Modeling of flood inundation in urban areas including underground space. In Proceedings of the 4th International Symposium on Flood Defence: Managing Flood Risk, Reliability and Vulnerability, Toronto, ON, Canada, 6–8 May 2008; pp. 398–403. [Google Scholar]
  34. Oertel, M. Flooding of underground facilities in urban regions after malfunction of flood protection measures. In Proceedings of the 4th International Symposium on Flood Defence: Managing Flood Risk, Reliability and Vulnerability, Toronto, ON, Canada, 6–8 May 2008; pp. 595–600. [Google Scholar]
  35. Yoneyama, N.; Toda, K.; Aihata, S.; Yamamoto, D. Numerical analysis for evacuation possibility from small underground space in urban flood. In Advances in Water Resources and Hydraulic Engineering; Zhang, C., Tang, H., Eds.; Springer: Berlin/Heidelberg, Germany, 2009; pp. 107–112. [Google Scholar]
  36. Mo, W. Numerical Simulation of the Flooding in Subway Station and Discussion on its Flood Prevention Measures; Zhejiang University: Hangzhou, China, 2010. [Google Scholar]
  37. Ishigaki, T.; Asano, N.; Morikane, M.; Ozaki, T.; Toda, K. Extreme hazard of pluvial and tsunami floods in a densely urbanized area. In Proceedings of the International Conference on Flood Resilience: Experiences in Asia and Europe, Exeter, UK, 5–7 September 2013. [Google Scholar]
  38. Shao, W.; Jiang, L.; Fang, L.; Zhu, D.Z.; Sun, Z. Assessment of the safe evacuation of people walking through flooding staircases based on numerical simulation. J. Zhejiang Univ.-SCIENCE A 2015, 16, 117–130. [Google Scholar] [CrossRef]
  39. Guo, P.; Gong, X.; Wang, Y.; Lin, H.; Zhao, Y. Minimum cover depth estimation for underwater shield tunnels. Tunn. Undergr. Space Technol. 2021, 115, 104027. [Google Scholar] [CrossRef]
  40. Zhang, C.; Pu, C.; Cao, R.; Jiang, T.; Huang, G. The stability and roof-support optimization of roadways passing through unfavorable geological bodies using advanced detection and monitoring methods, among others, in the Sanmenxia Bauxite Mine in China’s Henan Province. Bull. Eng. Geol. Environ. 2019, 78, 5087–5099. [Google Scholar] [CrossRef]
  41. Zhao, Y.; Liu, Q.; Zhang, C.; Liao, J.; Lin, H.; Wang, Y. Coupled seepage-damage effect in fractured rock masses: Model development and a case study. Int. J. Rock Mech. Min. Sci. 2021, 144, 104822. [Google Scholar] [CrossRef]
  42. Hirt, C.W.; Nichols, B.D. Volume of Fluid (VOF) Method for the Dynamics of Free Boundary. J. Comput. Phys. 1981, 39, 201–225. [Google Scholar] [CrossRef]
  43. Gholami, A.; Akhtari, A.A.; Minatour, Y.; Bonakdari, H.; Javadi, A.A. Experimental and numerical study on velocity fields and water surface profile in a strongly-curved 90 degrees open channel bend. Eng. Appl. Comput. Fluid Mech. 2014, 8, 447–461. [Google Scholar] [CrossRef] [Green Version]
  44. Ishigaki, T.; Toda, K.; Baba, Y.; Inoue, K.; Nakagawa, H. Experimental study on evacuation from underground space by using real size models. Proc. Hydraul. Eng. 2006, 50, 583–588. [Google Scholar] [CrossRef]
  45. Zheng, Y.; Li, X.-G.; Jia, B.; Jiang, R. Simulation of pedestrians’ evacuation dynamics with underground flood spreading based on cellular automaton. Simul. Model. Pract. Theory 2019, 94, 149–161. [Google Scholar] [CrossRef]
  46. Higo, E.; Okada, N.; Hipel, K.W.; Fang, L. Cooperative survival principles for underground flooding: Vitae System based multi-agent simulation. Expert Syst. Appl. 2017, 83, 379–395. [Google Scholar] [CrossRef]
Figure 1. The completed construction investment of subways in mainland China from 2011 to 2021.
Buildings 12 00853 g001
Figure 2. Location of the target study station.
Buildings 12 00853 g002
Figure 3. Plane design of the target study station.
Buildings 12 00853 g003
Figure 4. Schematic diagram of the floors of the target study station.
Buildings 12 00853 g004
Figure 5. Geometric model diagram. (a) Overall elevation of the geometric model, (b) floor plan of line 2, and (c) floor plan of line 5.
Buildings 12 00853 g005aBuildings 12 00853 g005b
Figure 6. Meshing diagram of the target study station.
Buildings 12 00853 g006
Figure 7. Schematic diagram of the evacuation passages.
Buildings 12 00853 g007
Figure 8. Schematic diagram of boundary conditions.
Buildings 12 00853 g008
Figure 9. Flood inundated area of the subway station. (a) Contour of water volume fraction at 10 s, (b) contour of water volume fraction at 30 s, (c) contour of water volume fraction at 60 s, (d) contour of water volume fraction at 120 s, (e) contour of water volume fraction at 300 s, (f) contour of water volume fraction at 600 s.
Buildings 12 00853 g009aBuildings 12 00853 g009b
Figure 10. Location map of monitoring points on the property development floor.
Buildings 12 00853 g010
Figure 11. Water depth at monitoring points on the property development floor as a function of time.
Buildings 12 00853 g011
Figure 12. Water depth growth rate at monitoring points on the property development floor as a function of time.
Buildings 12 00853 g012
Figure 13. Pedestrian moving velocity at the entrances of exit passages as a function of time.
Buildings 12 00853 g013
Figure 14. Water depth at the entrances of emergency safety passages as a function of time.
Buildings 12 00853 g014
Figure 15. Volume rendering of accumulated water in the Exit 4 passage.
Buildings 12 00853 g015
Figure 16. Flood inflow and outflow relationship diagram.
Buildings 12 00853 g016
Table 1. Time required for water depth of the monitoring point to exceed 50 cm.
Monitoring Point Number1234567
Time required (s)210430280350410390-
Publisher’s Note: MDPI stays neutral with regard to jurisdictional claims in published maps and institutional affiliations.

