1. Introduction
Since the emergence of Building Information Modeling (BIM), BIM technologies have presented promising results, such as a 75% enhancement in labor productivity [
1]. BIM has been used for different aspects of facility management including asset management [
2], data storage [
3], model visualization [
4], energy analysis [
5], safety [
6], lifecycle cost analysis [
7], and troubleshooting [
8], etc. Using BIM provides ease of access to required information while increasing ease of data modification [
9]. It also allows access to updated information and model through the building lifecycle [
10].
While previous studies have highlighted the positive impact of BIM on productivity [
1], facility life-cycle data and information captured in BI models during design and construction are critical for assisting and aiding facility managers and owners/operators to better maintain and operate their facilities while enhancing collaboration [
11]. Currently, this data and information are delivered using common BIM authoring and analysis platforms (such as Revit and Navisworks).
The lack of knowledge and skills of most facility managers regarding interaction with BIM authoring and analysis platforms [
11] discourages the use of these platforms by facility staff and hinders their ability to access critical life-cycle information embedded in the models. To facilitate the use and access of this critical information, software used to visualize and navigate model geometry and data should be more user-friendly and customized based on the needs of the user to enhance usability and support the adoption of the software selected [
12,
13]. Additionally, customizing the software used to respond to facility staff needs reduces data overload by presenting the most relevant information, supporting appropriate data interpretation [
14].
Because of their user-friendly interface, ease of use, and abstract functionality, Business Intelligence (BI) tools, such as the Microsoft Power BI platform, are becoming more common for supporting data-driven decision making [
15].
Microsoft Power BI is a collection of tools that connects data from different sources into coherent, visually immersive, and interactive insights [
16]. Dashboards can be designed using different visualization options (e.g., bar graph or slicer) to create insights that allow users to view and interact with the data in an intuitive interface. Power BI has multiple benefits compared to other visualization tools. Unlike Tableau, Power BI does not require programming skills but provides the option of running scripts. In contrast with Gephi, it does not require a good knowledge of graphs, as Gephi is only for graph visualization. As opposed to Plotly, Power BI allows integration with other Microsoft tools and platforms as well as other popular sources such as Google Analytics [
17].
Different studies have benefited from insights driven from Power BI dashboards and graphs. The authors of [
18] used Power BI graphs and dashboards to get insights about the space usage for designing facility layout. Further, refs. [
15,
16] used Power BI graphs and dashboards as an interactive tool for visualizing their facility data. Combining the features of Power BI with access to BIM can further enhance the decision-making processes. Power BI dashboards can be designed to address different types of maintenance requirements. For instance, dashboards can provide information necessary for responding to preventive maintenance such as information regarding valve access status, steam pressure, or supply airflow. Other dashboards can provide access to general asset information such as the model and the serial number of a piece of equipment. Dashboards provide a powerful tool to highlight specific Key Performance Indicators (KPIs) that matter most to the facility user.
Facility management requires timely access to accurate and relevant information about different assets to address timely decision-making [
4]. Recently, information visualization has attracted attention. Besides BIM and Power BI, other communication technologies such as augmented reality (AR) and mixed reality (MR) glasses can also provide timely access to real-time information [
19]. These technologies also allow model visualization [
20] during different phases of the building lifecycle including design [
21], construction [
22], as well as operation and maintenance [
23] to support facility managers and staff productivity [
24]. Previous studies have highlighted the positive impact of using AR/MR glasses on productivity, maintenance performance, and decision-making [
25] by allowing easier interaction and faster access to information [
20,
26].
This paper builds on previous research investigating the use of systems-centric data in BIM models [
27] as well as the use of AR/MR glasses for supporting facility management [
28]. The paper focuses on answering the following questions: (i) What properties should be specified to identify and visualize building data, elements, and systems components? (ii) Can Power BI dashboards provide advantages for viewing critical facility data in a centralized setting? (iii) Can facility data dashboards provide benefits to facility managers and field staff for dealing with preventive maintenance or when responding to an emergency? (iv) How can the effectiveness and usefulness of Power BI dashboards to visualize life-cycle data and BIM geometry be validated and assessed? (v) Can Power BI dashboard design be implemented in an AR environment? and (vi) Can current capabilities of AR add any additional value for the end-user?
In this paper, the authors define new asset properties grouped into five categories to define a more comprehensive FM-Capable BIM [
27], allowing for better support of facility maintenance management. The paper discusses an implementation that imports a project’s Navisworks BIM with life-cycle data for the mechanical system into the Microsoft Power BI platform. Data from other sources are also imported into the BI database. Various dashboards are created to provide facility users the ability to visualize and access data and model geometry using various formats and filters. Dashboards are designed based on research and work experiences of the authors in the facility management field as well as initial discussions with several facility industry experts from the academic and health care sectors.
The dashboards are designed to provide facility managers with a user-friendly intuitive tool to access life-cycle data and navigate the model geometry without any prior experience with the software. The effectiveness and usefulness of the dashboards are validated using a structured approach utilizing a focus group of six industry experts. Interviews were scheduled with each participant to discuss the implementation and capture feedback. Interviews were followed by a questionnaire targeted to collect specific input from the participants.
The paper also discusses the potential use of the Microsoft HoloLens 2 MR glasses. The paper tested the ability to import the dashboards into the HoloLens 2 to provide the captured information in real-time to the field staff. The paper identified limitations with the Power BI and HoloLens 2 integration.
2. Methodology
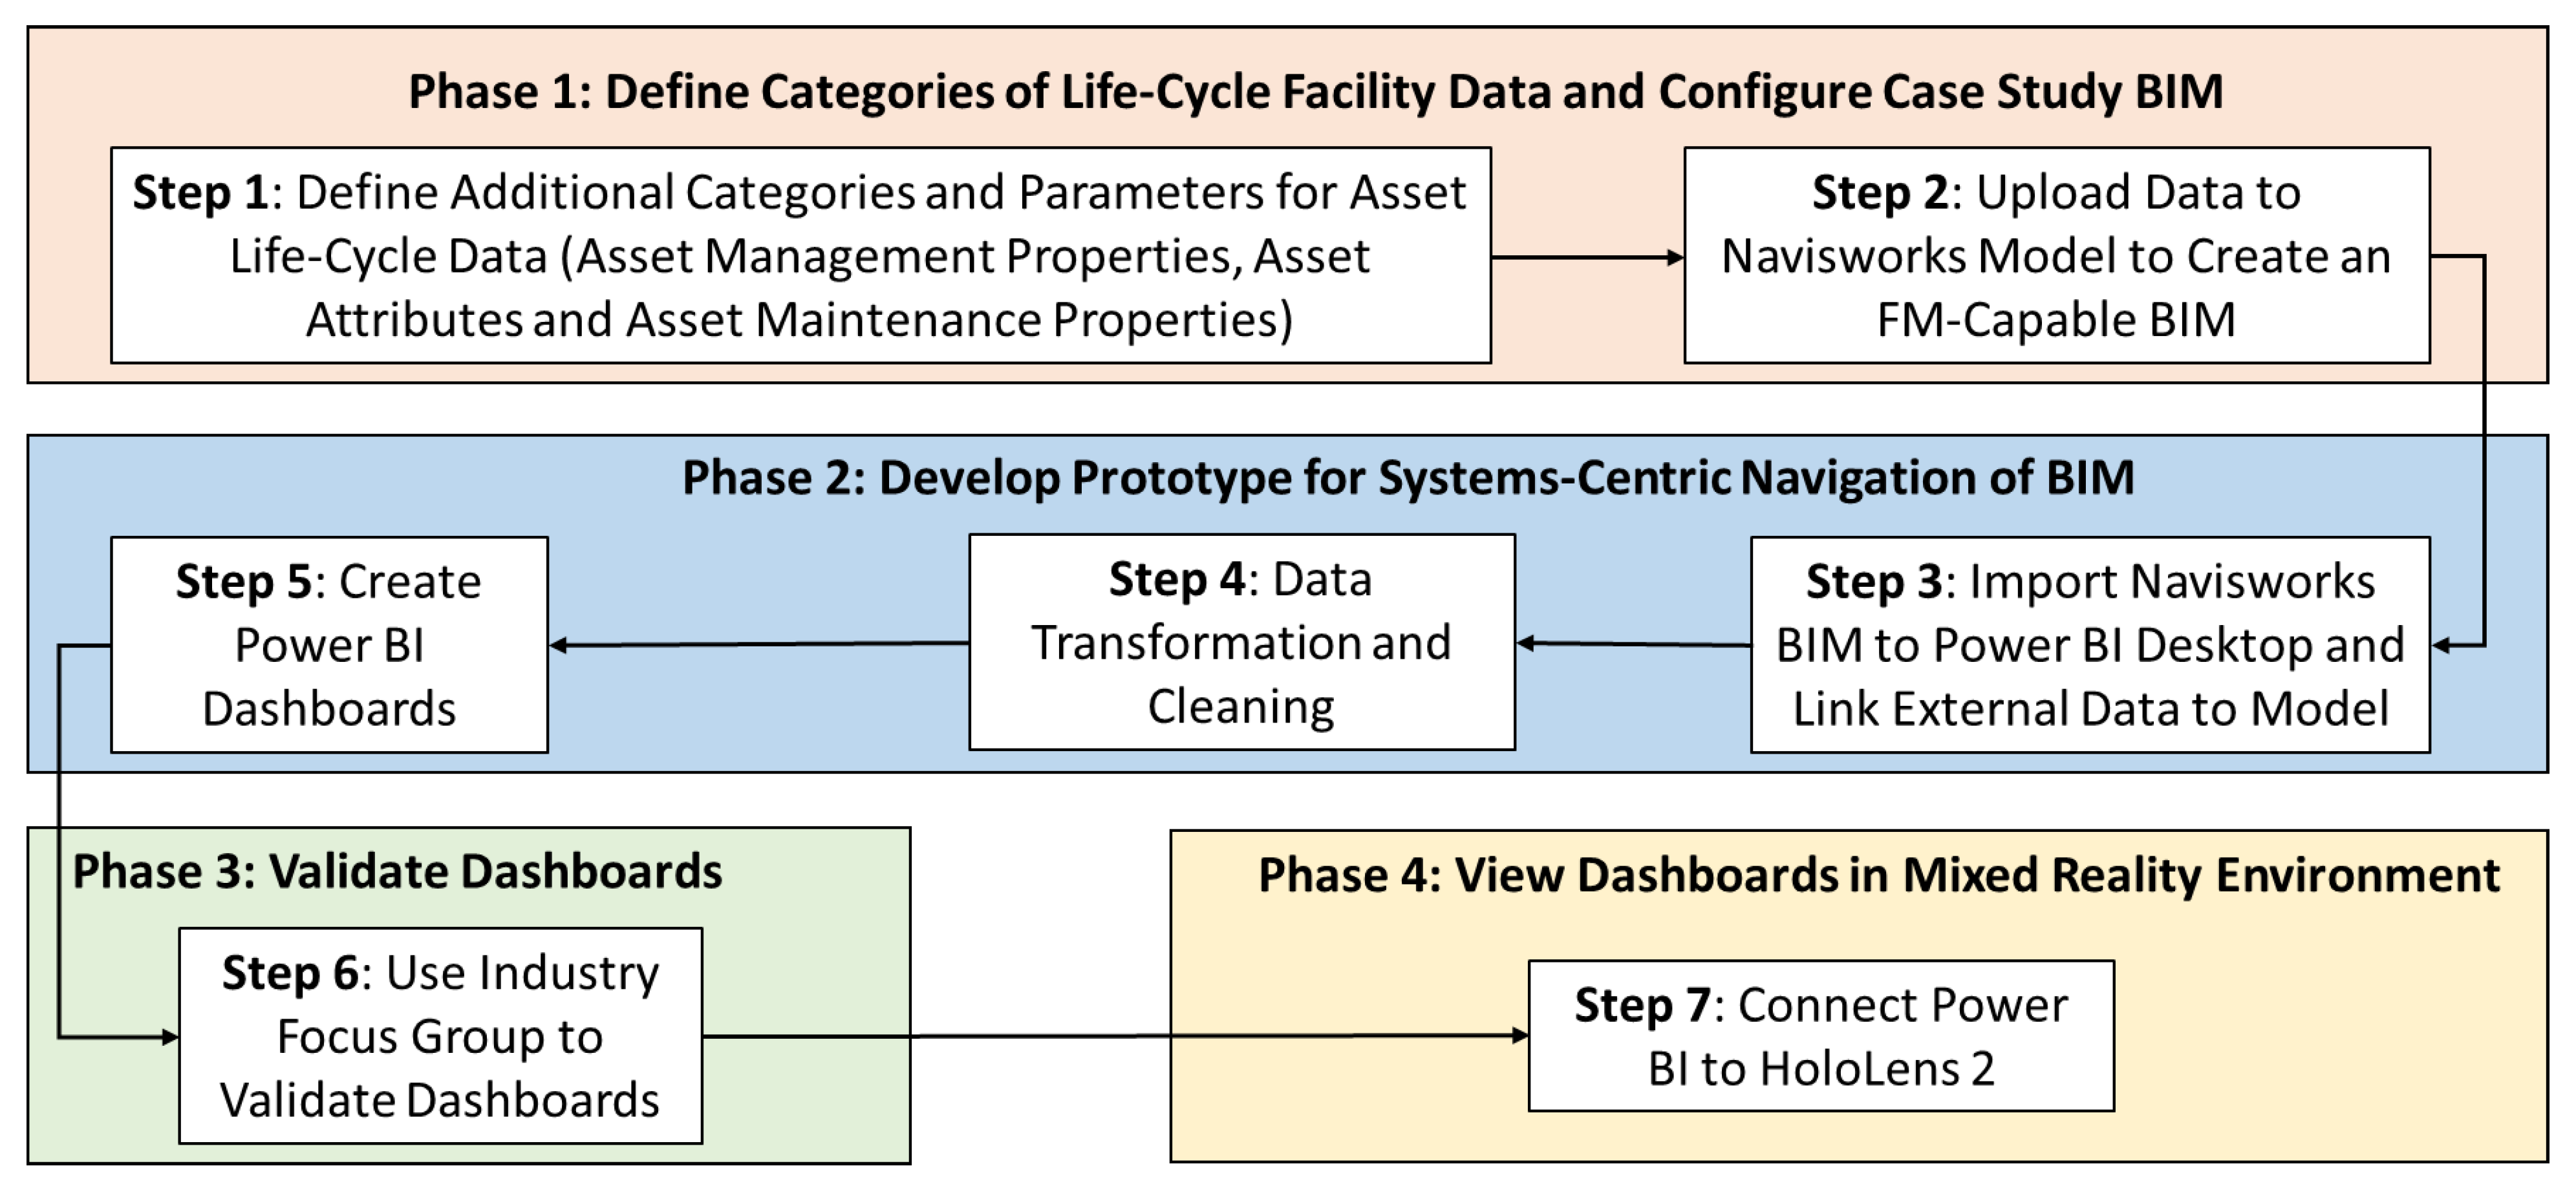
The research methodology for this paper comprises four distinct phases that include: (i) defining required categories of asset parameters for the BIM, (ii) developing a prototype implementation using a set of Power BI dashboards to visualize the model and query the imbedded data, (iii) validating usability and effectiveness of dashboards using a focus group of industry facility experts, and (iv) testing the prototype in a mixed reality (MR) environment. The prototype is designed to allow facility owners/operators to navigate the model and query the data from a systems-centric perspective, allowing faster access to critical model information when responding to a maintenance emergency. A 3D Navisworks model for a two-story science building on the campus of a four-year academic institution is utilized for the implementation, testing, and validation of the proof-of-concept application.
Figure 1 shows a summary of the research methodology. The following sections provide a detailed description of each phase and the corresponding steps.
The author’s contribution to the body of the knowledge is the distinct phases that facility managers/owners will have to go through to successfully utilize Power BI and its tools to support the Systems-Centric navigation of BIMs.
2.1. Phase 1, Step-1: Define Categories of Life-Cycle Facility Data
During a previous study [
27], the building’s 2D plans, specifications, and the Navisworks BIM for the building case study were thoroughly analyzed with a focus on the mechanical and plumbing systems. A set of data parameters grouped into two main categories (Asset Identification and Systems-Centric Properties) were defined and embedded in the BIM to allow for viewing and analyzing the model from a systems-centric perspective. The defined data parameters allowed users to filter and view model systems and components based on various criteria including components belonging to a specific system, components belonging to a specific location, components serving specific equipment, and components serving a specific location. The ability to view and isolate model systems and components using such criteria allowed for visualizing and analyzing the model from a systems-centric perspective aligned with how facility owners/operators are used to analyzing their systems to diagnose problems and respond to emergencies.
In this step, the authors define a new set of data parameters, thus expanding the facility data dictionary. Three additional data categories are developed to group the parameters, expanding the total categories of life-cycle data from two to five.
Table 1 illustrates the five data categories and corresponding parameters defined. The Asset Identification Properties and Systems-Centric Properties are adopted from the prior study, while the Asset Management Properties, Asset Attributes, and Asset Maintenance Properties are the new categories added in this study. Details of each data category and its parameters are provided in
Table A1,
Table A2,
Table A3,
Table A4 and
Table A5 in
Appendix A.
Properties in each category are defined to allow facility managers to have a clearer understanding of building components and how they interact with one another, and to allow for seamless identification of building assets for routine and emergency services. Properties from all five categories are added to pipes, ducts, and equipment belonging to the mechanical or plumbing system.
Asset Identification Properties category includes three parameters: ASSET_TAG, ASSET_ID and ASSET_DESCRIPTION.
Table A1 in
Appendix A provides a list of the parameters and a short description along with example parameter values.
Fifteen (15) Systems-Centric Properties are defined to assist facility managers in identifying and isolating model elements based on the specific system and subsystem. Properties in this category are based on a multi-level system hierarchy comprising of four (4) levels: System, System Type, System Classification, and System Name. The classification defines a natural breakdown of MEP systems into categories at different levels based on the type of system used and the function they provide to the building. The system classification hierarchy and corresponding parameters are developed by [
27].
Table A2 in
Appendix A provides details for parameters under this category.
The Asset Management Properties category is used to define asset parameters needed to allow facility managers proper and efficient operation and management of their assets.
Table A3 in
Appendix A provides details for parameters under this category.
Asset attributes comprise parameters that are unique and specific to each asset group and are based on design characteristics as per the asset specifications.
Table A4 in
Appendix A shows a list of asset attributes for an example asset group (AHU) with a description and example values for each parameter.
The Asset Maintenance Property set includes properties that can assist facility managers in scheduling and preparing for asset maintenance.
Table A5 in
Appendix A provides a short description and example values for each parameter. As indicated earlier, parameters under this category are not included in the model and will be imported directly into Power BI.
All properties across the five categories are defined based on authors’ experience, prior research [
27], and review of the literature [
29,
30]. Facility industry partners from the academic and healthcare sectors were also consulted on the development of these properties and their respective categories. For example, a facility manager of an academic campus emphasized the need to track and analyze asset life cycle costs in terms of the cost of repeated maintenance. This analysis can be used to decide on whether it is profitable to replace the asset or keep repairing it. Based on this discussion, three properties, INSTALLATION_COST, ORIGINAL_COST, and COST_OF_MAINTENANCE, were added. The facility manager also suggested the need to track the details of previous maintenance work (WORK_DESCRIPTION) so that subsequent maintenance can be forecasted.
Additional asset properties are also defined and expanded based on the literature review [
31]. For example, understanding which assets are more critical is an important criterion that can be utilized to plan and prioritize preventive maintenance for such assets. This motivated the authors to define a CIRITCALITY property.
2.2. Phase 1, Step-2: Configure the Navisworks BIM
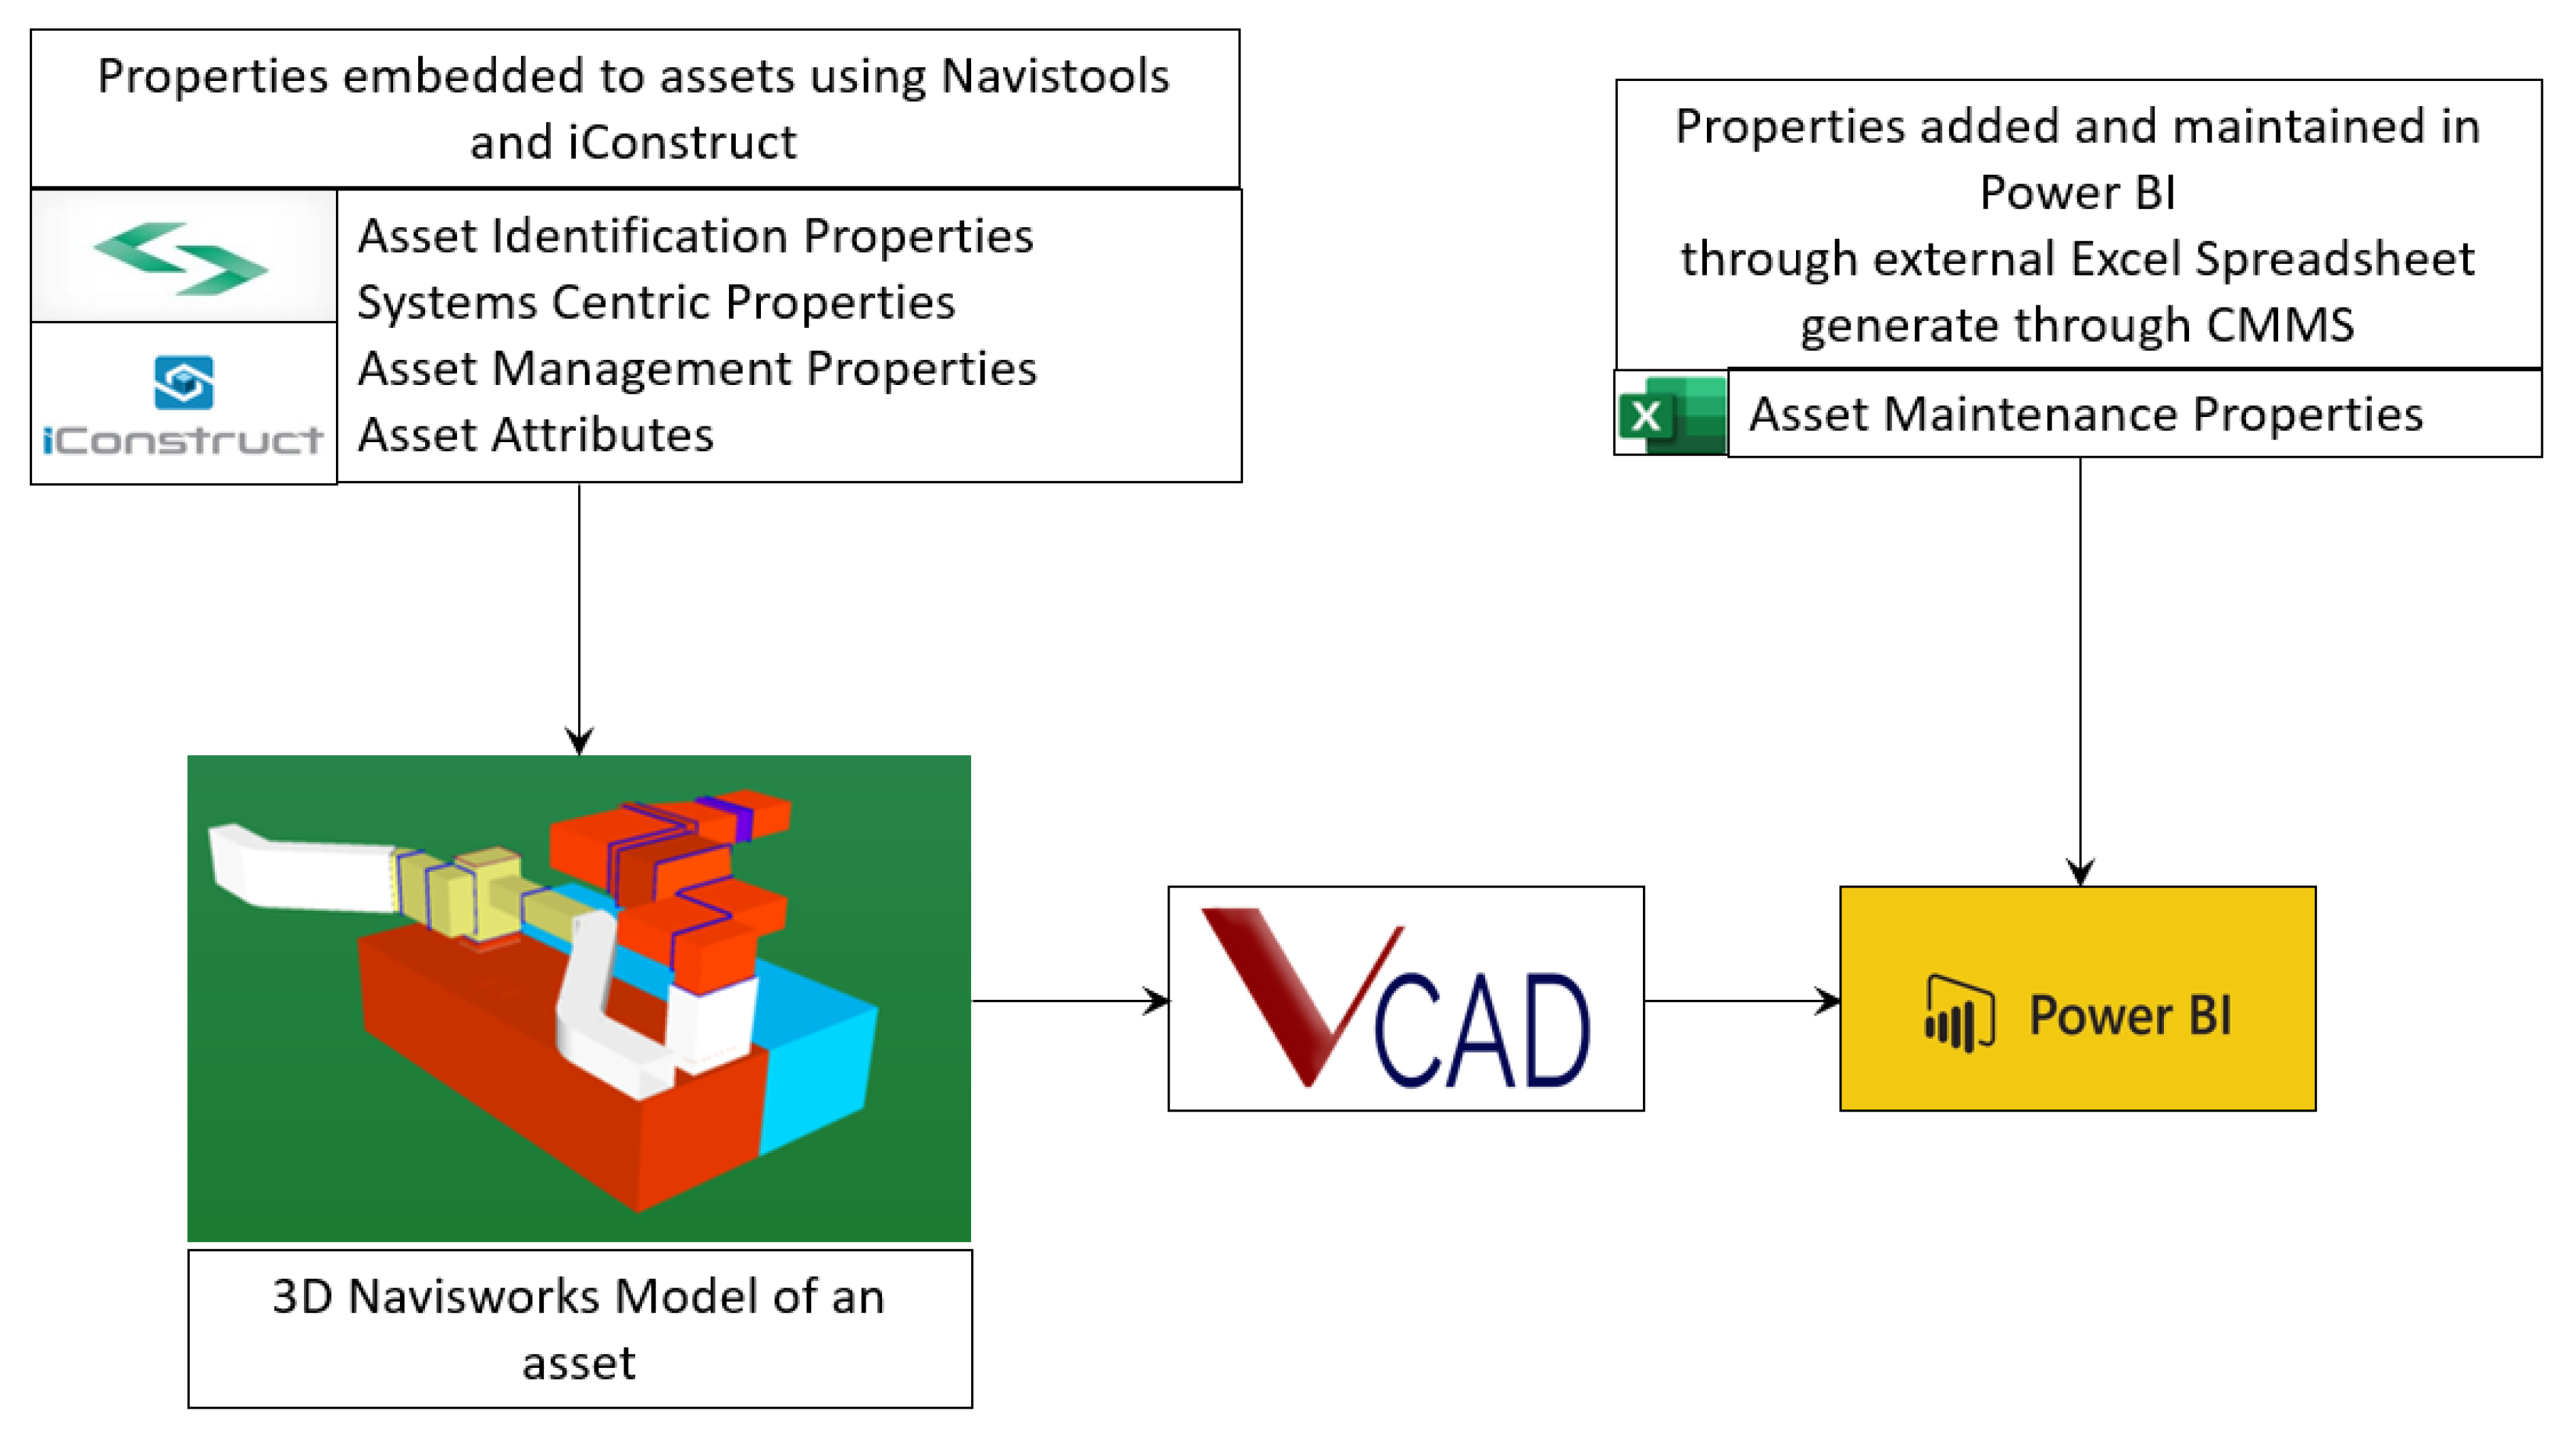
Using Navistools [
32] and iConstruct [
33], plugins for Navisworks, the Asset Identification Properties, Systems-Centric Properties, Asset Attributes, and Asset Management Properties are embedded in the Navisworks model to create an FM-capable BIM. Properties from the fifth category are imported directly into Power BI through an external excel spreadsheet. This demonstrates how additional data entered into or generated by a facility management system (e.g., a Computerized Maintenance Management System-CMMS) can be integrated at a later point with data already embedded in the model at project handover.
The Navisworks model analyzed under this study is a construction coordination model. The model is comprised of appended individual trade discipline models of different file formats including. rvt, .ifc, .dxf, and .dwg. These trade models had differing levels of information and properties defined. Additionally, properties and their values embedded in these discipline models are inconsistent and, in some cases, incorrect.
To embed all needed properties into the model, selected model elements including equipment, ducts, and pipes had to be grouped into selection sets by using common default properties defined in the model. In some cases, element grouping had to be done using a manual selection. Grouping model elements using selection sets assisted with faster identification of model elements belonging to the same category, system, and floor. This was a time-consuming task but necessary to prepare the model with the data. The Navistools plugin is used to export the element’s GUID to an Excel spreadsheet. Asset data is then entered into the spreadsheet and imported back into the model using iConstruct. Data for each element is grouped under three user-defined tabs: ASSET MANAGEMENT PROPERTIES, SYSTEMS-CENTRIC PROPERTIES, and ASSET ATTRIBUTES. The process of embedding the data (parameters and values) in the BIM took upwards of 300 man-hours to be completed. It is realized that this data entry process, while very critical to configuring the BIM with needed information, is labor-intensive. This can be reduced by defining and requiring owner standards that prescribe and specify asset data and allow capture and input of this data in trade models from their inception. Data requirements should be included in the design and construction contracts and defined in the project BIM execution plan.
2.3. Phase 2, Step-3: Export Navisworks to Power BI Desktop
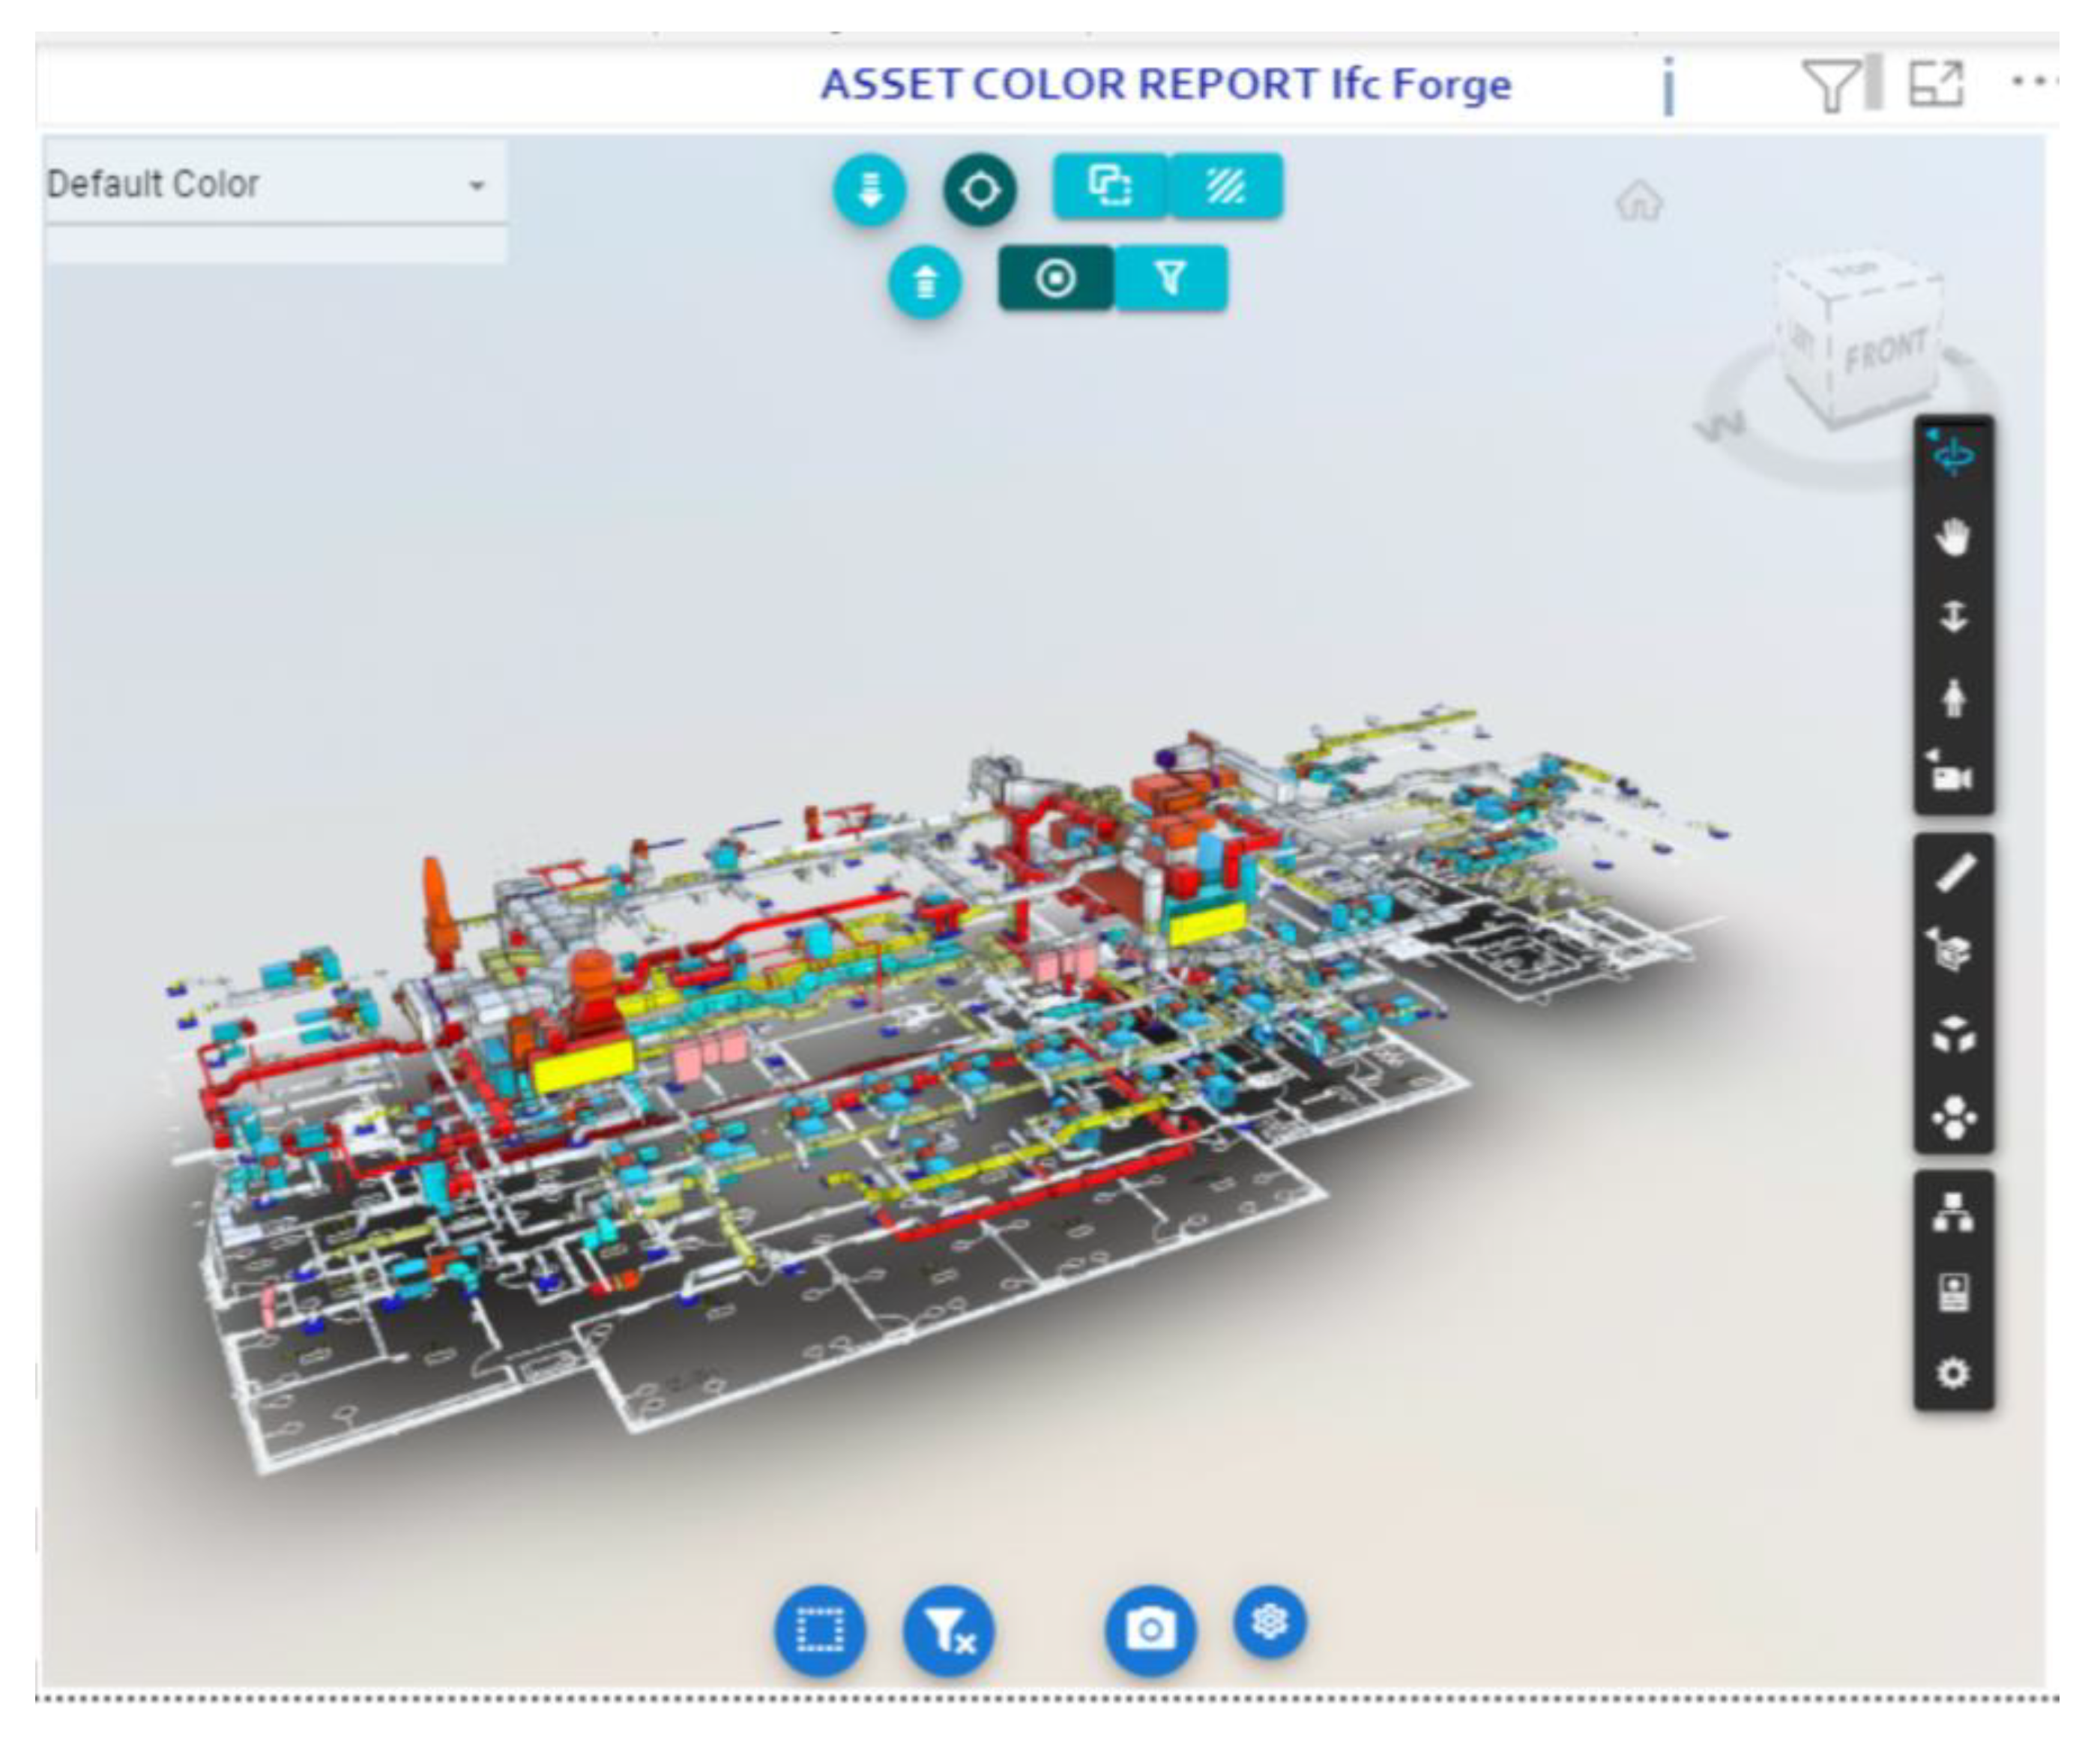
To open the Navisworks BIM into Power BI, the model had to be first converted using VCAD [
34] to generate a Power BI template file. During the conversion process, the VCAD application provides users with the option to select either the default 3D open viewer or the Autodesk Forge 3D viewer in their Power BI template. The Autodesk Forge 3D viewer option was chosen as it provides more visualization tools including clustering graphical elements by category. VCAD also provides a Text Filter to filter elements based on a specific property value.
Figure 2 illustrates the Forge viewer options.
Once the Navisworks BIM is converted, it is imported into the Power BI platform. Additional parameter data from the Asset Maintenance Properties category is imported from an external database (
Figure 3) and linked to the BIM elements using a common data column. During model processing, VCAD generates a unique value for each graphical element saved under an “ObjectId” column in the model data table.
To link external data to model elements, a similar column with the similar heading “ObjectId” is added to the imported external data table. A one-to-one relationship link between the imported table and the existing model table is created in Power BI to link the two data sources together.
2.4. Phase 2, Step-4: Data Transformation and Cleaning
Data transformation is the process of converting data from one format or structure into another. Data cleaning, also known as data scrubbing [
35], involves removing data that does not belong in the dataset. Data transforming and cleaning were conducted within Power BI to prepare for using different visualization tools and creating dashboards.
Data in various tables generated by VCAD when processing the BIM needs to be transformed and cleaned to restructure the data into a usable format, remove incorrect, duplicate, or unnecessary data, and fix any errors or missing data within the dataset. This allows for developing the required visualizations more efficiently and effectively.
- (a)
Data Transformation
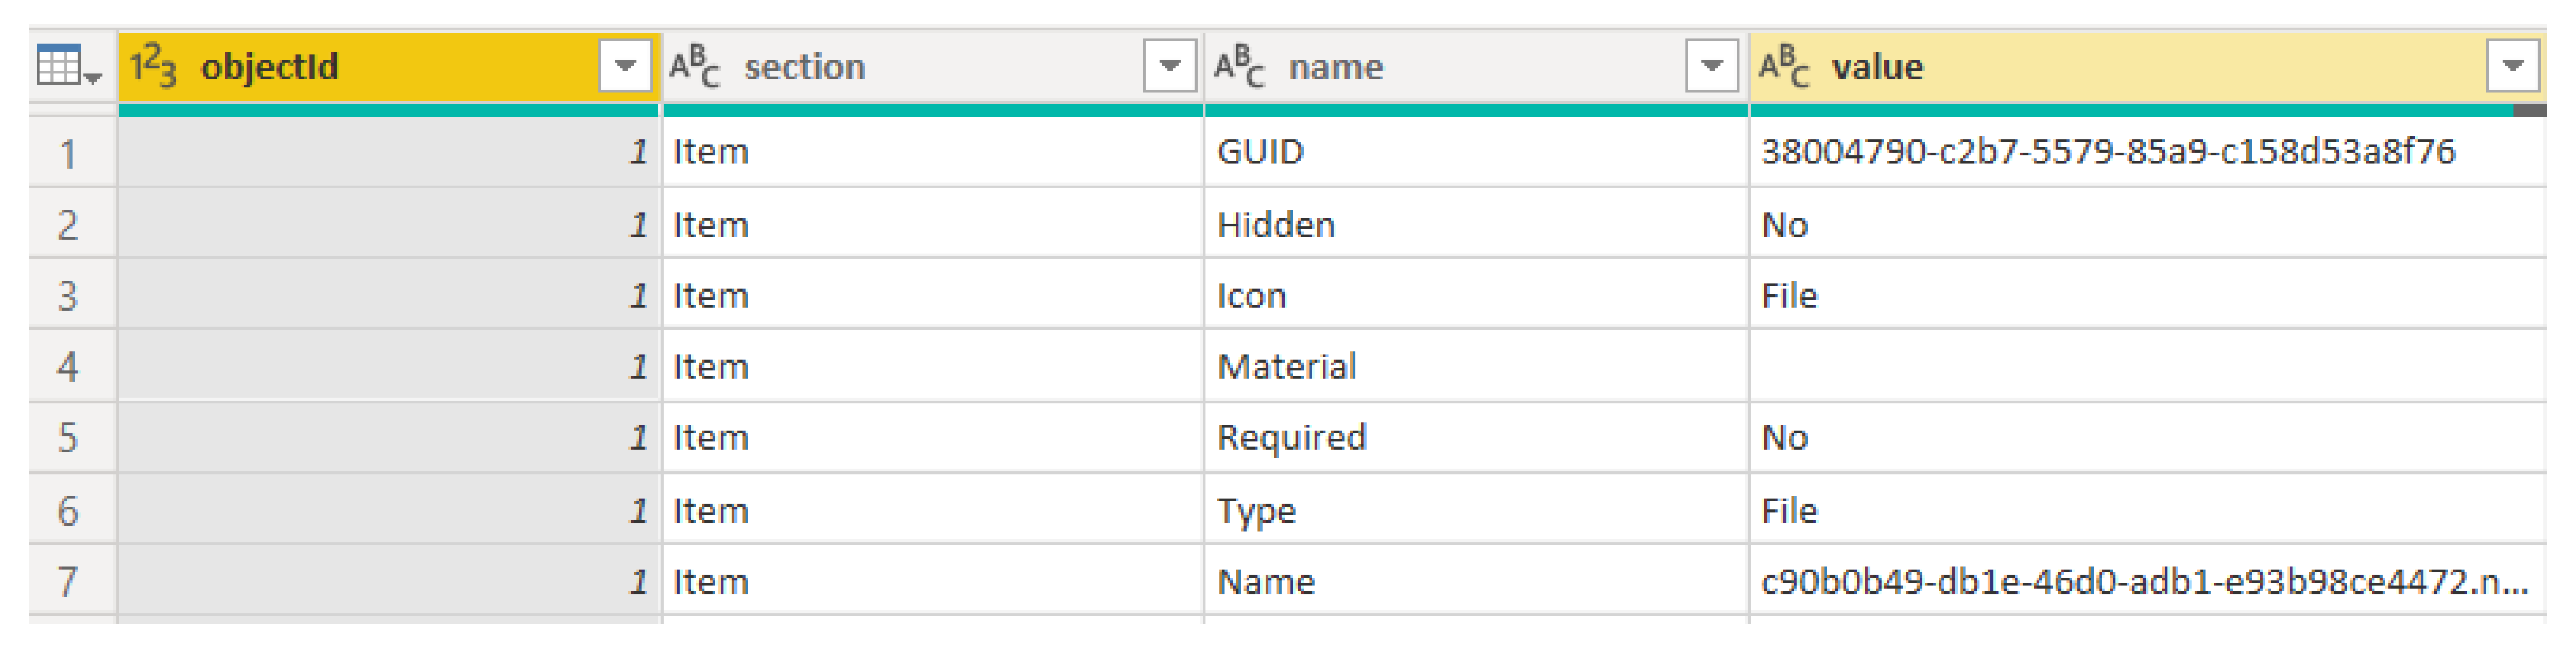
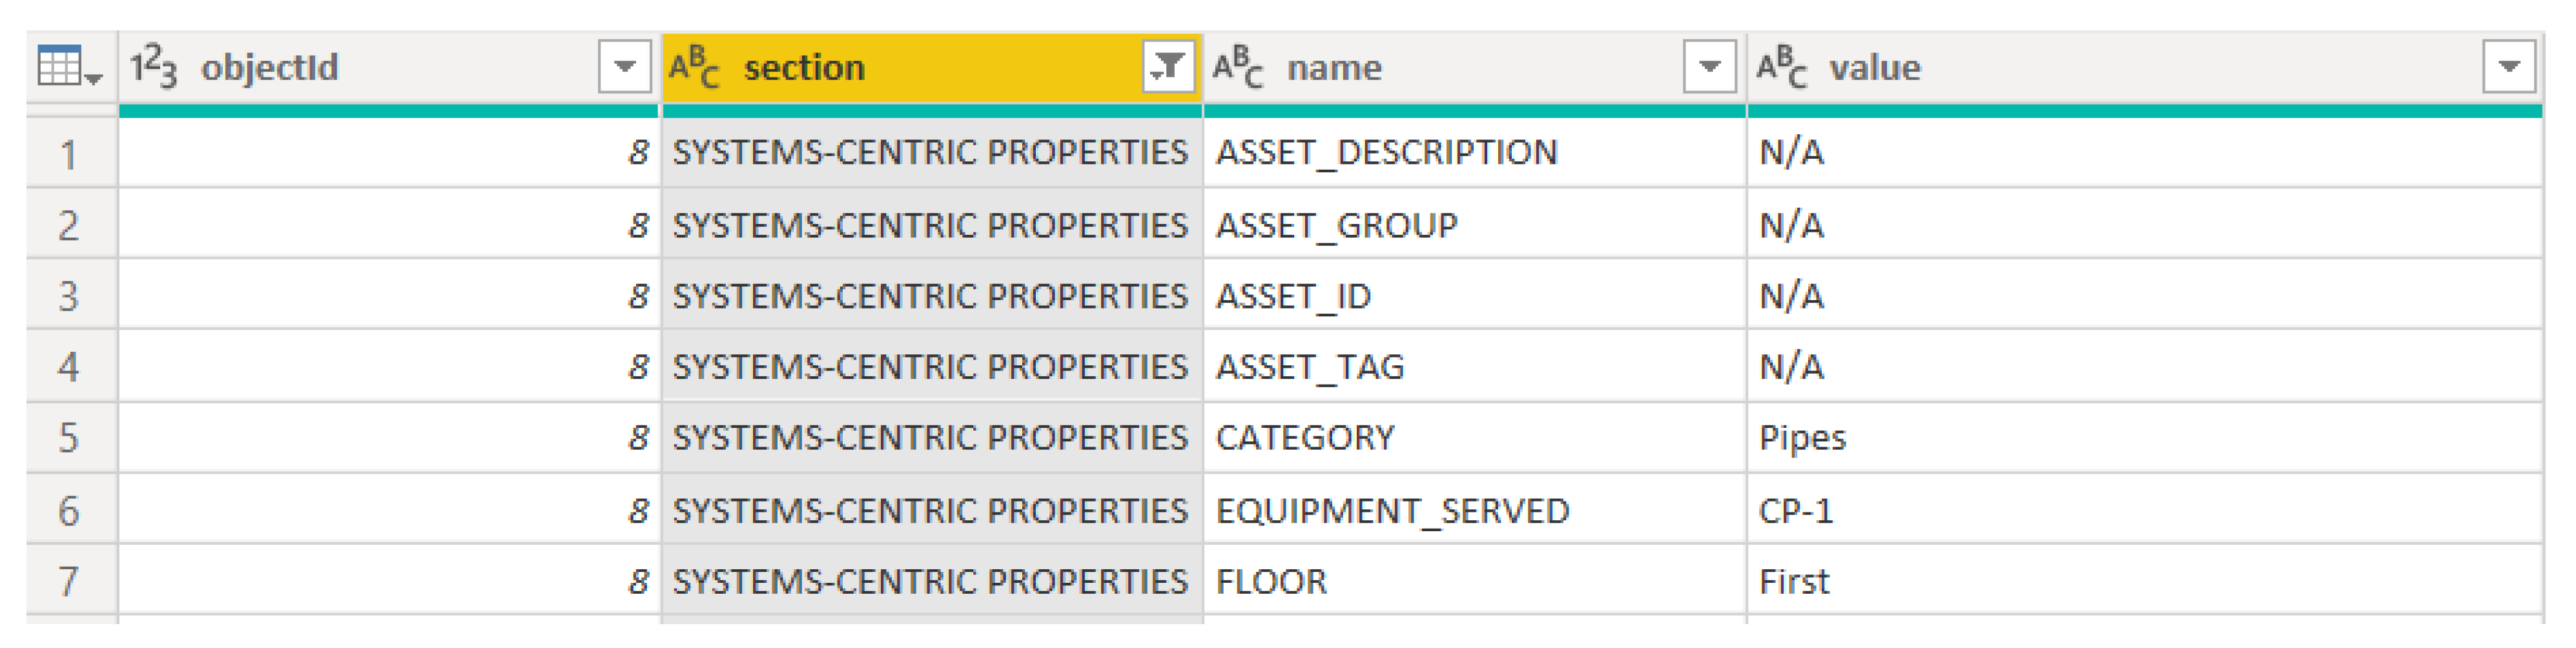
The Power BI template generated from processing the Navisworks BIM using VCAD will include a query table named “VCAD_Properties”. This query will include all the properties and values embedded in the model.
Figure 4 shows a portion of the VCAD_Properties query.
The ‘objectId’ column includes a unique identification number generated by VCAD for every element of the model. The ‘section’ column represents the names of the property tabs from Navisworks. The ‘name’ column represents the property name and the ‘value’ column represents the data values of the properties.
The “VCAD_Properties” table was split into three tables: the Systems-Centric Table, the Asset Management Properties Table, and the Asset Attributes Table. This allowed using each table and data separately to link to the Power BI visuals to create the different dashboards.
First, the ‘section’ column for each of the three tables is filtered to show only data rows with a ‘SYSTEMS-CENTRIC PROPERTIES’ value, an ‘ASSET MANAGEMENT PROPERTIES’ value, or ‘ASSET ATTRIBUTES’.
Figure 5 shows an example of the Systems-Centric Table filtered by the ‘section’ column.
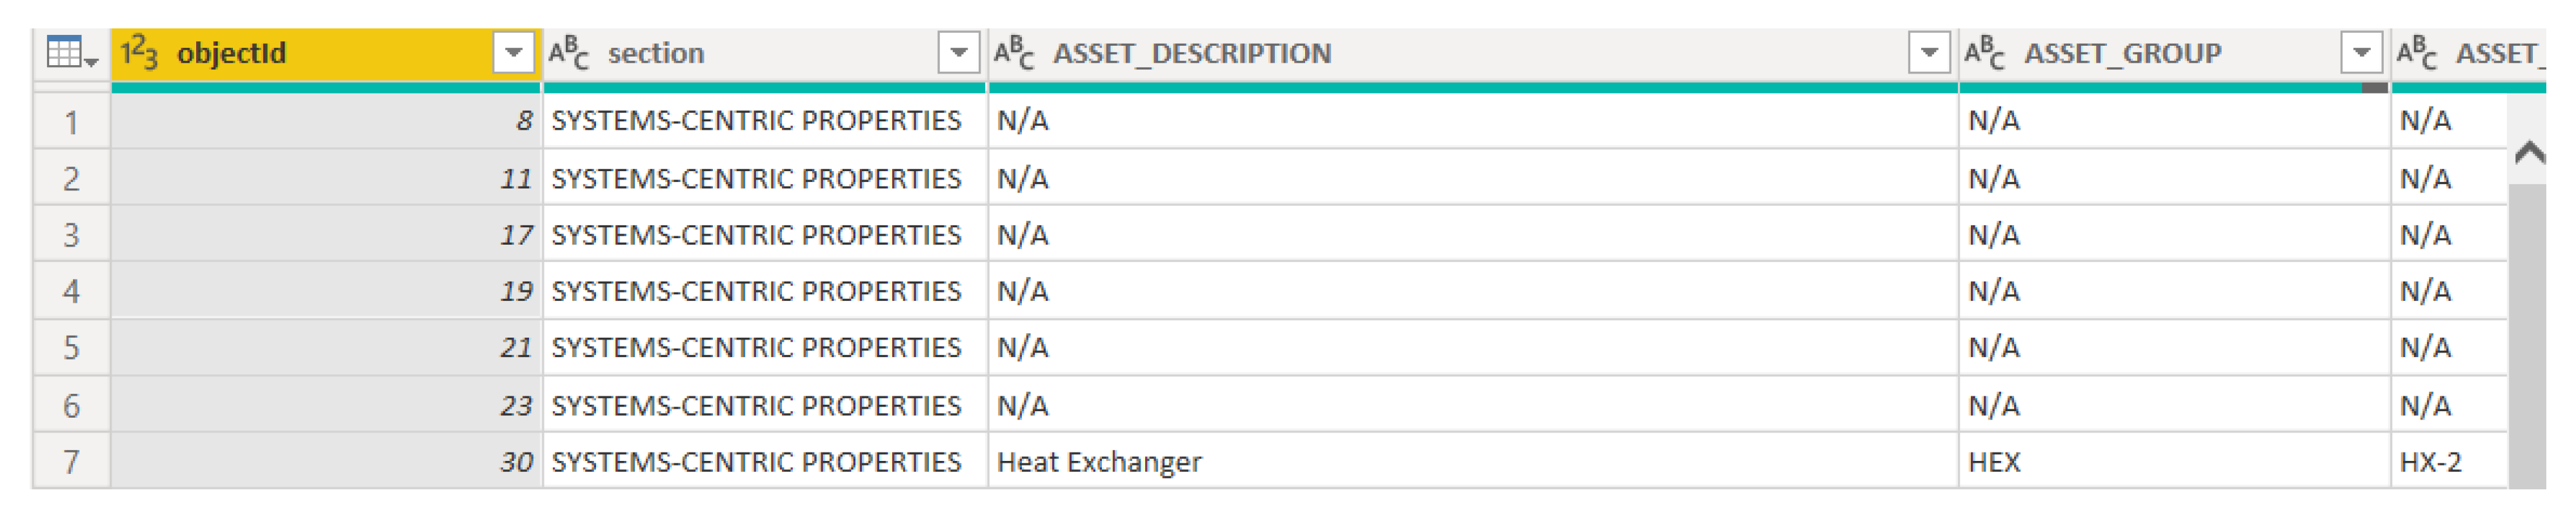
Each table is then pivoted along the “name” column and displaying corresponding data from the “value” column.
Figure 6 shows the results of this process applied to the Systems-Centric Table.
- (b)
Data Cleaning
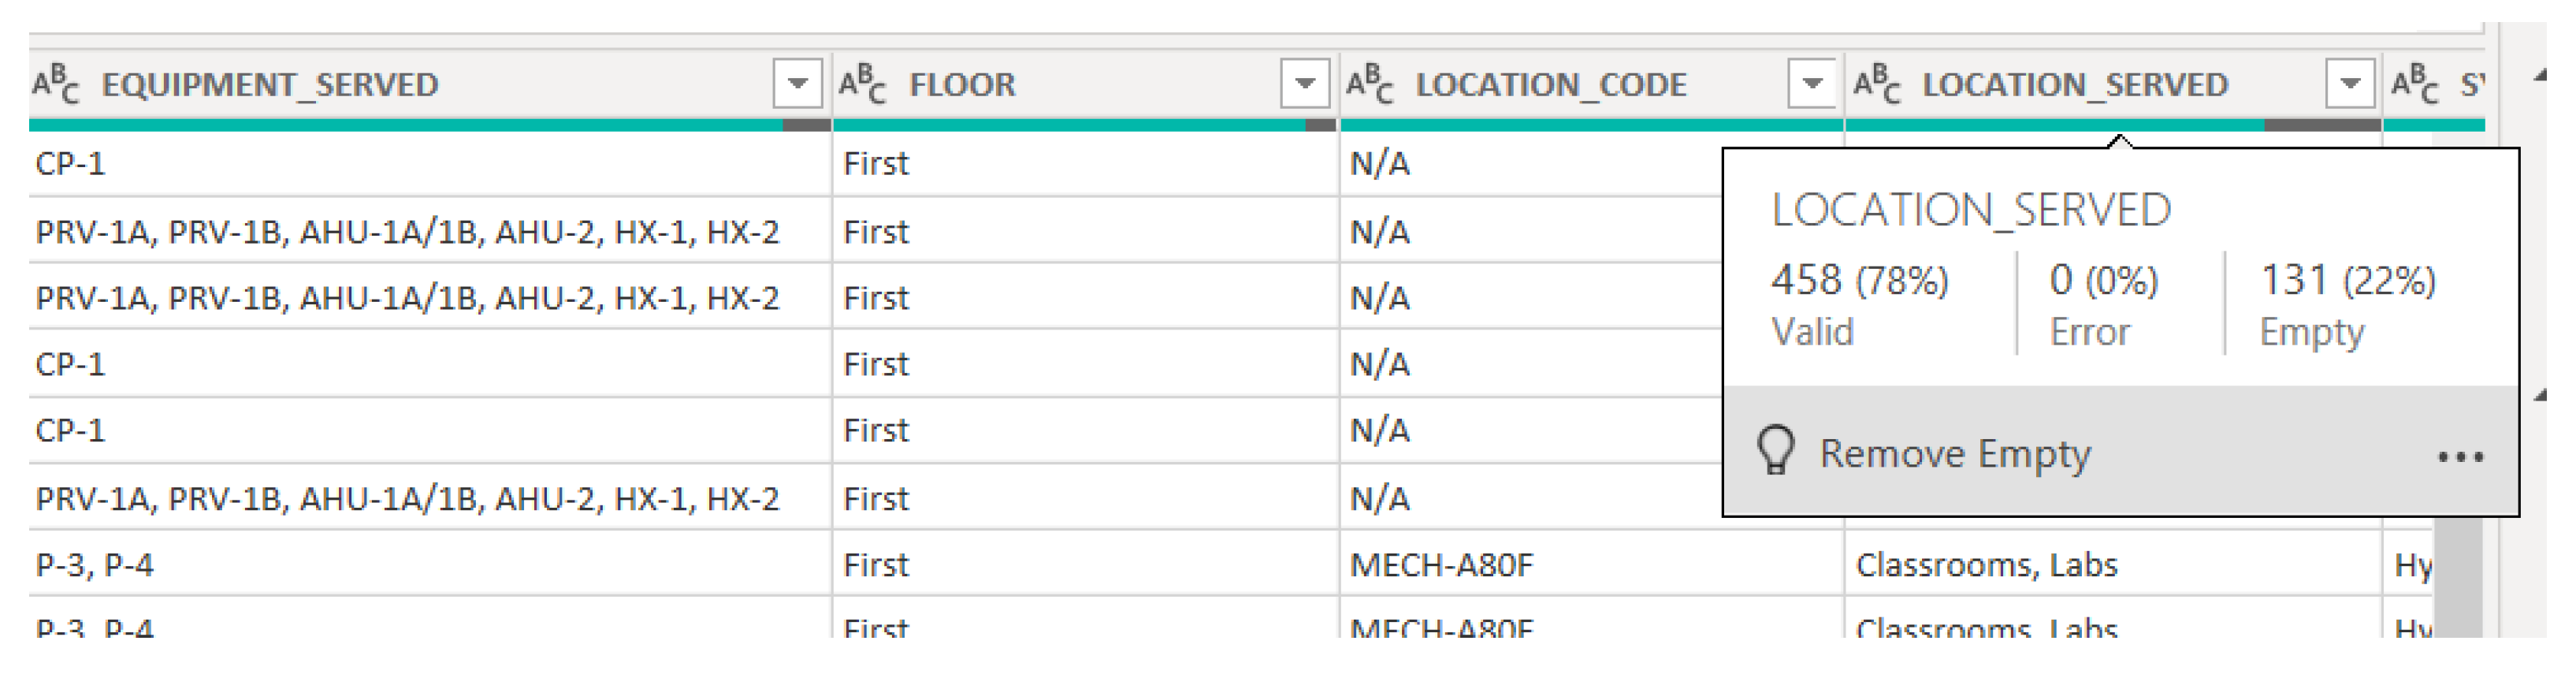
Data in tables imported into power BI are automatically checked to see if they contain any missing values or errors. As shown in
Figure 7, this is indicated by a colored line that appears below each column heading (green = valid values; gray = missing value; red hatched = error value). As each column is selected, Power BI displays information regarding percentage data validity in the column (%Valid, %Error, and %Empty).
If a column has any error value, the user can use the “Replace Errors” function to correct the value. Similarly, empty column values can be replaced with a user-defined value using the “Replace Values” option. Data transformation and scrubbing steps are also applied to the “Asset Management Properties” and “Asset Attributes” query tables.
2.5. Phase 2, Step-5: Create Power BI Dashboards
Four different dashboards are created using various visualization tools (e.g., Slicer, Table, Matrix, etc.) provided by the Power BI platform. Dashboards are created by linking different data tables with different visualization tools. Dashboard 1 is created to support the filtering of model elements and corresponding properties based on a specific asset identification value. Dashboard 2 assists in systems-centric navigation by isolation model graphics and data based on building systems. Dashboard 3 filters model information based on the make, model, and serial number of the assets. Dashboard 4 displays the life-cycle cost of the assets present in the building.
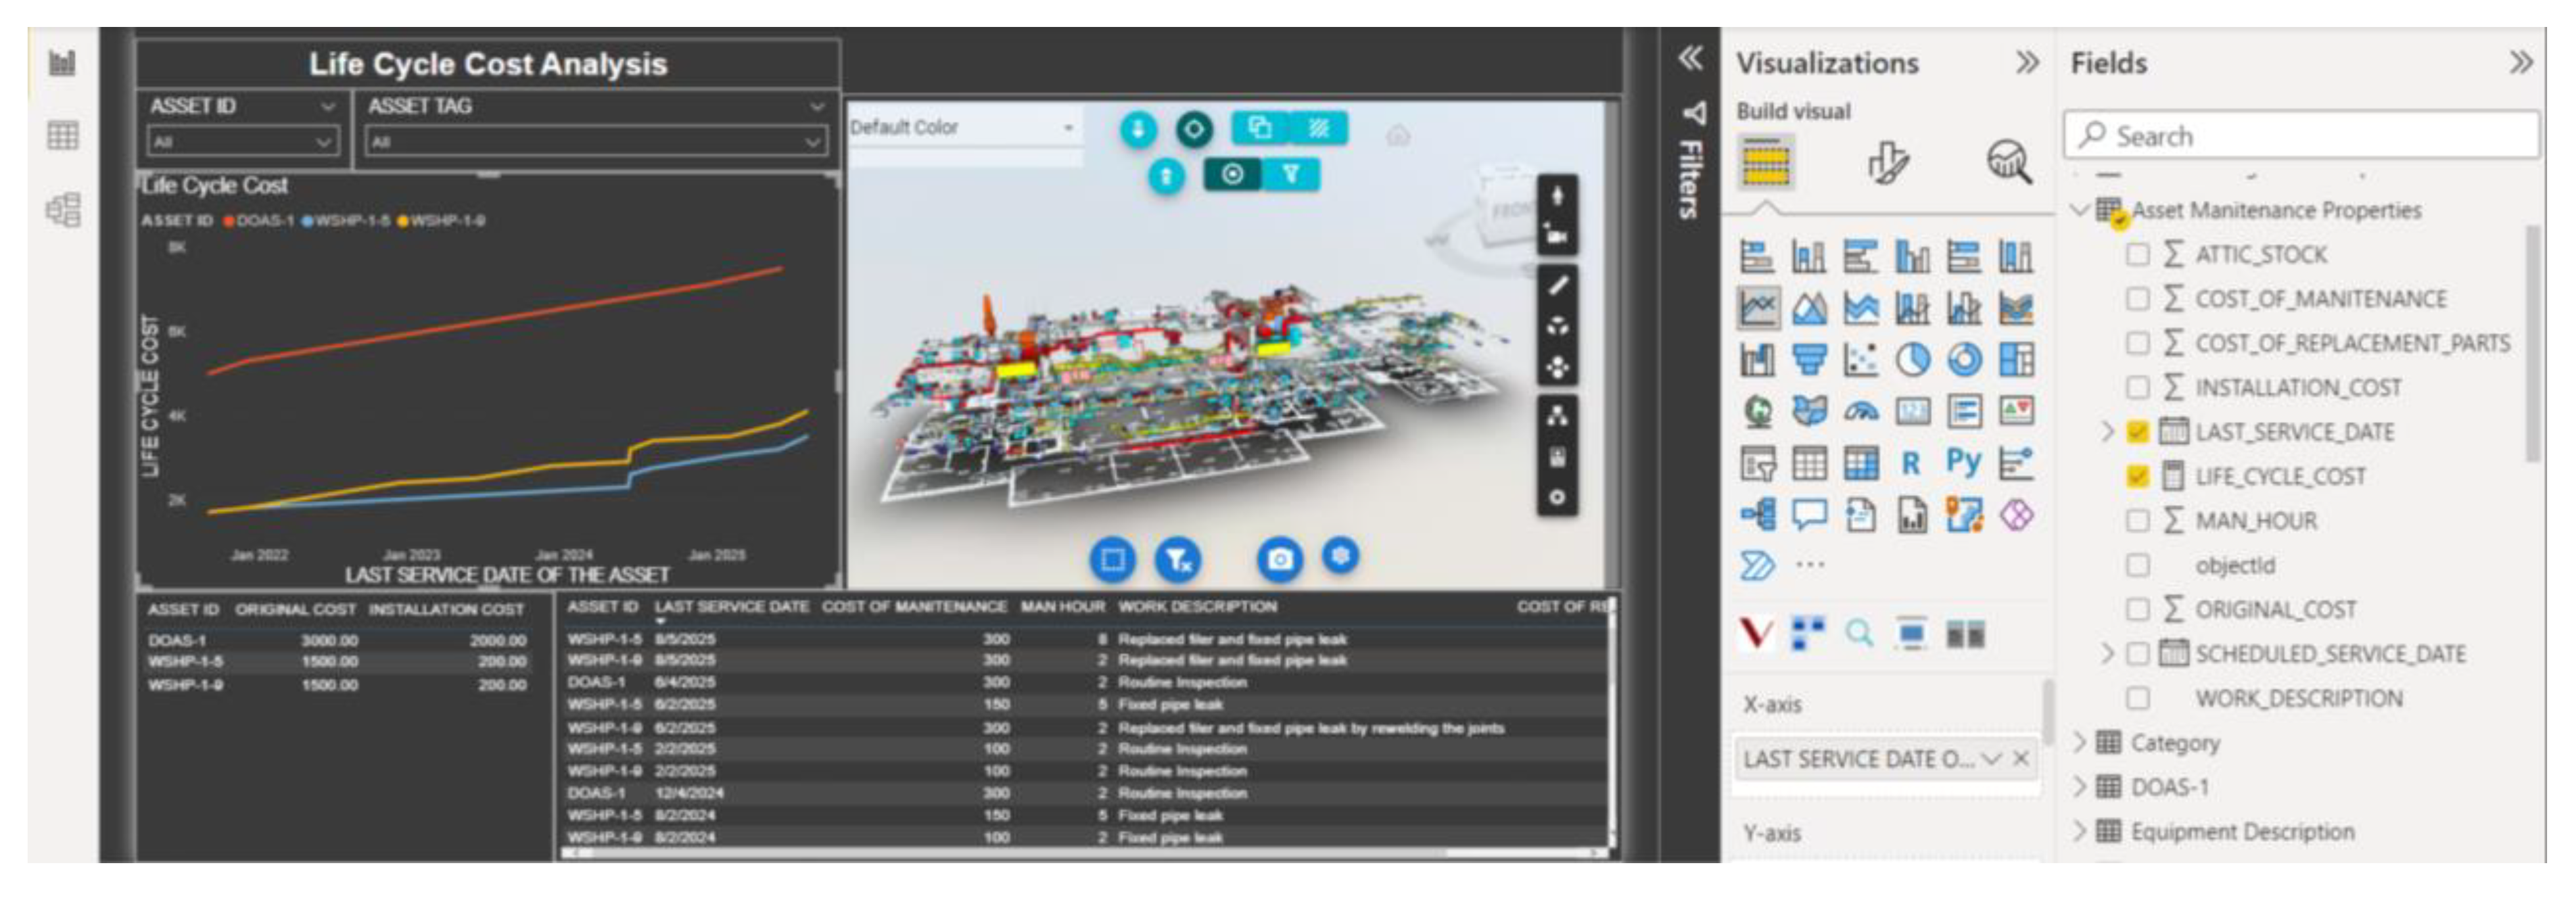
Figure 8 shows Dashboard 4 as an example. Dashboards are created by selecting one or more visualization tools and linking data from different tables with the visualization parameters specific to each tool to display information graphics in the Canvas area.
Content in each dashboard developed for this research is defined to provide valuable information to the facility staff to support timely decision-making. Dashboards are created to provide the facility managers and staff with specific information about an asset, to support a specific maintenance task, or to perform a lifecycle cost analysis of the data. The developed dashboard can also be frequently updated to reflect the changes in the source database and provide access to the most recent information.
Section 3 discusses the dashboards in more detail.
2.6. Phase 3, Step-6: Use Industry Focus Group to Validate Usability and Effectiveness of Dashboards
A focus group of six facility experts from the healthcare and academic sectors was utilized to validate the usability and effectiveness of the four developed dashboards. Structured interviews are conducted with the focus group to capture input and feedback. During the interview, the participants are provided with a quick overview of the developed dashboards, followed by a quick demo of each dashboard and its intended use. After the demo, the interviewees were given the opportunity to interact with the dashboards. Their feedback on the advantages and disadvantages of the dashboards was also captured.
Following the interview, the participants were asked to fill out a post-interview usability questionnaire (
Appendix B) by responding to 14 regarding how they rated the effectiveness and usability of Power BI dashboards on a scale from 1 to 5. The post-interview usability questionnaire is based on the Post Study System Usability Questionnaire that is used for assessing users’ perceived satisfaction with the presented computer system [
36]. The survey was divided into two sections with eight statements to evaluate the usability of the developed dashboards and six statements to evaluate the effectiveness of the dashboards.
The interviews and questionnaires are conducted in accordance with the institutional review board (IRB) protocol IRB-21–731 submitted to IRB at Virginia Tech. The details of work experience, industry sector, and current position of the interviewees are summarized in
Table A6, in
Appendix C. The interviewees were contacted from a convenience sample pool.
2.7. Phase 4, Step-7: Connect Power BI to HoloLens 2
The dashboards were published to Power BI Service and linked to the HoloLens 2 to test the user experience viewing the dashboards in a mixed reality environment. The integration of Power BI and HoloLens is still in its infancy. Testing was limited and was done by the authors in the lab. Future needed improvement areas are suggested.
3. Data Visualization and Analysis
Based on the authors’ experiences and discussions with facility experts, four (4) Power BI dashboards are developed. Each dashboard is designed to filter graphical elements and asset properties based on an asset’s unique identification value, the physical space that the equipment serves or is located in, or the building system the equipment belongs to. The dashboards also include a 3D model viewer to display model graphics and individual tables to view Systems-Centric Properties, Asset Management Properties, and Asset Attributes. Users can switch between these tables to view a variety of information provided based on their needs.
The following sections provide details of each dashboard developed.
3.1. Dashboard 1
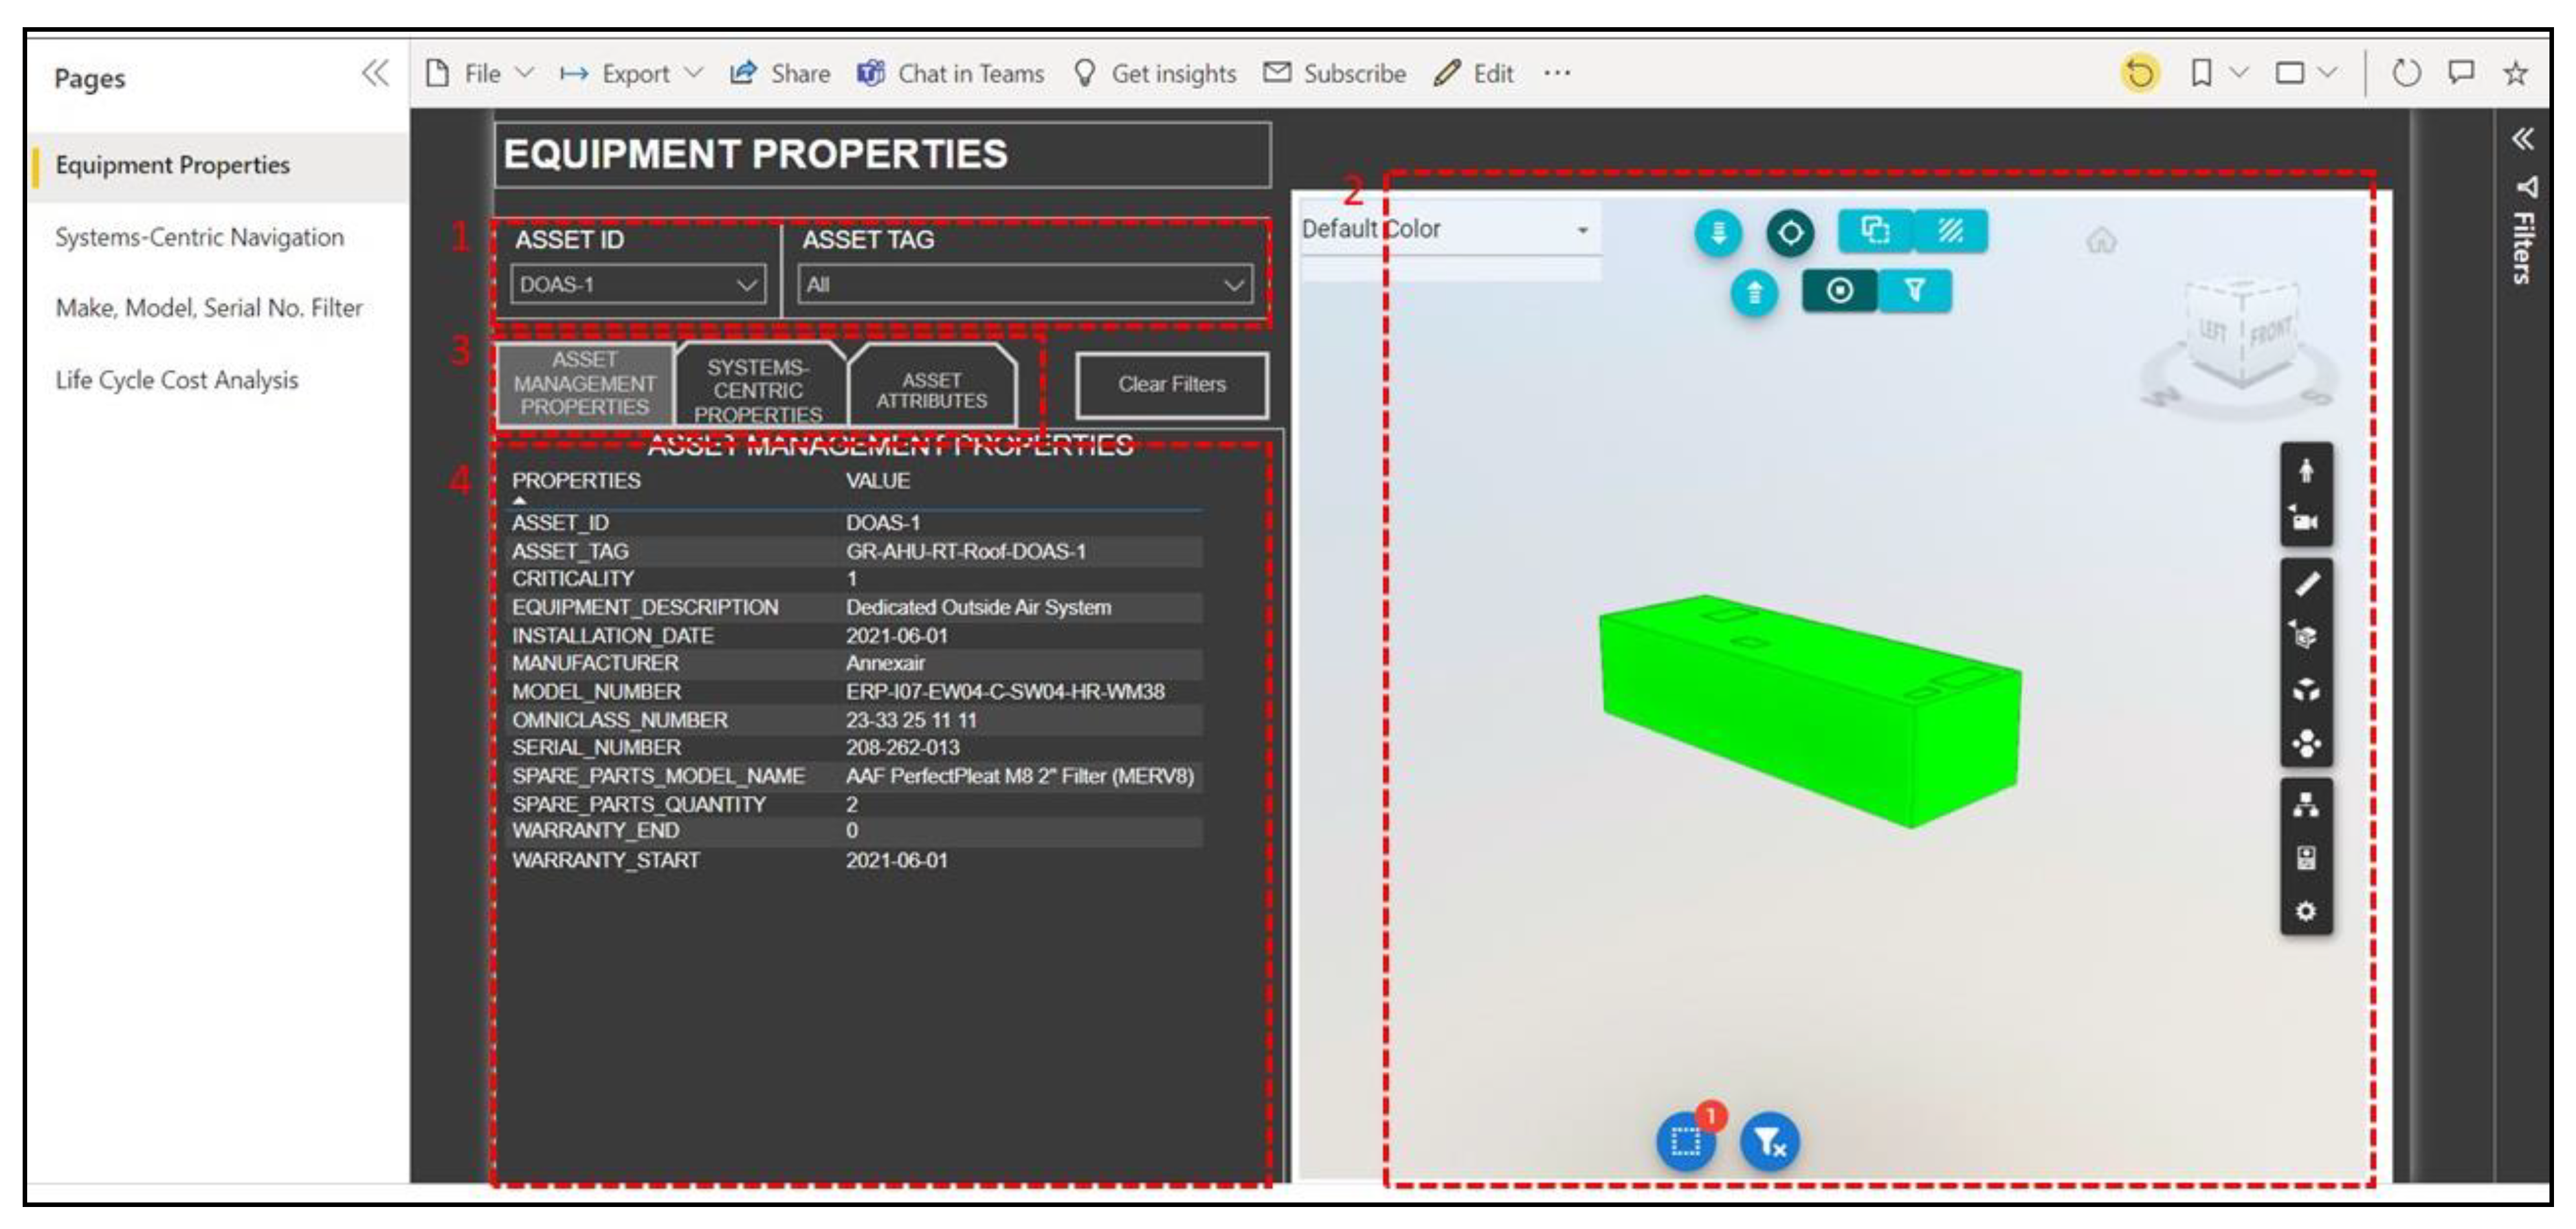
The first dashboard is designed to allow users to view different properties for any of the assets in the model. The dashboard supports the filtering of model elements and asset properties based on the asset’s unique identification values. The dashboard contains a 3D model viewer, drop-down filters to isolate elements based on Asset Tag and Asset ID, and tables to select and view asset properties. Users will also have the flexibility to select the category of asset properties they want to view in the dashboard.
Figure 9 details dashboard 1 showing an example using the “ASSET ID” to filter data for the DOAS-1. Area 1 in
Figure 9 houses drop-down filters based on the ASSET_ID and ASSET_TAG parameters. Area 2 is a model viewer window that displays the BIM. Asset property categories (Asset Management Properties, Systems-Centric Properties, and Asset Attributes) can be selected in area 3. Area 4 displays asset properties based on the category selected.
3.2. Dashboard 2
This dashboard allows users to filter model elements in the BIM and corresponding data based on the physical space that the assets are located in or the system the assets belong to. Users can filter data using six text filters based on ZONE, FLOOR, ROOM SERVED, EQUIPMENT by ROOM, SYSTEM TYPE, and SYSTEM CLASSIFICATION.
Figure 10 details dashboard 2 used to filter data for Zone-1, isolating elements that serve Zone-1. Area 1 of
Figure 10 houses the six different zones. Area 2 displays the graphical model. Asset property categories can be selected in area 3. Area 4 includes the tables containing Systems-Centric Properties, Asset Management Properties, and Asset Attributes for the assets.
3.3. Dashboard 3
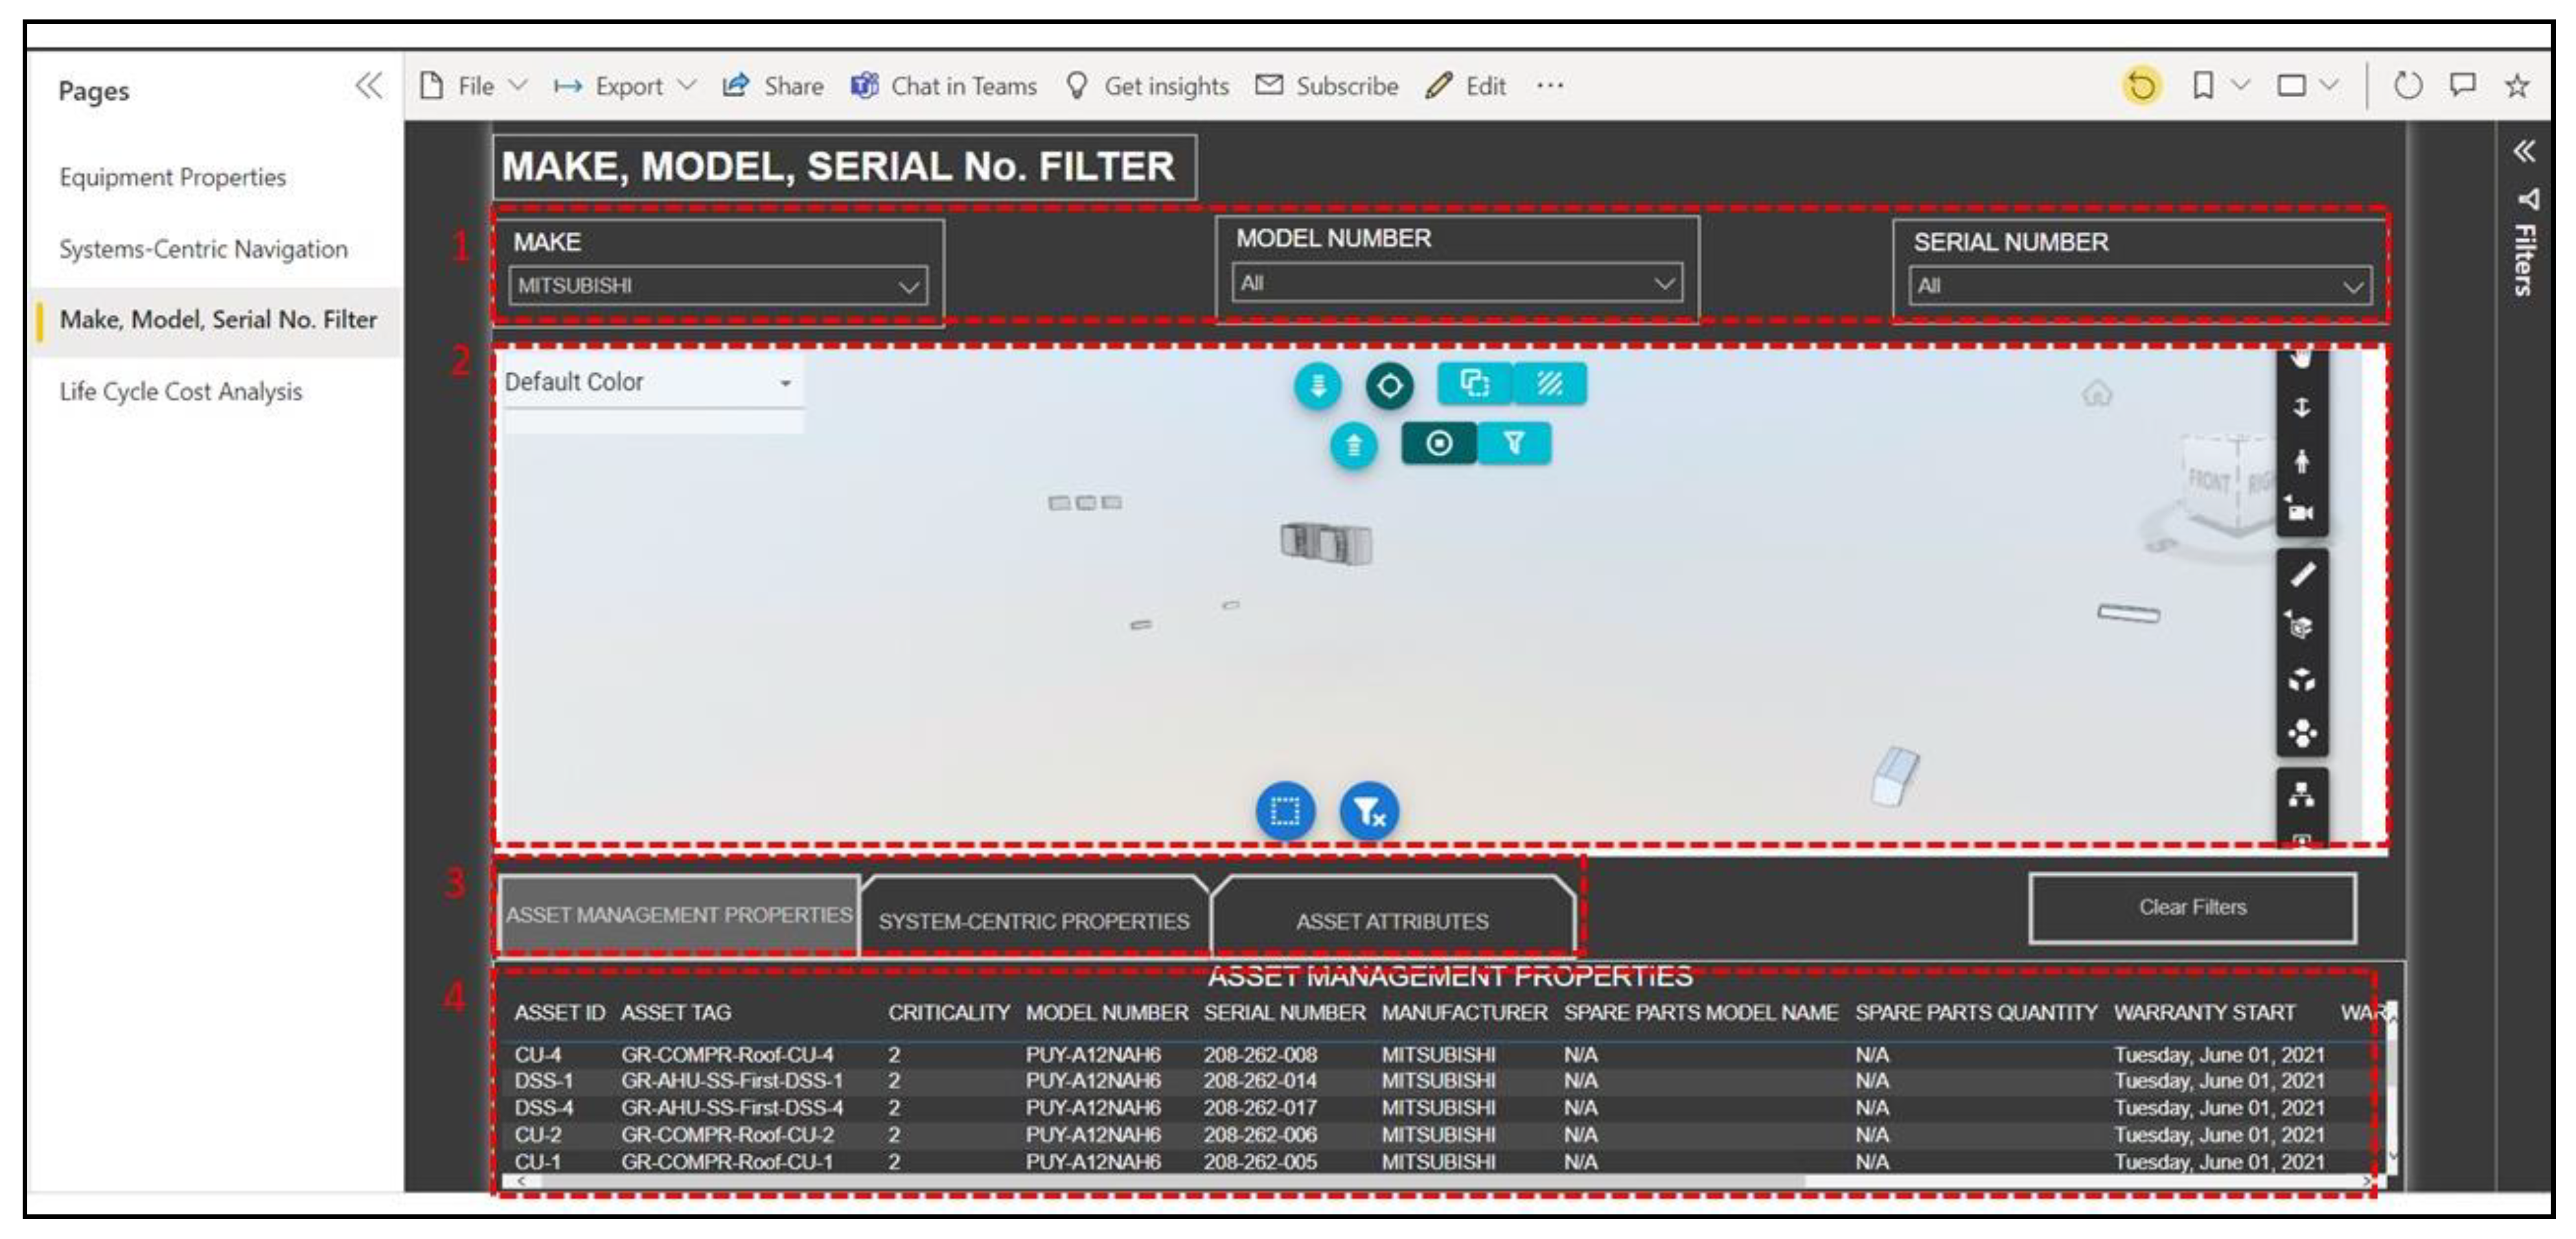
This dashboard is designed to allow the user to filter asset data based on the make (manufacturer) of the asset and its model or serial number. The dashboard will assist the user in addressing problems such as recalls or ordering parts by identifying assets belonging to a particular manufacturer or have a specific model number.
Figure 11 details dashboard 3 showing an example filtering assets for which MAKE = MITSUBISHI. This isolates all elements in the model that were manufactured by Mitsubishi and lists all their properties for the three categories. Area 1 of
Figure 11 houses filters based on MAKE, MODEL NUMBER, and SERIAL NUMBER. Region 2 displays the BIM. Asset properties categories can be selected in region 3. Region 4 includes the tables containing Systems-Centric Properties, Asset Management Properties, and Asset Attributes for the assets.
3.4. Dashboard 4
Dashboards 1 through 3 provide valuable information to the facility staff to support timely decision-making, but each facility also has specific data requirements based on the goal of the organization. These data are stored in various software applications used by facility staff and are updated frequently. Based on the discussion with one facility expert, the authors have identified examples of such data including the cost of maintenance, man-hours, cost of replacement parts, etc. Connecting Power BI to external databases allows access to such information.
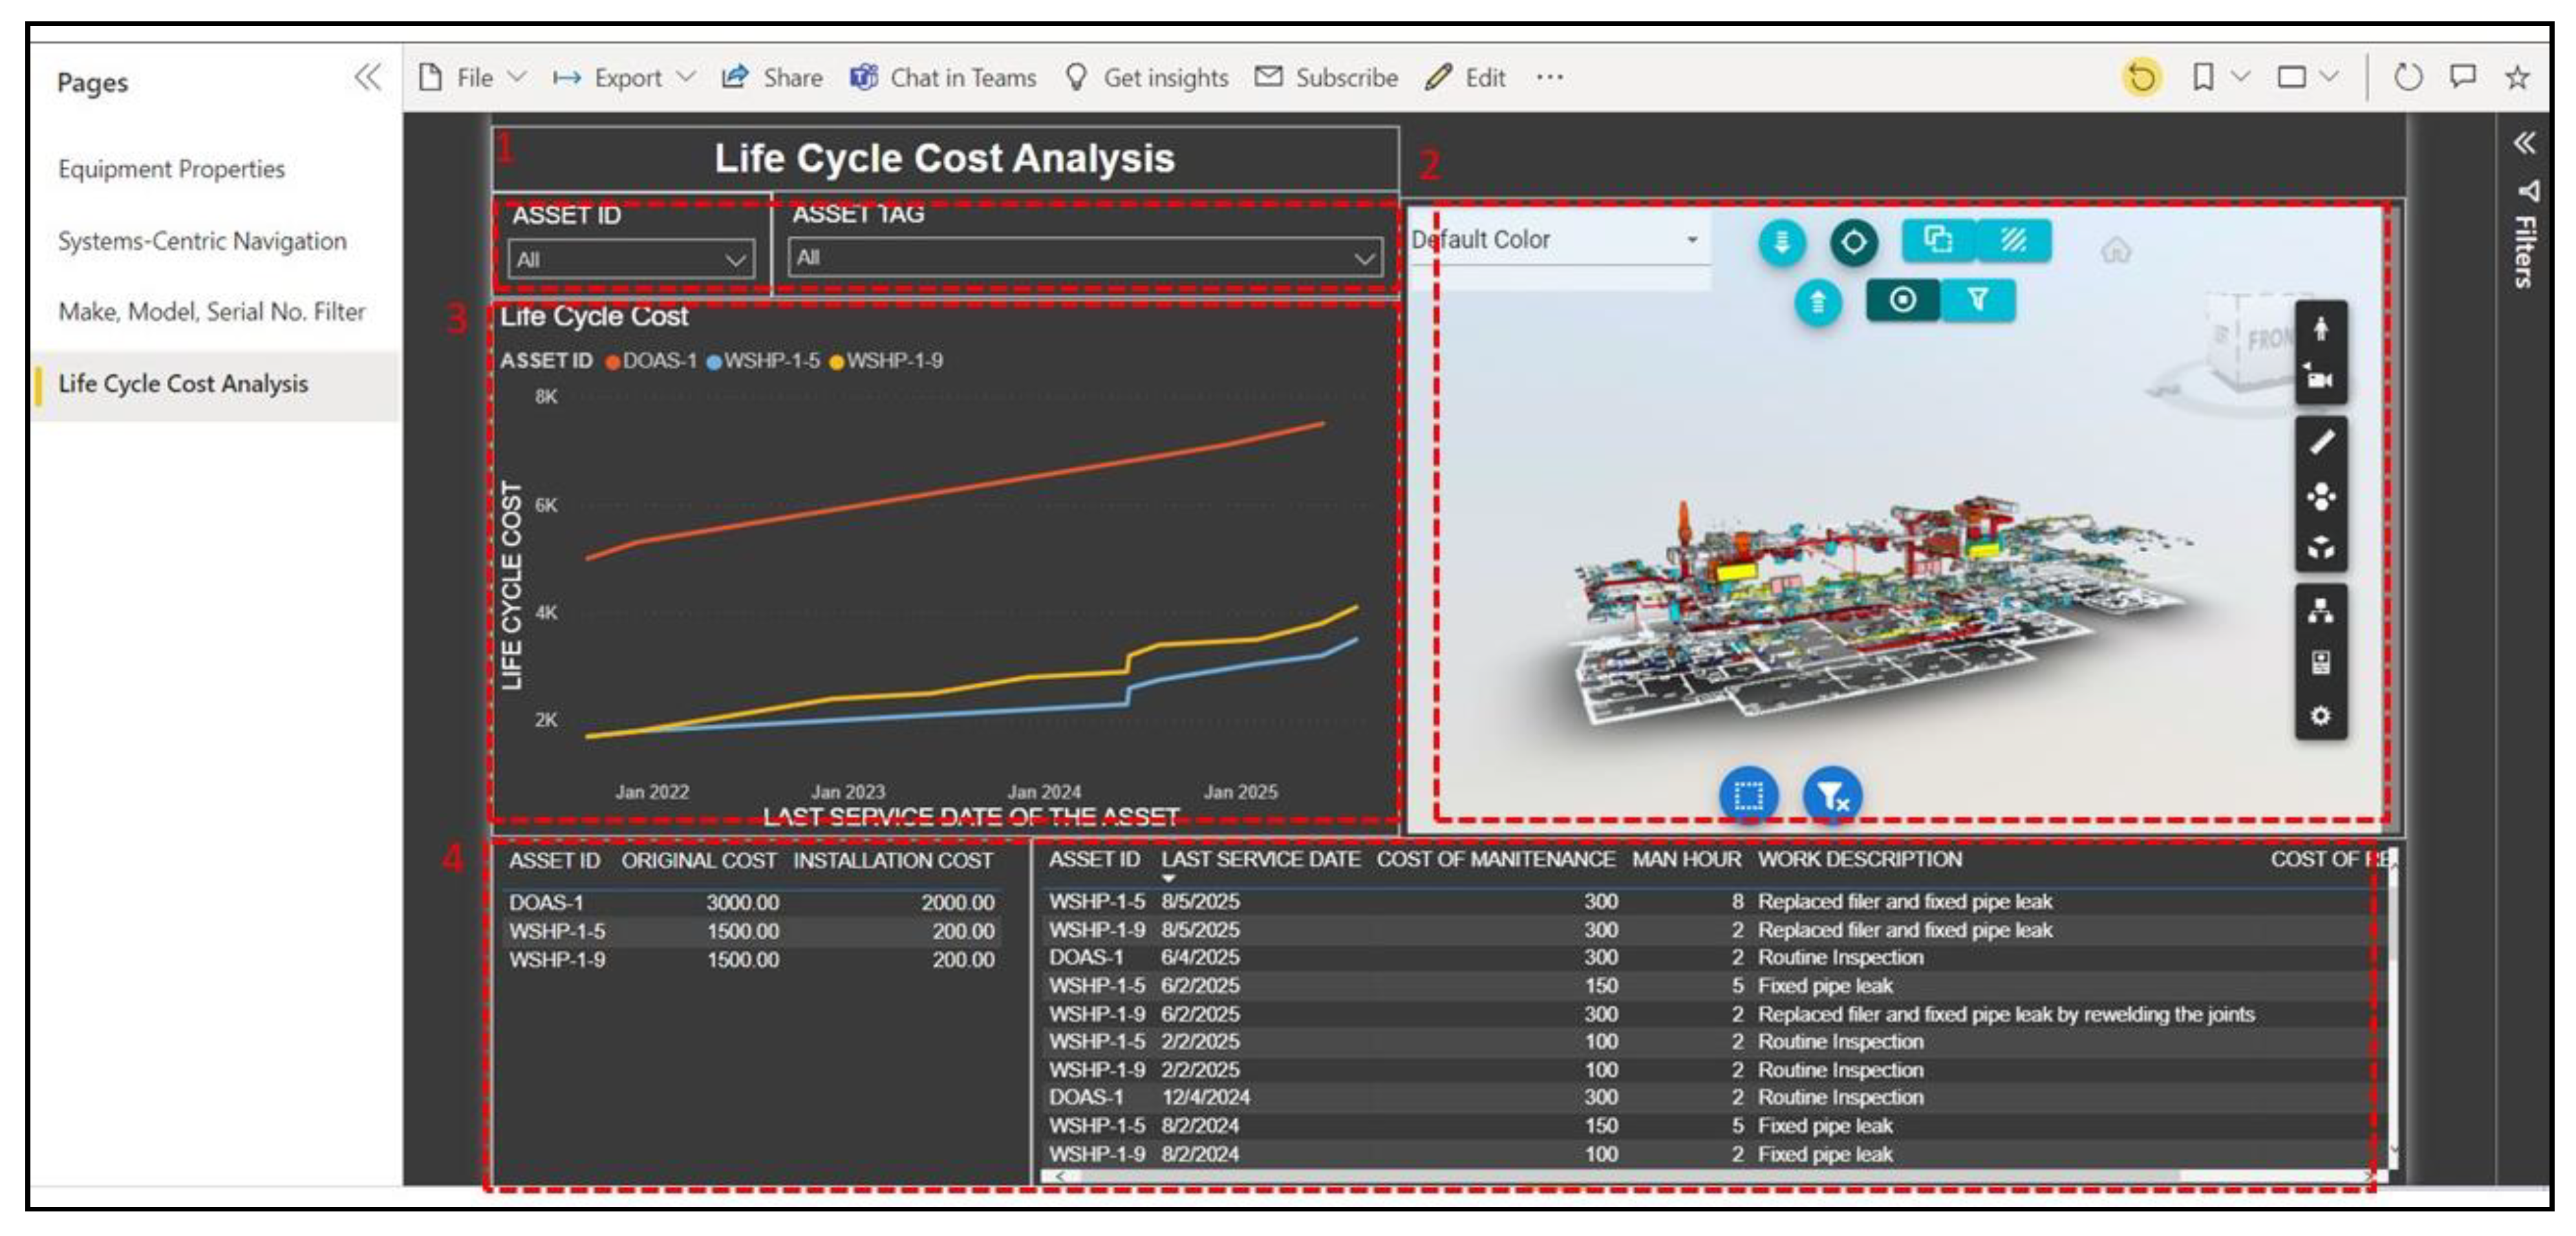
Dashboard 4 is designed to provide facility staff with the ability to track asset costs and perform lifecycle cost analysis. The dashboard can also be updated frequently to reflect changes in the source database, providing access to the most recent information.
Figure 12 details the layout of Dashboard 4 used to display Asset Maintenance Properties for DOAS-1, WSHP-1-5, and WSHP-1-9. Area 1 of
Figure 12 provides dropdown filters to isolate information in the dashboard based on Asset ID or Asset Tag. Area 2 displays the BIM. Area 3 houses the graph tracking the life-cycle cost of the asset based on original cost, installation cost, maintenance cost, and cost of the replacement part. Area 4 displays tables containing Asset Maintenance properties for the assets.
4. Accessing Power BI through HoloLens
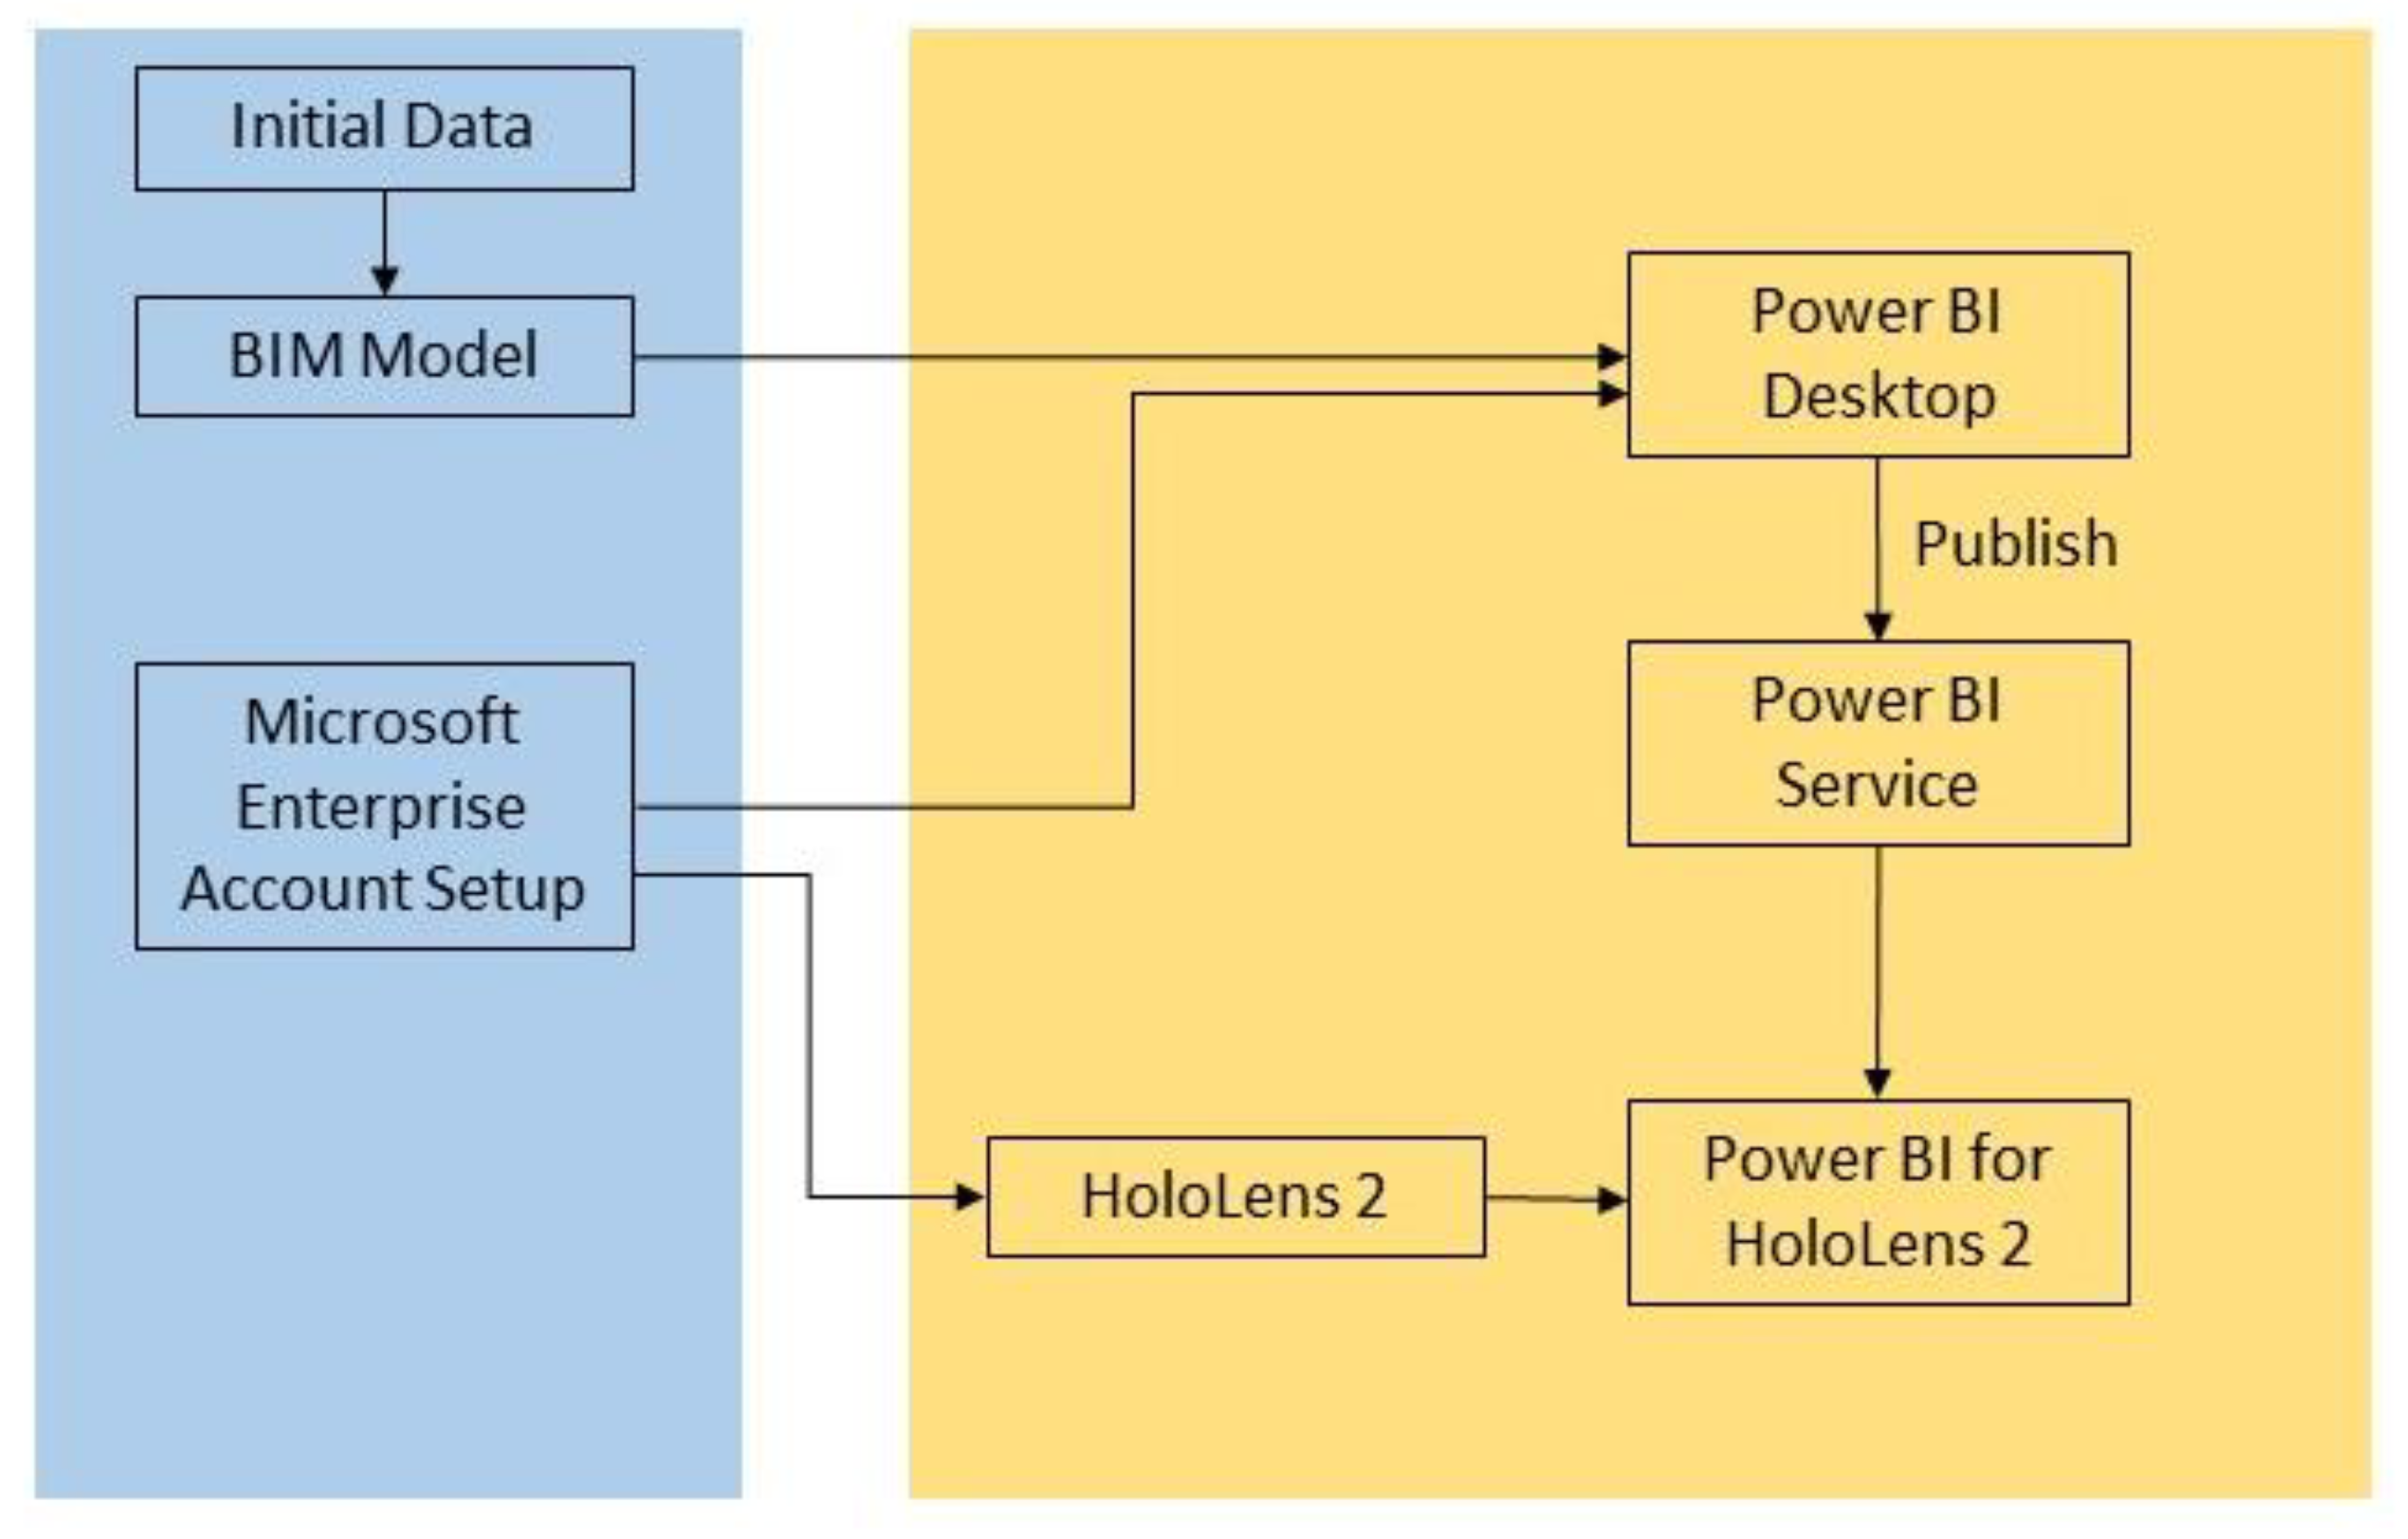
A Power BI App is available for use with the MS HoloLens 2. The Power BI app for HoloLens can only access dashboards present in the cloud version, also known as the Power BI Service. Publishing dashboards from the Power BI desktop to the Power BI service version allows viewing the dashboards on HoloLens 2.
Figure 13 presents the workflow for setting up Power BI for the HoloLens 2.
Access to Power BI (Desktop and Service) is restricted to Microsoft organizational accounts and users cannot use their personal Microsoft accounts to access Power BI (Desktop and Service). On the other hand, the Power BI App on the HoloLens automatically logs into the same account that the HoloLens is set up with. Therefore, the HoloLens needs to be set up using the same Microsoft organizational account used for Power BI Service.
The authors completed preliminary testing to integrate the MS HoloLens 2 glasses with Power BI Service to establish a real-time connection delivering lifecycle data to field staff to support the operation and maintenance of the facilities (
Figure 14).
Initial testing shows that viewing Power BI dashboards on HoloLens 2 provides several advantages, including timely access to accurate and relevant facility data in the field. Dashboards are also updated automatically while the user is using the app. If the data changes in Power BI, the changes will be reflected on the HoloLens 2, allowing access to real-time information. Additionally, viewing the data through the HoloLens 2 provides hands-free access to information while performing maintenance and repair tasks. Additional testing and validation are necessary to confirm the initial findings realized.
5. Results
The usability and effectiveness of the four dashboards developed are validated using a focus group approach. The focus group comprised six facility experts from the healthcare and academic sectors. Details of each participant’s background are provided in
Appendix C.
During the focus group discussions, participants were given a detailed introduction of the research goals/focus and were provided a demo of the dashboards. The demo included details on the potential use cases of each of the dashboards, the functionality of visualization tools present, and a discussion on the five property categories embedded in the BIM. The participants were then given the opportunity to interact with the dashboards themselves. They were asked to comment on the usability and benefits of the dashboards to support facility maintenance and operations based on their experiences.
During the interaction with the dashboards, the participants were able to isolate model elements and related information based on building systems, gain insights into the information on the life-cycle cost of the asset, and identify components that are related to a maintenance request. The statements made by the participants regarding the dashboards were coded and categorized based on usability and effectiveness.
Table 2 provides a summary of the statements made by the participants, their respective codes, and the author’s interpretation of the statements.
In addition to input captured during each interview, the participants are provided with a Post Study System Usability Questionnaire [
36]. The questionnaire includes six statements focused on the effectiveness of the developed dashboards and eight statements focused on the usability of the developed dashboards (
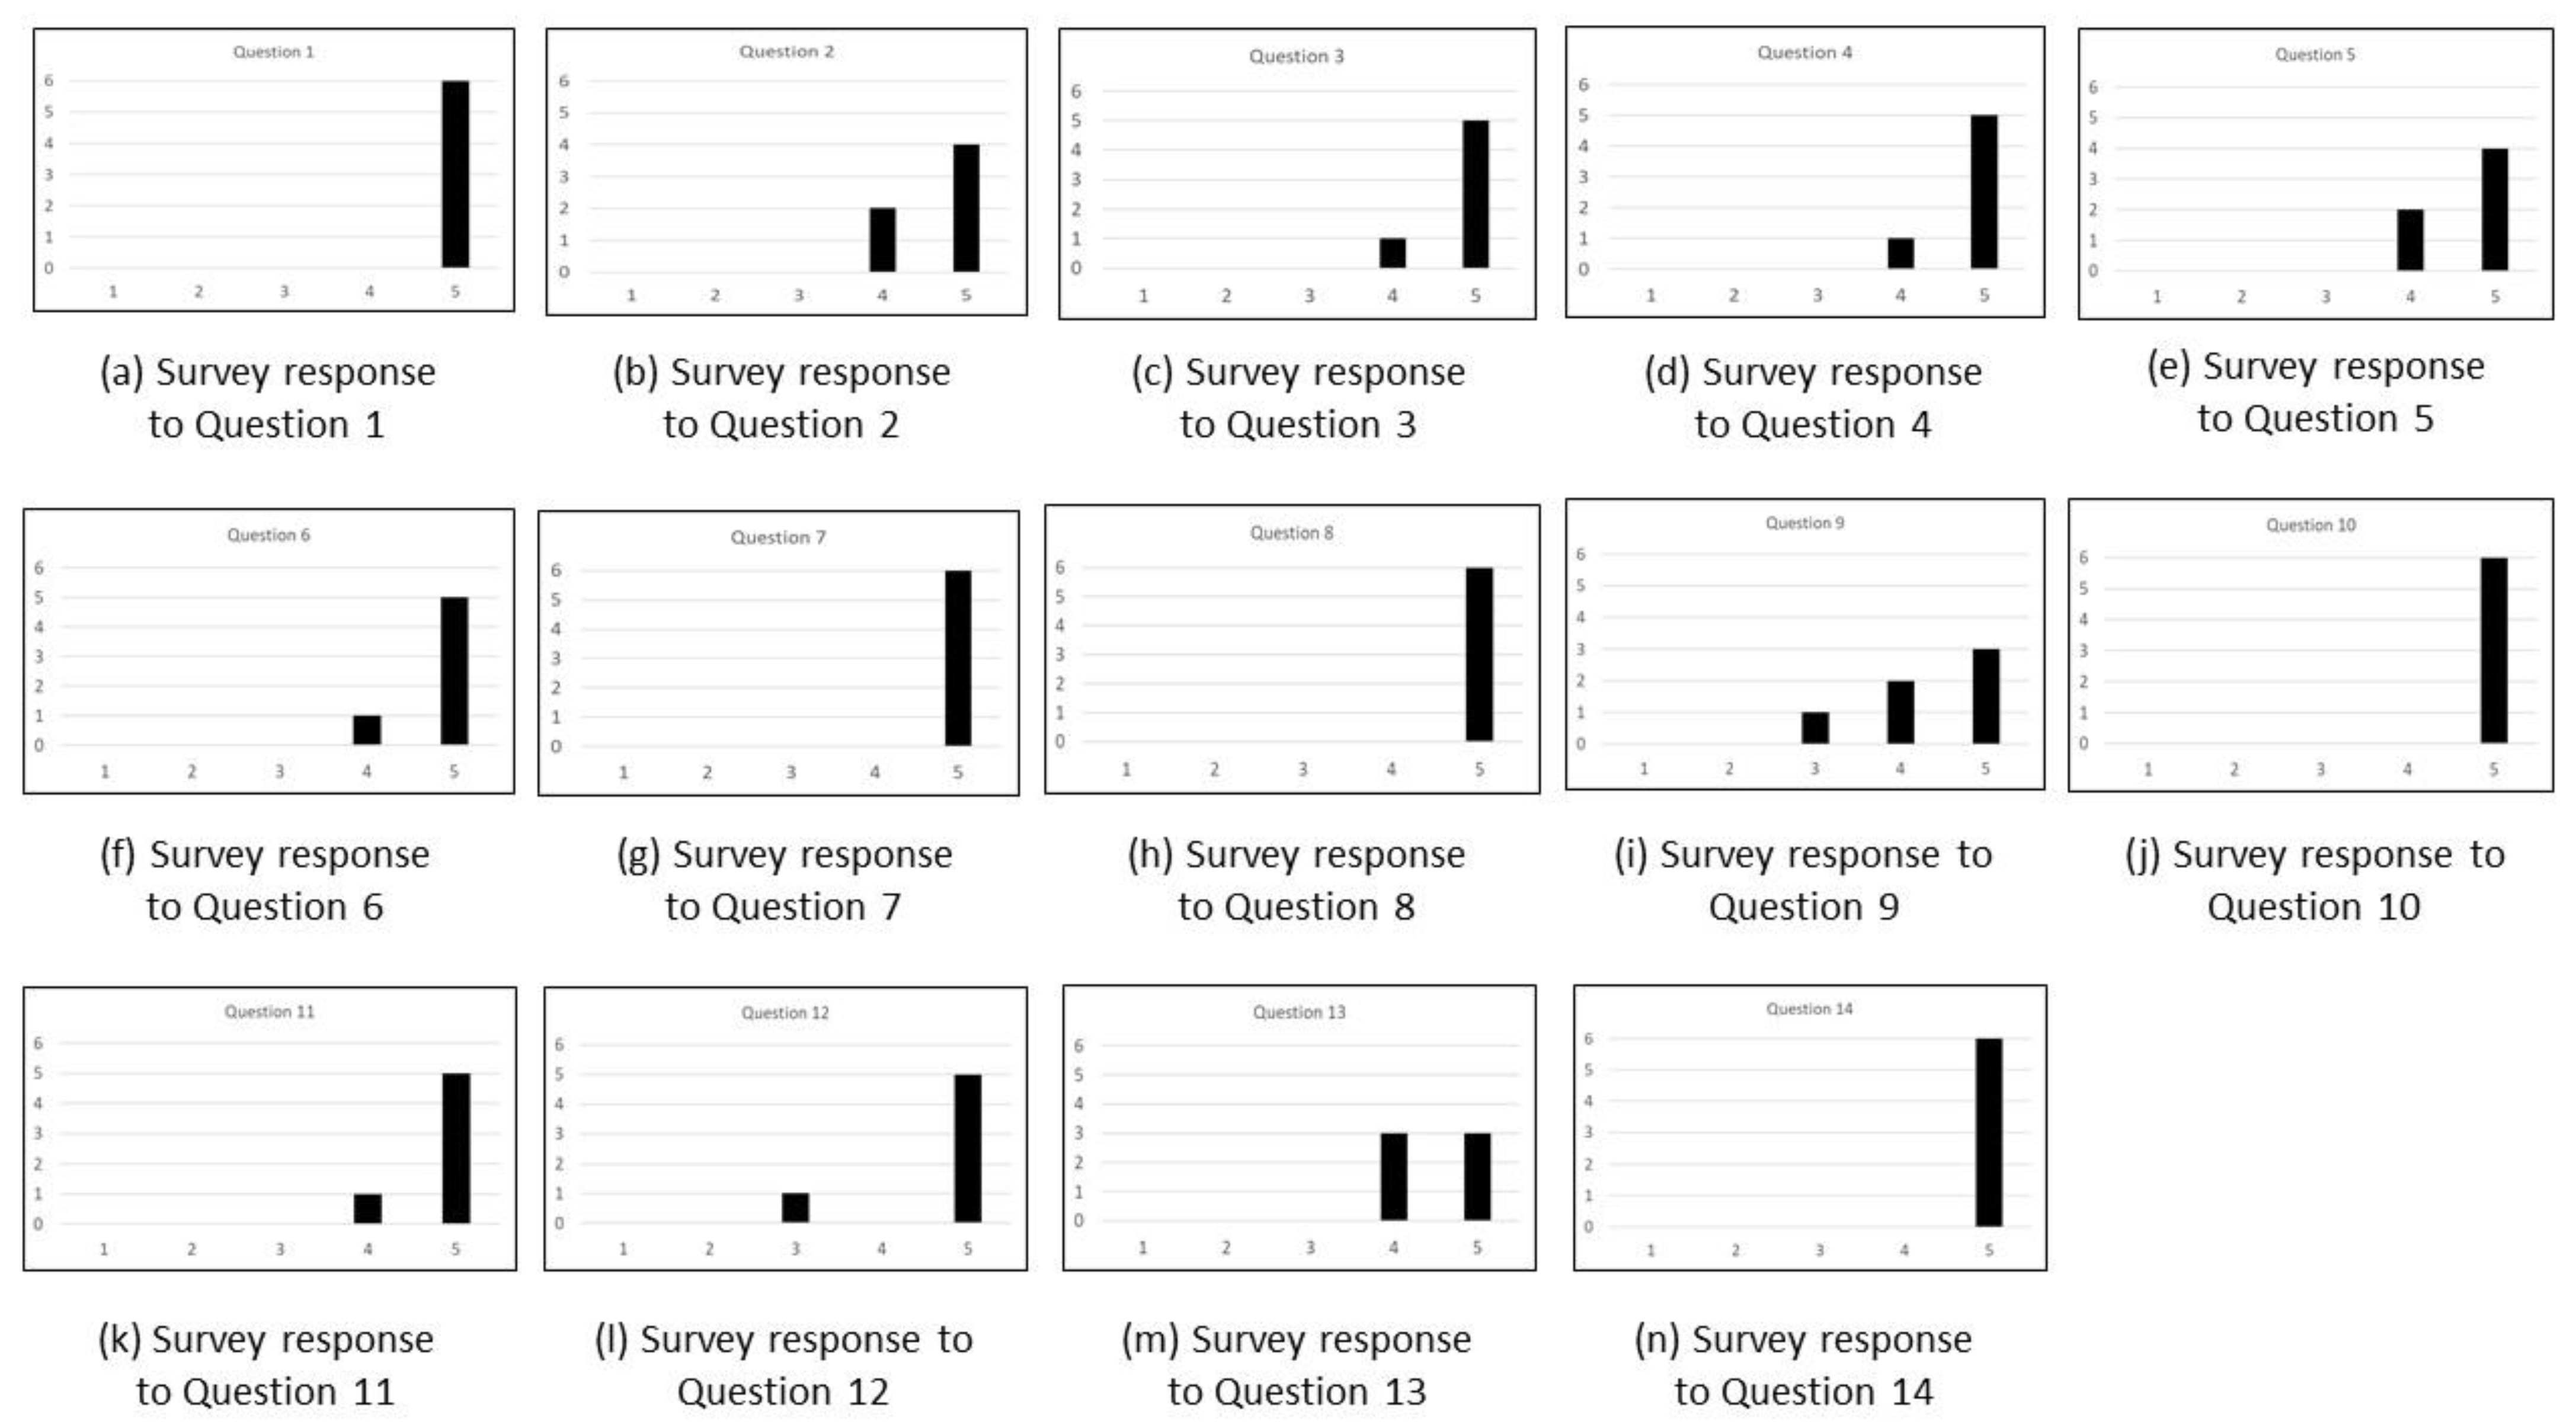
Appendix B). The participants are asked to respond with the level of agreement to each statement on a five-point Likert scale, with 1 being “strongly disagree” and 5 being “strongly agree”.
Figure 15 shows the distribution of responses for each question of the survey. Feedback from the focus groups received during discussions and testing of the dashboards showed a positive support by industry experts for the use of Power BI for facility operations and management. Additionally, results from the PSSUQ indicated a high score for all reviewers overall. The majority of reviewers (five out of six) gave a score of four or five to all questions. One reviewer gave a score of three to questions nine and twelve. The authors plan to continue to improve on the design and content of the dashboards to ensure any unresolved issues or concerns from any respondent are addressed in future implementations.
6. Discussion
The main objective of the paper was to explore and integrate new technologies and tools that would allow facility managers to view, navigate, and query the FM BIM, providing them with intuitive and immediate access to the graphical and life-cycle information necessary and critical for performing maintenance tasks or responding to emergencies.
While this paper has focused mainly on the aspect of the implementation of the prototype, several research areas were explored and investigated. This included:
Defining a parameter classification system organized into five categories. The classification was designed to organize asset properties and attributes into a logical hierarchy. The classification also established a set of systems-centric parameters (e.g., LOCATION_CODE, LOCATION_SERVED, EUIPMENT_SERVED, etc.) necessary to filter and isolate model components by system or subsystem and view the model from a systems-centric perspective. This is how owners/operators want to view the model when dealing with maintenance tasks or responding to emergencies.
Several tools were researched to ensure proper integration, allowing interoperable and seamless flow of data exchange from one tool to the other, resulting in customized dashboards and providing users immediate access to required information to make timely critical decisions.
Visual representation of data and selection of visuals in Power BI was based on lengthy meetings and discussions with several facility managers/operators accompanied by demonstrations of various versions of the prototype. This ensured that visuals presented data in a way that provided context and insights.
A Post Study System Usability Questionnaire was implemented using a focus group of well-experienced facility practitioners to assess the usability and effectiveness of the developed prototype. Feedback received from the experts during meetings organized to demonstrate the prototype, as well as results from questionnaires received following these meetings, were analyzed to establish future steps.
This paper set out to answer six research questions related to the development of FM-Capable BIM, visualization and analysis of critical facility data using Power BI, and access to facility data in an AR environment.
Our first research question was “What property should be specified to identify and visualize building data, elements, and systems components?” The paper discussed the development of five categories of model parameters that are currently needed to achieve a BIM-for-FM at handover. These categories and parameters are based on the authors’ experiences, literature review, prior research by the authors, and various discussions with several facility industry professionals. The objective of these parameters is to allow for a clear understanding of individual building components and assemblies, their interaction with each other, and the facilitation of asset management and maintenance. Each of the five categories defined in this paper include multiple properties that serve a unique purpose. The Asset Identification Properties were selected to facilitate navigation through building models to identify each asset based on a unique identification value. The Systems-Centric Properties helped define the relationships between assets based on the specific system or subsystem the assets belong to, the location of the asset, and the space or room that the asset serves. The Asset Attributes included properties that define the design characteristics of each asset group present in the building model. Asset Management Properties included properties to support efficient operation and maintenance of assets. Lastly, Asset Maintenance Properties facilitated the tracking of asset life cycle costs while supporting the scheduling of preventive maintenance.
The next three questions were “Can Power BI dashboards provide advantages for viewing critical facility data in a centralized setting?”, “Can facility data dashboards provide benefits to facility managers and field staff for dealing with preventive maintenance or when responding to an emergency?” and “How can the effectiveness and usefulness of Power BI dashboards to visualize life-cycle data and BIM geometry be validated and assessed?”. Power BI dashboards were designed to illustrate the usability of the different parameter groups embedded in the model. The effectiveness and usability of the dashboards were discussed with a focus group comprised of several facility industry experts from the academic and healthcare facility sectors. Overall feedback indicated that the dashboards could assist in the identification of critical elements during emergency maintenance. These dashboards can also assist in the quick notification of responsible personnel occupying the areas that may be affected during maintenance. Additionally, these dashboards can also be used for space management and life cycle cost analysis. By connecting Power BI to data sources that include data on space, occupancy analysis can be performed to identify the best available space to schedule classes in an academic building or identify available empty treatment rooms in a healthcare facility. Similarly, connecting Power BI to maintenance data such as original cost, cost of installation, cost of maintenance, and cost of part replacement would allow the user to perform a life cycle cost analysis for a given asset. This analysis can then be presented to upper management to make a case for the replacement of an asset. The participants during the focus group discussed the future potential of the developed dashboards in terms of displaying live sensor data to analyze building systems operations, assist in tracking work order history and life expectancy of the assets as compared to the industry average, and assist in tracking building energy utilization.
Each Power BI file generated through VCAD is capable of utilizing all available Power BI functions and data analytics and visualization tools, providing users with complete flexibility to design dashboards that best suit their needs. Users can represent data such as maintenance costs in a graph format to visualize the life cycle cost of the asset or can use data filters to isolate model elements and filter information on the dashboard related to a particular system, zone, room, or asset. In addition to providing users with multiple data visualization and analysis tools, Power BI also has the capability of connecting to a large number of external database sources, hence, providing users with a central platform to combine and analyze all their facility data. Data imported into Power BI from multiple sources can be linked together using a common column heading. The only shortcoming identified by the authors is that data export from Power BI is currently limited to an Excel file.
The paper has discussed how Power BI dashboards can be viewed using the mixed reality HoloLens 2 in response to the questions “Can Power BI dashboard design be implemented in an AR environment?” and “Can current capabilities of AR add any additional value to the end-user?”. While testing an example dashboard using the HoloLens 2, the authors realized that this feature is still in its infancy and is very limited. The HoloLens 2 only shows the dashboard and its information as a static screenshot. Although the information is updated automatically when data is updated in Power BI Desktop, the screenshots are non-interactive with no data manipulation or navigation capabilities.
The VCAD application was used to generate a Power BI file from the Navisworks model file. During the time of this research, VCAD was new to the market and the generated Power BI file had limited functionality. Since its release, VCAD has expanded its functionality to work as a plug-in for BIM 360 to convert any model uploaded to BIM 360 into a Power BI file. VCAD has also capitalized on the development of Autodesk Forge in the field of Internet of Things (IoT) and now provides its generated Power BI files with the capability of visualizing IoT data within the model as heat maps or sensor model elements.
While this research has used VCAD to generate a Power BI file, additional software applications are available in the market that can be utilized for this purpose. iConstruct, through their Genus platform, allows users to bring models uploaded to Genus into Power BI. Similarly, Pro-Revit Tools is a plug-in for Revit and can convert Revit models to a Power BI template file.
It is important to point out that the implementation of dashboards developed in this paper represents a beginner’s level digital twin for the case study science building. The dashboard accurately represents the properties and relationships among the assets present in the physical twin. By utilizing the ability of Power BI to connect with multiple data sources, additional data can be linked from live sensors attached to the physical twin to visualize the real-time operational data of the assets. This can enhance and elevate the level of the digital twin by incorporating performance sensory data captured from sensors, edge devices, and IoT. Additional implementation using artificial intelligence and machine learning to analyze the data and provide feedback to the physical twin can prove a higher level of sophistication for the digital twin.
7. Conclusions
The research completed and reported in this paper has defined and formalized a set of life-cycle data parameters required for an FM-capable BIM that would provide total value to facility owners. Five main asset property categories were defined in this paper: Asset Identification, Systems-Centric, Asset Management, Asset Attributes, and Asset Maintenance. Specifically, the proposed new systems-centric parameters allow for filtering of model elements and components, including equipment, ducts, and pipes, allow facility managers to have a clear understanding of how building systems interact with each other, and provide a systems-driven or system-oriented viewpoint of the facility aligned with how owners/operators view and visualize models. These asset properties when embedded in the BIM as part of project handover can lead to the creation of an Asset Twin. It is important to note that the proposed parameters are not inclusive. Additional parameters can be added based on owner/operator needs and the configuration of the project under consideration.
The paper also explored the use of MS Power BI, a business intelligence platform, to monitor and analyze FM-capable BIMs for facility maintenance and management. Power BI can provide facility managers with data visualization and analysis tools that can be customized based on their needs. Power BI dashboards provide facility managers with a common platform to integrate facility data from different sources using a central platform. During discussions with several industry experts, they stressed the benefits of using centralized dashboards for data visualization for more efficient preventive maintenance operations or when they need to respond to an emergency situation. The authors are currently conducting more research into the use and design of analytical dashboards and meeting with industry experts to solicit best practices. This will allow the enhancement of the design of future dashboards to better support the operation and maintenance of facilities.
Validation of the use of the HoloLens 2 with the Power BI dashboards using external users was not conducted under this research and will be considered in future work. The authors are also working on integrating performance data captured by sensors and edge devices into the Asset Twin to develop a higher-level Performance Twin with real-time operational data from a Building Automation System (BAS). Various options to deliver data to the Performance Twin are considered including using the MS Azure SQL database and the Neo4j graph databases. Performance data, such as pump speed or hot water supply temperature, will constitute new data categories that will expand the new parameter category hierarchy introduced in this research. When embedded and visualized through these higher-level Digital Twins, data will be collectively analyzed to improve various aspects of a facility including fault detection and diagnostics, support decisions for energy efficiency, and respond to current and new energy requirements defined by state and federal mandates.
Author Contributions
Conceptualization, A.H., M.E. and W.T.; methodology, A.H. and M.E.; software, A.H. and M.E.; validation, W.T.; formal analysis, A.H. and M.E.; investigation, A.H. and M.E.; resources, W.T.; data curation, M.E. and A.H; writing—original draft preparation, A.H. and M.E.; writing—review and editing, W.T.; visualization, A.H.; supervision, W.T.; project administration, W.T. All authors have read and agreed to the published version of the manuscript.
Funding
This research received no external funding.
Institutional Review Board Statement
The study was conducted in accordance with the Declaration of Helsinki, and approved by the Institutional Review Board (or Ethics Committee) of Virginia Tech (protocol code IRB 21-731 and 2 September 2021).
Informed Consent Statement
Informed consent was obtained from all subjects involved in the study.
Data Availability Statement
The data presented in this study are available on request from the corresponding author. The data are not publicly available as they are confidential.
Acknowledgments
The authors would like to sincerely thank the following individuals for their support and for providing an academic license of their software that help make this research possible: Jari Heinäjärvi, Codemill Oy (Navistools), Francesco Necciari, BLogic (VCAD) and Robert Gadbaw, iConstruct (iConstruct). The views and findings expressed in this paper are those of the authors and do not reflect those of Codemill, BLogic, or iConstruct.
Conflicts of Interest
The authors declare no conflict of interest.
Appendix A
Table A1.
Asset Identification Properties.
Table A1.
Asset Identification Properties.
| | Asset Identification Properties | Description | Examples |
|---|
| 1 | ASSET_ID | A second unique identifier for the asset based on its identification code provided in the 2D plans. Only used for equipment. | DOAS-1 |
| 2 | ASSET_TAG | A unique identifier for the asset based on a author-defined naming convention that includes: building abbreviation, asset group, asset type (for selected assets), floor number, and asset ID (next parameter). Only used for equipment | GR-AHU-RT-Roof-DOAS-1 |
| 3 | ASSET_DESCRIPTION | A short description of the asset. Only used for equipment. | Dedicated Outside Air System (DOAS) |
Table A2.
Systems Centric Properties [
27] (p. 5).
Table A2.
Systems Centric Properties [
27] (p. 5).
| | Systems-Centric Properties | Description | Examples |
|---|
| 1 | SYSTEM | Identifies the main system (Level-1) that the asset belongs to. | Mechanical System |
| 2 | SYSTEM_TYPE | Defines various categories based on major functions (Level-2). The mechanical system is divided into four system types while the plumbing system is divided into three. | Cooling System, Heating System, Air System, and Energy Recovery System |
| 3 | SYSTEM_CLASSIFICATION | Defines various categories based on the sub-system used that supports the system type (Level-3). | Hydronic Return, Hydronic Supply, Supply Air, Return Air, Exhaust Air, Outside Air, Enthalpy Wheel, Sensible Wheel, Direct Expansion Supply, Direct Expansion Return. |
| 4 | SYSTEM_NAME | Provides a fourth level of detail (Level 4) and defines different types of equipment using a specific approach or process and contributing to the major function of the system type (level 2) category it is classified under | Geothermal Well Supply System, Geothermal Well Return System, Direct Expansion Heat Pump System, Building Supply Air System, Building Return Air System, General Exhaust Air System, Outside Air General, Heat Recovery Supply System, Enthalpy Wheel System |
| 5 | CATEGORY | Specifies the standard Revit category that the asset belongs to. | Mechanical Equipment |
| 6 | ASSET_GROUP | Defines the asset group of the asset. Asset group abbreviations are based on the US CAD Standard. If no abbreviation is provided by the standard, an author-defined abbreviation is provided. Only used for equipment. | AHU |
| 7 | FLOOR | Specifies the floor number First, Second or Roof) on which the asset is located. | Roof |
| 8 | ZONE | Specifies the mechanical system zone number (1 through 5) to which the asset belongs to. | Zone-2, Zone-5 |
| 9 | LOCATION_CODE | Specifies the room number in which the asset is located based on the 2D plans. Only used for equipment and doesn’t apply to ducts or pipes (span multiple rooms). | R-310 |
| 10 | LOCATION_SERVED | Specifies the room number served by (or supported by) an asset. | R-116, R-118, R-120, R-122, R-124, R-126, R-140, R-107, R-109, R-115, R-113, R-111, R-105, R-130, R-131, R-141, R-142, R-143, R-145, R-160, R-155, R-212, R-214, R-215, R-218, R-219, R-211, R-209, R-207, R-220, R-221, R-222, R-223, R-224, R-225, R-226, R-227, R-228, R-231, R-230, R-205, R-240, R-242, R-260, R-255, R-253, R-254 |
| 11 | EQUIPMENT_SERVED | Specifies the ID number (ASSET_ID) for the equipment that is being served or supported by the asset. | N/A |
| 12 | PARENT_ASSET_TAG | Specifies the parent asset tag for the asset (e.g., an AHU could be the parent asset for a fan located inside the AHU). | N/A |
| 13 | PANEL_NUMBER | Specifies the electrical panel ID that powers the asset (as defined by the 2D design plans). | SWBD |
| 14 | CIRCUIT_NUMBER | Specifies the breaker number that is designated to the asset (as defined by the 2D design plans). | CKT 9 |
| 15 | PANEL_LOCATION | Specifies the location of the electrical panel that powers the asset (as defined by the 2D design plans). | R-114 |
Table A3.
Asset Management Properties.
Table A3.
Asset Management Properties.
| | Asset Management Properties | Description | Examples |
|---|
| 1 | CRITICALITY | Relative importance of an asset based on the number of spaces/rooms impacted by the functioning of the asset. The relative importance is measure on a 1–5 scale. | 3 |
| 2 | MODEL_NUMBER | Manufacturer model number of asset | GEVE1804 |
| 3 | SERIAL_NUMBER | Manufacturer serial number of asset | 208-262-002 |
| 4 | MANUFACTURER | Manufacturer’s name | Trane |
| 5 | SPARE_PARTS_MODEL_NAME | Specifies the model number for spare parts for an asset (may be limited to specific assets with spare parts being tracked). | AAF PerfectPleat M8 2″ Filter (MERV8) |
| 6 | SPARE_PARTS_QUANTITY | The total quantity of spare parts for the asset | 1 |
| 7 | WARRANTY_START | The start date of an asset warranty. | 6 January 2021 |
| 8 | WARRANTY_END | The end date of an asset warranty. | 6 January 2023 |
| 9 | INSTALLATION_DATE | The installation date of an asset. | 6 January 2021 |
| 10 | EMERGENCY_POWER | Specifies a “Yes” or “No” value depending on whether an asset is connected to emergency power or not. | NO |
| 11 | OMNICLASS_NUMBER | Reference number in Omniclass Table 23 based on asset classification. | 23–33 25 11 11 |
Table A4.
Asset Attributes for Asset Group AHU.
Table A4.
Asset Attributes for Asset Group AHU.
| | Asset Attributes | Description | Examples |
|---|
| 1 | BAS_POINT_ADDRESS | A unique automation point address number to service or diagnose the equipment. | BIA01 |
| 2 | HEATING_SOURCE | The source of heating for the asset. | STEAM |
| 3 | HEATING_CAPACITY | The heating capacity of the asset. | 1155 MBH |
| 4 | TOTAL_AIR_FLOW | The amount of air flow generated by the asset. | 19250 CFM |
| 5 | EXTERNAL_STATIC_PRESSURE(ESP) | The external static pressure of the asset. | 2.5 IN.H2O |
| 6 | MIN_OUTSIDE_AIR | The minimum outside air volume (CFM) | 19250 CFM |
| 7 | MAX_OUTSIDE_AIR | The maximum outside air volume (CFM) | 27000 CFM |
| 8 | COOLING_SOURCE | The source of cooling for the asset. | CHILLER |
| 9 | TOTAL_COOLING_CAPACITY | The total cooling capacity of the asset. | 1327 MBH |
| 10 | SENSIBLE_COOLING_CAPACITY | The sensible cooling capacity of the asset. | 1327 MBH |
| 11 | ECONOMIZER | Provides a Yes or No answer depending on whether the asset has an economizer or not. | YES |
| 12 | ECONOMIZER TYPE | The type of economizer used by the asset. | DRY BULB |
| 13 | TOTAL_STATIC_PRESSURE | The total static pressure of the asset. | 4.0 IN.H2O |
| 14 | AHU_TYPE | Defines a sub-category of the asset group. (e.g., Roof Top). | RT |
Table A5.
Asset Maintenance Properties.
Table A5.
Asset Maintenance Properties.
| | Asset Maintenance Properties | Description | Examples |
|---|
| 1 | INSTALLATION_COST | Total labor cost of installing the asset | $2000 |
| 2 | ORIGINAL_COST | Market cost of the asset | $3000 |
| 3 | ATTIC_STOCK | Specifies the number of spare parts currently available for an asset in the inventory. | 2 |
| 4 | LAST_SERVICE_DATE | Specifies the latest service date of an asset. | 12 April 2021 |
| 5 | SCHEDULED_SERVICE_DATE | Specifies the date for the next scheduled service of an asset. | 6 April 2022 |
| 6 | COST_OF_MAINTENANCE | Total labor cost of repairing the asset following the maintenance request | $300 |
| 7 | MAN_HOUR | Total man hour of work required to repair the asset | 2 |
| 8 | WORK_DESCRIPTION | Detailed description of work performed on the asset following a maintenance request | Scheduled Maintenance |
| 9 | COST_OF_REPLACEMENT_PARTS | Cost of spare parts required to perform maintenance on an asset or cost of replacing a spare part in the attic stock | $0.00 |
Appendix B
Appendix B.1. Useability
- Question 1.
It was simple to use this system.
- Question 2.
I felt comfortable using this system.
- Question 3.
It was easy to learn to use this system.
- Question 4.
Whenever I made a mistake using the system, I could recover easily and quickly. (Clarification: The system provided an easy way to reset the filters in case of incorrect filter selection).
- Question 5.
The organization of information on the system screen was clear.
- Question 6.
The interface of this system was pleasant.
- Question 7.
I liked using the interface of this system.
- Question 8.
Overall, I am satisfied with how easy it is to use this system.
Appendix B.2. Effectiveness
- Question 9.
I was able to complete the tasks and scenarios quickly using this system.
- Question 10.
I believe I could become productive quickly using this system.
- Question 11.
It was easy to find the information I needed.
- Question 12.
The information was effective in helping me complete the tasks and scenarios.
- Question 13.
This system has all the functions and capabilities I expect it to have.
- Question 14.
Overall, I am satisfied with this system.
Appendix C
Table A6.
Summary of the background of Interviewees.
Table A6.
Summary of the background of Interviewees.
| Interviewee No. | Current Position | Work Experience | Sector |
|---|
| 1. | BIM Manager | 37 Years | Health Care |
| 2. | Facilities Manager | 22 Years | Health Care |
| 3. | Supervisor Facilities Management | 13 Years | Health Care |
| 4. | Technical Lead | 11 Years | Academic |
| 5. | Associate Director of Facilities Finance | 38 Years | Academic |
| 6. | ICM Manager | 23 Years | Academic |
References
- Poirier, E.A.; Staub-French, S.; Forgues, D. Measuring the impact of BIM on labor productivity in a small specialty contracting enterprise through action-research. Autom. Constr. 2015, 58, 74–84. [Google Scholar] [CrossRef]
- Farghaly, K.; Abanda, F.H.; Vidalakis, C.; Wood, G. Taxonomy for BIM and Asset Management Semantic Interoperability. J. Manag. Eng. 2018, 34, 04018012. [Google Scholar] [CrossRef] [Green Version]
- Chen, W.; Chen, K.; Cheng, J.C.; Wang, Q.; Gan, V.J. BIM-based framework for automatic scheduling of facility maintenance work orders. Autom. Constr. 2018, 91, 15–30. [Google Scholar] [CrossRef]
- Sadeghi, M.; Mehany, M.; Strong, K. Integrating building information models and building operation information exchange systems in a decision support framework for facilities management. In Proceedings of the Construction Research Congress, New Orleans, LA, USA, 2–4 April 2018; pp. 770–779. [Google Scholar] [CrossRef]
- Carvalho, J.P.; Almeida, M.; Bragança, L.; Mateus, R. Bim-based energy analysis and sustainability assessment—Application to portuguese buildings. Buildings 2021, 11, 246. [Google Scholar] [CrossRef]
- Wetzel, E.M.; Thabet, W.Y. The use of a BIM-based framework to support safe facility management processes. Autom. Constr. 2015, 60, 12–24. [Google Scholar] [CrossRef] [Green Version]
- Gao, X.; Pishdad-Bozorgi, P. A framework of developing machine learning models for facility life-cycle cost analysis. Build. Res. Inf. 2020, 48, 501–525. [Google Scholar] [CrossRef]
- Yang, X.; Ergan, S. BIM for FM: Information requirements to support HVAC-related corrective maintenance. J. Archit. Eng. 2017, 23, 04017023. [Google Scholar] [CrossRef]
- Orr, K.; Shen, Z.; Juneja, P.K.; Snodgrass, N.; Kim, H. Intelligent facilities: Applicability and flexibility of open BIM standards for operations and maintenance. In Proceedings of the Construction Research Congress 2014: Construction in a Global Network, Atlanta, GA, USA, 19–21 May 2014; pp. 1951–1960. [Google Scholar] [CrossRef] [Green Version]
- Ashtab, M.; Farzad, M. Aligning Tender Cost Estimation Practices in Iran with BIM. Int. J. Eng. Technol. 2018, 10, 329–334. [Google Scholar] [CrossRef] [Green Version]
- Akanmu, A.A.; Olayiwola, J.; Olatunji, O.A. Automated checking of building component accessibility for maintenance. Autom. Constr. 2020, 114, 103196. [Google Scholar] [CrossRef]
- Malekpour Koupaei, D.; Cetin, K. Smart thermostats in rental housing units: Perspectives from landlords and tenants. J. Archit. Eng. 2021, 27, 04021042. [Google Scholar] [CrossRef]
- Danczyk, J.; Jacobs, P.; Montgomery, O.; Jenkins, M.; Farry, M. Testing the usability of a decision support system for increasing environmental awareness. In Proceedings of the 2017 IEEE Conference on cognitive and computational aspects of situation management (CogSIMA), Savannah, GA, USA, 27–31 March 2017; pp. 1–5. [Google Scholar] [CrossRef]
- Ensafi, M.; Thabet, W. Challenges and Gaps in Facility Maintenance Practices. EPiC Ser. Built Environ. 2021, 2, 237–245. [Google Scholar] [CrossRef]
- El Kaed, C.; Leida, B.; Gray, T. Building management insights driven by a multi-system semantic representation approach. In Proceedings of the 2016 IEEE 3rd World Forum on Internet of Things (WF-IoT), Reston, VA, USA, 12–14 December 2016; pp. 520–525. [Google Scholar] [CrossRef]
- Farhana Jamaludin, A.; Najib Razali, M.; Jalil, R.; Othman, H.; Adnan, Y. Identification of business intelligence in big data maintenance of government sector in Putrajaya. In Proceedings of the 2021 10th International Conference on Software and Computer Applications, Kuala Lumpur, Malaysia, 23–26 February 2021; pp. 201–207. [Google Scholar] [CrossRef]
- Ali, S.M.; Gupta, N.; Nayak, G.K.; Lenka, R.K. Big data visualization: Tools and challenges. In Proceedings of the 2016 2nd International Conference on Contemporary Computing and Informatics (IC3I), Greater Noida, India, 14–17 December 2016; pp. 656–660. [Google Scholar] [CrossRef]
- Octavia, T.; Halim, S.; Alianto, C. Designing Facility Layout Using Business Intelligence Approach: A Case Study in an Amusement Arcade. Procedia Comput. Sci. 2019, 161, 623–629. [Google Scholar] [CrossRef]
- Ogunseiju, O.R.; Olayiwola, J.; Akanmu, A.A.; Nnaji, C. Digital twin-driven framework for improving self-management of ergonomic risks. Smart Sustain. Built Environ. 2021, 403–419. [Google Scholar] [CrossRef]
- Gheisari, M.; Williams, G.; Walker, B.; Irizarry, J. Locating building components in a facility using augmented reality vs. paper-based methods: A user-centered experimental comparison. Comput. Civ. Build. Eng. 2014, 850–857. [Google Scholar] [CrossRef] [Green Version]
- Shaghaghian, Z.; Burte, H.; Song, D.; Yan, W. Learning Geometric Transformations for Parametric Design: An Augmented Reality (AR)-Powered Approach. arXiv 2021, arXiv:2109.10899. [Google Scholar] [CrossRef]
- Oke, A.E.; Arowoiya, V.A. An analysis of the application areas of augmented reality technology in the construction industry. Smart Sustain. Built Environ. 2021. [Google Scholar] [CrossRef]
- Chung, S.; Cho, C.-S.; Song, J.; Lee, K.; Lee, S.; Kwon, S. Smart Facility Management System Based on Open BIM and Augmented Reality Technology. Appl. Sci. 2021, 11, 10283. [Google Scholar] [CrossRef]
- Linares Garcia, D.A.; Dongre, P.; Roofigari-Esfahan, N.; Bowman, D.A. The mobile office: A mobile AR systems for productivity applications in industrial environments. In Proceedings of the International Conference on Human-Computer Interaction, Virtual Event, 24 July–29 July 2021; pp. 511–532. [Google Scholar] [CrossRef]
- Palmarini, R.; Erkoyuncu, J.A.; Roy, R.; Torabmostaedi, H. A systematic review of augmented reality applications in maintenance. Robot. Comput.-Integr. Manuf. 2018, 49, 215–228. [Google Scholar] [CrossRef] [Green Version]
- del Amo, I.F.; Erkoyuncu, J.A.; Roy, R.; Palmarini, R.; Onoufriou, D. A systematic review of Augmented Reality content-related techniques for knowledge transfer in maintenance applications. Comput. Ind. 2018, 103, 47–71. [Google Scholar] [CrossRef]
- Ensafi, M.; Harode, A.; Thabet, W. Developing systems-centric as-built BIMs to support facility emergency management: A case study approach. Autom. Constr. 2022, 133, 104003. [Google Scholar] [CrossRef]
- Ensafi, M.; Thabet, W.; Devito, S.; Lewis, A. Field Testing of Mixed Reality (MR) Technologies for Quality Control of As-Built Models at Project Handover: A Case Study. EPiC Ser. Built Environ. 2021, 2, 246–254. [Google Scholar] [CrossRef]
- Becerik-Gerber, B.; Jazizadeh, F.; Li, N.; Calis, G. Application areas and data requirements for BIM-enabled facilities management. J. Constr. Eng. Manag. 2012, 138, 431–442. [Google Scholar] [CrossRef]
- Thabet, W.; Lucas, J. Asset data handover for a large educational institution: Case-study approach. J. Constr. Eng. Manag. 2017, 143, 05017017. [Google Scholar] [CrossRef]
- How to Fix Your Maintenance Program. Available online: https://www.infor.com/en-gb/resources/how-to-fix-your-maintenance-programme (accessed on 27 January 2022).
- Navistools. Available online: https://www.codemill.fi/ (accessed on 6 February 2021).
- iConstruct. Available online: https://iconstruct.com/ (accessed on 14 March 2021).
- Blogic. Available online: https://www.bimservices.it/ (accessed on 14 March 2021).
- Theobald, O. Machine Learning for Absolute Beginners: A Plain English Introduction; Scatterplot Press: London, UK, 2017; ISBN 9781549617218. [Google Scholar]
- Lewis, J.R. Psychometric evaluation of the PSSUQ using data from five years of usability studies. Int. J. Hum.-Comput. Interact. 2002, 14, 463–488. [Google Scholar] [CrossRef]
| Publisher’s Note: MDPI stays neutral with regard to jurisdictional claims in published maps and institutional affiliations. |
© 2022 by the authors. Licensee MDPI, Basel, Switzerland. This article is an open access article distributed under the terms and conditions of the Creative Commons Attribution (CC BY) license (https://creativecommons.org/licenses/by/4.0/).


