Article

The Impact of Building Orientation and Window-to-Wall Ratio on the Performance of Electrochromic Glazing in Hot Arid Climates: A Parametric Assessment

by
Imene Lahmar
1,
Alessandro Cannavale
2,3,*,
Francesco Martellotta
2 and
Noureddine Zemmouri
1
1
Laboratoire LACOMOFA, University of Mohamed Khider, Biskra 07000, Algeria
2
DICAr—Politecnico di Bari, Via Orabona 4, 70125 Bari, Italy
3
National Research Council, Institute of Nanotechnology (CNR-NANOTEC), Via Monteroni, 73100 Lecce, Italy
*
Author to whom correspondence should be addressed.
Buildings 2022, 12(6), 724; https://doi.org/10.3390/buildings12060724
Submission received: 8 April 2022 / Revised: 17 May 2022 / Accepted: 20 May 2022 / Published: 26 May 2022
(This article belongs to the Special Issue Buildings: 10th Anniversary)

Abstract

:
The significant increase in construction industry demand with its negative effects on energy consumption is particularly evident in areas with severe climatic factors. Here, the designers aim at providing comfort with the least amount of energy, and consequently have resorted to using different software tools to choose the optimal solution in the early phase of design to avoid time and cost losses. The use of smart innovative technologies such as electrochromic (EC) glazing may provide an important contribution in reducing consumptions while providing good thermal and visual comfort conditions. Nonetheless, as shown in the literature, such glazing should be used and managed carefully to avoid any adverse effects or low performance. Thus, a parametric simulation was carried out using Rhinoceros and Grasshopper to assess the advantages in terms of energy use resulting from use of EC glazing in residential buildings as a function of façade orientation and window-to-wall ratio (WWR) with reference to the city of Biskra, located in the northeastern region of Algeria. Eight main orientations and ten WWR scenarios were investigated in order to evaluate the benefit of using this technology in the selected climatic region. The research results proved the benefit of using EC glazing in all orientations, with energy savings ranging from 35.88% in the northern façade to 60.47% in the southwestern façade.

1. Introduction

Two compelling challenges of current times are the timely fight against climate changes and fossil fuels dependency. Since the construction sector is responsible for 35% of worldwide CO2 emissions [1], and residential buildings in Algeria consume approximately 33.6% of total electricity demand [2], an adequate choice of building materials envelope can play a major role in minimizing the negative impacts of unsustainable energy resources on the environment. The largest effects in terms of reduction of energy consumption of buildings can be obtained by improving the weakest link in the building envelope: the windows. In hot climates, the window-to-wall ratio was determined to be the most important indicator of total load, particularly for cooling loads, whereas it was negligible for heating loads [3].
Among the diverse solutions that can be used to control window behavior, one of the most promising is represented by dynamic smart windows based on EC glazing (Figure 1). An EC glazing is a device resembling an electrical battery, generally including five superimposed layers, between two glass or plastic substrates, covered with transparent conductive oxides (e.g., indium tin oxide or fluorine-doped tin oxide): the middle layer is a transparent electrolyte (containing small cations, such as lithium or hydrogen ions). This layer is in direct contact with at least one EC material and an ion accumulation layer, or a further EC layer [4,5]. The most widely investigated EC materials are inorganic transition metal oxides, such as tungsten trioxide (WO3) or nickel oxide (NiO).
The former is a cathodic EC material, because it reversibly colors upon electron insertion and ion intercalation, by applying a small bias, in a redox reaction. Anodic EC materials, such as NiO, show a “complementary” behavior, because they color upon charge extraction and ion deintercalation. Moreover, they effectively work as ion storage layers when devices are bleached. Due to their behavior, upon ion intercalation/deintercalation, these two materials have been often used jointly to enhance visual contrast of EC devices [6,7].
Several organic EC materials are also reported in literature, such as polyaniline, viologens, poly (3, 4- ethylenedioxythiophene)-poly (styrenesulfonate) (PEDOT: PSS) [8].
Different manufacturing processes have been used in the fabrication of EC devices (Table 1), where the main aspects are the EC materials and the deposition of the ion accumulation material onto a transparent electrode. These depositions can be made either in liquid, vapor, or solid phase [9].
According to Jud Einstein et al., the sol–gel process was firstly used in the fabrication of EC devices in 1988. It is a chemical solution process that is one of the simplest techniques, compatible with spraying, spin-coating, and dip-coating deposition [10].
In comparison to sol–gel, other techniques that are widely used, but have more advantageous characteristics (Table 1), are the physical and chemical vapor depositions, that take place under vacuum conditions [11].
Physical vapor deposition is a vaporization coating method in which a solid material is heated to produce vapors that cover the surface of the substrate [12]. In chemical vapor deposition, the precursor heated is in gaseous form and reacts chemically [13].
Table 1. Advantages and disadvantages of fabrication processes for electrochromic devices.
ProcessesAdvantagesDisadvantagesReferences
Electrode position
-
Economical and versatile process
-
Can be performed under atmospheric pressure
-
Large deposition areas are possible
Material preparation and post-processes (drying, annealing) require:
-
Toxic chemicals
-
Relatively high temperatures
-
Long process times
[14,15,16]
Sol–gel
-
Easy control of the microstructure and composition at relatively low temperatures
-
Simple and low-cost equipment
-
Can be performed under atmospheric pressure
-
Weak bonding
-
Difficulty in controlling porosity
-
Mismatch of cracks from thermal expansion with the substrate
[10,17,18,19]
Spray pyrolysis
-
Cost-effective
-
Large area
-
Thin films
-
Can be performed under atmospheric pressure
-
Slow deposition rate
-
Wastage of solution
[20,21,22]
Chemical vapor deposition (CVD)
-
High-purity films
-
High deposition rate
-
Requires volatile precursors
-
Maximum process temperature can reach over 1000 °C
[11,13,23,24],
Physical vapor deposition
(PVD)
-
Thin film
-
Low contamination
-
Controlling film deposition rates
-
Expensive
[11,12,25,26,27]
Sputtering
-
Widely used
-
Deposition at room temperature
-
Magnetron and pulsed magnetron sputtering processes were developed to improve the deposition rate
-
Some processes require high vacuum and temperature
[28,29,30]
Nanoparticle deposition system (NPDS)
-
Under dry conditions
-
Uses room temperature
-
Under low vacuum conditions
-
Relatively simple and low-cost process
-
Performance and durability have not yet been verified sufficiently by other researchers in this area
[31,32,33,34]
Several research activities state the importance of window orientation, type of glazing, and window-to-wall ratio (WWR) for the energy efficiency of buildings. A study conducted by Mehaoued and Lartigue [35] in Algeria showed that in hot regions, augmenting the WWR led to a rise in the cooling demand caused by an increase in the temperature of the air surrounding the building due to multiple reflections of the heat flux. In the same context, Leskovar et al. [36] found that the impact of increasing WWR is less critical in the north than in the south orientation.
Hassouneh et al. [37] studied the impact of eight types of window glazing on thermal behavior of an apartment located at latitude 32 °N in Amman. The results indicated that a larger window with clear glass facing east, west, and south reduces heating load.
According to Friess et al. [38], in hot climates, the building orientation is the first factor that must be taken into account in passive design.
Yang et al. [39] studied the impact of WWR on the heating and cooling energy consumption of residential buildings in the hot summer and cold winter zone in China. They reported that the most important parameters for determining the optimum WWR are air conditioning system, window orientation, and glazing types.
Qiong et al. [40] tested twenty types of glazing, in three different Chinese climates, using Design Builder software. It was found that 6 mm double-glazed units (equipped with tinted glass panes) embodying 13 mm air interspace showed advantages in a climate characterized by hot summer and cold or warm winter, compared to single glazing and double-glazed units filled with argon, which was more expensive, while the same glazing (without tinting) was more suitable in cold climate.
Sibilio et al. [41] concluded—in their review paper dealing with smart windows for residential applications—that when using EC glazing, the energy saving may range from 39% to 59% compared to conventional static glazing, depending on the building orientation, climatic conditions, and control strategy.
Piccolo et al. [42] used an experimental and theoretical model to investigate the behavior of EC glazing based on WO3 in a cooling-dominated climate. The results showed that the performance of EC glazing in dynamic mode was comparable to that of low-emissivity double glazing (about 31% savings) in comparison with clear glass.
Another study [43], based on EnergyPlus dynamic simulation software, was conducted in an office building located in Milan, with the goal of determining the best option among three different types of glazing (EC glazing, common glass, and one equipped with an external venetian blind system), as compared to standard glazing. EC glazing decreased energy consumption by 39.5% and by 26.2% when using an external venetian blind device.
Using the same software as Ref. [43], Cannavale et al. [44] compared the efficiency of innovative solid-state EC devices with transparent glazing in commercial buildings in three different locations (Rome, London, and Aswan): the best scenario was discovered in Rome, using innovative EC devices, with energy savings ranging from 20.7% to 28.7%.
A study using the eQuest building simulation tool [45] analyzed three different United States climate zones; the model was a commercial office building with 60% WWR, according to a comparison of static and EC glazing efficiency: energy savings of up to 45% were observed in various climate zones.
Aldawoud [46] also analyzed the effect of EC glazing on building energy consumption in a hot and dry climate, using Design Builder software to compare EC glazing to various glazing types. The reduction in solar heat gains varied from 53% to 59%.
According to Piccolo et al. [47], the performance of EC glazing in residential buildings has been investigated in a few simulation studies, one of which was conducted in a cooling dominated climate, using Grasshopper software. The results show that larger EC window openness area on the exterior can be used without affecting the energy [48].
Tavares et al. [49] used the ESP-r software to estimate the energy savings for heating and cooling in the case of using a commercial EC glazing in a Mediterranean climate. The case study was an old building in Portugal, which was simulated in various window orientations with different WWR and different control strategies (outdoor and indoor air temperature, solar irradiance); the results indicated that the energy savings ranged from 20.28 to 36.94 kWh/m² year (per square meter of glazed area), and the best saving was obtained in the west orientation.
According to previous studies, we observed that several interactive parameters affect the energy performance of buildings, and this point confirms the importance of using a parametric approach to simulate the building behavior. On the other hand, the lack of research on the impact of using EC glazing in Northern Africa, as well as the absence of building energy regulations in Algeria, complicate the choice of designers, hence the importance of highlighting the performance of such new technology in this country.

2. Materials and Methods

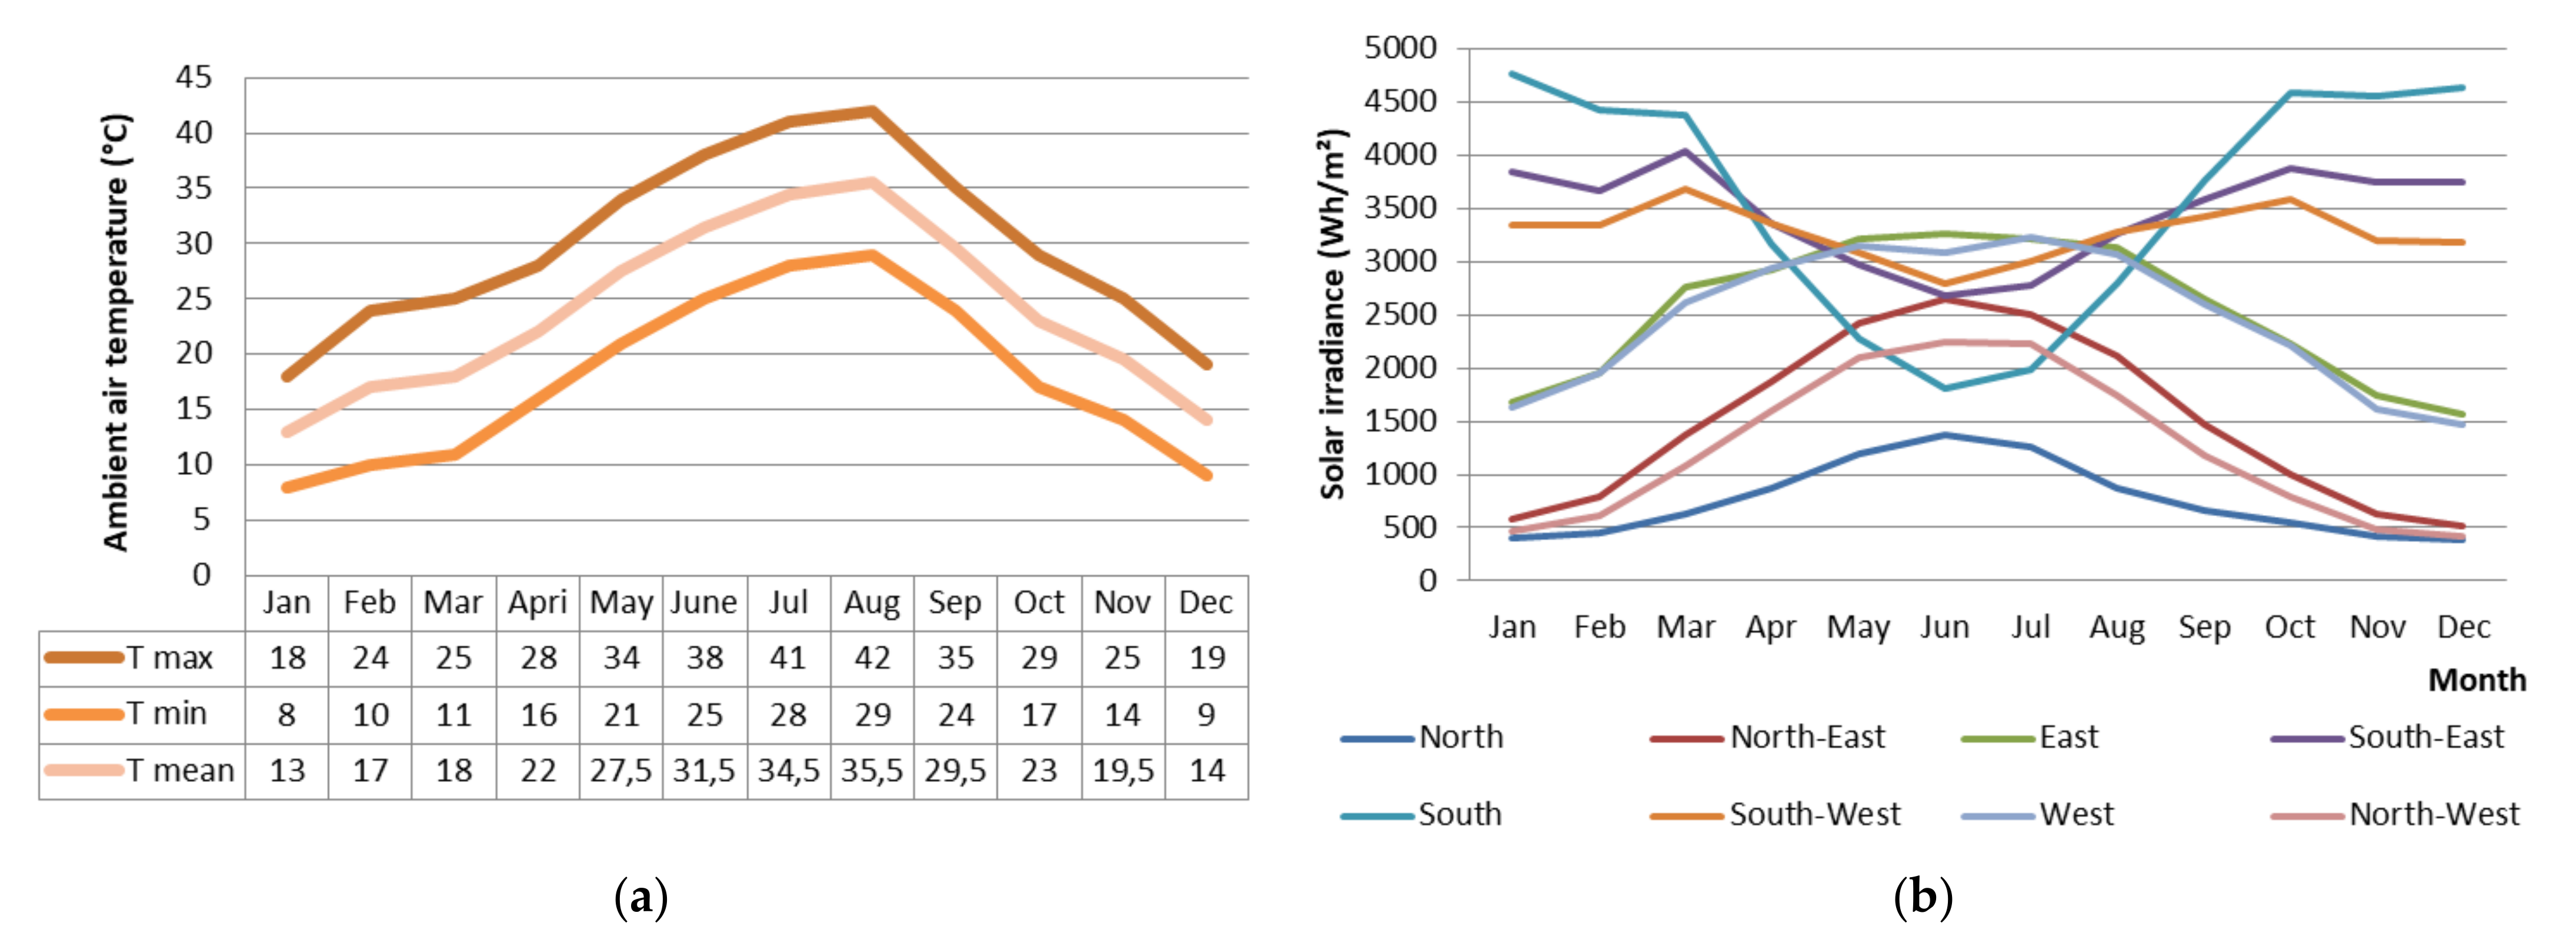
2.1. Climatic Condition

The case study of this work was located in the northeast part of the Algerian desert, at latitude 34.80 °N, longitude 5.73 °E, and an altitude of 82 m above sea level, classified as a hot and dry climate according to Köppen–Geiger classification [50].
Climatic data were taken from the international weather for energy calculations database for the location of Biskra [51], where the climate is influenced by solar radiation, given in Figure 2b, that represents a summary of the different monthly average solar irradiation values for different exposures.
According to the ambient air temperature of the city of Biskra shown in Figure 2a, the period from June to September represents the hot season with average maximum temperature of 35.5 °C and minimum of 29.5 °C, respectively; the hottest month is August, with an average maximum temperature of 42 °C and minimum temperature of 29 °C. While the cool season extends from the second half of November to the first week of March, with an average maximum of 19.5 °C and minimum of 13 °C, the coldest month is January, with an average maximum of 18 °C and minimum of 8 °C.

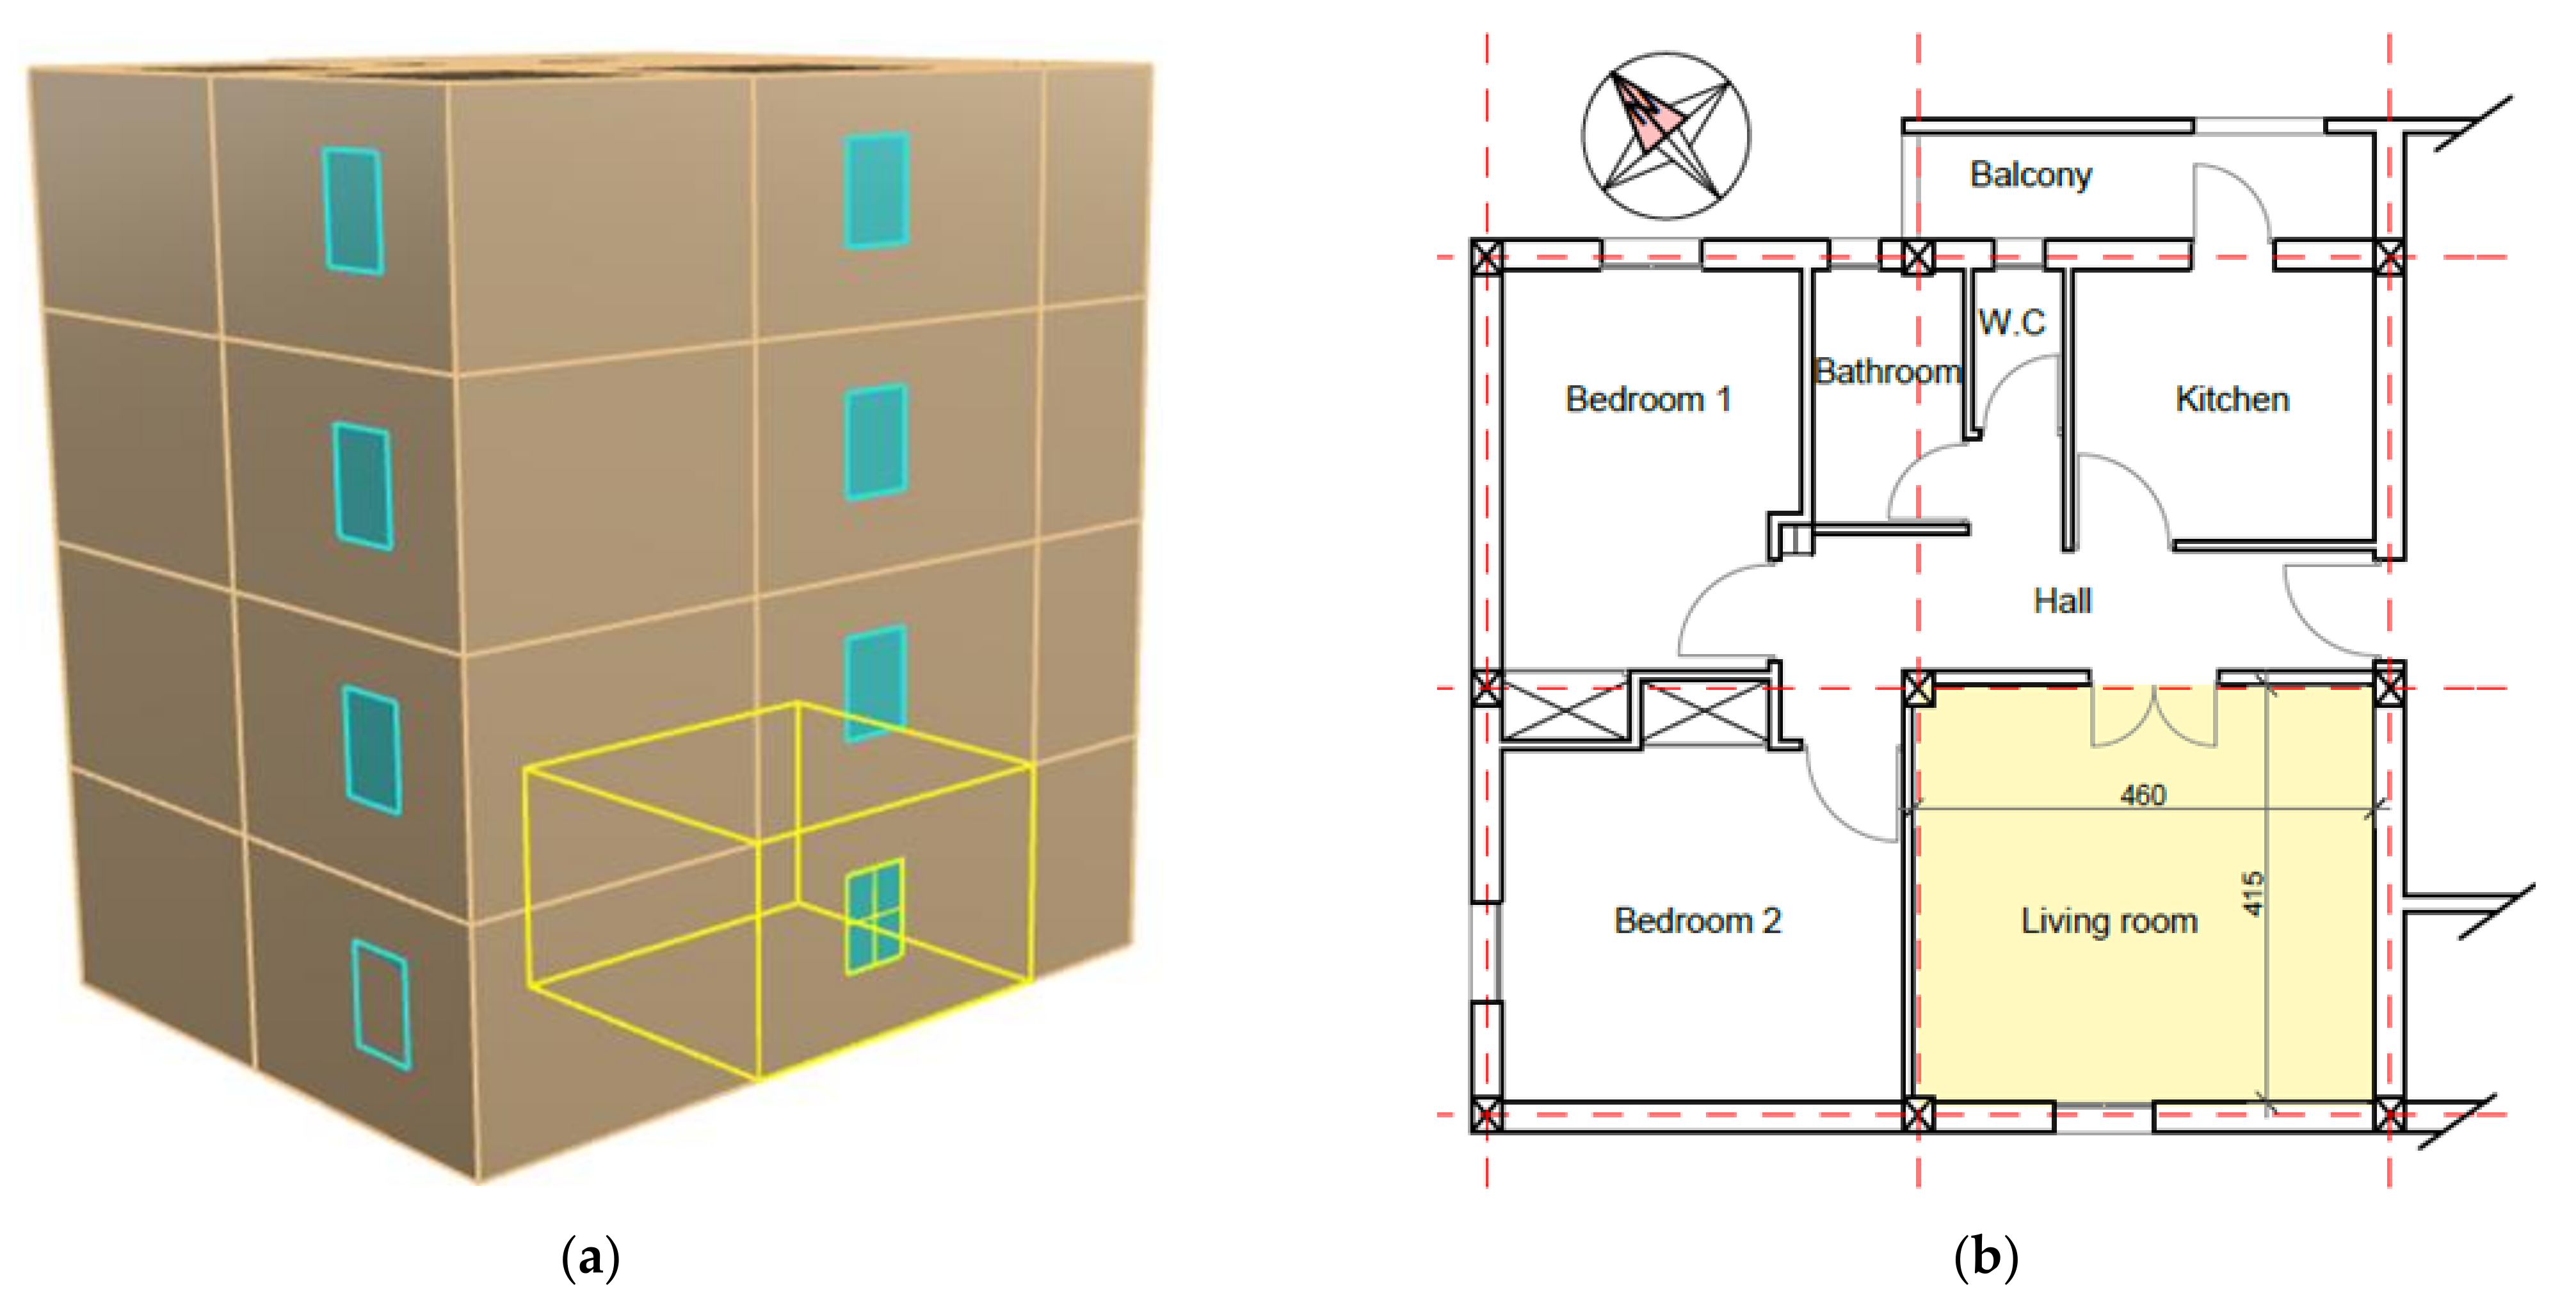
2.2. Building Description

In the present study, the building context was a typical residential project located in the city of Biskra consisting of four floors, each one hosting two apartments, composed of two bedrooms, kitchen, bathroom, hall, and a living room; based on the Algerian national office of statistics [52], it represents a typical apartment in collective housing model in Algeria.
The case study deals with a southwest-oriented living room with 8.5% Window-to-Wall Ratio (WWR) and a surface area of 19.09 m², representing about a quarter of the apartment total area (80 m²), located on the ground floor (Figure 3).
Based on typical characteristics of similar buildings, the material specifications of the boundaries of the space to be analyzed were defined and are listed in Table 2. As said above, there is no building regulation in Algeria that gives reference values for U-values. The opaque building envelope data and characteristic have been fixed for all the case studies to appreciate the effect of glazing.
With reference to transparent elements (listed in Table 3), three different options were evaluated, assuming a laminated glazing based on the characteristics of the base case, and then it was compared to EC glazing to estimate the amount of energy saved when used in the real-life building.
Due to the significant differences in the properties of both glazing, an intermediate case (double vacuum glazing) was considered, taking into account the similarities between the double vacuum and the EC glazing in terms of thermal characteristics, cost, layer number, and pane glass thickness, with one exception: the thickness and materials of the space between panes.
As the EC glazing is significantly more expensive than the standard static glazing used, the vacuum glazing was chosen based on the comparable price range of 300 to 500 €/m2 according to the market information in 2021 [53,54]. The high cost of both glazing is due to their manufacture processes, which both need high vacuum conditions.
For the EC glazing, it was assumed based on its commercial availability by the manufacturer Sage Glass [55], even though it is less efficient than other types of EC glazing. Moreover, all glazing properties were calculated using LBNL Window 7.5 [56].

2.3. Simulation Data

The main aim of the research is to assess the efficiency of EC glazing in reducing solar heat gain and providing new design alternatives without increasing energy consumption, in order to address the problem of limited building openness and orientation flexibility in hot climates.
There are two basic simulation tools for evaluating building energy performance: static, which uses a simple mathematical procedure, and dynamic, which uses circumstances that vary over time [57]. Recently, software based on parametric simulation has been developed, giving designers the ability to work out possible combinations between the different parameters, resulting in more variables. Another advantage of these tools is the possibility to use many plugins adding on the same platform; for example, Grasshopper links to Rhinoceros, Honeybee, EnergyPlus, Open studio, Ladybug, and Radiance [58].
In the present work, once the building and site specifications were defined, the model was implemented in Rhinoceros; afterwards, it was exported to Grasshopper.
In order to specify the zone properties, another plugin, named Ladybug, was used to identify the envelope materials used in the existing building and listed in Table 2, as well as to create the windows with the assigned ratio variation, with glazing properties (Table 3), calculated using LBNL Window 7.5 and then exported as an input data file.
In this step, all parameters were kept as in the reference building (Table 4) except the orientation, which was changed in eight different directions, with an increment of 45 degrees, with 0° corresponding to north, 90° to east, etc.
Because of the specific environmental conditions of the case study and in reference to literature review [59], the boundary conditions have been set as follows:
  • 18 °C setpoint temperature for heating.
  • 26 °C setpoint temperature for cooling.
  • 300 lux limit for lighting (illuminance level).
The occupation period of the space has been defined as 12:00 to 24:00, according to the authors’ own observations and to previous investigation [60]. Indeed, the living room as a main space in the apartment is used mostly in the afternoon after work or school for family gathering and for recreative and pleasure activities in the night, such as watching television, playing, reading studying, etc.
For the building infiltration, an average building was considered, with an infiltration rate of 0.0003 m3/(s∙m²), the equipment load per area was supposed to be 5 W/m², and 5 W/m² for lighting density [61].
Ventilation was calculated according to the windows opening, assumed to be two hours a day from 9 a.m. to 11 a.m. in order to simulate a realistic window-opening behavior of occupants that are supposed to be four individuals.
Using Honeybee plugin, the city’s weather data were imported as an EPW file from the international weather for energy calculations database [51].
The component “EP output” was used to control the type of calculation and results, analyzed in terms of cooling and heating, that were calculated assuming an “ideal loads air system” converted to equivalent electric energy by a COP of 2.7 [62], as well as in terms of electrical lighting and overall consumption.
Through a parametric simulation, the WWR was varied from 8.5% to 10% and then, with 10% steps, to 90%, thus including 10 alternatives, with three different types of glazing (Table 3), where the laminated glass was replaced by a double vacuum glazing and commercial EC glazing, controlled by the “interior illuminance” strategy that ensures a 300 lux target over a virtual sensor, located at the center of the zone, 2.8 m above the floor. The living room window was also rotated in eight different orientations, obtaining 240 scenarios, summarized in Figure 4.
The consumption of the base case was then compared to the other variants, which were normalized with reference to floor surface area to allow for greater generalization of results.

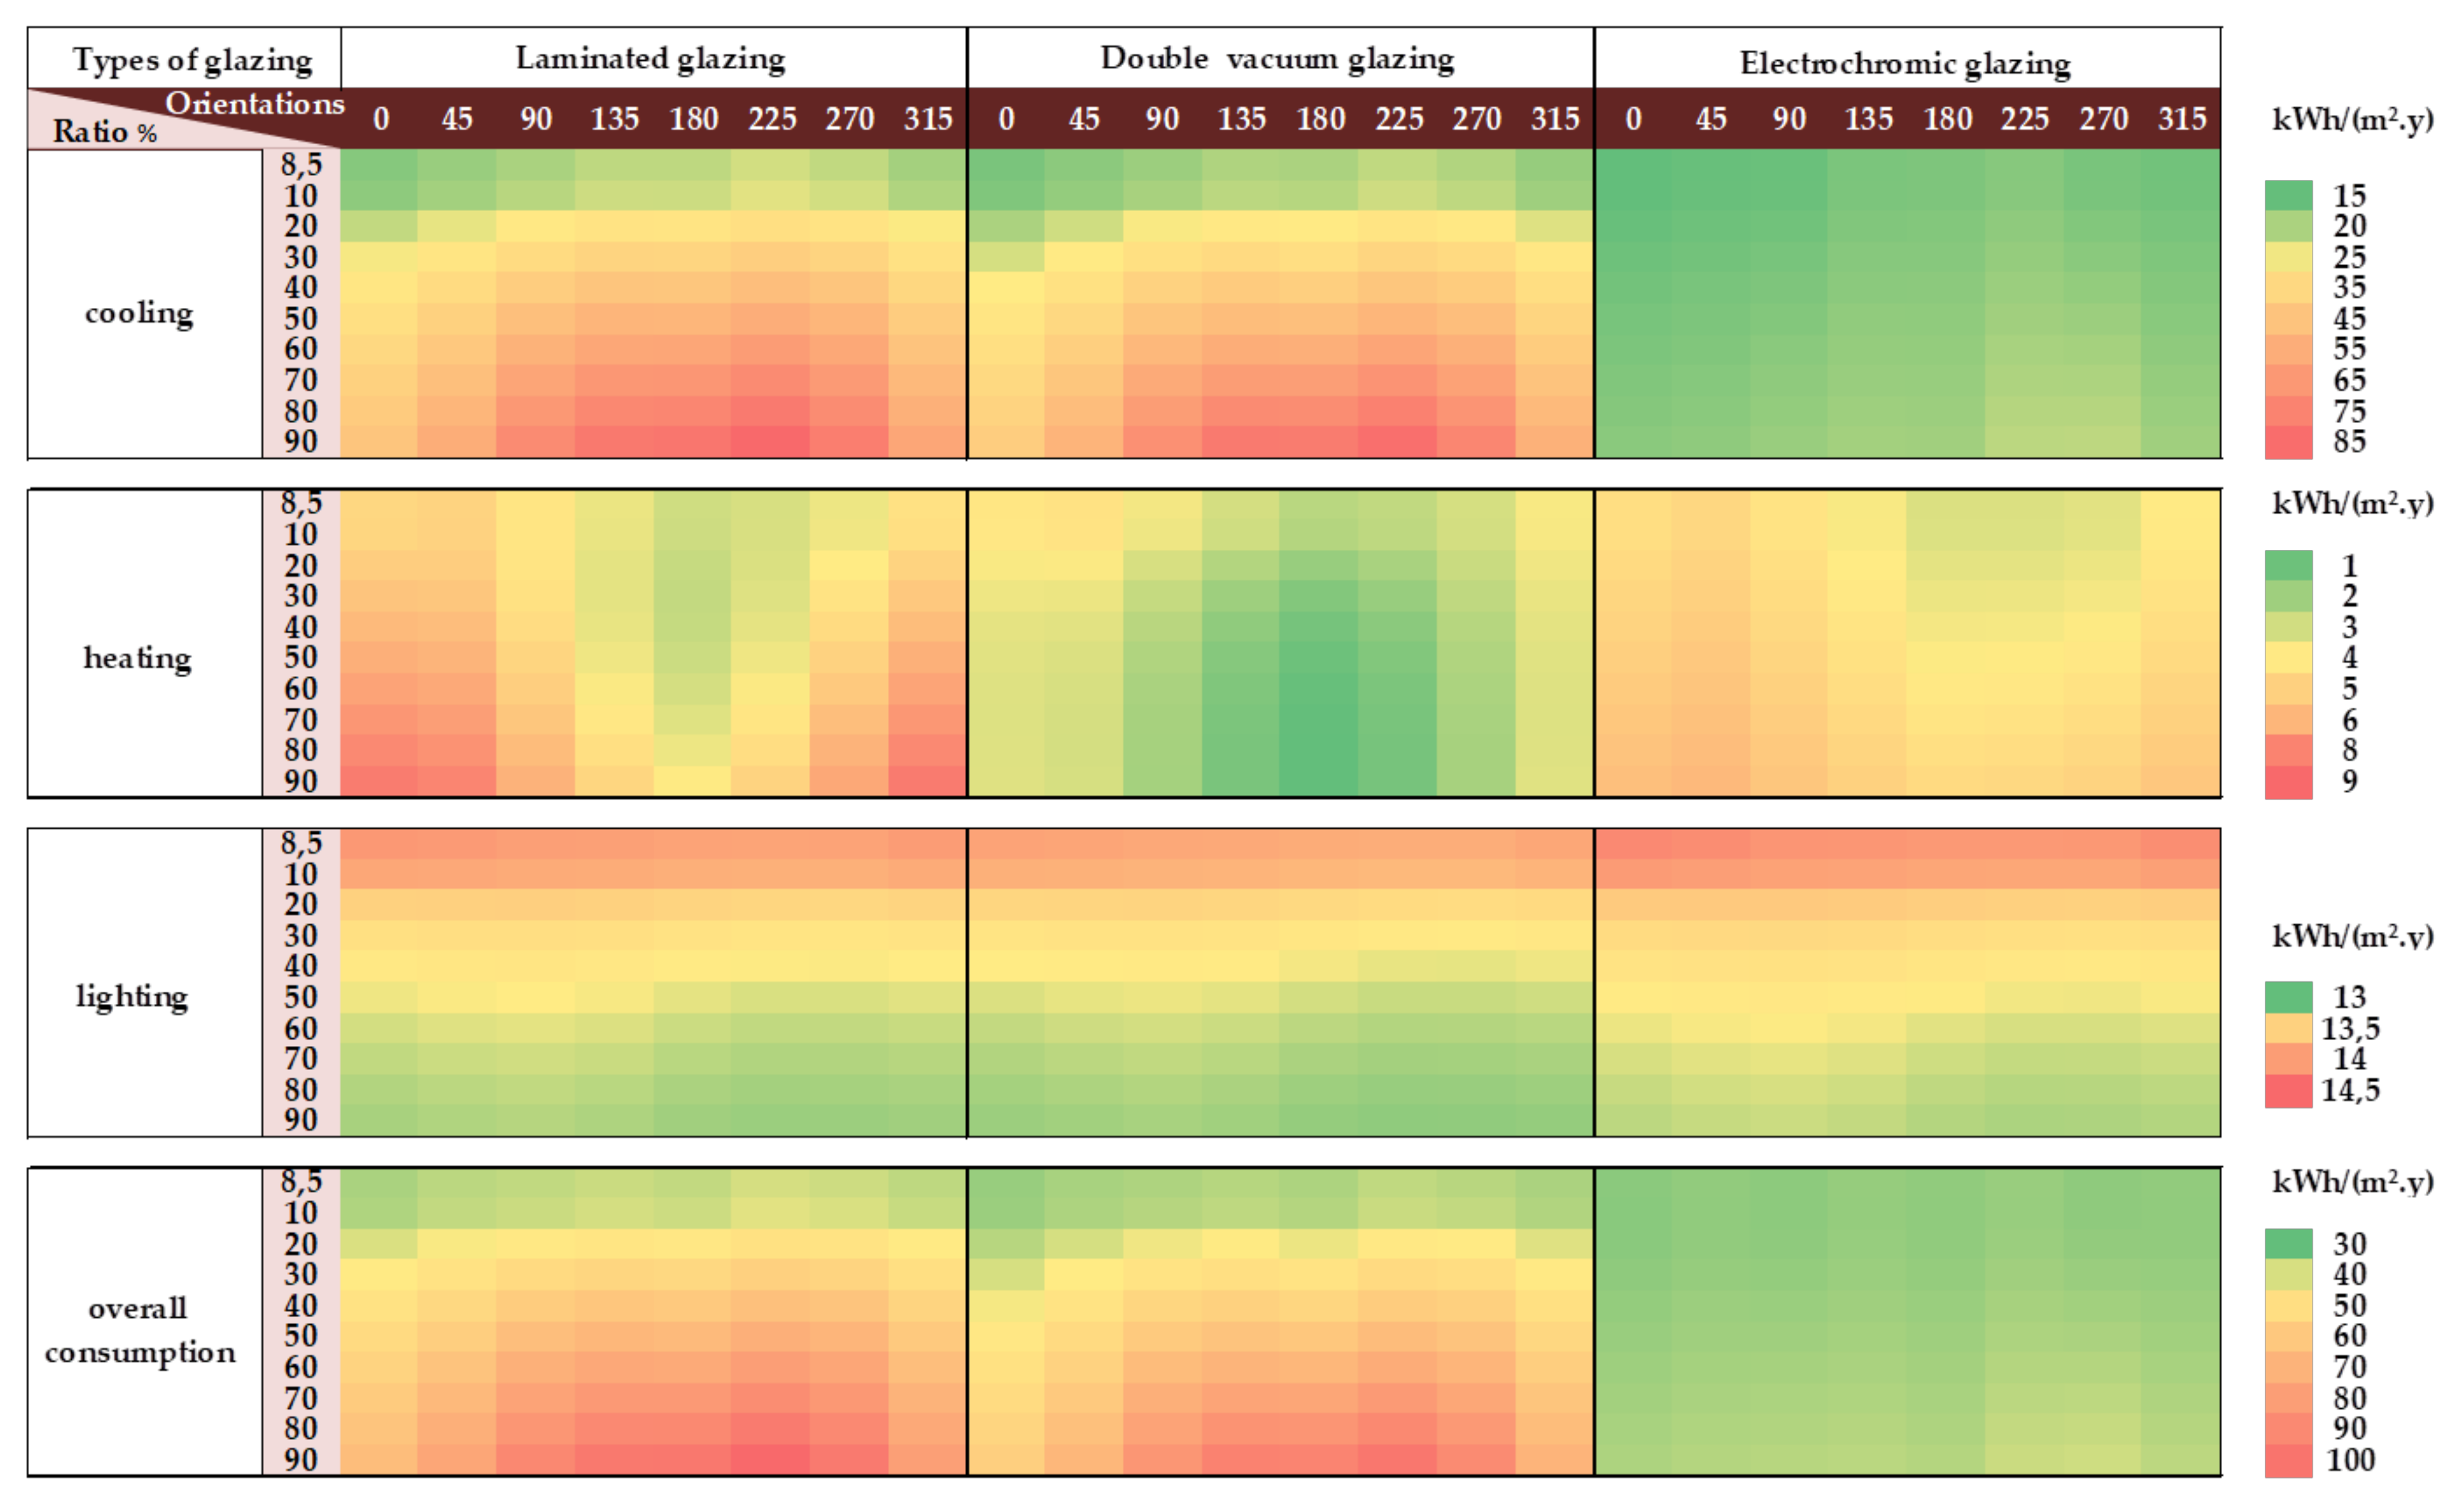
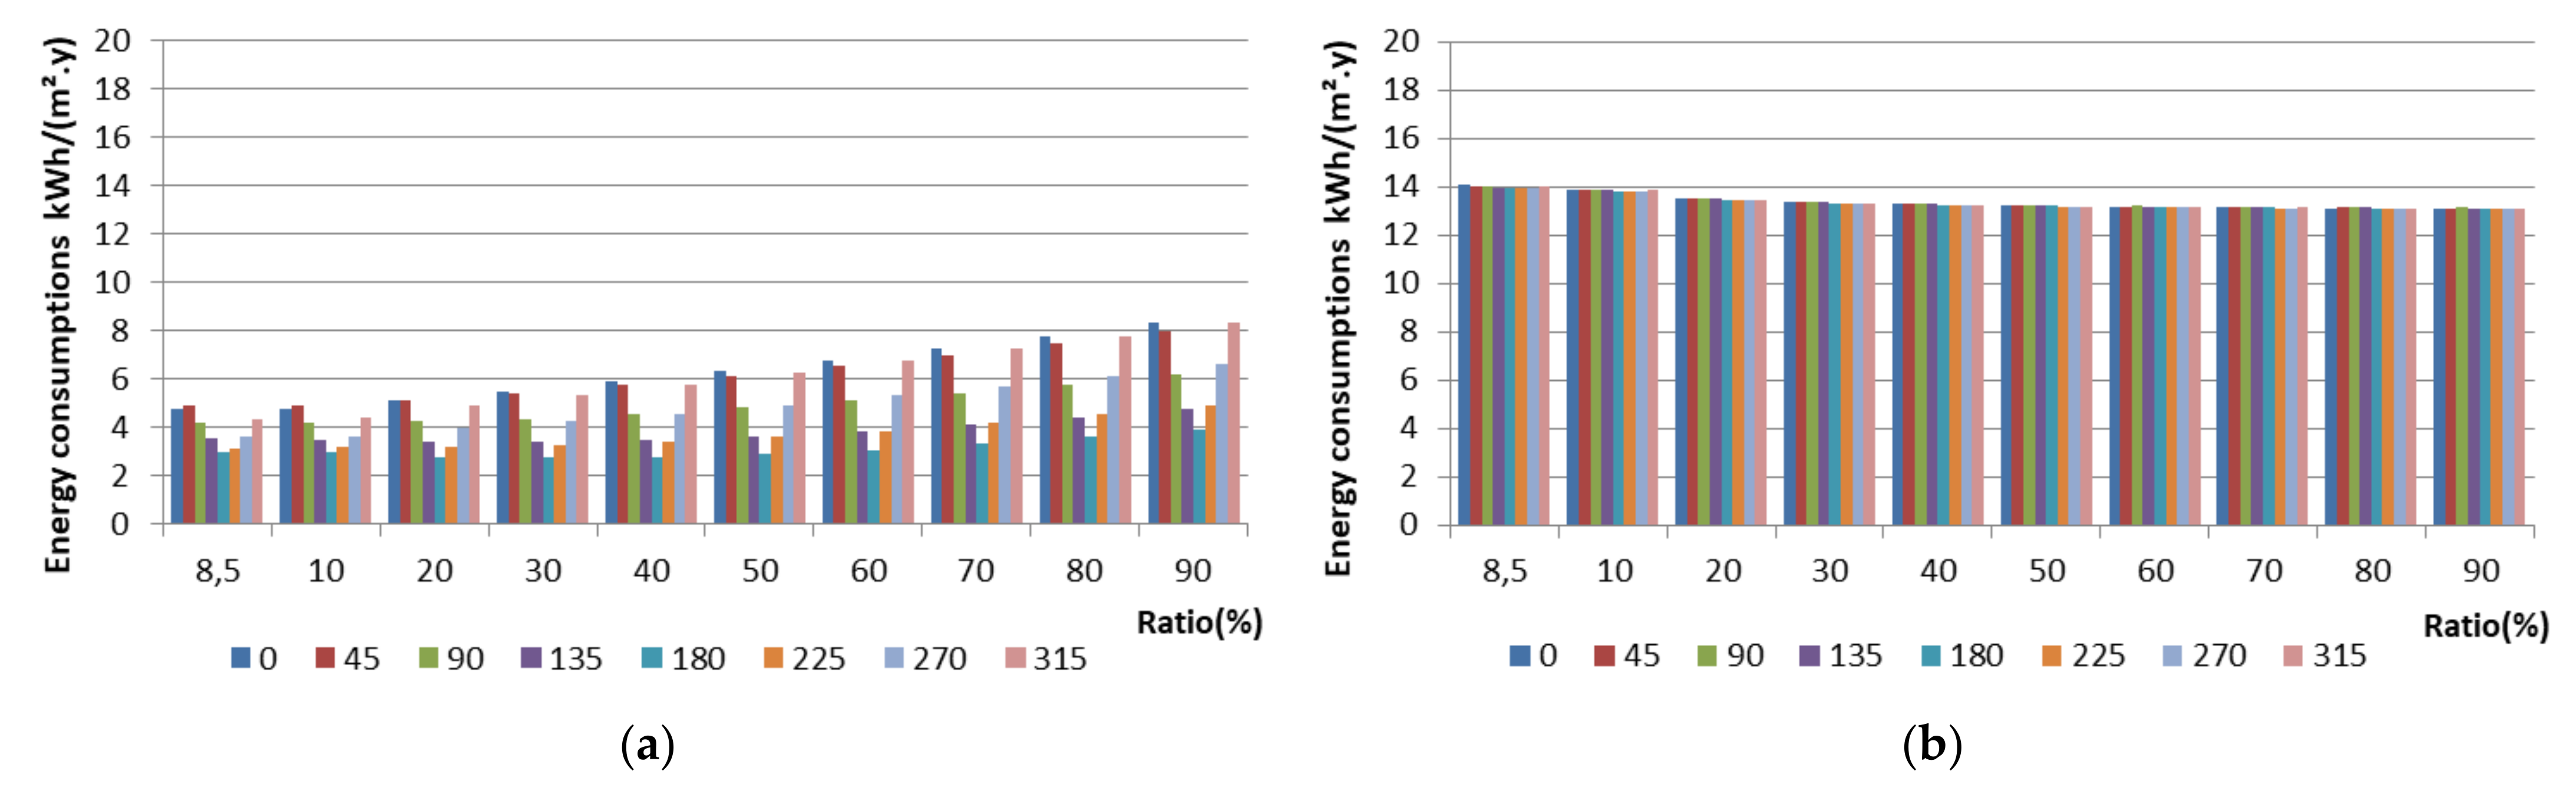
3. Results and Discussion

The electric energy consumption of the reference case with laminated glazing as a function of orientation and WWR (Figure 5) illustrates that minimizing the WWR decreases the energy consumption and the disparity between the different orientations.
Furthermore, when the WWR is less than 10%, the difference between the eight orientations is insignificant, due to the decrease in sun radiation entering the building, and the heat transfer from outside to inside, while in the case of WWR 90%, the difference between the north and southwest facades reaches 39.31 kWh/(m2.y).
Due to the long hot season, the overall consumption is largely influenced by the cooling needs, with the maximum values corresponding to the SW exposure and minimum to the north exposure.
It is clear from the results that the energy consumptions were affected by the solar irradiation (Figure 2b). The highest heating needs were found in the case of north orientation, which receives the least amount of irradiation for the whole year. On the other hand, the southwest façade receives convergent irradiation during the different seasons (maximum in spring, 3678.33 Wh/m², and autumn, 3579.66 Wh/m²), which increases the cooling needs periods.
In all the orientations, increasing the WWR decreases the lighting demand, while in the case of north orientation, the lighting needs are slightly higher because of the relatively minimum amount of irradiation. Moreover, all the other orientations have approximately the same lighting consumptions due to the type of building, where the majority of consumption occurs at night, therefore the natural lighting has a negligible effect compared to artificial lighting.
Figure 4 summarizes results from the investigated scenarios, showing that the highest energy consumption was found in the base case (laminated glazing), and for both alternative glazing, the results show a positive correlation between the WWR and the energy consumption. However, the increment is small compared to laminated glazing, due to a decrease in the amount of radiation entering the building.
Moreover, in the case of EC glazing, the disparity of cooling needs between different orientations is less than 3 kWh/(m².y). This results from the combination of both reduced solar heat gain coefficient (SHGC) and visible light transmittance (Tvis) that characterize the EC glazing in its colored state, which greatly reduce the amount of thermal radiation entering the building. In fact, during the cooling season, increased daylight illuminance contributes to set the EC glazing in tinted status in most of the time.
On the other hand, it was found that using double vacuum glazing reduces heating needs (to nearly zero from WWR 70% up, in the south orientation). This is because the high SHGC combined with low thermal transmittance decreases heat loss. Consequently, an increase in cooling needs can be observed.
In terms of energy expenditures for artificial lighting, EC glazing increased the consumption, compared to the reference glazing. This increase was inversely related to the WWR, due to the decreasing sunlight entering the space, while the consumption decreases when using double vacuum glazing, because the Tvis of laminated glass is greater than Tvis of the former. This slight difference is a result of the material used in laminated glazing between the two glasses (this type of glass is widely used in residential buildings in Algeria). In addition, the use of lighting during night hours results in a slight difference of consumption between the different types of glazing.
Figure 6 and Figure 7 report the amount of energy saved after using the EC glazing compared to the double vacuum glazing and the reference window, respectively.
Either way, the improvement was higher in terms of cooling consumption (a), due to the long cooling season, which is why the EC glazing outperforms vacuum glazing in terms of overall consumption reduction (d), even though the vacuum glazing is more efficient in reducing the heating needs because of the high SHGC value.
In Figure 7b, which represents the variation in energy required for heating, a small increase was found in the south orientation, which receives the highest irradiation in December (4635 Wh/m²), after using EC glazing as a result of reduced solar radiation entering the space. Conversely, in the north orientation a slight decrease was found, thanks to the improved U-value of the EC glazing compared to simple laminated glazing.
Moreover, the best saving observed for overall consumption was about 62.87% compared to laminated glazing and about 60.47% compared to double vacuum glazing, which is consistent with previous research that found improvements up to 59% [41], while the findings are higher than the energy saving reported in [42] (31%), in [43] (39.5%), and in [44] (28.7%).

4. Conclusions

This research activity focuses on the energy savings that can be obtained using EC windows in residential buildings located in a hot arid climate. The chosen glazing has already been commercialized by a well-known manufacturer and we are strongly confident that using EC glazing with improved characteristics may yield even better results.
As a consequence of the yearly long period of overheating, the cooling is more important, and heating shows minimum loads.
Furthermore, the results led to some design recommendations; since the space function impacts the choice of orientation, it is recommended, in the case of laminated glazing, to orient the living room toward north with WWR up to 90 as it is a space that needs a panoramic view. This orientation also prevents the interference of intense luminance with the television; however, it may be oriented toward the south to ensure a warmer ambient in winter plus more of the natural light, without exceed WWR 50%, which has a similar overall consumption with WWR 90 north-facing.
Meanwhile, it is preferred to orient the bedroom toward the east so it obtains the advantage of facing the sunrise plus keeping it cool at the end of the day.
In the kitchen, the internal heat gains are high due to cooking, so north orientation is an adequate choice; however, the zone may be dimly lit; therefore, a double orientation northeast to southeast will increase the benefit of the natural light in the morning.
As the bathroom and garage do not require an outside view, a double northwest or southwest orientation choice will be sufficient.
The best advantage resulting from the use of EC glazing was found for the orientations with high solar radiation, where it allowed obtaining significant savings compared to laminate and double vacuum glazing.
The best improvement, compared to double vacuum glazing, was obtained in the case of WWR 90% for southwest facing windows, with 60.47% savings for overall yearly energy consumption, followed by south orientation with 59.85%, southeast orientation with 59.83%, west orientation with 55.81%, east orientation with 55.71%, northwest orientation with 45.89%, northeast orientation with 45.65%, and north orientation with 35.88%.
The results show that, starting from WWR 40%, in the case of laminated or vacuum glazing, the influence of orientation is greater than the influence of WWR. While in the case of EC glazing, the influence of WWR and orientations is negligible, due to the significant reduction in solar heat gain, thus solves the problem of limited WWR and orientation choices.
However, because of the relatively high cost of EC glazing, it is recommended that it be used when savings greater than a quarter of initial overall consumption are achieved, such as in the southwest orientation from WWR 20%, from 30% in southeast and south, from 50% in the northwest or east, or from 70% in the north or northeast.
The major limitation that obstructs large-scale market introduction of the EC glazing is the high cost of the production process that can be developed in the future to be less expensive, such as the (NPDS) process mentioned in the introduction. Even with the high cost, it is considered as a useful technology to reduce energy consumptions and, therefore, the environmental consequences obtained through CO2 emission to the atmosphere.
At this stage, visual and thermal comfort parameters were not included in the analysis, although other studies show that EC may significantly contribute to improve it. However, it will be interesting for future research work on this subject to concentrate on parametric optimization, in order to find a suitable balance between daylighting, thermal comfort, and energy consumption.

Author Contributions

Conceptualization, I.L., A.C., F.M. and N.Z.; methodology, I.L., A.C. and F.M.; software, I.L.; writing—original draft preparation, I.L.; writing—review and editing, A.C., I.L., F.M. and N.Z; visualization, I.L.; supervision, A.C., F.M. and N.Z. All authors have read and agreed to the published version of the manuscript.

Funding

This research received no external funding.

Institutional Review Board Statement

Not applicable. The study did not require ethical approval.

Informed Consent Statement

Not applicable. The study did not involve humans.

Data Availability Statement

Not applicable.

Conflicts of Interest

The authors declare no conflict of interest.

Nomenclature

EC Electrochromic
CVDChemical vapor deposition
PVDPhysical vapor deposition
NPDSNanoparticle deposition system
WWRWindow-to-wall ratio
Low-eLow emissivity
WO3Tungsten trioxide
NiONickel oxide
SHGCSolar heat coefficient
TvisVisible light transmittance
U-valuesThermal transmittance
PVBPolyvinyl butyral
EPW fileEnergyPlus weather file
IDFInput data file
COPCoefficient of performance

References

  1. Gyamfi, S.; Krumdieck, S.; Urmee, T. Residential peak electricity demand response—Highlights of some behavioural issues. Renew. Sustain. Energy Rev. 2013, 25, 71–77. [Google Scholar] [CrossRef] [Green Version]
  2. Van, L.P.; Malyavina, E.G.; Malikova, O.Y. Impact of Glass Window to Heat Load in Office Building in Different Climates. In IOP Conference Series: Materials Science and Engineering; IOP Publishing: Bristol, UK, 2021; Volume 1079, p. 042084. [Google Scholar] [CrossRef]
  3. Chiffres Clés du Bilan Energetique de L’année 2017. Available online: https://www.energy.gov.dz/?article=bilan-energetique-national-du-secteur (accessed on 1 May 2022).
  4. Granqvist, C.G. Recent progress in thermochromics and electrochromics: A brief survey. Thin Solid Film. 2016, 614, 90–96. [Google Scholar] [CrossRef]
  5. Granqvist, C.G. Electrochromics for smart windows: Oxide-based thin films and devices. Thin Solid Film. 2014, 564, 1–38. [Google Scholar] [CrossRef]
  6. Casini, M. Active dynamic windows for buildings: A review. Renew. Energy 2018, 119, 923–934. [Google Scholar] [CrossRef]
  7. Piccolo, A.; Simone, F. Performance requirements for electrochromic smart window. J. Build. Eng. 2015, 3, 94–103. [Google Scholar] [CrossRef]
  8. Monk, P.; Mortimer, R.; Rosseinsky, D. Electrochromism and Electrochromic Devices; Cambridge University Press: Cambridge, UK, 2007; Volume 1, pp. 1–24. [Google Scholar] [CrossRef]
  9. Park, S.-I.; Quan, Y.-J.; Kim, S.-H.; Kim, H.; Kim, S.; Chun, D.-M.; Lee, C.S.; Taya, M.; Chu, W.-S.; Ahn, S.-H. A review on fabrication processes for electrochromic devices. Int. J. Precis. Eng. Manuf.-Green Technol. 2016, 3, 397–421. [Google Scholar] [CrossRef]
  10. Pierre, A.C. Introduction to Sol-Gel Processing; Springer Science & Business Media: Cham, Switzerland, 2013; Volume 1. [Google Scholar]
  11. Ilangovan, R.; Subha, V.; Ravindran, R.E.; Kirubanandan, S.; Renganathan, S. Nanomaterials: Synthesis, physicochemical characterization, and biopharmaceutical applications. In Nanoscale Processing; Elsevier: Amsterdam, The Netherlands, 2021; pp. 33–70. [Google Scholar]
  12. Devasia, R.; Painuly, A.; Devapal, D.; Sreejith, K.J. Continuous fiber reinforced ceramic matrix composites. In Fiber Reinforced Composites; Woodhead Publishing: Sawston, UK, 2021; pp. 669–751. [Google Scholar]
  13. Creighton, J.R.; Ho, P. Introduction to chemical vapor deposition (CVD). Chem. Vap. Depos. 2001, 2, 1–22. [Google Scholar]
  14. Yuan, Y.F.; Xia, X.H.; Wu, J.B.; Chen, Y.B.; Yang, J.L.; Guo, S.Y. Enhanced electrochromic properties of ordered porous nickel oxide thin film prepared by self-assembled colloidal crystal template-assisted electrodeposition. Electrochim. Acta 2011, 56, 1208–1212. [Google Scholar] [CrossRef]
  15. Sonavane, A.C.; Inamdar, A.I.; Shinde, P.S.; Deshmukh, H.P.; Patil, R.S.; Patil, P.S. Efficient electrochromic nickel oxide thin films by electrodeposition. J. Alloy. Compounds 2010, 489, 667–673. [Google Scholar] [CrossRef]
  16. Zhang, J.; Tu, J.P.; Cai, G.F.; Du, G.H.; Wang, X.L.; Liu, P.C. Enhanced electrochromic performance of highly ordered, macroporous WO3 arrays electrodeposited using polystyrene colloidal crystals as template. Electrochim. Acta 2013, 99, 1–8. [Google Scholar] [CrossRef]
  17. Zarzycki, J. Past and present of sol-gel science and technology. J. Sol-Gel Sci. Technol. 1997, 8, 17–22. [Google Scholar] [CrossRef]
  18. Scherer, G.W. Sintering of sol-gel films. J. Sol-Gel Sci. Technol. 1997, 8, 353–363. [Google Scholar] [CrossRef]
  19. Dimitriev, Y.; Ivanova, Y.; Iordanova, R. History of sol-gel science and technology. J. Univ. Chem. Technol. Metall. 2008, 43, 181–192. [Google Scholar] [CrossRef]
  20. Mukherjee, R.; Sahay, P.P. Improved electrochromic performance in sprayed WO3 thin films upon Sb doping. J. Alloy. Compd. 2016, 660, 336–341. [Google Scholar] [CrossRef]
  21. Mousavi, M.; Kompany, A.; Shahtahmasebi, N.; Bagheri-Mohagheghi, M.M. The effect of solution concentration on the physical and electrochemical properties of vanadium oxide films deposited by spray pyrolysis. J. Semicond. 2013, 34, 103001. [Google Scholar] [CrossRef]
  22. Bertus, L.M.; Enesca, A.; Duta, A. Influence of spray pyrolysis deposition parameters on the optoelectronic properties of WO3 thin films. Thin Solid Film. 2012, 520, 4282–4290. [Google Scholar] [CrossRef]
  23. Obraztsov, A.N.; Obraztsova, E.A.; Tyurnina, A.V.; Zolotukhin, A.A. Chemical vapor deposition of thin graphite films of nanometer thickness. Carbon 2007, 45, 2017–2021. [Google Scholar] [CrossRef]
  24. Chandrakala, M.; Bharath, S.R.; Maiyalagan, T.; Arockiasamy, S. Synthesis, crystal structure and vapour pressure studies of novel nickel complex as precursor for NiO coating by metalorganic chemical vapour deposition technique. Mater. Chem. Phys. 2017, 201, 344–353. [Google Scholar] [CrossRef]
  25. Chiu, P.K.; Chiang, D.; Lee, C.T.; Hsiao, C.N.; Yang, J.R.; Cho, W.H.; Huang, C.L. Investigation of the Microstructure, Porosity, Adhesion, and Optical Properties of a WO3 Film Fabricated Using an E-Beam System with Ion Beam-Assisted Deposition. IEEE Trans. Magn. 2014, 50, 3500204. [Google Scholar] [CrossRef]
  26. Selvakumar, N.; Barshilia, H.C. Review of physical vapor deposited (PVD) spectrally selective coatings for mid-and high-temperature solar thermal applications. Sol. Energy Mater. Sol. Cells 2012, 98, 1–23. [Google Scholar] [CrossRef]
  27. Tajima, K.; Yamada, Y.; Okada, M.; Yoshimura, K. Fabrication study of proton injection layer suitable for electrochromic switchable mirror glass. Thin Solid Film. 2010, 519, 934–937. [Google Scholar] [CrossRef]
  28. Kubo, T.; Nishikitani, Y.; Sawai, Y.; Iwanaga, H.; Sato, Y.; Shigesato, Y. Electrochromic properties of Li x Ni y O films deposited by RF magnetron sputtering. J. Electrochem. Soc. 2009, 156, 629. [Google Scholar] [CrossRef]
  29. Chu, C.H.; Wu, H.W.; Huang, J.L. Novel WO3-Based Electrochromic Device for High Optical Modulation and Infrared Suppression. IEEE Electron Device Lett. 2015, 36, 256–258. [Google Scholar] [CrossRef]
  30. Tajima, K.; Yamada, Y.; Okada, M.; Yoshimura, K. Accelerated degradation studies on electrochromic switchable mirror glass based on magnesium–nickel thin film in simulated environment. Sol. Energy Mater. Sol. Cells 2010, 94, 1716–1722. [Google Scholar] [CrossRef]
  31. Kim, H.; Park, Y.; Choi, D.; Ahn, S.H.; Lee, C.S. Novel fabrication of an electrochromic antimony-doped tin oxide film using a nanoparticle deposition system. Appl. Surf. Sci. 2016, 377, 370–375. [Google Scholar] [CrossRef]
  32. Kim, M.S.; Chun, D.M.; Choi, J.O.; Lee, J.C.; Kim, Y.H.; Kim, K.S.; Ann, S.H. Dry-spray deposition of TiO2 for a flexible dye-sensitized solar cell (DSSC) using a nanoparticle deposition system (NPDS). J. Nanosci. Nanotechnol. 2012, 12, 3384–3388. [Google Scholar] [CrossRef]
  33. Chun, D.M.; Kim, C.S.; Choi, J.O.; Lee, G.Y.; Lee, C.S.; Ahn, S.H. Multilayer deposition of ceramic and metal at room temperature using nanoparticle deposition system (NPDS) and planarization process. Int. J. Adv. Manuf. Technol. 2014, 72, 41–46. [Google Scholar] [CrossRef]
  34. Kim, H.; Yang, S.; Ahn, S.H.; Lee, C.S. Effect of particle size on various substrates for deposition of NiO film via nanoparticle deposition system. Thin Solid Film. 2016, 600, 109–118. [Google Scholar] [CrossRef]
  35. Mehaoued, K.; Lartigue, B. Influence of a reflective glass façade on surrounding microclimate and building cooling load: Case of an office building in Algiers. Sustain. Cities Soc. 2019, 46, 101443. [Google Scholar] [CrossRef]
  36. Leskovar, V.Ž.; Premrov, M. An approach in architectural design of energy-efficient timber buildings with a focus on the optimal glazing size in the south-oriented façade. Energy Build. 2011, 43, 3410–3418. [Google Scholar] [CrossRef]
  37. Hassouneh, K.; Alshboul, A.; Al-Salaymeh, A. Influence of windows on the energy balance of apartment buildings in Amman. Energy Convers. Manag. 2010, 51, 1583–1591. [Google Scholar] [CrossRef]
  38. Friess, W.A.; Rakhshan, K. A review of passive envelope measures for improved building energy efficiency in the UAE. Renew. Sustain. Energy Rev. 2017, 72, 485–496. [Google Scholar] [CrossRef]
  39. Yang, Q.; Liu, M.; Shu, C.; Mmereki, D.; Hossain, U.; Zhan, X. Impact analysis of window-wall ratio on heating and cooling energy consumption of residential buildings in hot summer and cold winter zone in China. J. Eng. 2015, 2015, 538254. [Google Scholar] [CrossRef] [Green Version]
  40. He, Q.; Ng, S.T.; Hossain, M.; Skitmore, M. Energy-efficient window retrofit for high-rise residential buildings in different climatic zones of China. Sustainability 2019, 11, 6473. [Google Scholar] [CrossRef] [Green Version]
  41. Sibilio, S.; Rosato, A.; Scorpio, M.; Iuliano, G.; Ciampi, G.; Vanoli, G.P.; de Rossi, F. A review of electrochromic windows for residential applications. Int. J. Heat Technol. 2016, 34, S481–S488. [Google Scholar] [CrossRef]
  42. Piccolo, A. Thermal performance of an electrochromic smart window tested in an environmental test cell. Energy Build. 2010, 42, 1409–1417. [Google Scholar] [CrossRef]
  43. Aste, N.; Compostella, J.; Mazzon, M. Comparative energy and economic performance analysis of an electrochromic window and automated external venetian blind. Energy Procedia 2012, 30, 404–413. [Google Scholar] [CrossRef] [Green Version]
  44. Cannavale, A.; Martellotta, F.; Cossari, P.; Gigli, G.; Ayr, U. Energy savings due to building integration of innovative solid-state electrochromic devices. Appl. Energy 2018, 225, 975–985. [Google Scholar] [CrossRef]
  45. Sbar, N.L.; Podbelski, L.; Yang, H.M.; Pease, B. Electrochromic dynamic windows for office buildings. Int. J. Sustain. Built Environ. 2012, 1, 125–139. [Google Scholar] [CrossRef] [Green Version]
  46. Aldawoud, A. Conventional fixed shading devices in comparison to an electrochromic glazing system in hot, dry climate. Energy Build. 2013, 59, 104–110. [Google Scholar] [CrossRef]
  47. Piccolo, A.; Marino, C.; Nucara, A.; Pietrafesa, M. Energy performance of an electrochromic switchable glazing: Experimental and computational assessments. Energy Build. 2018, 165, 390–398. [Google Scholar] [CrossRef]
  48. Lahmar, I.; Zemmouri, N.; Cannavale, A.; Martellotta, F. Investigating the impact of electrochromic glazing on energy performance in hot arid climate using parametric design. In IOP Conference Series: Materials Science and Engineering; IOP Publishing: Bristol, UK, 2019; Volume 609, p. 062027. [Google Scholar] [CrossRef] [Green Version]
  49. Tavares, P.F.; Gaspar, A.R.; Martins, A.G.; Frontini, F. Evaluation of electrochromic windows impact in the energy performance of buildings in Mediterranean climates. Energy Policy 2014, 67, 68–81. [Google Scholar] [CrossRef] [Green Version]
  50. Kottek, M.; Grieser, J.; Beck, C.; Rudolf, B.; Rubel, F. World map of the Köppen-Geiger climate classification updated. Meteorol. Z. 2006, 15, 259–263. [Google Scholar] [CrossRef]
  51. EPW File. Available online: https://climate.onebuilding.org/WMO_Region_1_Africa/DZA_Algeria/index.html (accessed on 1 May 2022).
  52. Hadjij, C. Famille, logement, propriété à Alger. Insaniyat. Rev. Algérienne D’anthropologie Et De Sci. Soc. 1998, 4, 99–107. [Google Scholar] [CrossRef]
  53. Vacuum Glazing. Available online: https://www.vacuum-glass.com/vacuum-insulating-glass-price-costs/ (accessed on 14 May 2022).
  54. Will Smart Glass come to windows and doors? Available online: https://www.aluminiumtradesupply.co.uk/12549/will-smart-glass-come-windows-doors/ (accessed on 14 May 2022).
  55. SageGlass. Available online: https://www.sageglass.com/en/products/sageglass (accessed on 14 May 2022).
  56. LBNL Window 7.5. Available online: https://windows.lbl.gov/tools/window/software-download (accessed on 14 May 2022).
  57. Lomas, K.J. Empirical validation of building energy simulation programs. Fuel Energy 1997, 26, 253–275. [Google Scholar] [CrossRef]
  58. Toutou, A.; Fikry, M.; Mohamed, W. The parametric based optimization framework daylighting and energy performance in residential buildings in hot arid zone. Alex. Eng. J. 2018, 57, 3595–3608. [Google Scholar] [CrossRef]
  59. Silvero, F.; Rodrigues, F.; Montelpare, S. A parametric study and performance evaluation of energy retrofit solutions for buildings located in the hot-humid climate of Paraguay—sensitivity analysis. Energies 2019, 12, 427. [Google Scholar] [CrossRef] [Green Version]
  60. Bre, F.; Silva, A.S.; Ghisi, E.; Fachinotti, V.D. Residential building design optimisation using sensitivity analysis and genetic algorithm. Energy Build. 2016, 133, 853–866. [Google Scholar] [CrossRef]
  61. Handbook, A.F. Chapter 31: Energy Estimating and Modeling Methods; American Society of Heating, Refrigerating, and Air-Conditioning Engineers: Atlanta, GA, USA, 2001. [Google Scholar]
  62. Al-Saadi, S.N.; Al-Hajri, J.; Sayari, M.A. Energy-efficient retrofitting strategies for residential buildings in hot climate of Oman. Energy Procedia 2017, 142, 2009–2014. [Google Scholar] [CrossRef]
Figure 1. Electrochromic glazing schematic diagram.
Buildings 12 00724 g001
Figure 2. (a) Ambient air temperature (°C). (b) Incident global irradiation on a vertical plane.
Buildings 12 00724 g002
Figure 3. Case study (a) 3D and (b) plan.
Buildings 12 00724 g003
Figure 4. Energy consumption as a function of WWR, glazing window, and orientation for Cooling. Heating. Lighting. Overall consumption.
Buildings 12 00724 g004
Figure 5. Electric energy consumptions for laminated glazing as a function of different orientations and WWR kWh/(m².y). (a) Heating. (b) Lighting. (c) Cooling. (d) Overall consumptions.
Buildings 12 00724 g005aBuildings 12 00724 g005b
Figure 6. Variation in energy demand resulting from use of EC glazing instead of double glazing window, as a function of WWR and orientations for (a) cooling. (b) Heating. (c) Lighting. (d) Overall consumption. per unit area kWh/(m2.y).
Buildings 12 00724 g006
Figure 7. Variation in energy demand resulting from use of EC glazing instead of reference window, as a function of WWR and orientations for (a) Cooling. (b) Heating. (c) Lighting. (d) Overall energy consumption per unit area kWh/(m2.y).
Buildings 12 00724 g007
Table 2. Thermal characteristics of the building envelope.
Materials ThicknessThermal Properties U-value (W/(m²∙K))Front Mass
(kg/m²)
Exterior Wall0.02 m cement plaster1.14329
0.15 m hollow brick
0.05 m air barrier
0.1 m hollow brick
0.01 m coated plaster
Interior Wall0.01 m coated plaster2.49188
0.1 m hollow brick
0.01 m coated plaster
Roof0.02 m flooring2.42537
0.04 m mortar
0.16 m concrete blocks hollow
0.04 m concrete slab
0.01 m coated plaster
Floor0.15 m clay2.25809
0.15 m stones of valley
0.04 m concrete slab
0.04 m mortar
0.02 m flooring
Table 3. Thermal and optical characteristics of windows.
WindowsLaminated GlazingDouble Vacuum GlazingEC Glazing
Structure diagramBuildings 12 00724 i001Buildings 12 00724 i002Buildings 12 00724 i003
Materials thicknessLayer 13.1 mm clear glass 5.7 mm clear glass 5.7 mm clear glass
Layer 21.05 mm PVB color film0.1 mm vacuum12 mm air space
Layer 33.1 mm clear glass5.7 mm clear glass7 mm sage glass
Thermal and optical properties U-value (W/(m²∙K))U-value5.642.21.9
SHGC0.650.700.44 (0.10)
Tvis0.680.780.64 (0.01)
Table 4. Boundary conditions for the base case.
CharacteristicsDescription of the Base Case
locationBiskra, Algeria34.80° N/ 5.73° E/82 m
building azimuth225° (southwest)
plan shape rectangular 4.6 × 4.15 m
setpoint temperature for heating18 °C
setpoint temperature for cooling26 °C
limit for lighting300 lux
occupied period12 p.m.–12 a.m.
infiltration0.0003 m3/(s∙m²)
internal heat gain1 Tv, 4 people, 2 LED lights
equipment load5 W/m²
lighting density5 W/m²
occupancy density4 persons
weather fileEnergyPlus weather file
COP2.7
Publisher’s Note: MDPI stays neutral with regard to jurisdictional claims in published maps and institutional affiliations.

