
Mechanical Characteristics and Acoustic Emission Characteristics of Mortar-Rock Binary Medium


Abstract
:1. Introduction
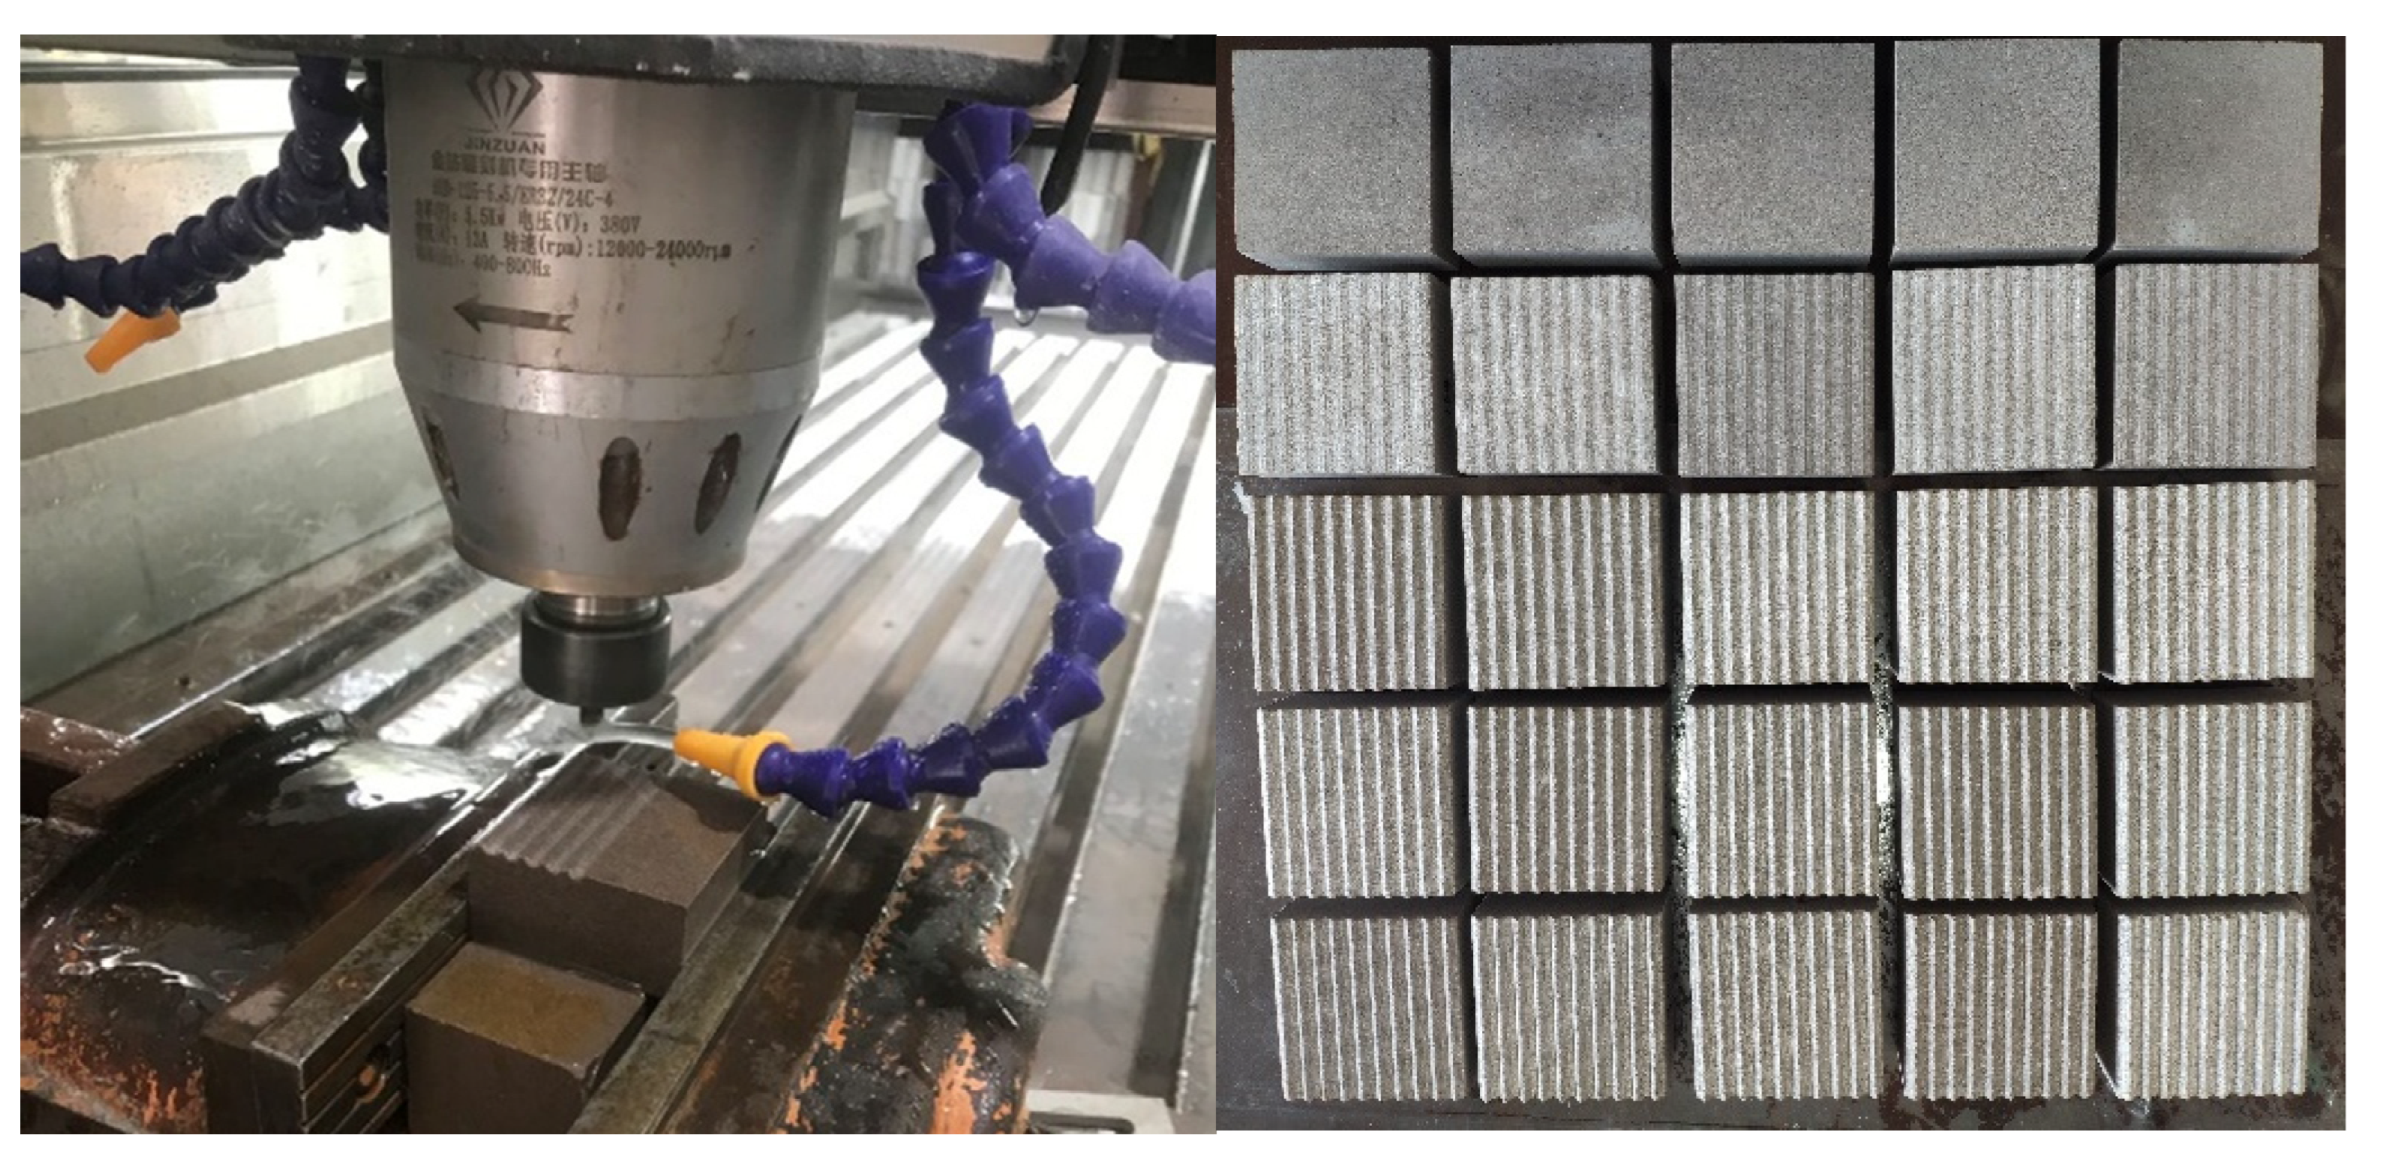
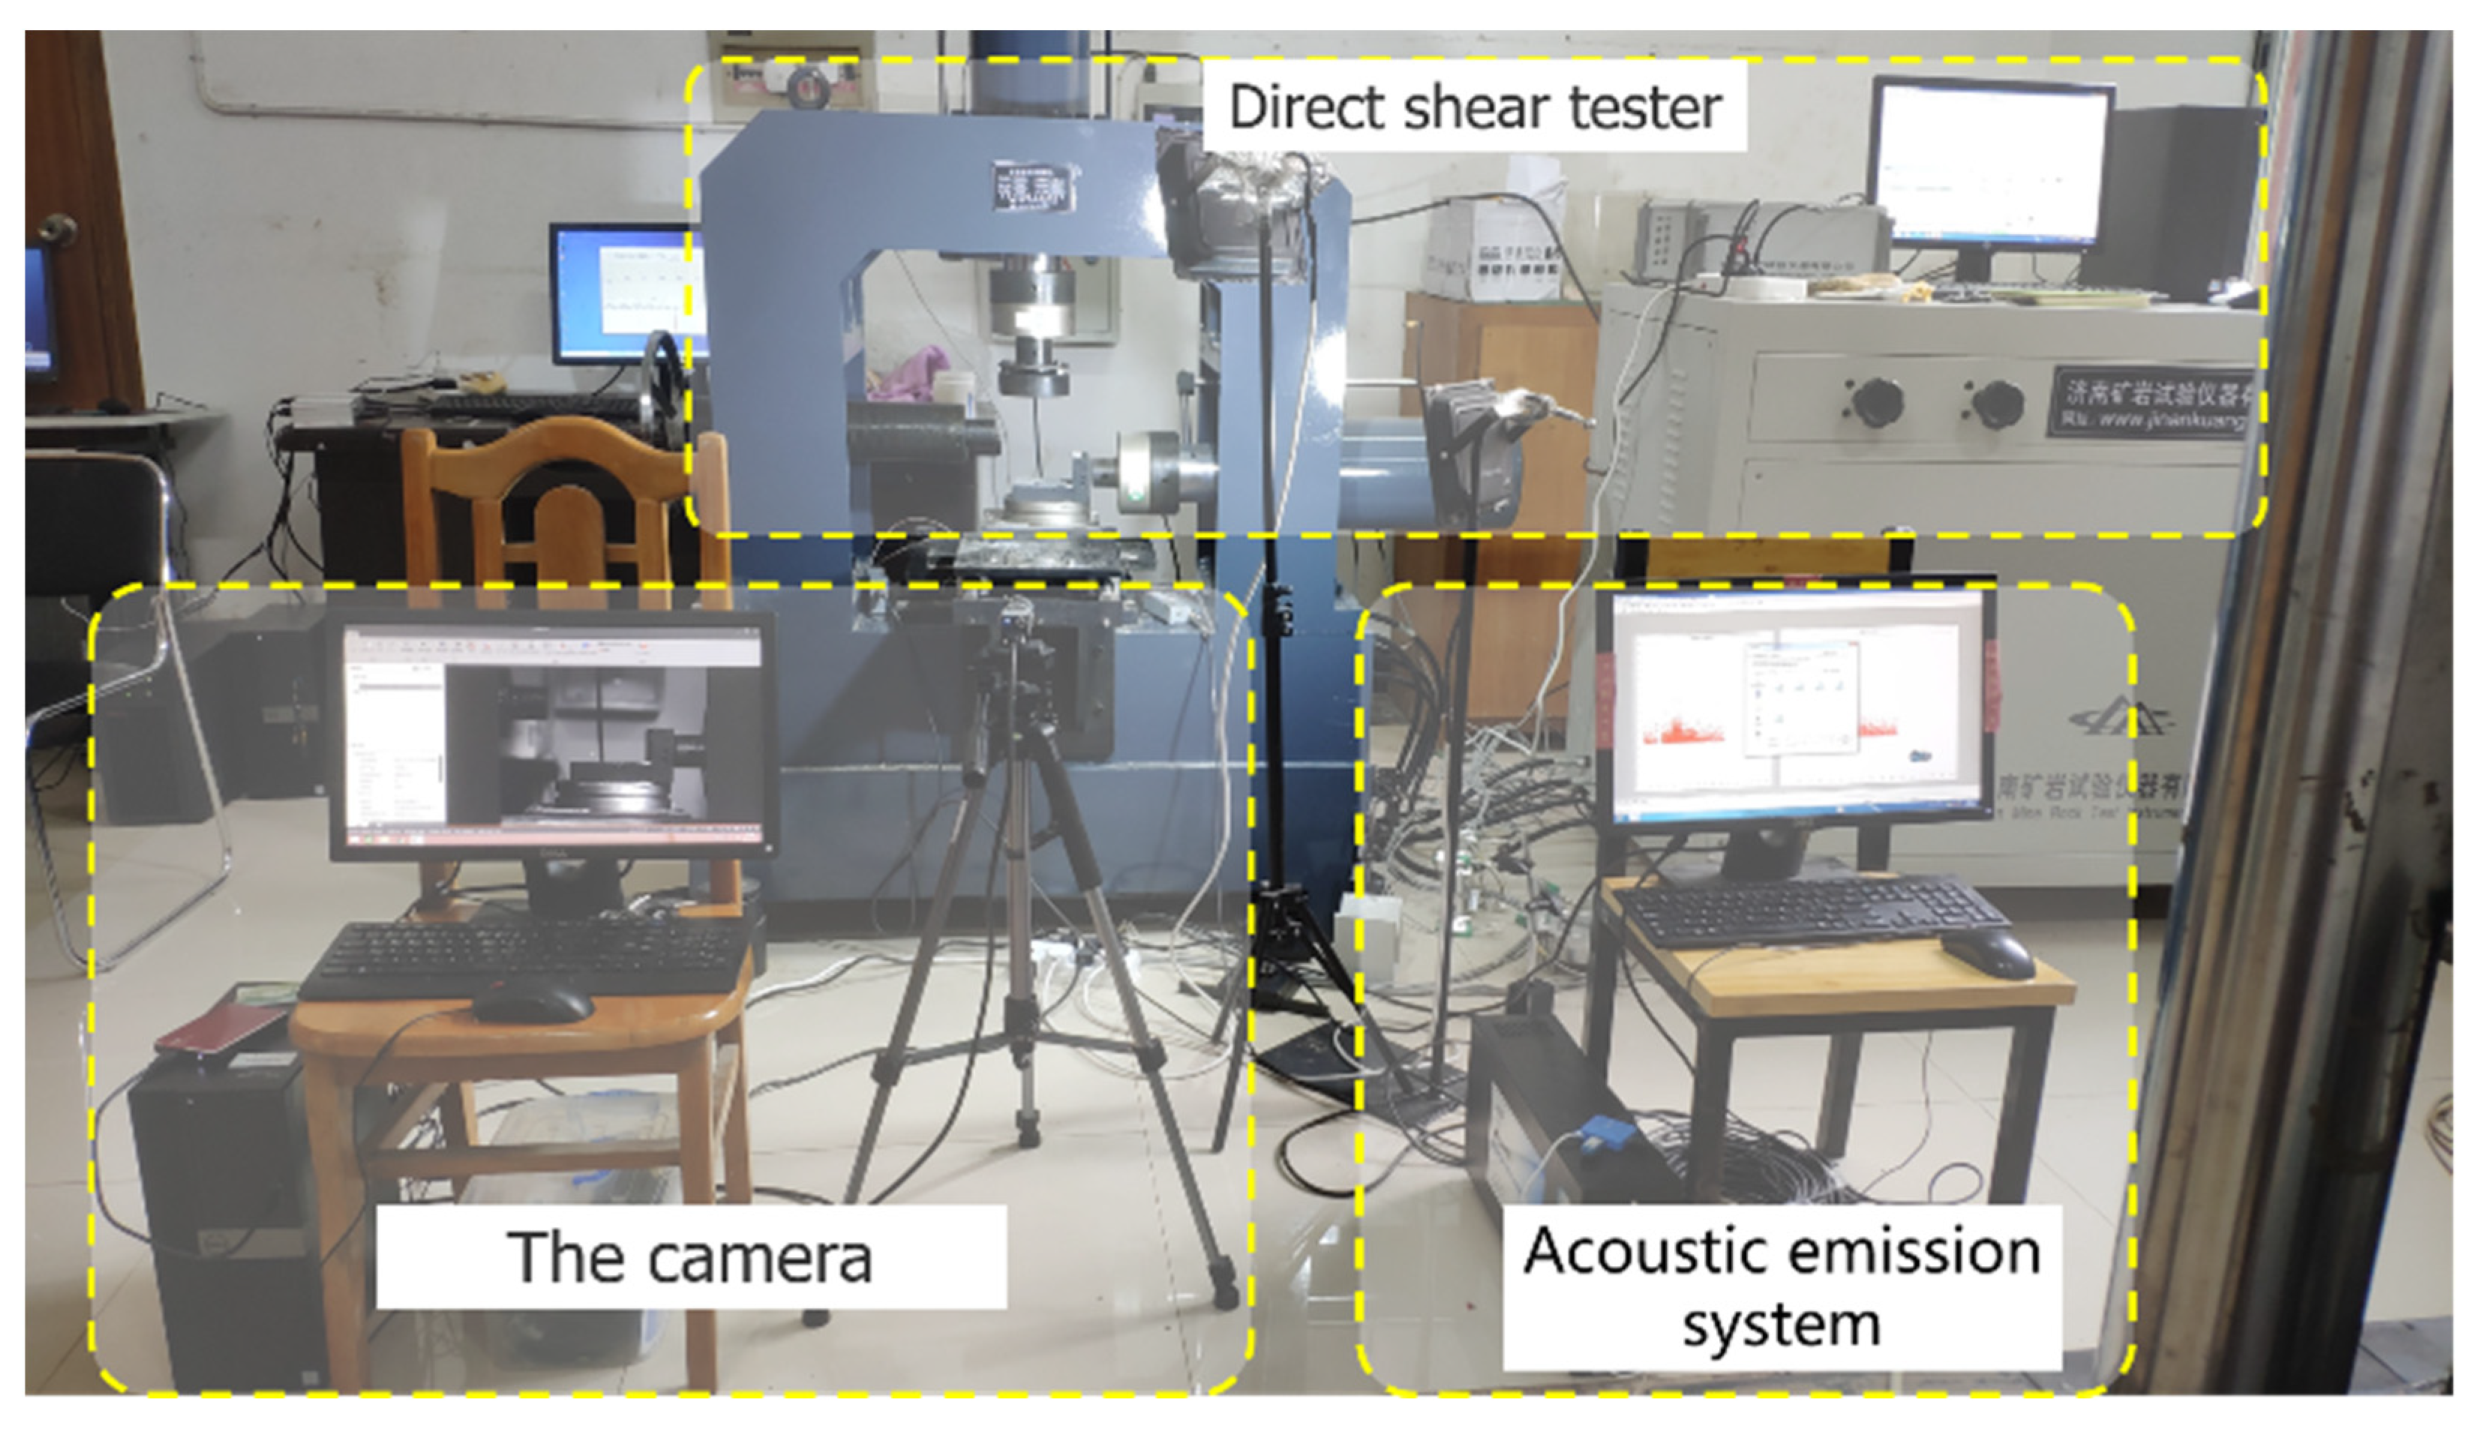
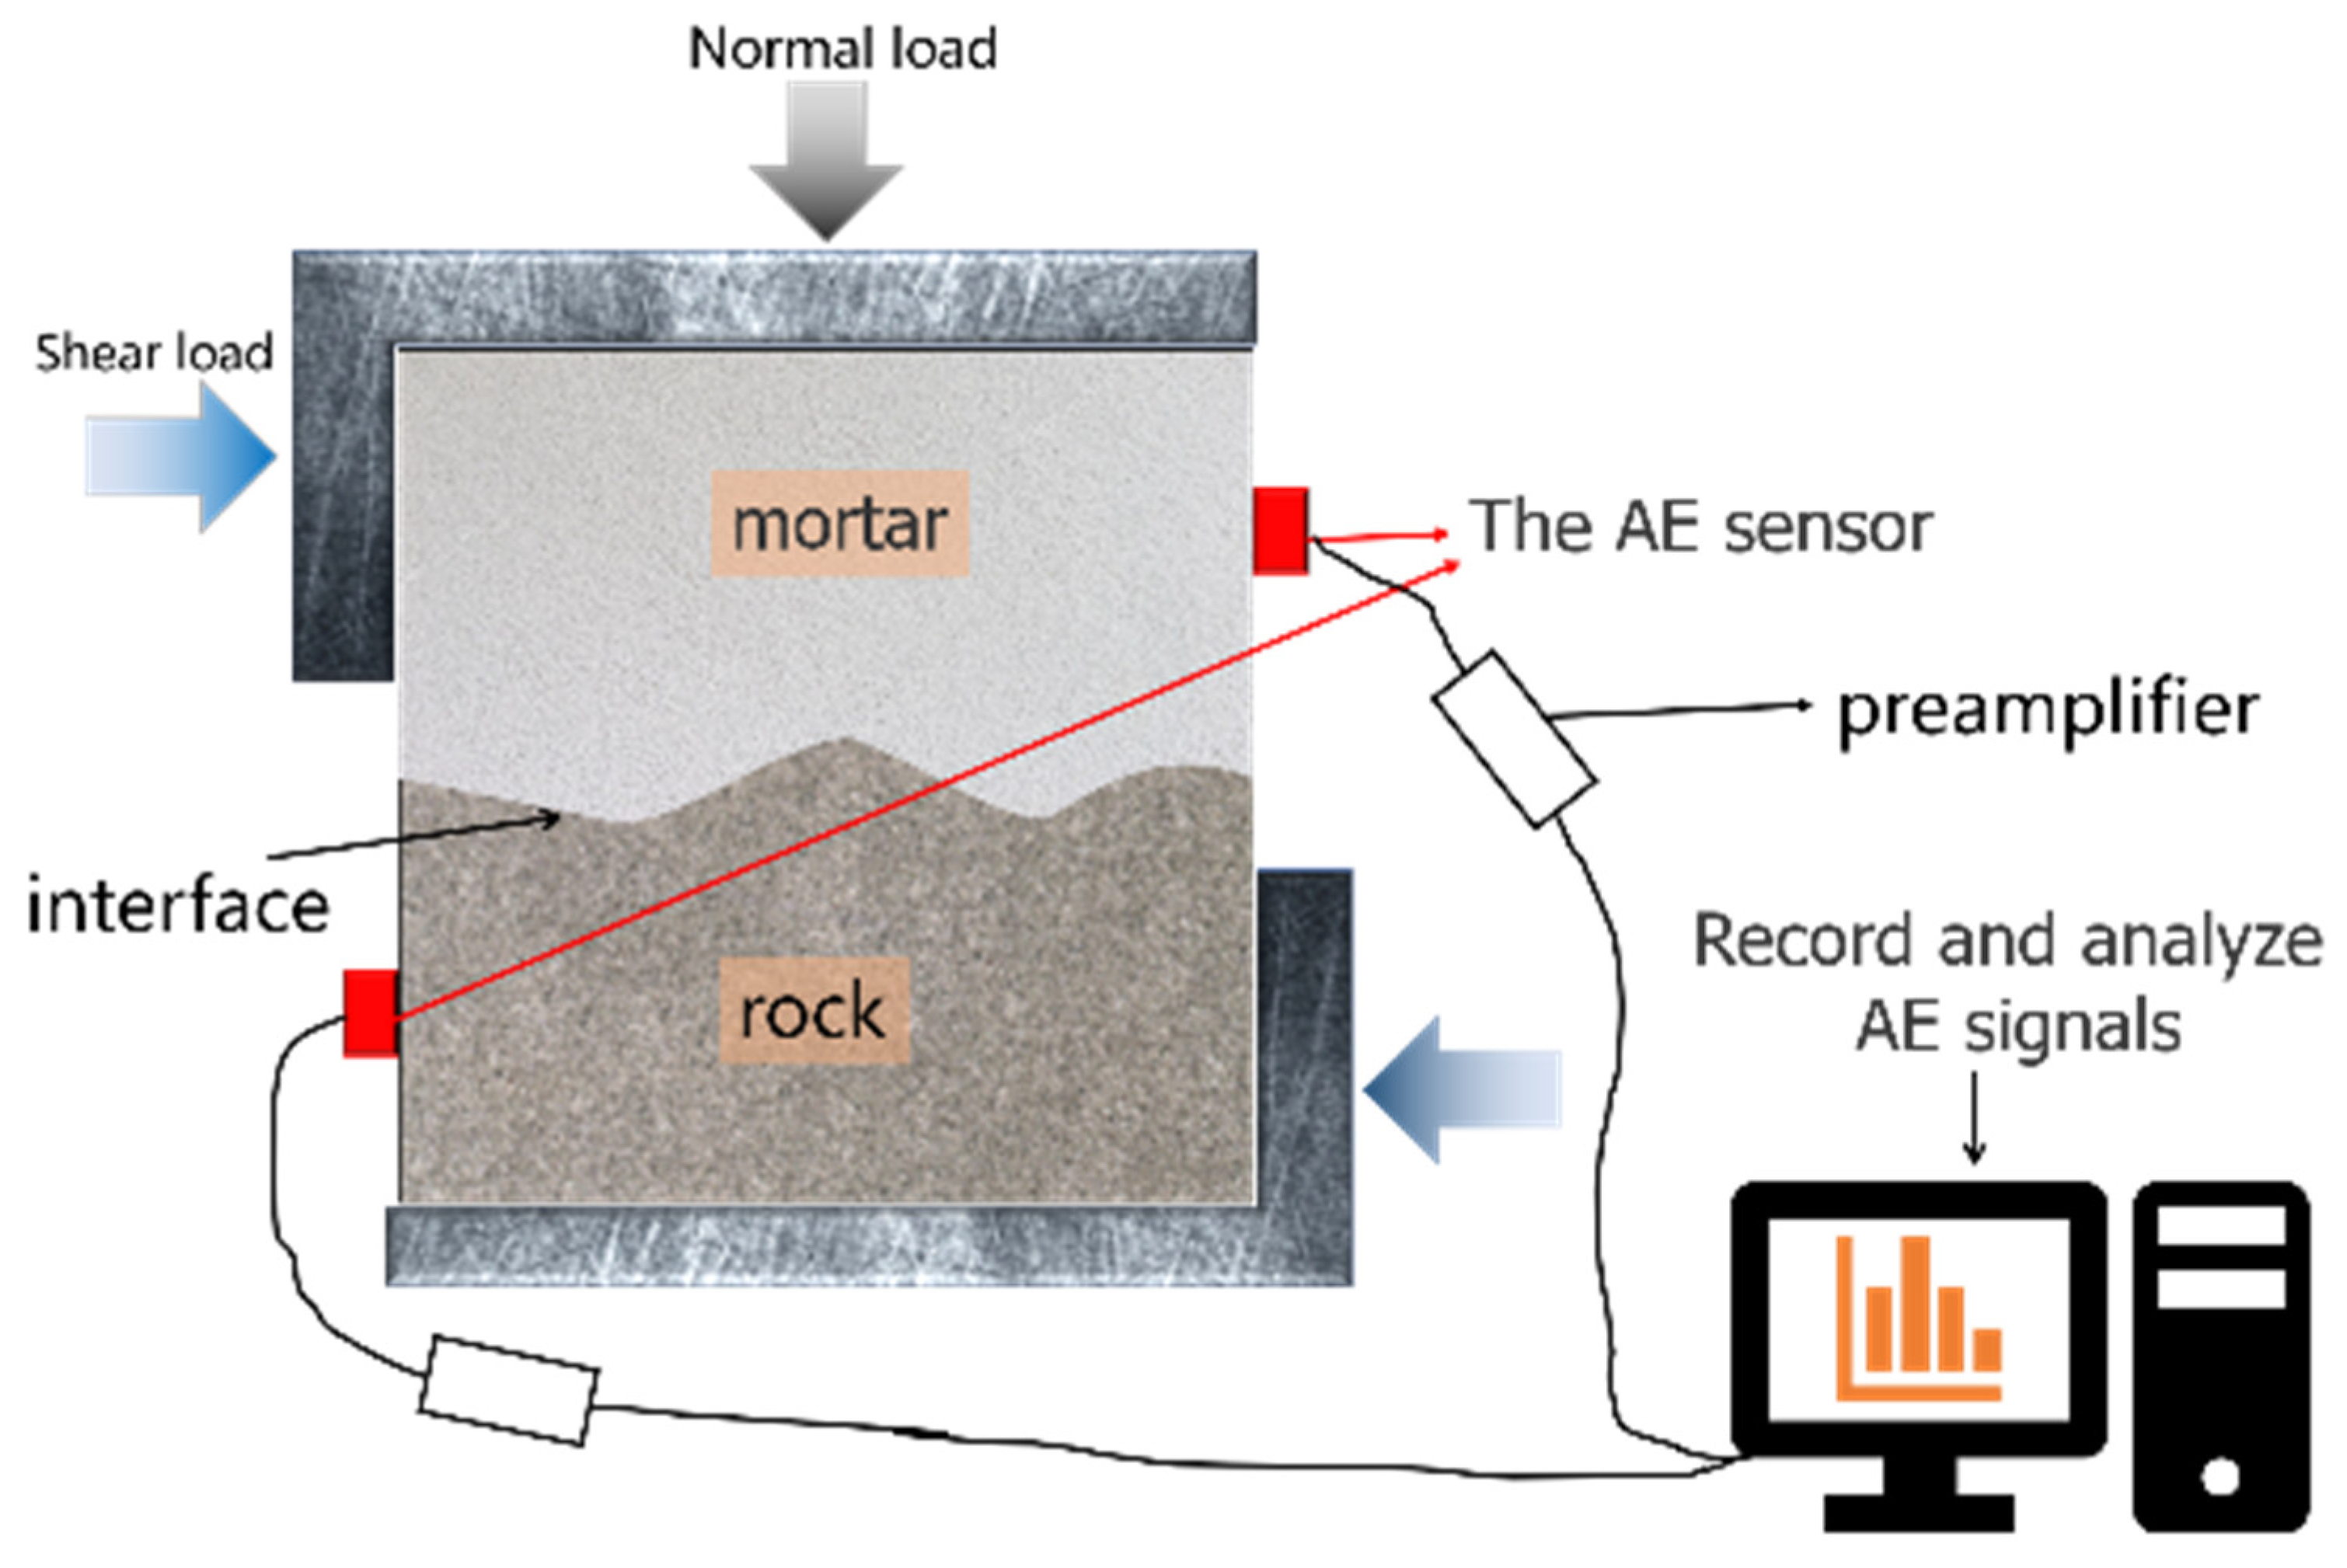
2. Materials and Methods
3. Test Results and Analysis
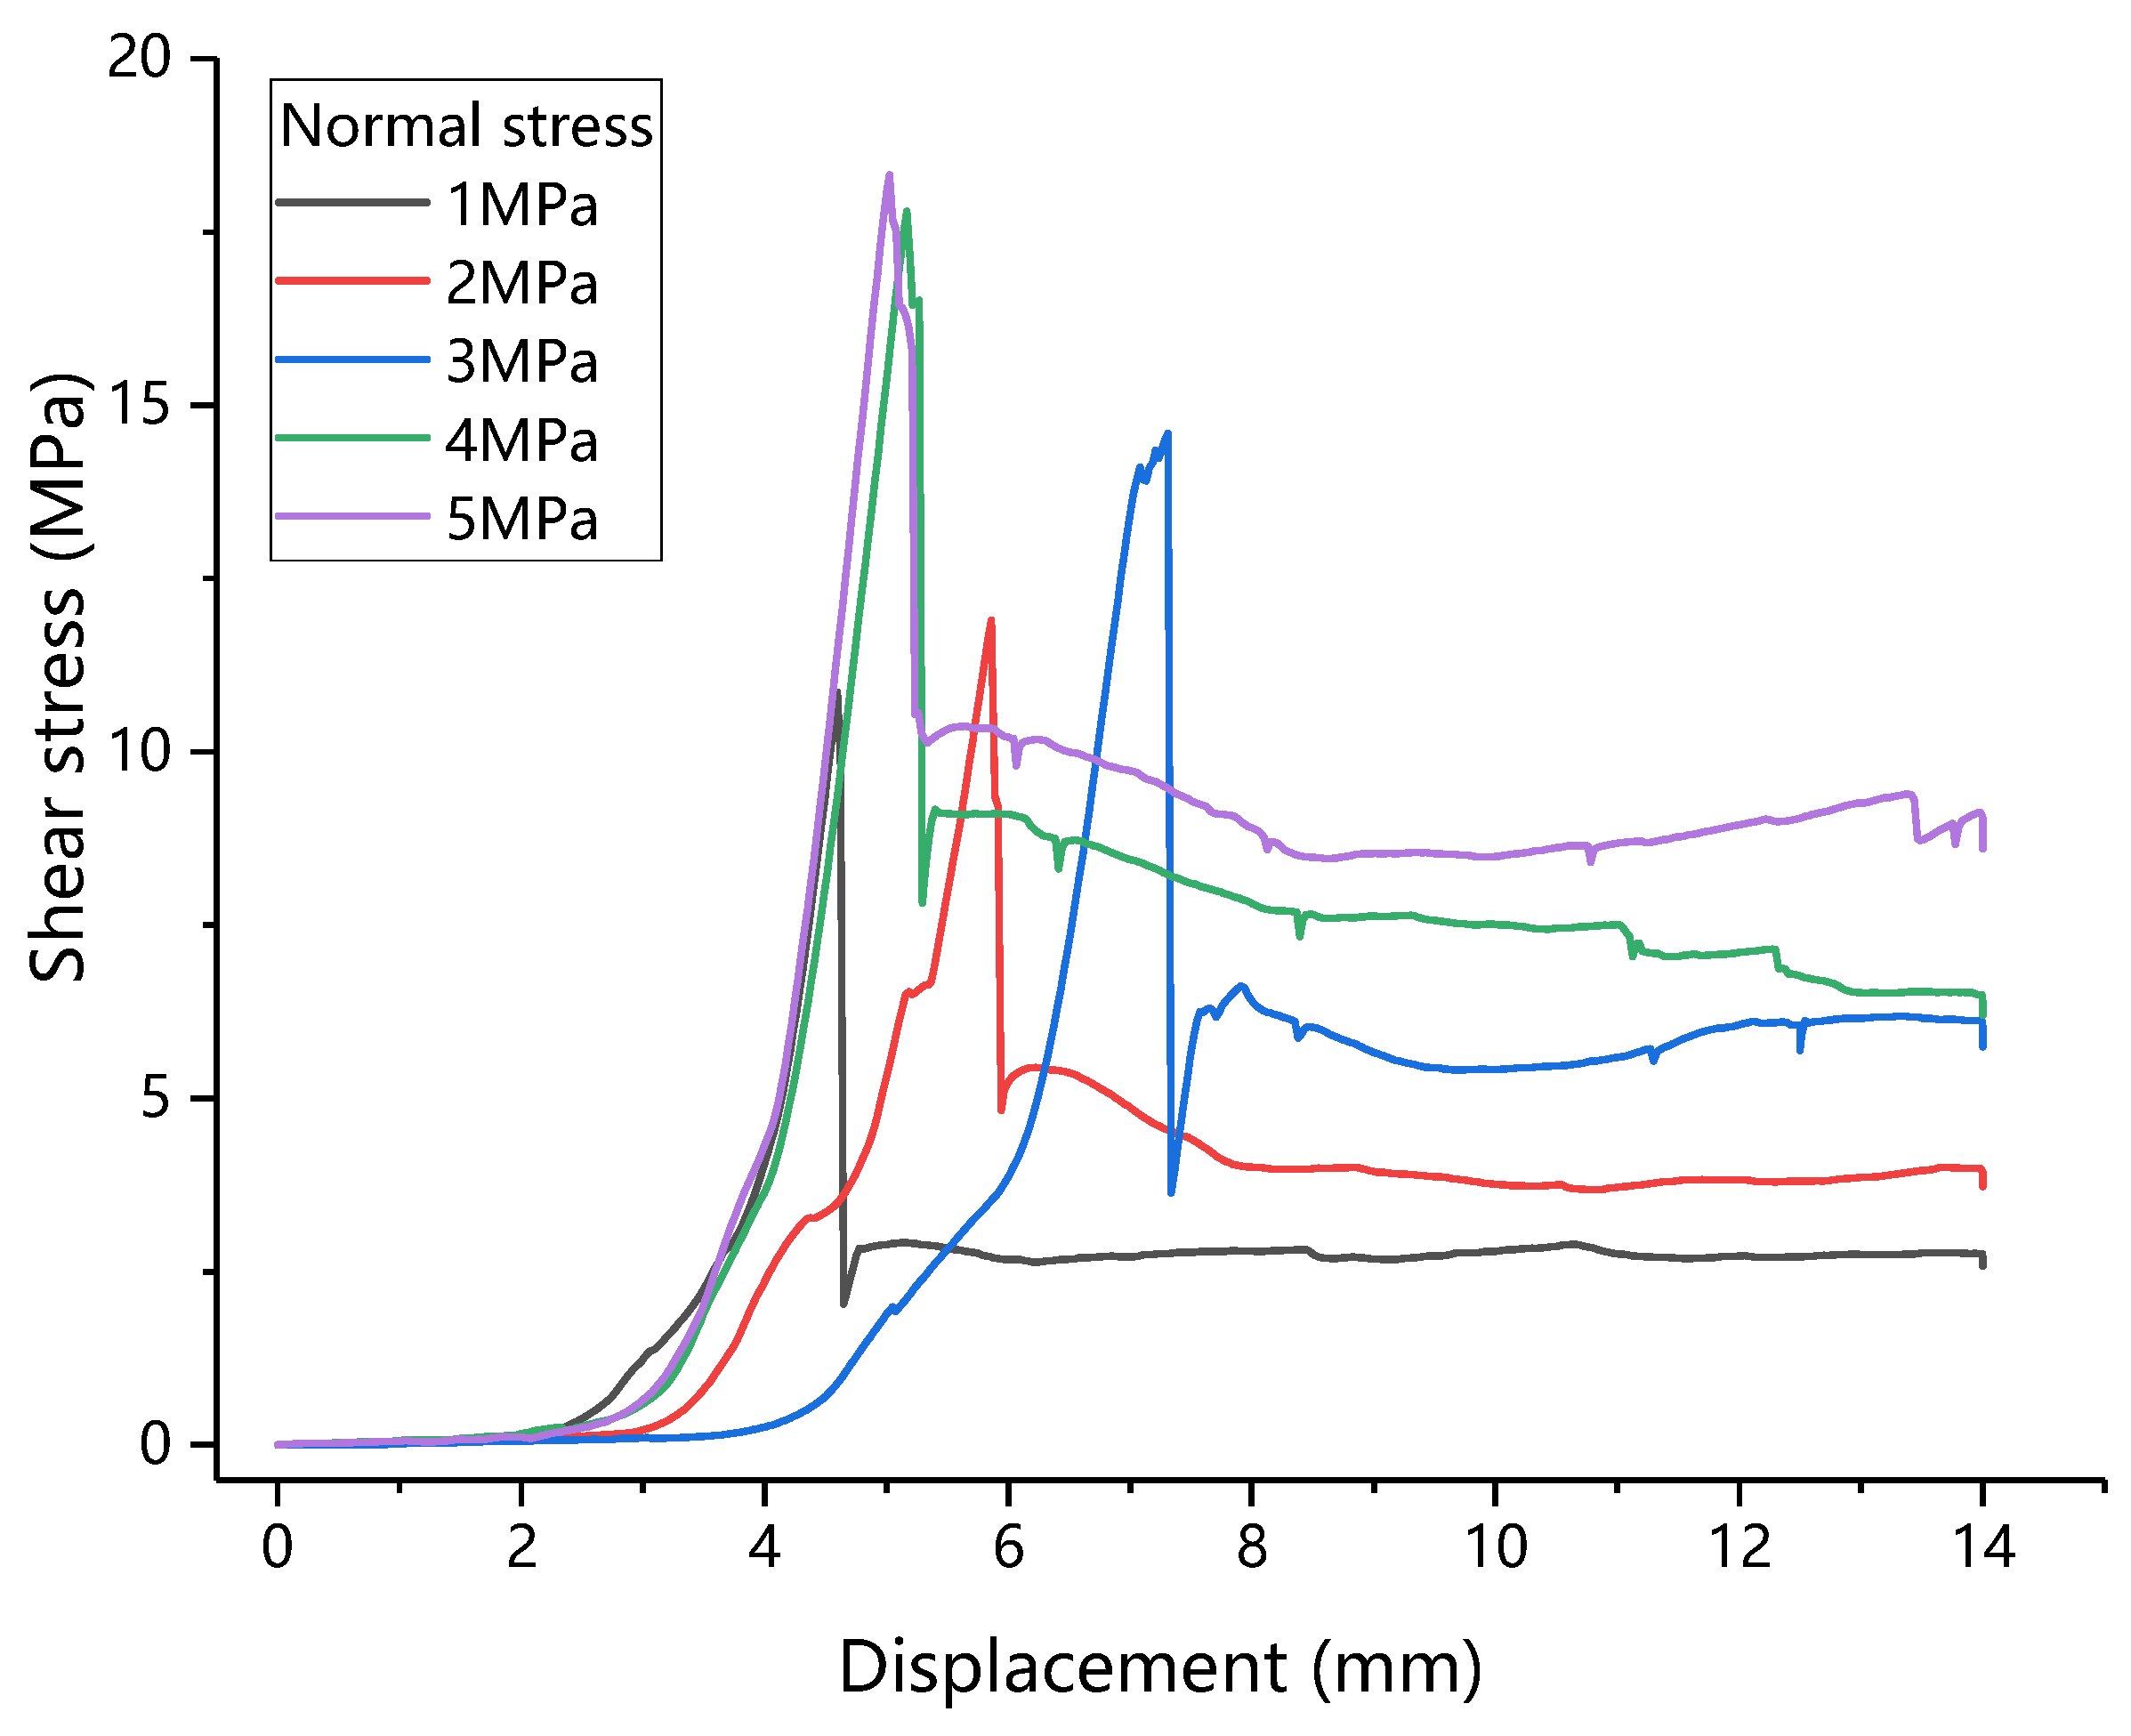
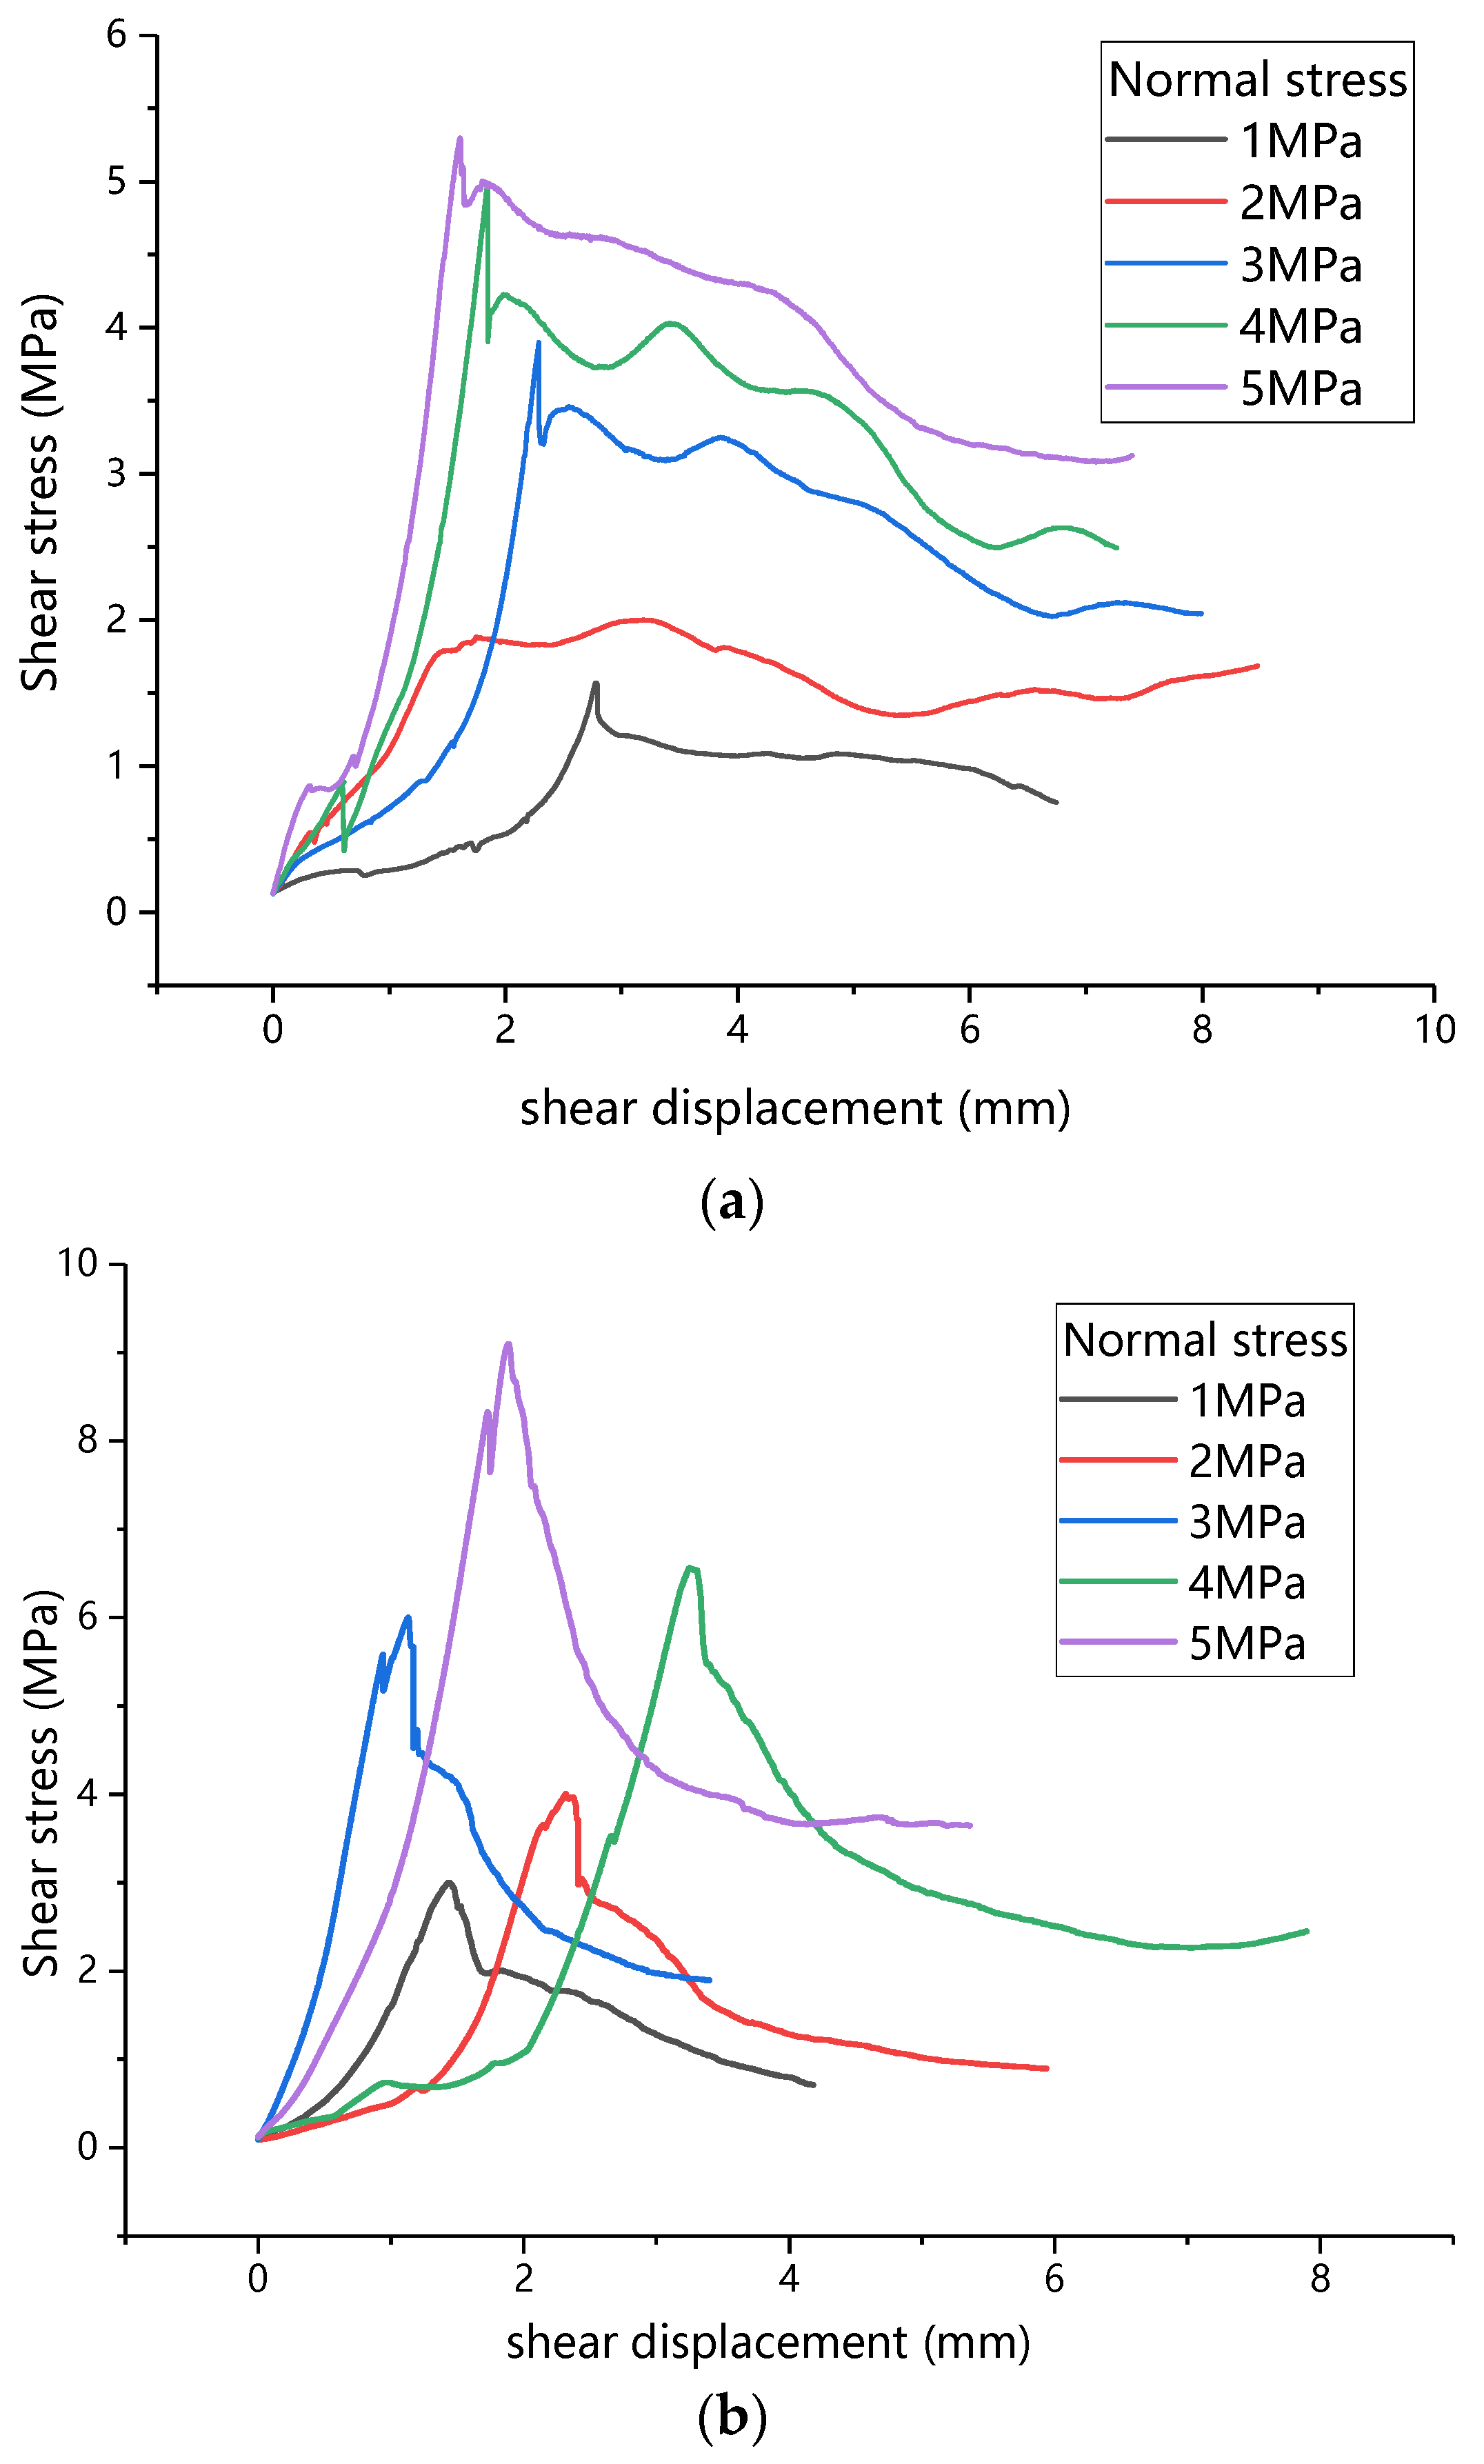
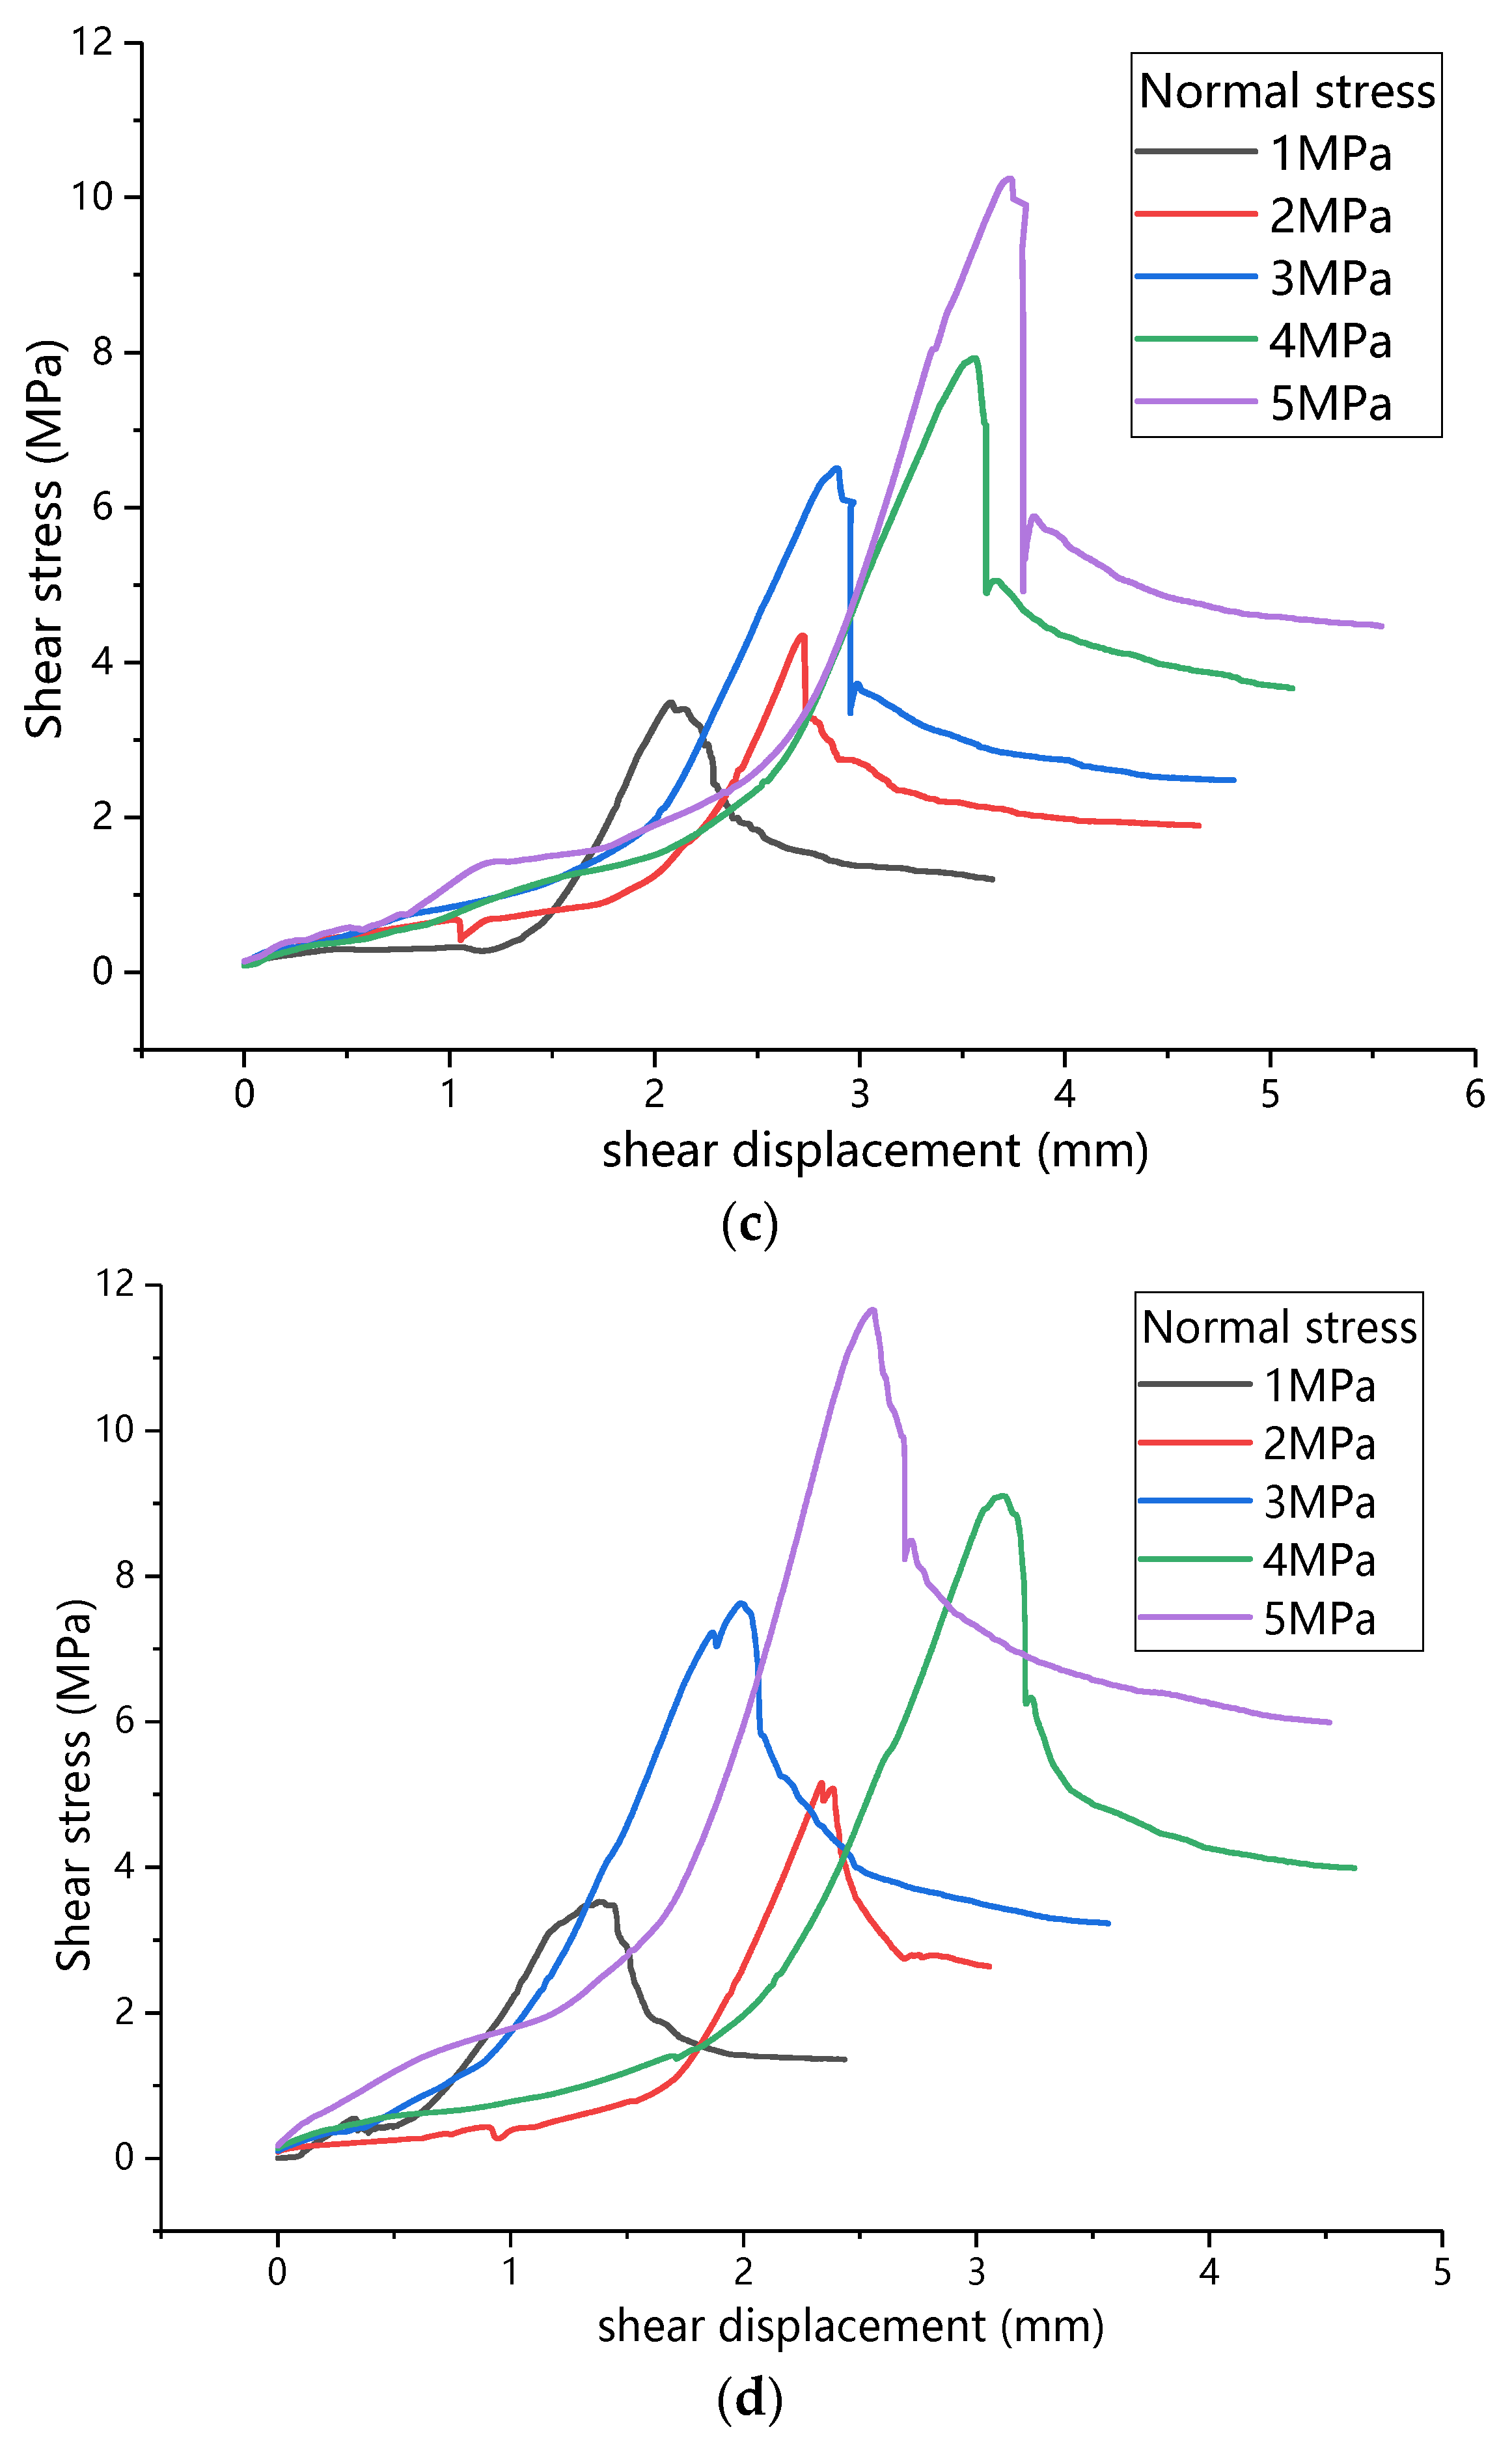
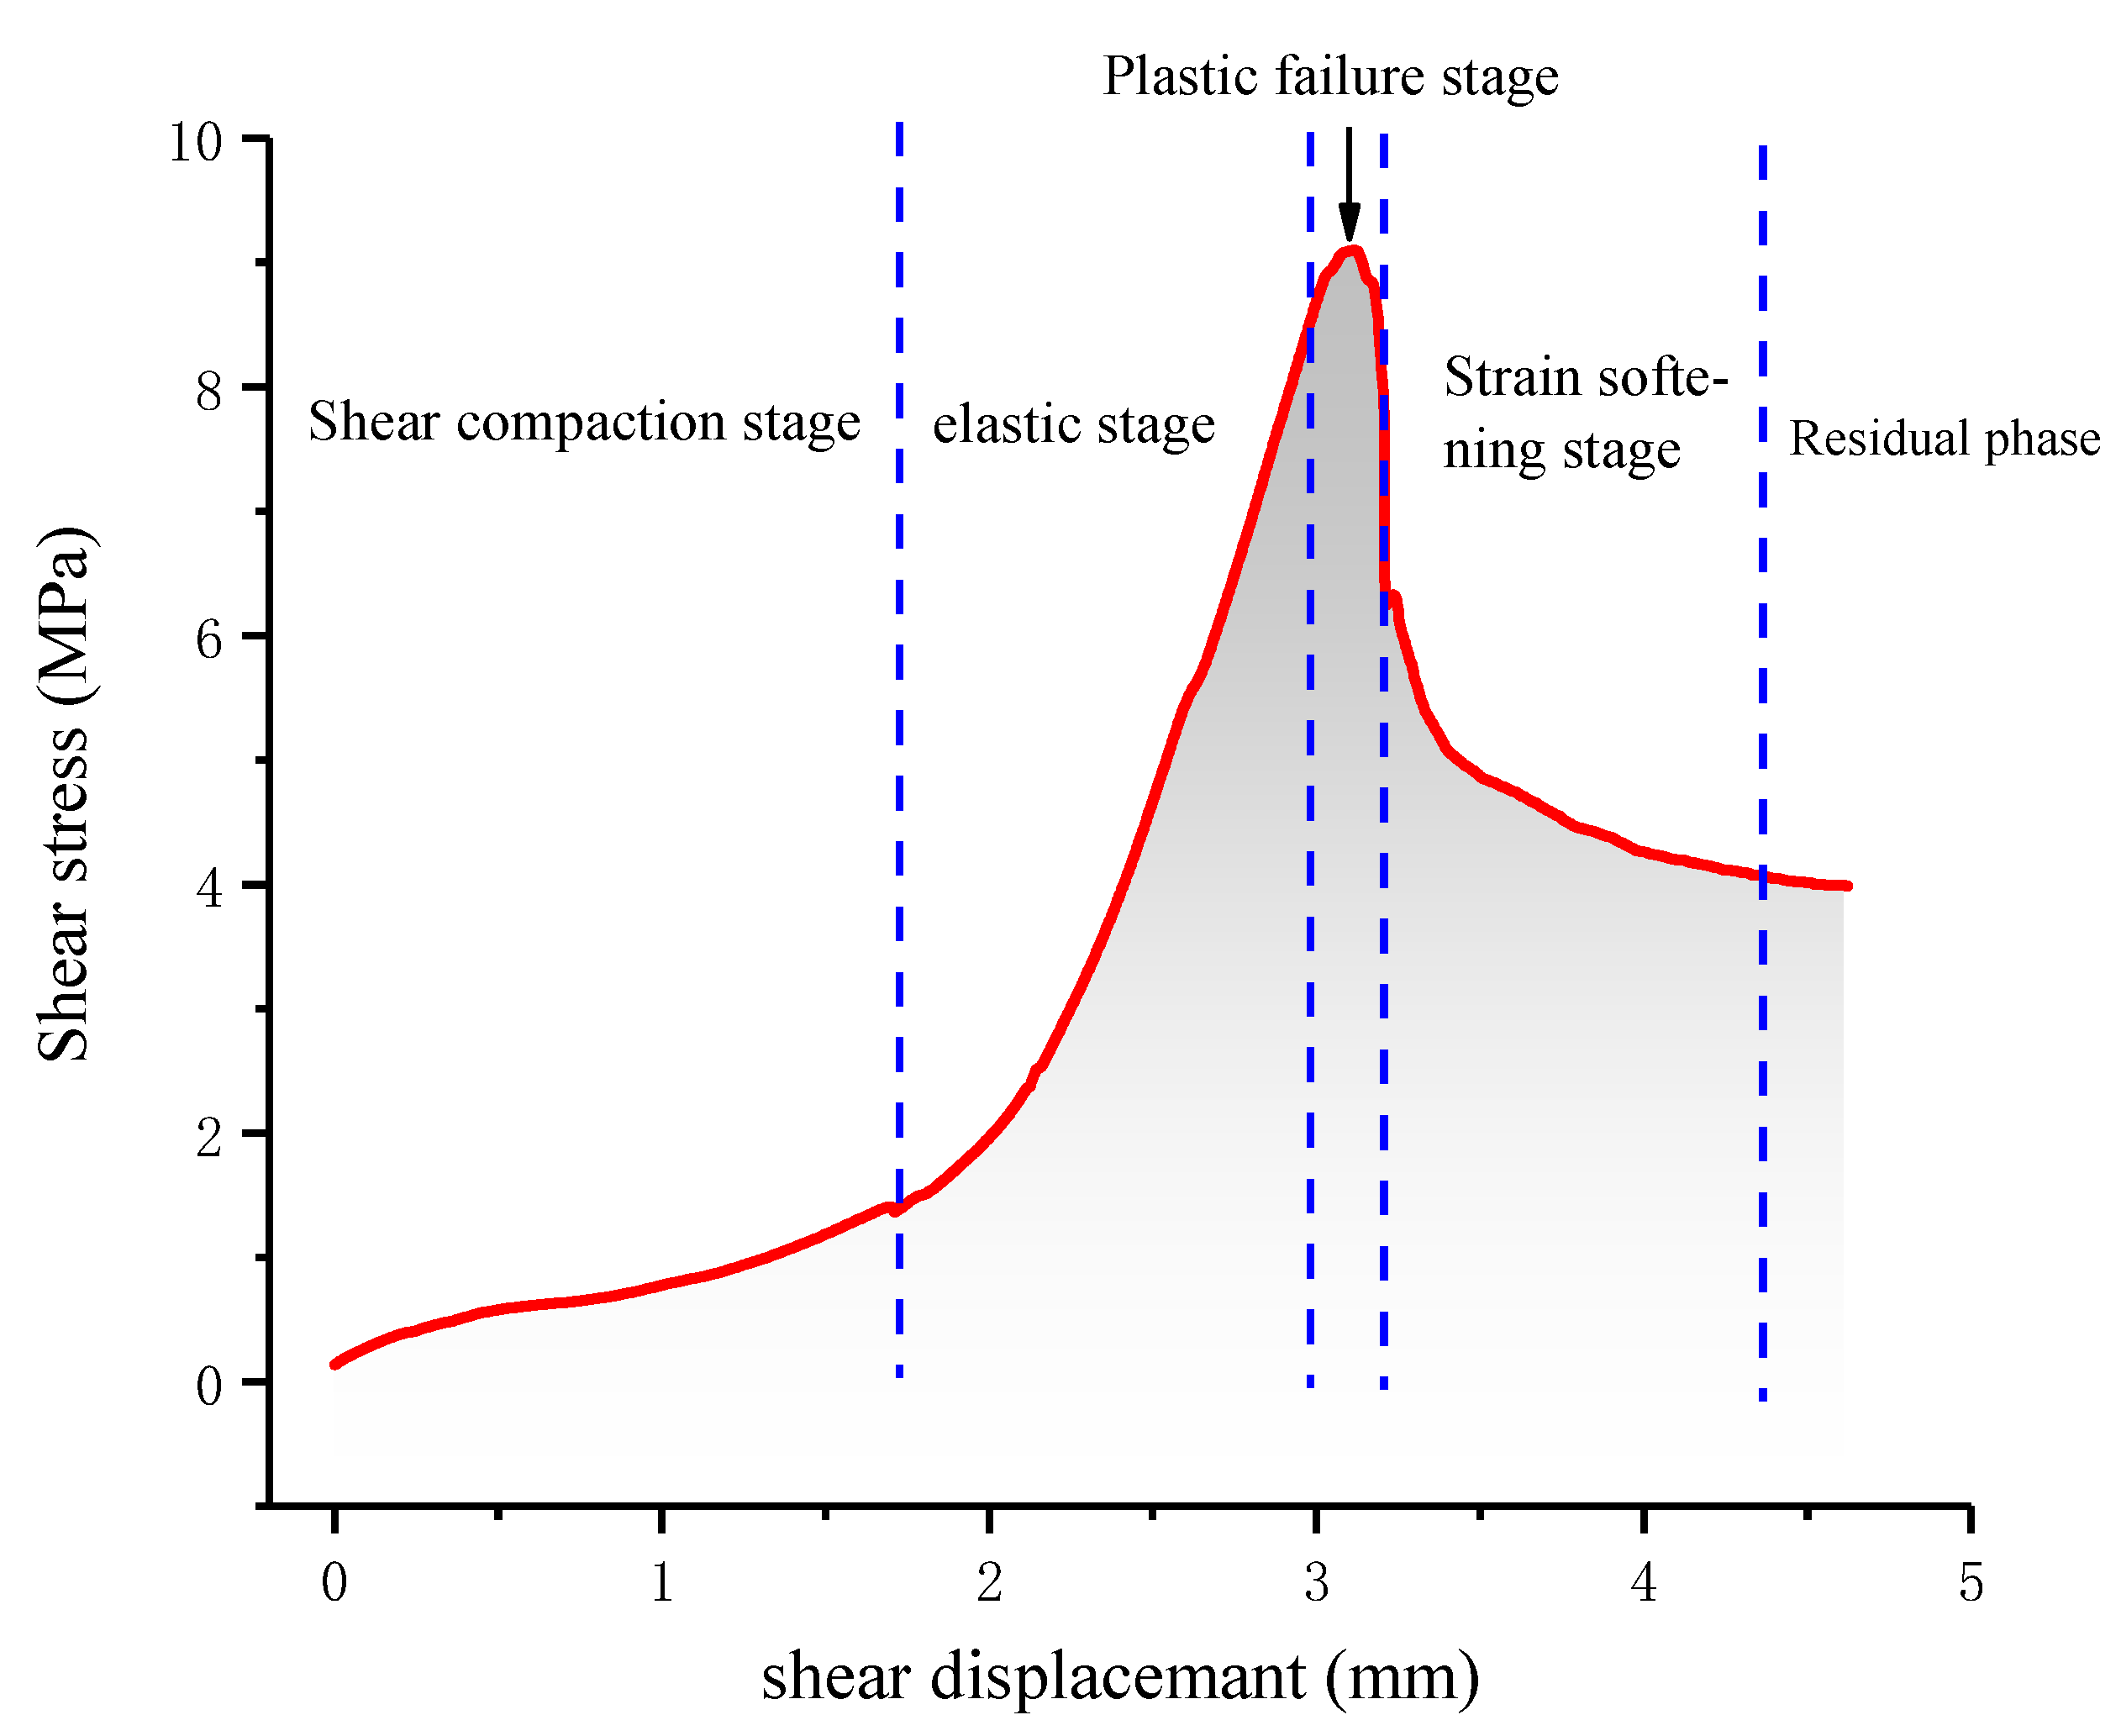
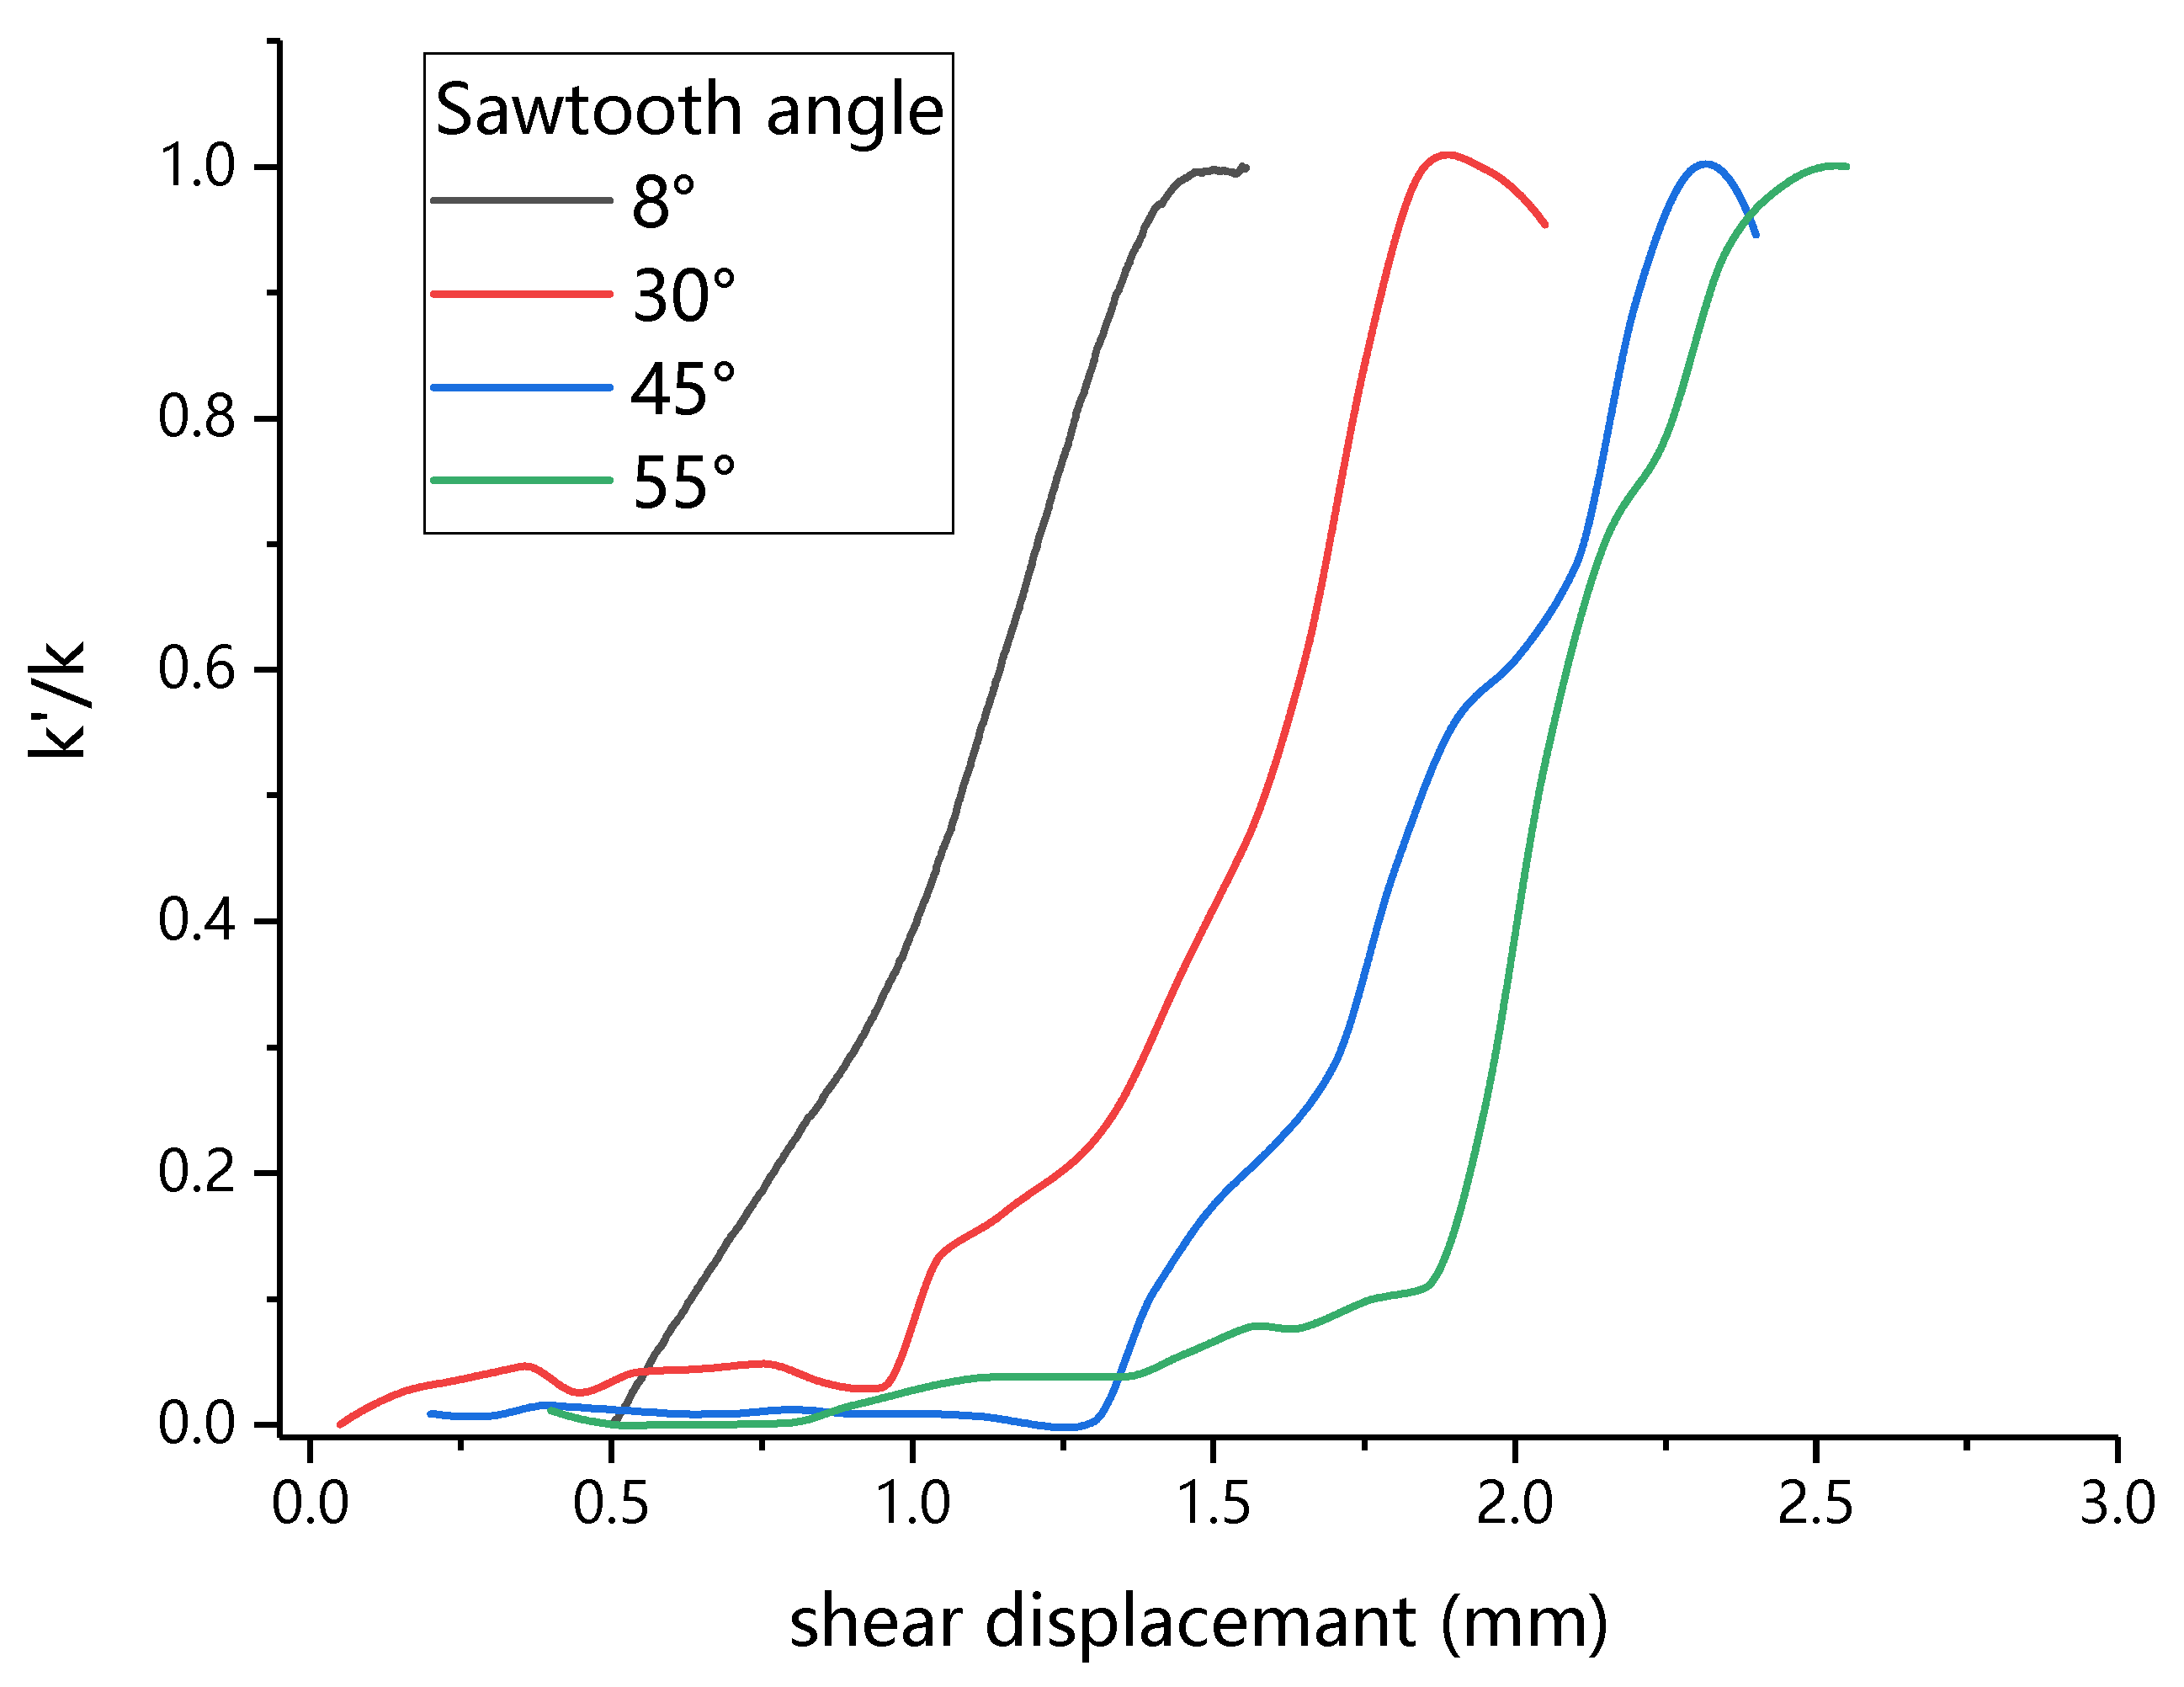
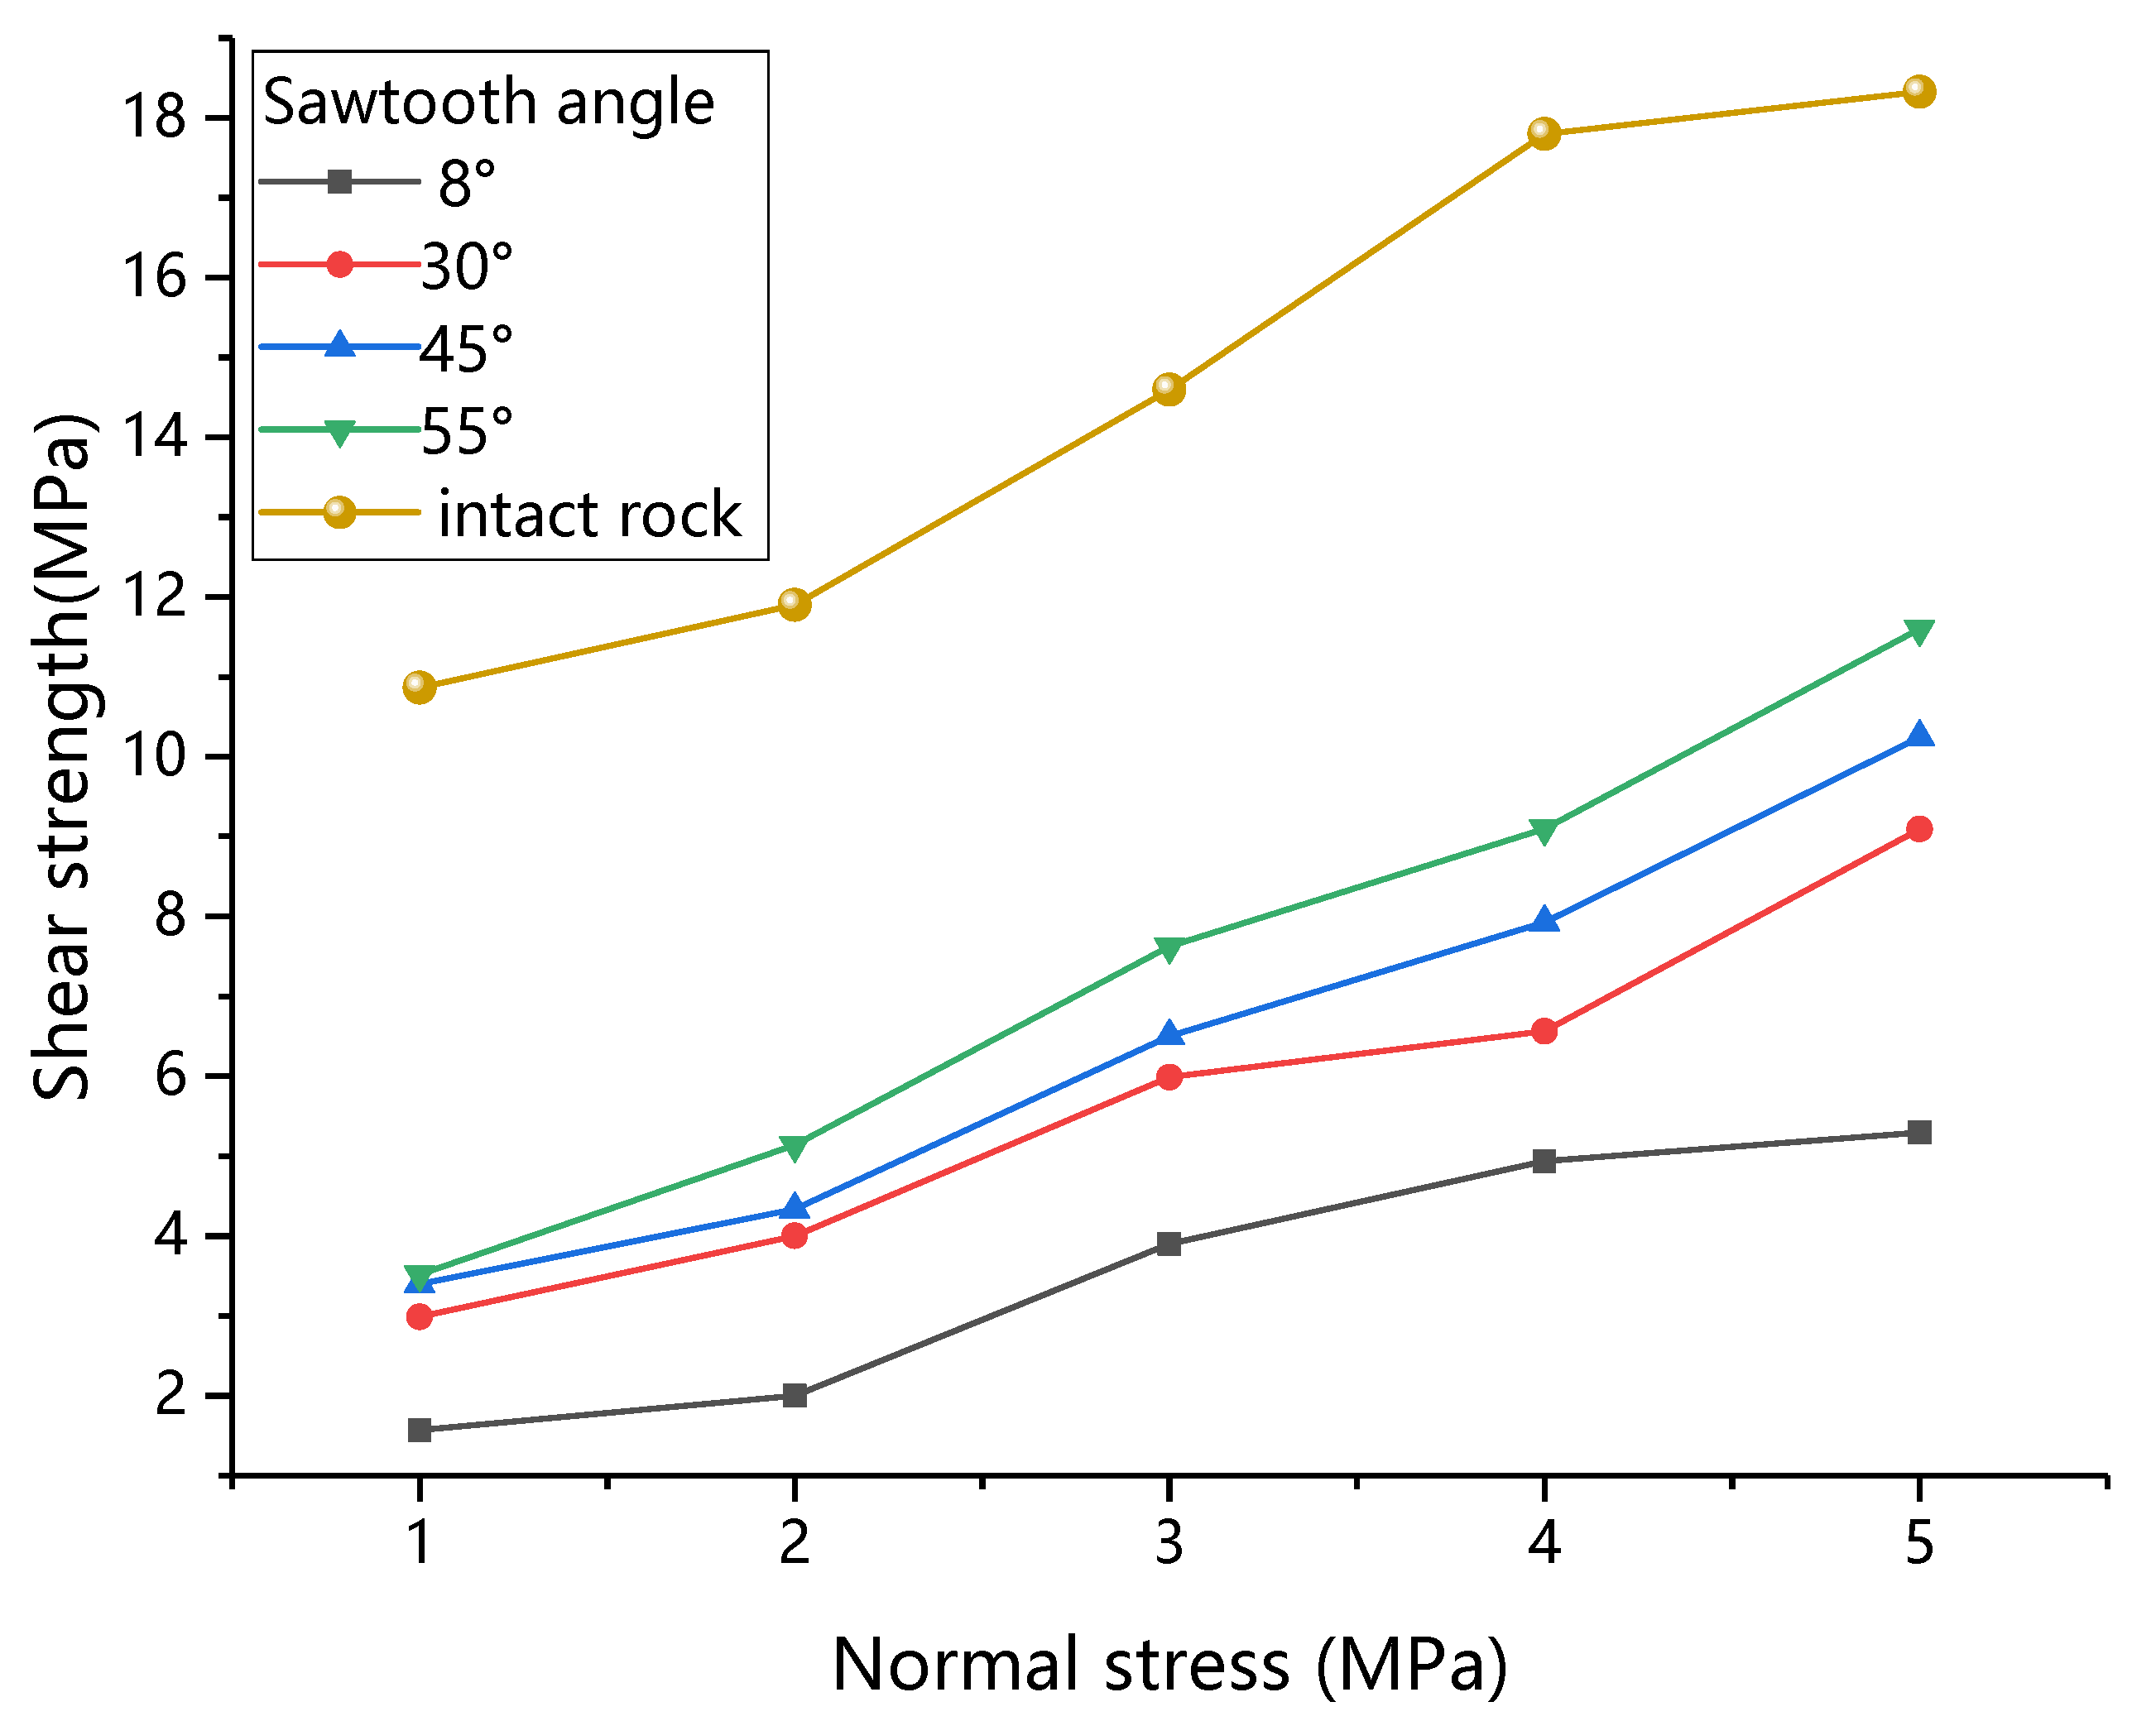
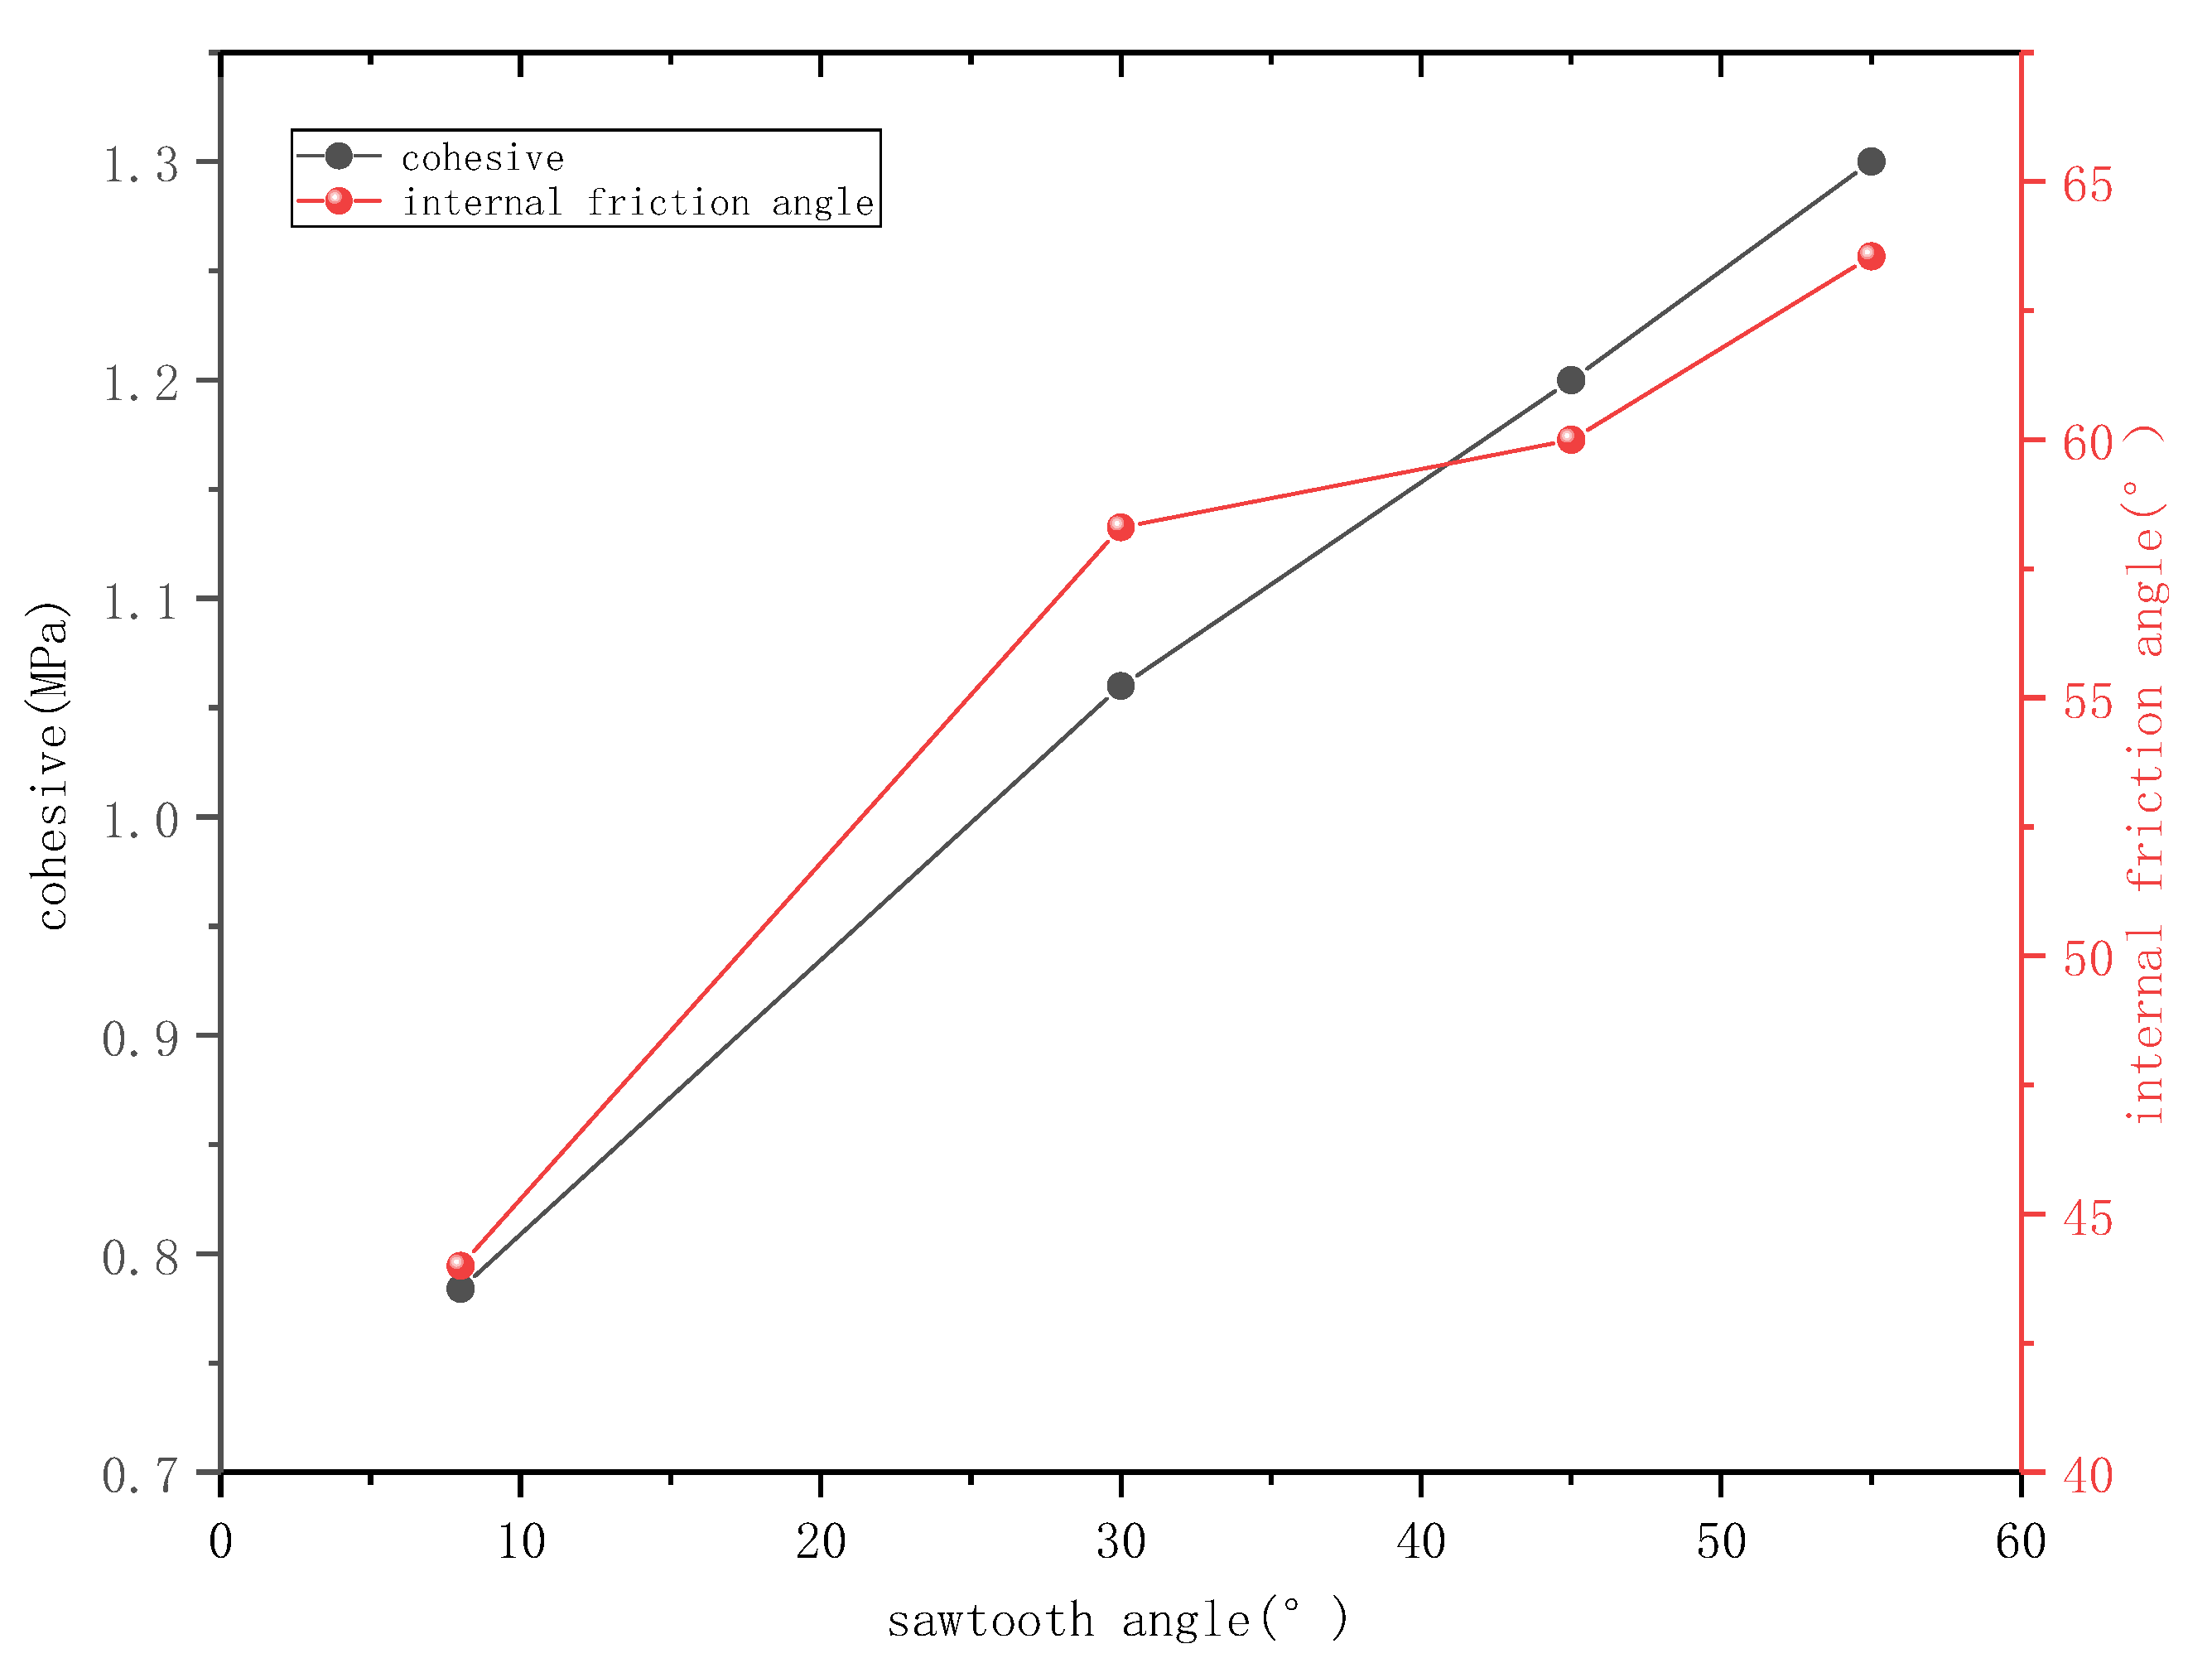
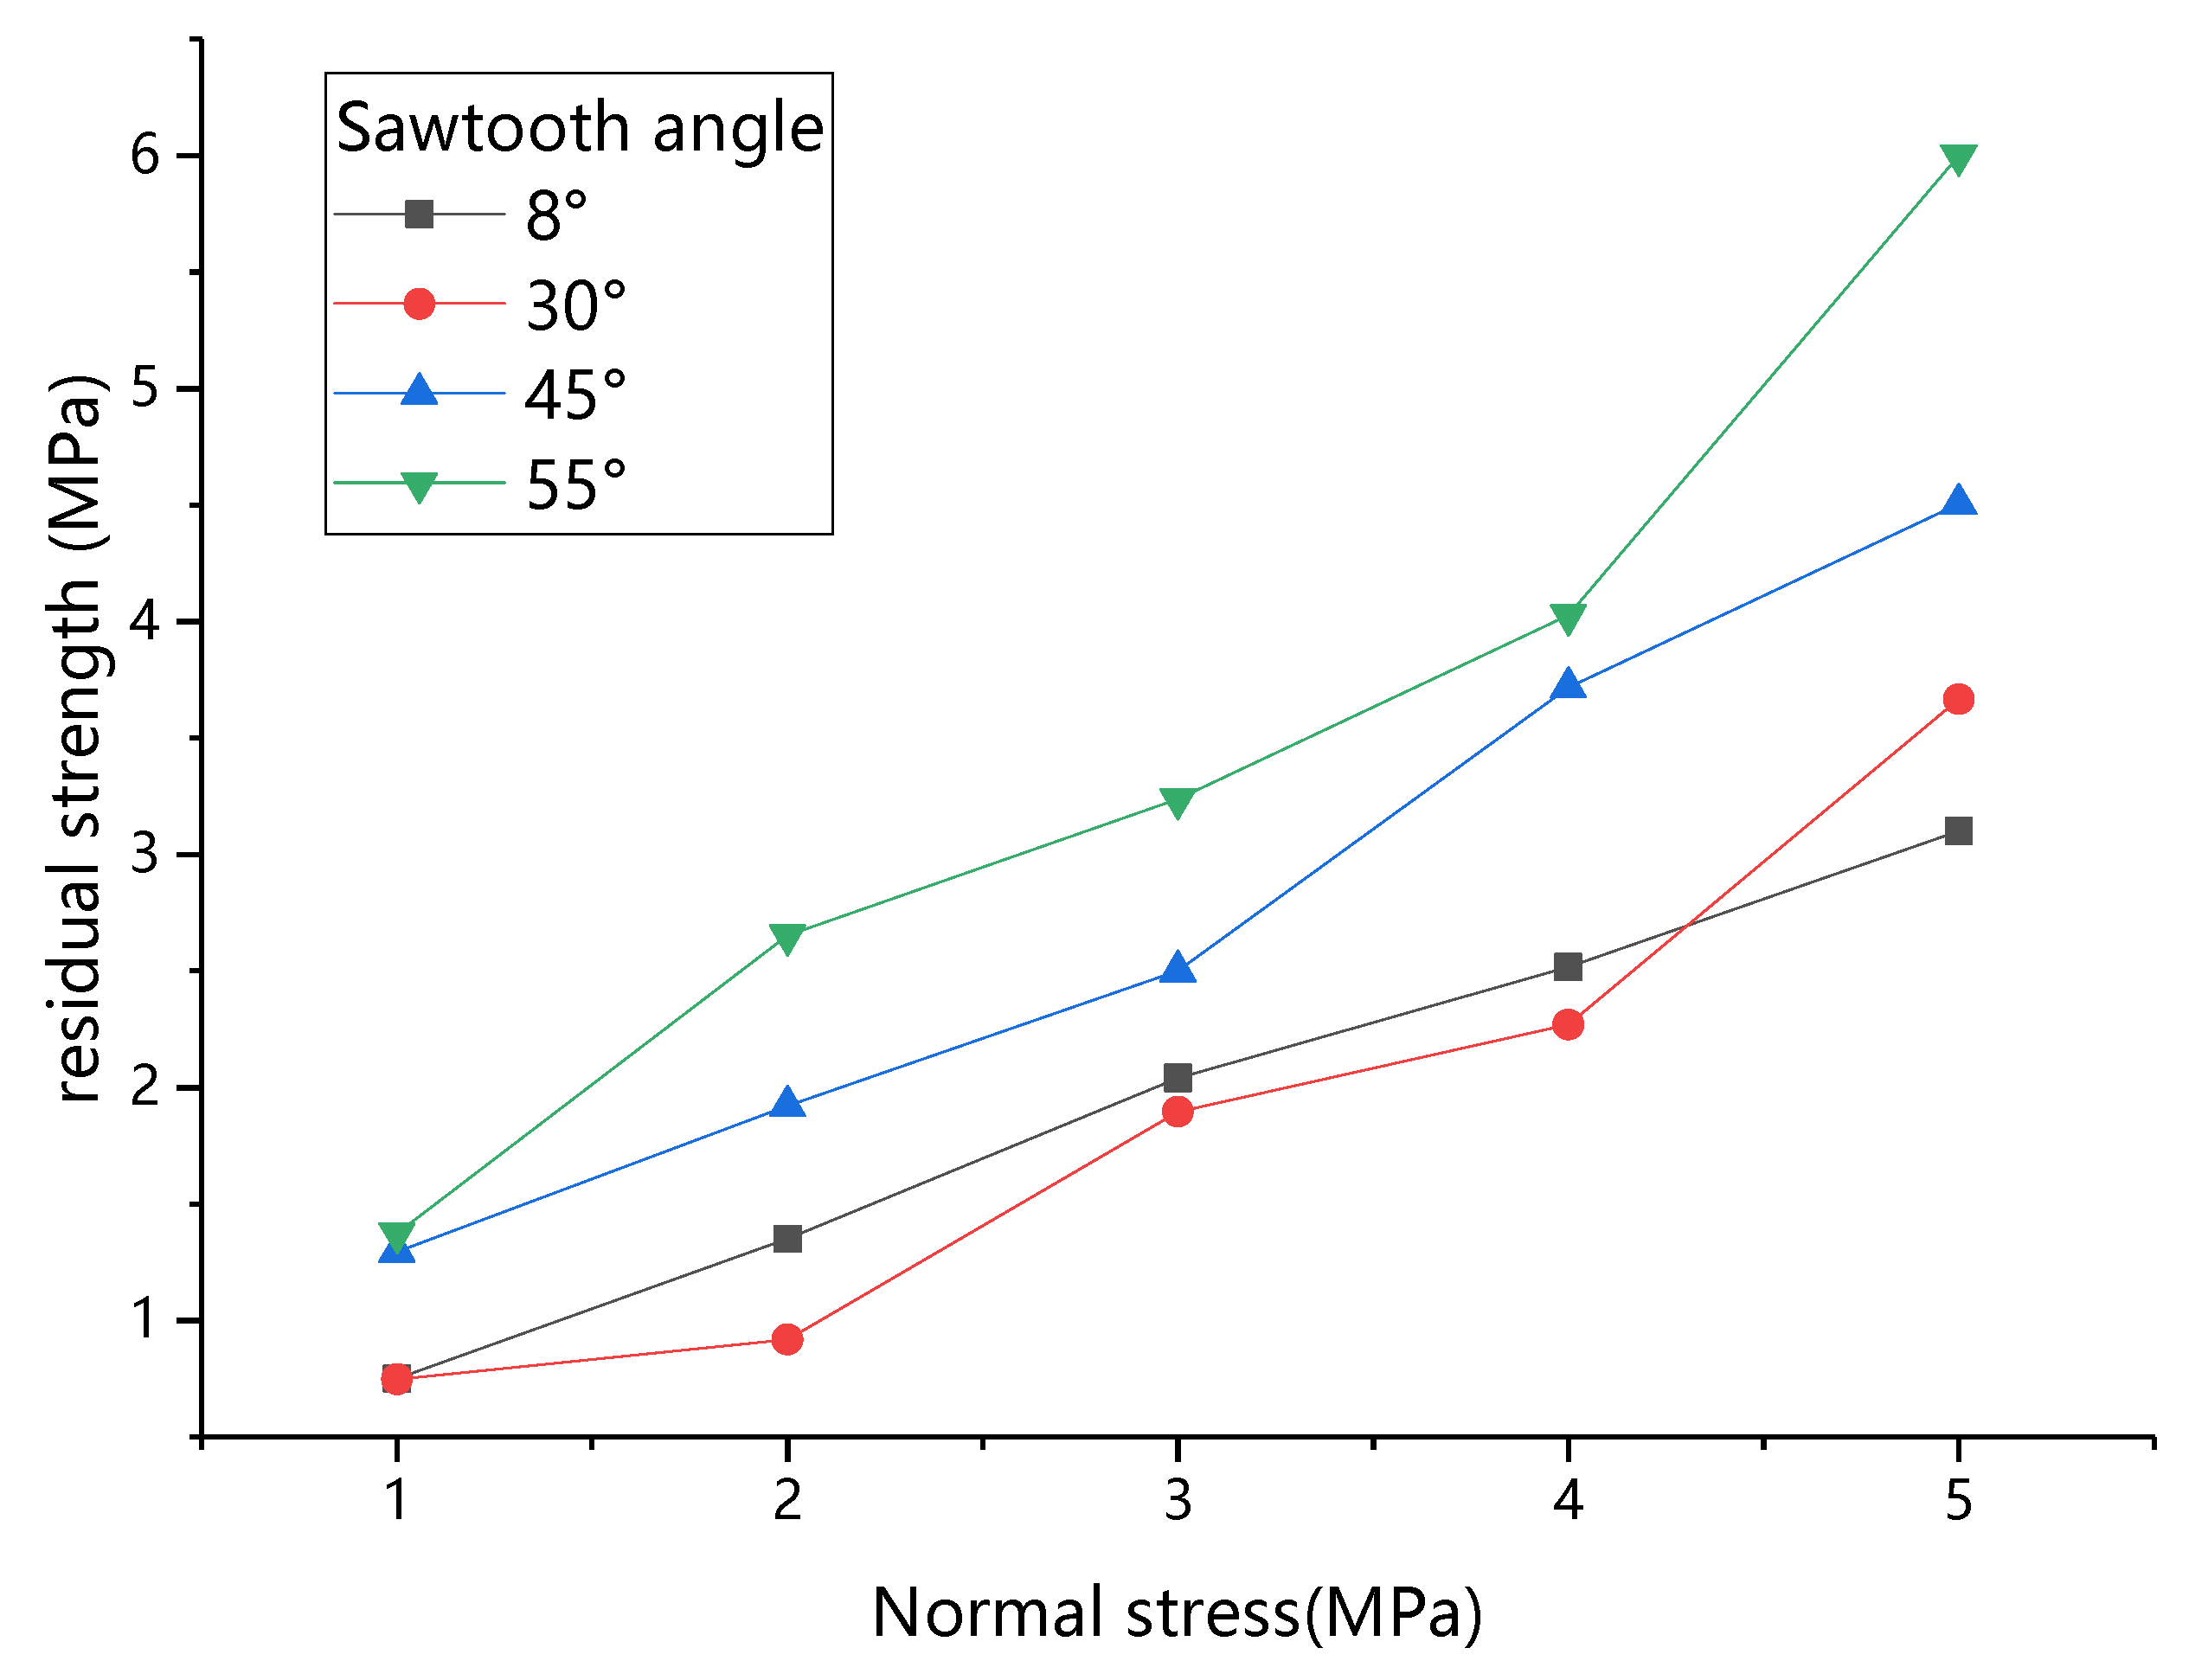
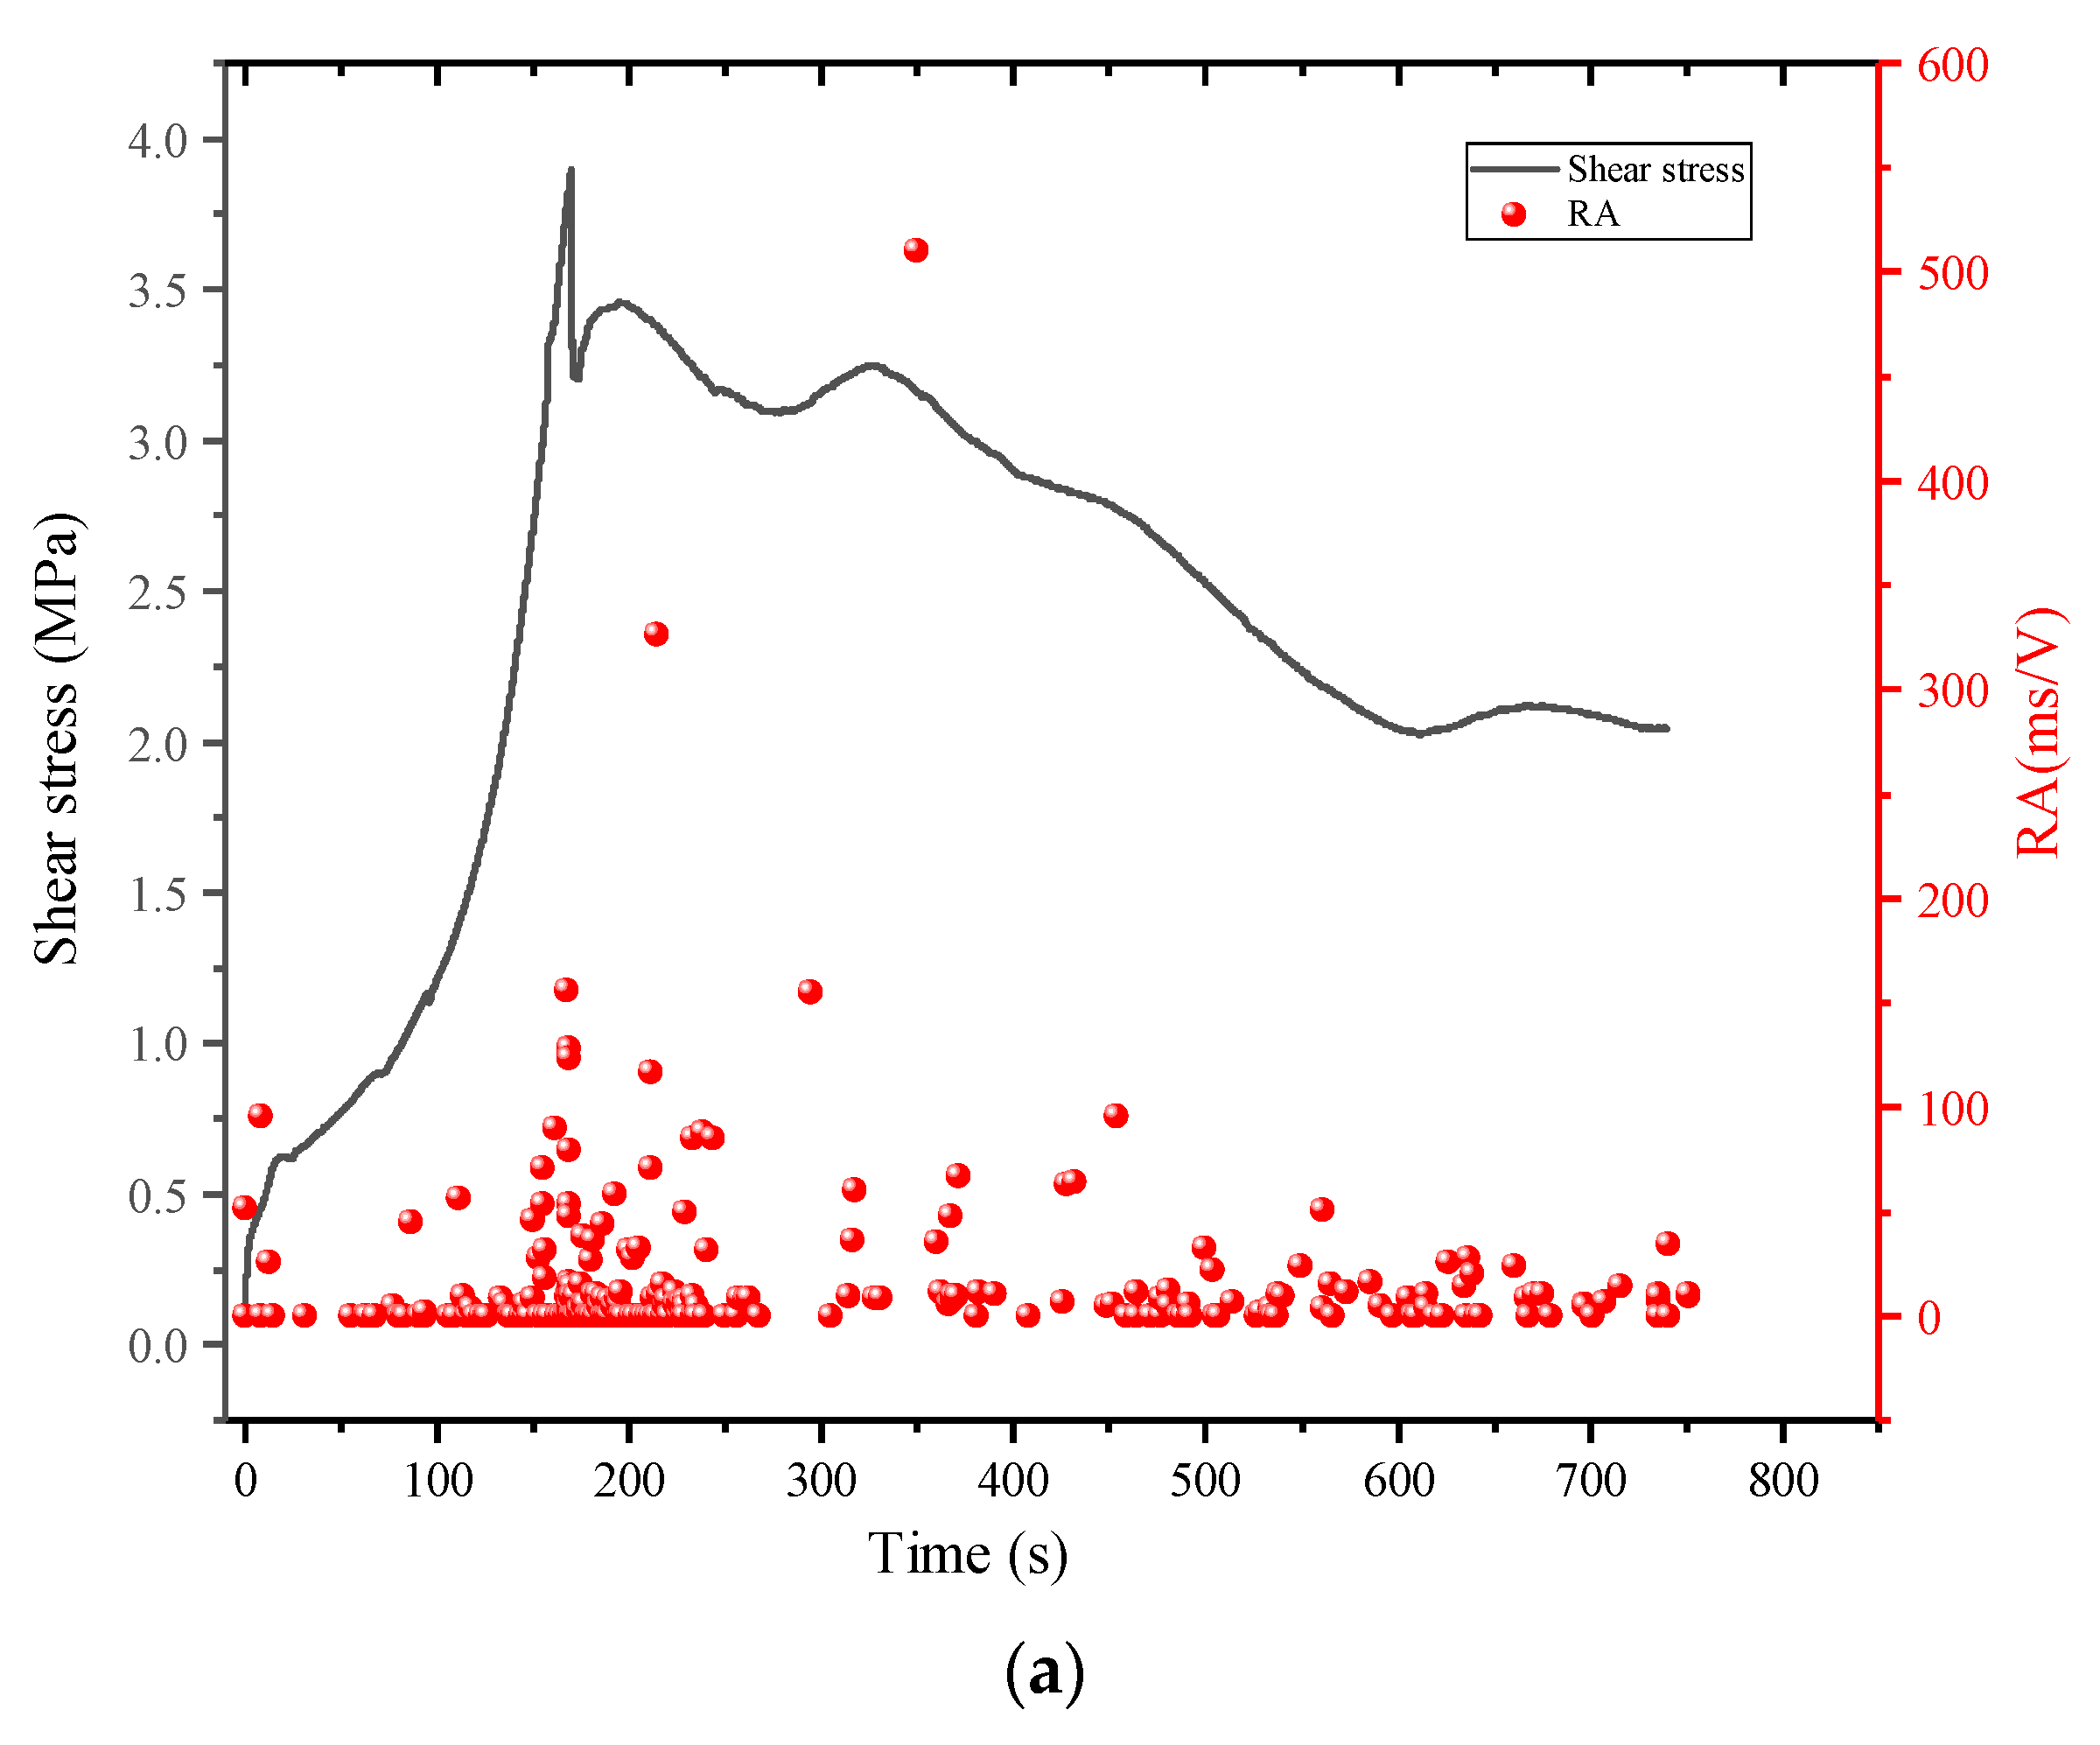
3.1. Shear Mechanics Characteristics of Mortar-Rock Binary Medium
3.2. Analysis of Acoustic Emission Characteristic Parameters
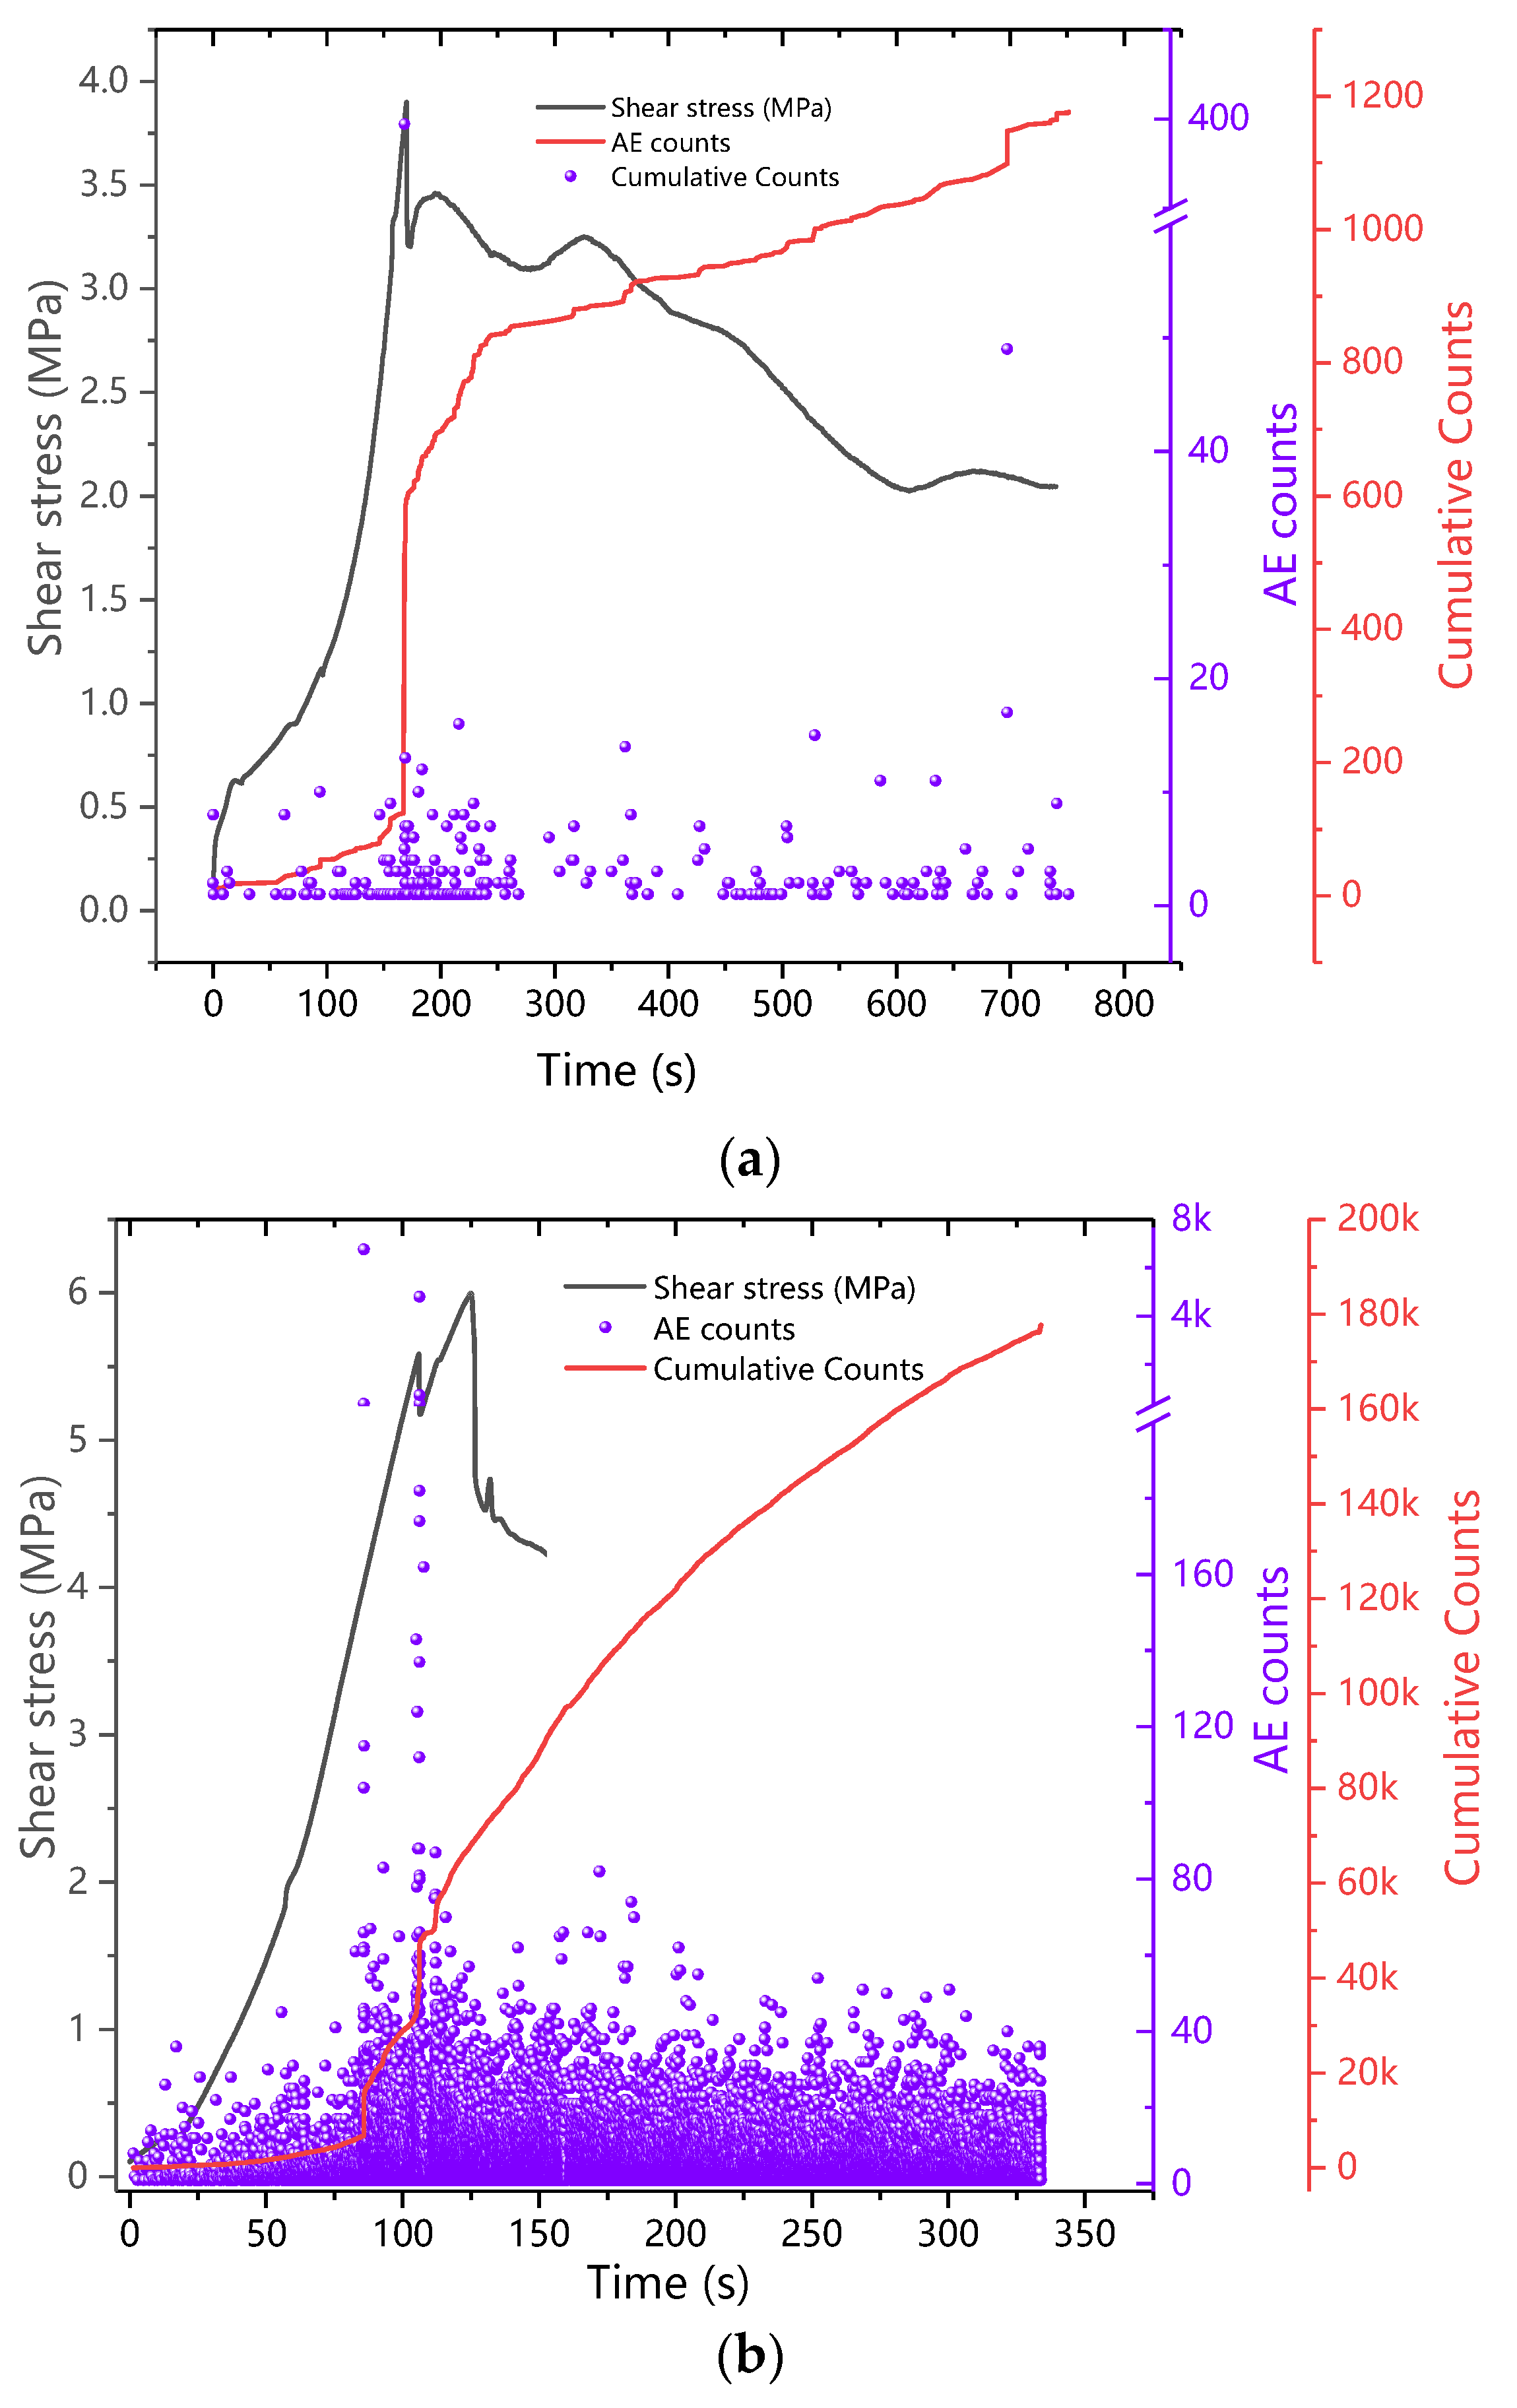
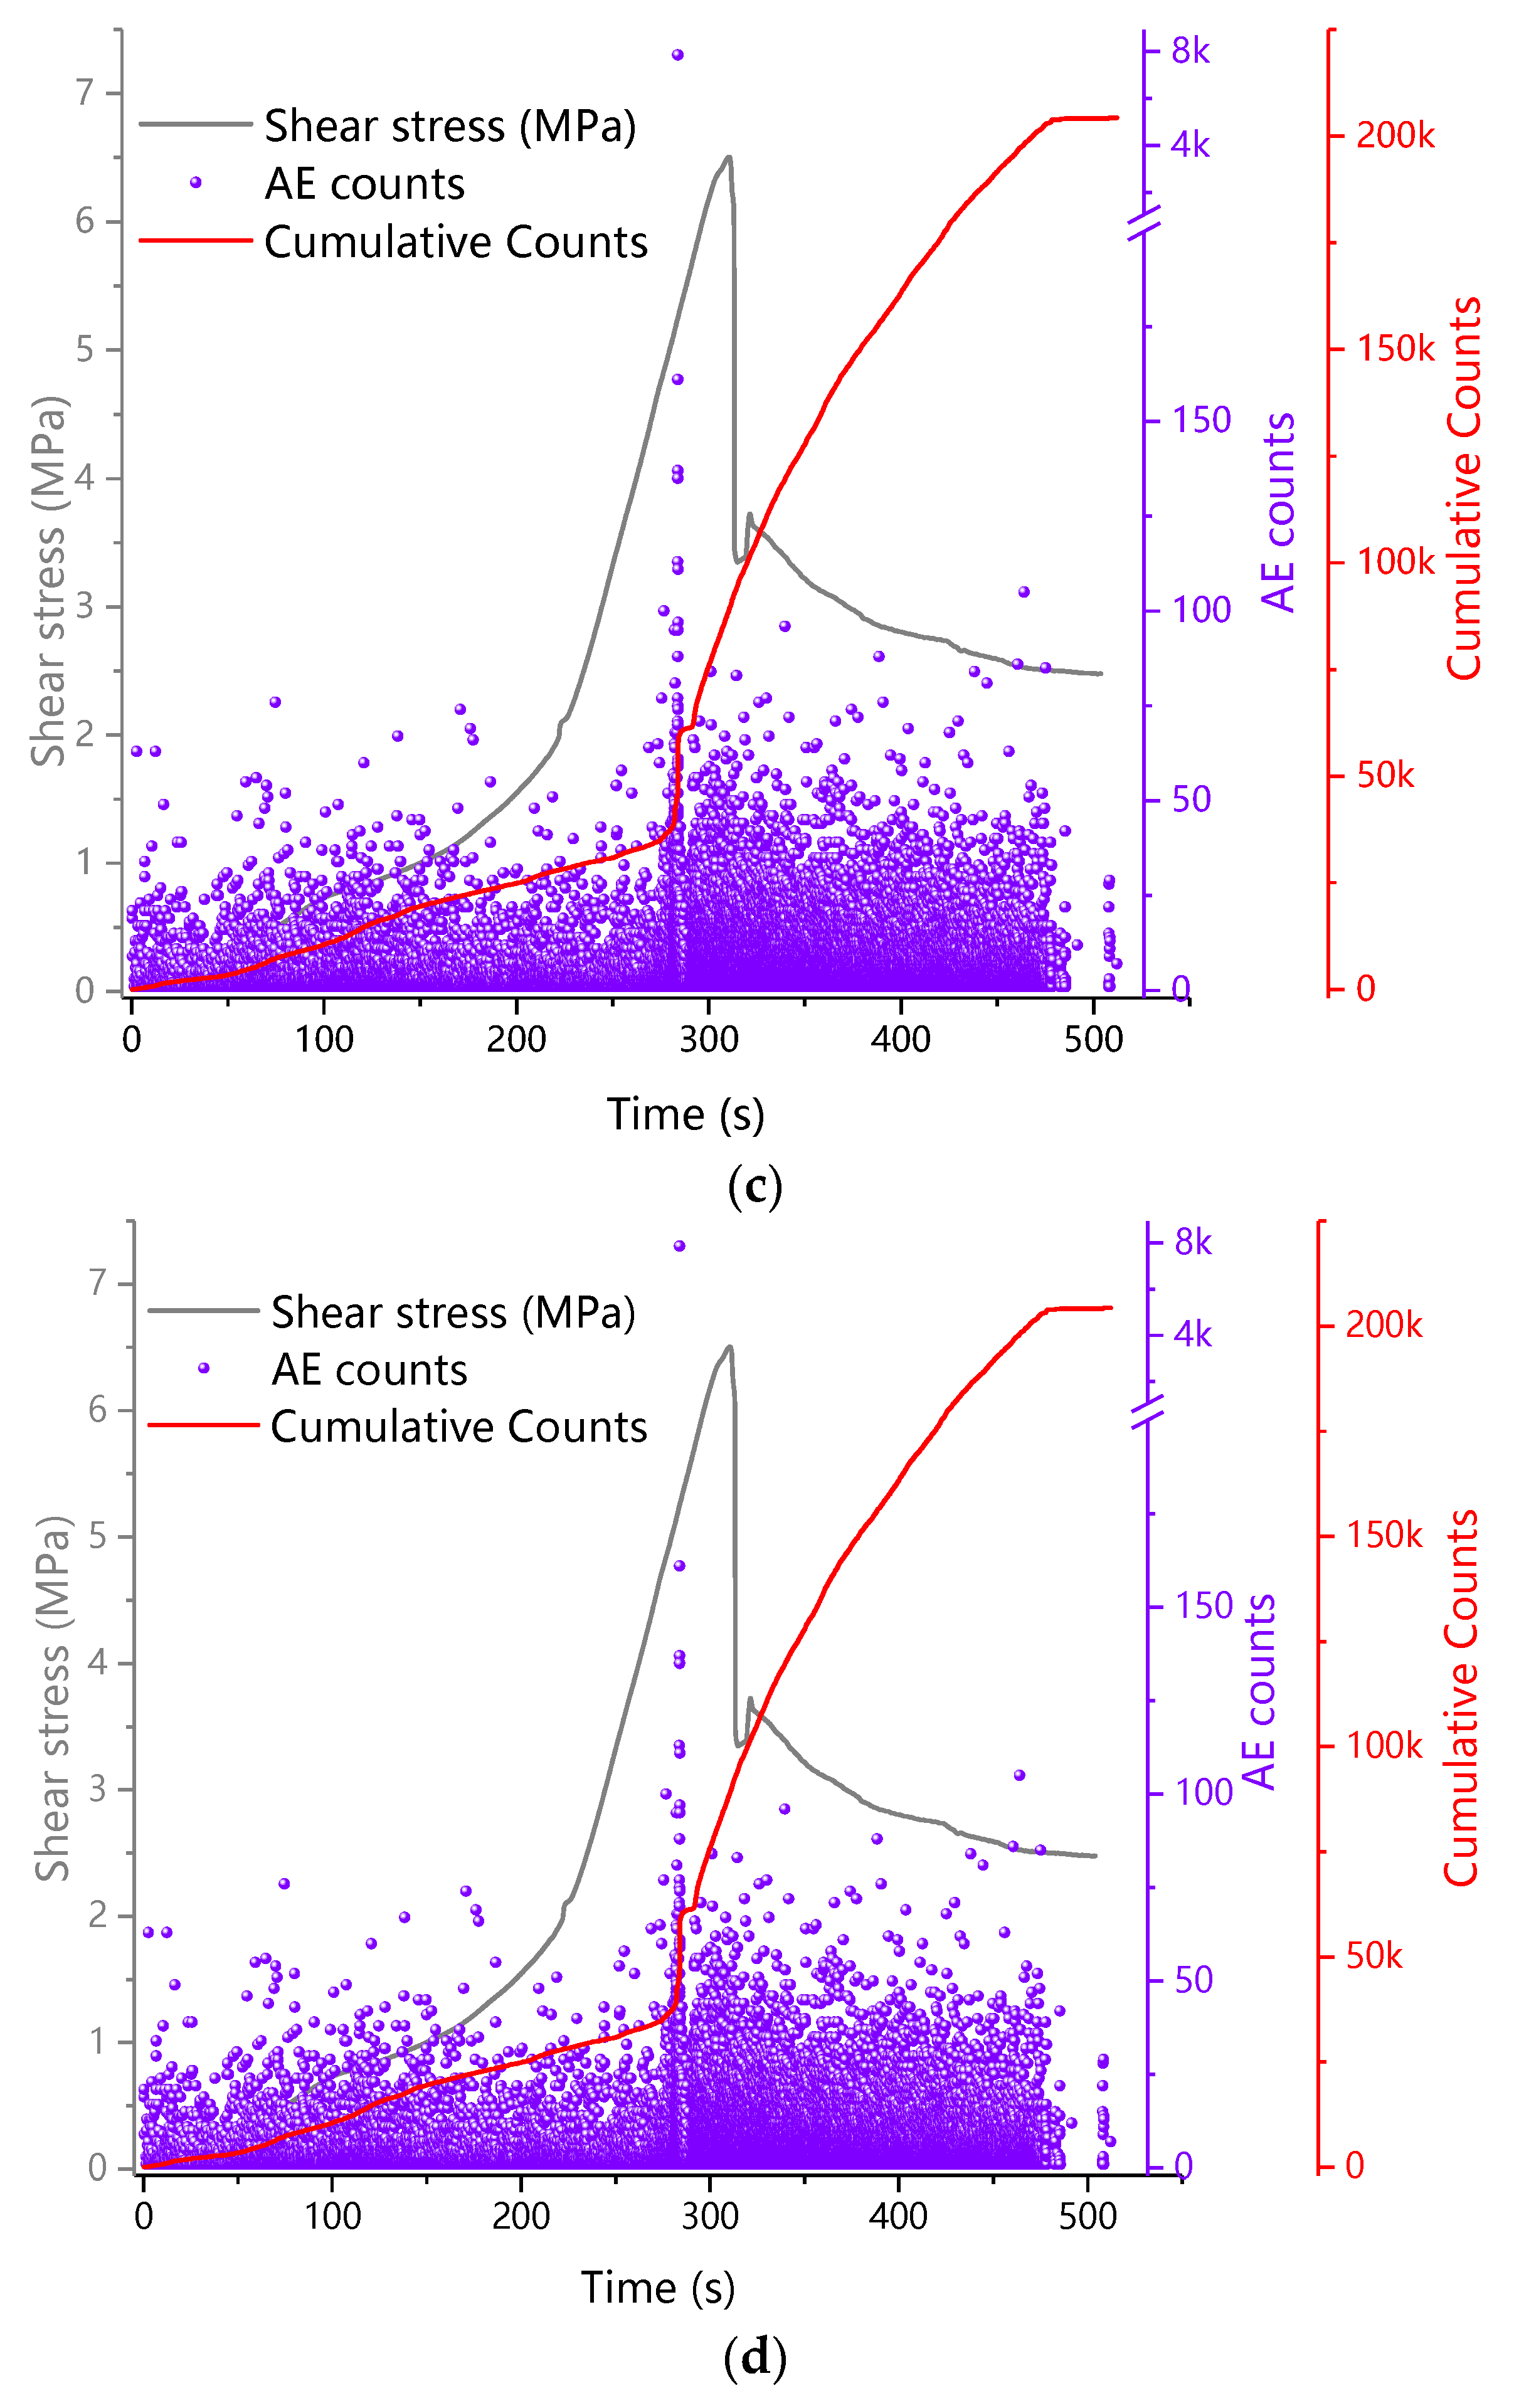
3.2.1. AE Counts
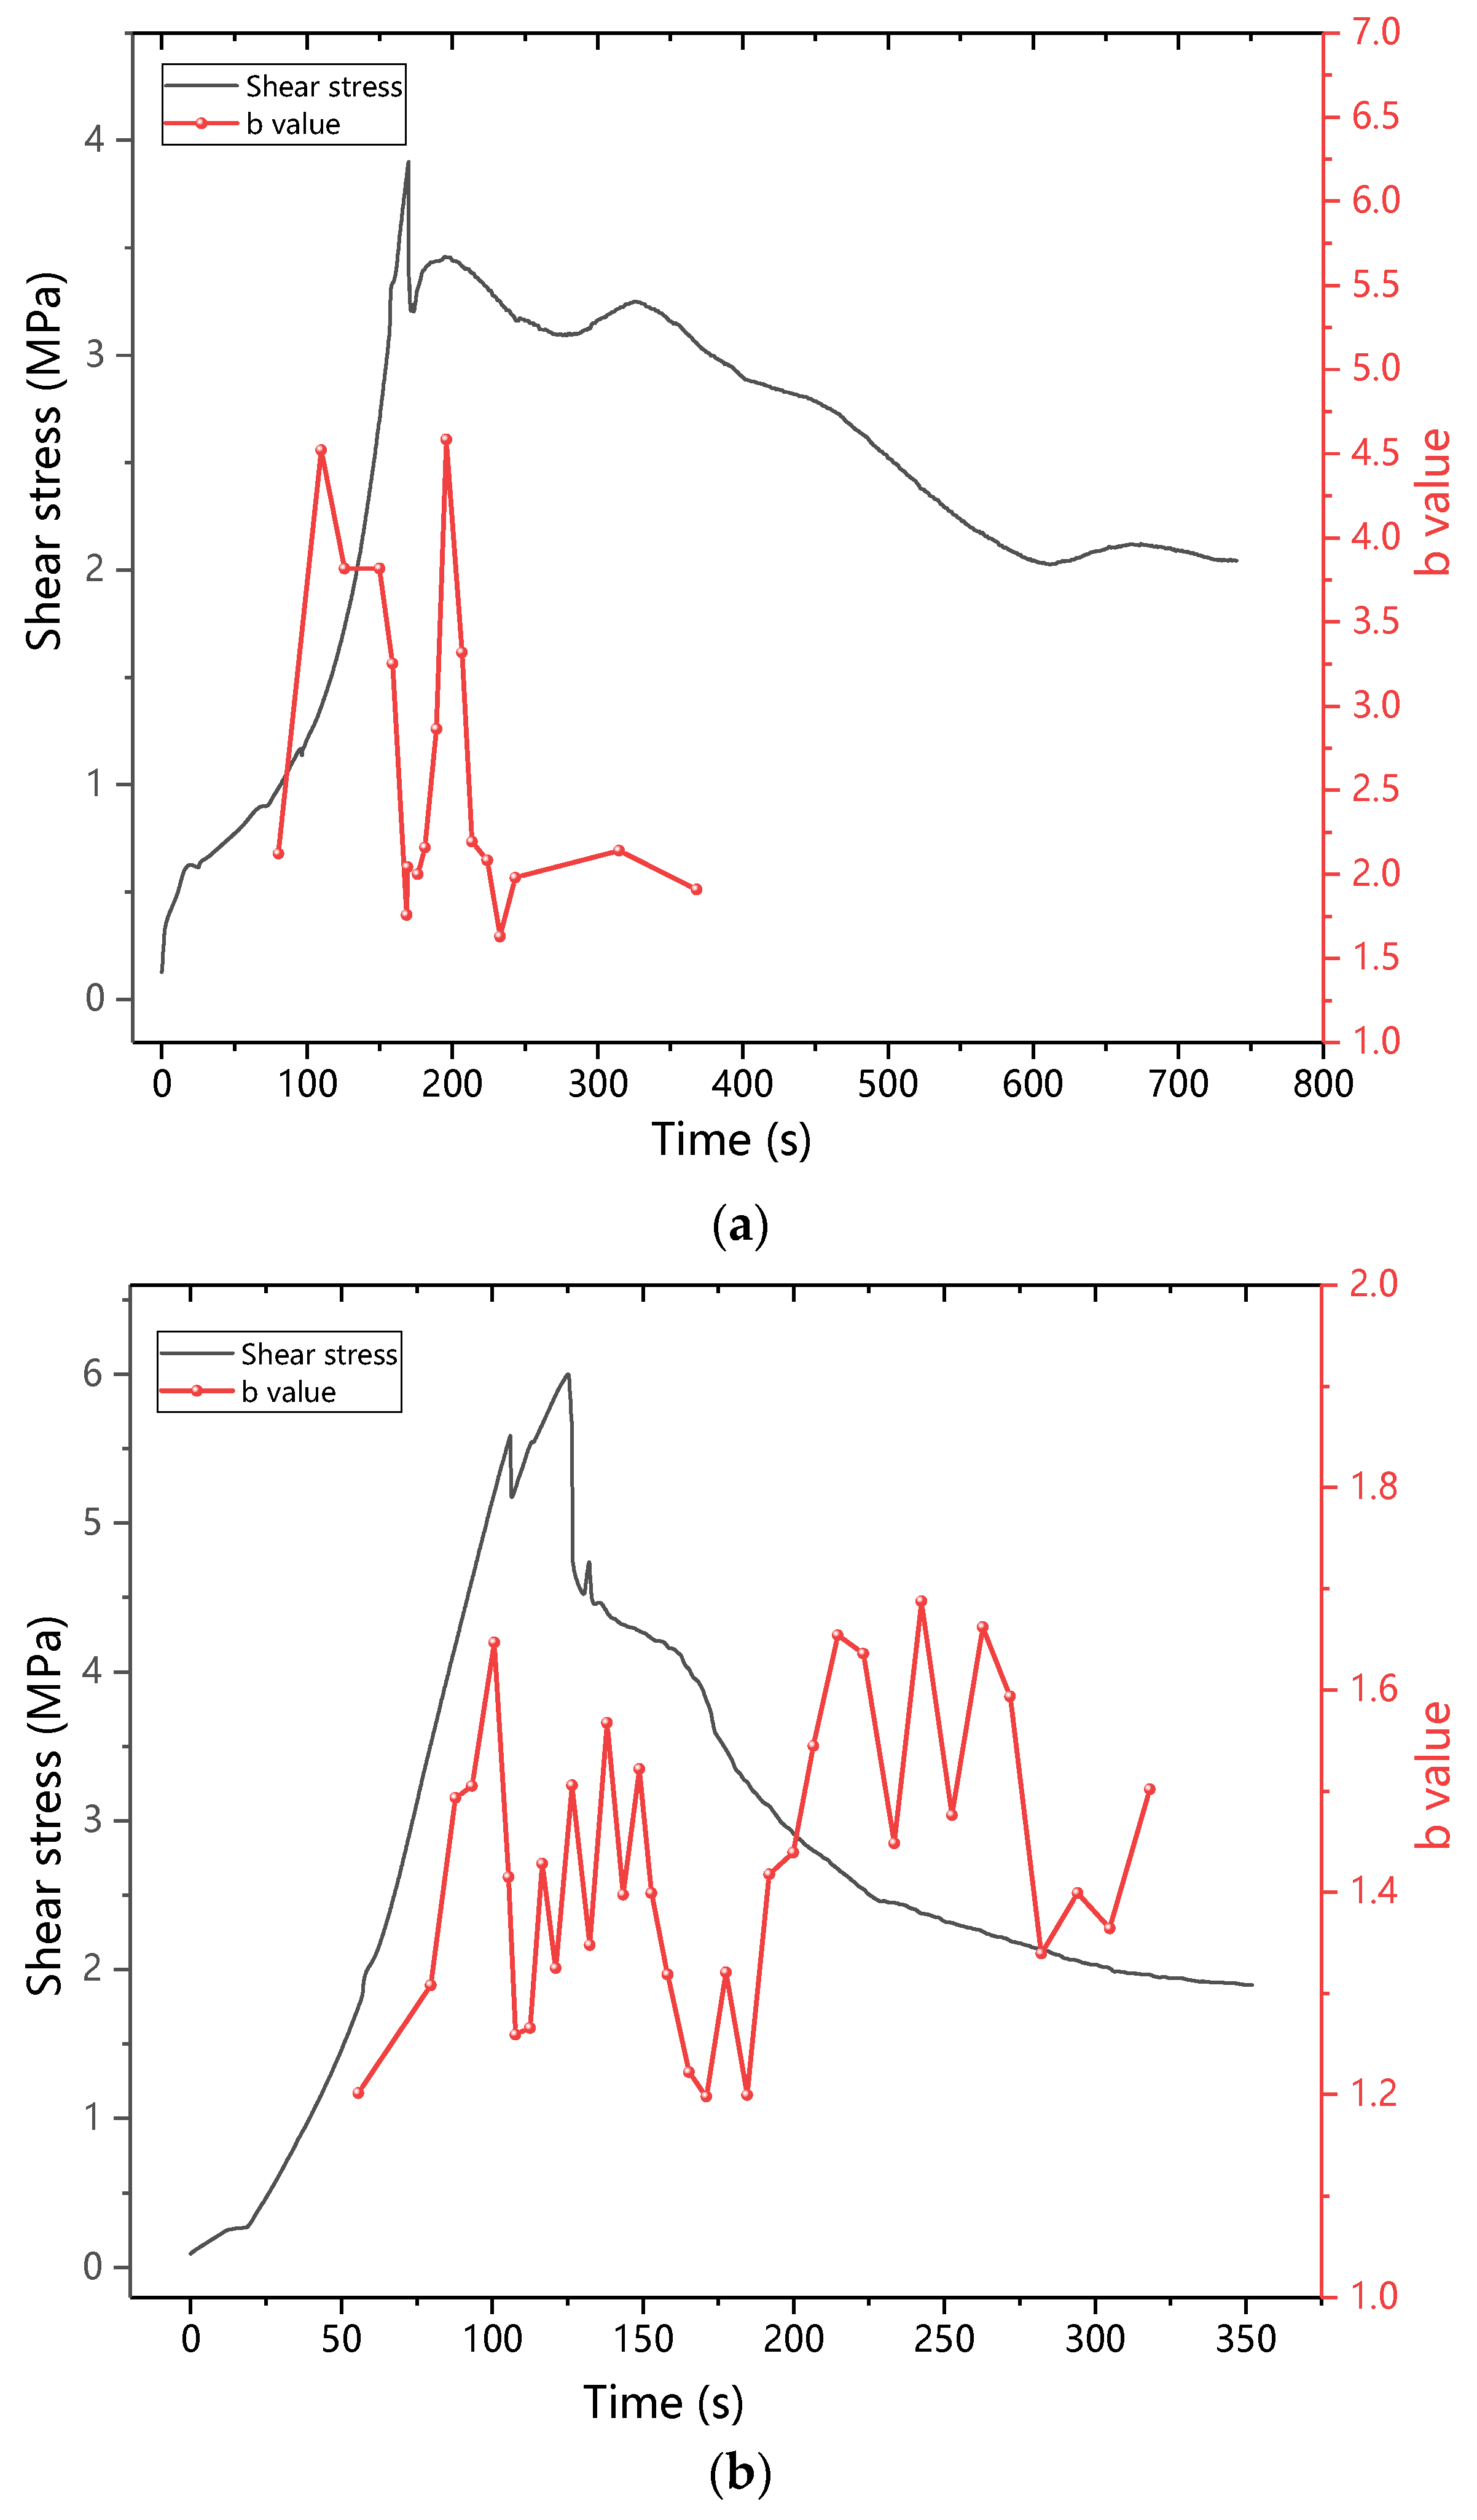
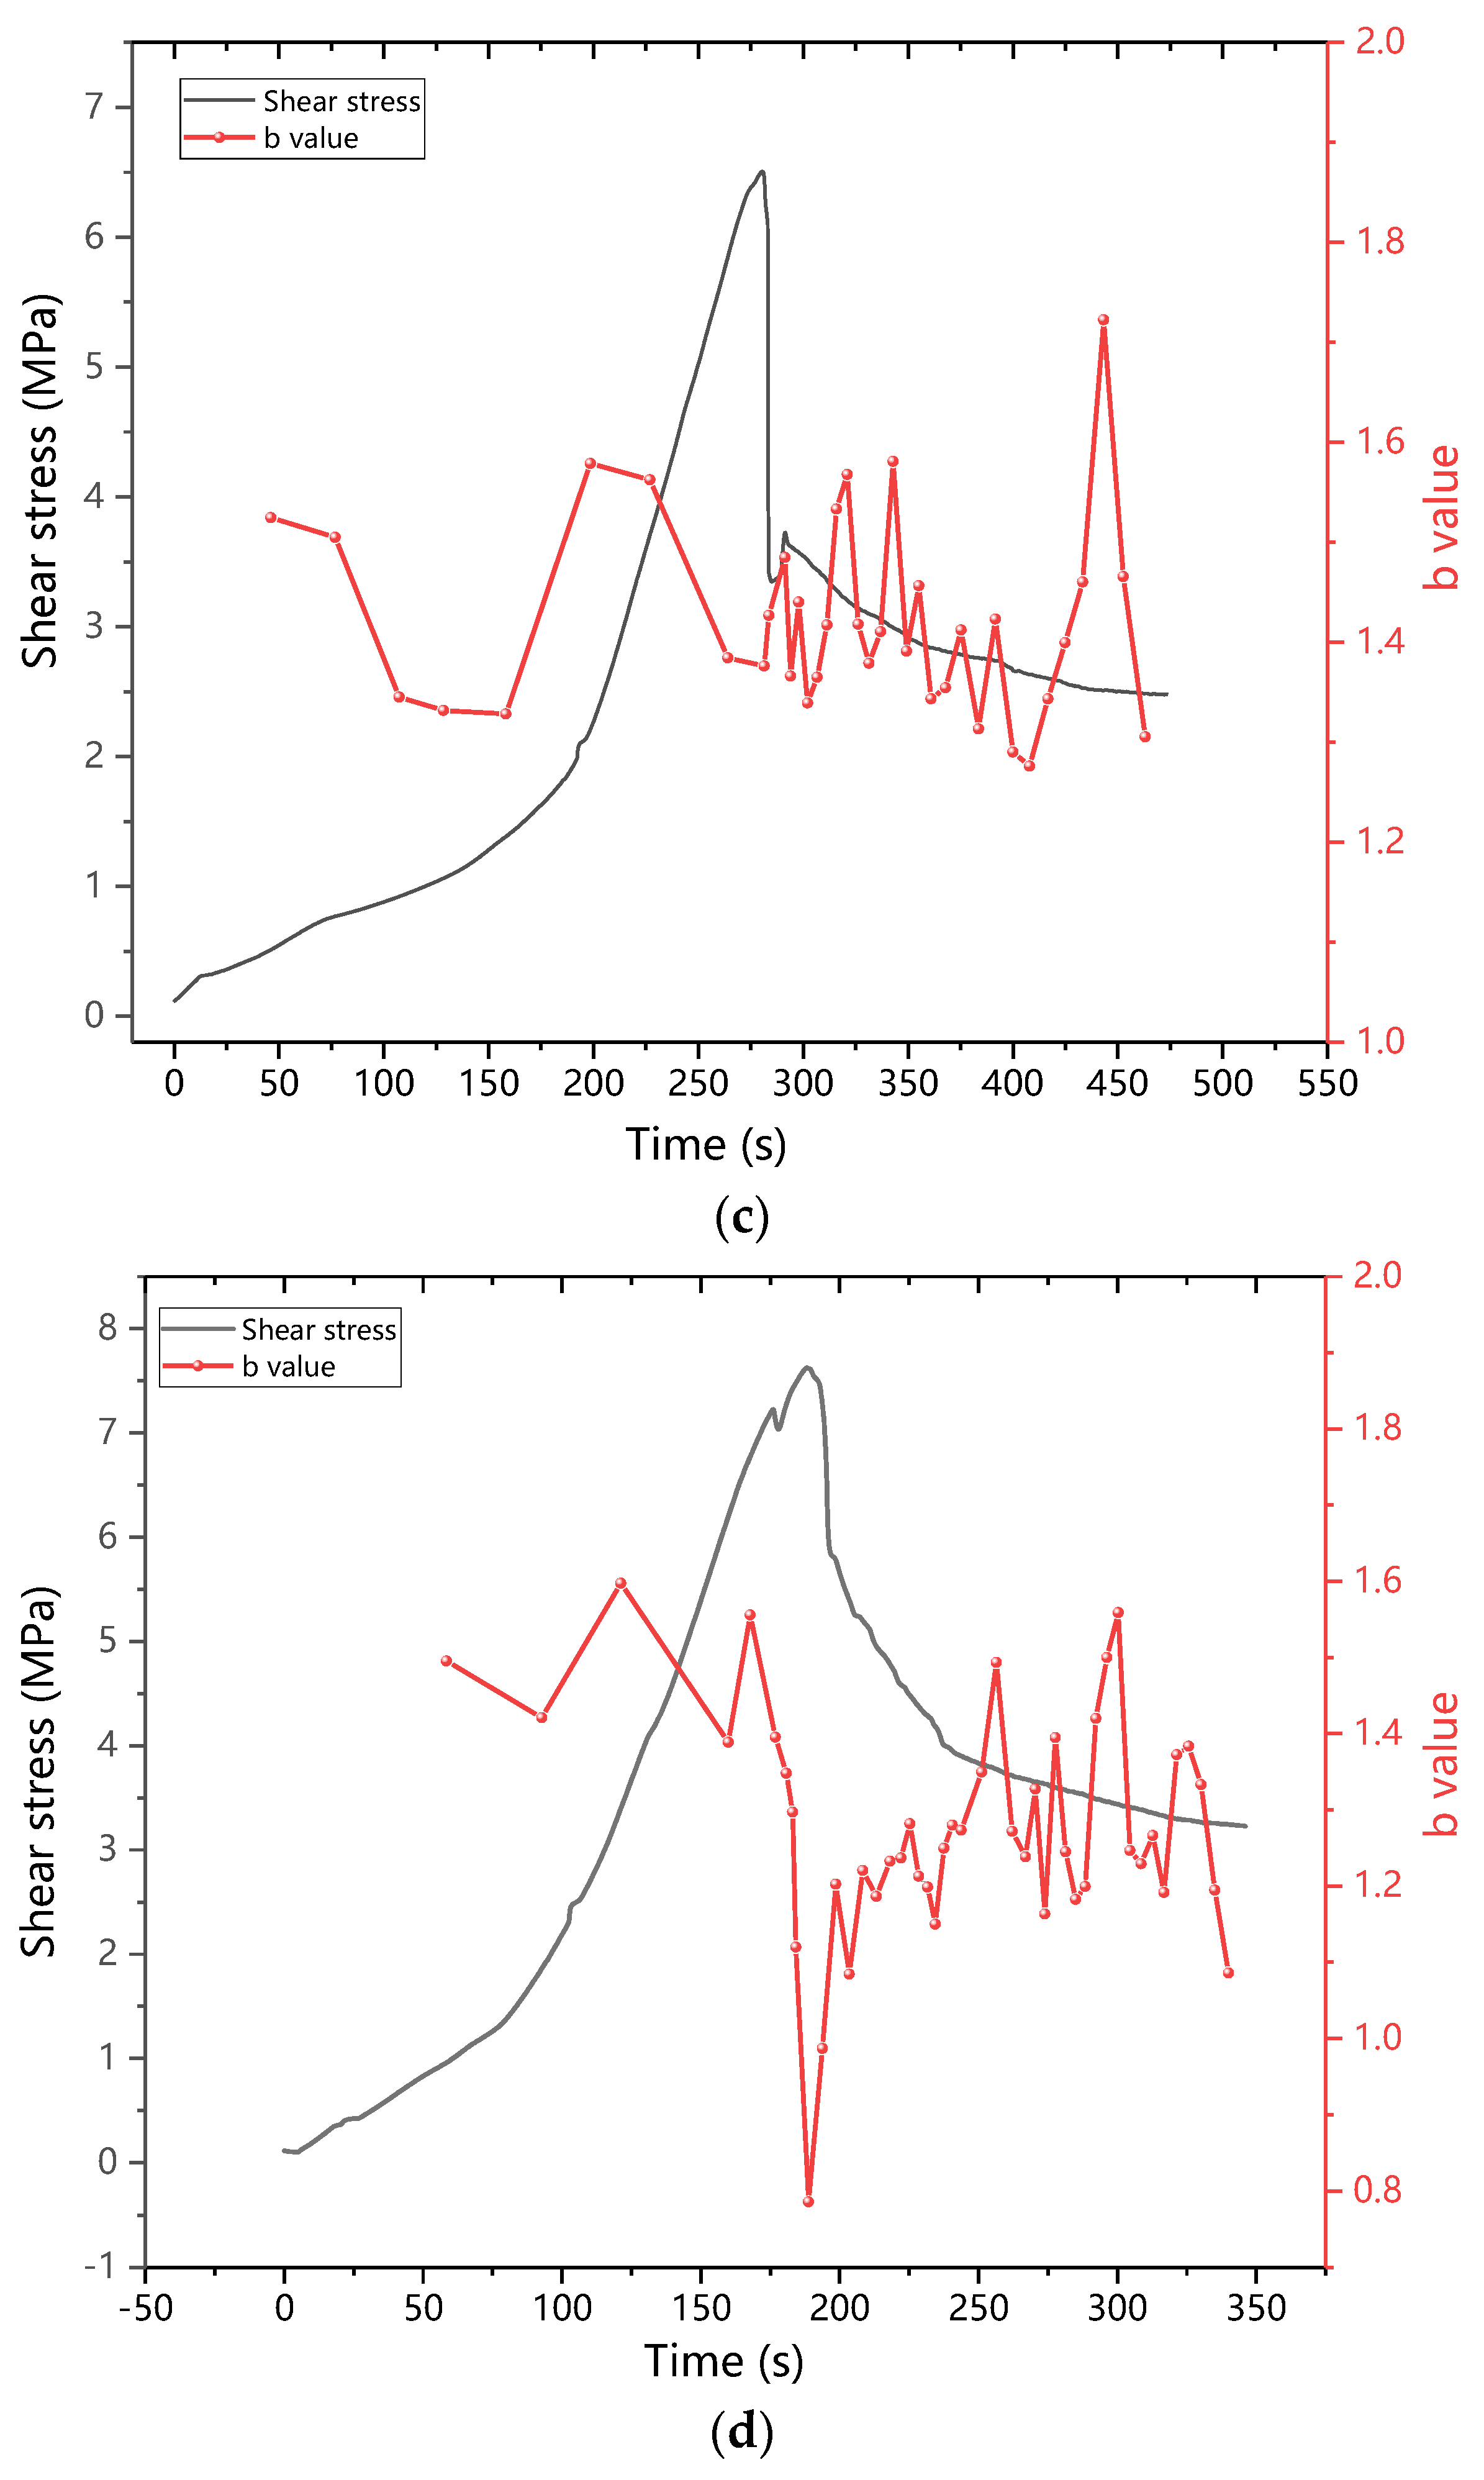
3.2.2. b Value
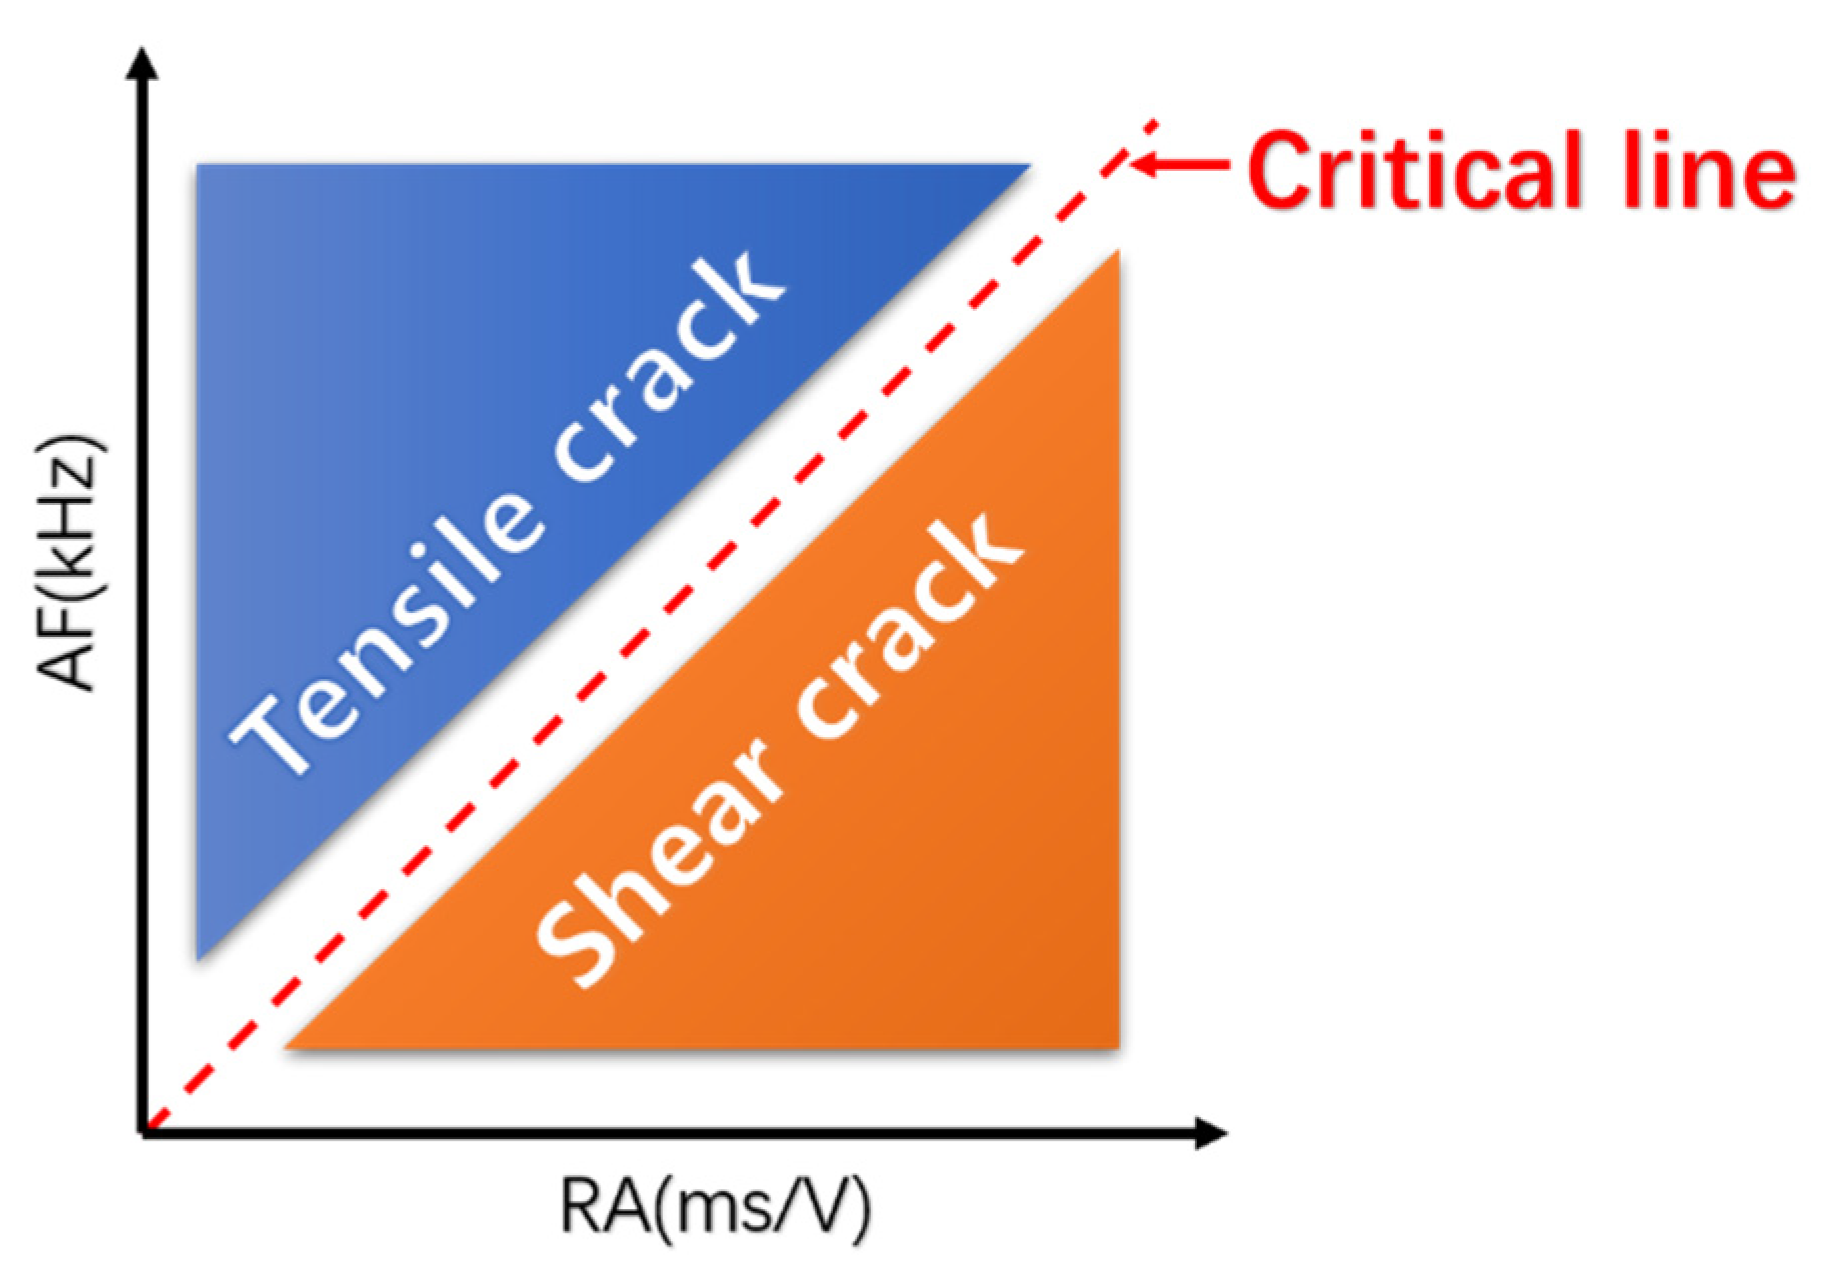
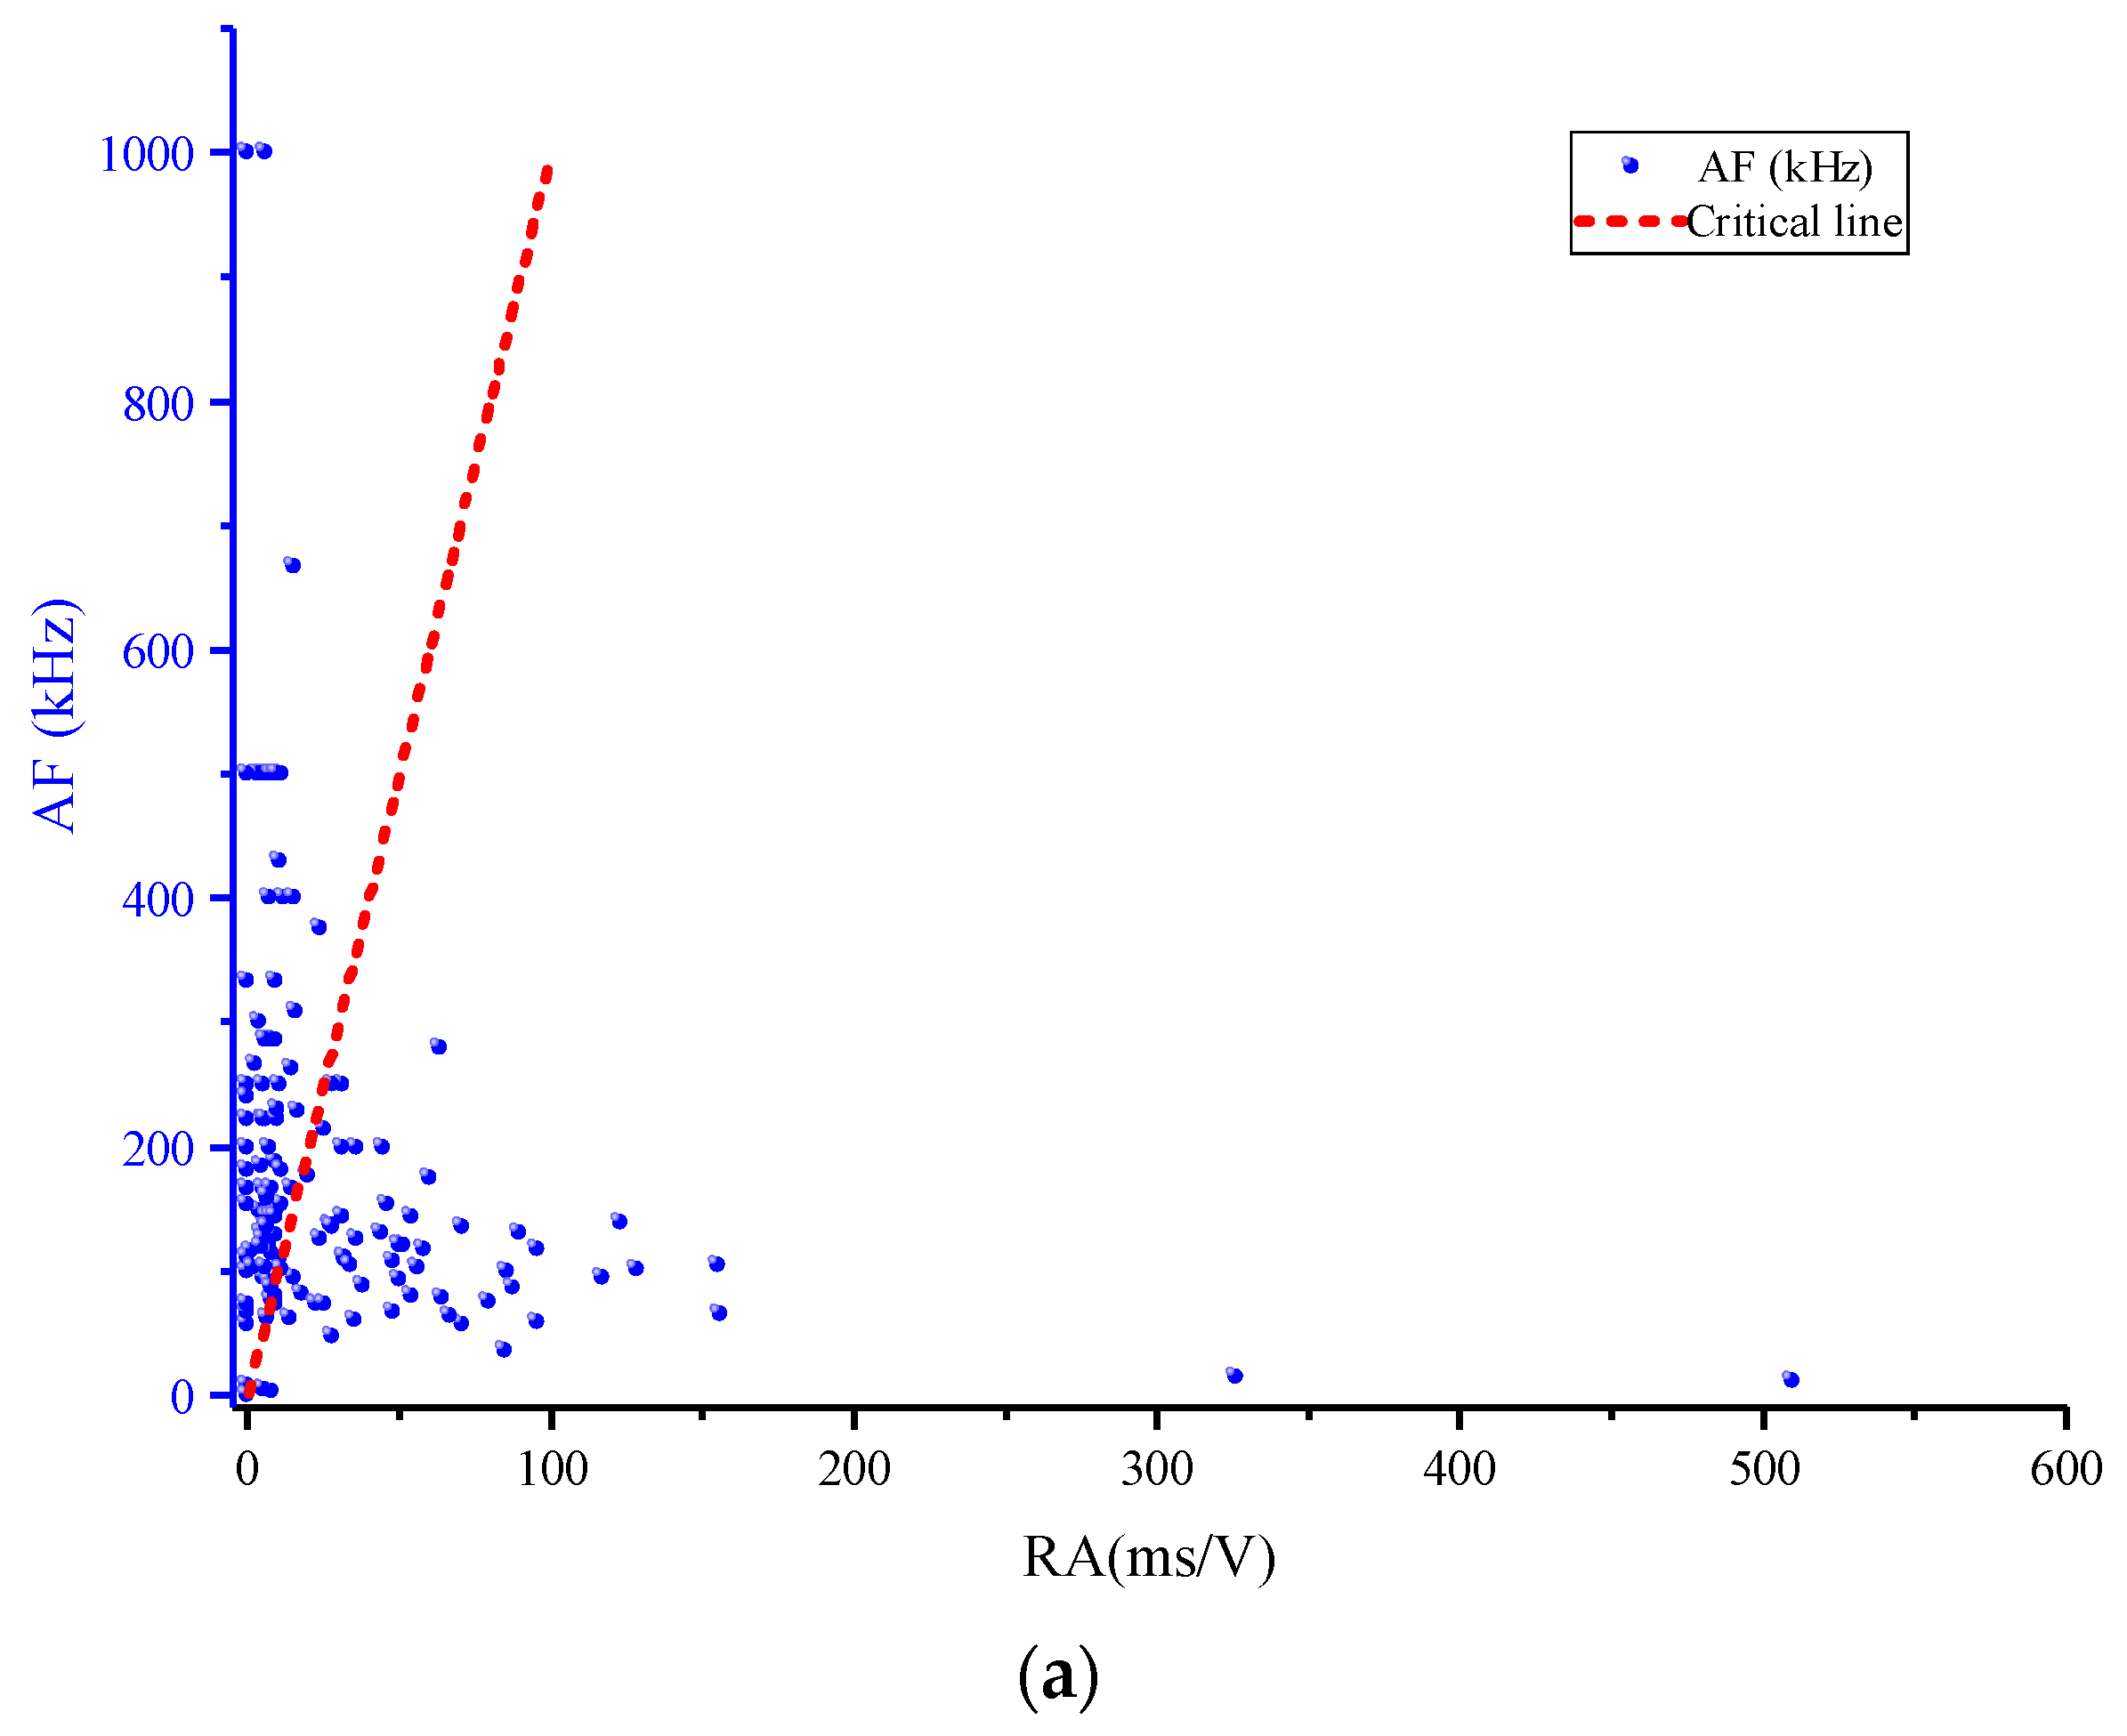
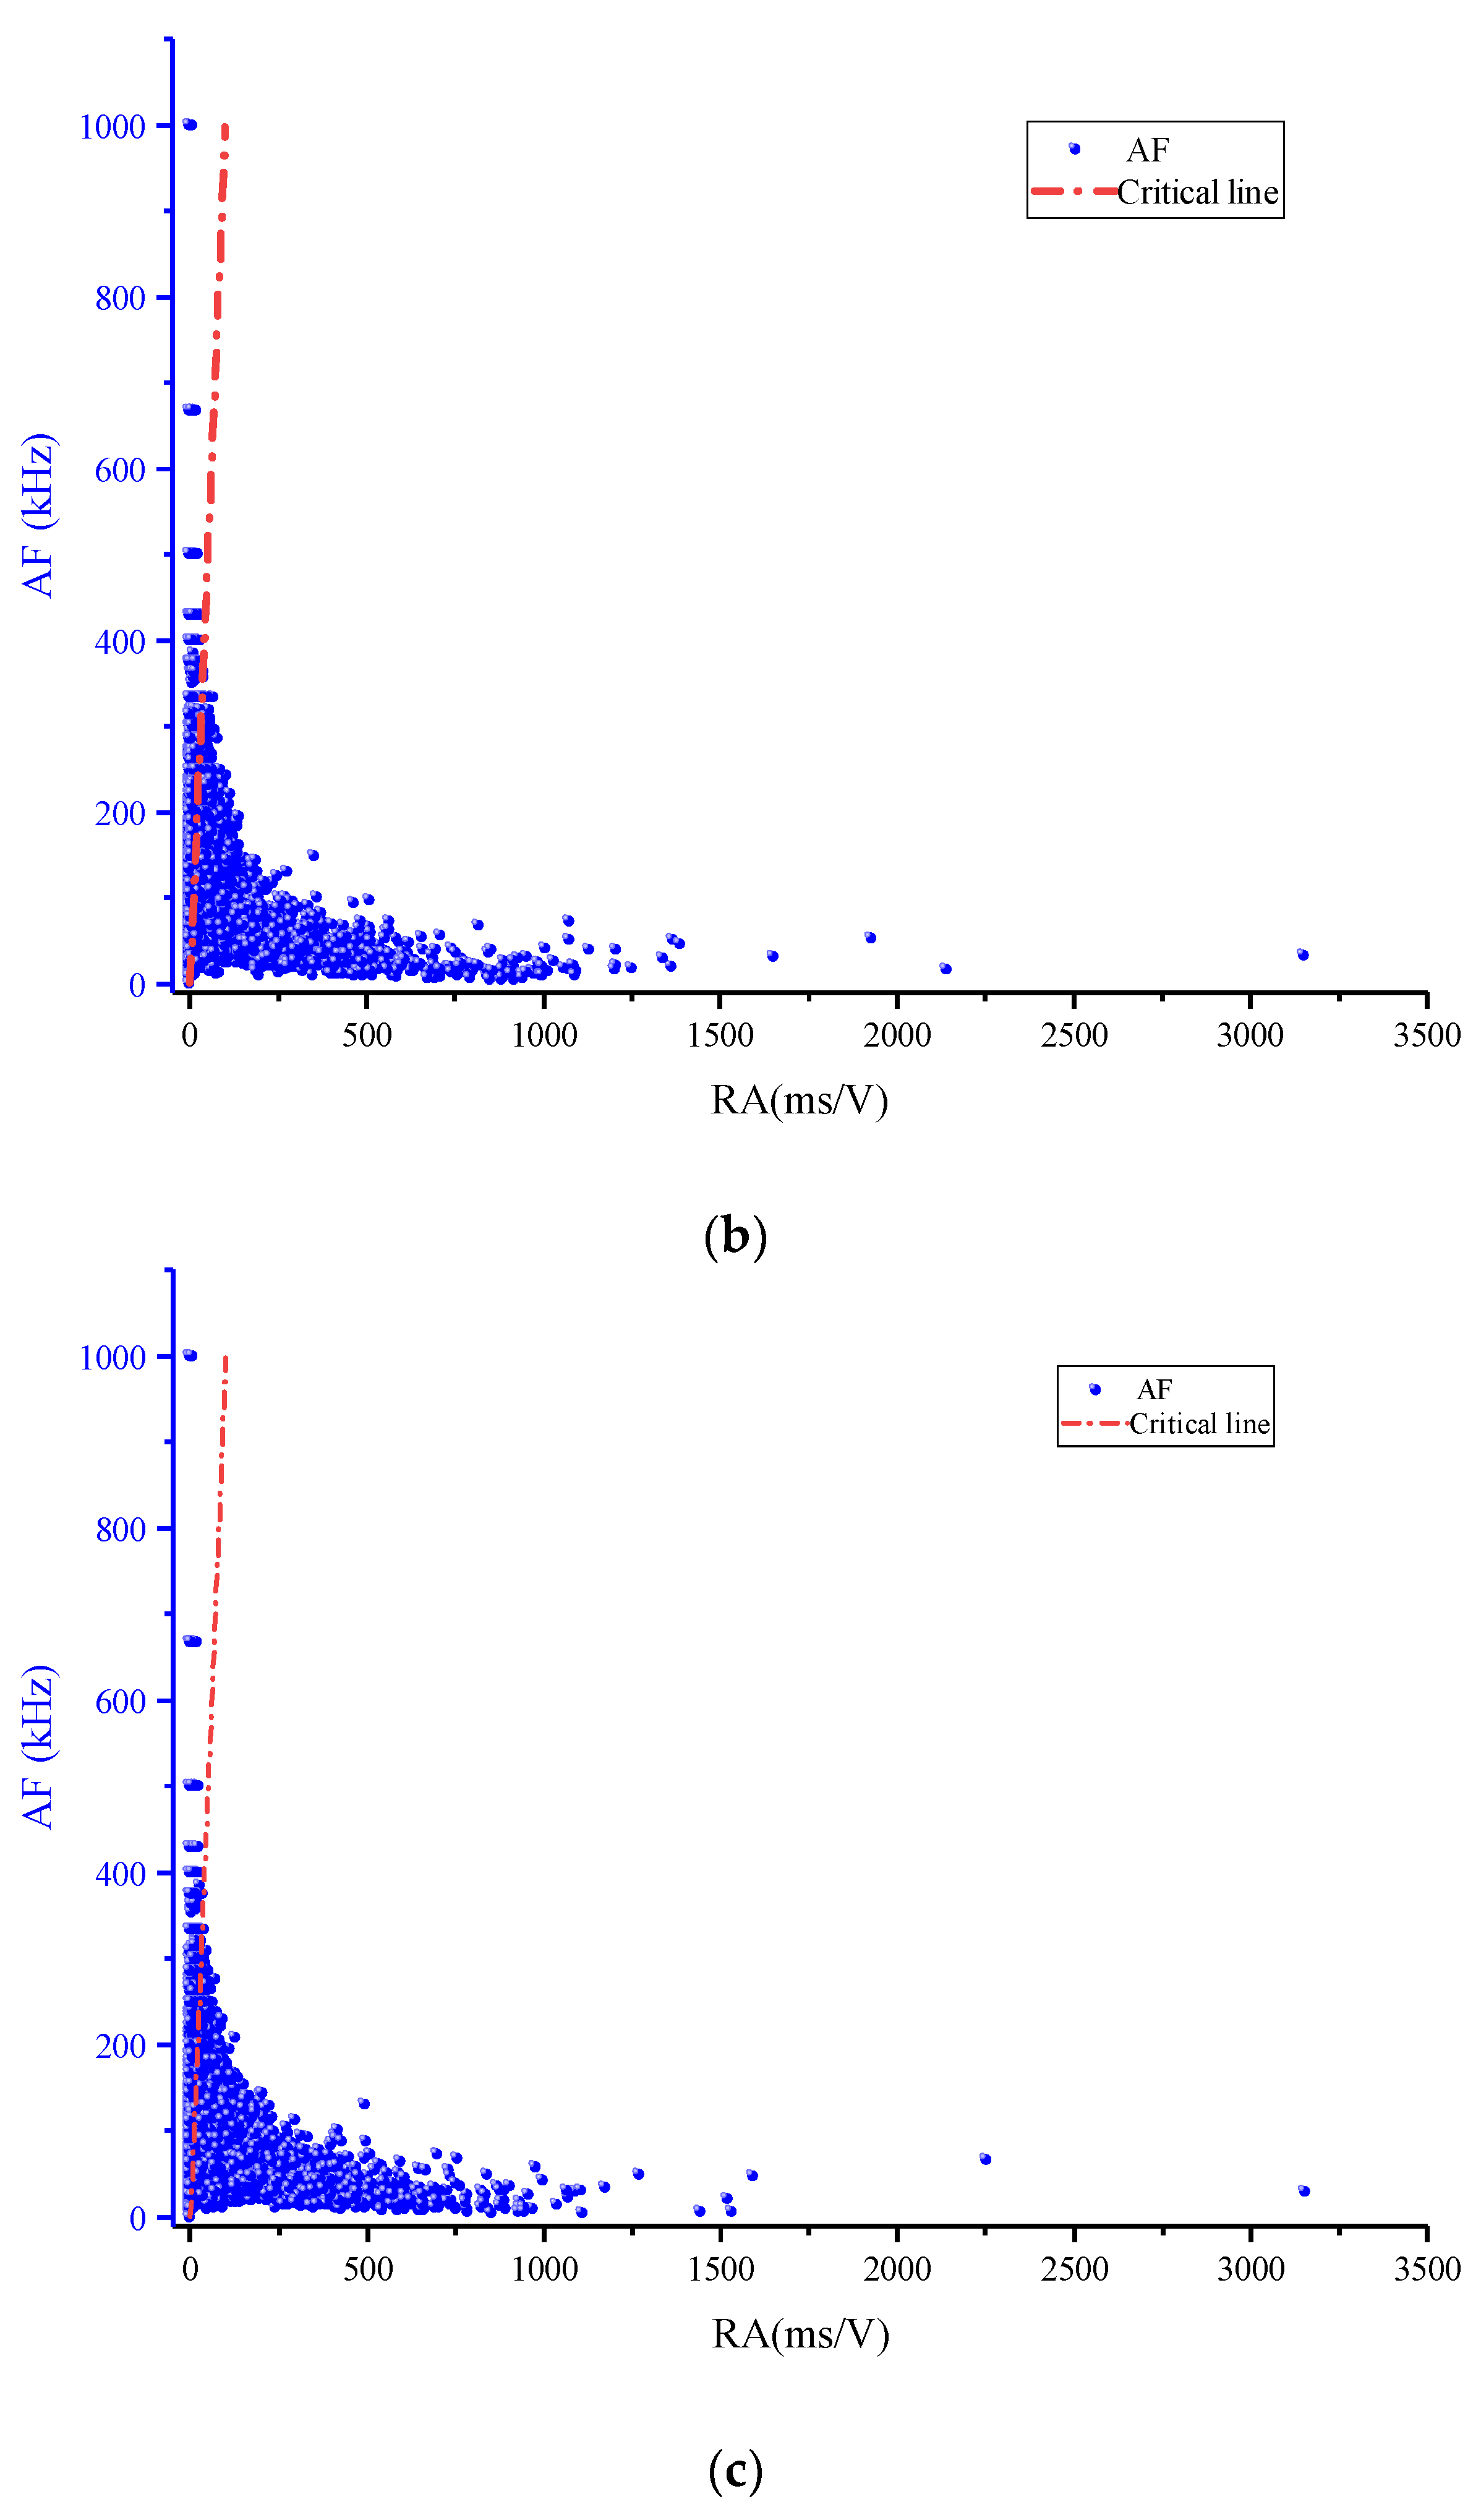
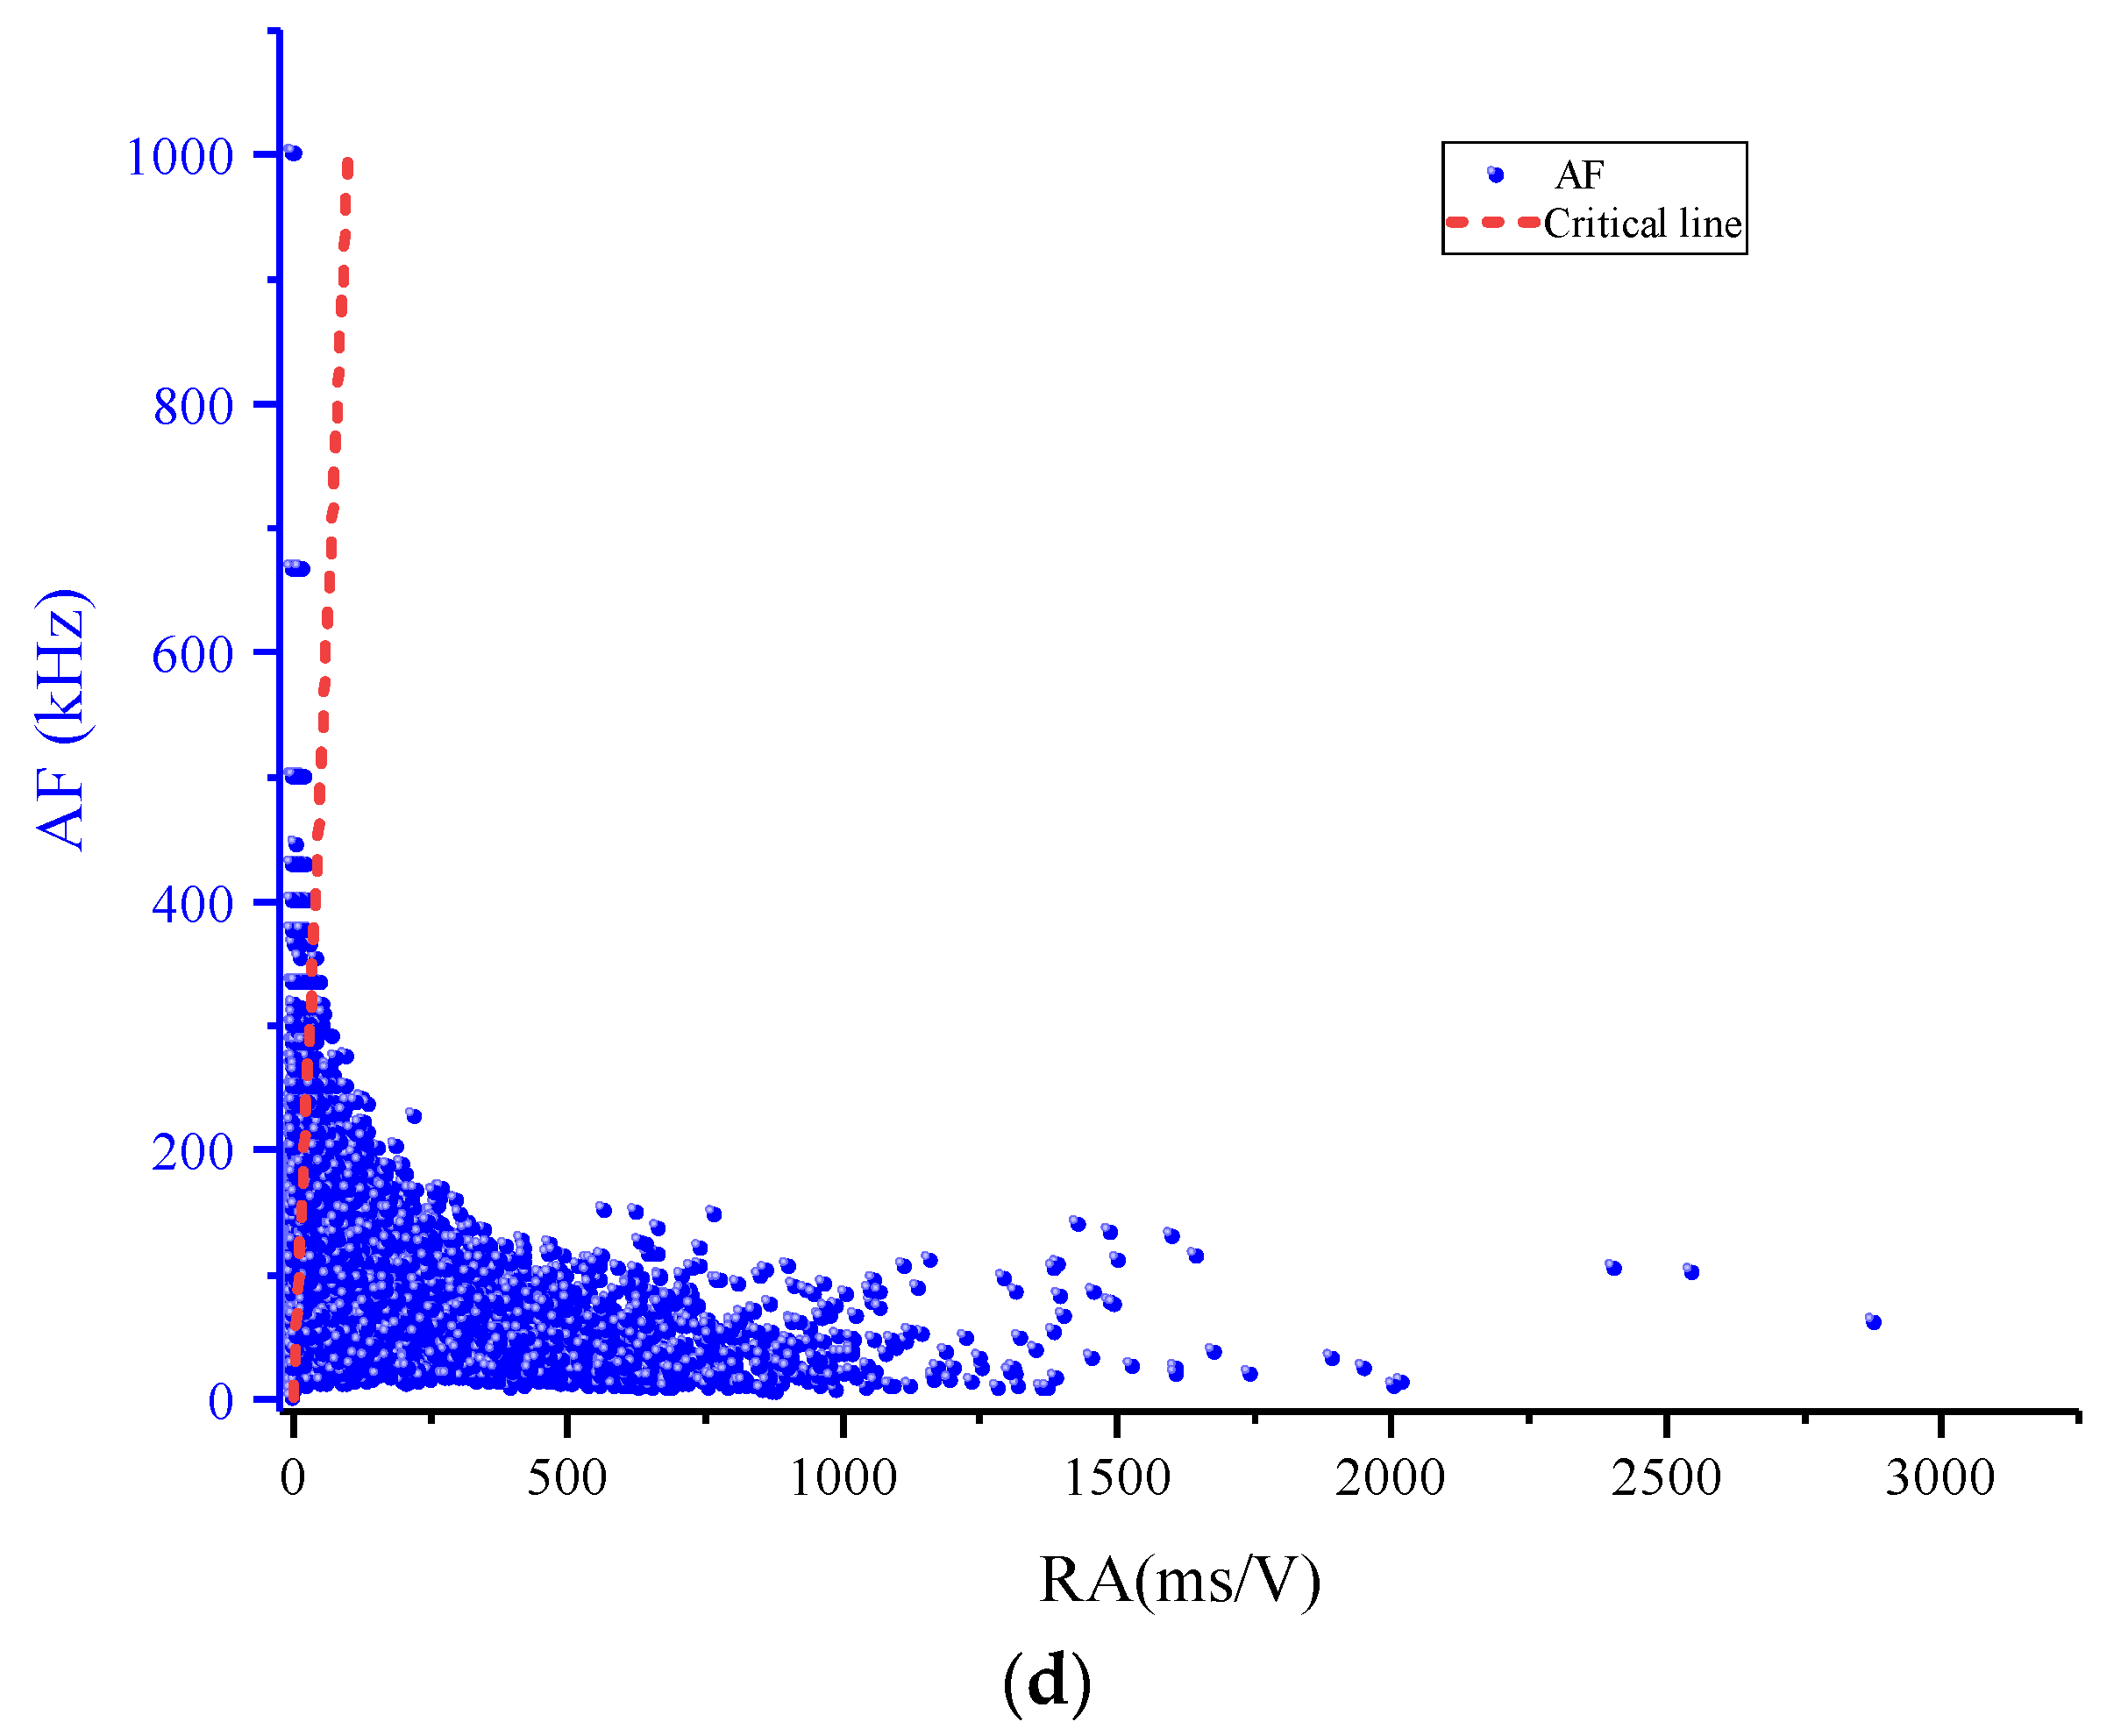
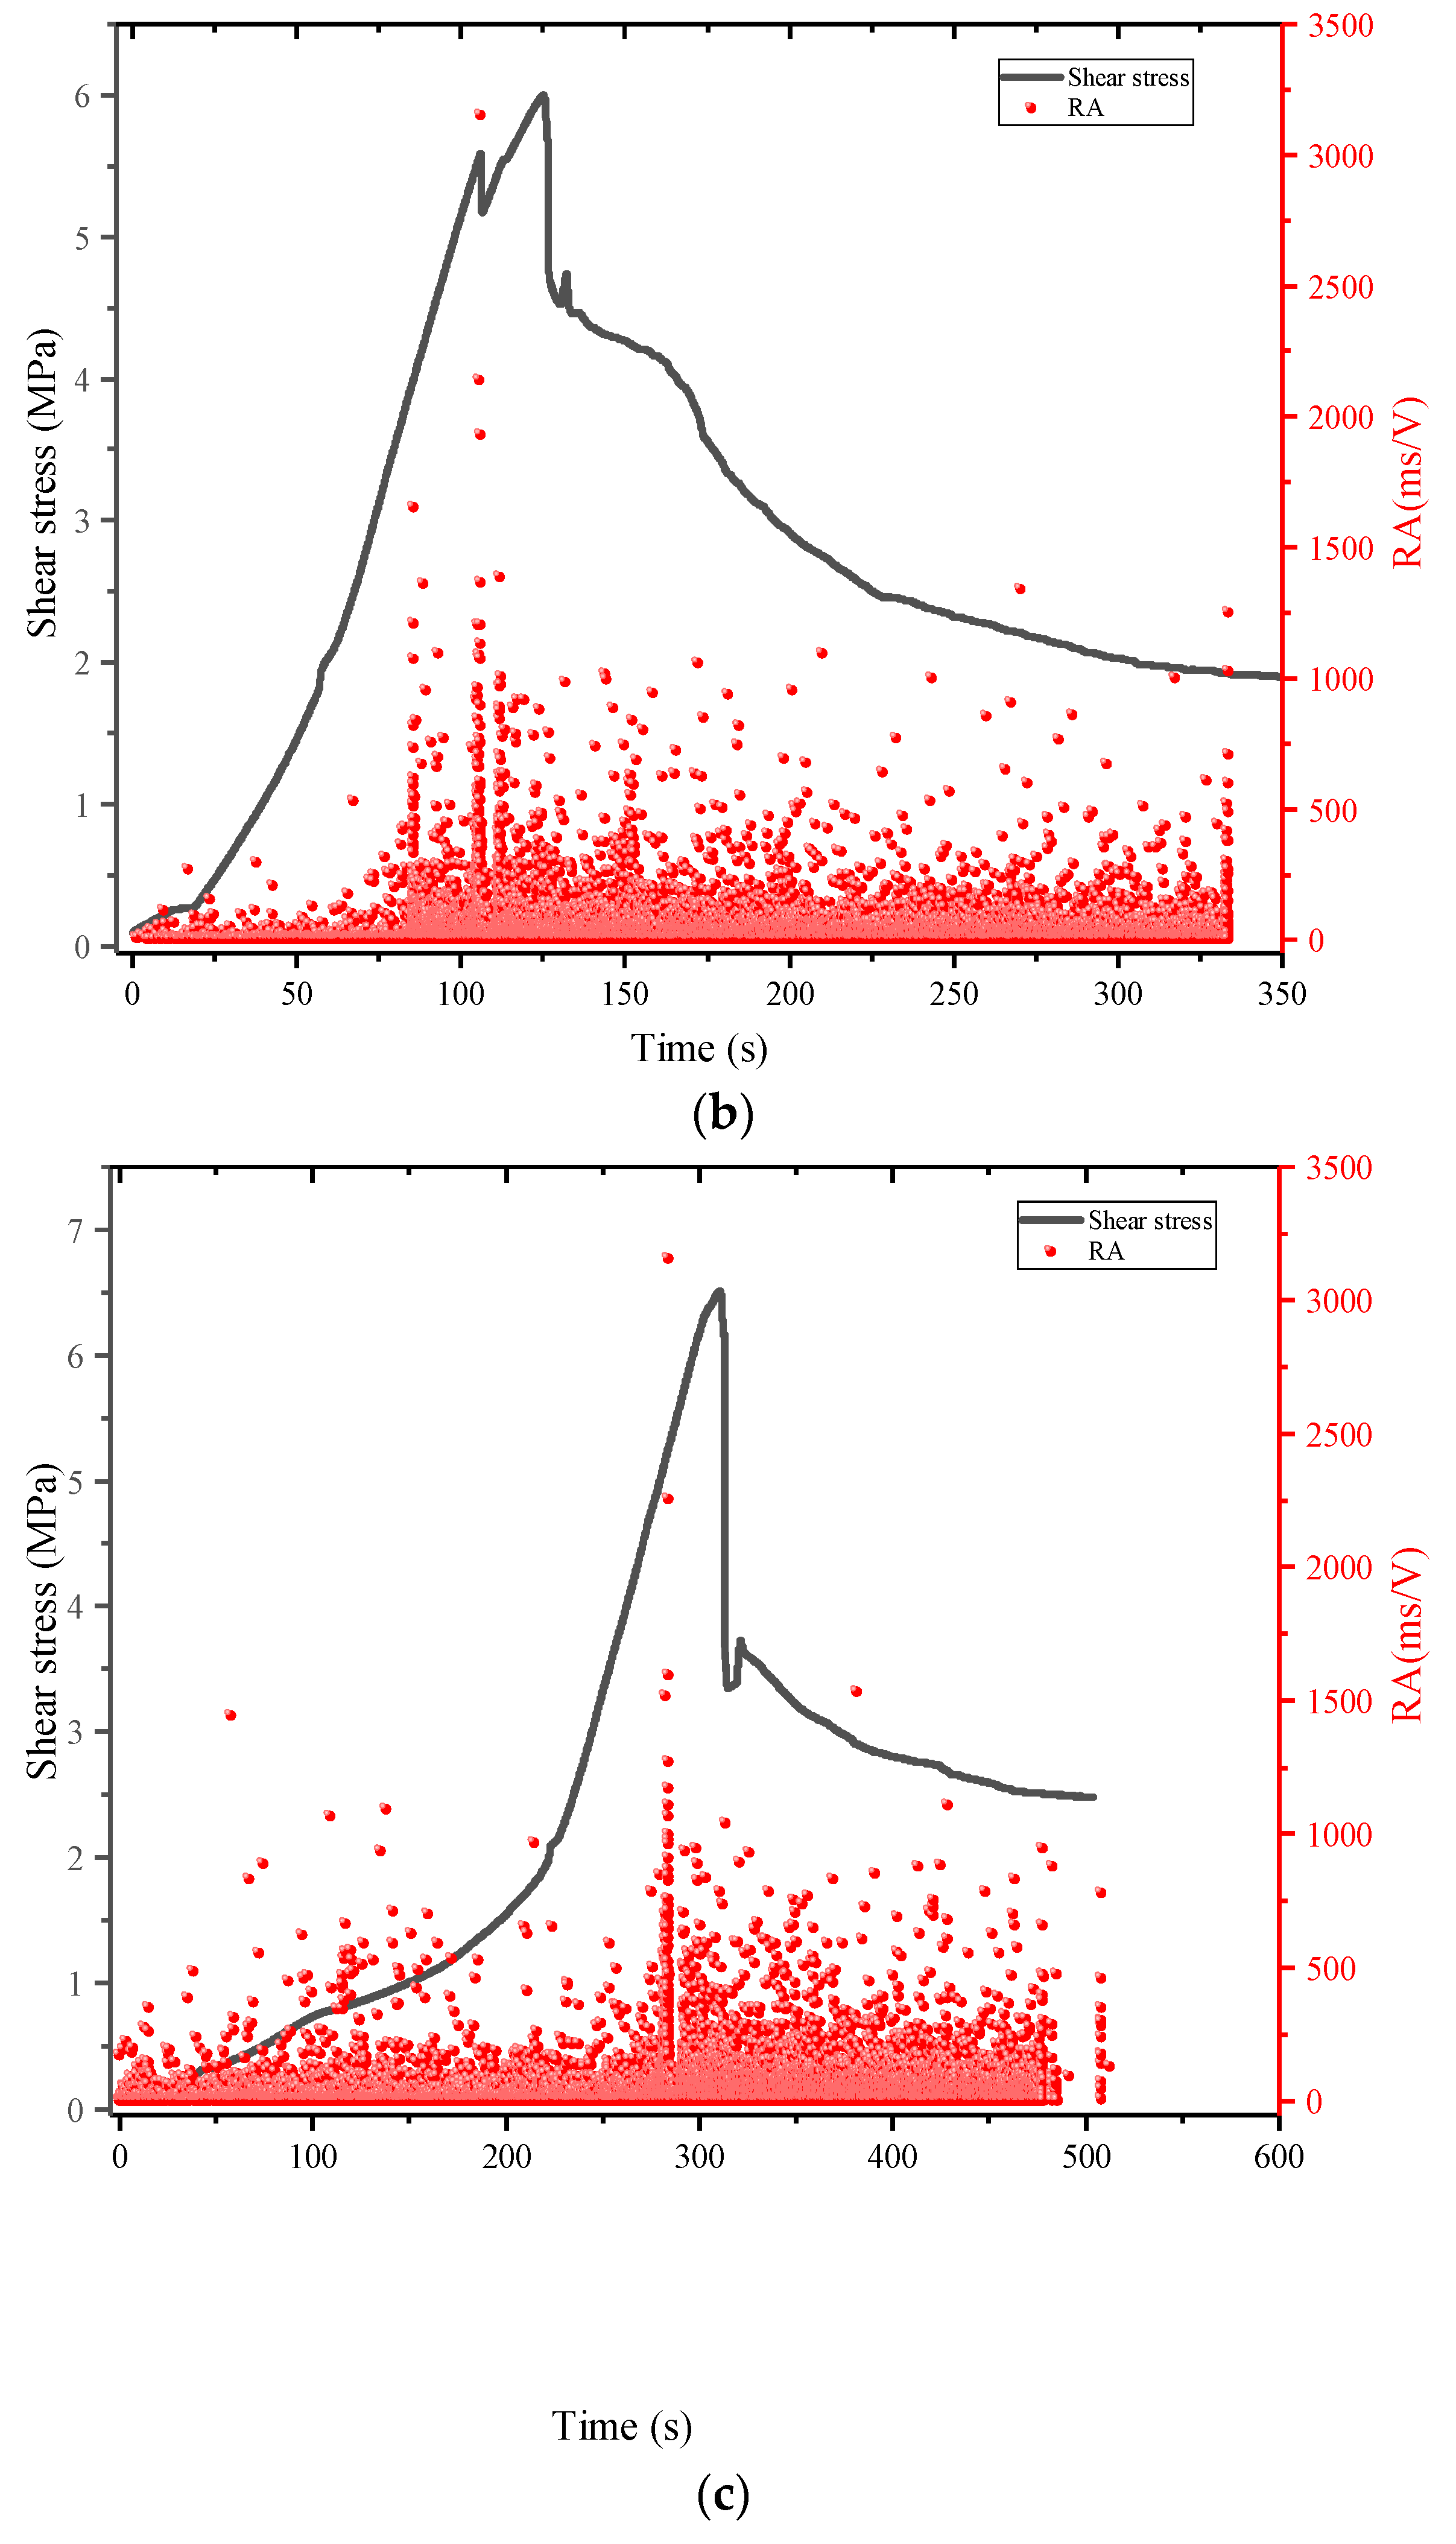
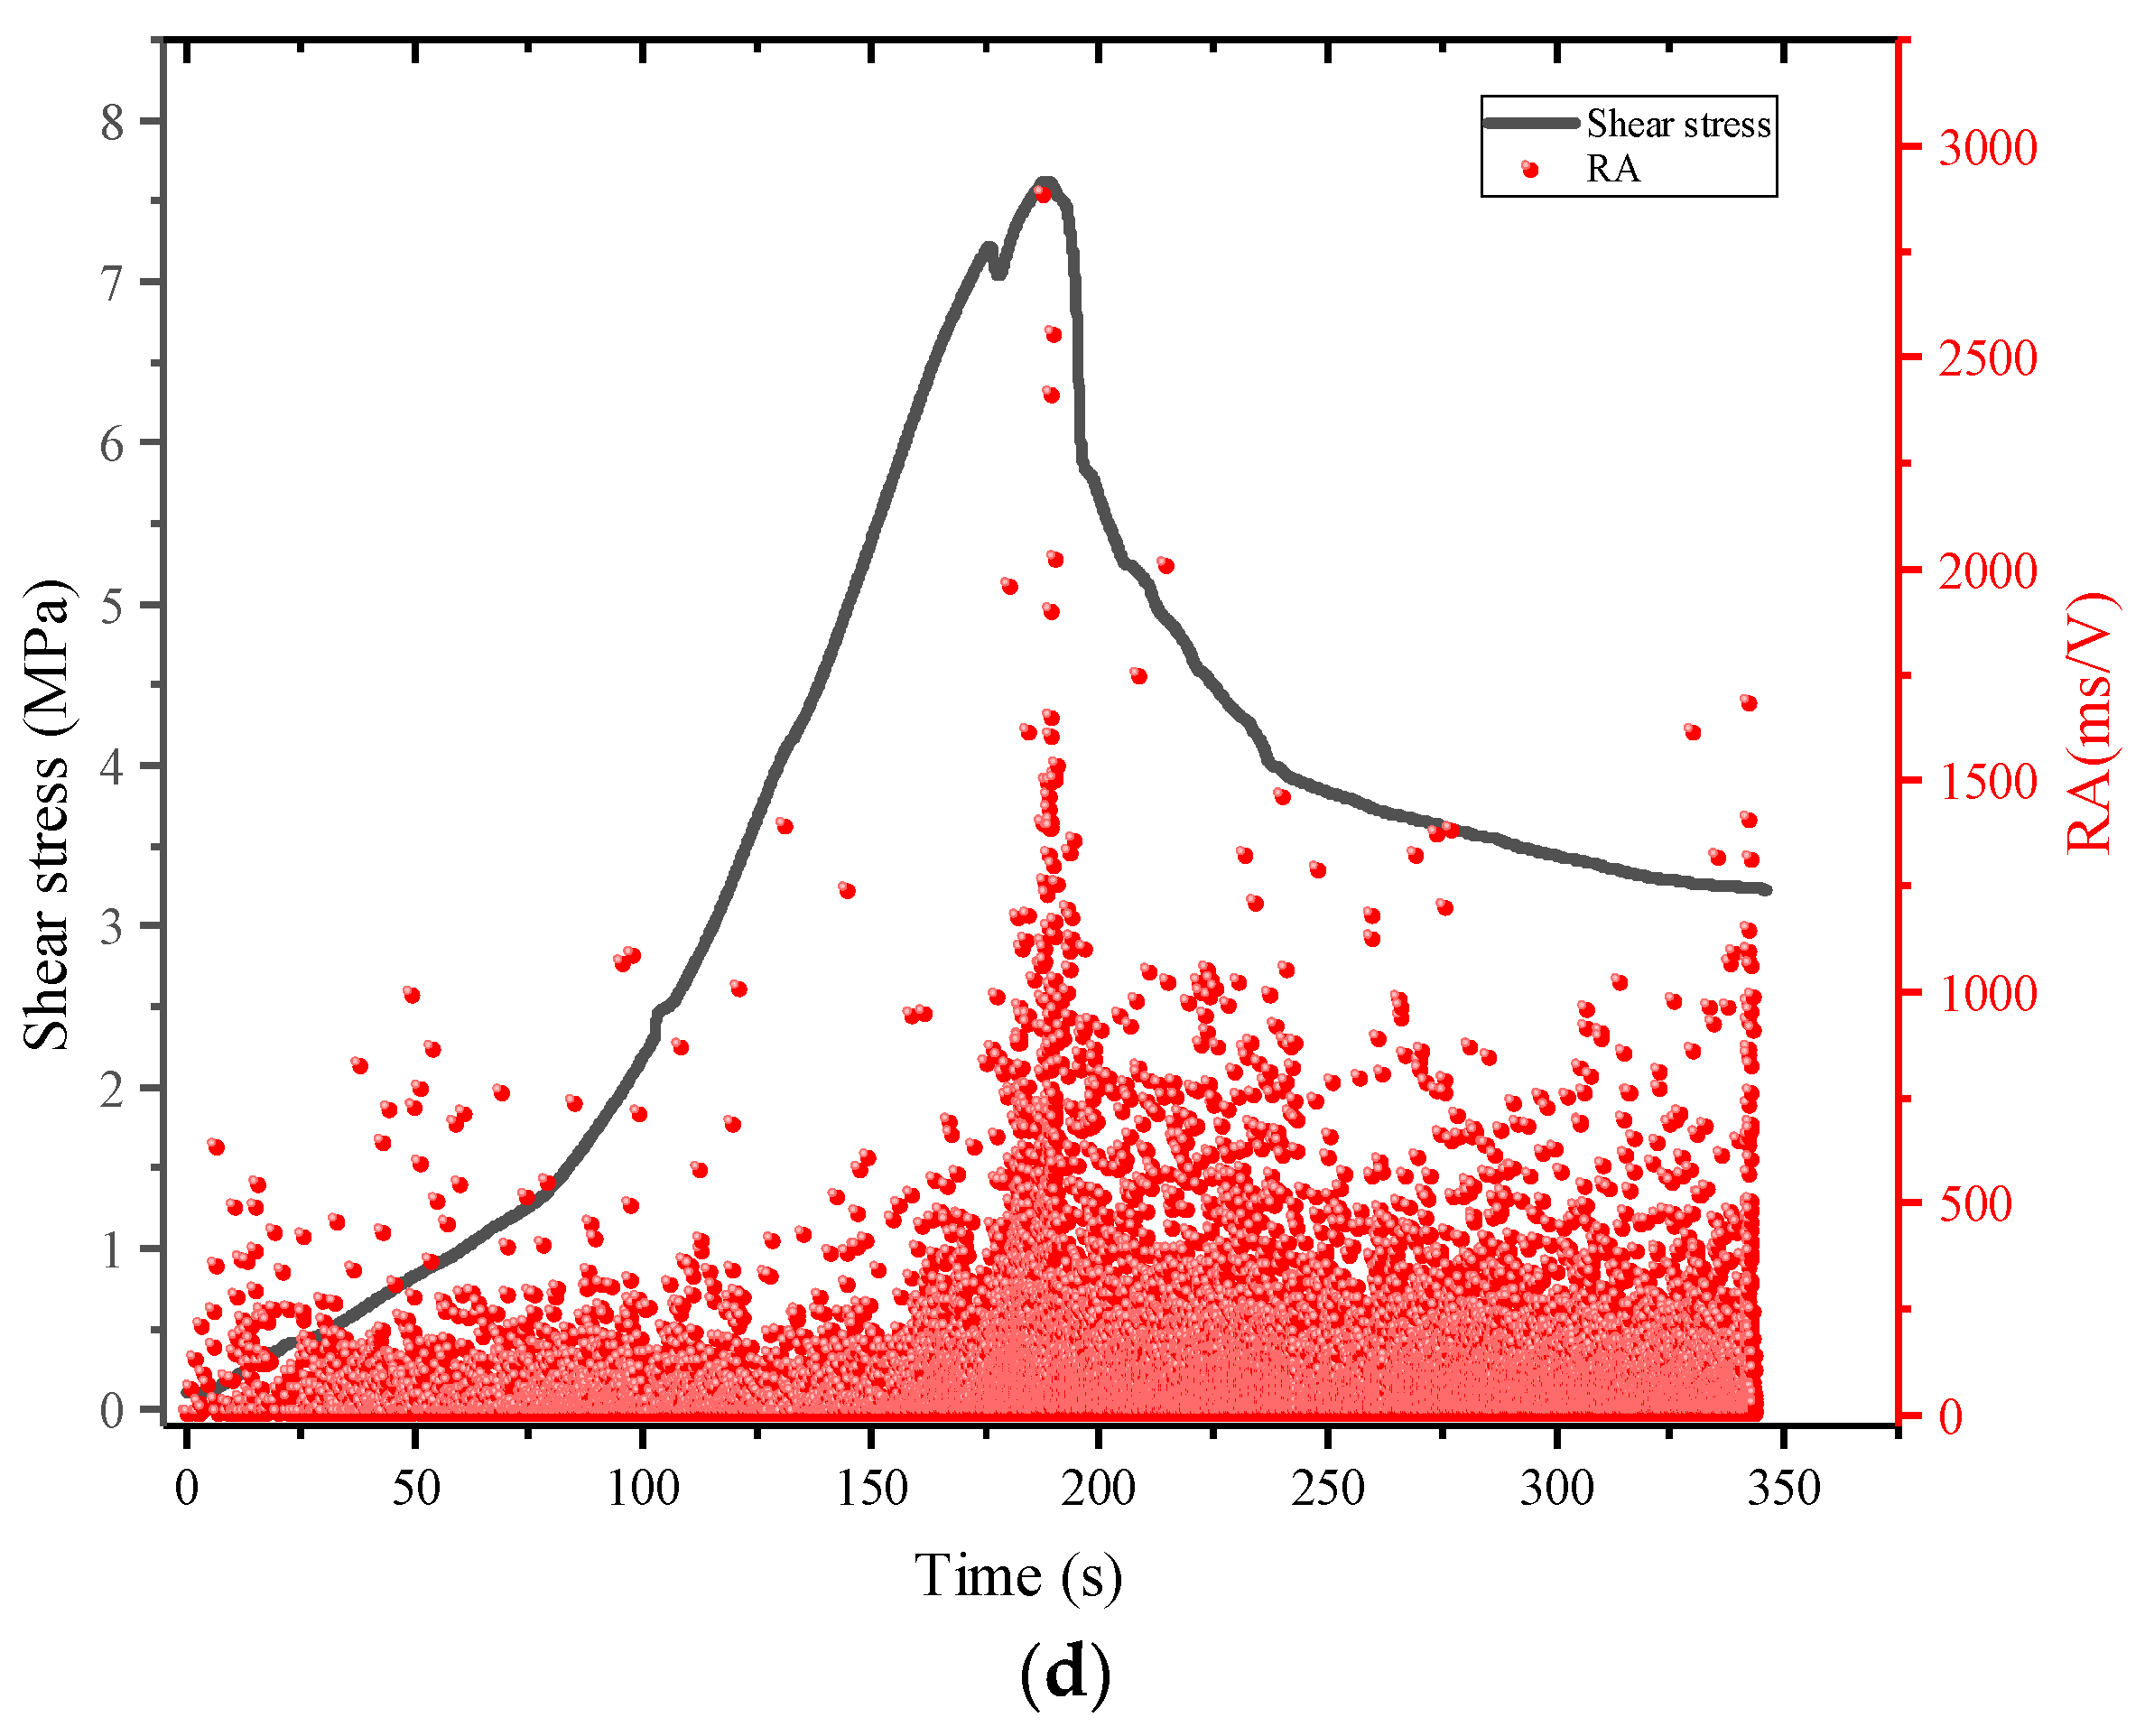
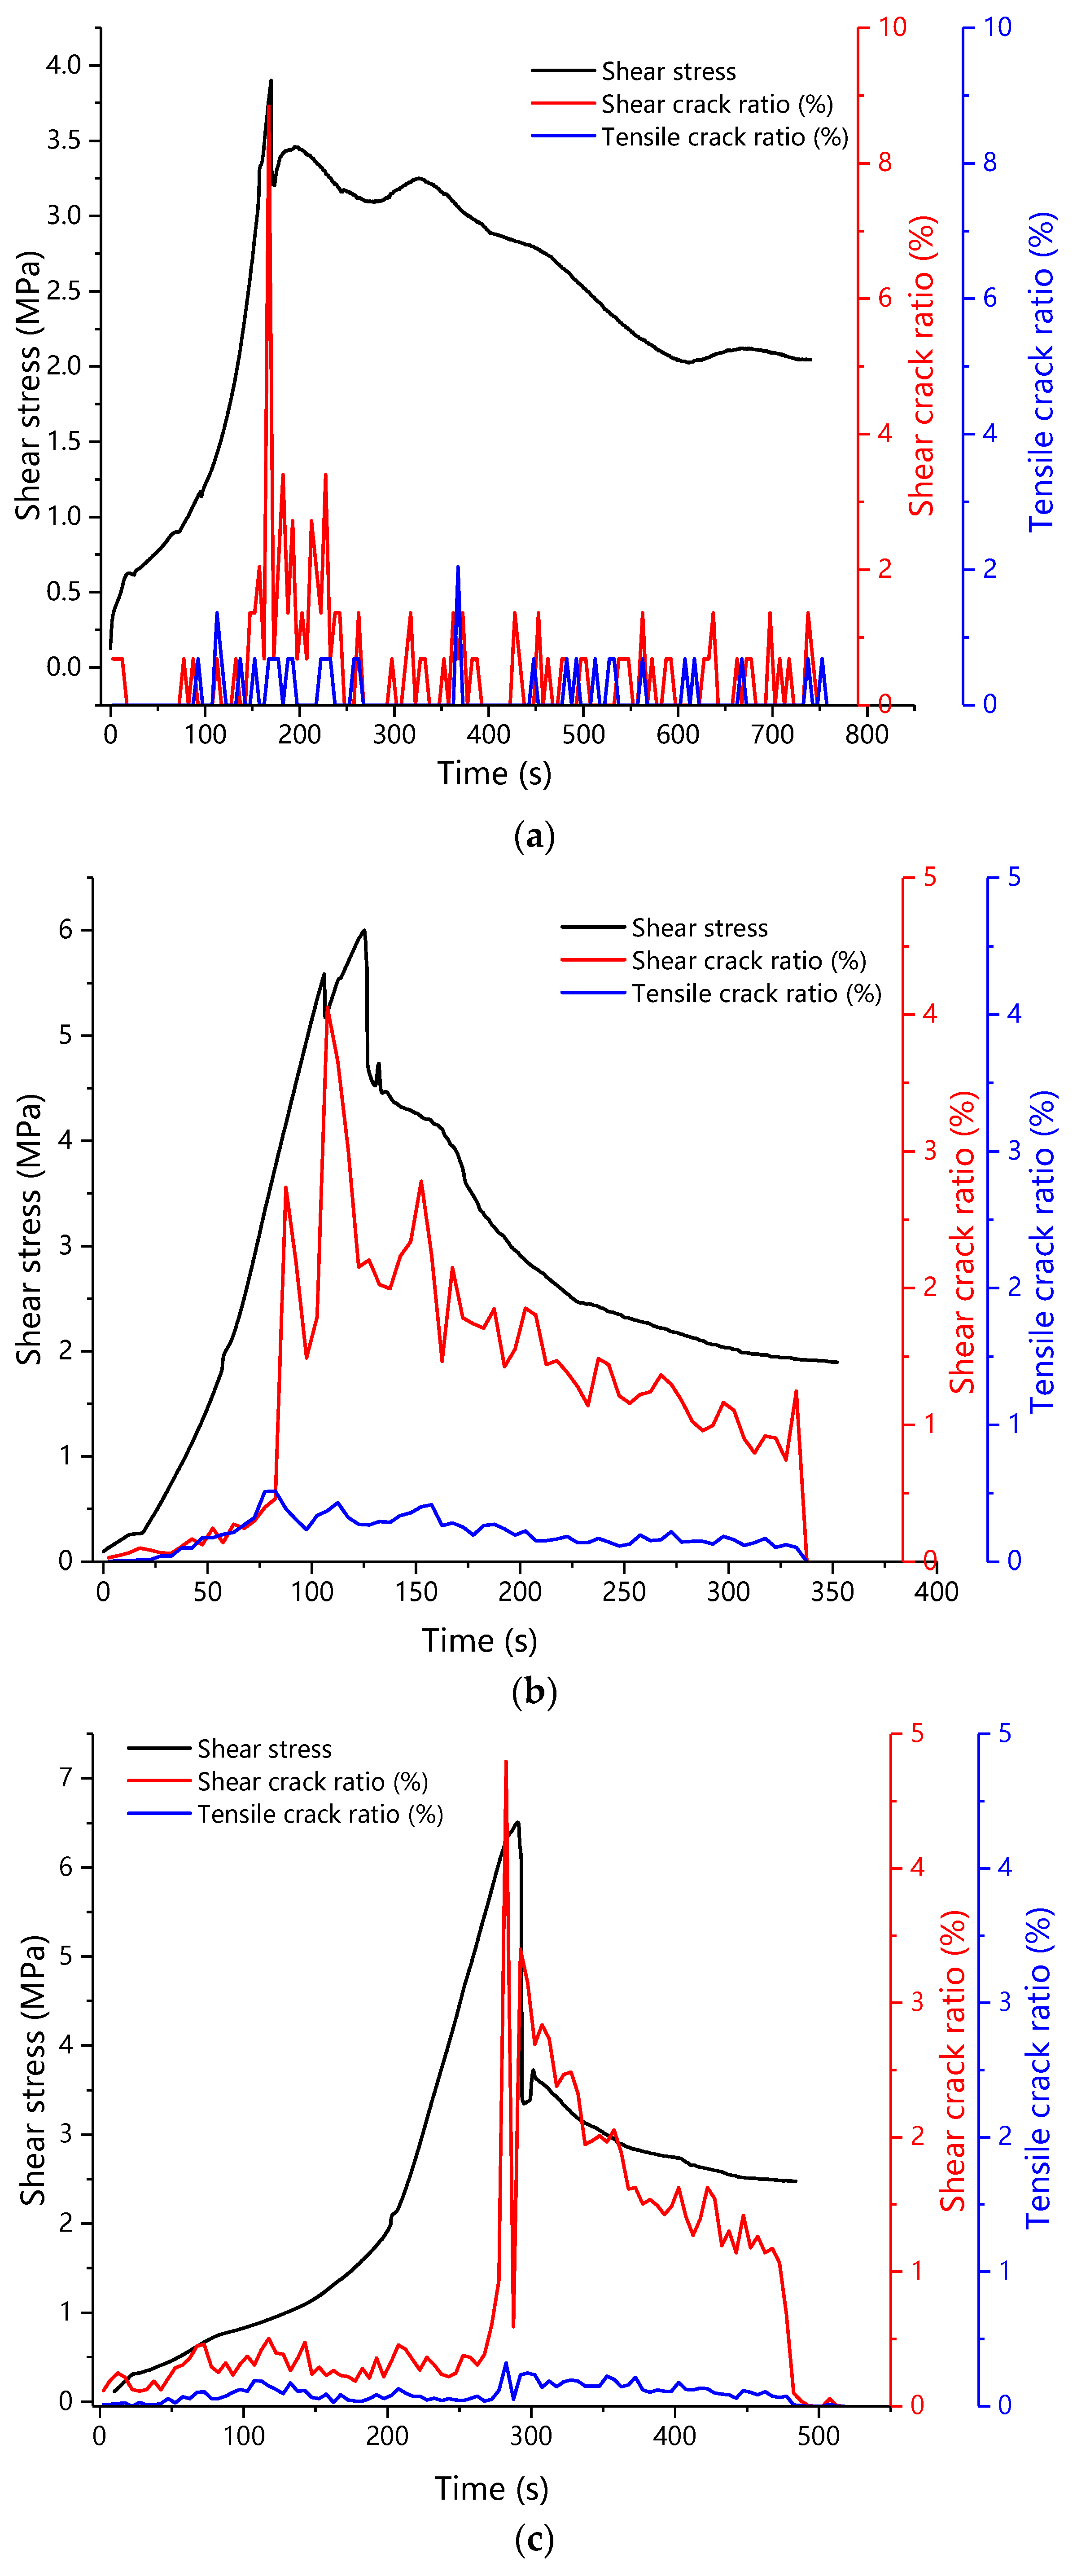
3.2.3. Crack Identification Analysis
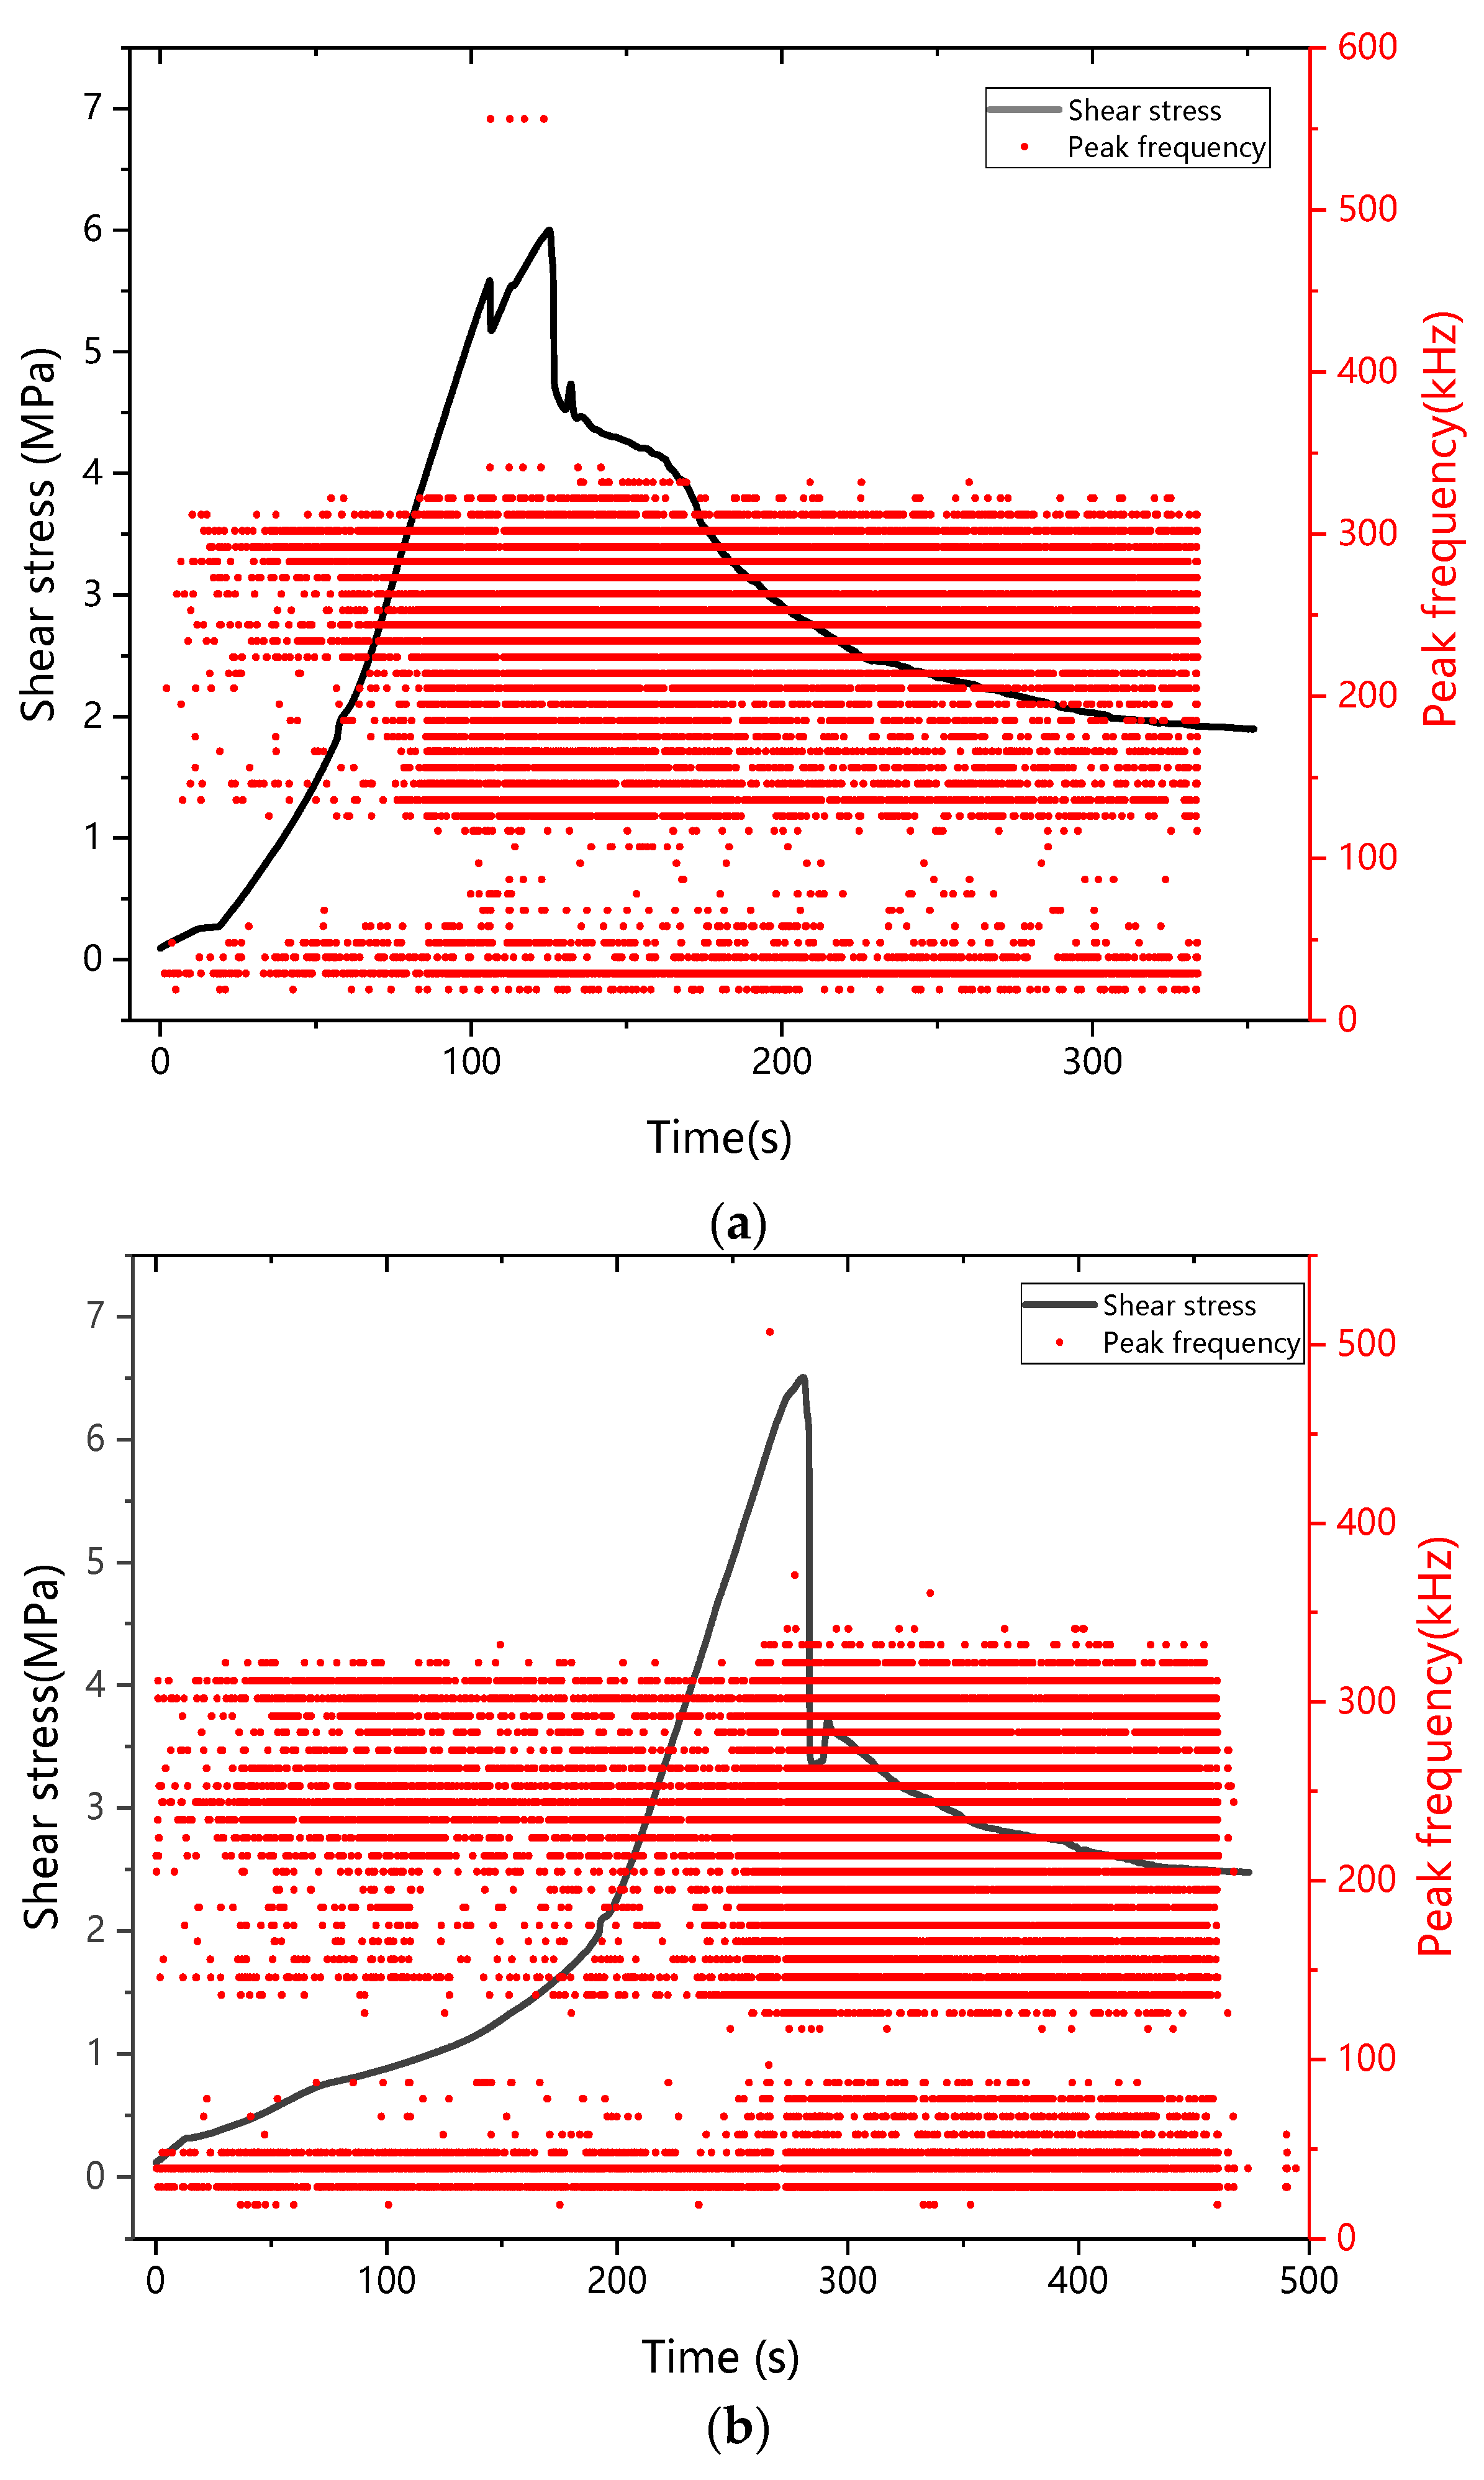
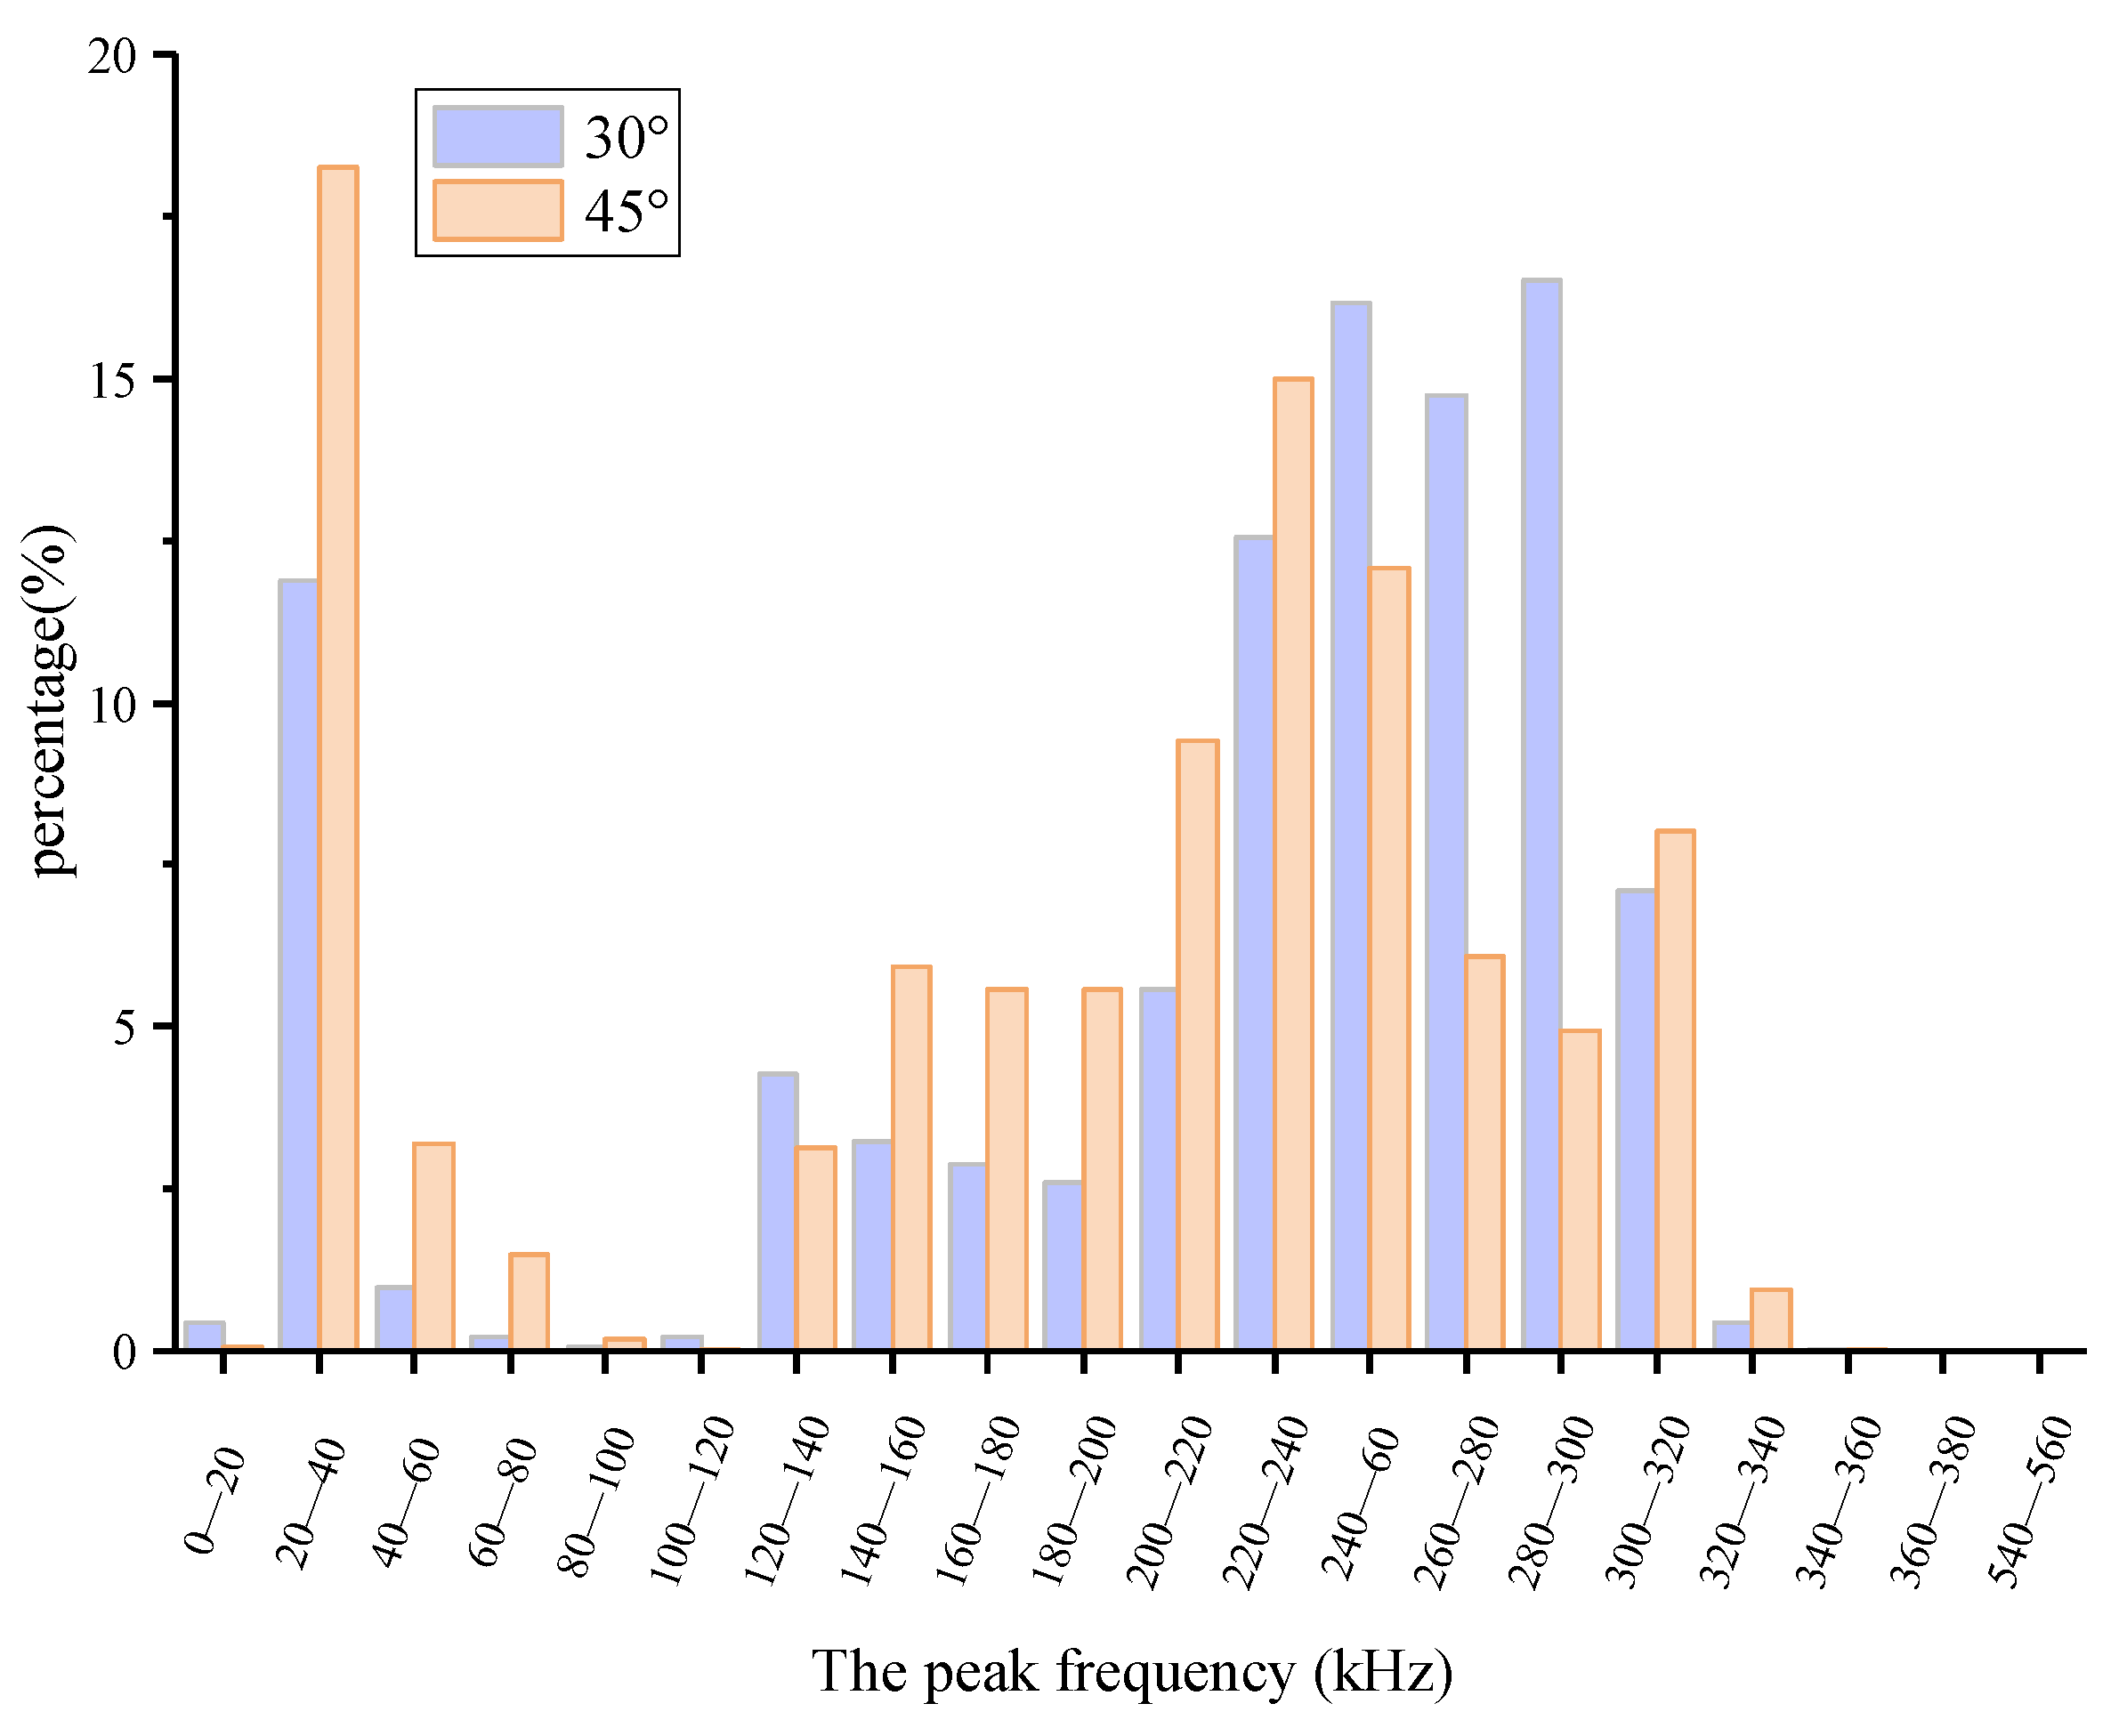
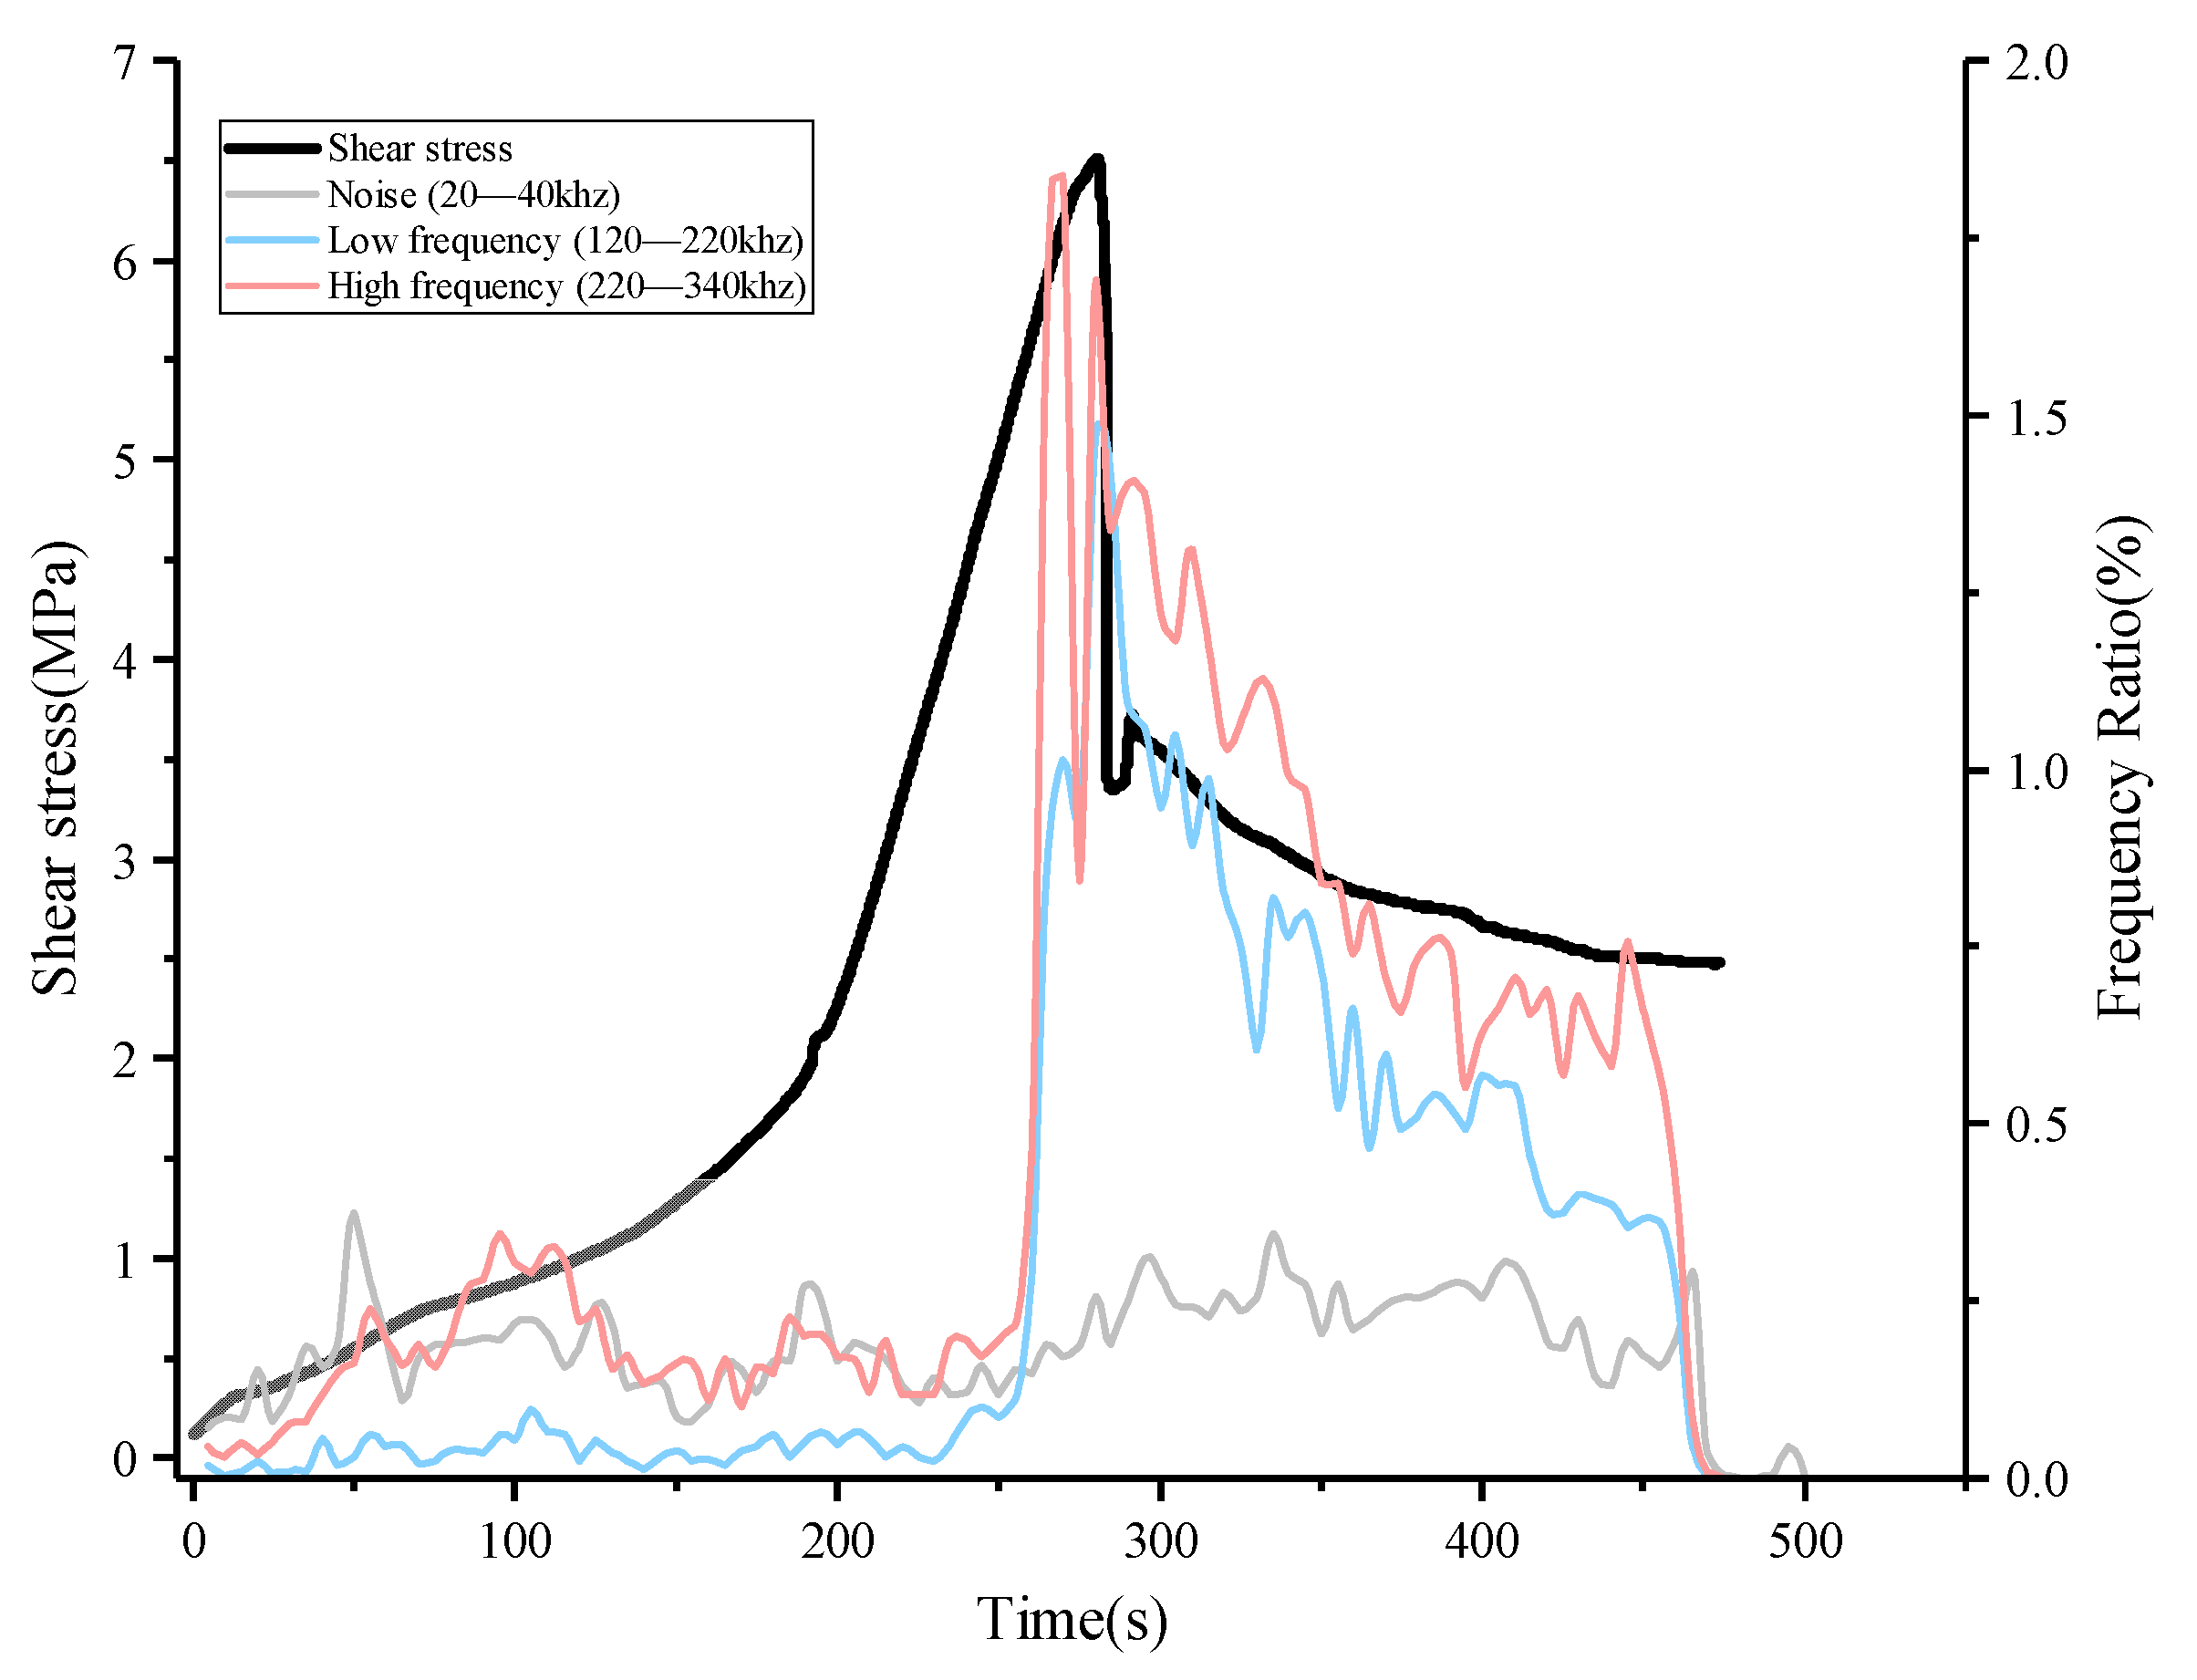
3.2.4. Peak Frequency Analysis
4. Conclusions
- The direct shear process of the mortar-rock binary medium is divided into five stages. There is a linear relationship between the shear strength of the binary medium and the normal stress, and the relationship between the sawtooth angle and the shear strength of the binary medium, cohesive force, internal friction angle, and residual in-ternal friction angle is established.
- The AE count and cumulative count of the binary medium direct shear test are both affected by the interface roughness. The greater the sawtooth angle, the greater the AE count and cumulative count.
- In the plastic failure stage, the AE b value will decrease suddenly, and the proportion of shear cracks in the specimen will increase suddenly. The sudden drop of the AE b value and the sudden increase of the shear crack signal ratio can be used as reference indicators for predicting the macroscopic damage of mor-tar-rock binary medium.
- The shear and tensile cracks are distinguished and their proportion is statistically analyzed. With the increase of shear stress, the number of shear cracks increases suddenly, but the change of tensile cracks is little. The development of shear cracks plays a decisive role in the failure of specimens in the shear failure stage. The variation of AE shear crack number can play a role in the early warning and prediction of structural failure. In the practice of monitoring practical engineering, this parameter can be used as one of the parameters to predict structural failure.
- The peak frequency of shear acoustic emission in the mortar-rock binary medium is distributed in high and low-frequency bands. The effective peak frequency of acoustic emission signal in the direct shear process of binary medium structure is mainly concentrated in 120–340 kHz, and the sudden increase of high-frequency signal (220–320 kHz) has an efficient prediction effect on structural surface damage.
Author Contributions
Funding
Institutional Review Board Statement
Informed Consent Statement
Data Availability Statement
Acknowledgments
Conflicts of Interest
References
- Han, L.; Lin, H.; Chen, Y.; Lei, D. Effects of strength property difference on shear strength of joint of binary media. Environ. Earth Sci. 2021, 80, 712. [Google Scholar] [CrossRef]
- Shen, Y.; Wang, Y.; Yang, Y.; Sun, Q.; Luo, T.; Zhang, H. Influence of surface roughness and hydrophilicity on bonding strength of concrete-rock interface. Constr. Build. Materials. 2019, 213, 156–166. [Google Scholar] [CrossRef]
- Suits, L.D.; Sheahan, T.C.; Seidel, J.P.; Haberfield, C.M. Laboratory Testing of Concrete-rock Joints in Constant Normal Stiffness Direct Shear. Geotech. Test. J. 2002, 25, 391–404. [Google Scholar]
- Zhao, Y.; Chang, L.; Wang, Y.; Lin, H.; Liao, J.; Liu, Q. Dynamic response of cylindrical thick-walled granite specimen with clay infilling subjected to dynamic loading. Arch. Appl. Mech. 2022, 92, 643–648. [Google Scholar] [CrossRef]
- Fan, X.; Yu, H.; Deng, Z.; He, Z.; Zhao, Y. Cracking and deformation of cuboidal sandstone with a single nonpenetrating flaw under uniaxial compression. Theor. Appl. Fract. Mech. 2022, 119, 103284. [Google Scholar] [CrossRef]
- Fan, X.; Yang, Z.; Li, K. Effects of the lining structure on mechanical and fracturing behaviors of four-arc shaped tunnels in a jointed rock mass under uniaxial compression. Theor. Appl. Fract. Mech. 2021, 112, 102887. [Google Scholar] [CrossRef]
- LYBIMOVE, C.; Pinns, E. Crystallization Structure in Concrete Contact Zone between aggregate and cement in concrete. Colloid J. 1962, 24, 491–498. [Google Scholar]
- Qiu, H.; Wang, F.; Zhu, Z.; Wang, M.; Yu, D.; Luo, C.; Wan, D. Study on dynamic fracture behaviour and fracture toughness in rock-mortar interface under impact load. Compos. Struct. 2021, 271, 114174. [Google Scholar] [CrossRef]
- Chen, L.; Yue, C.; Zhou, Y.; Zhang, J.; Jiang, X.; Fang, Q. Experimental and mesoscopic study of dynamic tensile properties of concrete using direct-tension technique. Int. J. Impact Eng. 2021, 155, 103895. [Google Scholar] [CrossRef]
- Feng, X.T.; Li, S.J.; Chen, S.L. Effect of water chemical corrosion on strength and cracking characteristics of rocks—A review. In Advances in Fracture and Failure Prevention, Pts 1 and 2; Kishimoto, K., Kikuchi, M., Shoji, T., Saka, M., Eds.; Trans Tech Publications Ltd.: Bäch SZ, Switzerland, 2004; pp. 1355–1360. [Google Scholar]
- Qiu, H.; Zhu, Z.; Wang, F.; Wang, M.; Mao, H. Dynamic behavior of a running crack crossing mortar-rock interface under impacting load. Eng. Fract. Mech. 2020, 240, 107202. [Google Scholar] [CrossRef]
- Wang, H.W.; Wu, Z.M.; Wang, Y.J.; Yu, R.C. Investigation on crack propagation perpendicular to mortar–rock interface: Experimental and numerical. Int. J. Fract. 2020, 226, 45–69. [Google Scholar] [CrossRef]
- Satoh, A.; Yamada, K.; Shinohara, Y. Simulation of Adhesion Performance of Mortar—Mortar Interface with Varied Fractographic Features. Key Eng. Mater. 2013, 577, 357–360. [Google Scholar] [CrossRef]
- Buzzi, O.; Hans, J.; Boulon, M.; Deleruyelle, F.; Besnus, F. Hydromechanical study of rock-mortar interfaces. Phys. Chem. Earth. 2007, 32, 820–831. [Google Scholar] [CrossRef]
- Wang, Y.; Chen, S.J.; Zhao, H.T.; Chen, Y.Z. Acoustic emission characteristics of interface between aggregate and mortar under shear loading. Russ. J. Nondestruct. Test. 2015, 51, 497–508. [Google Scholar] [CrossRef]
- Lin, H.; Zhang, X.; Cao, R.; Wen, Z. Improved nonlinear Burgers shear creep model based on the time-dependent shear strength for rock. Environ. Earth Sci. 2020, 79, 149. [Google Scholar] [CrossRef]
- Tang, Z.C.; Zhang, Q.Z.; Peng, J.; Jiao, Y.Y. Experimental study on the water-weakening shear behaviors of sandstone joints collected from the middle region of Yunnan province, P.R. China. Eng. Geol. 2019, 258, 105161. [Google Scholar] [CrossRef]
- Fan, X.; Li, K.; Lai, H.; Zhao, Q.; Sun, Z. Experimental and numerical study of the failure behavior of intermittent rock joints subjected to direct shear load. Adv. Civ. Eng. 2018, 2018, 19. [Google Scholar] [CrossRef] [Green Version]
- Cheng, Y.; Yang, W.; He, D. Influence of structural plane microscopic parameters on direct shear strength. Adv. Civ. Eng. 2018, 2018, 7. [Google Scholar] [CrossRef] [Green Version]
- Xie, S.; Lin, H.; Cheng, C.; Chen, Y.; Wang, Y.; Zhao, Y.; Yong, W. Shear strength model of joints based on Gaussian smoothing method and macro-micro roughness. Comput. Geotech. 2022, 143, 104605. [Google Scholar] [CrossRef]
- Du, S.-G.; Lin, H.; Yong, R.; Liu, G.-J. Characterization of Joint Roughness Heterogeneity and Its Application in Representative Sample Investigations. Rock Mech. Rock Eng. 2022, 1–25. [Google Scholar] [CrossRef]
- Zhao, Y.; Zhang, C.; Wang, Y.; Lin, H. Shear-related roughness classification and strength model of natural rock joint based on fuzzy comprehensive evaluation. Int. J. Rock Mech. Min. Sci. 2021, 137, 104550. [Google Scholar] [CrossRef]
- Wang, C.; Wang, L.; Karakus, M. A new spectral analysis method for determining the joint roughness coefficient of rock joints. Int. J. Rock Mech. Min. Sci. 2019, 113, 72–82. [Google Scholar] [CrossRef]
- Lin, Q.; Cao, P.; Cao, R.; Lin, H.; Meng, J. Mechanical behavior around double circular openings in a jointed rock mass under uniaxial compression. Arch. Civ. Mech. Eng. 2020, 20, 19. [Google Scholar] [CrossRef] [Green Version]
- Naderloo, M.; Moosavi, M.; Ahmadi, M. Using acoustic emission technique to monitor damage progress around joints in brittle materials. Theor. Appl. Fract. Mech. 2019, 104, 102368. [Google Scholar] [CrossRef]
- 0276.25-2015 DT. Part 25: Test for determining the shear strength of rock. In Regulation for Testing the Physical and Mechanical Properties of Rock; Ministry of Land and Resources: Beijing, China, 2015.
- Ge, Z.; Sun, Q. Acoustic emission characteristics of gabbro after microwave heating. Int. J. Rock Mech. Min. Sci. 2021, 138, 104616. [Google Scholar] [CrossRef]
- JC MS-III B5706. Monitoring Method for Active Cracks in Concrete by Acoustic Emission. Federation of Construction Materials Industries Japan: Tokyo, Japan, 2003.
- Physical Acoustics Corporation. SAMOS AE System User’s Manual; Physical Acoustics Corporation: Princeton Junction, NJ, USA, 2005. [Google Scholar]
- Ohno, K.; Ohtsu, M. Crack classification in concrete based on acoustic emission. Constr. Build. Mater. 2010, 24, 2339–2346. [Google Scholar] [CrossRef]
- Aggelis, D.G. Classification of cracking mode in concrete by acoustic emission parameters. Mech. Res. Commun. 2011, 38, 3–157. [Google Scholar] [CrossRef]
- Shahidan, S.; Pulin, R.; Bunnori, N.M.; Holford, K.M. Damage classification in reinforced concrete beam by acoustic emission signal analysis. Constr. Build. Mater. 2013, 45, 78–86. [Google Scholar] [CrossRef] [Green Version]
- Degala, S.; Rizzo, P.; Ramanathan, K.; Harries, K.A. Acoustic emission monitoring of CFRP reinforced concrete slabs. Constr. Build. Mater. 2009, 23, 2016–2026. [Google Scholar] [CrossRef]


| Normal Stress | The Value of k | ||||
|---|---|---|---|---|---|
| Sawtooth Angle of 8° | Sawtooth Angle of 30° | Sawtooth Angle of 45° | Sawtooth Angle of 55° | Intact Rock | |
| 1 MPa | 1.74 | 3.46 | 5.72 | 5.61 | 12.01 |
| 2 MPa | 1.75 | 4.83 | 6.07 | 7.21 | 13.23 |
| 3 MPa | 5.85 | 8.06 | 5.79 | 8.03 | 15.58 |
| 4 MPa | 6.45 | 5.67 | 6.26 | 8.82 | 16.21 |
| 5 MPa | 6.92 | 9.29 | 8.02 | 11.59 | 18.56 |
Publisher’s Note: MDPI stays neutral with regard to jurisdictional claims in published maps and institutional affiliations. |
© 2022 by the authors. Licensee MDPI, Basel, Switzerland. This article is an open access article distributed under the terms and conditions of the Creative Commons Attribution (CC BY) license (https://creativecommons.org/licenses/by/4.0/).
Share and Cite
Tang, W.; Lin, H.; Chen, Y.; Feng, J.; Hu, H. Mechanical Characteristics and Acoustic Emission Characteristics of Mortar-Rock Binary Medium. Buildings 2022, 12, 665. https://doi.org/10.3390/buildings12050665
Tang W, Lin H, Chen Y, Feng J, Hu H. Mechanical Characteristics and Acoustic Emission Characteristics of Mortar-Rock Binary Medium. Buildings. 2022; 12(5):665. https://doi.org/10.3390/buildings12050665
Chicago/Turabian StyleTang, Wenyu, Hang Lin, Yifan Chen, Jingjing Feng, and Huihua Hu. 2022. "Mechanical Characteristics and Acoustic Emission Characteristics of Mortar-Rock Binary Medium" Buildings 12, no. 5: 665. https://doi.org/10.3390/buildings12050665