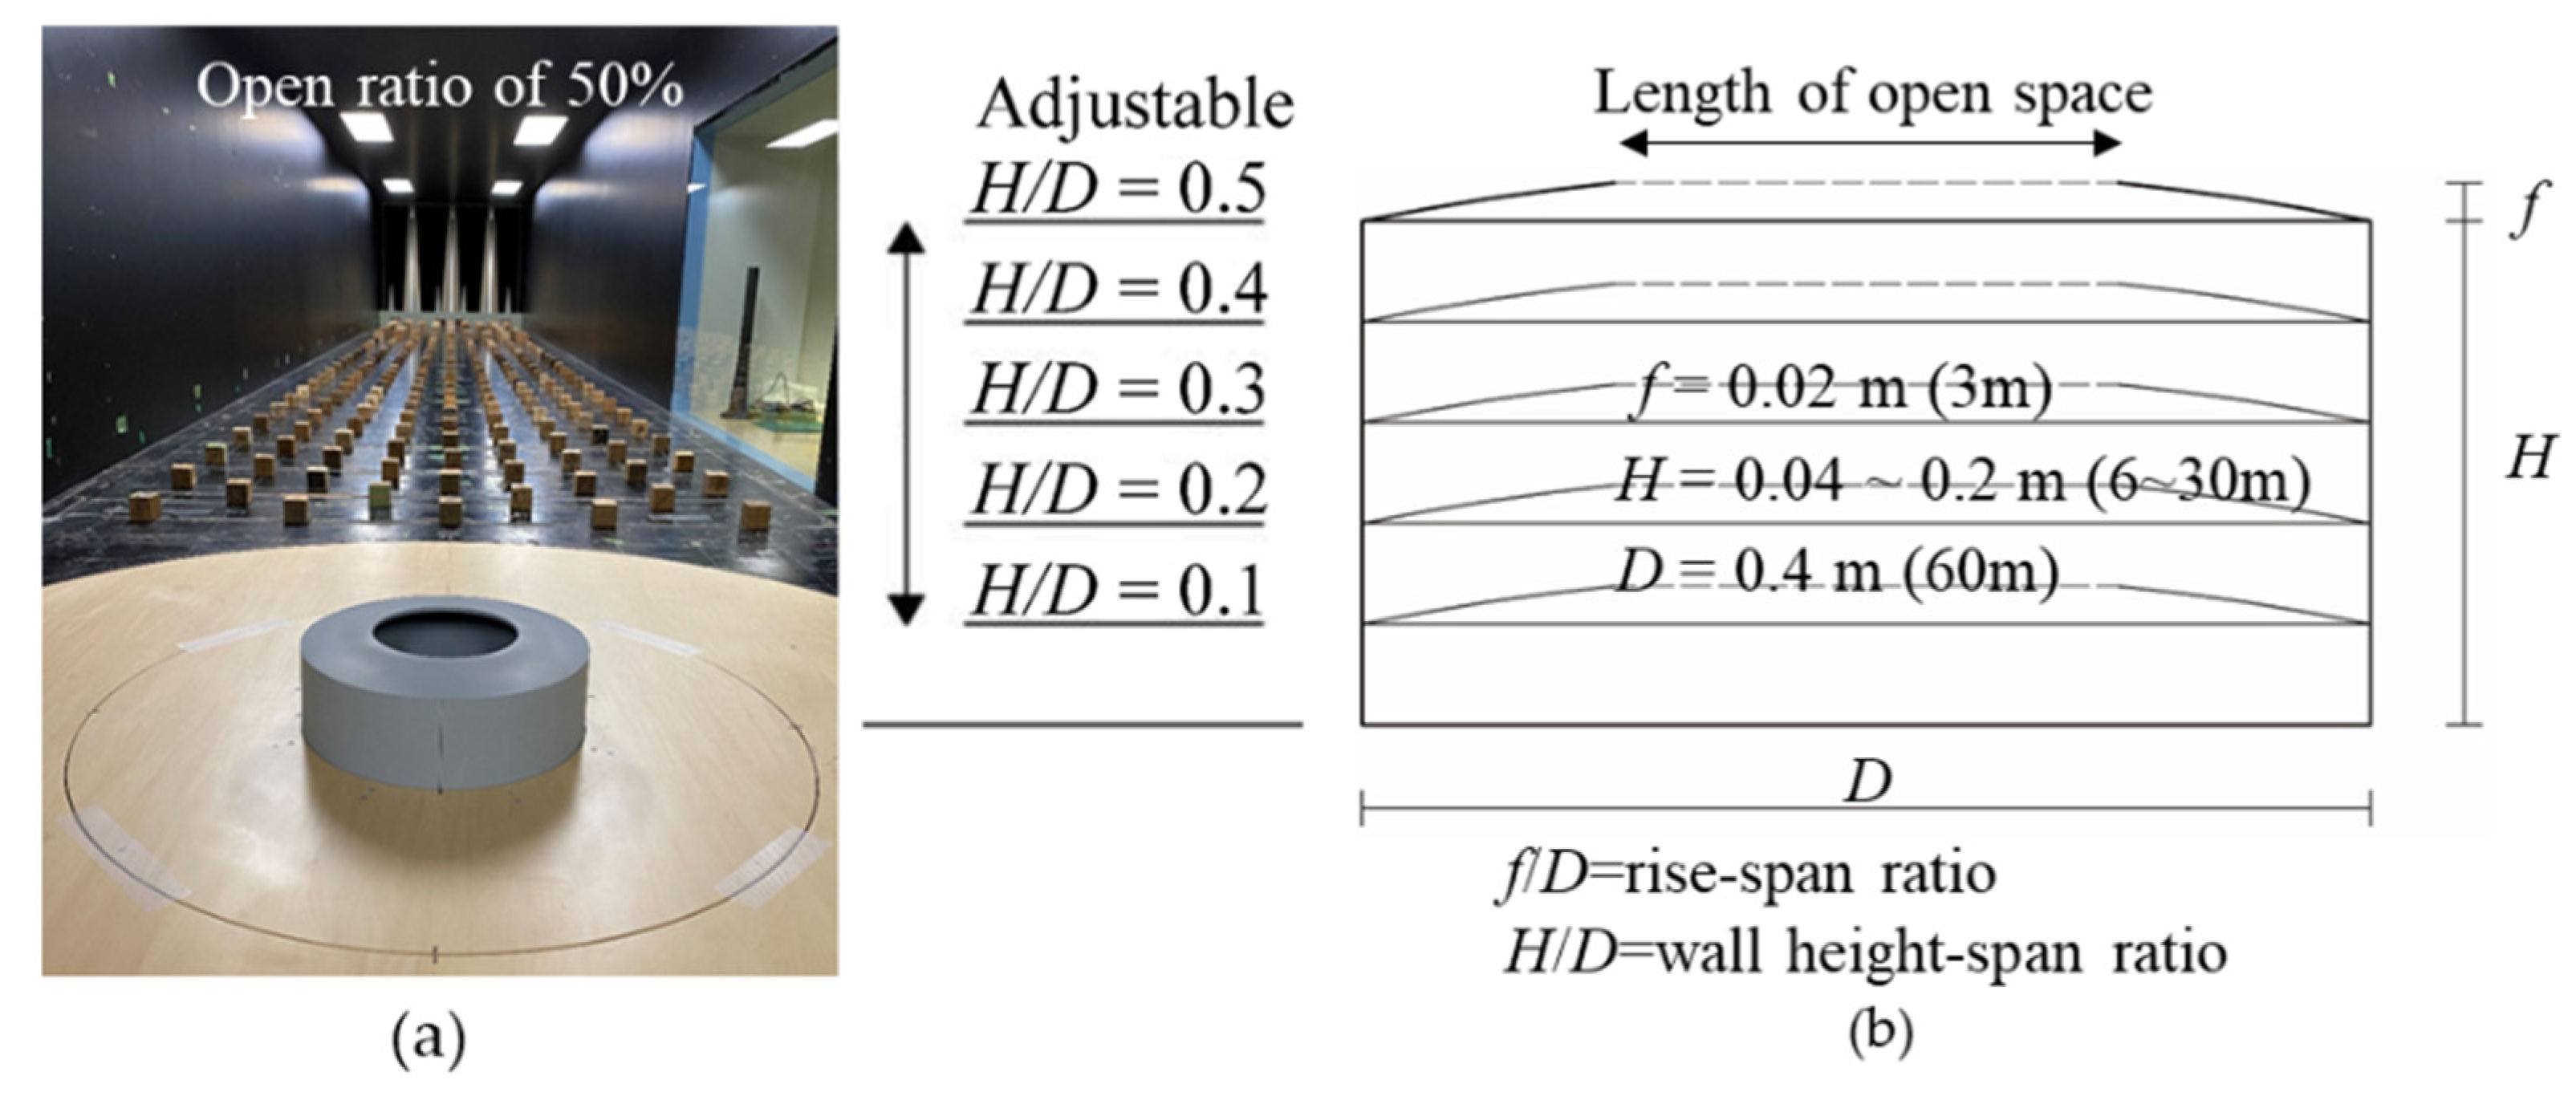
Article

Wind Pressure Characteristics Based on the Rise–Span Ratio of Spherical Domes with Openings on the Roof

1
School of Civil, Environmental and Architectural Engineering, Korea University, Seoul 02841, Korea
2
Department of Architecture, Seoul National University of Science & Technology, 232, Gongneung-ro, Nowon-gu, Seoul 01811, Korea
3
Department of Architecture, Tokyo Polytech University, Atsugi 243-0297, Japan
*
Author to whom correspondence should be addressed.
Buildings 2022, 12(5), 576; https://doi.org/10.3390/buildings12050576
Submission received: 24 March 2022 / Revised: 23 April 2022 / Accepted: 27 April 2022 / Published: 29 April 2022
(This article belongs to the Section Building Structures)

Abstract

:
Wind loads are a primary concern in dome roof structures with openings such as retractable dome roofs. This is because the openings can cause damage to the cladding owing to high internal pressure. In this study, the wind pressure characteristics of a dome with an opening that varied based on the opening, rise–span ratio, and height span were examined by comparing the results from wind tunnel tests with those from previous studies. The negative pressure dominated the internal pressure of the roof in all regions and was not significantly affected by changes in the rise–span and height–span ratios. The reattachment distance of the windward region increased as the rise–span ratio increased, increasing the negative net pressure and decreasing the positive net pressure owing to a relatively large vortex. The roof inclination angle of the leeward region decreased as the rise–span ratio decreased, resulting in a decrease in the negative net pressure and an increase in the positive net pressure owing to a relatively small vortex. Based on the experimental results, a peak net pressure coefficient for cladding design was proposed for an open dome roof with a rise–span ratio of 0.05.

1. Introduction

Dome roofs, which are primarily used for spatial structures such as stadiums, are sensitive to wind loads owing to the use of long-span structures and light materials. Therefore, wind loads are a primary concern in the design of dome roofs. Consequently, various studies have been conducted to investigate the distributions of the wind pressures on dome roofs, particularly on enclosed dome roofs. Uematsu et al. [1] conducted experiments on various rise–span ratios (hereinafter referred to as f/D) and height–span ratios (hereinafter referred to as H/D) to investigate wind pressure distributions based on the shape of a dome roof. The results confirmed that a change in f/D exerted a more significant effect on the change in the pressure distribution than a change in H/D. Letchford and Sakar [2] investigated mean and fluctuating pressure distributions based on the surface roughness of dome roofs with high f/D values. They discovered that the surface roughness reduced the suction over the apex of the dome and increased the suction in the wake region on the leeward face. Cheng and Fu [3] conducted experiments based on various Reynolds numbers and confirmed that the separation point varied according to the change in Reynolds number. In addition, they confirmed that the distribution of wind pressure was the most stable when the Reynolds number was between 1.0 × 10⁵ and 2.0 × 10⁵. Noguchi and Uematsu [4] conducted wind-tunnel experiments on domes with varying f/D and H/D values and proposed wind pressure coefficients for the main wind-force-resisting frame and cladding. Sun and Qiu [5] proposed a regional wind pressure spectrum model after investigating the characteristics of wind pressure spectra based on various f/D and H/D values for dome roofs. These previous studies on enclosed dome roofs showed that f/D has the most significant effect on wind pressure characteristics.
Recently, the demand for retractable dome roof structures that remain unaffected by weather has increased worldwide. Such structures sometimes entail openings in the dome roof. If an opening is present in a building, strong winds can induce a strong internal pressure, causing damage to the cladding. Wang and Li [6] conducted wind tunnel experiments on low-story buildings with openings of various sizes and shapes at the corners of the roof to investigate the external and internal pressures. They confirmed that a positive net pressure occurred owing to the overlap of the external and internal pressures. Cheon et al. [7] investigated cases of cladding damage in dome roofs and confirmed that cladding damage owing to strong winds typically occurred on open or retractable dome roofs (as well as noting incorrect wind load calculations).
Nonetheless, the wind load codes and related studies that can be used as references for designing open-dome roofs are limited [8,9]. Xu et al. [10] investigated the internal pressure of hemiellipsoidal roofs as induced by openings and discovered that it was dominated by negative pressure. Kim et al. [11] investigated the characteristics of wind pressure on circular retractable dome roofs opening from the roof edge to the central direction and proposed an external peak pressure coefficient for cladding design with various opening rates. Lee et al. [12] proposed an external peak pressure coefficient for cladding design for elliptical retractable dome roofs opening from the roof edge in the central direction. Cheon et al. [13] investigated the external and internal wind pressures on dome roofs with the center of the dome open and proposed a peak net pressure coefficient applicable to cladding design.
As explained above, one factor significantly affecting the wind pressure in dome roofs is f/D. Table 1 shows the f/D values for eight retractable dome roofs as investigated by Lee [14]. According to Lee [14] and Ishii [15], the f/D values of constructed open or retractable dome roofs range from 0 to 0.2. Meanwhile, in previous studies on dome roofs with openings, the value of f/D was proposed to be 0.1. Therefore, in this study, the external, internal, and net pressure characteristics of open-dome roofs with low span–rise ratios (f/D = 0.05) and openings were analyzed. In addition, the pressure characteristics were compared with those of previous studies to investigate the wind pressure characteristics based on roof shape characteristics, such as the opening, f/D, and H/D.

2. Wind Tunnel Test

2.1. Model

As shown in Figure 1a, the model used in the experiment simulated a spherical dome with an opening. Figure 1b shows a section of the model, where f, H, and D denote the rise in the dome roof, wall height, and span length, respectively. In this study, a length scale of 1/150 was used. The values of f, H, and D were 0.02 m, 0.04–0.2 m, and 0.4 m, respectively; these values are shown in Figure 2 and Table 2. H was adjusted by 0.04 m by using a turntable with adjustable heights to conduct the test. The opening ratio is defined as the ratio of the span length (D) of the model and diameter of the open space, which are 0.4 m and 0.2 m, respectively. Therefore, the opening ratio is 50%. The specifications of the model are listed in Table 2.
Figure 3 shows the line of pressure taps installed on the model. Ten pressure taps were installed in a single line on the external and internal roof surfaces, totaling 20 pressure taps. Depending on the wind direction, the pressure data were measured from the pressure taps of a single line. The spherical dome roof showed symmetrical values based on the centerline, and data were measured for seven wind directions from 0° to 180° at intervals of 30°. As shown in Figure 3, when the wind direction is 90°, Line 1 becomes Line 4. Similarly, when the wind direction is 180°, Line 1 becomes Line 7. In previous studies, no significant change was observed in the pressure depending on the wind direction for a spherical dome roof [1,3,11,13]. Therefore, in cases where the wind direction was over 180°, data were organized using the value of the symmetrical line.

2.2. Characteristics of Approaching Oncoming Flow and Data Acquisition

The wind tunnel tests were conducted in a large boundary layer wind tunnel (2.2 m (width) × 1.8 m (height)) at Tokyo Polytechnic University, Japan. The oncoming flow was simulated according to the conditions proposed in the Japanese Recommendations for Loads on Buildings (AIJ-RLB) [16]. An urban topography was assumed, and the targeted power law exponent (α) of the mean wind speed profile was set to be 0.21. The mean wind speed and turbulence intensity profiles are shown in Figure 4a. The turbulent boundary layers were reproduced using various spires and roughness blocks. Assuming a wind speed scale of 1/3, for the maximum height of the roof of the model with H/D = 0.5, the mean wind speed was 7.8 m/s, and the turbulence intensity was 19.1%. Figure 4b shows the integral scales of the simulated flow, which gradually increased when the height increased. In addition, the integral values (solid line in Figure 4b) calculated using AIJ-RLB [16] are in good agreement with the relationship between the simulated integral scales and AIJ-RLB [16] values. The power spectrum of the longitudinal wind velocity fluctuation is consistent with the target von Karman spectrum, as shown in Figure 4c.
Considering the time scale obtained using the length and velocity scales, i.e., 1/50, each pressure record was sampled for 12 s, equivalent to an actual time of 10 min. All the pressures were simultaneously measured using a multichannel pressure system. The sampling frequency was 1000 Hz, and low-pass filtering with a 300 Hz cut-off frequency was cascaded in each data acquisition channel. The moving average time was set as 1 s for comparison with the results of previous studies and AIJ-RLB. Based on the time scale, the moving average time in the wind tunnel was 0.02 s. Therefore, 20 data points sampled at intervals of 0.001 s were used to obtain the moving average. The maximum blockage rate was 2.0%; therefore, data correction was unnecessary. The experimental conditions are listed in Table 3.
The Reynolds number was defined using the span length and mean wind velocity, and an initial test was conducted to determine a constant Reynolds number with stable pressure coefficient values. The Reynolds number was calculated as follows:
R e = U D υ
In the above equation, υ is the kinematic viscosity, U is the mean wind velocity at the maximum roof height for each model, and D is the span length of the model. In this study, the Reynolds number varied from 1.8 × 10⁵ to 2.2 × 10⁵. According to previous studies pertaining to dome roofs, it was discovered that when the Reynolds number exceeded 1.0 × 10⁵, the location of the separation remained unchanged, and the wind pressure was stable [3].

2.3. Definitions of Pressure Coefficients

In this study, the wind pressure coefficients on the external and internal surfaces of the roof and the net pressure coefficient were defined as follows:
C P e = P e 1 / 2 ρ U H + f 2
C P i = P i 1 / 2 ρ U H + f 2
C P n = C p e C p i
The external and internal pressure coefficients were calculated using Equations (2) and (3), where Pe and Pi are the wind pressures exerted on the external and internal surfaces of the roof, respectively, ρ is the air density, and U H + f is the mean wind velocity at the maximum height of the roof for each model. The net pressure coefficients were calculated using Equation (4). The mean and peak pressure coefficients were defined as the mean, minimum, and maximum values for Cpe, Cpi, and Cpn. A pressure coefficient corresponding to an actual time of 10 min was calculated for each sample, and the mean value of the 10 samples was used.

3. Wind Pressure Distribution on Spherical Dome with Opening of f/D = 0.05

3.1. Mean Pressure Coefficients

Figure 5 shows the contours of the mean external pressure (Cpe,mean) for H/D values of 0.1, 0.3, and 0.5. As shown in Figure 5, the negative pressure was dominant at all H/D values, and changes in pressure were observed as the flow moved to the leeward side. In the windward region, the absolute value was higher than those in other regions. This was attributable to the separation of the incoming flow at the edge of the roof. In addition, as the value of H/D increased, the reattachment distance increased, and the region affected by the separation and absolute value increased owing to the turbulence intensity. When the turbulence intensity was low, separation occurred easily, and the space in which a vortex was formed increased owing to the separation, resulting in a greater effect from the negative pressure. Except for the open space, the absolute value in the central region decreased owing to the formation of a boundary layer on the roof surface. For the central region, at the edge of the roof where the wall was located, the absolute value increased slightly as H/D increased. This can be attributed to the separation effect. However, the absolute value was relatively small because it was affected by a small vortex relative to that in the windward region. In the leeward region, the absolute value at the roof edge of the open space slightly increased. This was because the flow deviating from the windward region was separated at the corresponding location [13].
Figure 6 shows the contours of the internal mean pressure coefficients (Cpi,mean) for H/D of 0.1, 0.3, and 0.5. The internal roof surface was dominated by negative pressures for all H/D values. The increase in H/D did not result in significant changes, and the absolute values in the windward and central regions were similar. However, in the leeward region, the magnitudes and variations in the absolute values were similar to those of the external roof surface. This is because the internal roof of the leeward side was also affected by the separation.
Figure 7 shows the mean pressure coefficient along lines 1, 4, and 7 when the value of H/D is 0.5. The wind pressure characteristics based on the H/D values are discussed comprehensively in Section 4. In Figure 7, the x-axis is the normalized radius, which is defined as the ratio of the pressure tap distance from the center to the wall’s (roof edge) distance from the center. Thus, a normalized radius of 0 indicates the center of the dome, whereas a normalized radius of 1 indicates the edge of the roof. Lines 1, 4, and 7 represent the windward, central, and leeward regions, respectively. Figure 7a shows the external mean pressure coefficient (Cpe,mean). In the normalized radius 1 of L1, that is, the edge of the roof where the wall was located, the absolute value was 1.5, and the absolute values gradually decreased as the flow moved to the center region. When the normalized radius was below 0.55, the absolute values became similar owing to the effect of reattachment. In the case of L4, the absolute value was slightly higher in the normalized radius of 1, that is, the edge of the roof where the wall was located; however, no significant difference was observed when compared with the absolute value at the normalized radius of 0.5. The tendencies of the wind pressure distributions in L1 and L4 were the same as in the results of previous studies pertaining to closed-dome roofs [1,17,18,19,20,21,22,23]. In the case of L7 with a normalized radius of 0.5, that is, at the roof edge of the open space, the absolute value increased owing to separation. However, the absolute value at the corresponding location was 0.6, i.e., 2.3 times smaller than the absolute value at the normalization radius 1 of L1. This phenomenon is attributed to the complicated turbulence of the flow deviating from the windward roof surface [13]. Figure 7b shows the internal mean pressure coefficients. The absolute values along L1 and L4 were generally similar without significant variation, and the absolute values along L7 were similar to those at the external surface of the roof.

3.2. Negative and Positive Peak Pressure Coefficients

Figure 8 shows the external and internal negative peak pressure coefficients (Cpe,min and Cpi,min) along lines 1, 4, and 7 when H/D = 0.5. The effects of the flow separation, reattachment, and boundary layer of the roof surface can be clearly identified from the negative peak pressure coefficients, and the variations in the absolute value for each line are similar to those of the mean pressure coefficients for both the external and internal surfaces of the roof. L1 in Figure 8a is a region affected by the separation of the oncoming flow; at a normalized radius of approximately 0.95, the maximum absolute value was 2.8. L7 in Figure 8a,b is a region affected by the separation of the flow deviating from the windward roof surface, and the maximum absolute values at the normalized radius of 0.5 were 1.6 and 1.7 for the external and internal surface of the roof, respectively.
Figure 9 shows the external and internal positive peak pressure coefficients (Cpe,max and Cpi,max) along lines 1, 4, and 7 when H/D = 0.1. The effects of the positive pressure decreased when H/D increased. Specifically, the effects of the positive pressure on the entire region significantly decreased when H/D was greater than 0.3. Therefore, a case (H/D = 0.1) in which the absolute value of the positive peak pressure coefficient is the largest is representatively shown. As described in Section 2.3, the positive peak pressure coefficient was defined as the mean of the maximum values of Cpe and Cpi measured for ten samples. However, a negative pressure value was observed in some regions. These regions were dominated by the separation and boundary layer effects formed on the dome surface, resulting in no positive pressure. The maximum absolute values of L1 and L4 in Figure 9a,b were close to 0. Moreover, in L7 in Figure 9a,b, the absolute value gradually increased after a normalized radius of 0.55, reaching the maximum value of 0.3 at the normalized radius of 1. This phenomenon is assumed to occur because the flow deviates without reattachment after separation owing to the shape of the roof.

3.3. Mean Net Pressure Coefficients

Figure 10 shows the contours of the mean net pressure coefficients (Cpn,mean) and the values along lines 1, 4, and 7. By comparing the contours in Figure 10a and Figure 4c, it can be observed that the absolute value of the mean net pressure coefficients decreased in general relative to the external mean pressure coefficients. As explained earlier, a negative mean pressure was observed in the case involving the internal roof surface, suggesting that the actions of internal pressure on the roof were opposite to those of the negative external pressures. In this case, the negative net pressure on the roof could be reduced by offsetting the internal and external pressures.
As shown in Figure 10b, the mean net pressure coefficients along L1 and L4 were lower than that of the external roof surface, whereas the trend of the absolute value change was preserved. This is because the pressures on the internal roof surface at the corresponding region were generally similar (see Figure 7b), as well as because of the synchronous contributions of the external and internal roof surface pressures. Meanwhile, in the case of L7 in Figure 10b, the overall value of the mean net pressure coefficient approached 0 and the effect of separation disappeared at a normalized radius of 0.5. This phenomenon was expected, as the pressures generated on the external and internal roof surfaces of the roof were similar.
Figure 11 shows the time series of the pressure coefficients measured on the pressure tap of the area affected by separation. Among the ten elements of sampled data, the largest negative peak net pressure coefficient is presented. Figure 11a shows the external, internal, and net pressure coefficients in the windward region. The external pressure coefficients generated a large negative spike owing to the separation, whereas the internal pressure coefficients generally remained constant. The absolute value of the net pressure coefficient decreased compared with the external pressure coefficient, but the tendency of the pressure fluctuations did not change significantly. Figure 11b shows the external, internal, and net pressure coefficients of the leeward region. The pressure tap shown in the figure represents the roof edge of an open space. At the corresponding locations, the external and internal pressure coefficients exhibited similar values and variations. Consequently, the effects of the external and internal negative pressures were offset, and the mean value of the overall net pressure coefficient approached zero. In addition, positive and negative spikes occurred regularly depending on the mean value [24].

3.4. Negative and Positive Peak Net Pressure Coefficients

Figure 12 shows the contours of the negative peak net pressure coefficients (Cpn,min) and the values along lines 1, 4, and 7. Comparing the contours in Figure 12a and Figure 6c, it can be observed that the absolute value of the negative peak net pressure coefficient decreased compared with the negative external peak pressure coefficient. According to the explanation regarding the mean net pressure coefficient, only the absolute value decreased, and the trend of the absolute value change was preserved.
Figure 13 shows the contours of the positive peak net pressure coefficients (Cpn,max) and the values along lines 1, 4, and 7. By examining the positive peak pressure coefficient at the external and internal roofs separately, it was discovered that the normalized radius 0.5 of L7 was a region in which the effect of the positive pressure did not appear owing to the separation of the deviated flow. However, the positive peak net pressure coefficient increased rapidly owing to the interaction between the external and internal pressures.
For the normalized radius 0.5 of L7, the absolute values of the negative and positive peak net pressure coefficients were 1.2. As shown in Figure 13b, similar absolute values were obtained because negative and positive spikes appeared regularly around the mean value.

4. Effects of f/D and H/D

To investigate the change in the wind pressure distribution according to the values of f/D and H/D, the results were compared with those of Cheon et al. [13] for f/D = 0.1, where all other experimental conditions were the same as those of the current study. The two cases were compared based on lines 1 and 7 of the centerline, with lines 1 and 7 representing the windward and leeward regions, respectively.

4.1. Comparison of Mean Pressure Coefficients

Figure 14 shows the mean pressure coefficients for the two f/D cases. The x-axis represents the normalized diameter, which is defined as the ratio of the pressure tap distance from the roof edge of the windward side to the roof edge of the leeward side. Thus, a normalized diameter of 0 indicates the roof edge of the windward region; and a normalized diameter of 1 indicates the roof edge of the leeward region. In both cases, the negative pressure was dominant. Figure 14a,b shows the external mean pressure coefficients (Cpe,mean). In the windward region, the absolute value increased in both cases, and the absolute value was larger when f/D = 0.05. This occurred because as f/D decreased, the reattachment distance increased, and a relatively large vortex was formed [13]. In the leeward region, the overall absolute values showed similar values and variations regardless of the change in H/D in both cases. This occurred because the characteristics of the deviated flow became similar owing to the boundary layer that formed on the roof surface after reattachment [13]. Comparing the two cases, the absolute value based on f/D = 0.05 was slightly smaller at the normalized diameter of 0.75, as it was affected by the separation of the deviated flow. Figure 14c,d shows the internal mean pressure coefficients. The absolute value for f/D = 0.05 was slightly smaller than that for f/D = 0.1, although the difference was insignificant and similar variations were indicated in general.

4.2. Comparison of Negative Peak Pressure Coefficients

Figure 15 shows the negative peak pressure coefficients for the two f/D cases. As described above, the trend of the absolute value change for different f/D and H/D values was similar. However, in the case involving the negative external peak pressure coefficients (Cpe,min) shown in Figure 15b, the absolute value at the normalized diameter of 0.75 was smaller than that for f/D = 0.1. In the case involving the negative internal peak pressure coefficients (Cpi,min) shown in Figure 15c,d, both cases exhibited similar absolute values and variations.
Figure 16a,b shows the negative external and internal peak pressure coefficients (Cpe,min and Cpi,min) on the two external and internal taps of the roof edge of the open space affected by separation, respectively. The x-axis represents the H/D ratio and turbulence intensity values for each H/D. In the figures, the markers indicate the value for each of the 10 samples, and the dotted line indicates the mean of the 10 sample values for each f/D. The absolute values for each case were similar regardless of the H/D and turbulence intensity changes. This is because the flow characteristics were similar owing to the boundary layer formed on the roof surface after reattachment. As shown in Figure 16a, the absolute value of f/D = 0.1 for the external tap was greater than that for f/D = 0.05; however, the absolute value of the roof’s internal pressure tap was similar for both cases. This is because the roof had a different shape. Figure 16c shows the inclination angle of the roof. Based on the external roof of the leeward region, it was observed that the larger the f/D, the higher the inclination angle of the roof. As mentioned earlier, the negative external peak pressure coefficient for f/D = 0.1 was larger than that for f/D = 0.05. This is because the space in which the vortex formed after separation increased with f/D [25].

4.3. Comparison of Positive Peak Pressure Coefficients

Figure 17 shows the positive peak pressure coefficients for the two f/D cases. The positive peak net pressure coefficient was defined as the mean of the maximum values of Cpe and Cpi measured in the ten samples. However, a negative pressure value was observed in some regions. These regions were dominated by the separation and boundary layer effects formed on the dome surface, resulting in no positive pressure. Figure 17a,b shows the positive external peak pressure coefficient (Cpe,max). For the positive external peak pressure coefficient shown in Figure 17a, the absolute value when f/D = 0.1 was greater than that when f/D = 0.05 owing to the effect of the roof rise. As the rise of the dome roof increased, the reattachment distance decreased and was affected intermittently by the oncoming flow [1,2,3,4,5]. Therefore, the absolute value for f/D = 0.1 was relatively large. Meanwhile, as H/D increased, the absolute value decreased. In the case of f/D = 0.05 shown in Figure 17b, the negative pressure was dominant because of the low rise–span ratio; therefore, the effect of the positive pressure was insignificant, and the absolute values were similar regardless of H/D.
Figure 17c,d shows the positive internal peak pressure coefficients (Cpi,max). In the windward region, the negative pressure was dominant in both cases; therefore, the effect of the positive pressure was insignificant. In contrast, the whole or parts of the regions were influenced by the positive pressure for both cases in the leeward region. This was caused by the pressure recovery phenomenon [18,19,20]. In the case of f/D = 0.1, the normalized diameters ranging from 0.85 to 1 were influenced by the positive pressure. In the case of f/D = 0.5, the whole surface of the roof was influenced by the positive pressure. In addition, the absolute values in both cases were largest when the normalized diameter was 1.

4.4. Comparison of Net Pressure Coefficients

Figure 18 shows the mean net pressure coefficients (Cpn,mean) for the two f/D cases. In Figure 18a, the absolute value of the windward region for f/D = 0.1 was more affected by the positive pressure than for f/D = 0.05. This was caused by the direct effects of the oncoming flow and constant negative pressure on the internal surface of the roof. The absolute value for f/D = 0.1 in the leeward region was also larger compared to that for f/D = 0.05. This is why the effects of the positive pressure on the external surface at this point were more significant than those on the internal surface in the case of f/D = 0.1, whereas the pressures at the external and internal surfaces of the roof were similar.
Figure 19 shows the negative peak net pressure coefficients (Cpn,min) for the two f/D cases. Compared with the case of f/D = 0.05, the absolute value was smaller in the windward region and larger in the leeward region for f/D = 0.1. This phenomenon is associated with the vortex on the external roof surface and constant negative pressure on the internal surface of the roof. In both cases, the wind pressures on the internal roof surface exhibited similar values and variations. Owing to the relatively high roof rise, the vortex current caused by separation in the windward region was small. In contrast, the vortex current generated by the separation in the leeward region was larger owing to the increase in the roof inclination angle. Therefore, the absolute values for each region were different.
Figure 20 shows the positive peak net pressure coefficients (Cpn,max) for the two f/D cases. Compared with the case of f/D = 0.05, the absolute value was larger in the windward region and smaller in the leeward region for f/D = 0.1. In the windward region, the absolute value was larger than that for f/D = 0.05 owing to the direct effect of the incoming flow on the external roof surface. However, the leeward region indicated a larger roof inclination angle, resulting in a smaller absolute value at a normalized diameter of 0.75 owing to the relatively larger vortex formed in the external roof surface relative to that in the internal roof surface. However, the absolute value for f/D = 0.1 was significantly large when the normalized diameter was over 0.8. As previously mentioned, this was why the effects of the positive pressure on the external surface at point were more significant than those on the internal surface in the case of f/D = 0.1, although the pressures at the external and internal surfaces of the roof were similar.

5. Proposed Peak Net Pressure Coefficients for Cladding Design

5.1. Comparison with AIJ-RLB and Previous Study

The experimental values were compared with those in the AIJ-RLB [16] and those proposed in a previous study, as presented in Figure 21. Because the pressure coefficients of open dome roofs do not exist in the AIJ-RLB [16], the pressure coefficients of closed dome roofs are used for comparison. The peak net pressure coefficients for the cladding design as prescribed by the AIJ-RLB are calculated as follows:
C p n , p e a k = C p e , p e a k C p i
In the above, Cpe,peak denotes the external negative and positive peak pressure coefficient and Cpi denotes the internal pressure coefficient. The values of Cpn,peak are shown in Table 4 and Table 5. Because the proposed Cpi was 0 or −0.5 and considering the weakest condition, the values of Cpi for the negative and positive peak net pressure coefficients were assumed to be 0 and −0.5, respectively.
Peak net pressure coefficients for open dome roofs with f/D = 0.1 were also proposed in previous studies, as shown in Table 6 and Table 7. All conditions other than f/D were equal to the conditions used in this study.
For the negative peak net pressure coefficient shown in Figure 21a, the experimental value did not exceed the AIJ-RLB, whereas the proposed value exceeded the AIJ-RLB in the normalized diameter range of 0.9–1.0 in the windward region. For the positive peak net pressure coefficient shown in Figure 21b, the experimental value exceeded both the AIJ-RLB and proposed values at a normalized radius of 0.5.

5.2. Proposal of Peak Net Pressure Coefficients

As indicated previously, the experimental value exceeded the AIJ-RLB and proposed values owing to the changes in the net pressure coefficient in the windward and leeward regions as f/D decreased. Accordingly, the application of the AIJ-RLB and previous values to an open dome roof of f/D = 0.05 might result in an underestimated wind load. Hence, a peak net pressure coefficient was proposed for cladding design. Two regions were identified while considering the effect of wind pressure on the roof, and a peak net pressure coefficient was proposed based on the maximum values observed in each region. The peak net pressure coefficient was investigated for all H/D values to determine the boundaries of the appropriate regions. The boundary between the two regions was selected based on a dimensionless radius of 0.6, at which the lowest absolute value after the flow separation occurred. The classification method for each region is shown in Figure 22. The windward region affected by the oncoming flow is denoted by Ra, and the leeward region affected by the separated flow is denoted by Rb. The two regions are classified by the non-dimensional radius as multiplied by 0.8 and 0.2.
Figure 23 shows the peak net pressure coefficients for all the pressure taps for different H/D values. Figure 23a shows the negative peak net pressure coefficient, where diverse values are exhibited from a dimensionless radius 0.6 of 1 in the Ra region for different H/D values. The negative peak net pressure coefficient of the corresponding region is proposed based on the maximum absolute value for each H/D. The effect of the H/D change was insignificant in the Rb region of Figure 23a and in the two regions in Figure 23b, and the maximum absolute values were similar. Accordingly, only one value of the negative and positive peak net pressure coefficients was proposed for the corresponding region. The proposed values are listed in Table 8 and Table 9.

6. Conclusions

In this study, the external, internal, and net pressure characteristics of open-dome roofs with low span-rise ratios (f/D = 0.05) and openings were analyzed via wind tunnel experiments. The findings were compared with those of previous studies to discuss the characteristics of wind pressures varying with the roof shape (i.e., opening, f/D and H/D). The primary conclusions of this study are as follows:
  • In the windward region of the external roof surface, both the f/D = 0.1 and f/D = 0.5 cases were dominated by the negative pressure induced by the separation of the approaching airflow, where the effect of the negative pressure increased with H/D.
  • In the leeward region of the external roof surface, the effect of the negative pressure in the roof edge region of the open space was increased by the separation of the flow deviating from the windward roof owing to the opening located in the center in both f/D cases.
  • The negative pressure was dominant in all areas of the internal roof surface, including the leeward region. The negative pressure in the roof edge region of the open space was increased by the separation of the flow deviating from the windward region owing to the opening located at the center, similar to the case of the external roof surface. However, similar values were obtained regardless of the changes in the values of f/D and H/D.
  • For the net pressure, the reattachment distance of the windward region increased as the rise–span ratio increased, resulting in an increase in the negative net pressure and a decrease in the positive net pressure owing to a relatively large vortex. In contrast, the roof inclination angle of the leeward region decreased as the rise–span ratio decreased, resulting in a decrease in the negative net pressure and an increase in the positive net pressure owing to a relatively small vortex at the roof edge of the open space in the leeward region.
  • The experimental results when f/D = 0.05 was compared with the peak net pressure coefficient values proposed in the AIJ-RLB and in previous studies, both of which are used in the cladding design. The negative peak net pressure coefficient exceeded the proposed value in the windward region, and both the negative and positive peak net pressure coefficients exceeded the AIJ-RLB and proposed values in the leeward region. Accordingly, a peak net pressure coefficient applicable to the design of cladding for an open dome roof with f/D = 0.05 was proposed based on the experimental results.

Author Contributions

Conceptualization, D.J.C.; data curation, M.J.P., Y.C.K. and D.J.C.; formal analysis, D.J.C.; funding acquisition, S.W.Y.; investigation, M.J.P. and D.J.C.; project administration, S.W.Y.; software, Y.C.K.; supervision, S.W.Y. and Y.C.K.; writing—original draft, M.J.P. and D.J.C.; writing—review and editing, Y.C.K. and D.J.C. All authors have read and agreed to the published version of the manuscript.

Funding

This research was supported by the Korean Government in the form of a grant [NRF-2019R1A2C1086485 and NRF-2020R1A2C3005687] from the National Research Foundation of Korea, and by the Joint Research Project of the Wind Engineering Research Center and Tokyo Polytechnic University (MEXT (Japan) Promotion of Distinctive Joint Research Center Program) [Grant Number JPMXP0619217840 and JURC Grant Numbers 21213002].

Institutional Review Board Statement

Not applicable.

Informed Consent Statement

Not applicable.

Data Availability Statement

Data presented in this study are available upon request from the corresponding author.

Conflicts of Interest

The authors declare no conflict of interest. The funders had no role in the study design, collection, analyses, interpretation of data, writing of the manuscript, or decision to publish the results.

References

  1. Uematsu, Y.; Yamada, M.; Inoue, A.; Hongo, T. Wind Loads and Wind-Induced Dynamic Behavior of a Single-Layer Latticed Dome. J. Wind Eng. Ind. Aerodyn. 1997, 66, 227–248. [Google Scholar] [CrossRef]
  2. Letchford, C.W.; Sarkar, P.P. Mean and Fluctuating Wind Loads on Rough and Smooth Parabolic Domes. J. Wind Eng. Ind. Aerodyn. 2000, 88, 101–117. [Google Scholar] [CrossRef]
  3. Cheng, C.M.; Fu, C.L. Characteristic of Wind Loads on a Hemispherical Dome in Smooth Flow and Turbulent Boundary Layer Flow. J. Wind Eng. Ind. Aerodyn. 2010, 98, 328–344. [Google Scholar] [CrossRef]
  4. Noguchi, M.; Uematsu, Y. Design Wind Pressure Coefficients for Spherical Domes. In Proceedings of the Annual Meeting 2003, Japan Association for Wind Engineering, Tokyo, Japan, 24–25 April 2003; pp. 353–358. [Google Scholar]
  5. Sun, Y.; Qiu, Y.; Wu, Y. Modeling of Wind Pressure Spectra on Spherical Domes. Int. J. Space Struct. 2013, 28, 87–99. [Google Scholar] [CrossRef]
  6. Wang, Y.; Li, Q.S. Wind pressure characteristics of a low-rise building with various openings on a roof corner. Wind Struct. 2015, 21, 1–23. [Google Scholar] [CrossRef]
  7. Cheon, D.J.; Yoon, S.W. A Study on the Analysis of Collapse Cases of Retractable and Membrane Roof Structures. Proc. KASS 2017 Sprint Conf. 2017, 13, 55–56. [Google Scholar]
  8. Majowiecki, M. Structural Architecture of Wide Span Enclosures: Uncertainties in Reliability Assessment; University of Venice: Venice, Italy, 2005; pp. 59–75. Available online: https://www.majowiecki.com/userfiles/Pubblicazione/files/Articoli/2005_-_Structural_architecture_of_wide_span_enclosures_uncertainties_in_reliability_assesment.pdf (accessed on 23 March 2022).
  9. Kumar, K.S.; Stathopoulos, T. Wind Loads on Low Building Roofs: A Stochastic Perspective. J. Struct. Eng. 2000, 126, 944–956. [Google Scholar] [CrossRef]
  10. Xu, H.; Lou, W. Wind-induced internal pressures in building with dominant opening on hemi-ellipsoidal roof. J. Eng. Mech. 2018, 144, 04018041. [Google Scholar] [CrossRef]
  11. Kim, Y.C.; Yoon, S.W.; Cheon, D.J.; Song, J.Y. Characteristics of Wind Pressures on Retractable Dome Roofs and External Peak Pressure Coefficients for Cladding Design. J. Wind Eng. Ind. Aerodyn. 2019, 188, 294–307. [Google Scholar]
  12. Lee, J.H.; Kim, Y.C.; Cheon, D.J.; Yoon, S.W. Wind pressure characteristics of elliptical retractable dome roofs. J. Asian Architect. Build. Eng. 2021, 1–17. [Google Scholar] [CrossRef]
  13. Cheon, D.J.; Kim, Y.C.; Lee, J.H.; Yoon, S.W. Experimental Investigation of Wind Pressure Characteristics for Cladding of Dome Roofs. Materials 2021, 14, 5266. [Google Scholar] [CrossRef] [PubMed]
  14. Lee, J.H. Proposal of Peak Pressure Coefficient for Cladding Design of Elliptical Retractable Dome Roof by Wind Tunnel Test. Ph.D. Thesis, Seoul National University of Science and Technology, Seoul, Korea, 2022. [Google Scholar]
  15. Ishii, K. Structural Design of Retractable Roof Structures, 1st ed; WIT Press: Southampton, UK, 2000; pp. 10–15. [Google Scholar]
  16. AIJ (Architectural Institute of Japan). AIJ Recommendations for Loads on Buildings; AIJ: Tokyo, Japan, 2015. [Google Scholar]
  17. Cheon, D.J.; Kim, Y.C.; Yoon, S.W. Comparison of Wind Pressure Coefficient and Wind Load Standard for Cladding in a Retractable Dome Roof by Wind Tunnel Test. J. Korean Assoc. Spat. Struct. 2018, 18, 125–132. [Google Scholar] [CrossRef]
  18. Cheon, D.J.; Kim, Y.C.; Lee, J.H.; Yoon, S.W. Analysis of Wind Fluctuating Pressures for Circular Closed and Open dome roofs. J. Korean Assoc. Spat. Struct. 2020, 20, 125–132. [Google Scholar]
  19. Cheon, D.J.; Kim, Y.C.; Lee, J.H.; Yoon, S.W. Wind Pressure Spectra for Circular Closed and Open Dome Roofs. J. Korean Assoc. Spat. Struct. 2020, 20, 69–76. [Google Scholar] [CrossRef]
  20. Cheon, D.J.; Lee, J.H.; Kim, Y.C.; Yoon, S.W. Analysis of Wind Pressure Characteristics of Retractable Dome Roof by Opening Type through Wind Tunnel Test. J. Korean Assoc. Spat. Struct. 2021, 21, 41–49. [Google Scholar] [CrossRef]
  21. Lo, Y.L.; Kanda, J. Cross spectra of wind pressures on domed roofs in boundary layer wind tunnel. In Proceedings of the Seventh International Colloquium on Bluff Body Aerodynamics and Applications, Shanghai, China, 20–23 July 2012. [Google Scholar]
  22. Noguchi, M.; Uematsu, Y. Model of Fluctuating Wind Pressures on Spherical Domes for Load Estimation of Cladding. Natl. Symp. Wind Eng. 2004, 18, 353–358. [Google Scholar]
  23. Lo, Y.L. Investigation on Non-Gaussian Peak Factors for Wind Pressures on Domed Roof Structures. J. Appl. Sci. Eng. 2016, 19, 125–134. [Google Scholar]
  24. Rizzo, F.; Sepe, V.; Avossa, A.M. Wind pressures on a large span canopy roof. Wind Struct. 2020, 30, 299–316. [Google Scholar]
  25. Kil, Y.S.; Kim, D.W.; Ha, Y.C.; Lee, K.Y.; Kim, J.R. Characteristics on the Change of Wind Pressure for the Membrane Roof Structure with Variable Roof Slop. JAIK 2003, 23, 39–42. [Google Scholar]
Figure 1. Test model: (a) model in the wind tunnel; (b) model section.
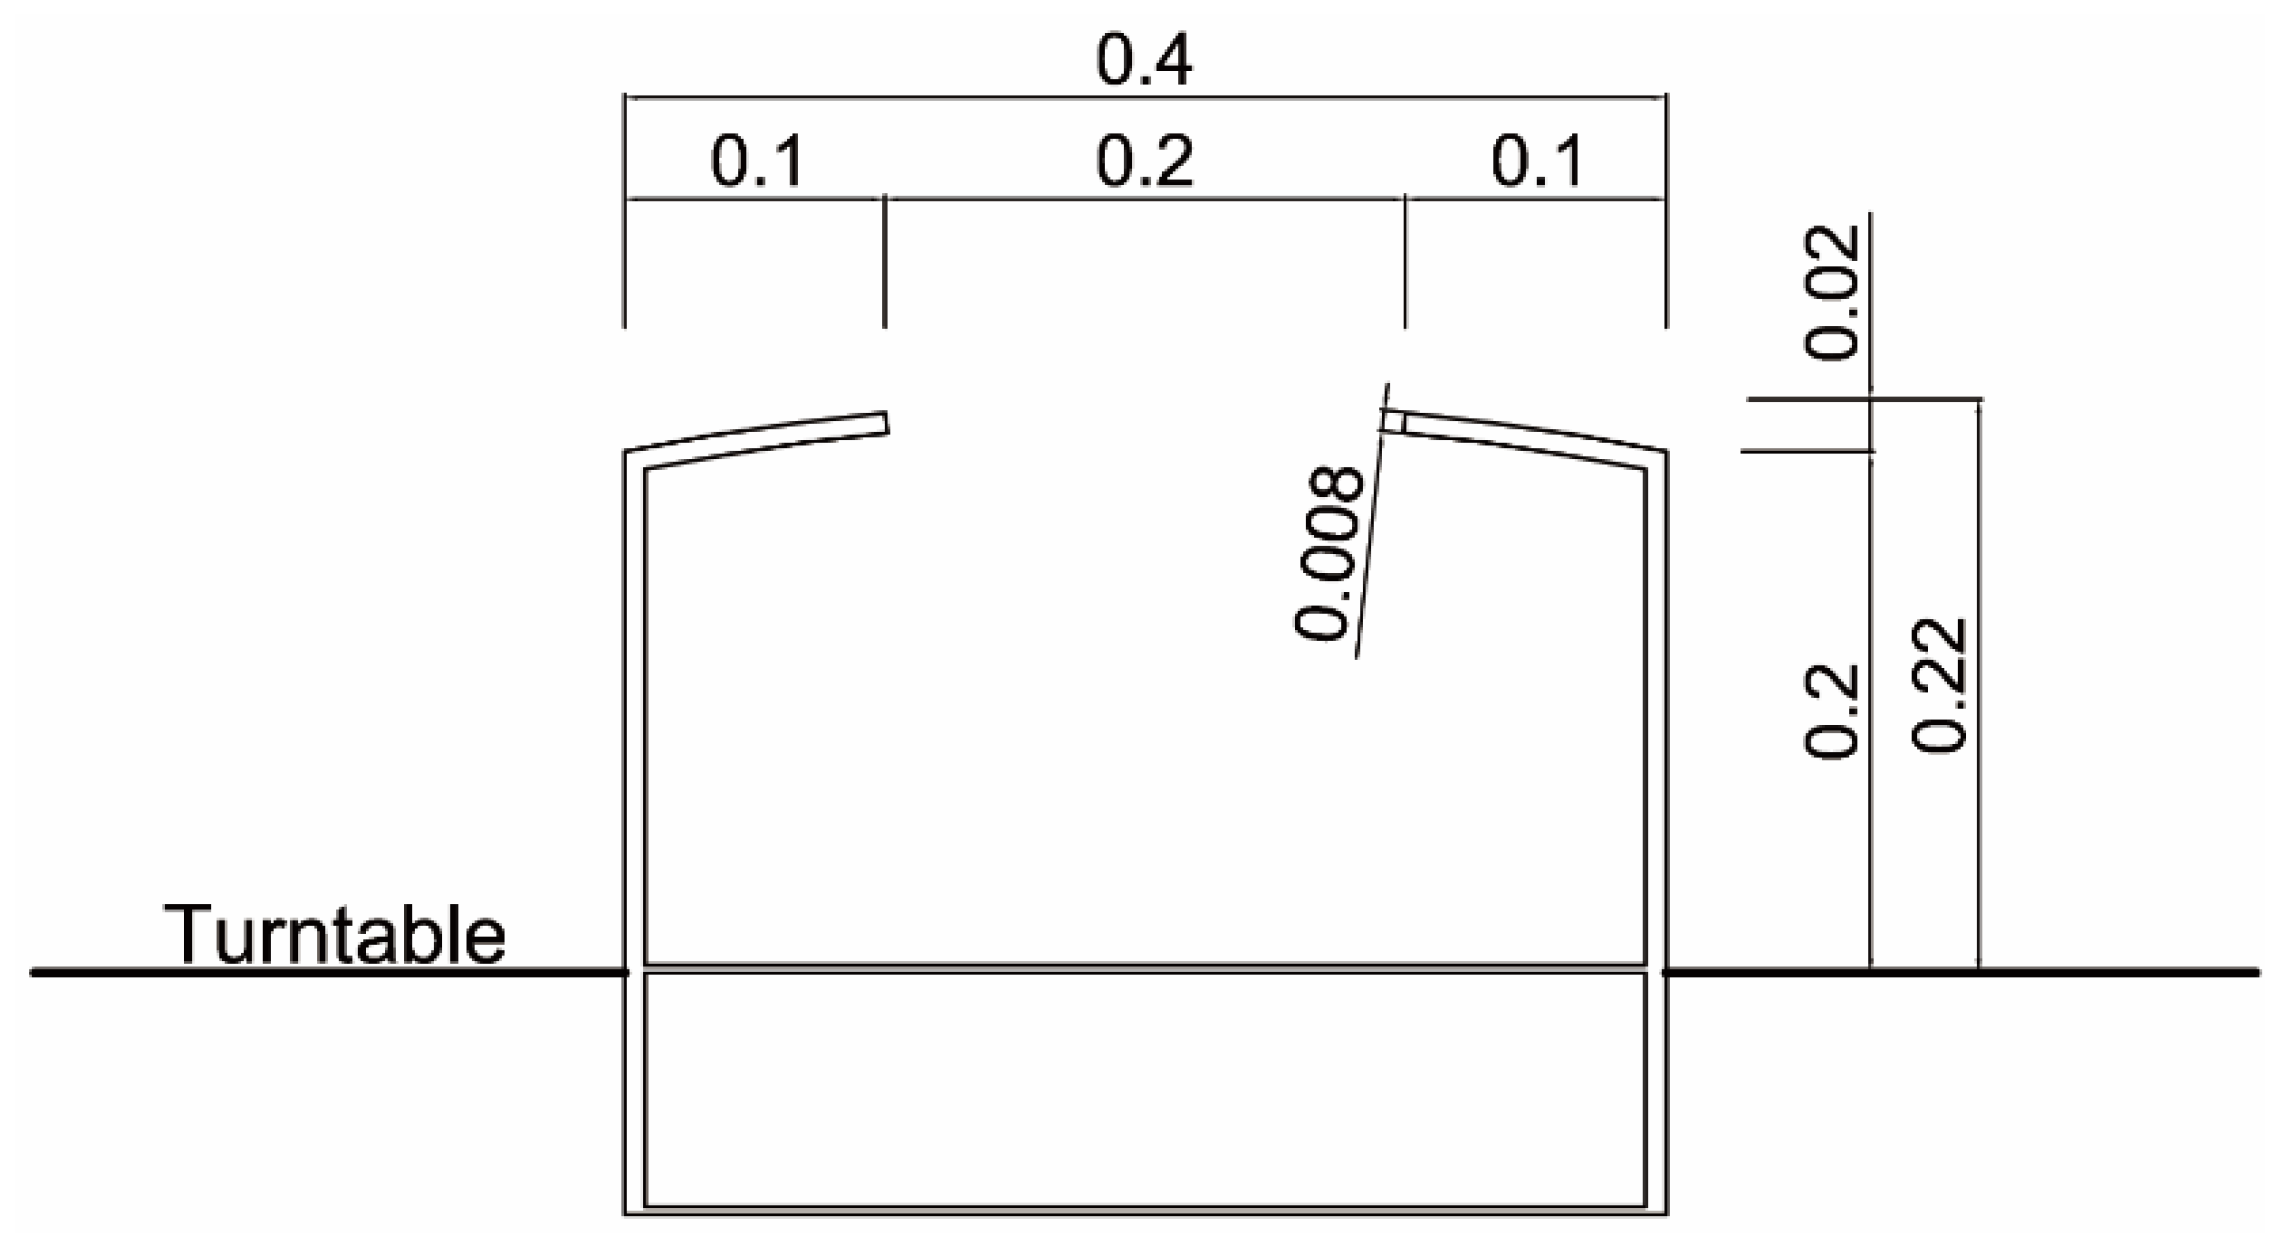
Buildings 12 00576 g001
Figure 2. Detailed dimensions of model (in meters).
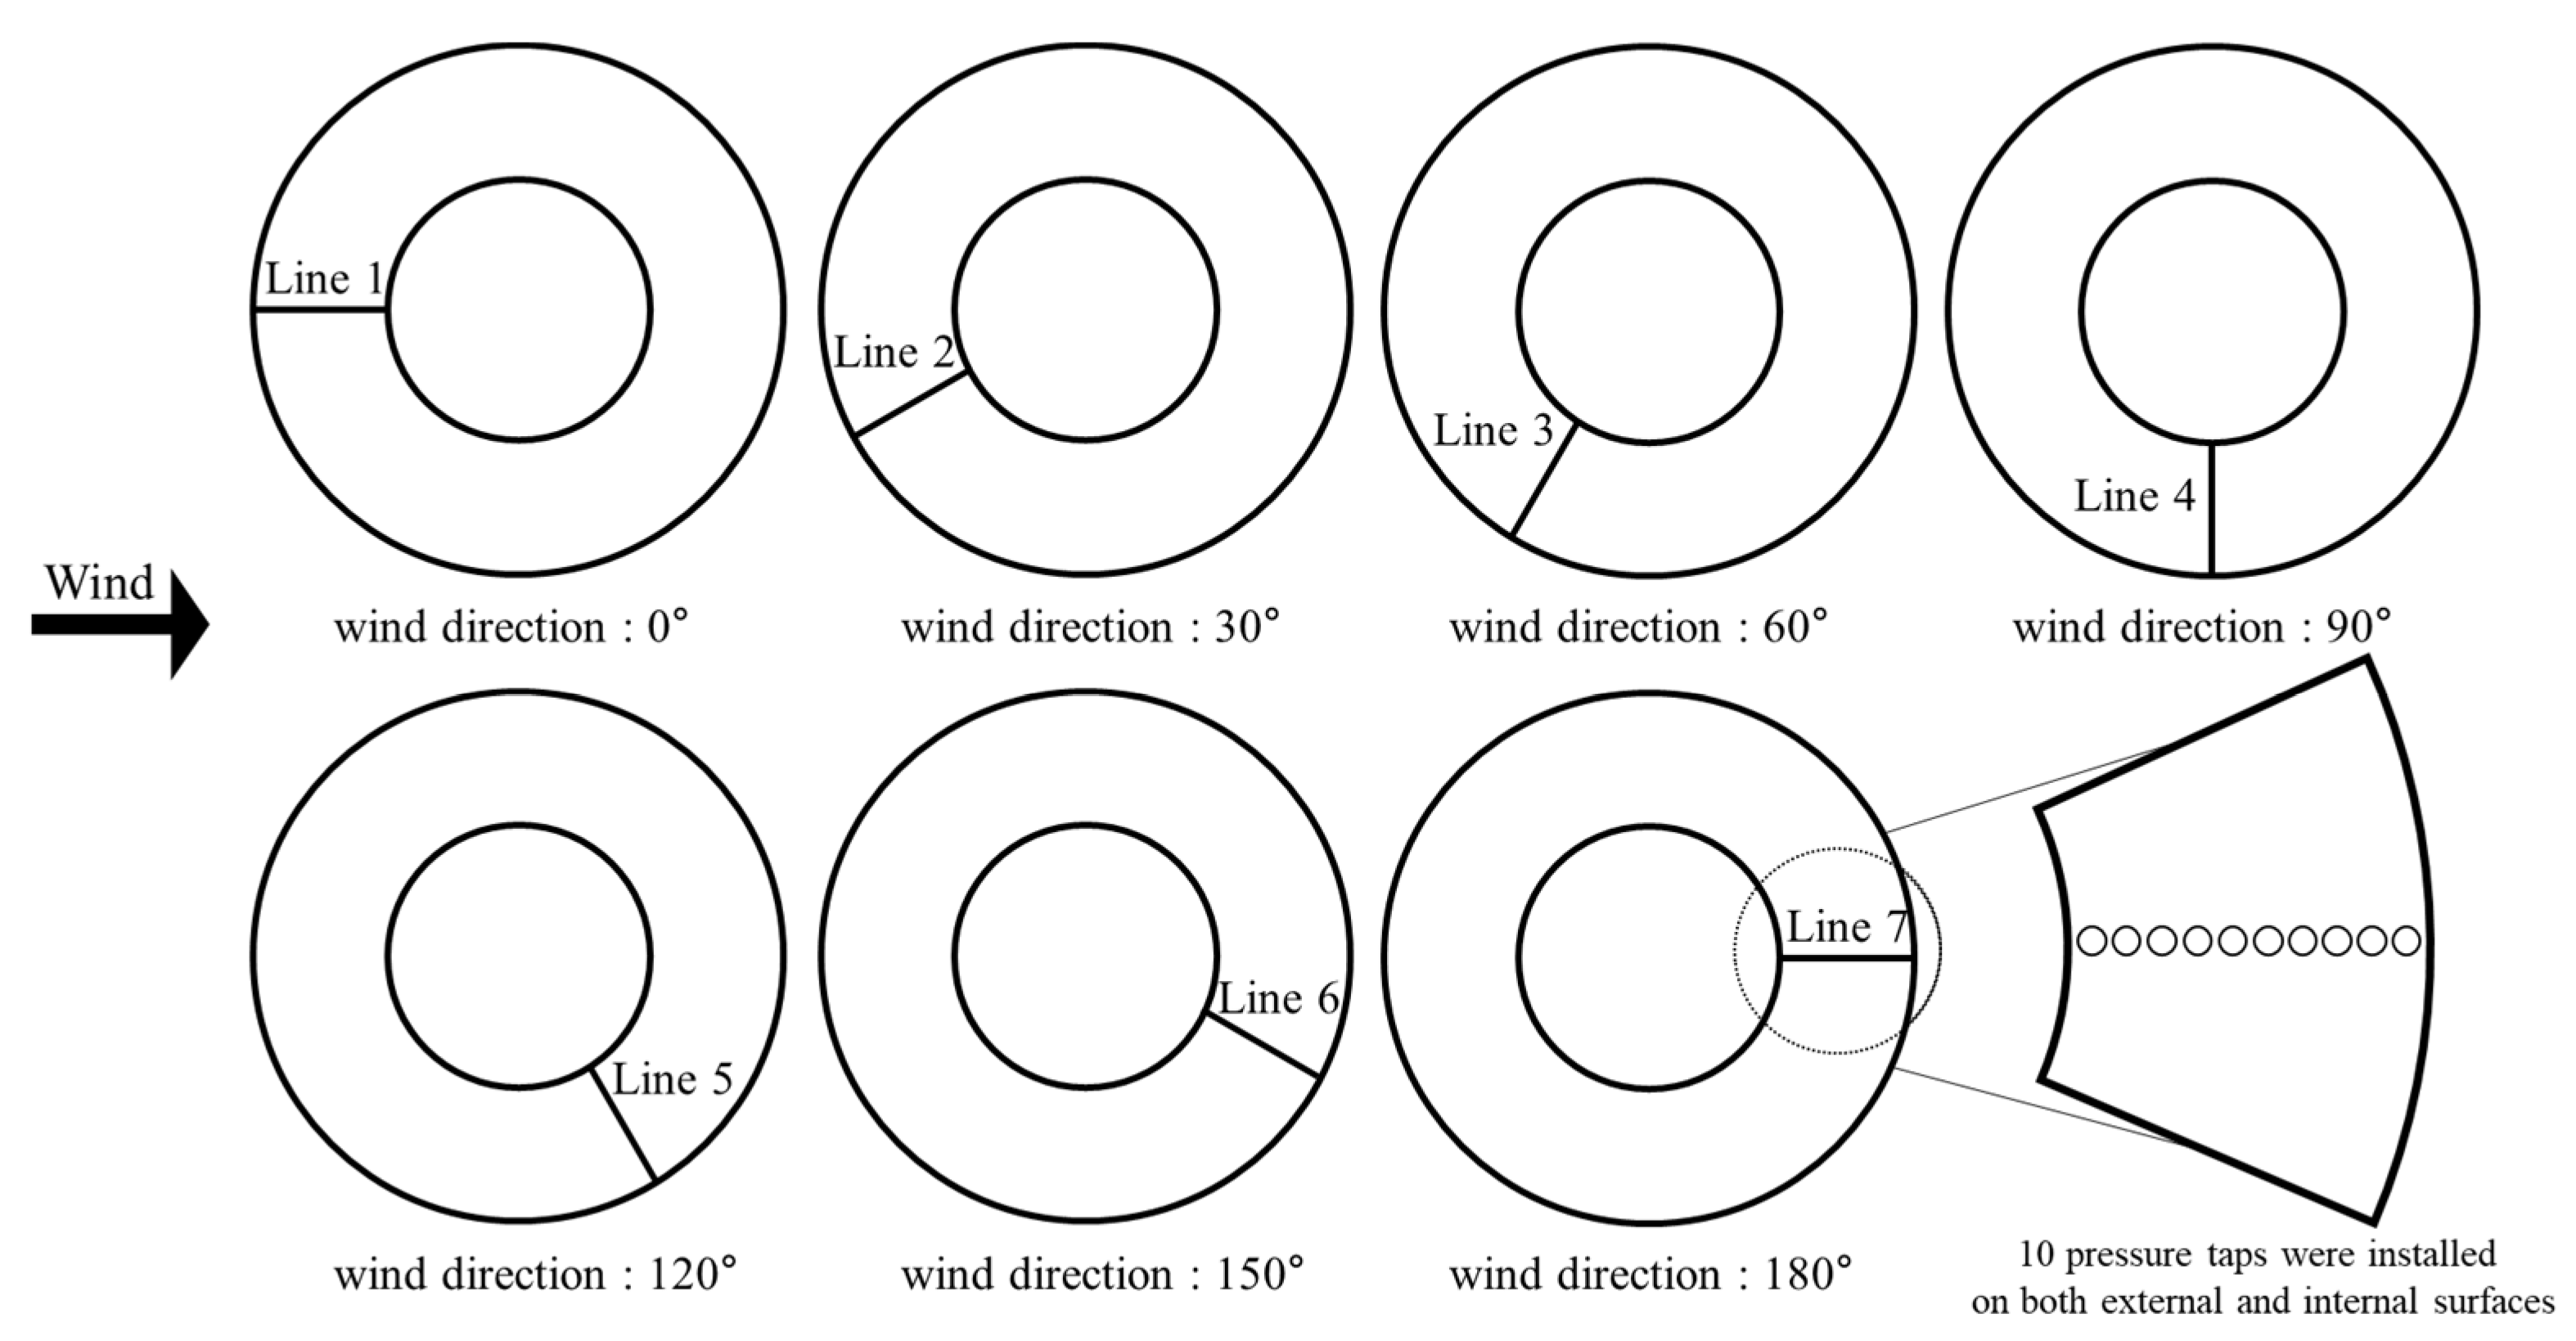
Buildings 12 00576 g002
Figure 3. Installed pressure taps and corresponding wind direction.
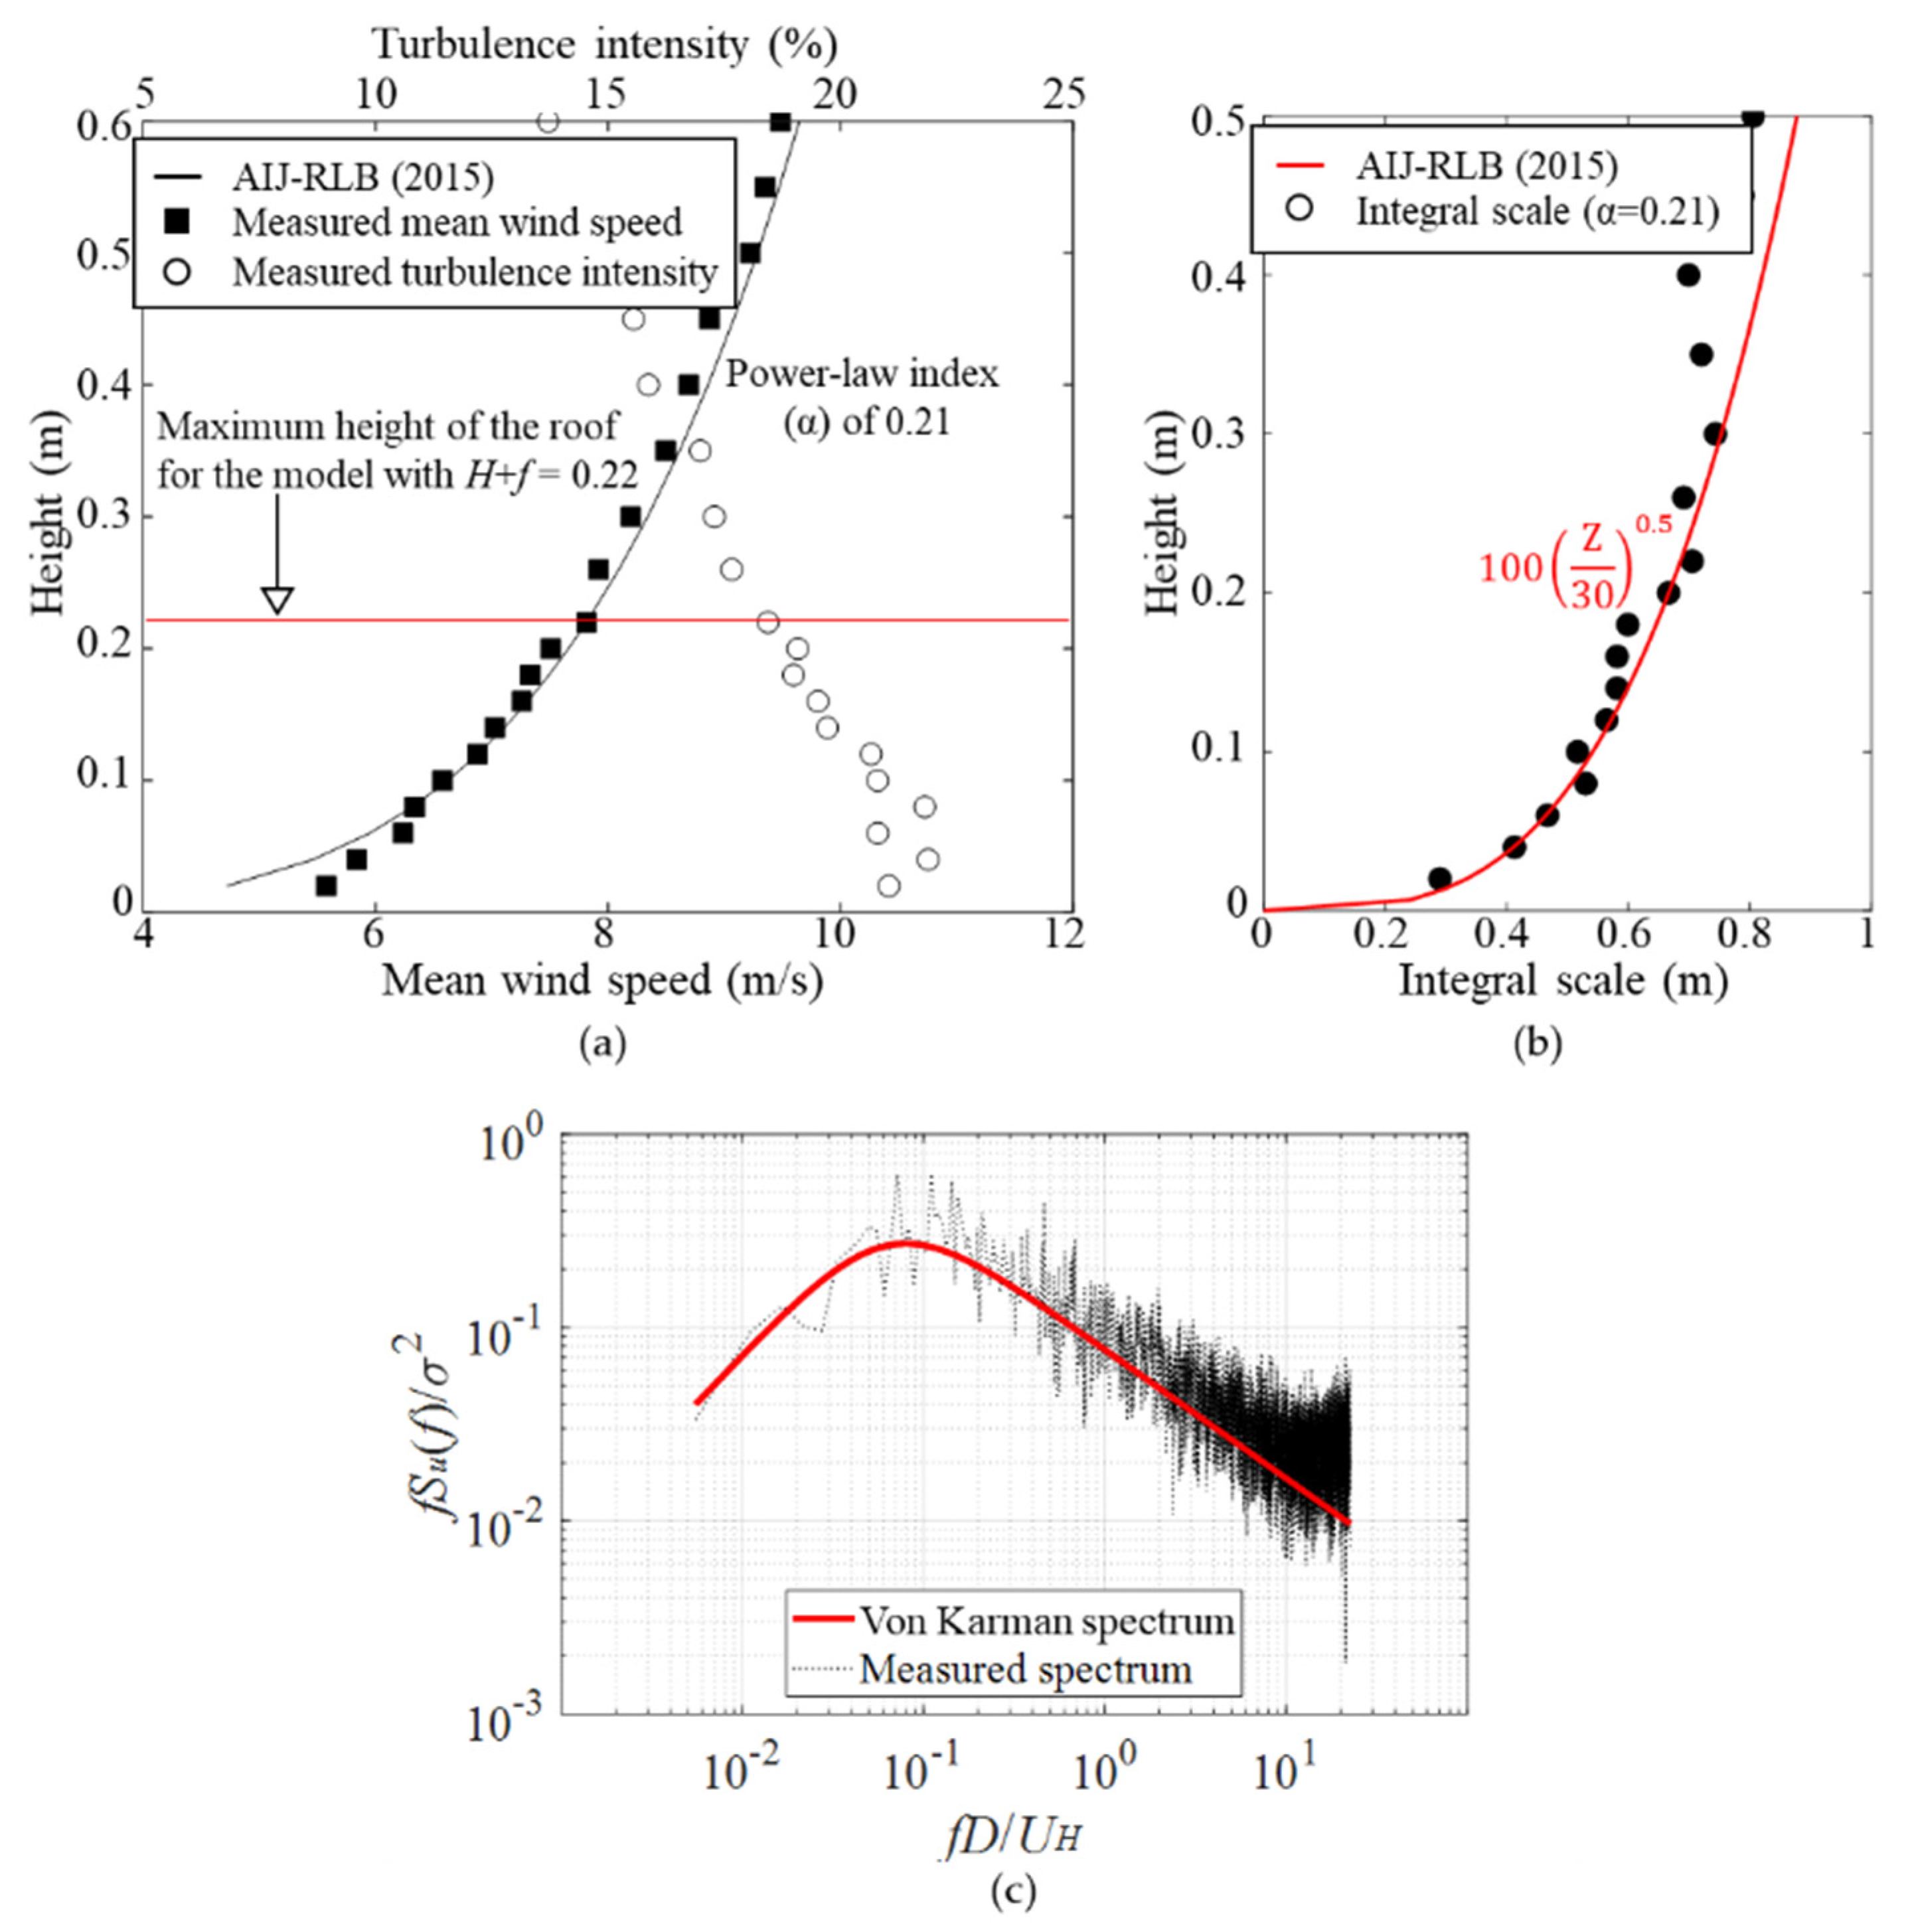
Buildings 12 00576 g003
Figure 4. Characteristics of oncoming flow: (a) mean velocity and turbulence intensity profiles; (b) profile of integral scale; (c) power spectra of velocity fluctuation at H = 0.22 m.
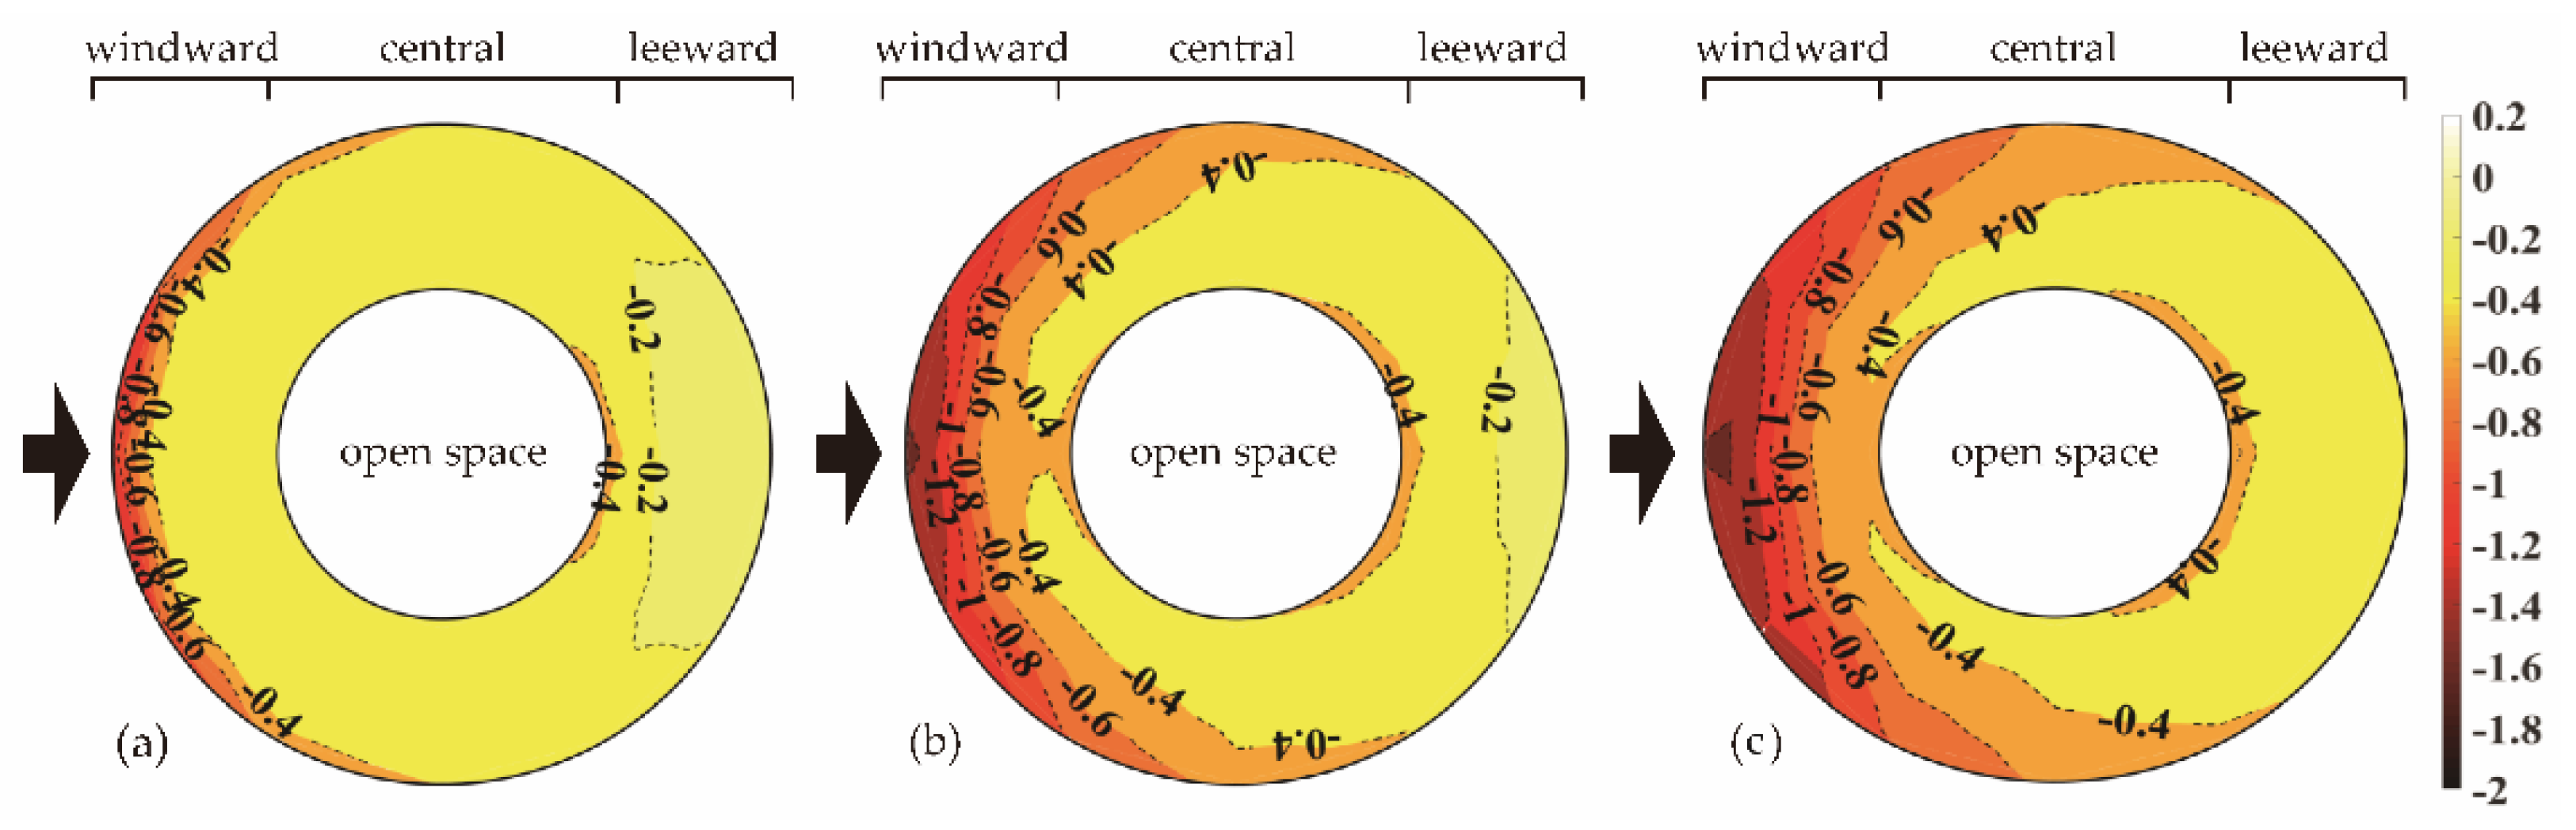
Buildings 12 00576 g004
Figure 5. Distribution of external mean pressure coefficient for different H/D values: (a) 0.1; (b) 0.3; (c) 0.5.
Buildings 12 00576 g005
Figure 6. Distribution of internal mean pressure coefficient for different H/D values: (a) 0.1; (b) 0.3; (c) 0.5.
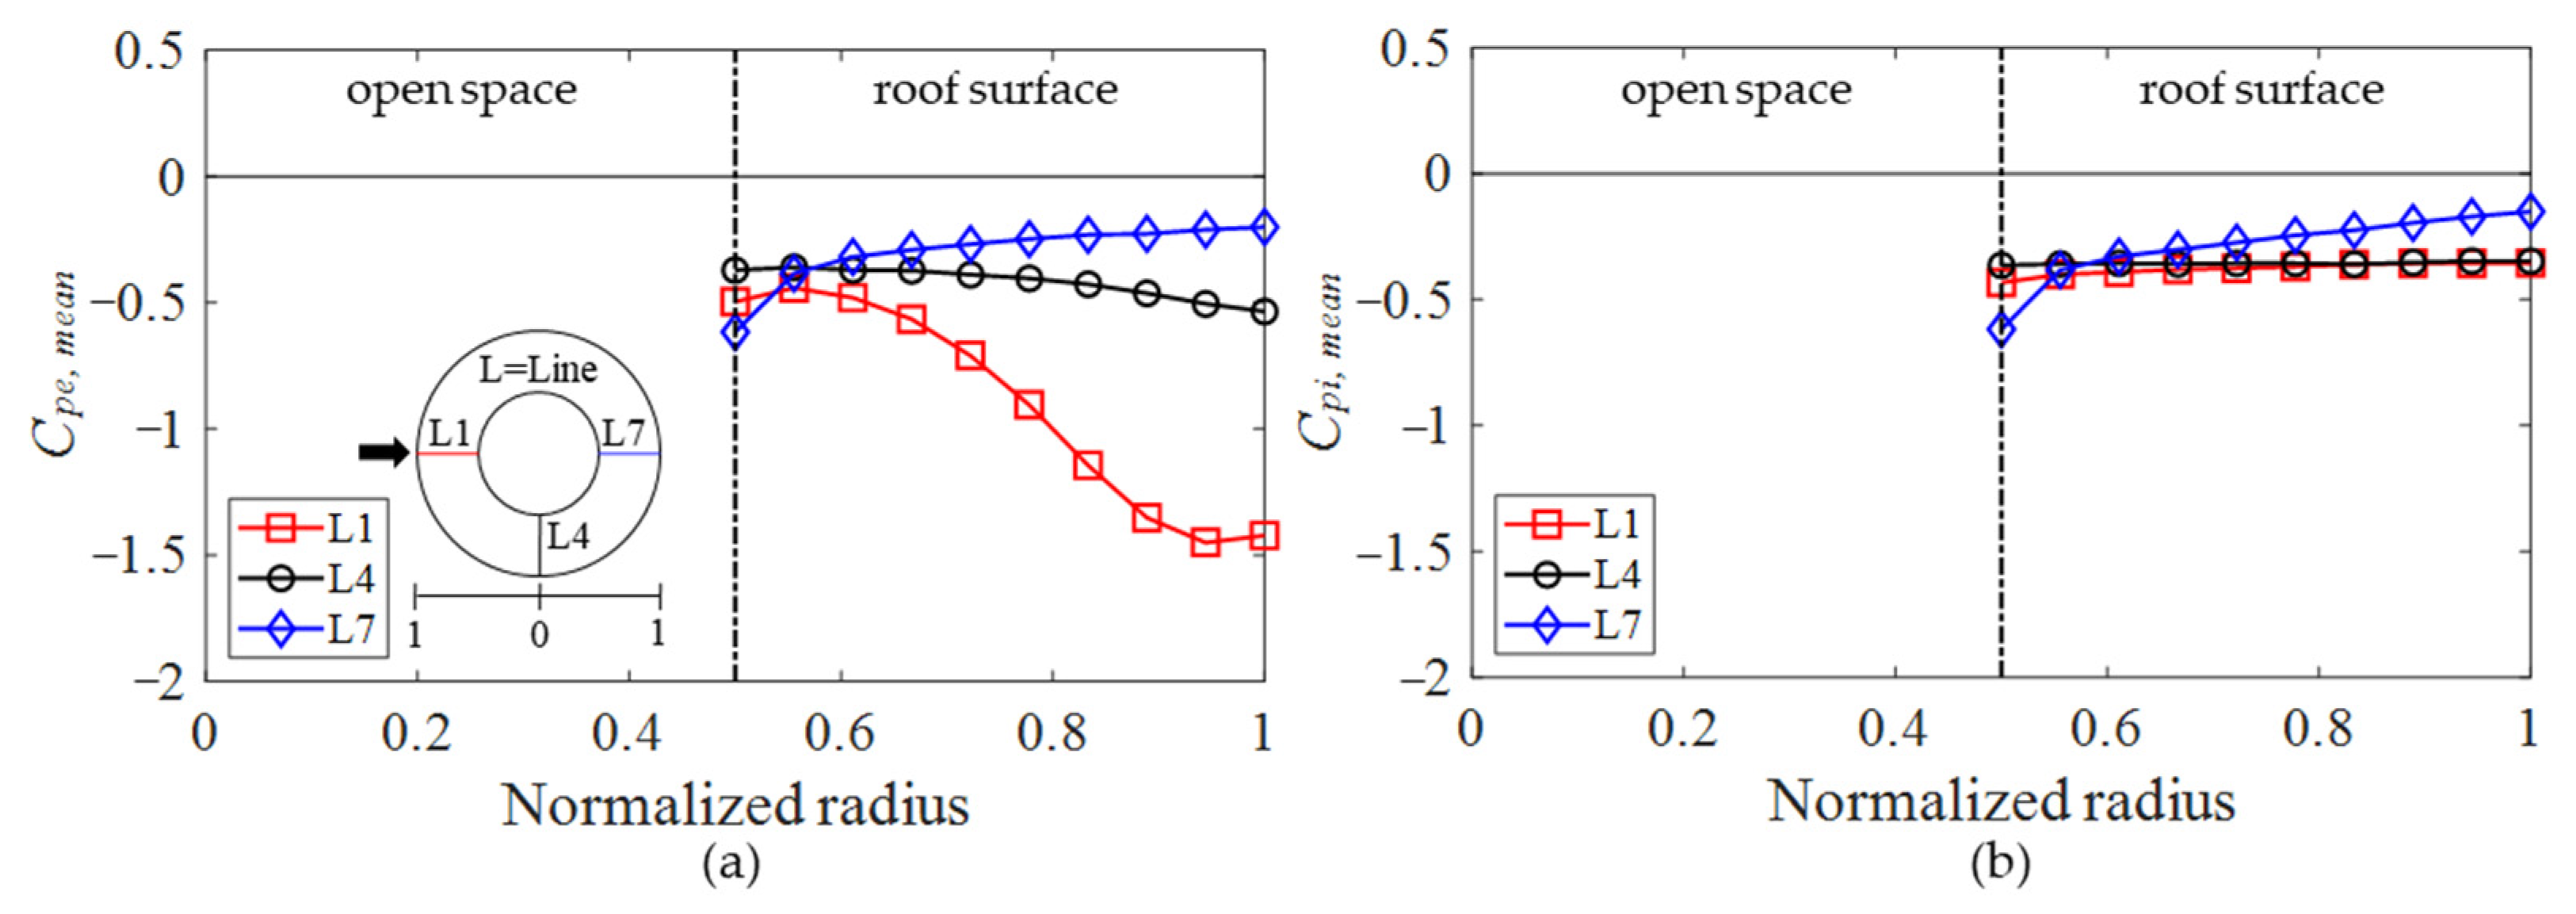
Buildings 12 00576 g006
Figure 7. Mean pressure coefficients along lines 1, 4, and 7 when H/D = 0.5: (a) Cpe,mean; (b) Cpi,mean.
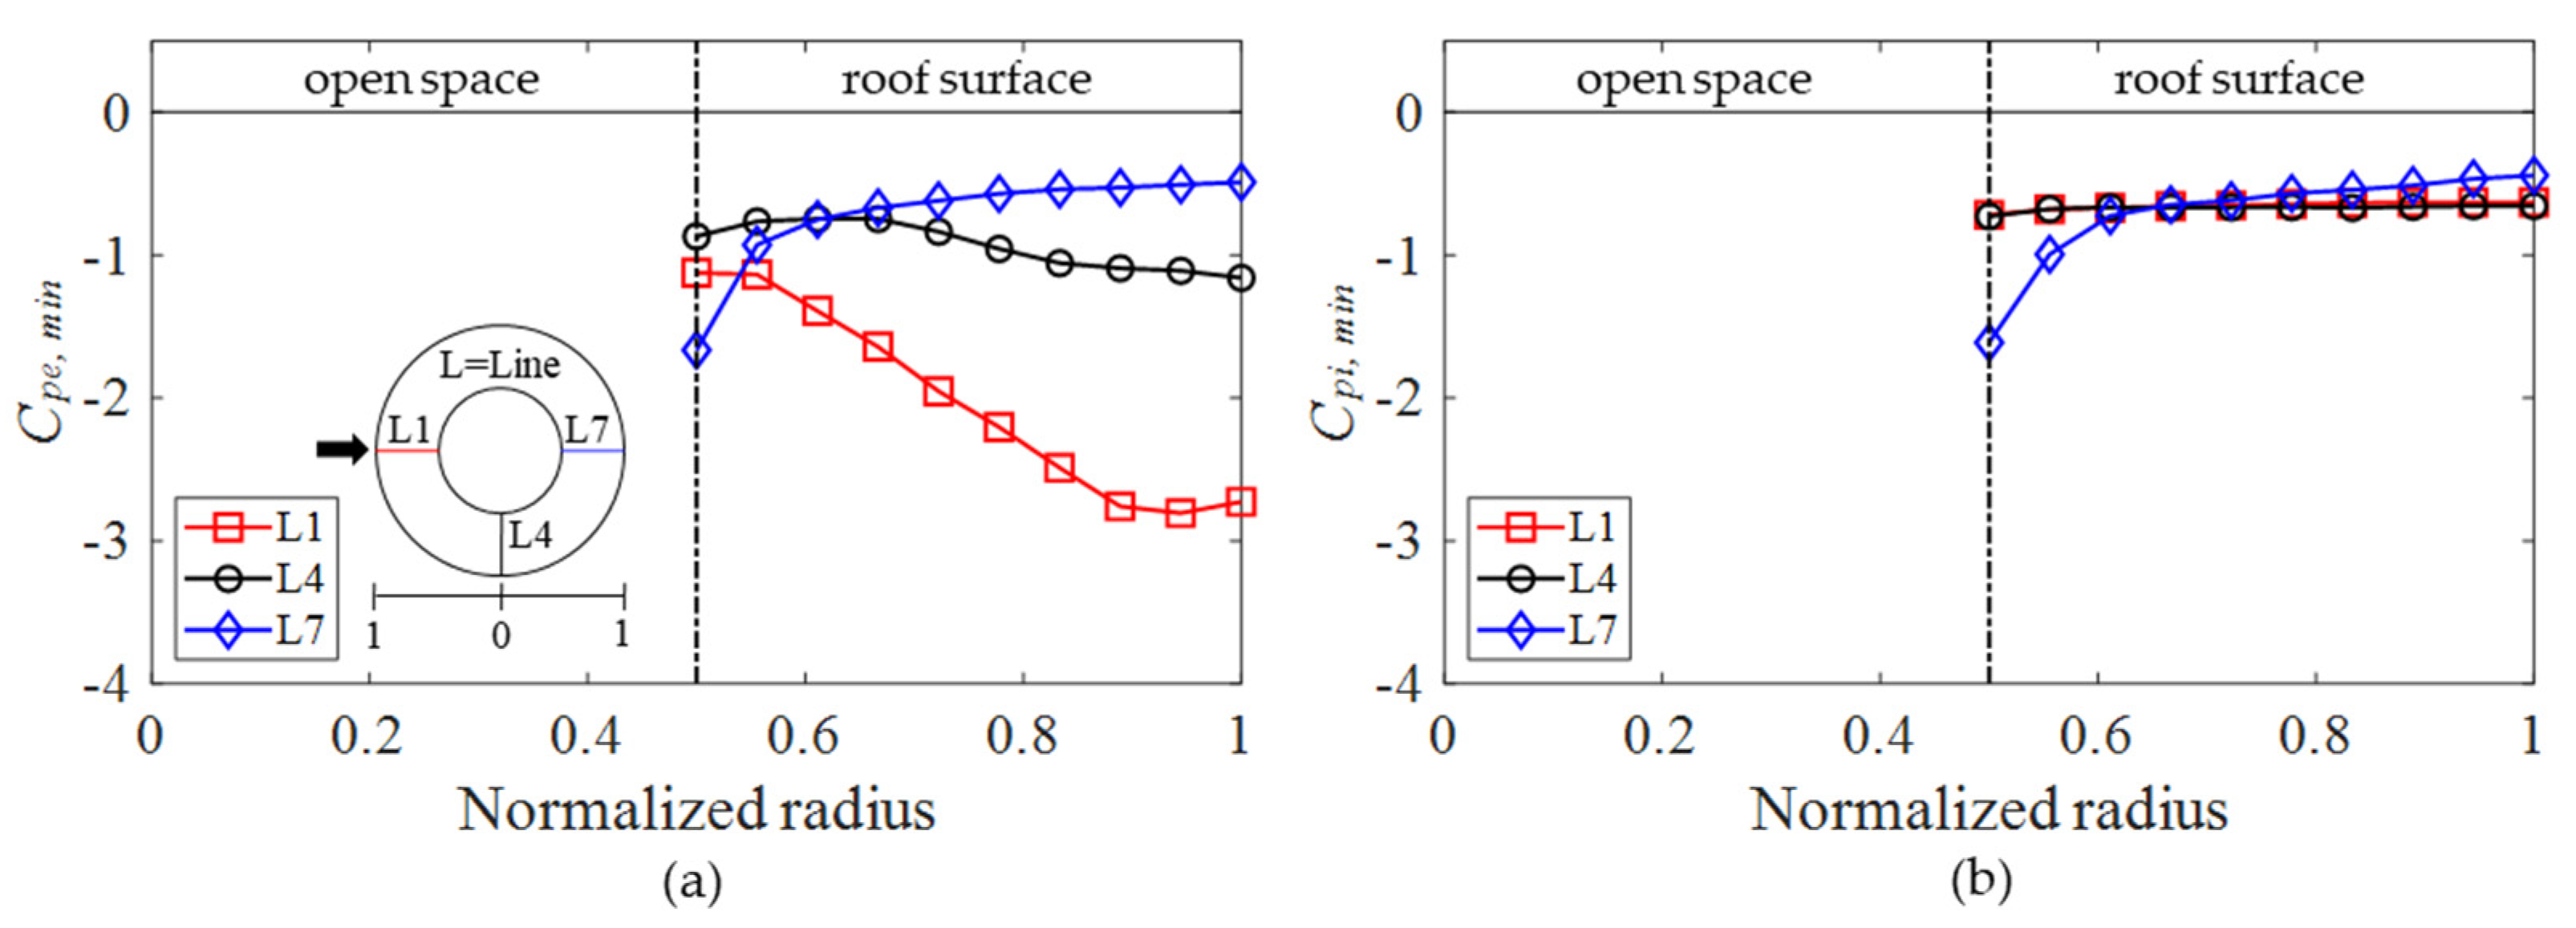
Buildings 12 00576 g007
Figure 8. Negative peak pressure coefficients along lines 1, 4, and 7 when H/D = 0.5: (a) Cpe,min; (b) Cpi,min.
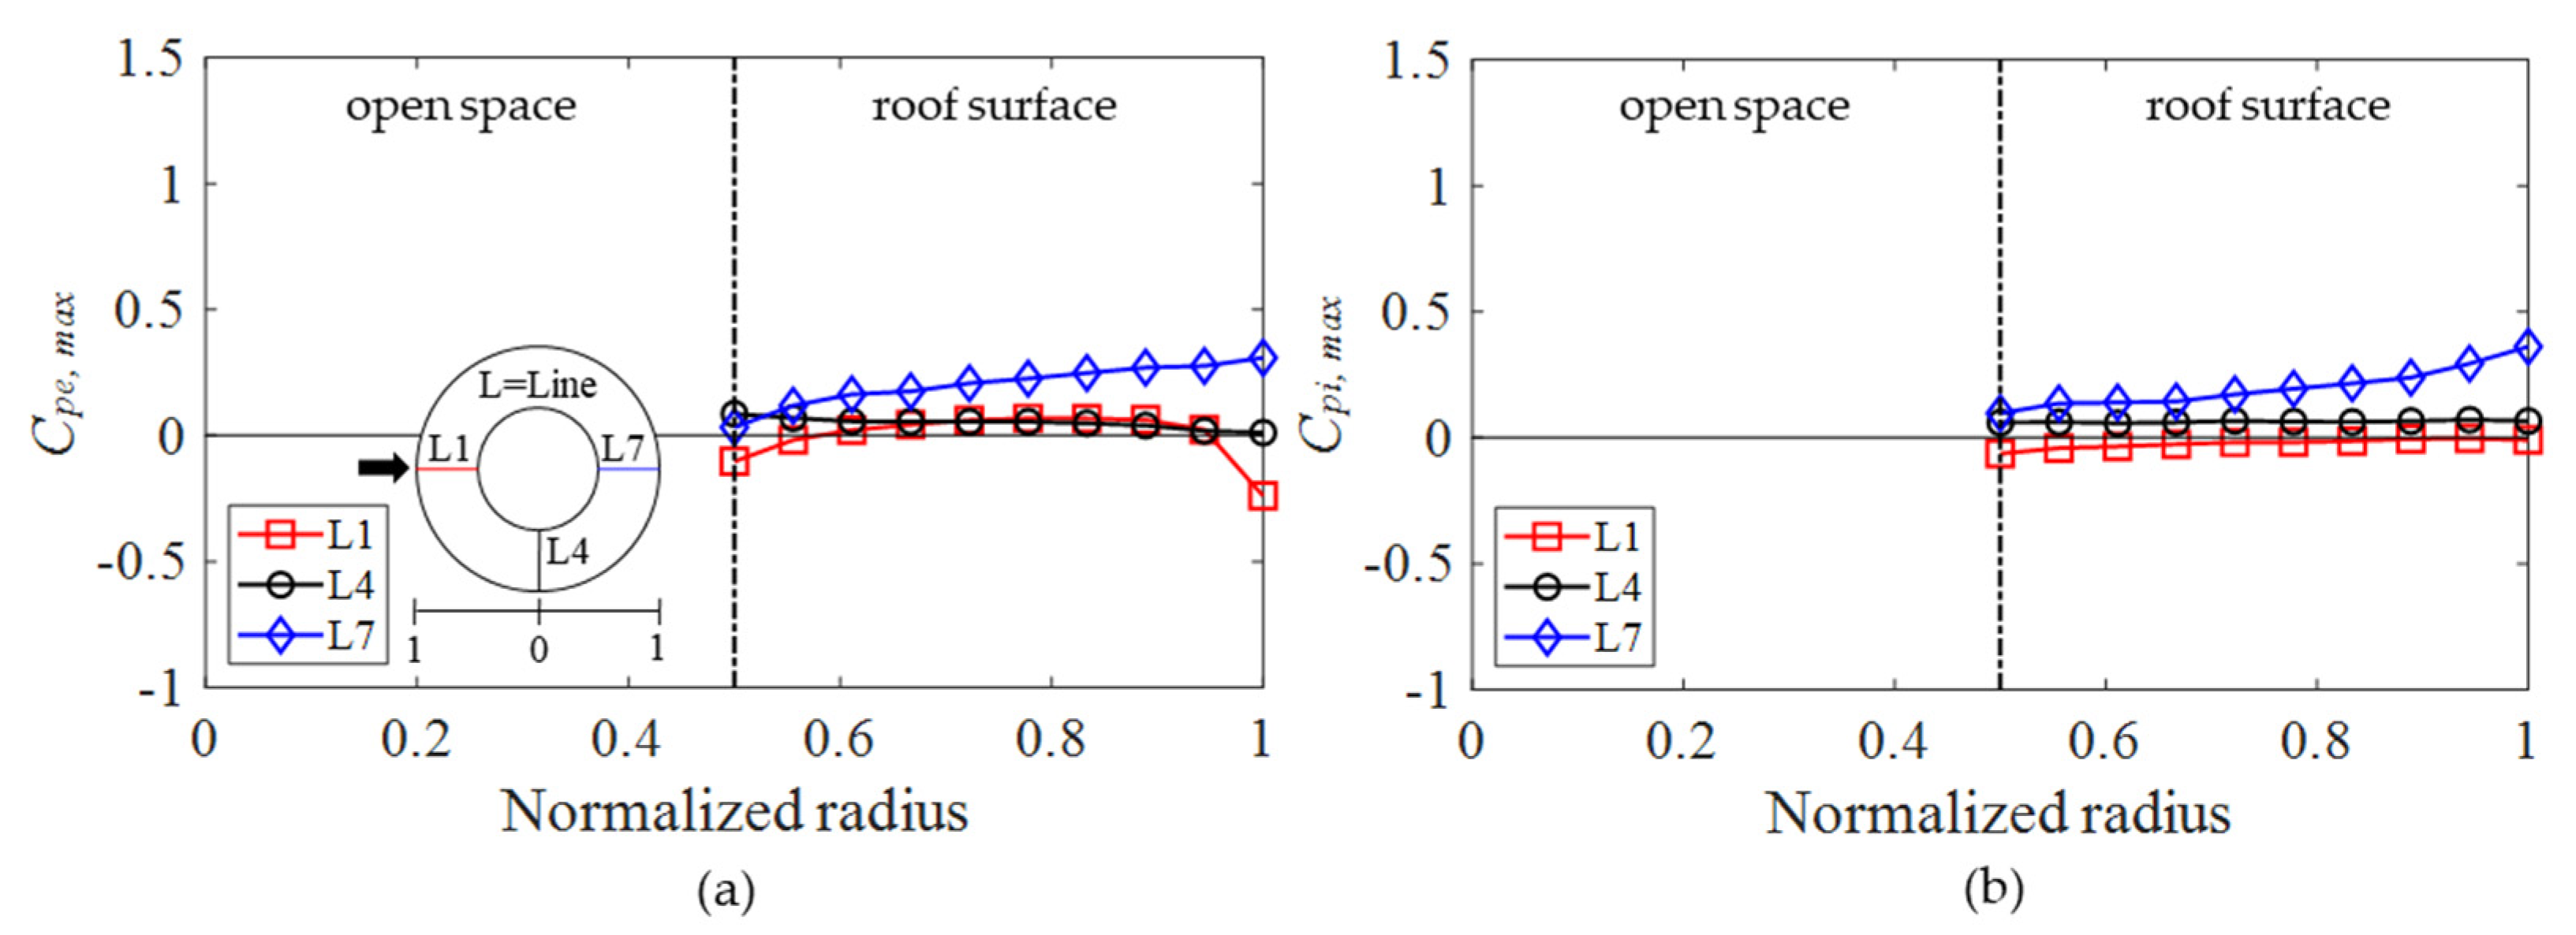
Buildings 12 00576 g008
Figure 9. Positive peak pressure coefficients along lines 1, 4, and 7 when H/D = 0.1: (a) Cpe,max; (b) Cpi,max.
Buildings 12 00576 g009
Figure 10. Distribution of mean net pressure coefficient when H/D = 0.5: (a) contour; (b) mean net pressure coefficient along lines 1, 4, and 7.
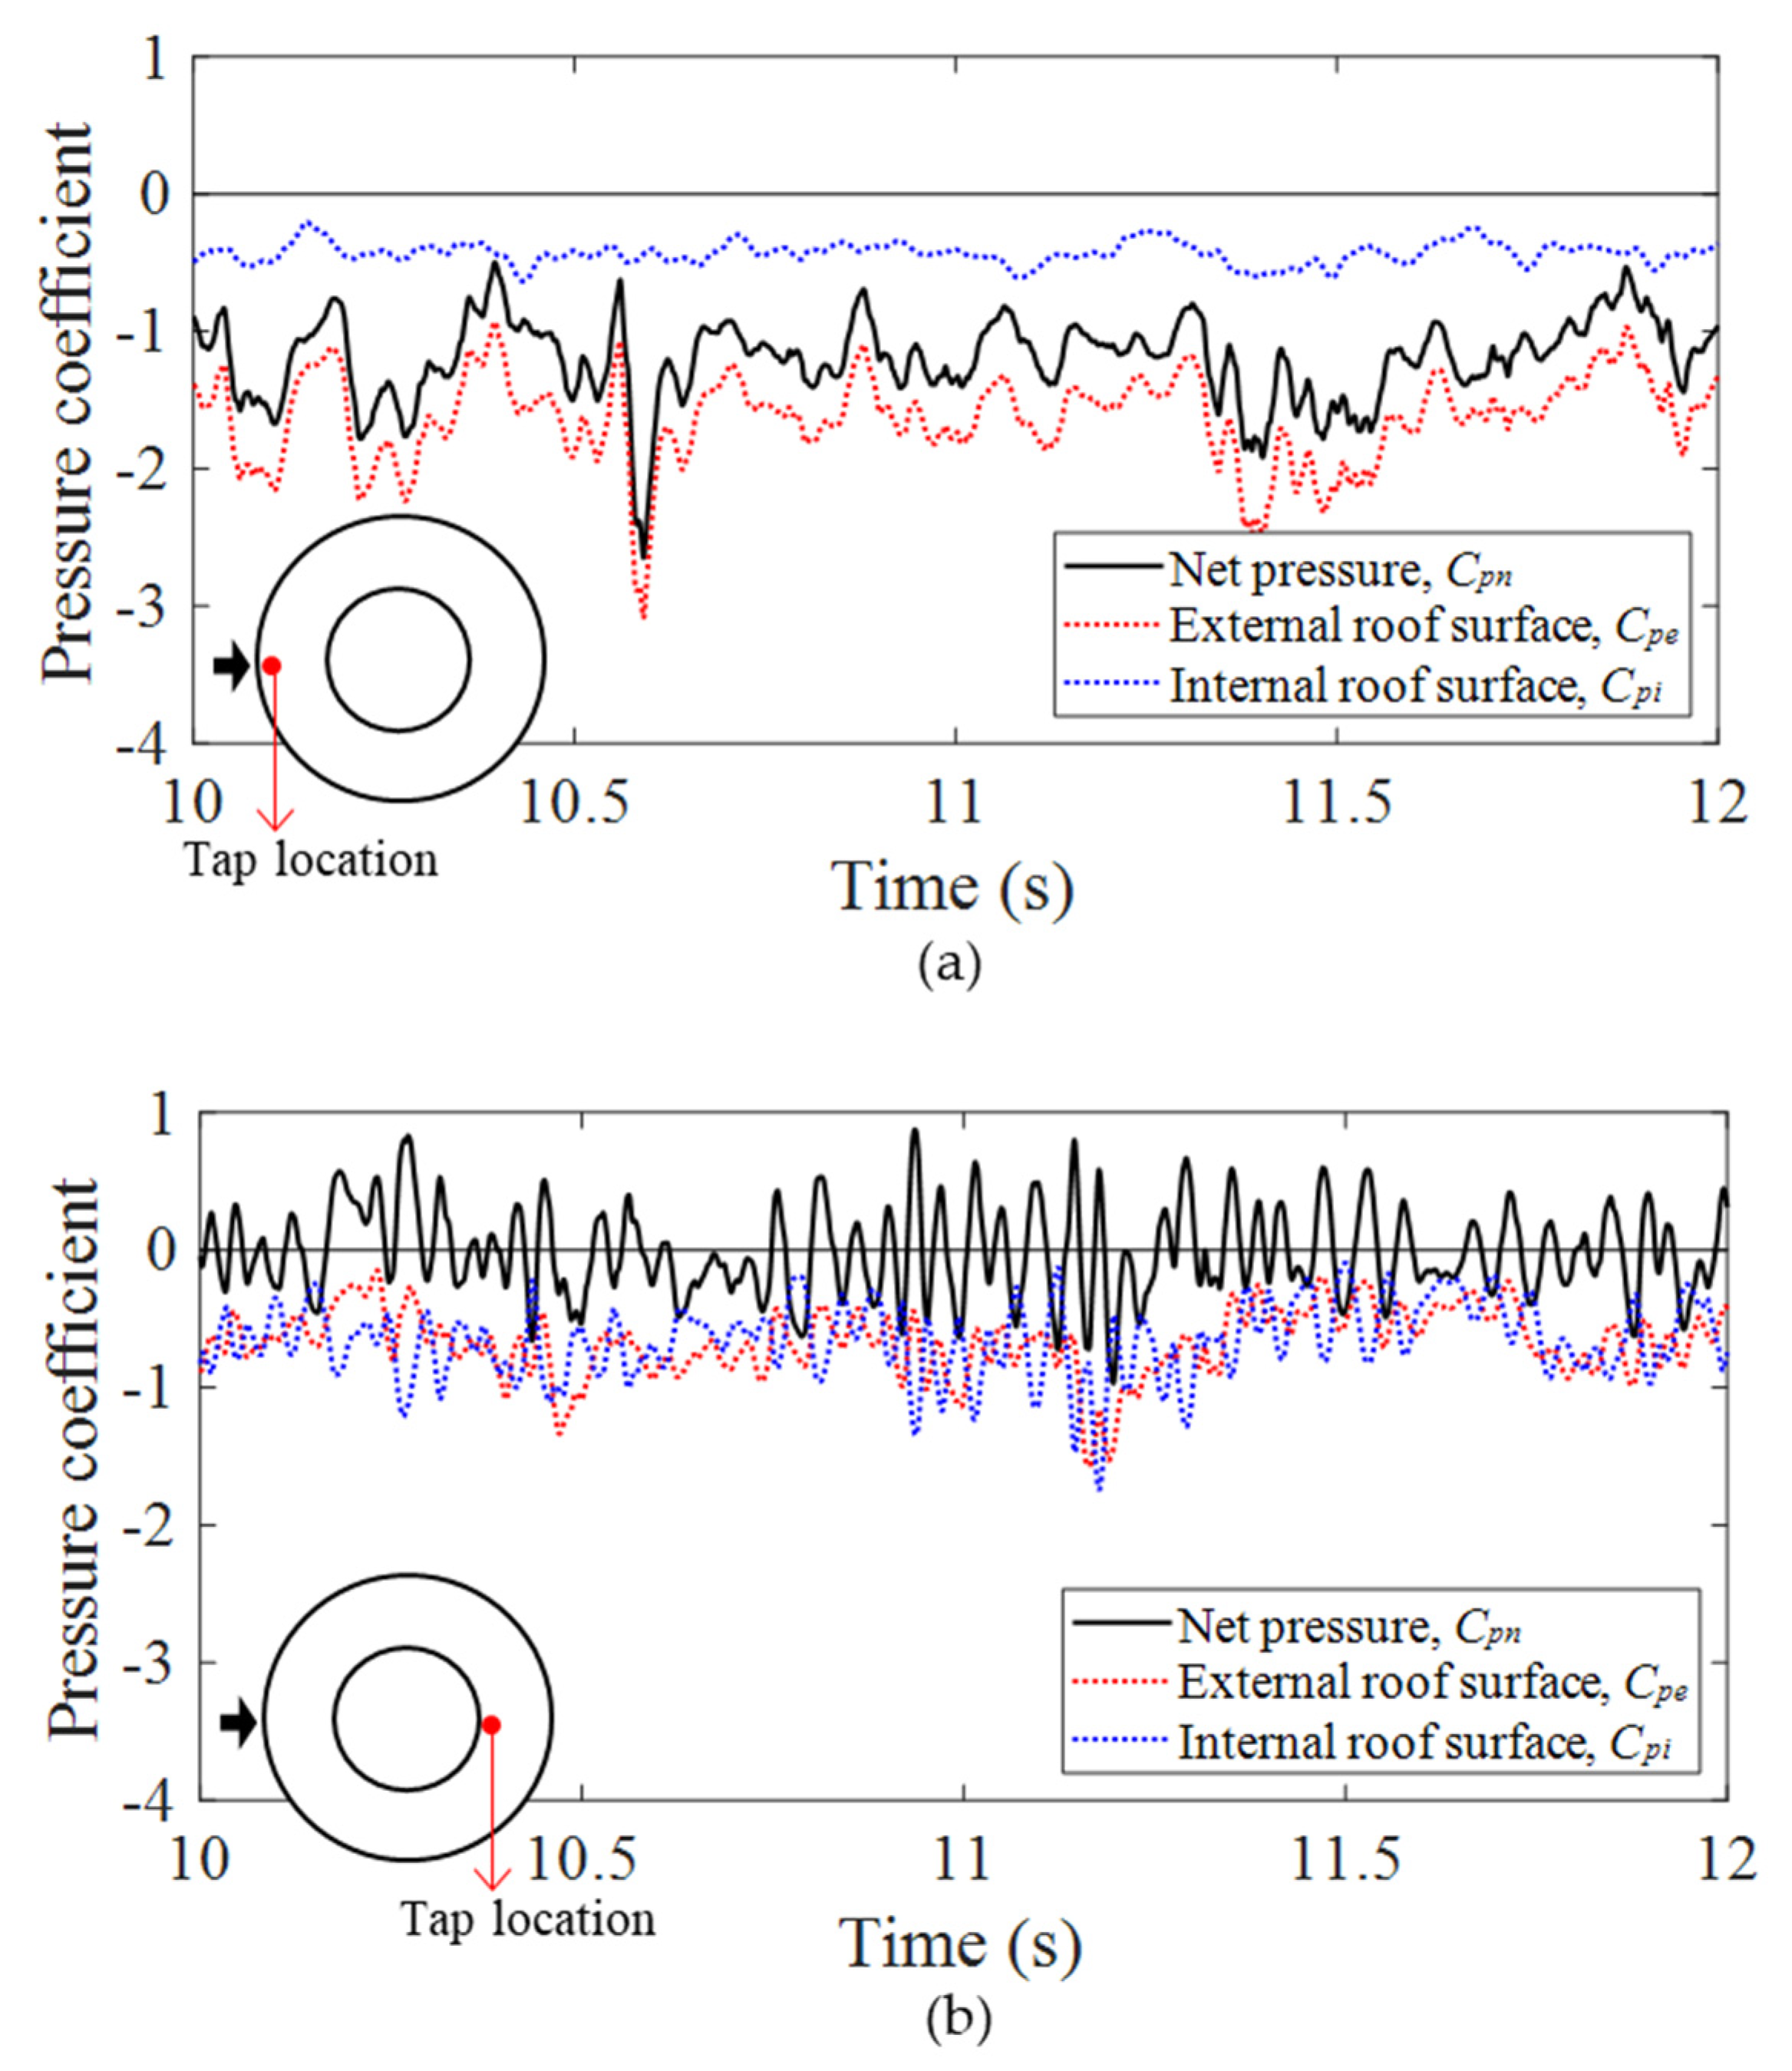
Buildings 12 00576 g010
Figure 11. Wind pressure time histories of location affected by separation: (a) windward region; (b) leeward region.
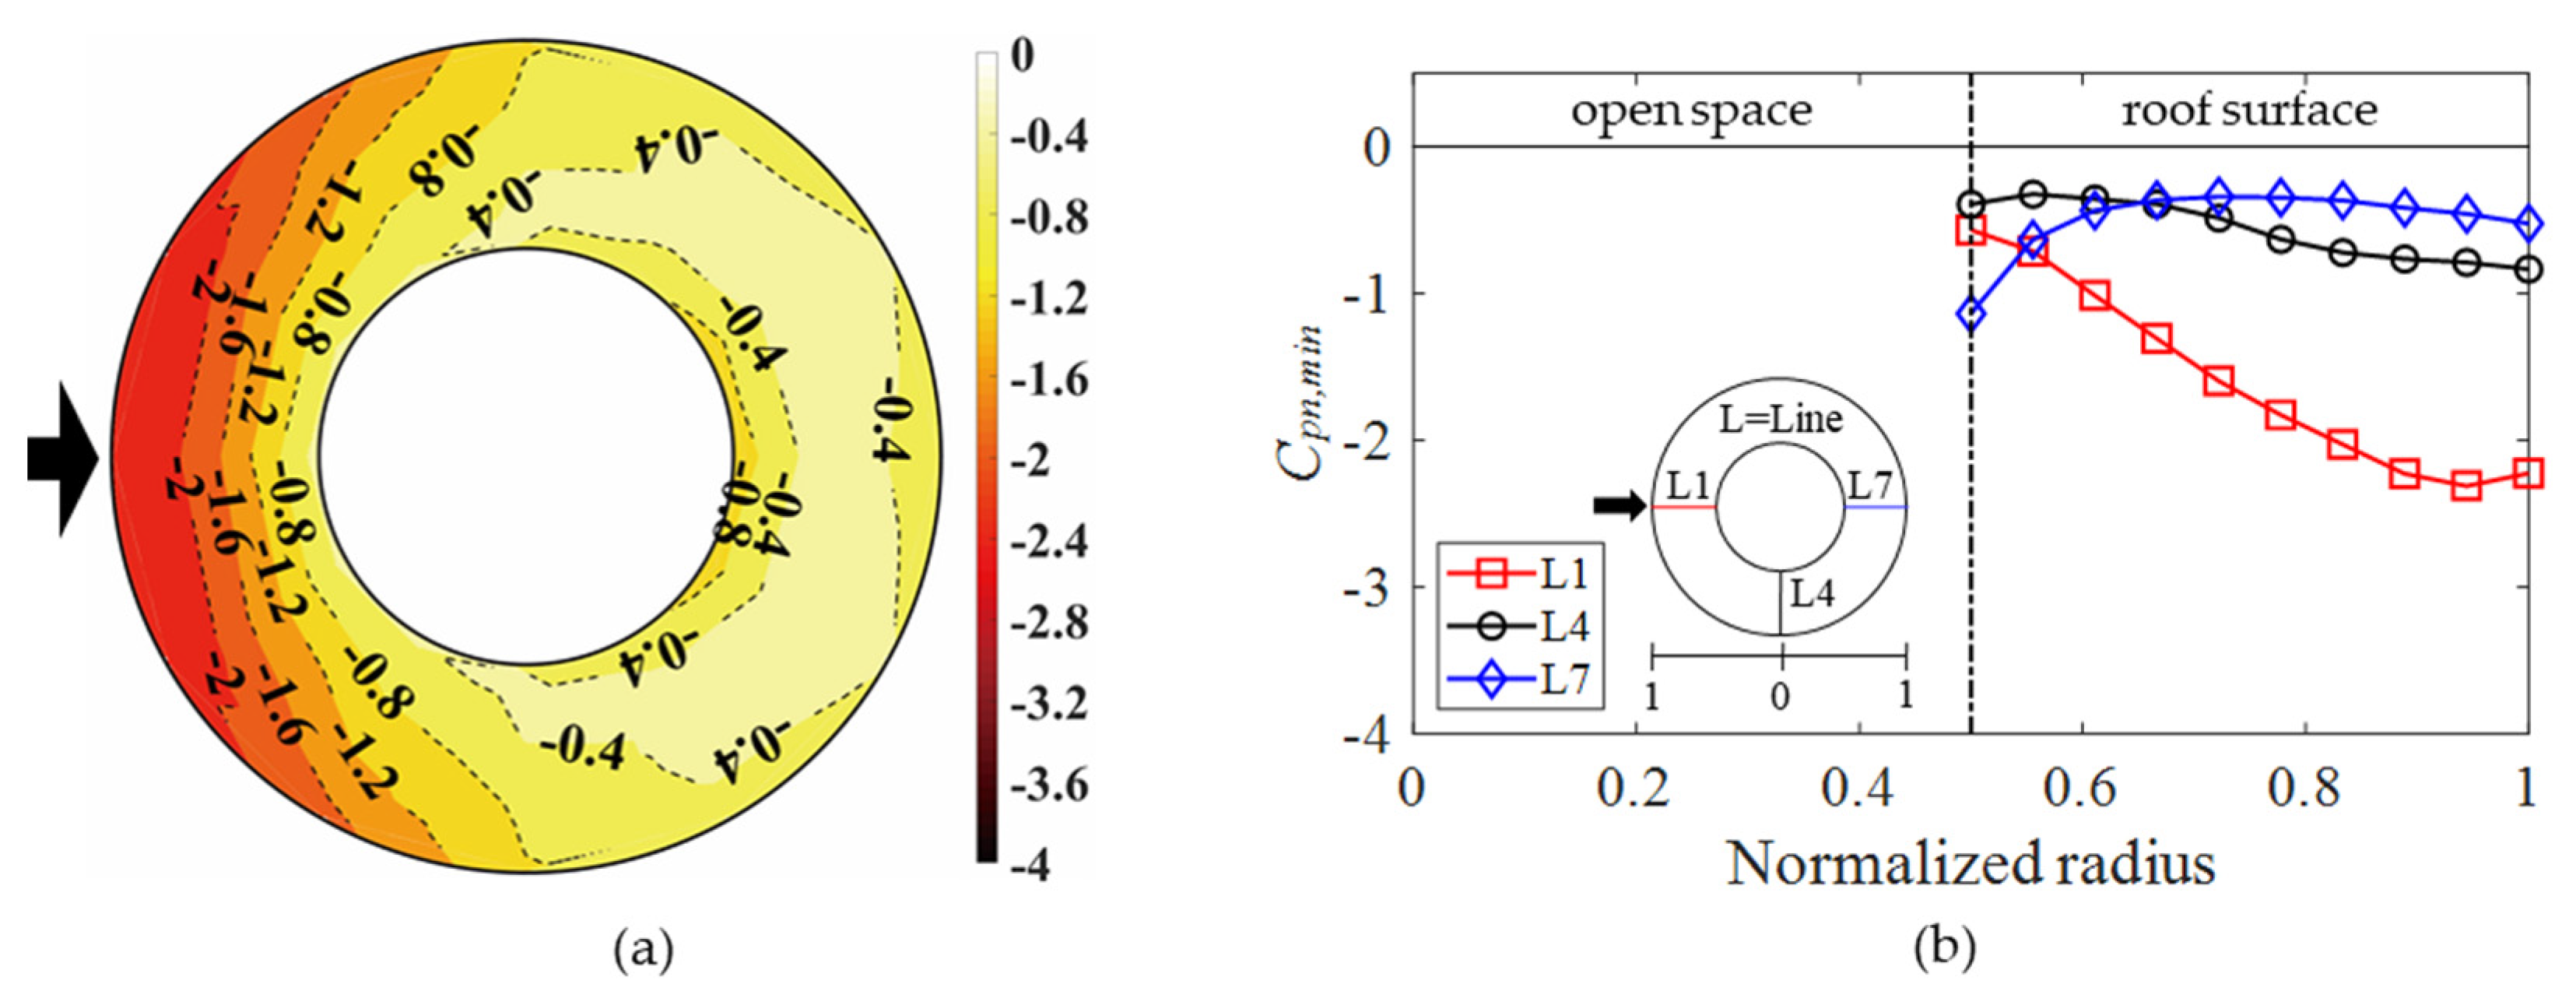
Buildings 12 00576 g011
Figure 12. Distribution of negative peak net pressure coefficients when H/D = 0.5: (a) contour; (b) Cpn,min along lines 1, 4, and 7.
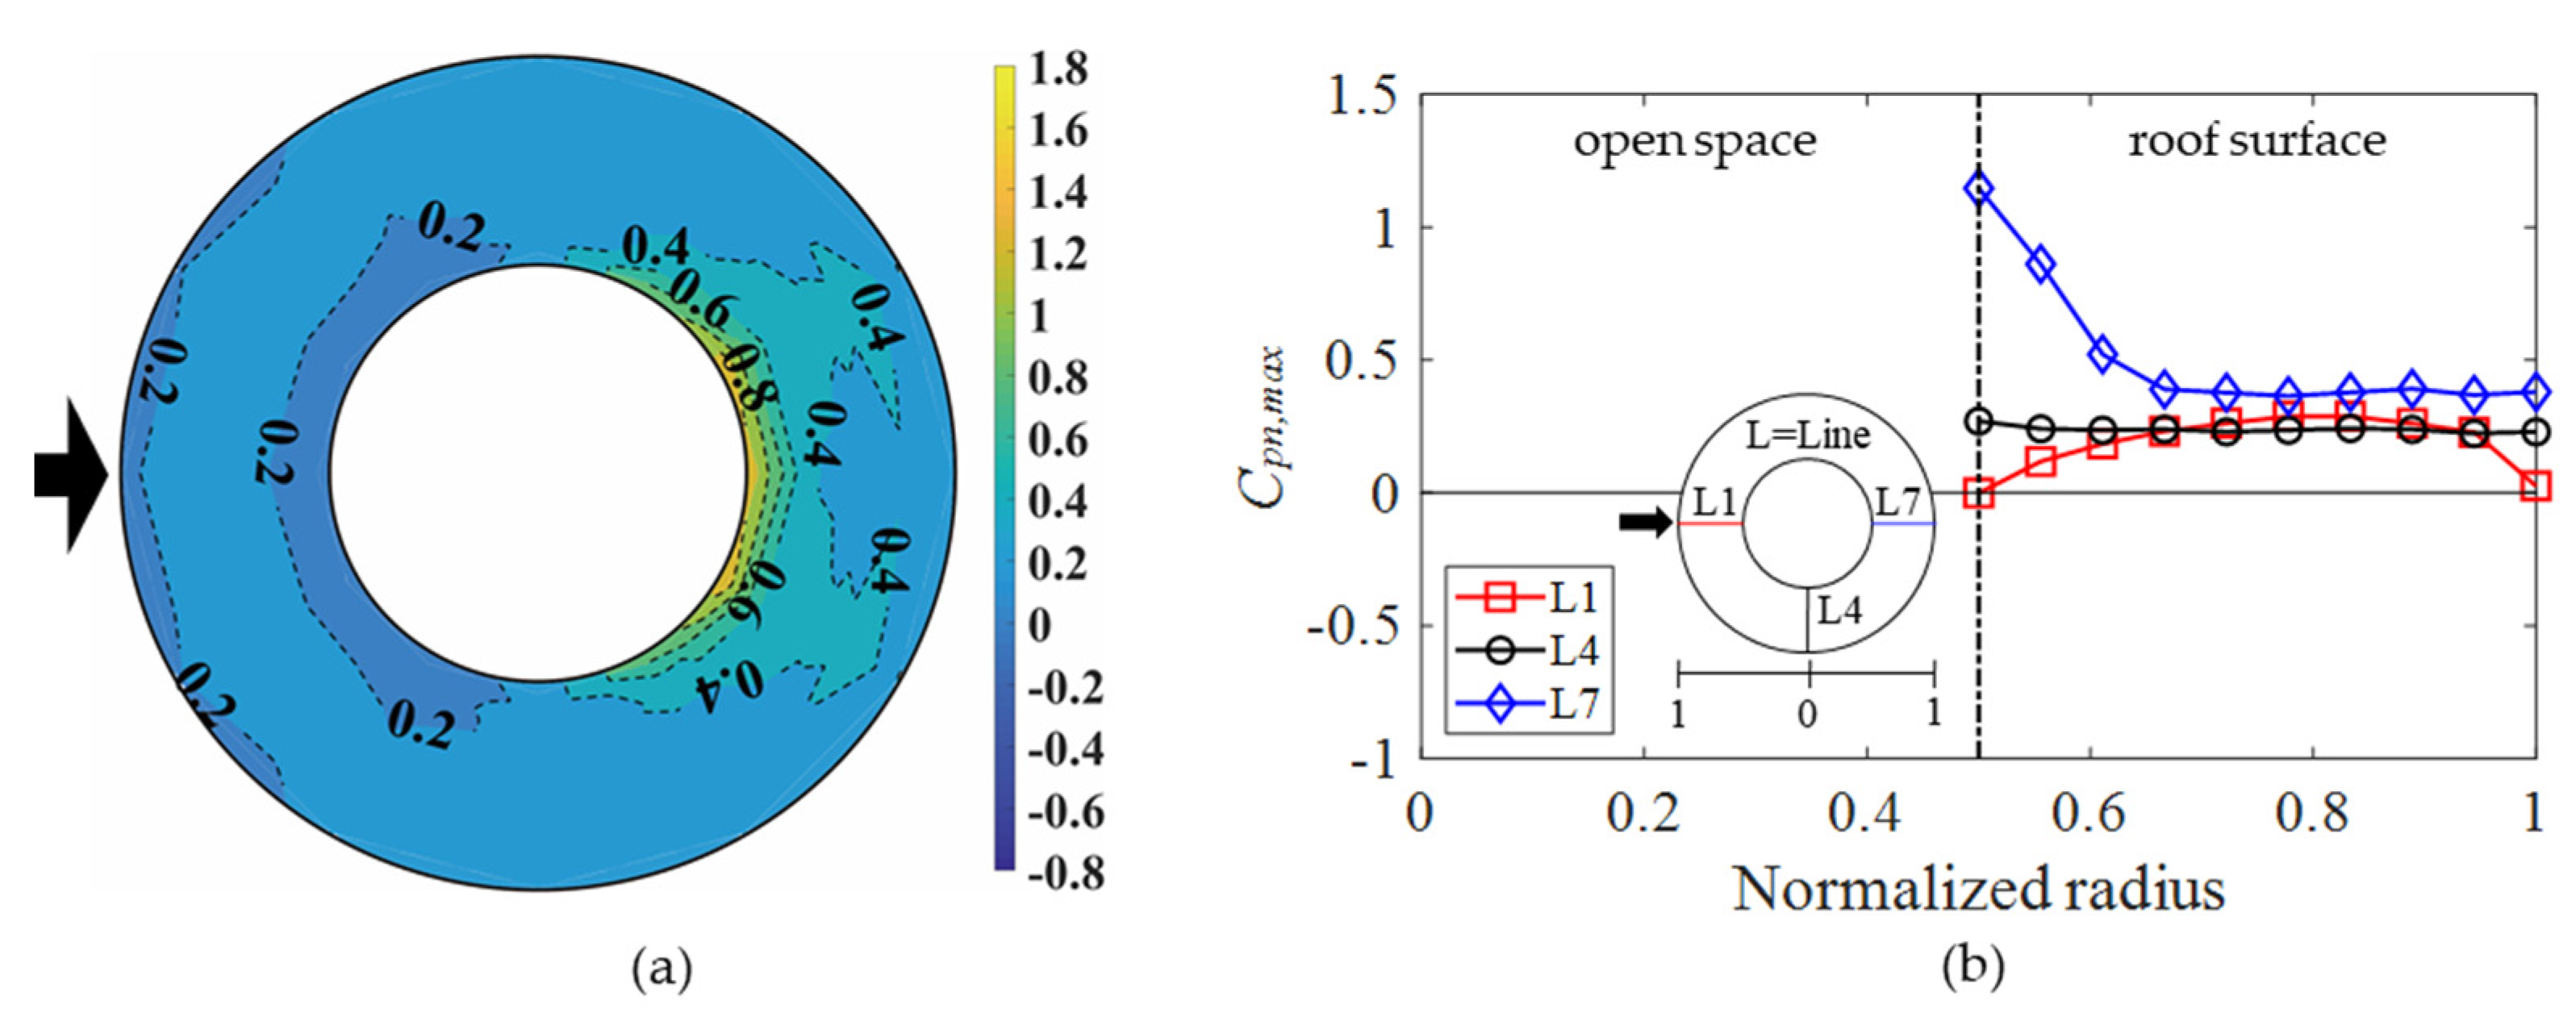
Buildings 12 00576 g012
Figure 13. Distribution of positive peak net pressure coefficients when H/D = 0.1: (a) contour; (b) Cpn,max along lines 1, 4 and 7.
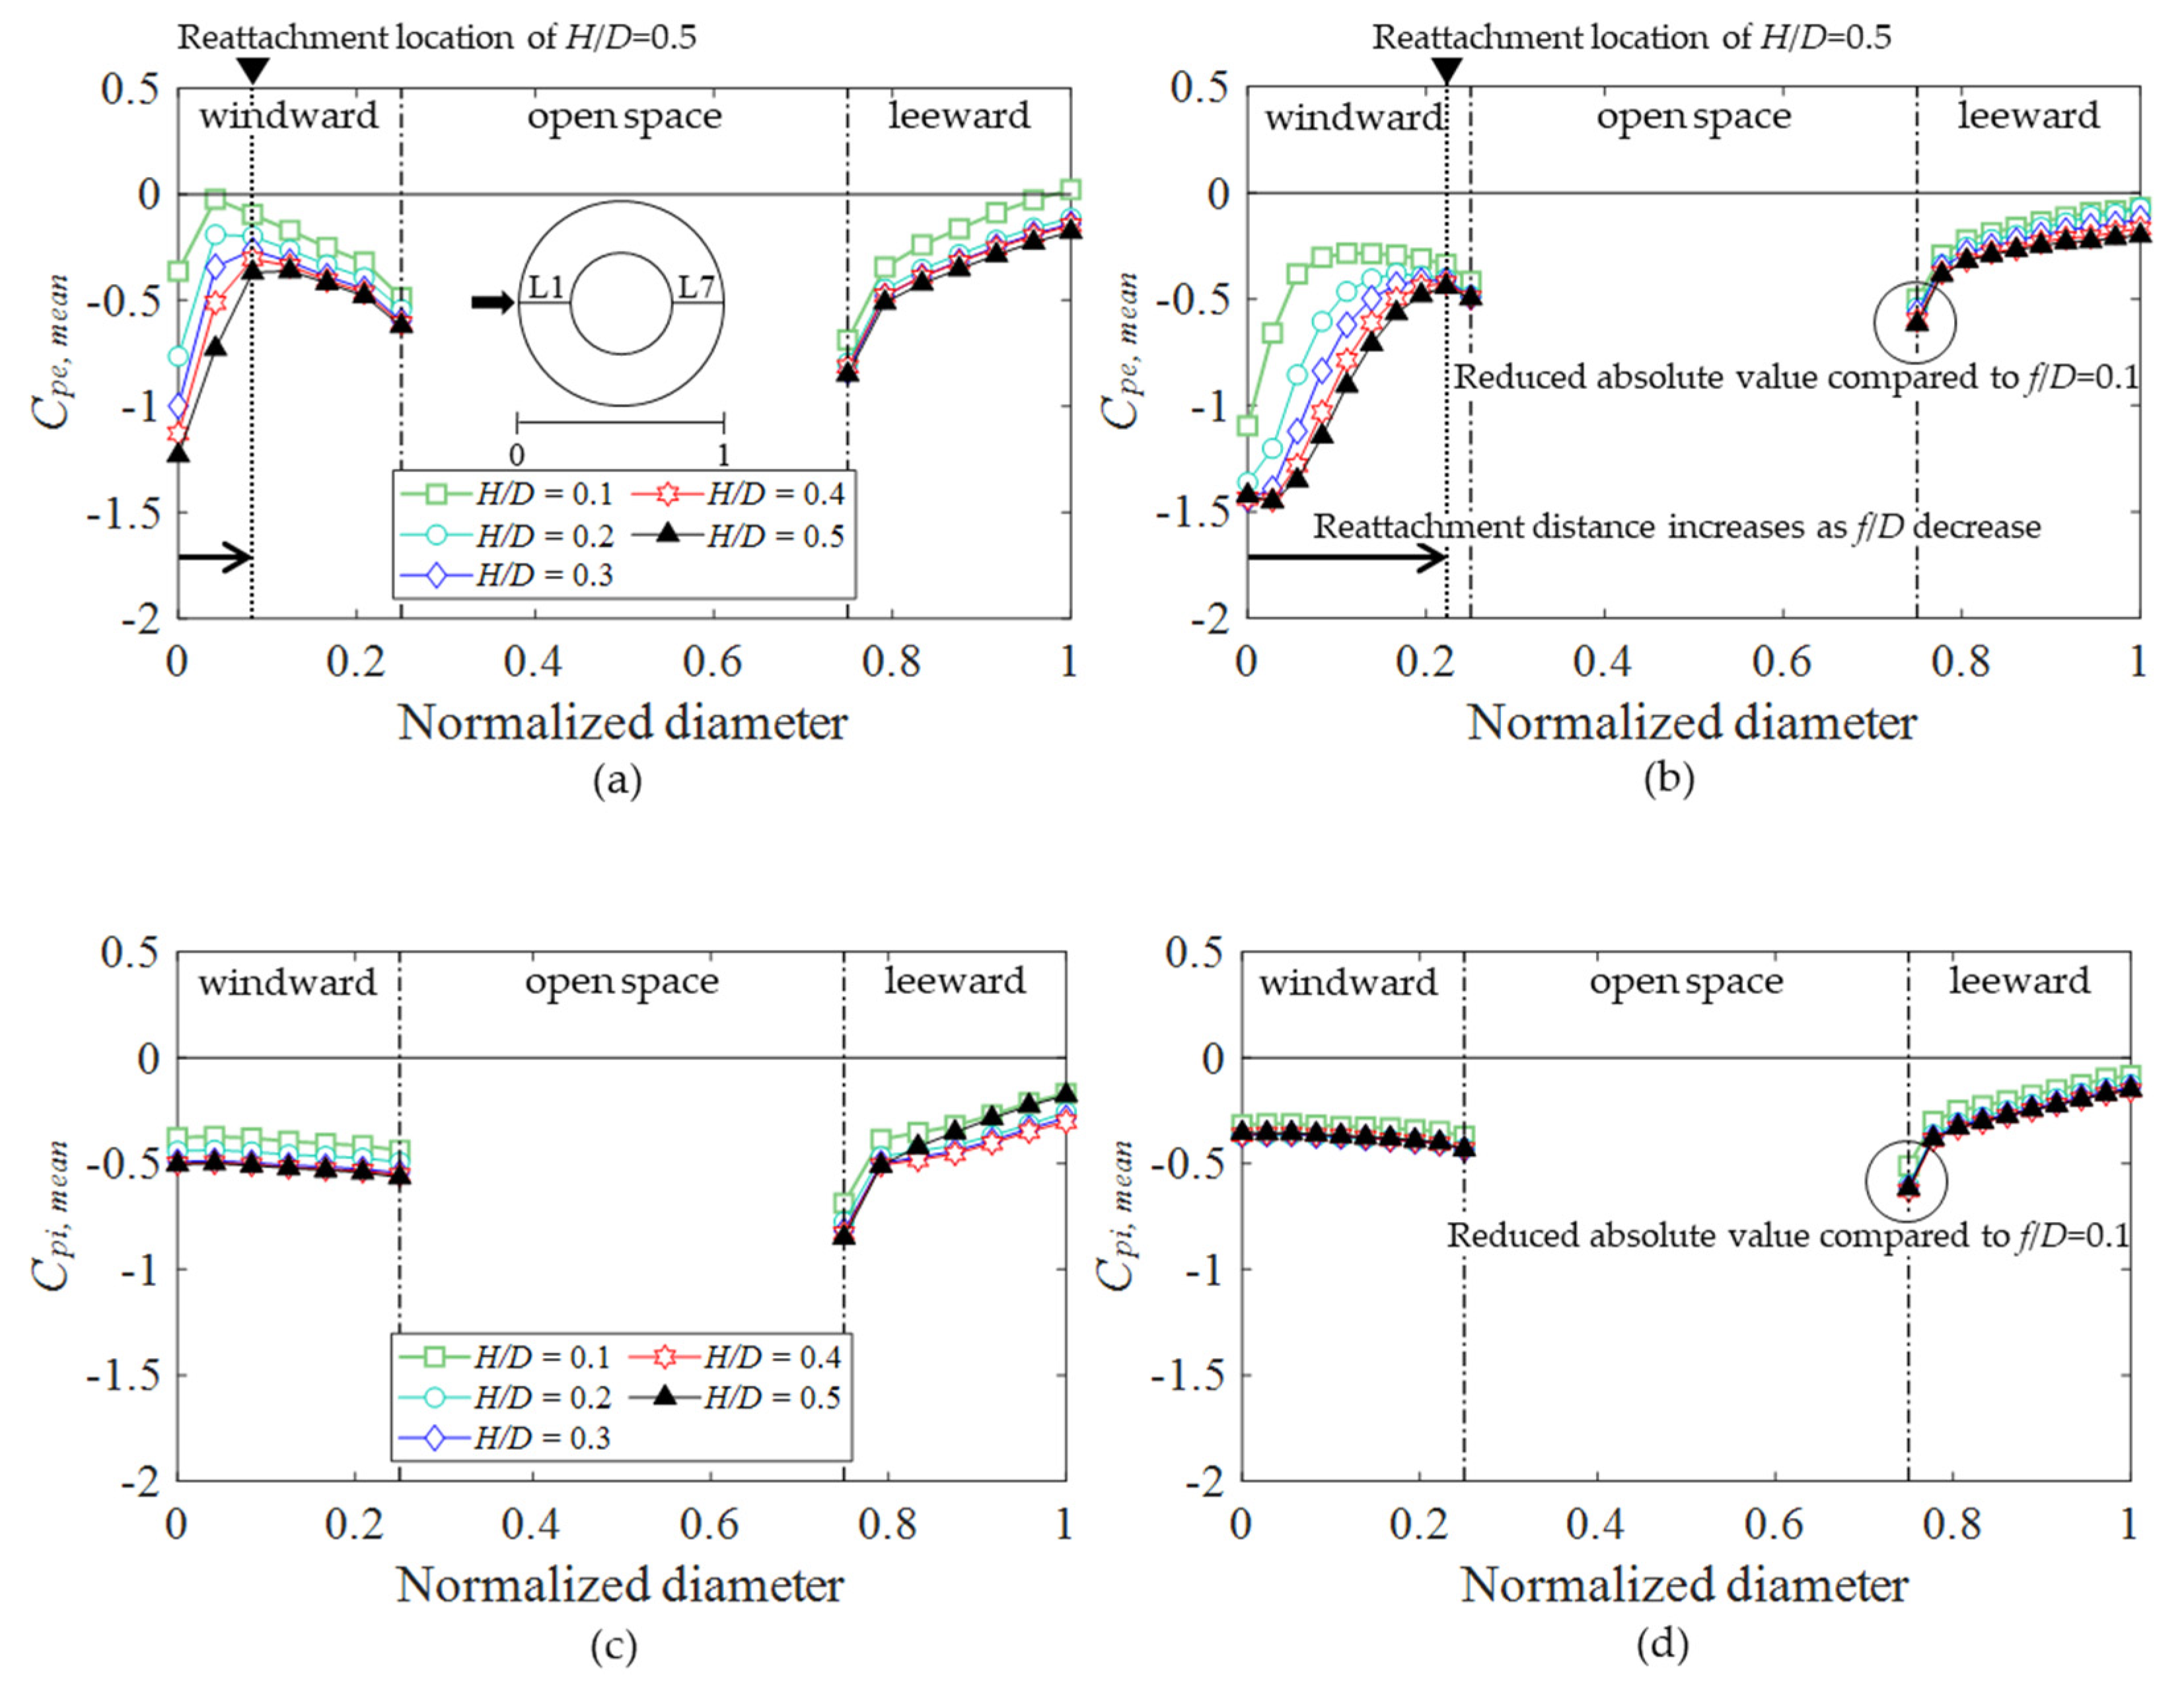
Buildings 12 00576 g013
Figure 14. External and internal mean pressure coefficients based on f/D: (a) Cpe,mean when f/D = 0.1; (b) Cpe,mean when f/D = 0.05; (c) Cpi,mean when f/D = 0.1; (d) Cpi,mean when f/D = 0.05.
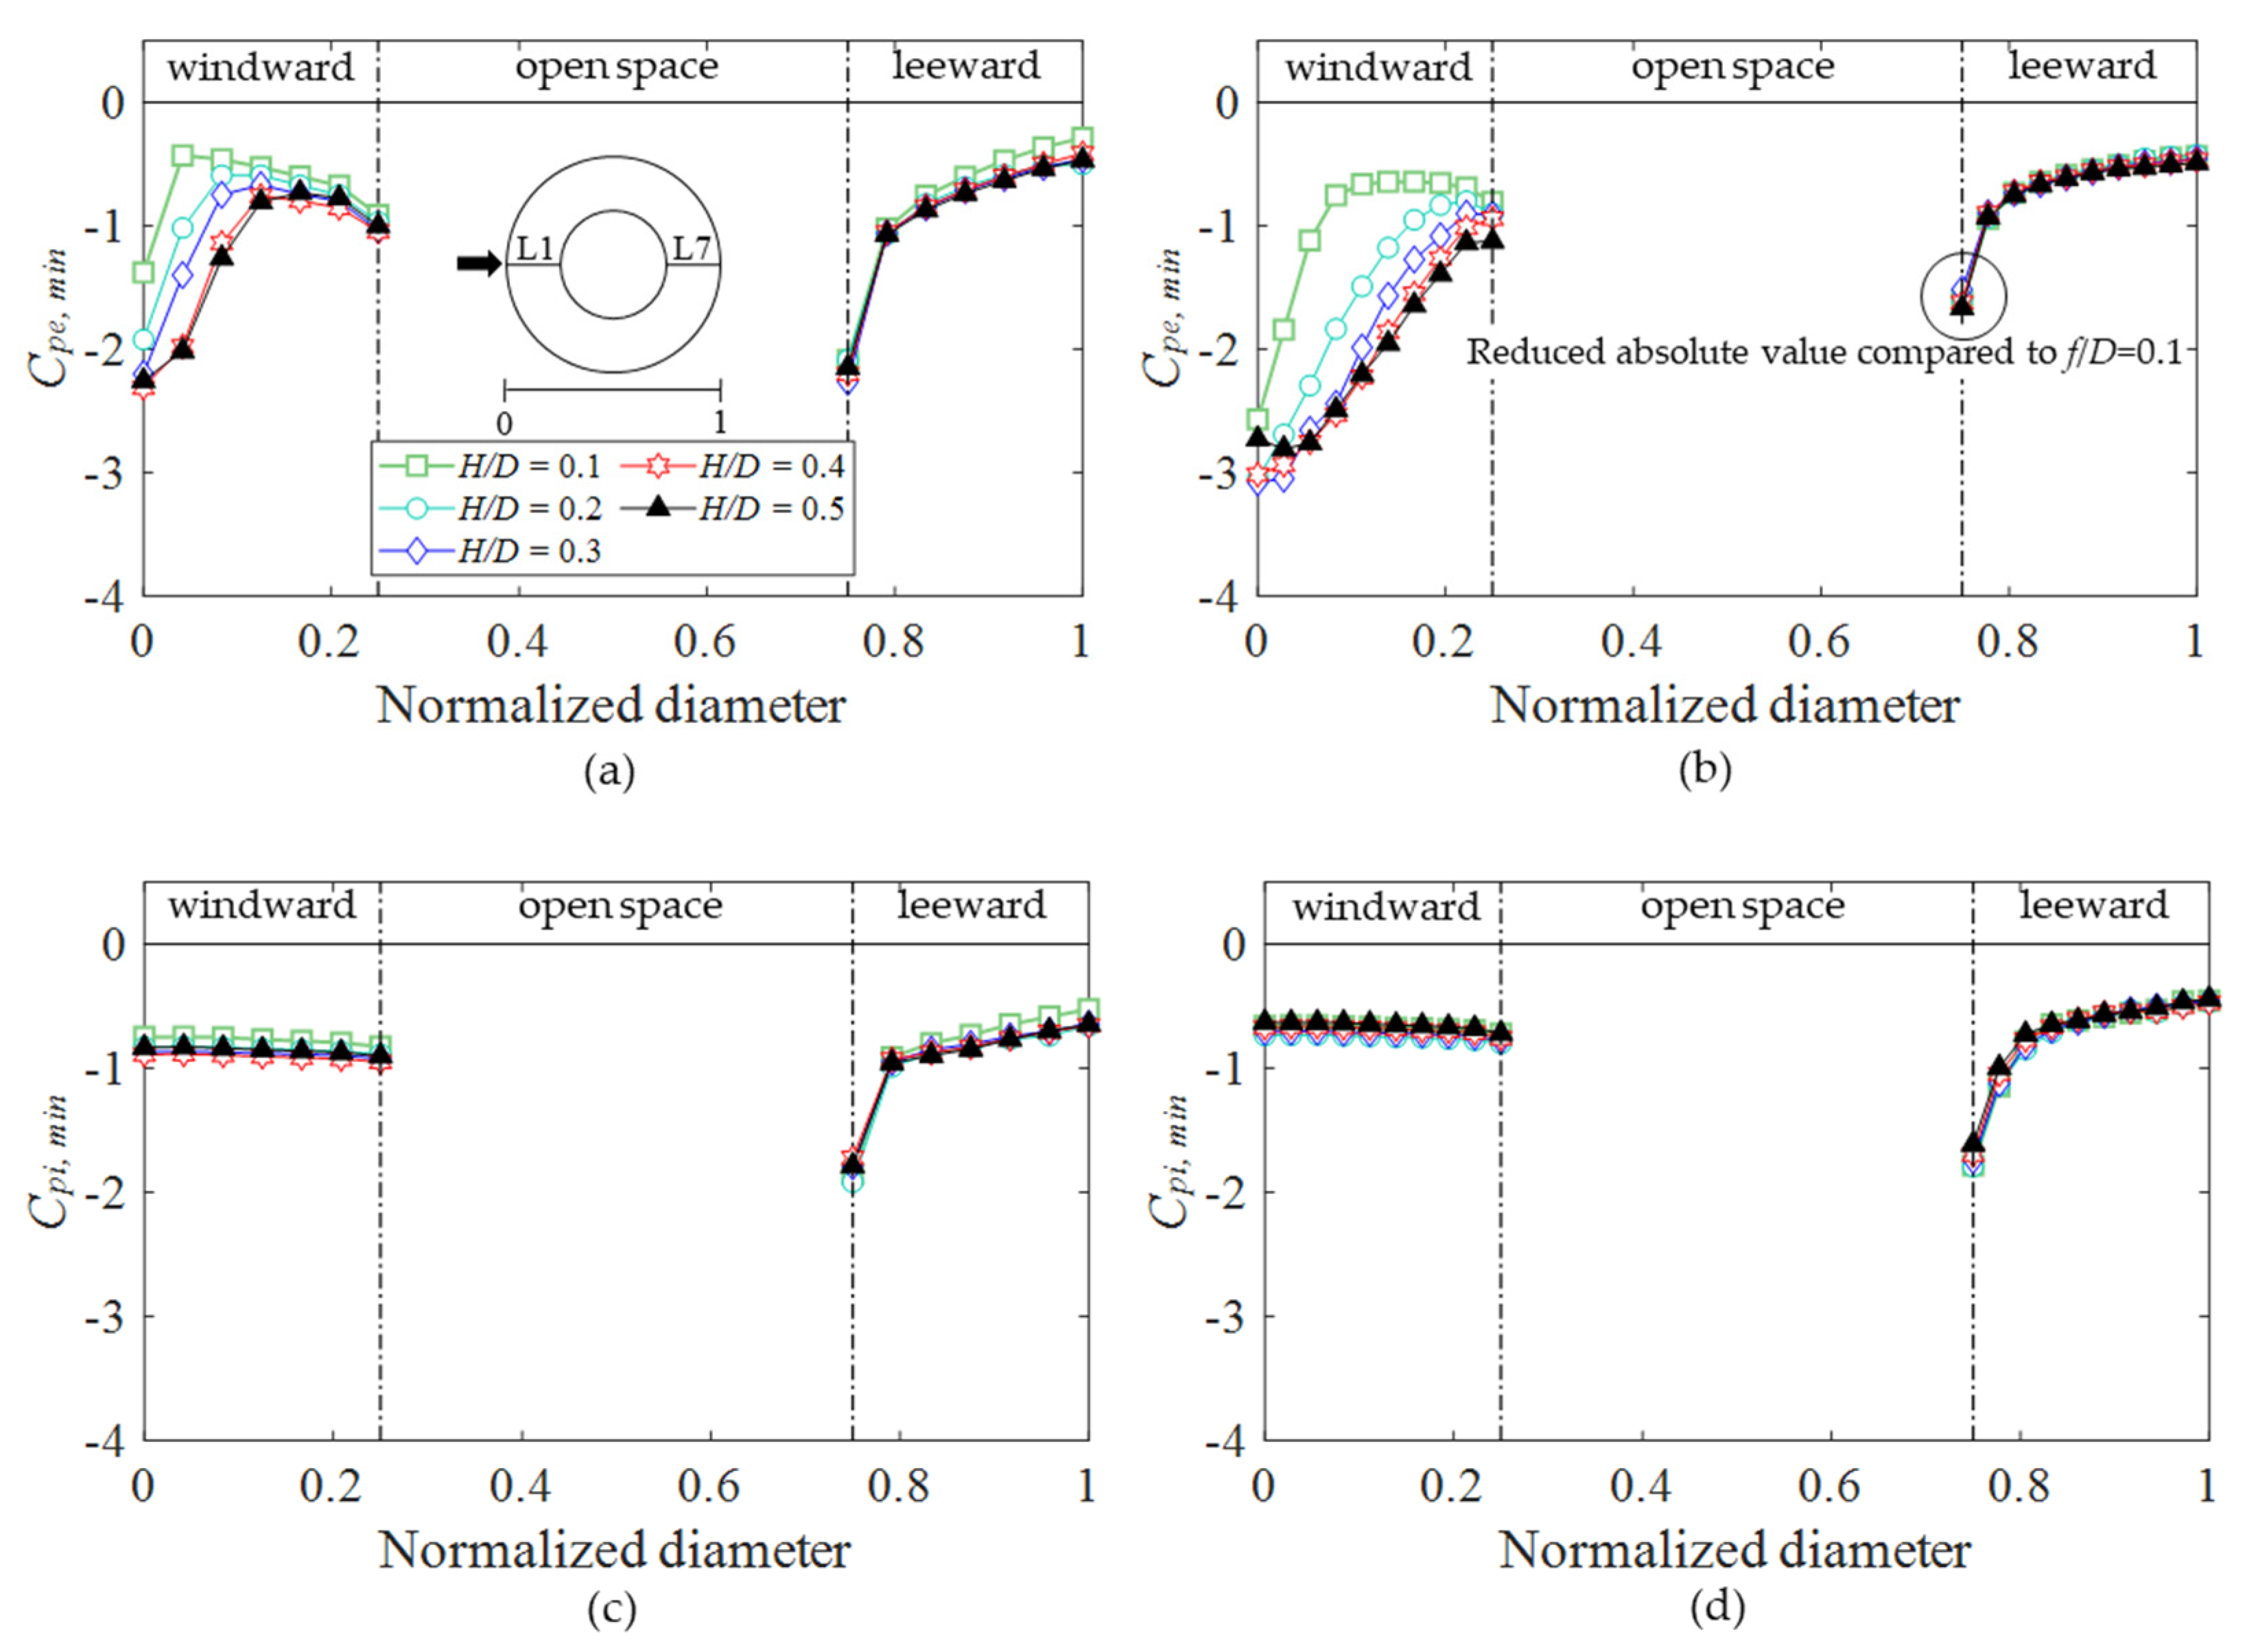
Buildings 12 00576 g014
Figure 15. External negative peak pressure coefficient based on f/D: (a) Cpe,min when f/D = 0.1; (b) Cpe,min when f/D = 0.05 (c) Cpi,min when f/D = 0.1; (d) Cpi,min when f/D = 0.05.
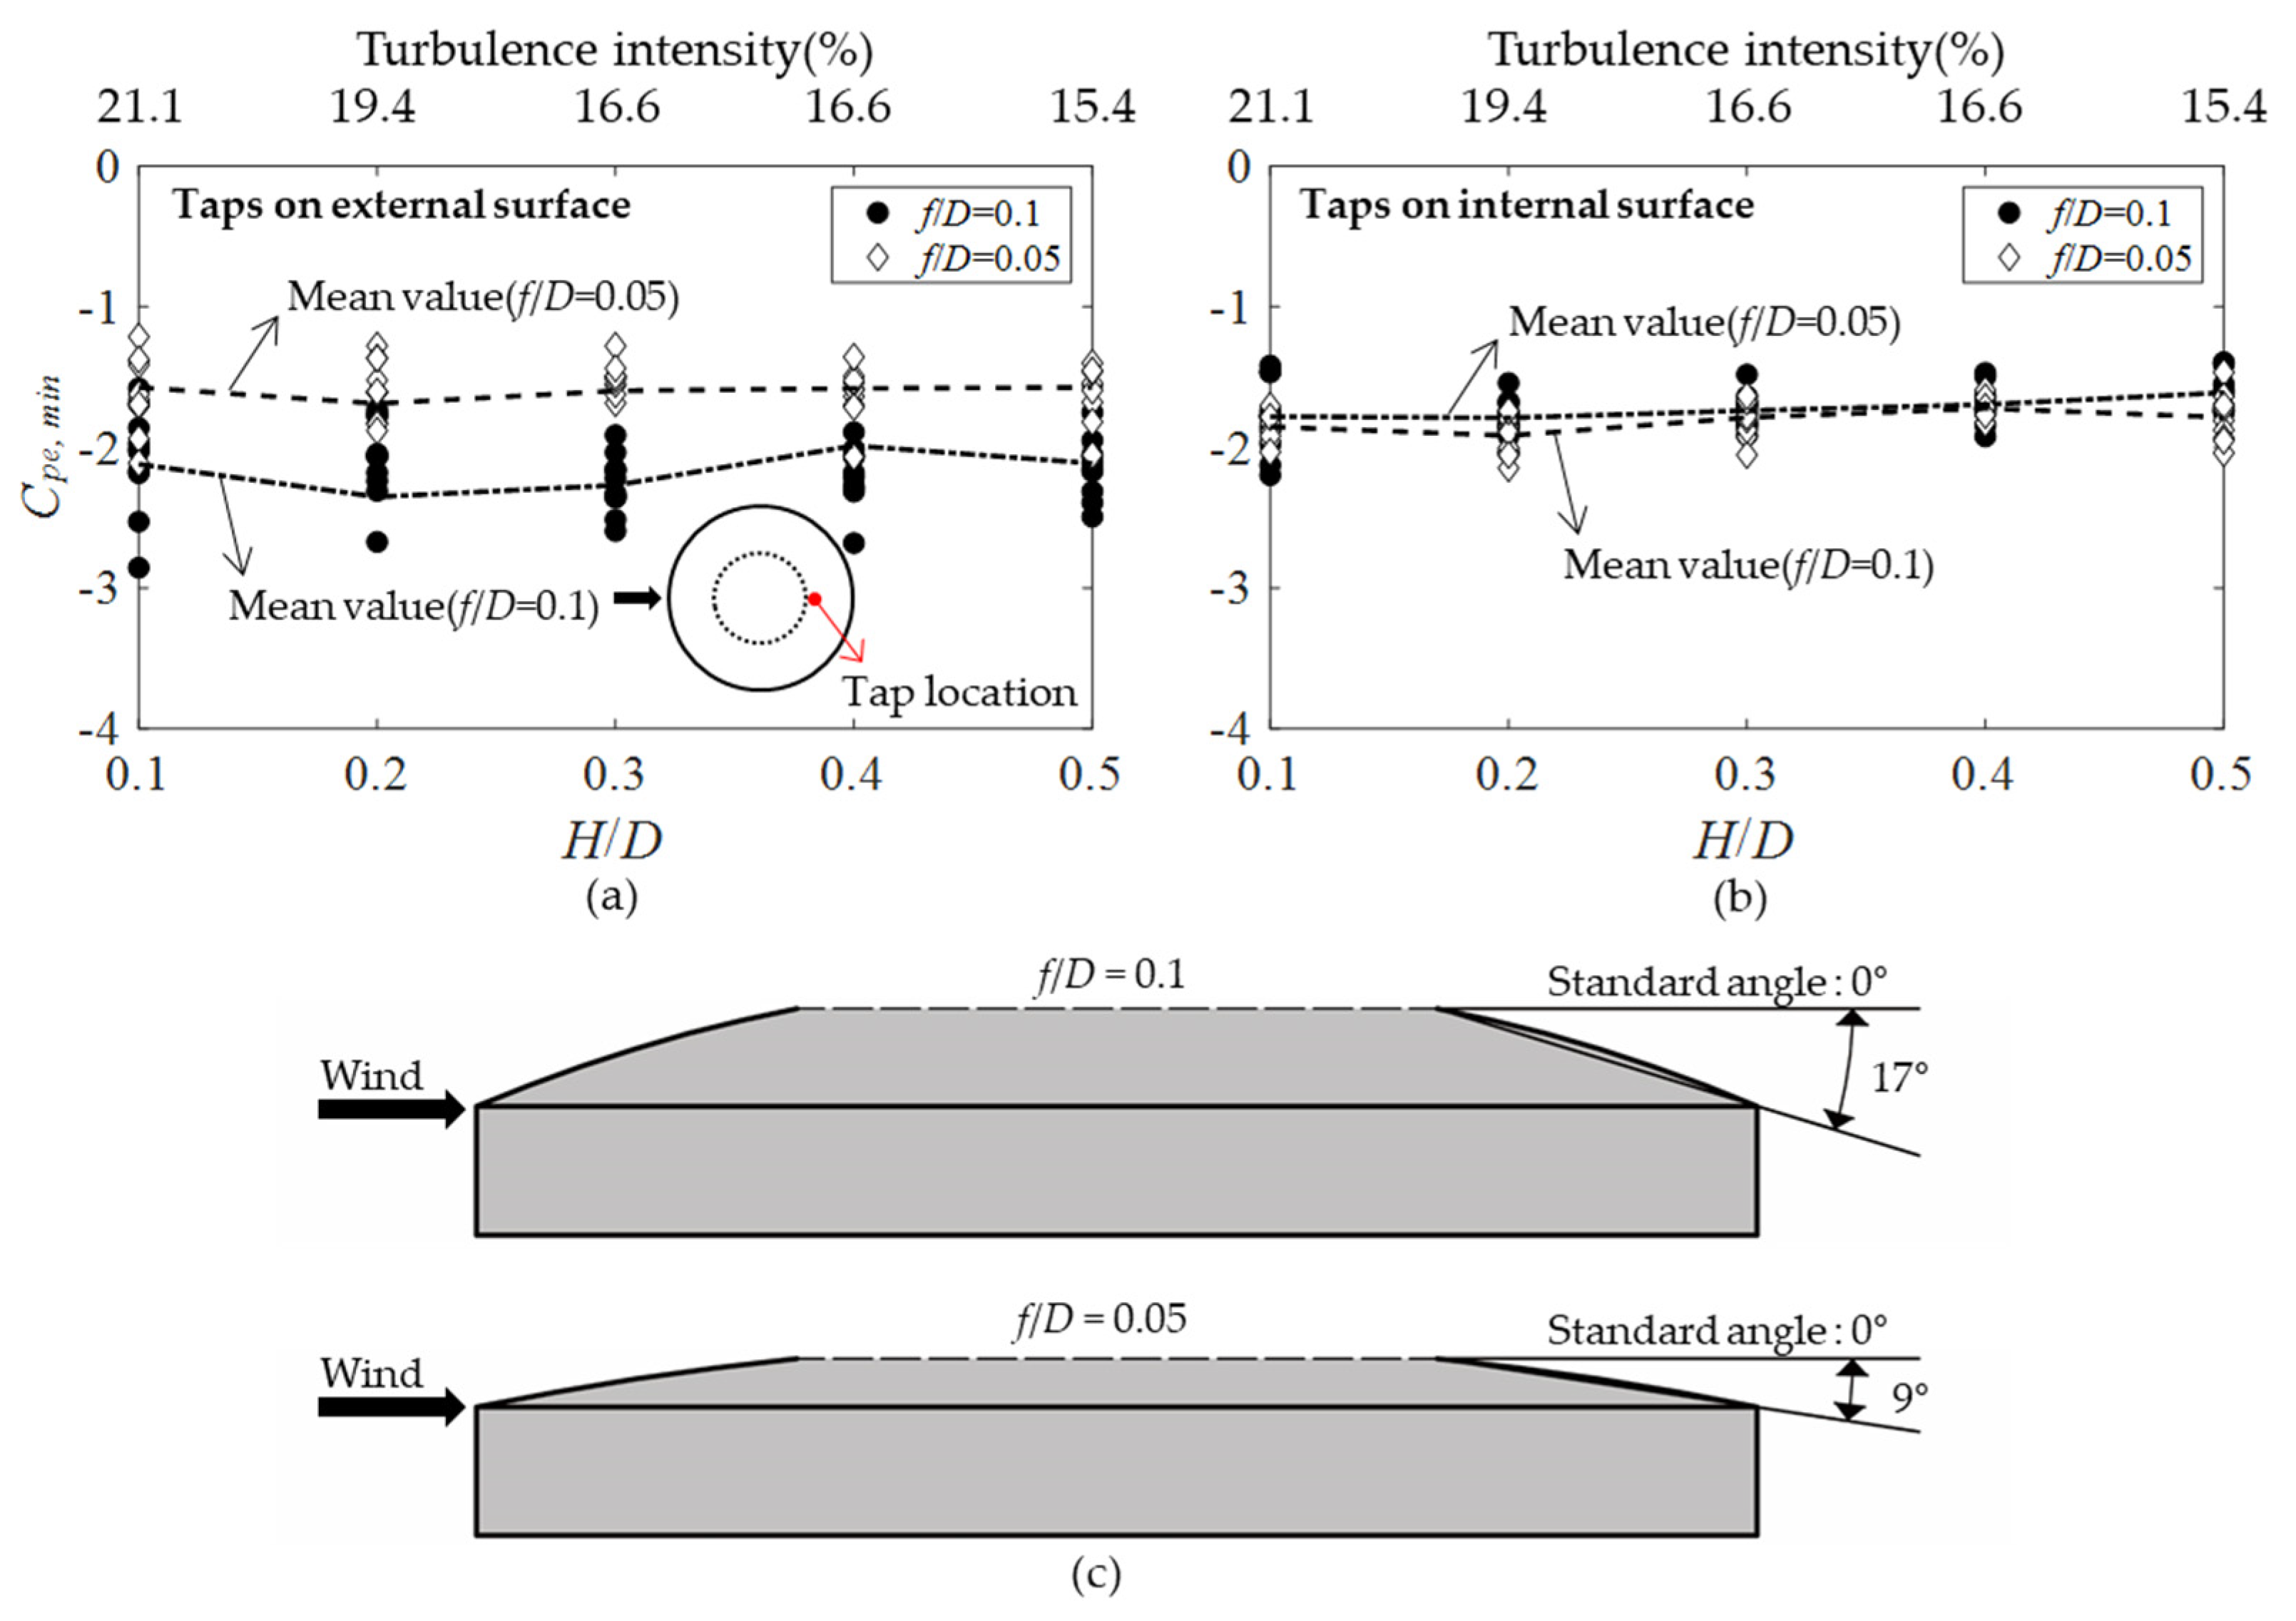
Buildings 12 00576 g015
Figure 16. Cpe,min and Cpi,min based on turbulence intensity: (a) Cpe,min on external surface of roof; (b) Cpi,min on internal surface of roof; (c) inclination angle of leeward-side roof.
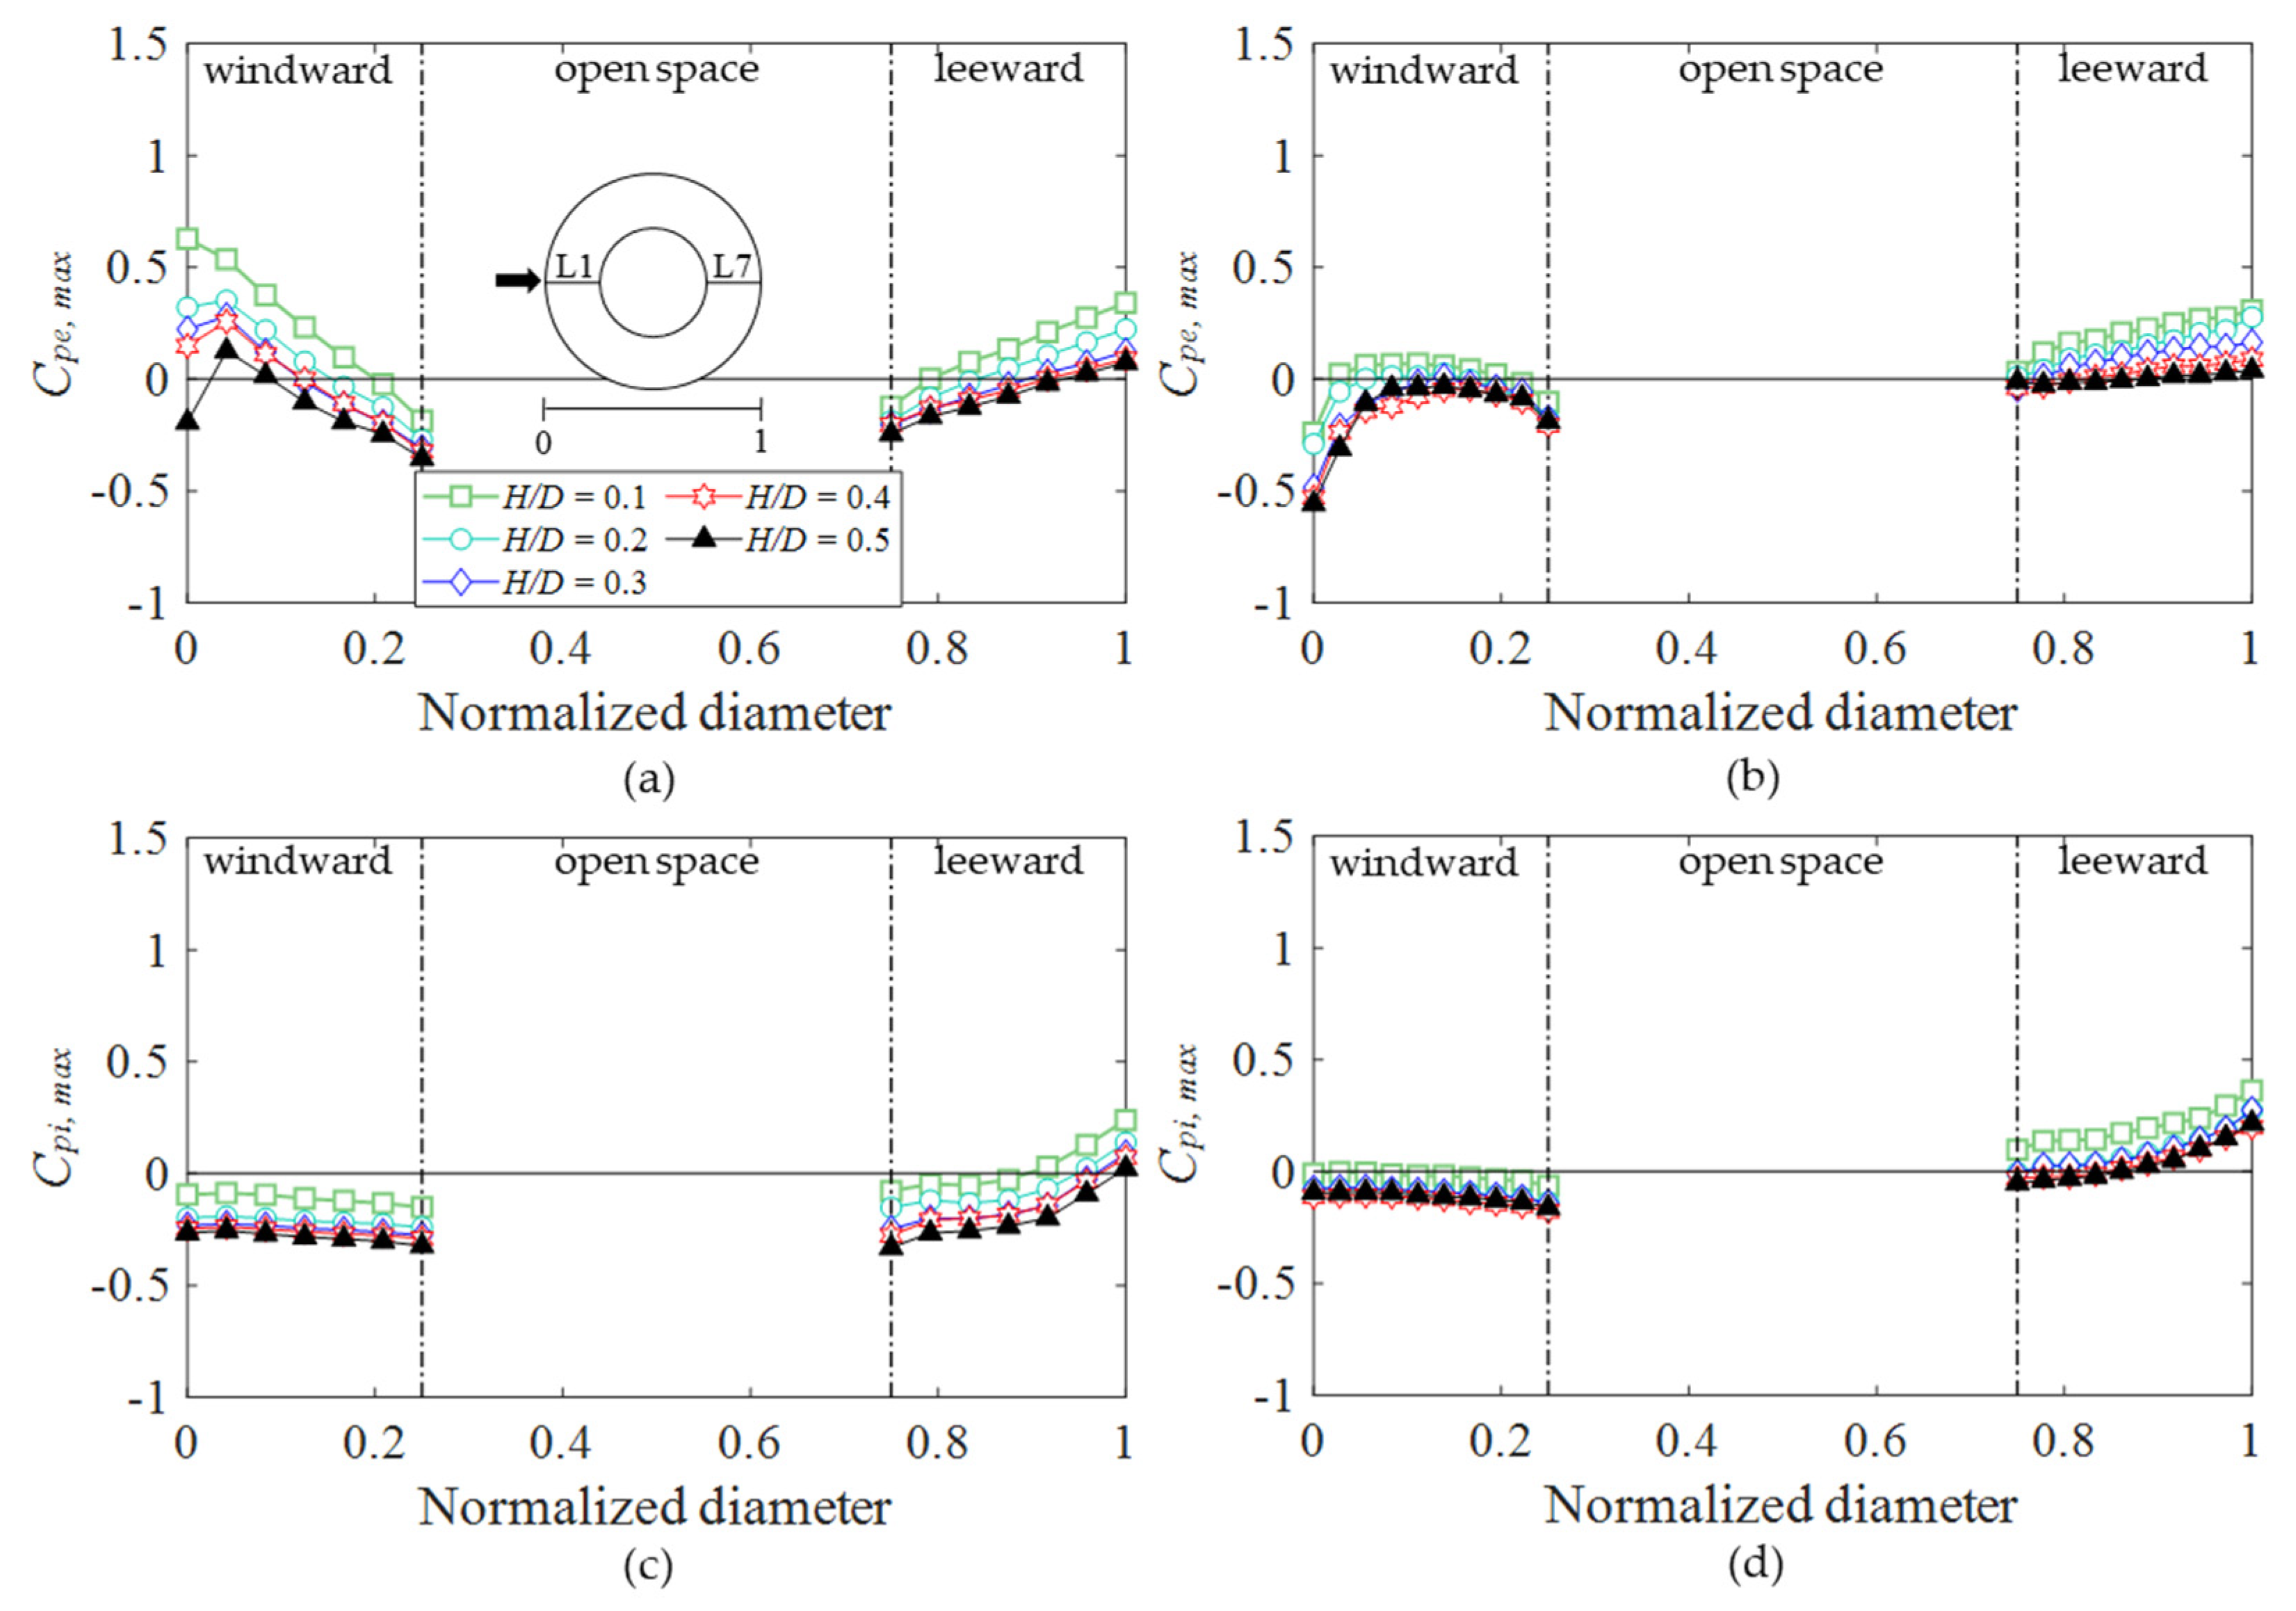
Buildings 12 00576 g016
Figure 17. External positive peak pressure coefficient based on f/D: (a) Cpe,max of f/D = 0.1; (b) Cpe,max of f/D = 0.05; (c) Cpi,max of f/D = 0.1; (d) Cpi,max of f/D = 0.05.
Buildings 12 00576 g017
Figure 18. Mean net pressure coefficient based on f/D: (a) Cpn,mean of f/D = 0.1; (b) Cpn,mean of f/D = 0.05.
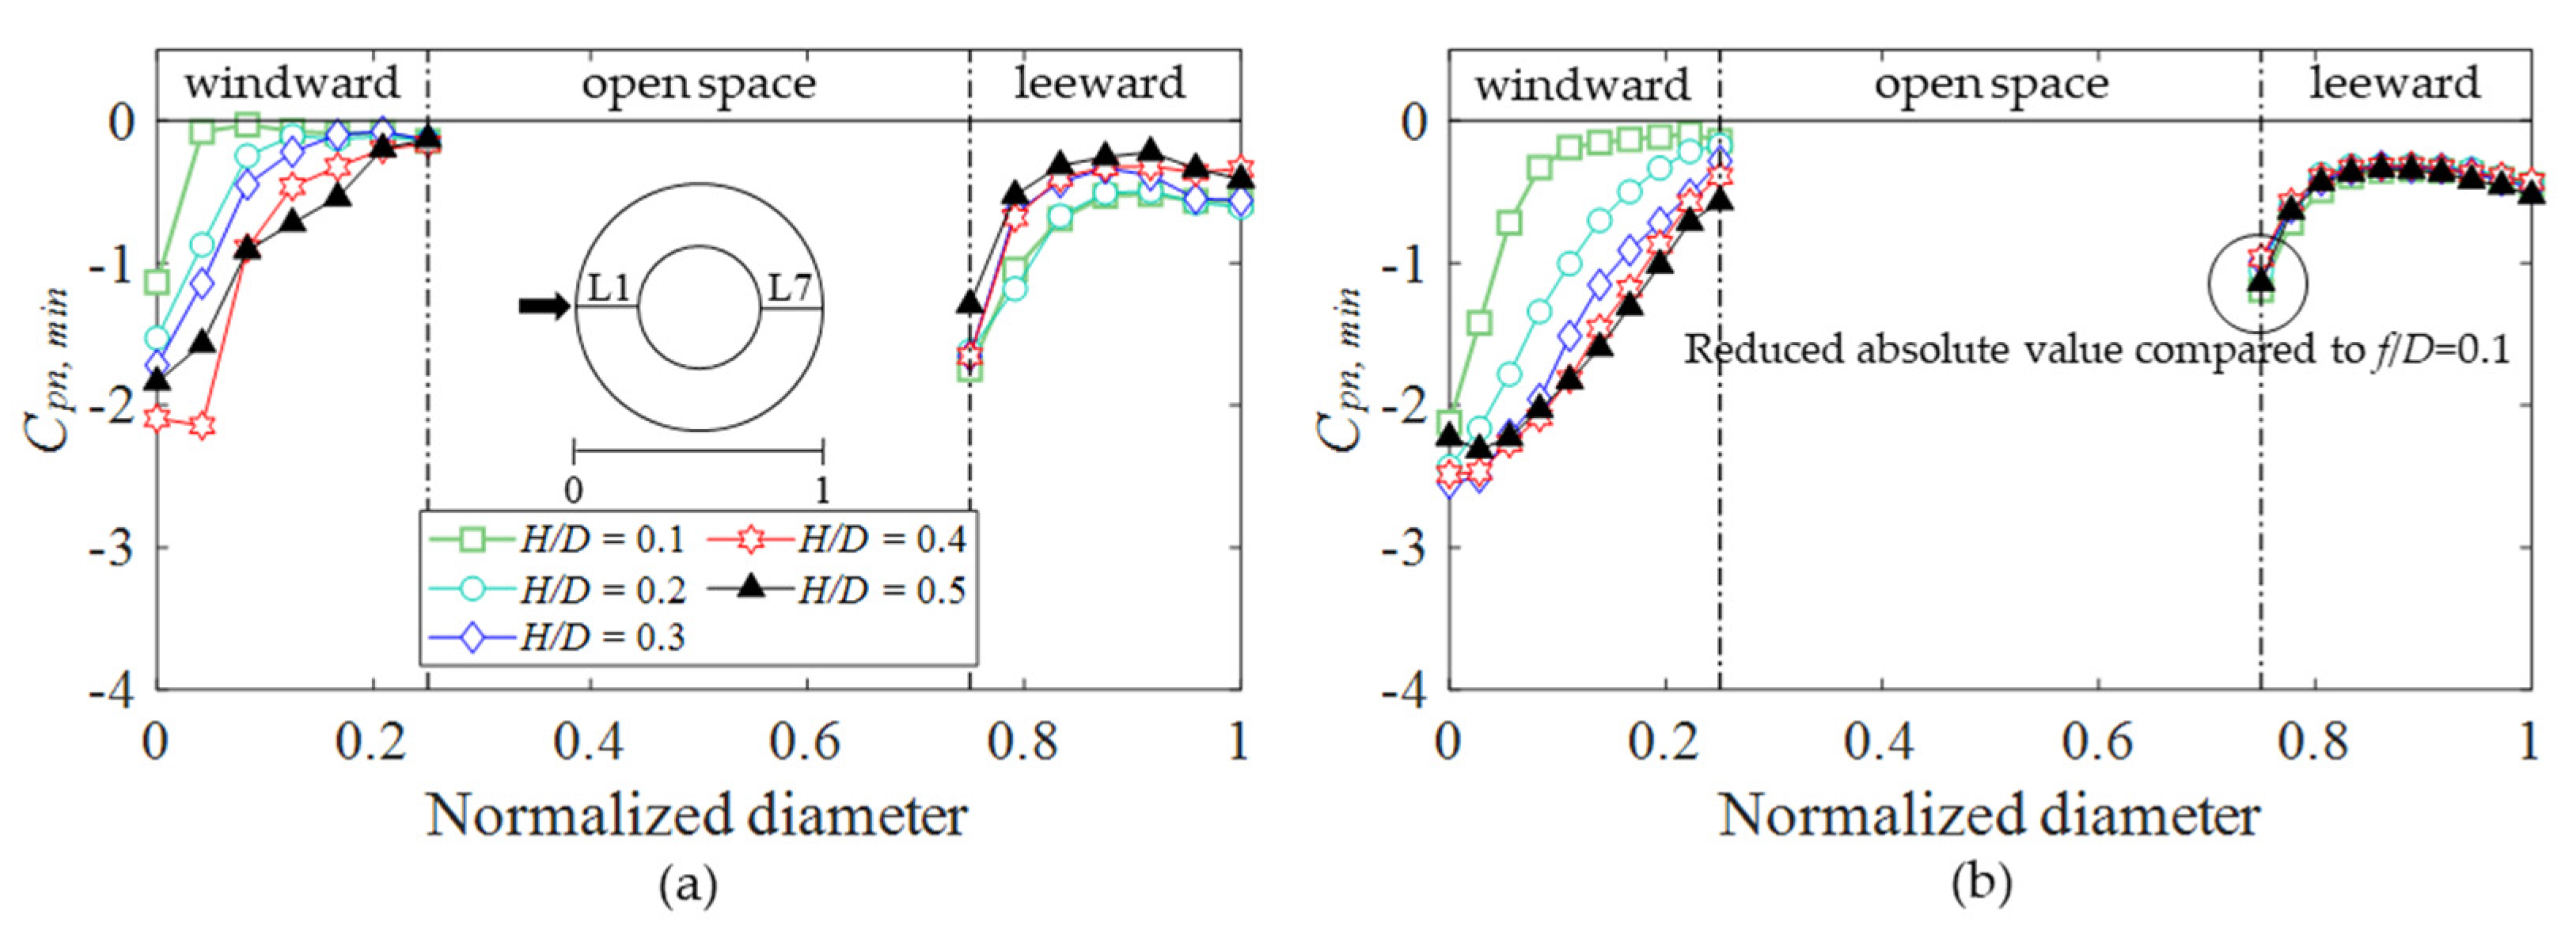
Buildings 12 00576 g018
Figure 19. Negative net pressure coefficient based on f/D: (a) Cpn,min of f/D = 0.1; (b) Cpn,min of f/D = 0.05.
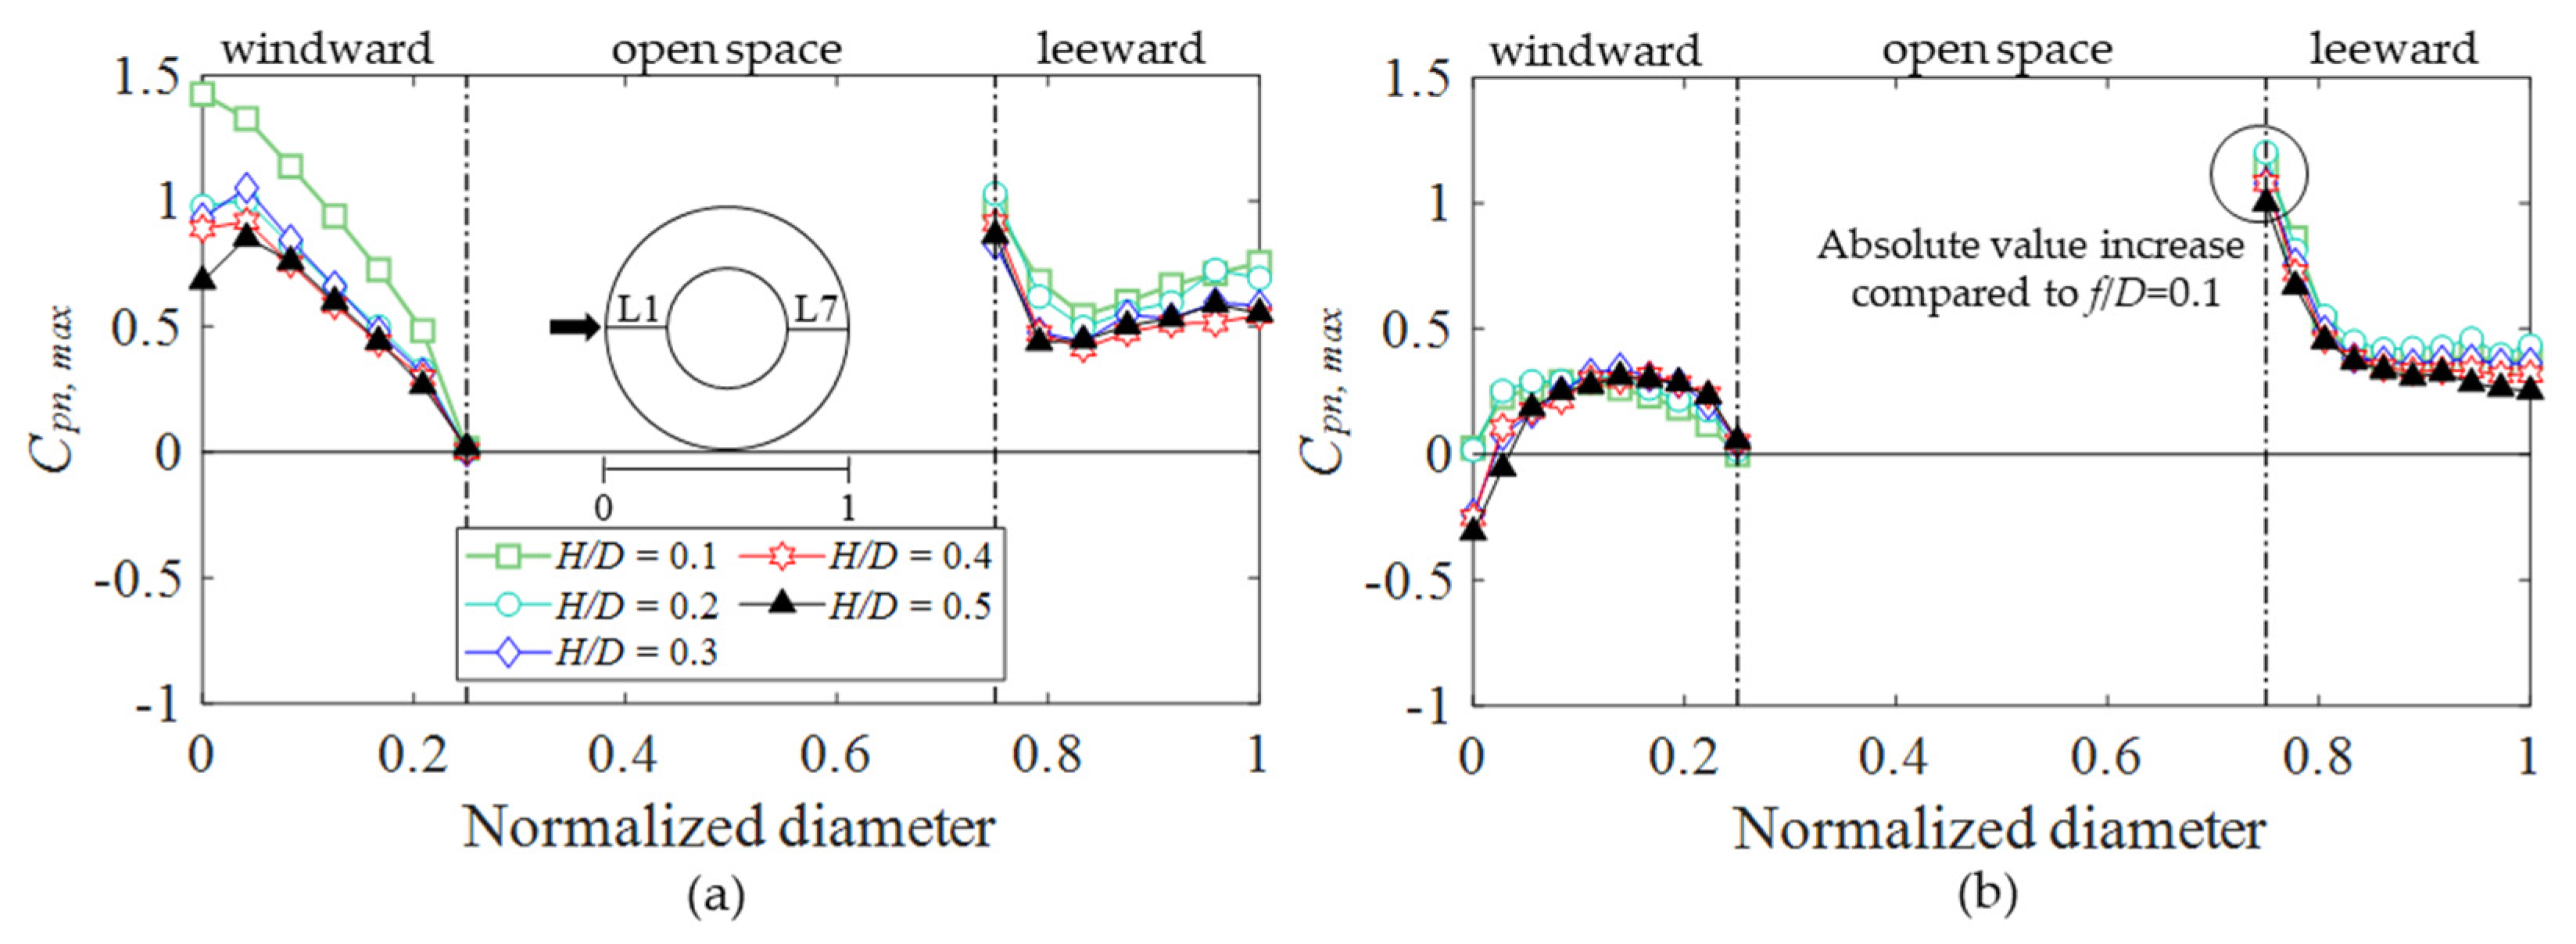
Buildings 12 00576 g019
Figure 20. Positive net pressure coefficient based on f/D: (a) Cpn,max of f/D = 0.1; (b) Cpn,max of f/D = 0.05.
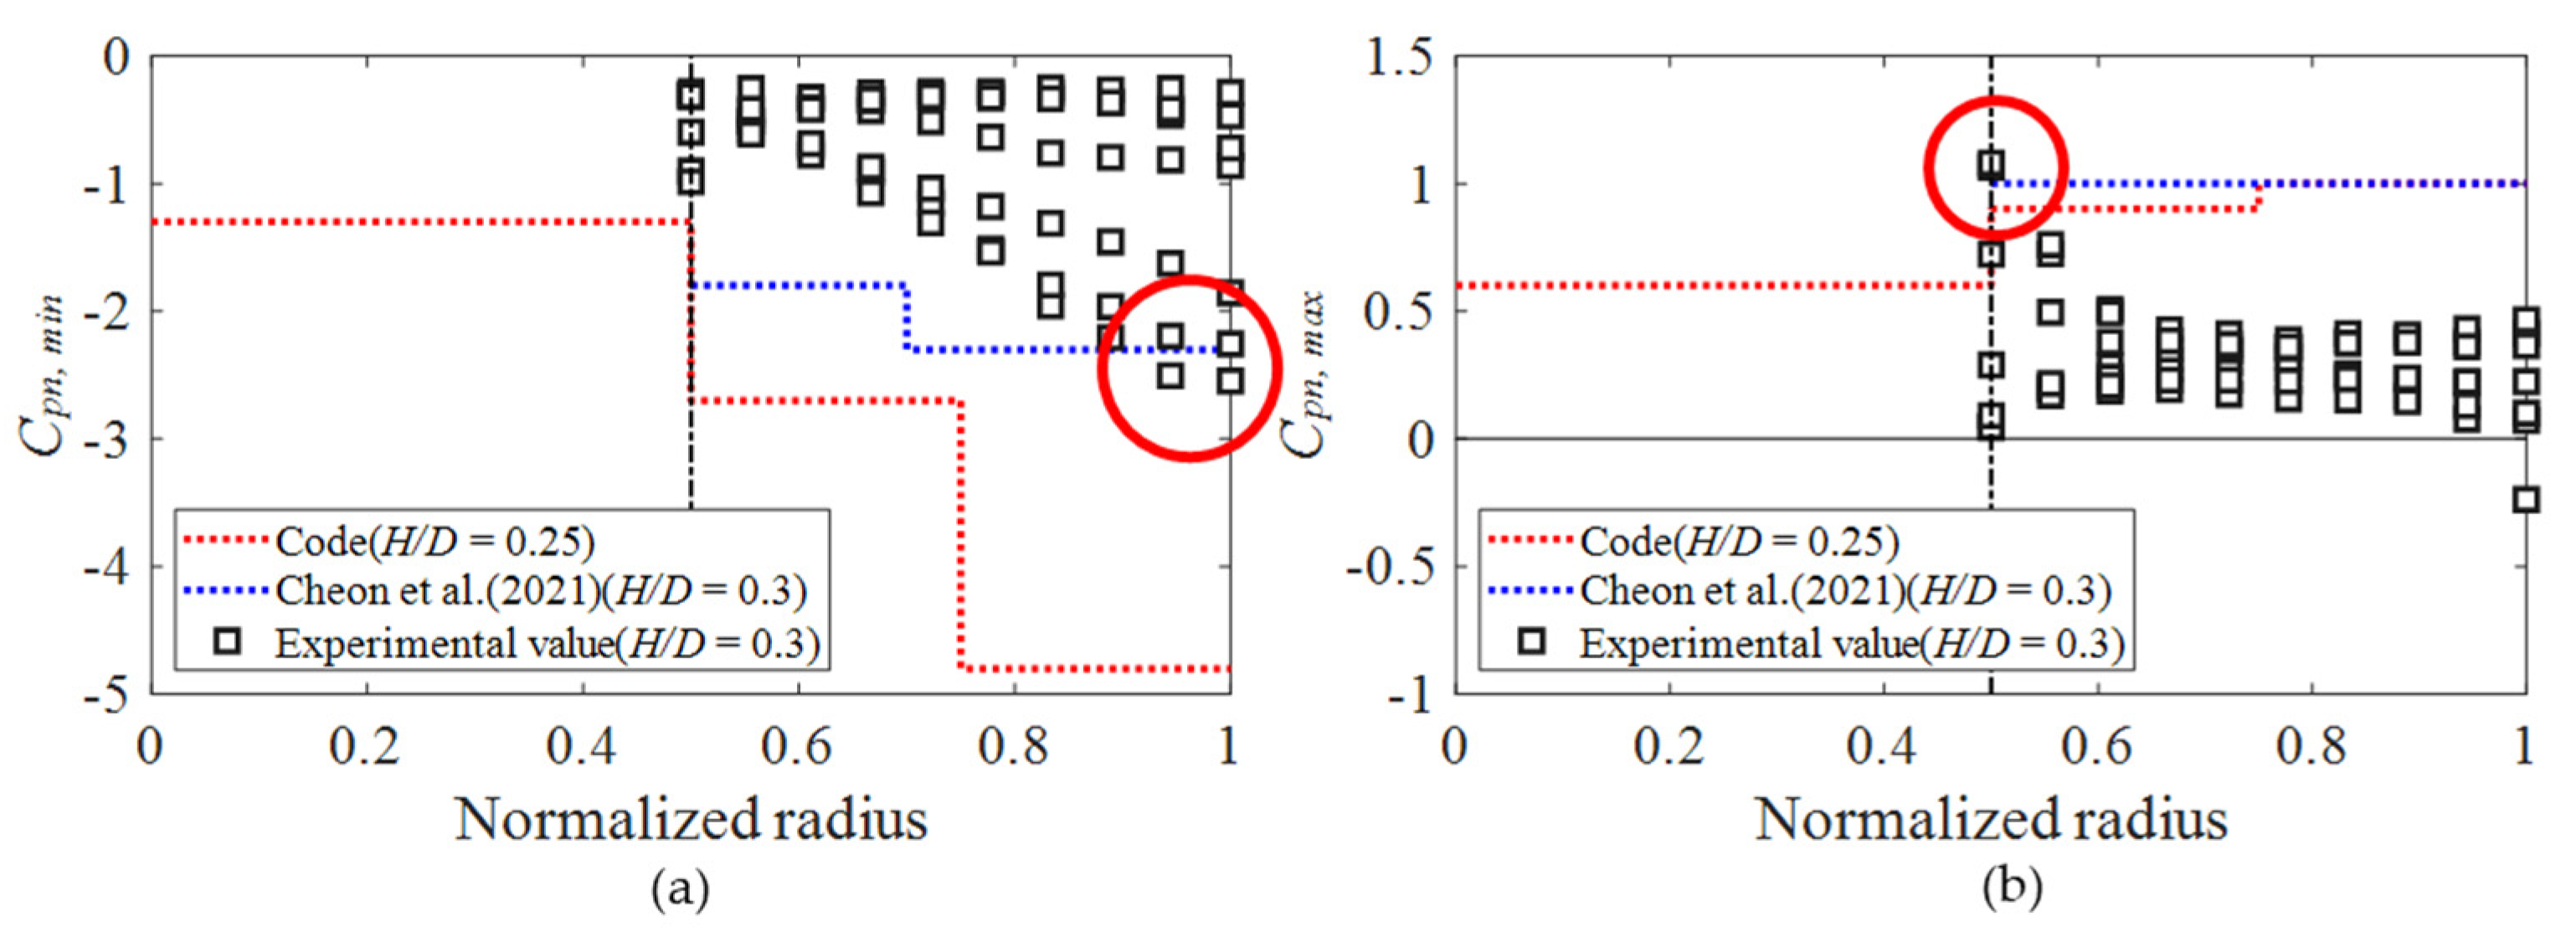
Buildings 12 00576 g020
Figure 21. Comparison with values from AIJ-RLB and values proposed in the previous study: (a) Cpn,min; (b) Cpn,max.
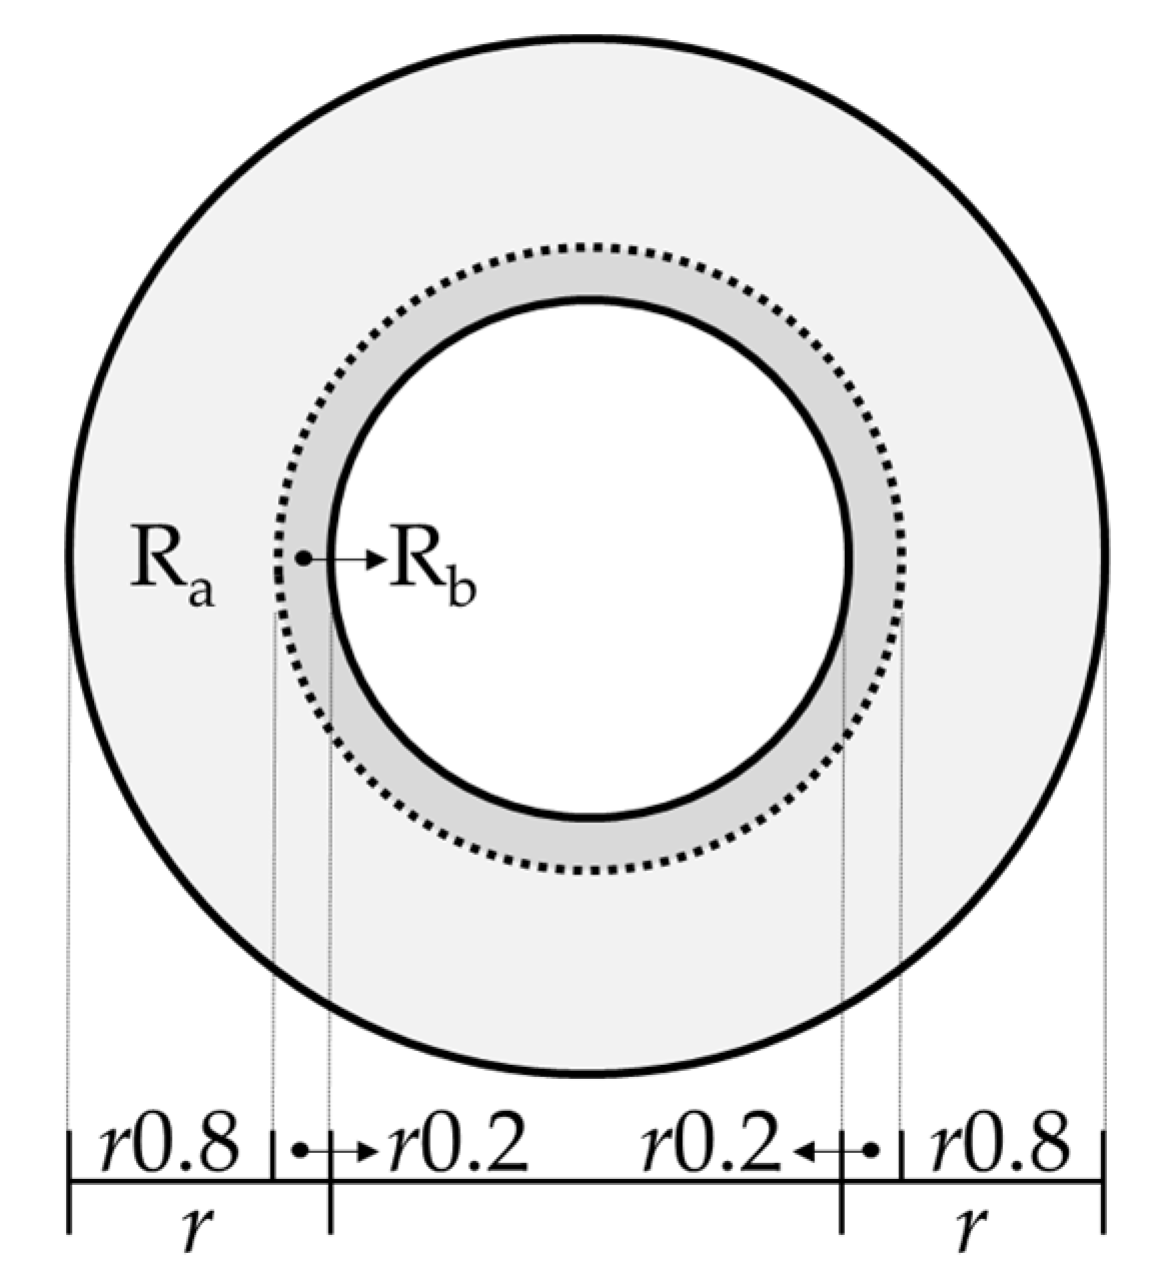
Buildings 12 00576 g021
Figure 22. Classification of regions.
Buildings 12 00576 g022
Figure 23. Proposed peak net pressure coefficients for f/D = 0.05: (a) Cpn,min; (b) Cpn,max.
Buildings 12 00576 g023
Table 1. f/D of constructed retractable dome roofs (adapted from Ref. [14]).
Building Namef/D
BC Place Stadium0.06
Oita Big Eye Stadium0.18
Nantong Stadium0.08
National Stadium0.09
Plaza De Toros Moralzarzal0.10
Cowboy Stadium0.14
Commerzbank Arena0.00
University of Phoenix Dome0.14
Table 2. Model dimensions.
f (in Full Scale, m)H (in Full Scale, m)D (in Full Scale, m)f/DH/D
0.02 (3)0.04 (6)0.4 (60)0.050.1
0.08 (12)0.2
0.12 (18)0.3
0.16 (24)0.4
0.2 (30)0.5
Table 3. Experimental conditions.
ConditionsValue
Length scale1/150
Velocity scale1/3
Time scale1/50
Wind direction0° to 180° (steps of 30°)
10 min sample number10
Sampling frequency1000 Hz
Moving average time1 s
Table 4. Negative peak pressure coefficients for cladding design prescribed in Architectural Institute of Japan—Recommendations for Loads on Buildings (AIJ-RLB) (2015) (adapted from Ref. [16]).
H/Df/D = 0.05
RaRbRc
0.25−4.8−2.7−1.3
Table 5. Positive peak pressure coefficients for cladding design prescribed in AIJ-RLB (2015) (adapted from Ref. [16]).
H/Df/D = 0.05
RaRbRc
0.251.30.40.1
Table 6. Proposed negative peak net pressure coefficients in a previous study (adapted from Ref. [13]).
H/Df/D = 0.1
RaRb
0.1−2.0−1.8
0.2−2.3
0.3−2.3
0.4−2.4
0.5−2.1
Table 7. Proposed positive peak net pressure coefficients in a previous study (adapted from Ref. [13]).
H/Df/D = 0.1
RaRb
0.11.41.1
0.21.2
0.31.0
0.41.0
0.51.0
Table 8. Proposed negative peak net pressure coefficients.
H/Df/D = 0.05
RaRb
0.1−2.2−1.2
0.2−2.5
0.3−2.5
0.4−2.5
0.5−2.3
Table 9. Proposed positive peak net pressure coefficients.
H/Df/D = 0.05
RaRb
0.10.71.2
0.2
0.3
0.4
0.5
Publisher’s Note: MDPI stays neutral with regard to jurisdictional claims in published maps and institutional affiliations.

