
Analyzing the Impact of Urban Planning and Building Typologies in Urban Heat Island Mitigation

 ,
,  , , ,
, , , 
Abstract
:1. Introduction
- The release of anthropogenic heat;
- The excess storage of solar radiation by the city structures;
- The lack of green spaces and cool sinks;
- The non-circulation of air in urban canyons;
- The reduced ability of the emitted infrared radiation to escape in the atmosphere.
2. Materials and Methods
- The neighborhoods represent real case areas.
- There is a good representation of open and compact typologies defined officially by the Australian Association of Planners.
- The building typologies and urban precincts are selected to fully represent the urban characteristics and neighborhoods.
- The precincts are modeled using ENVI-met for the mitigated and unmitigated scenarios.
- The ambient temperature, surface temperature, outdoor comfort indices, and wind flow regimes for both mitigated and unmitigated scenarios are extracted and compared.
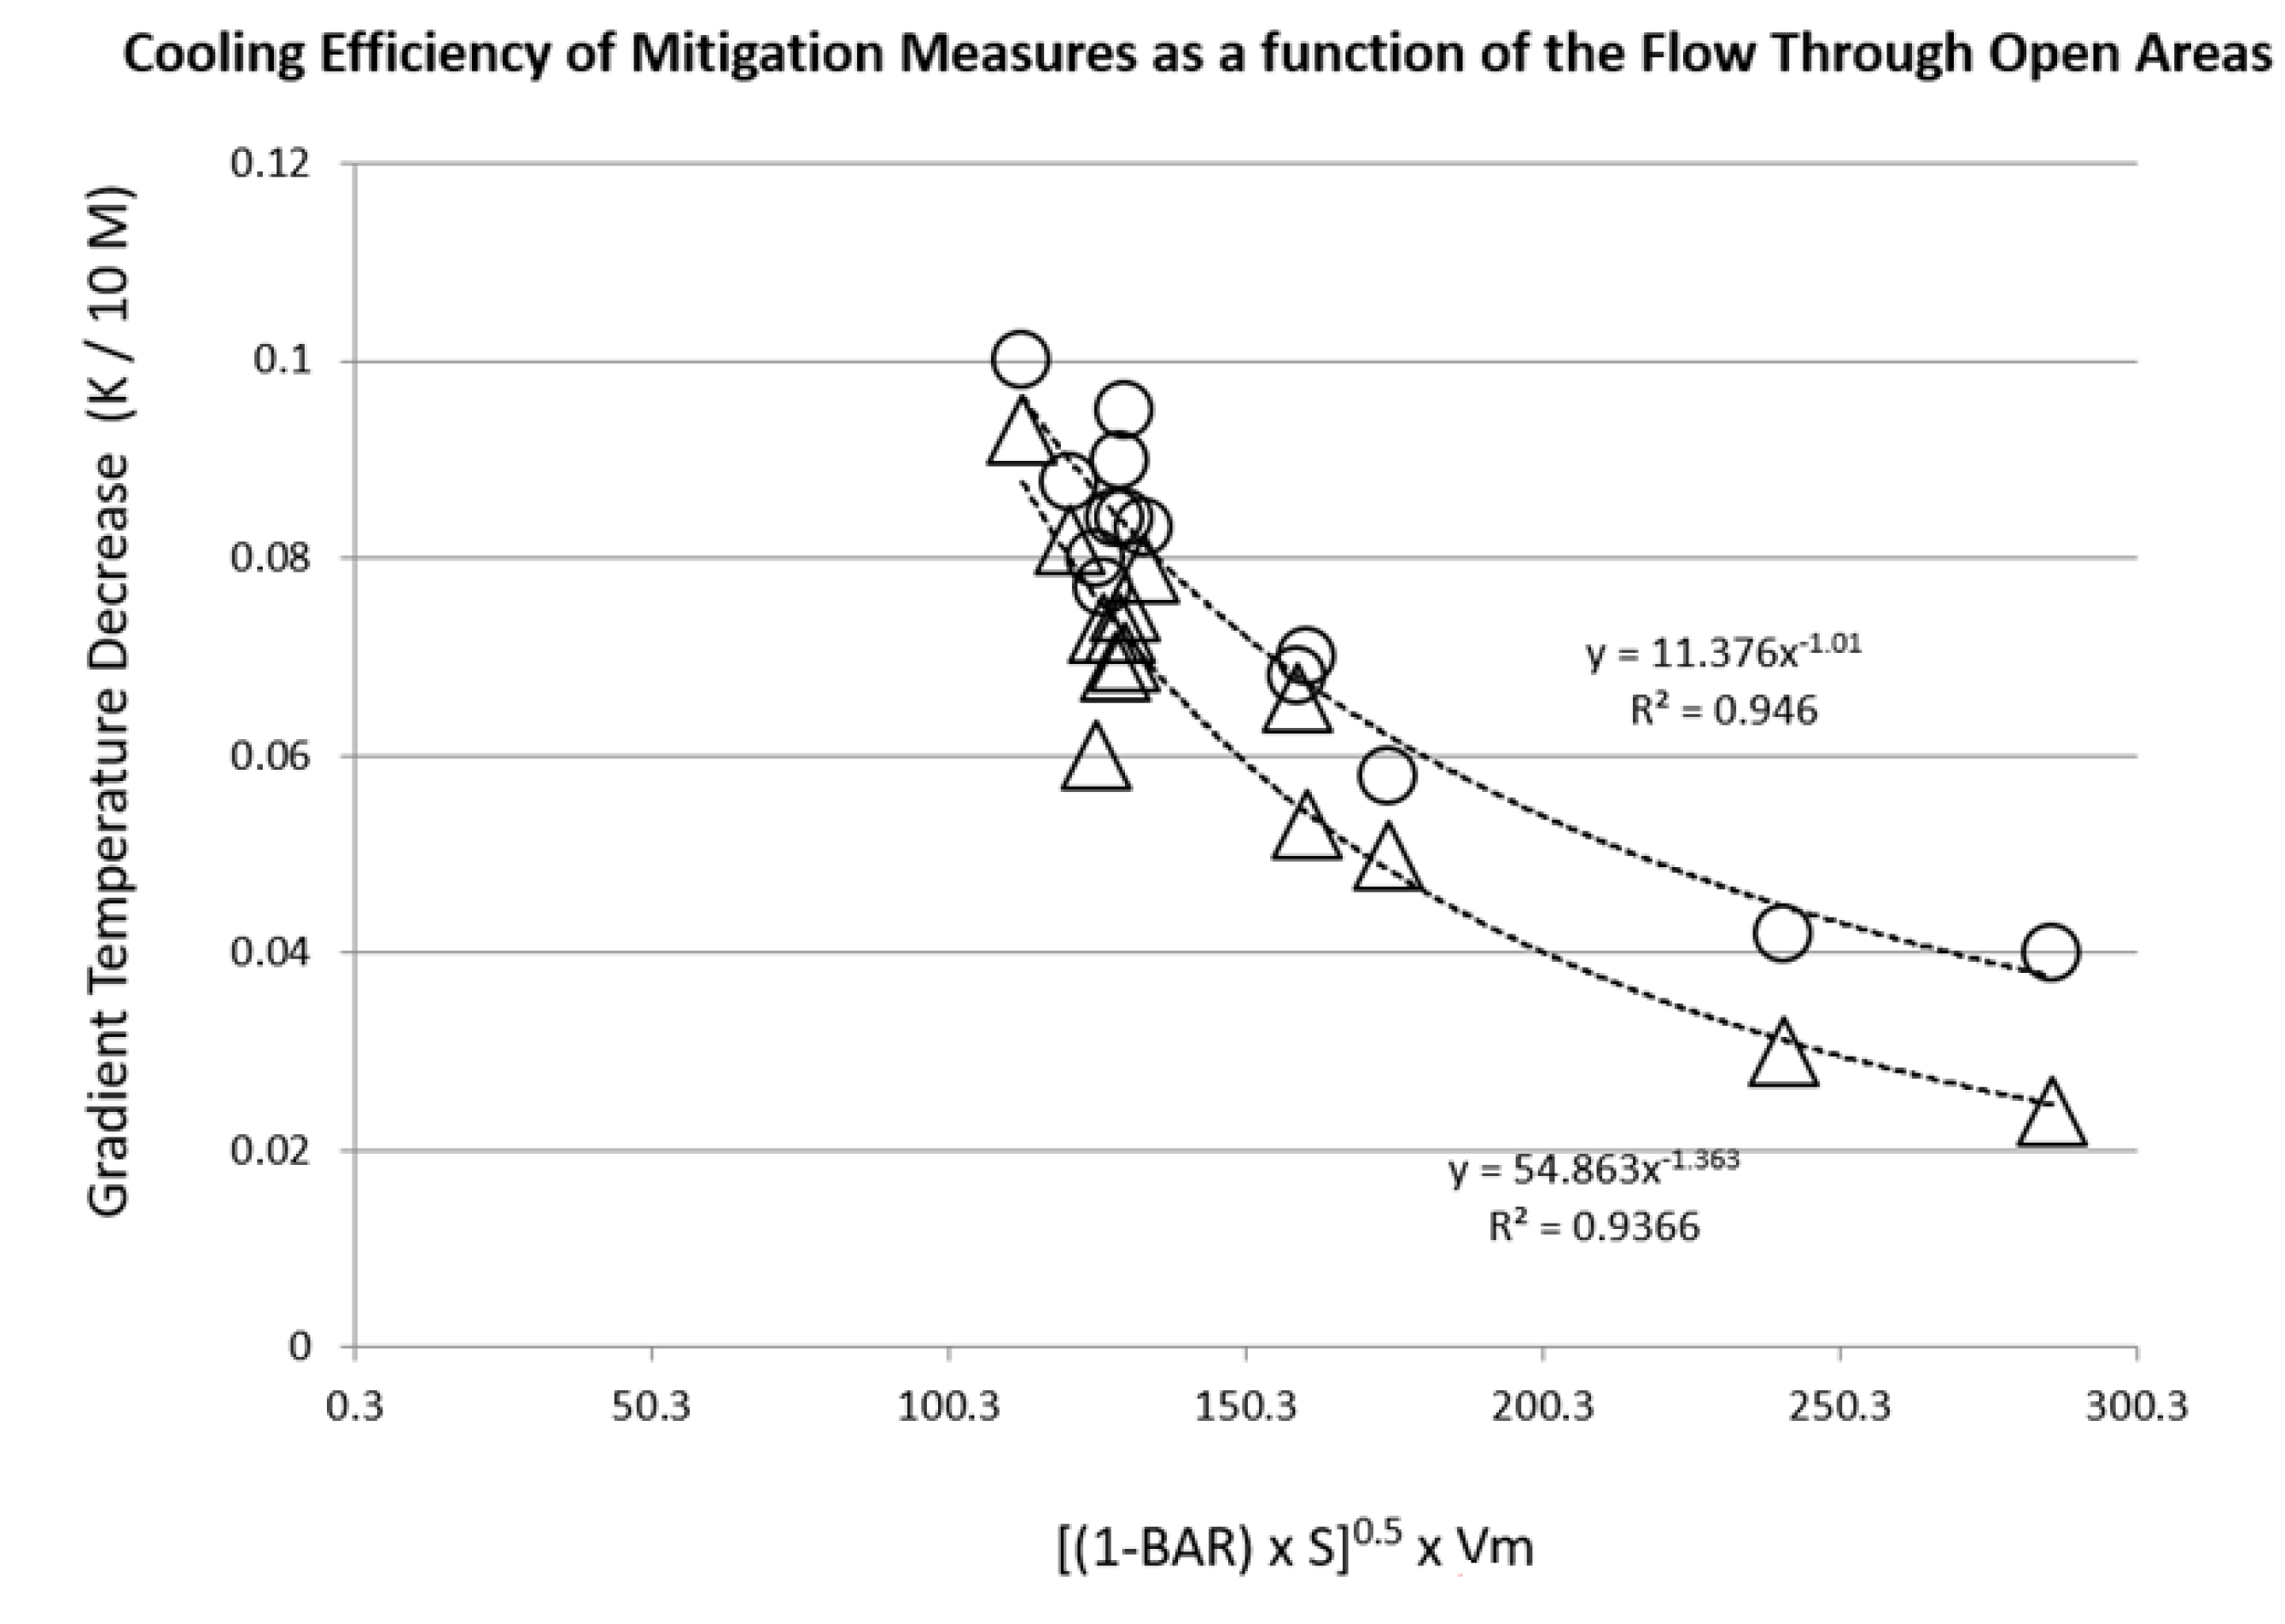
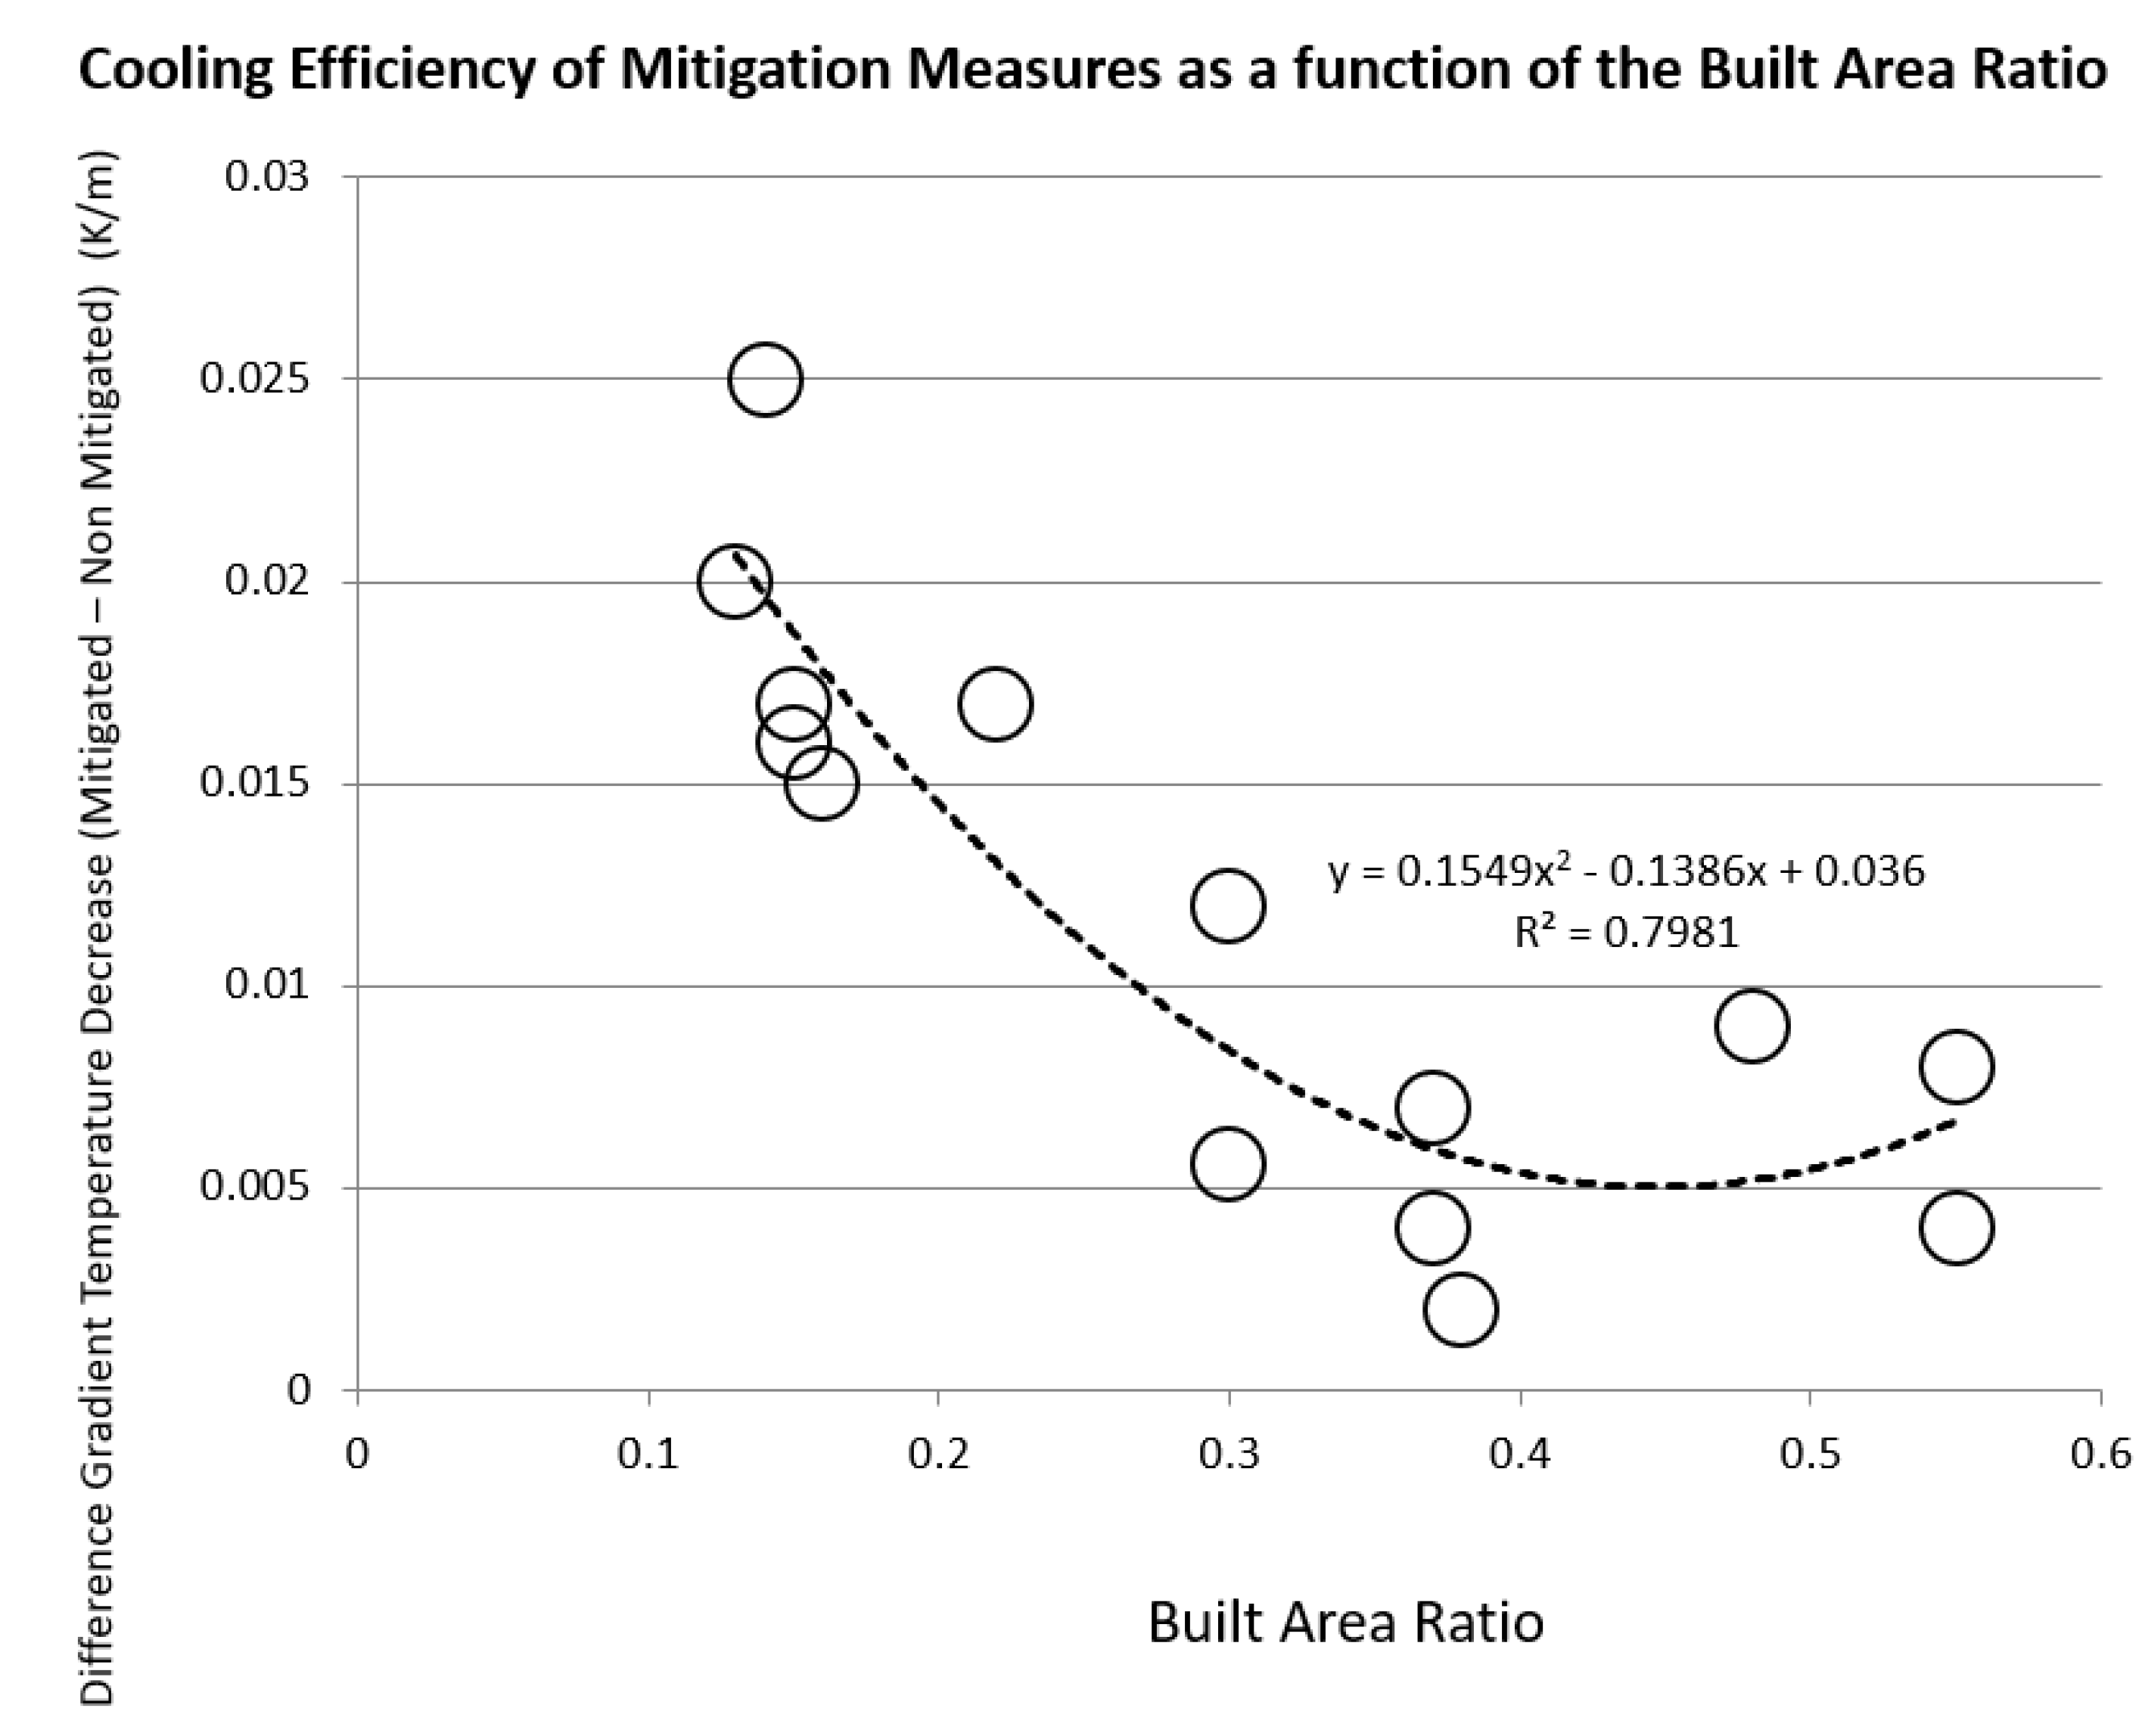
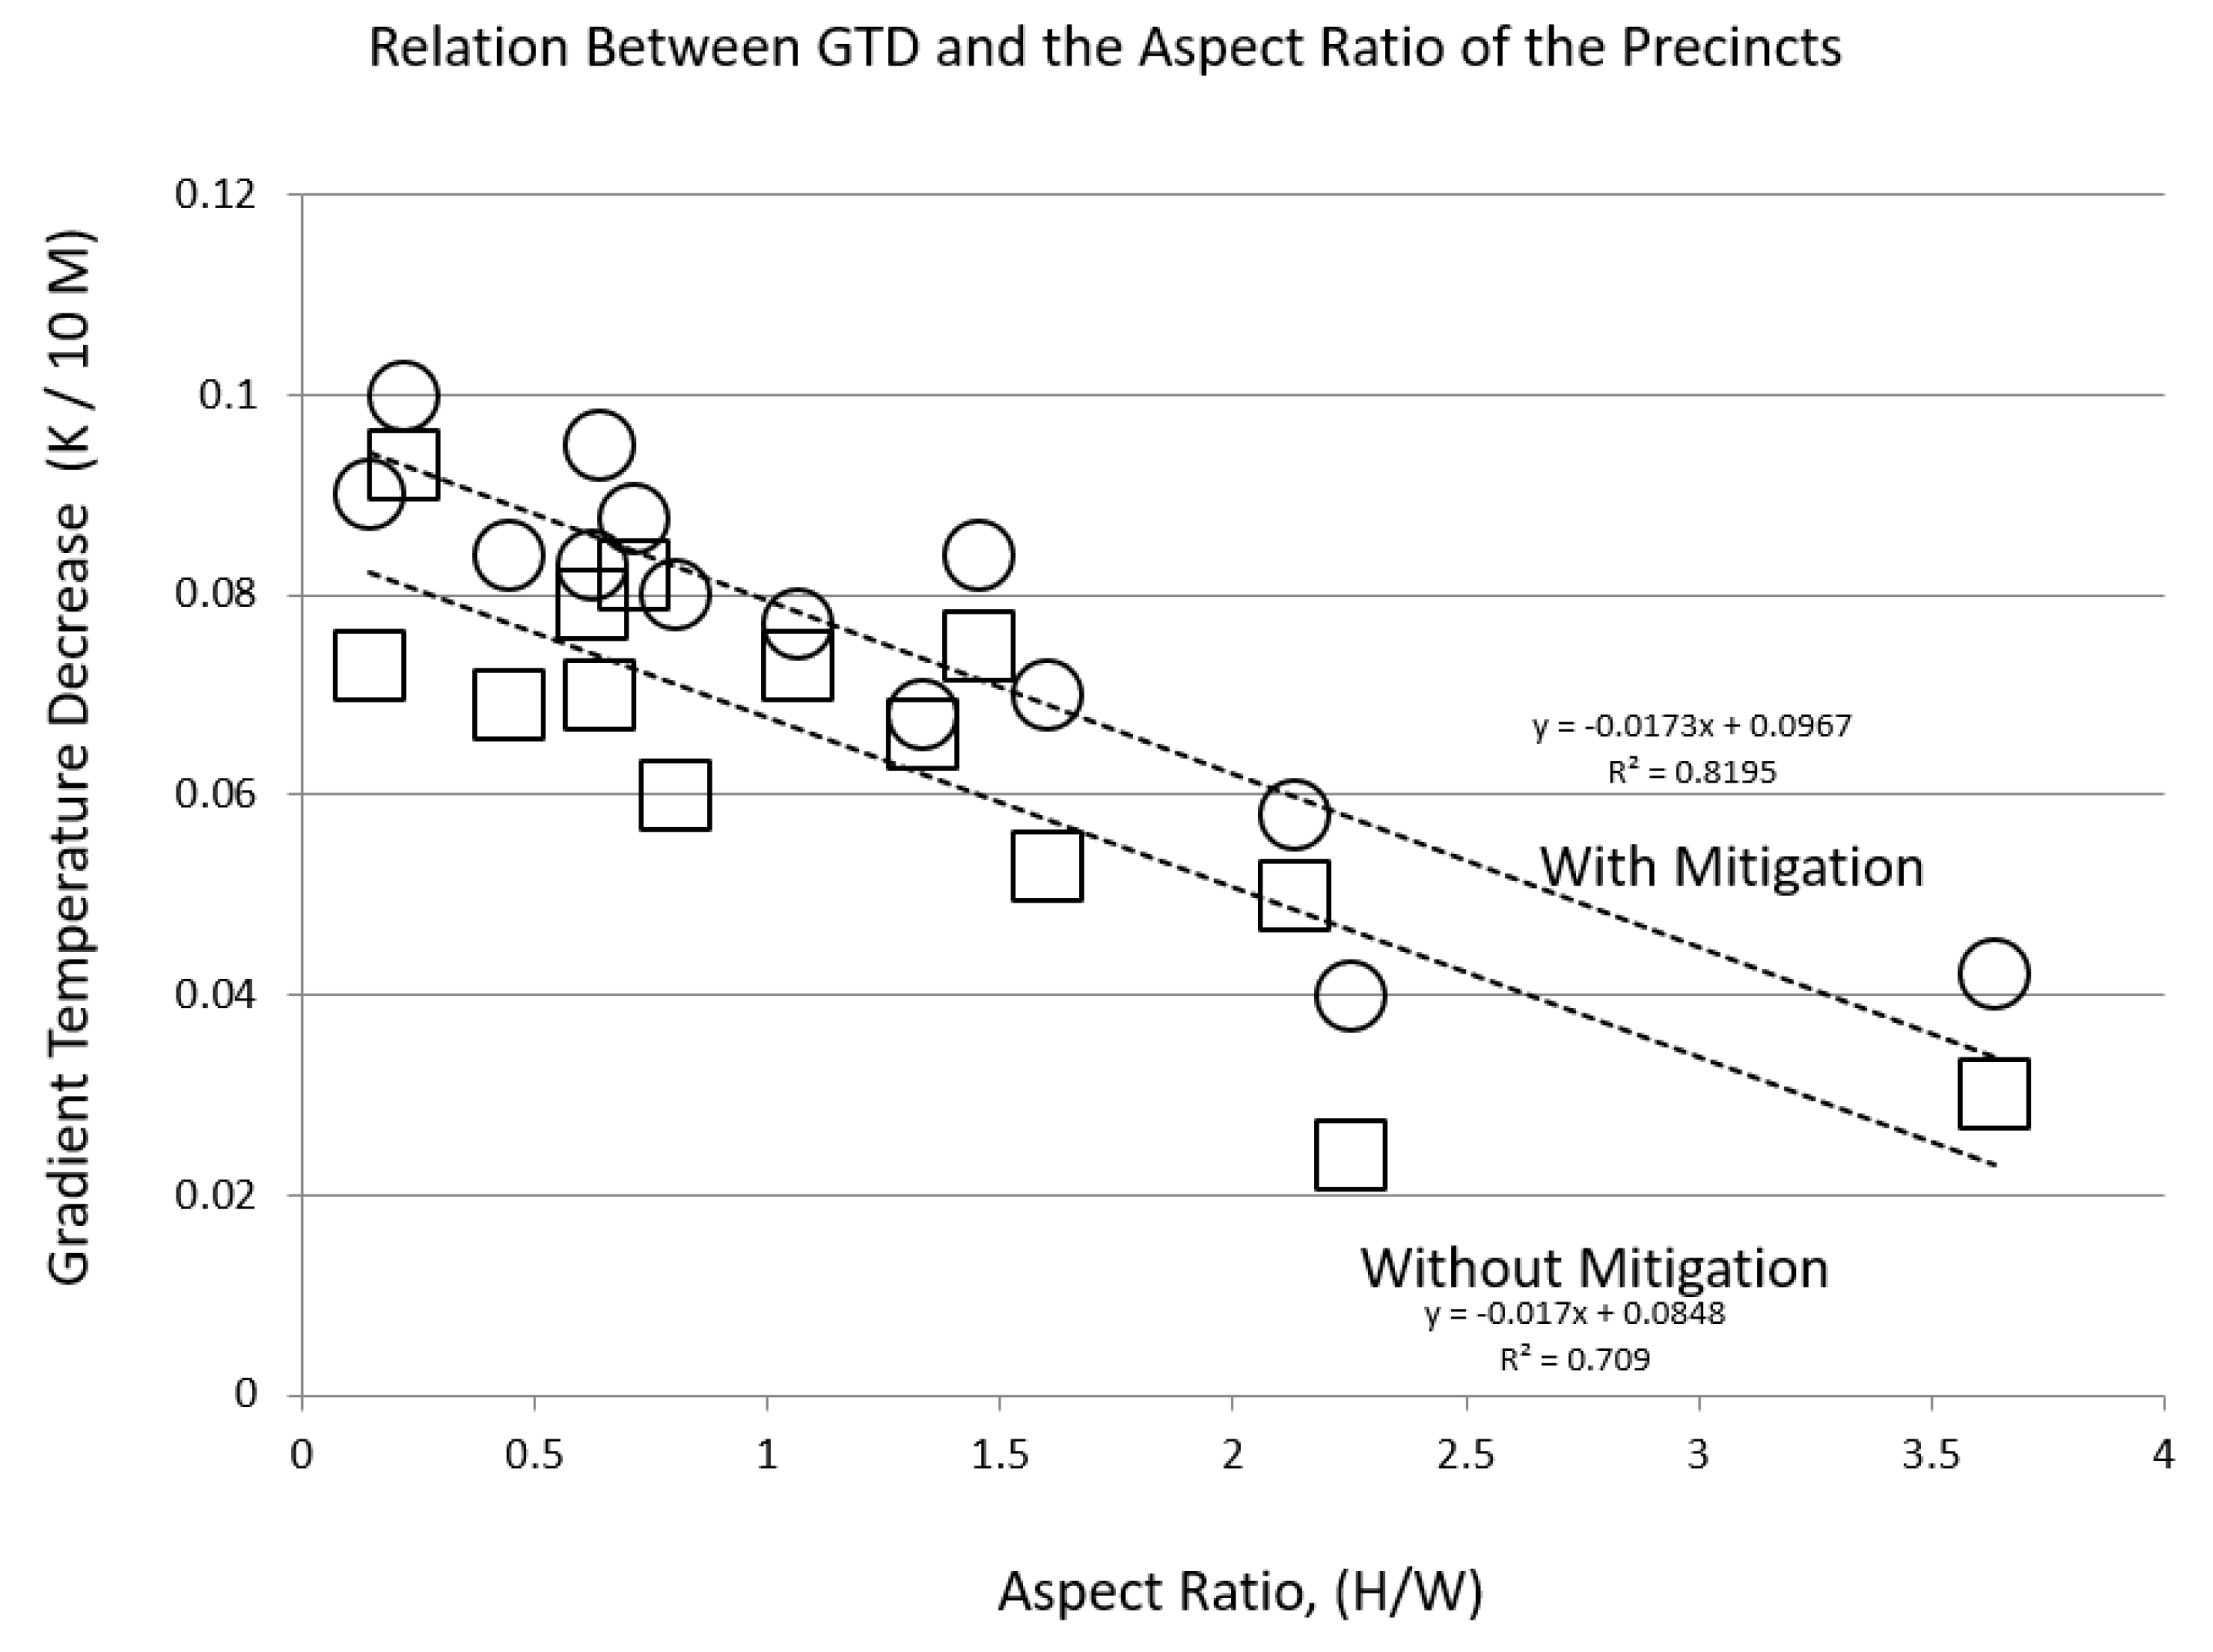
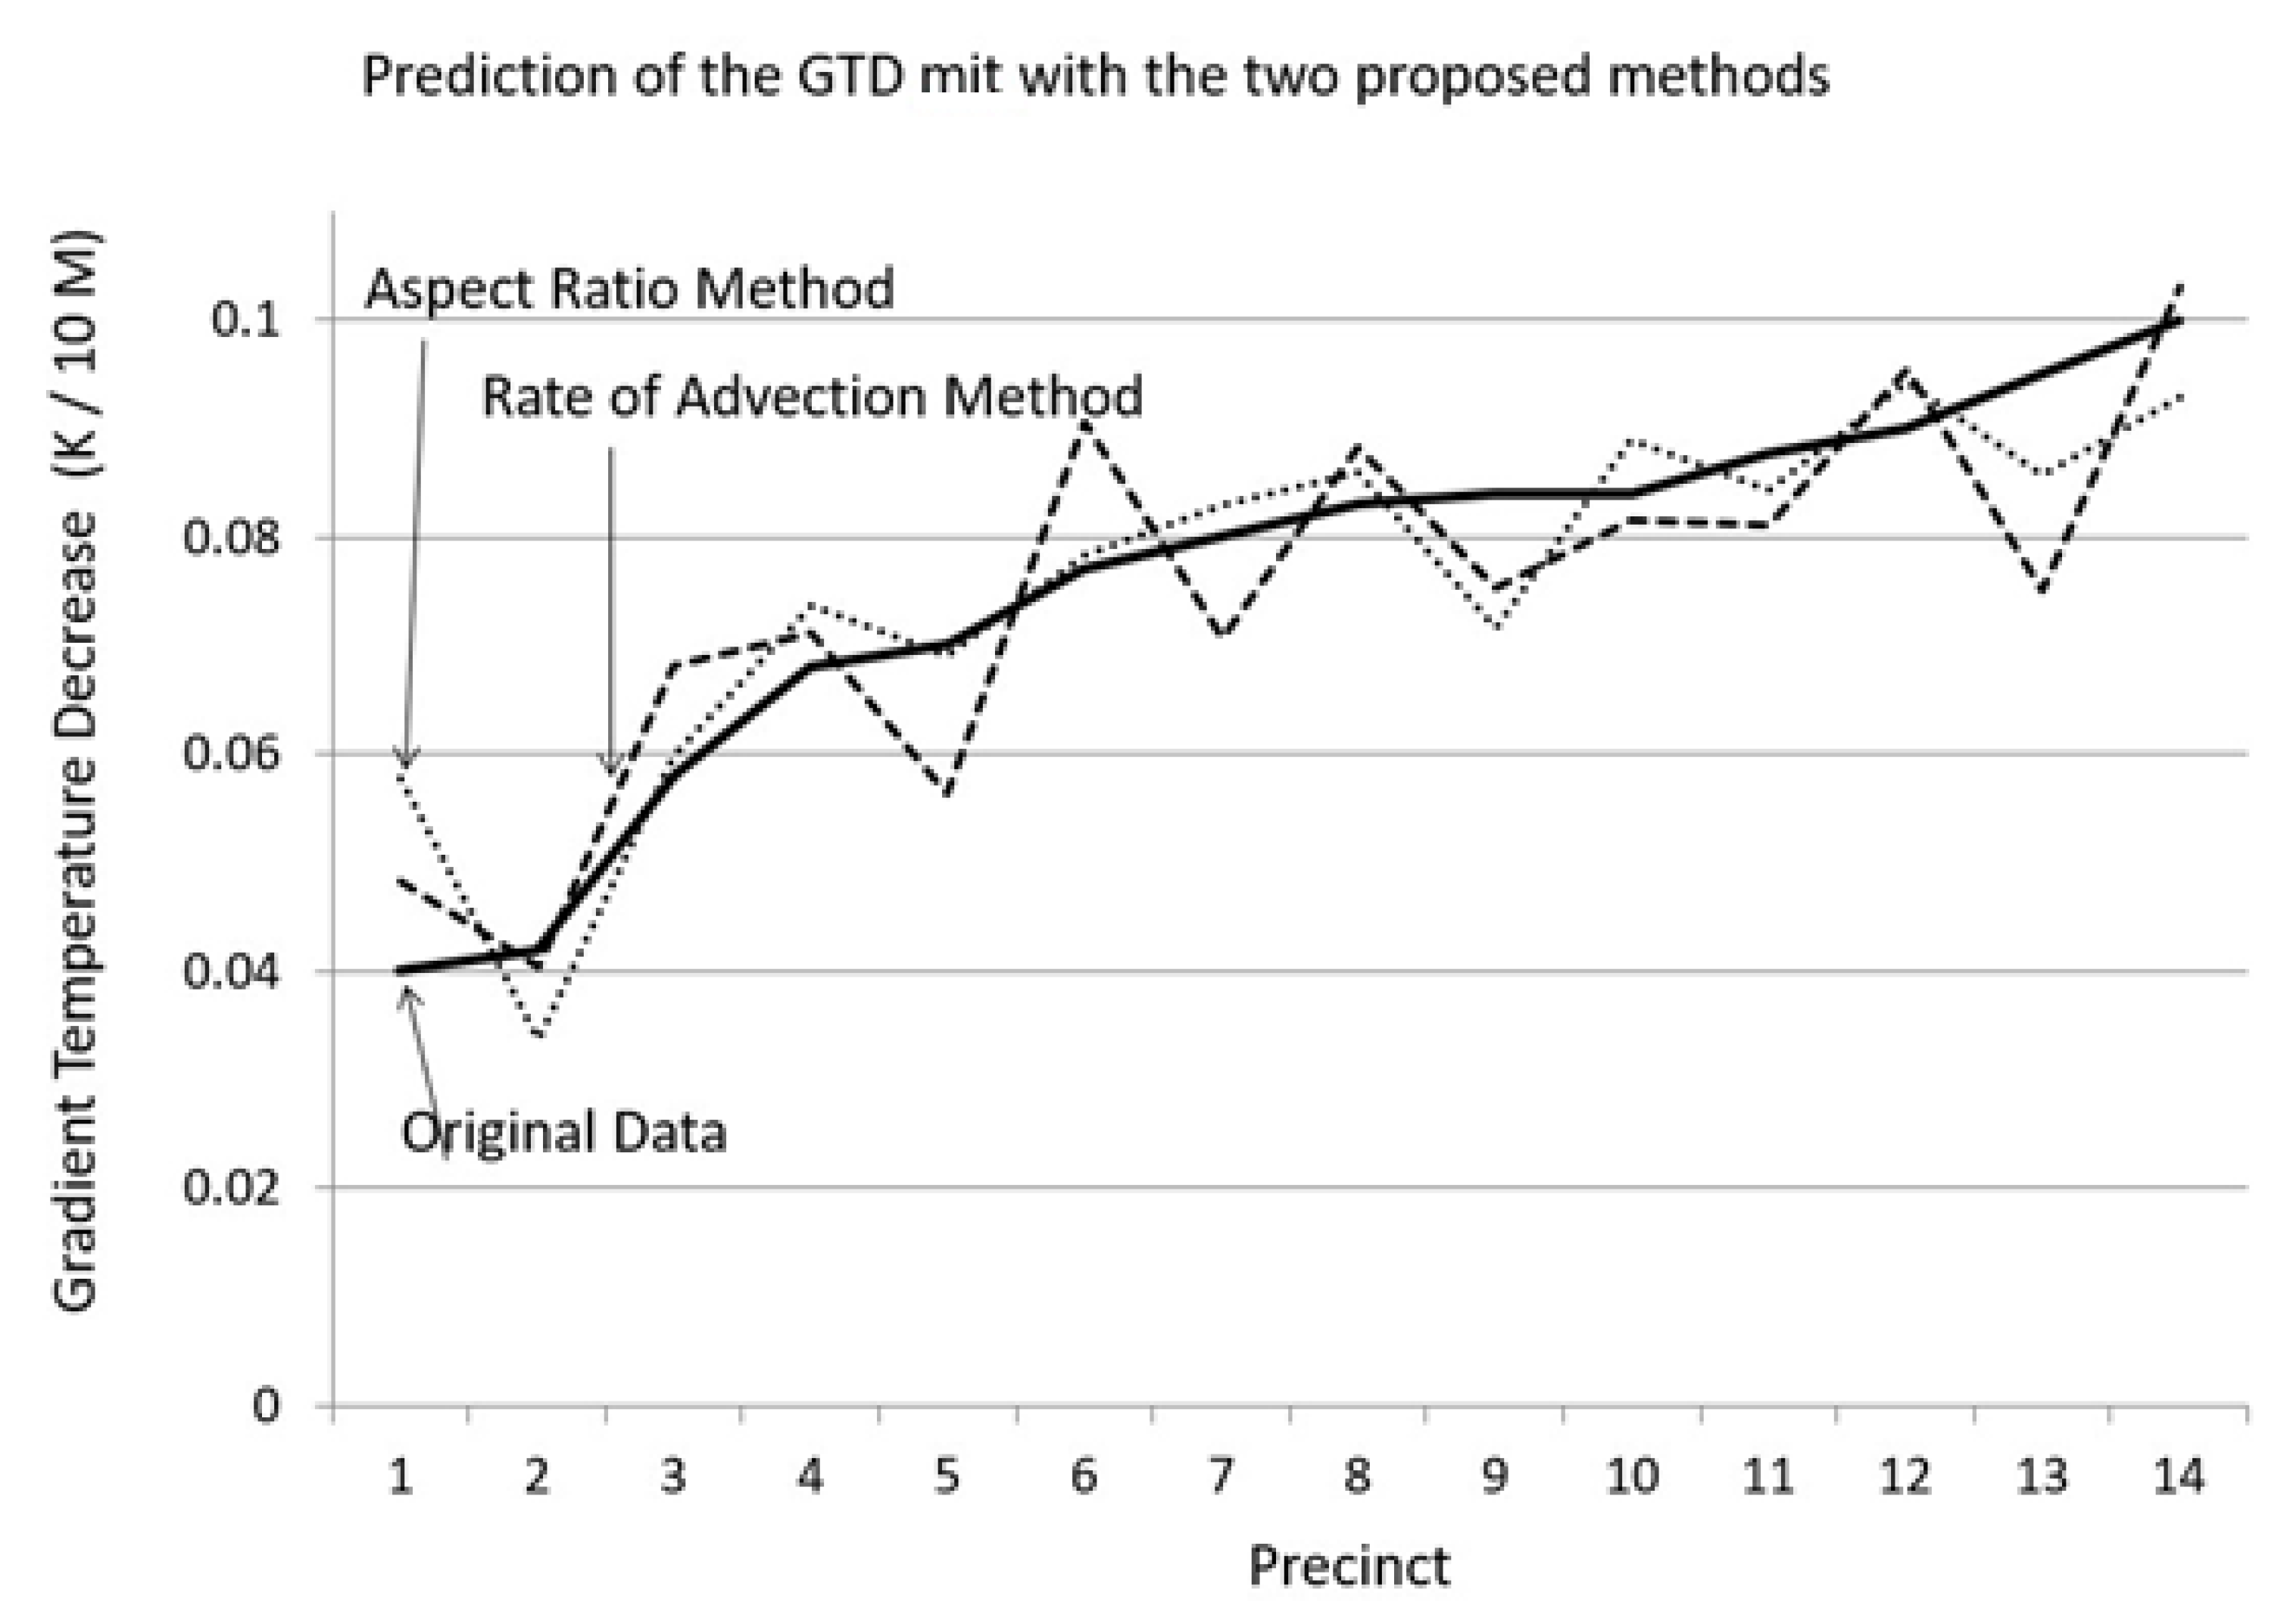
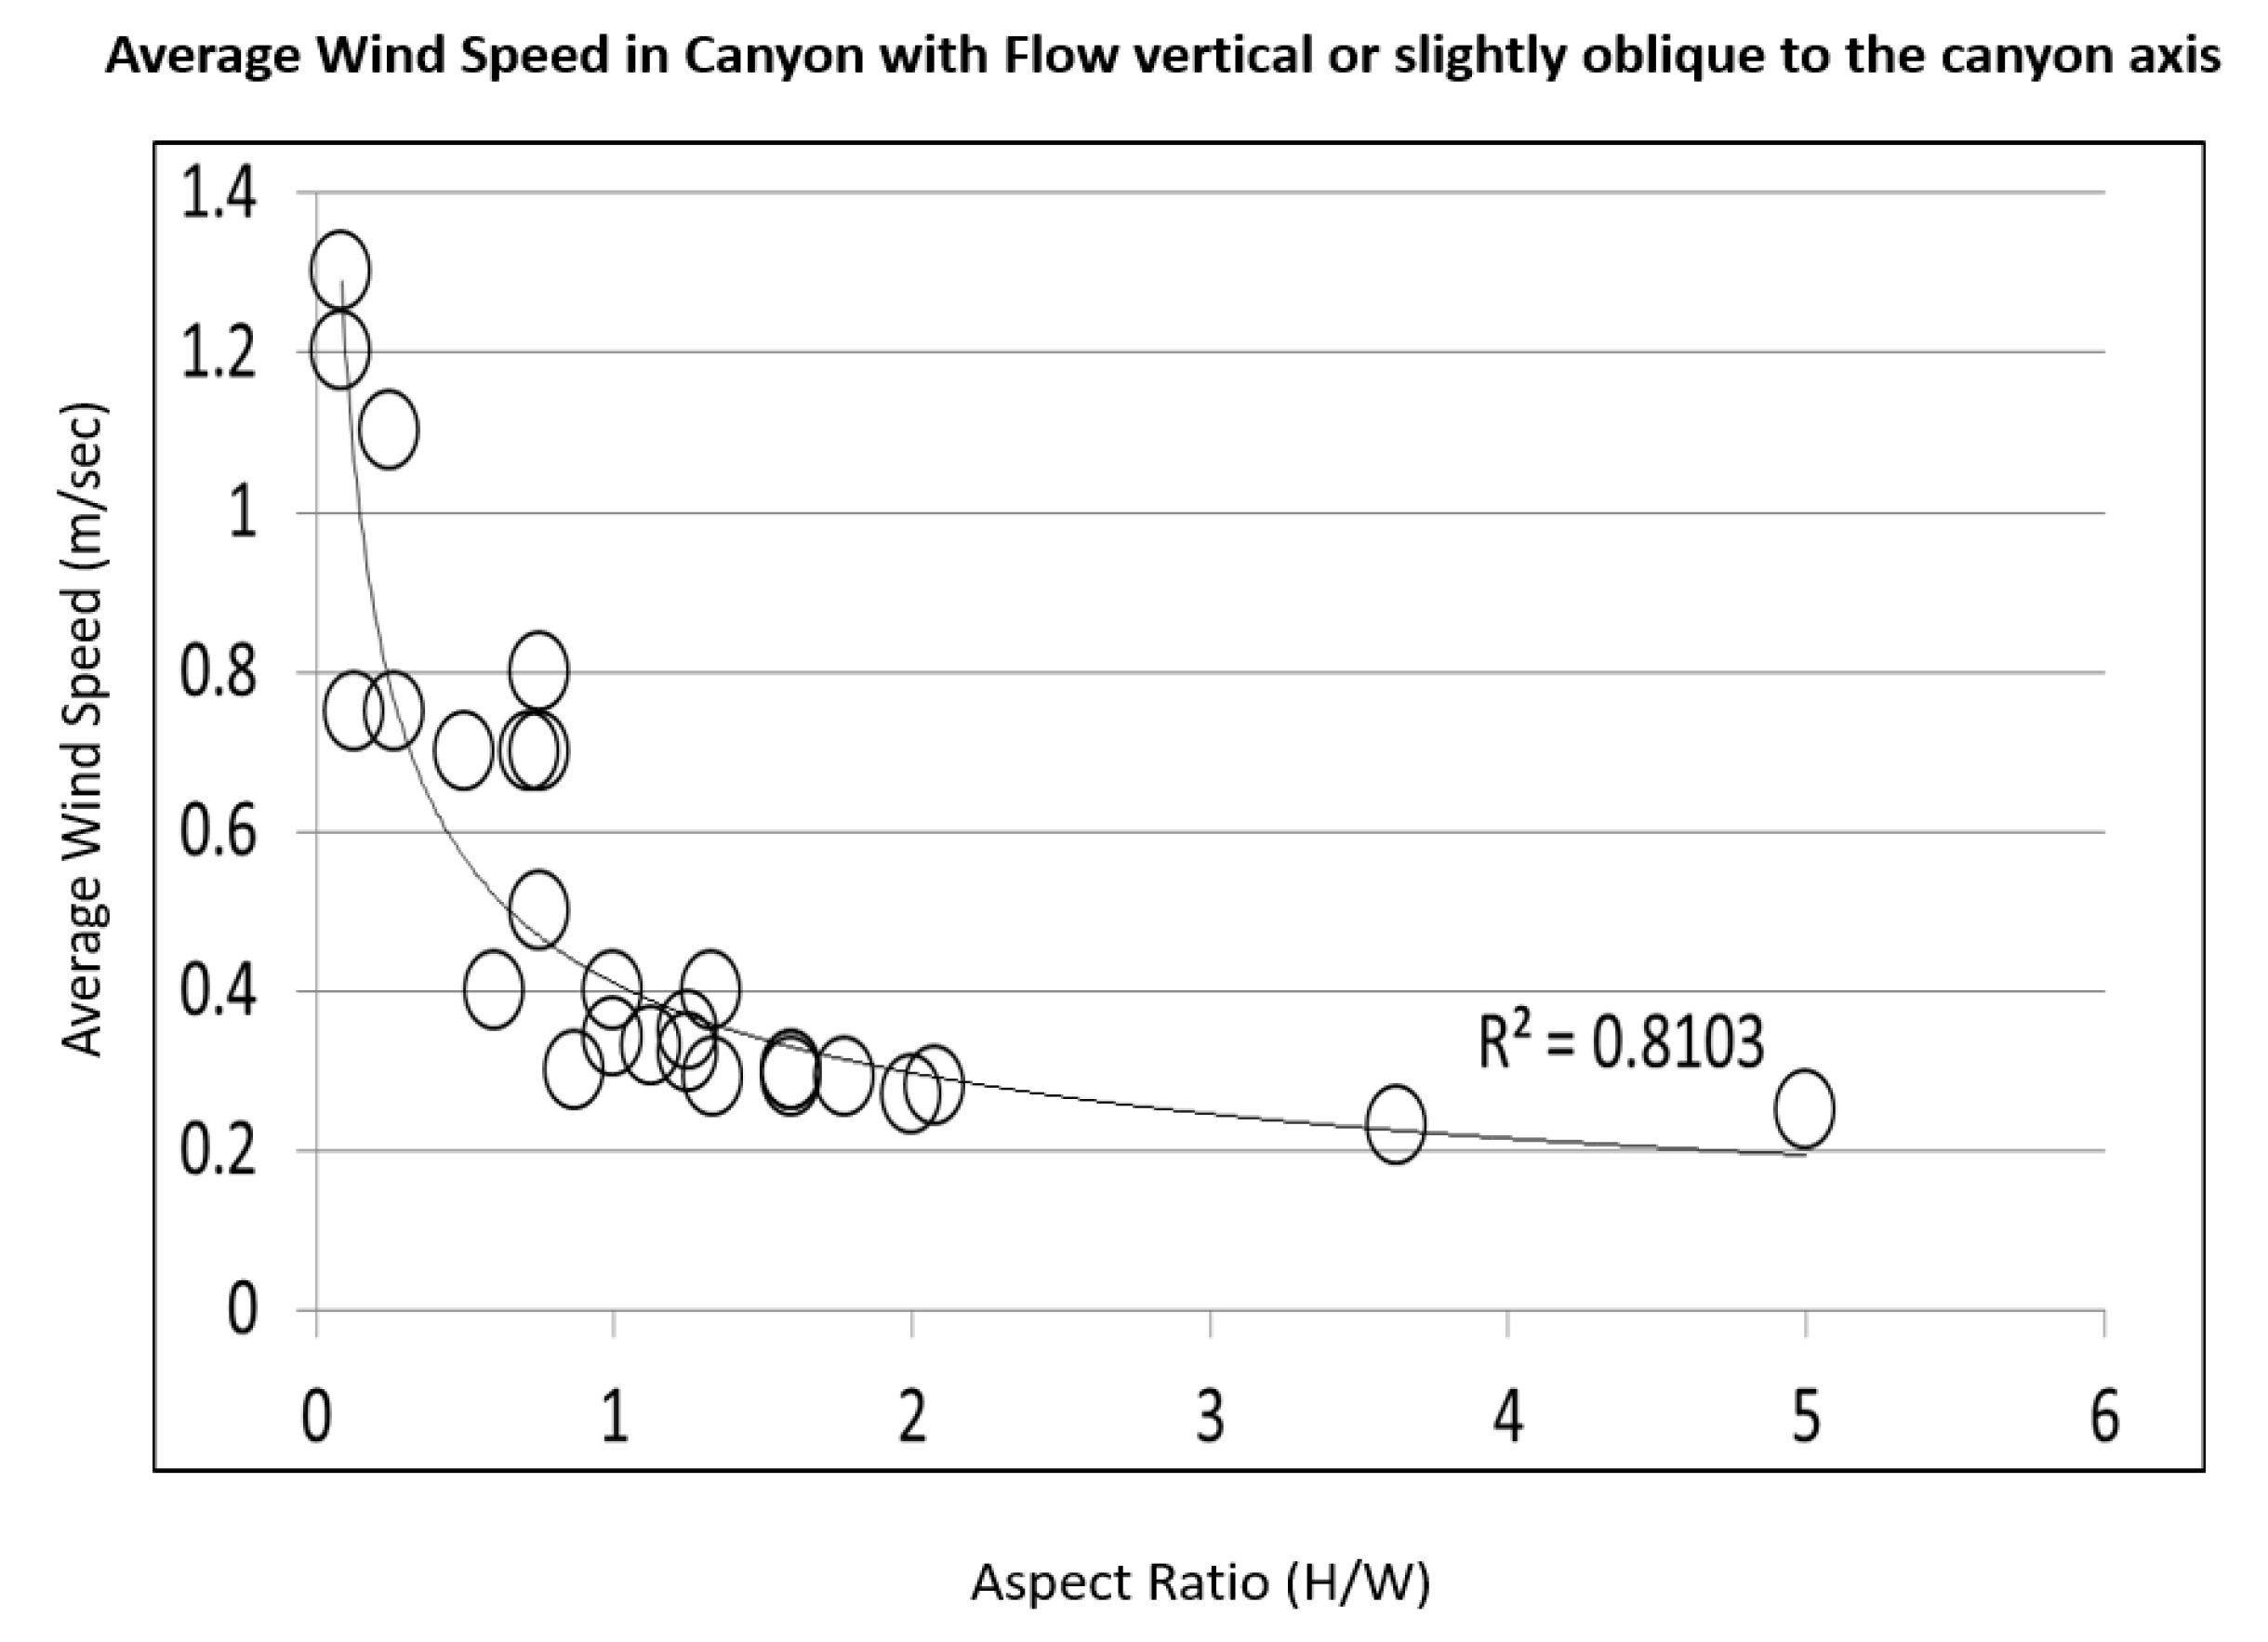
- The cooling potential is then analyzed by introducing a specific parameter called ‘Gradient of the Temperature Decrease along the Precinct Axis’ (GTD).
- The GTD is evaluated versus the flow through open areas, the aspect ration (H/W), and the Built Area Ratio.
3. Buildings and Urban Context
4. Modeling Procedures
- A typical horizontal resolution from 0.5 to 5 m
- A typical time frame of 24 to 48 h
- A time step of 1 to 5 s.
- Wind speed: 2.5 m/s;
- Wind direction: 250°;
- The start time and date of simulation: 18:00 21/2/2050;
- The end time and date of simulation: 00:00 23/2/2050 correspond to summer conditions in Sydney.
5. Simulation Results
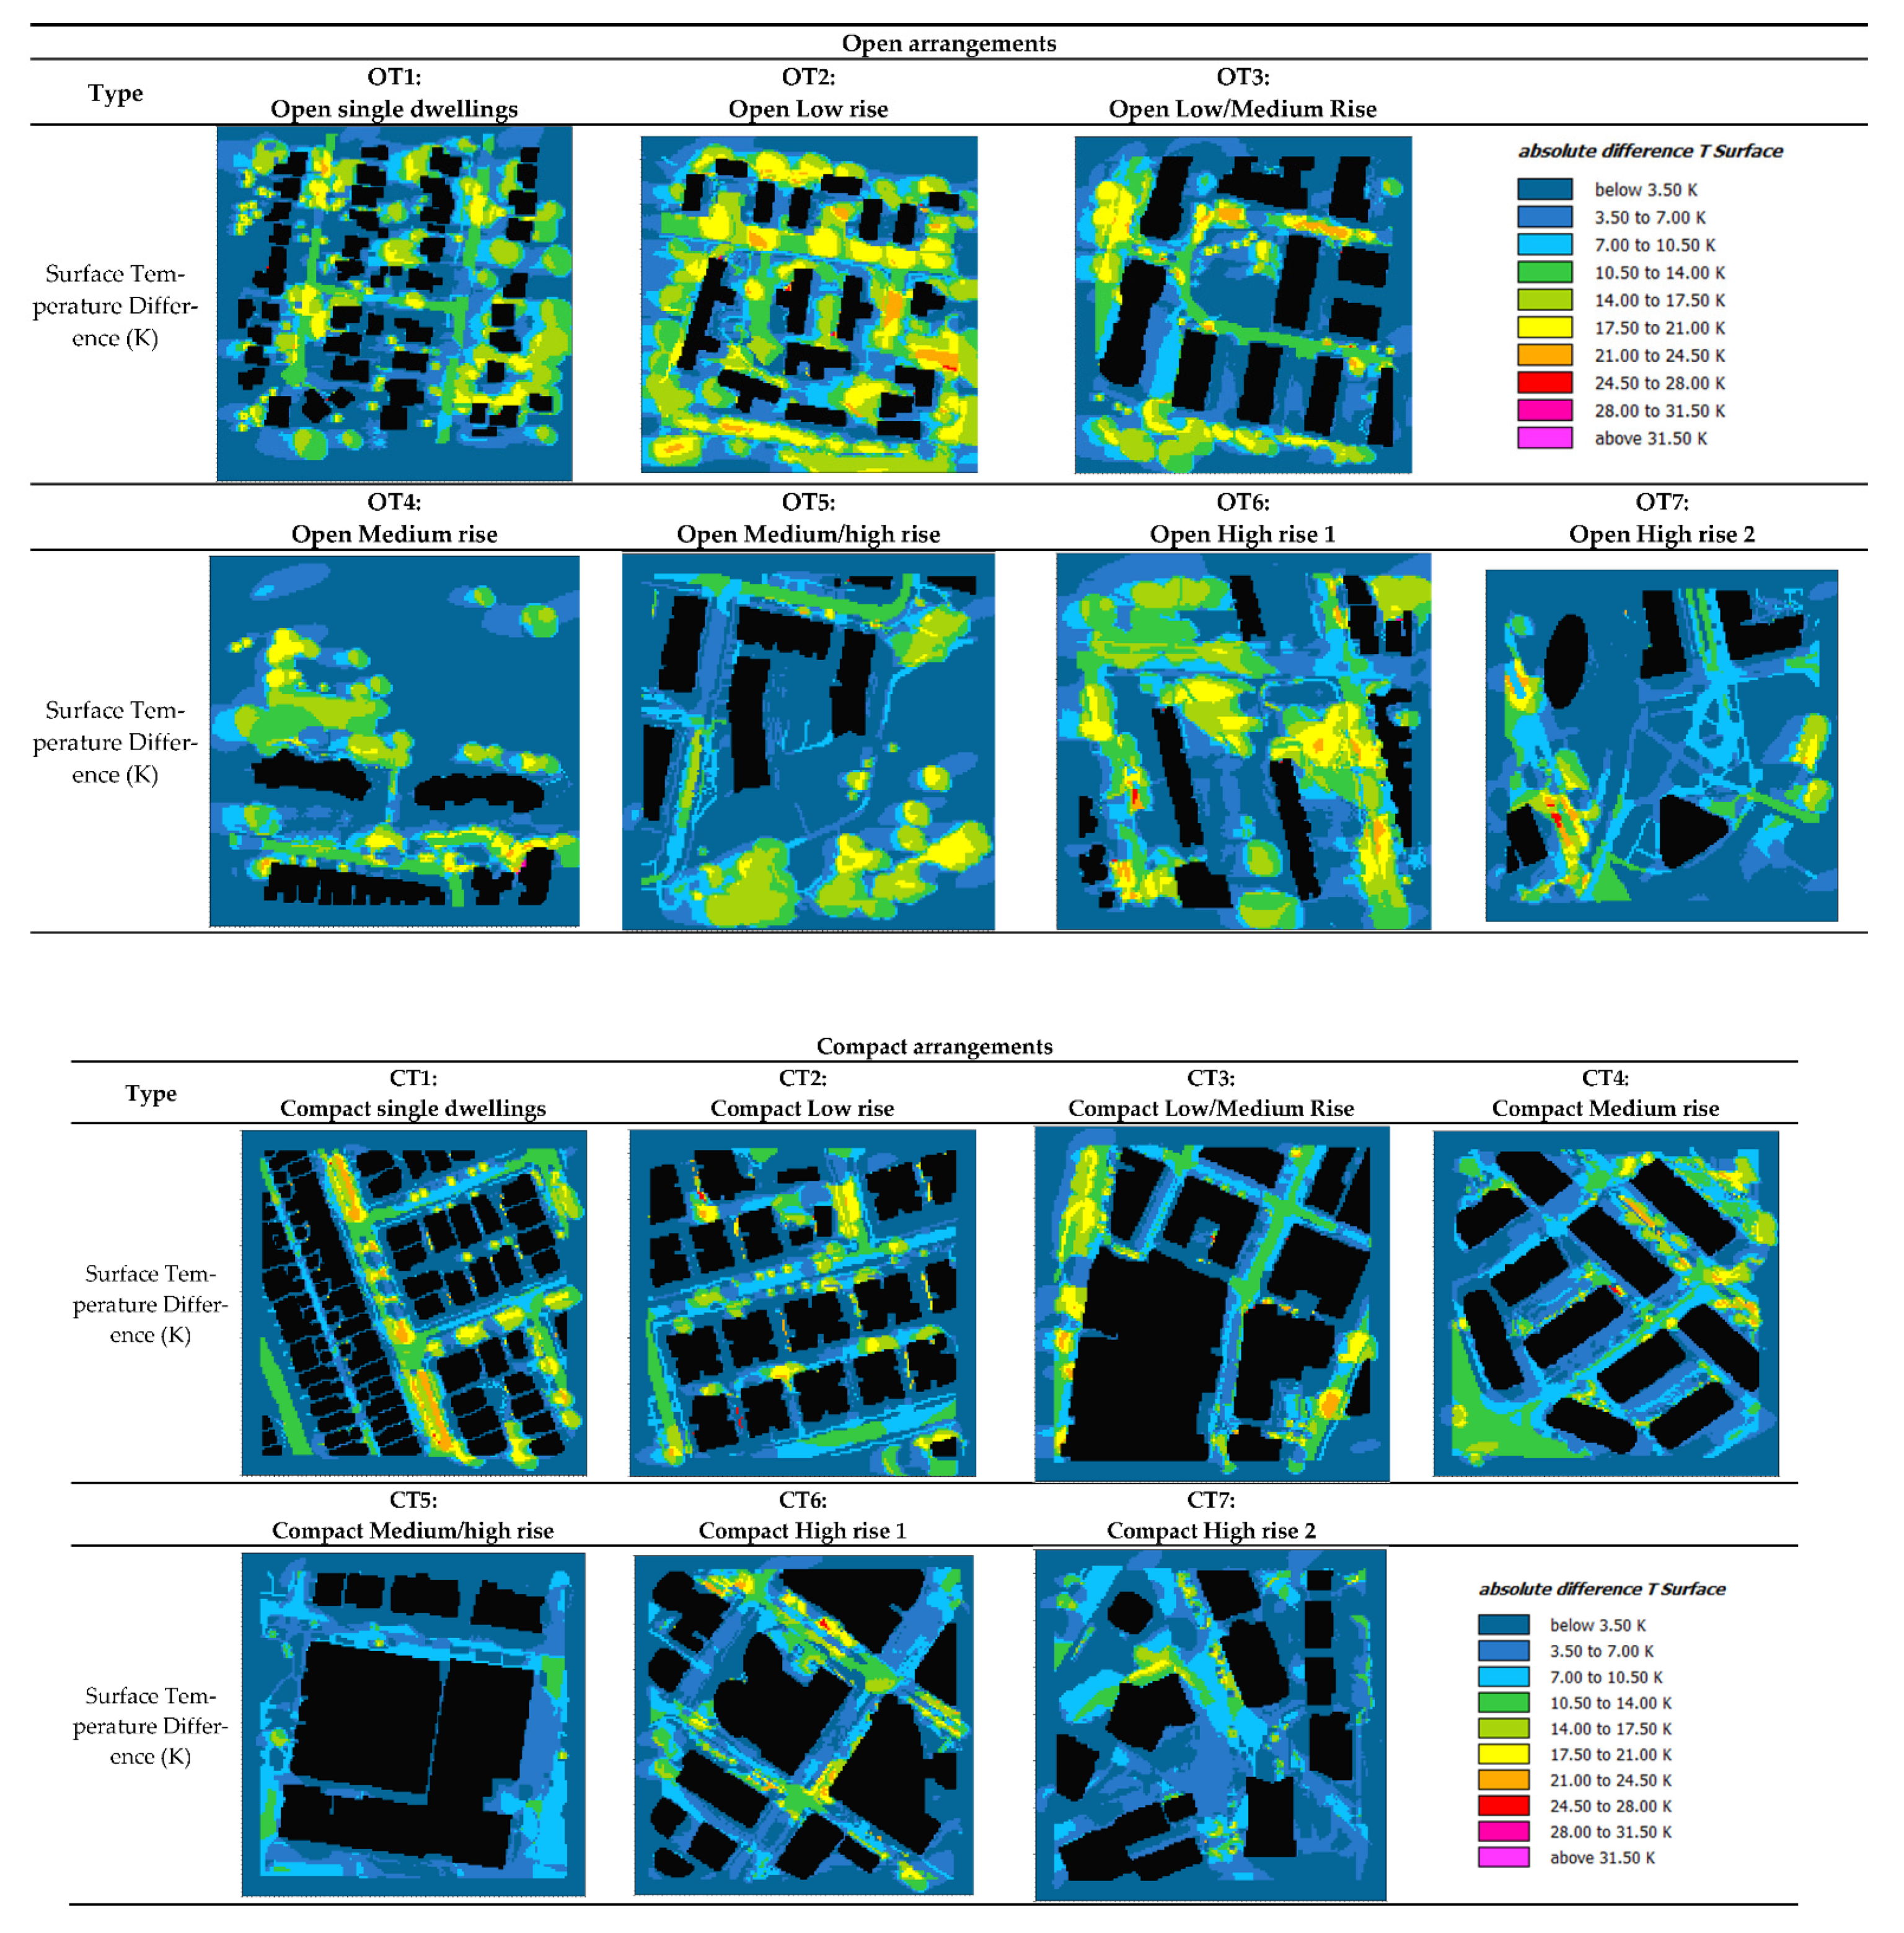
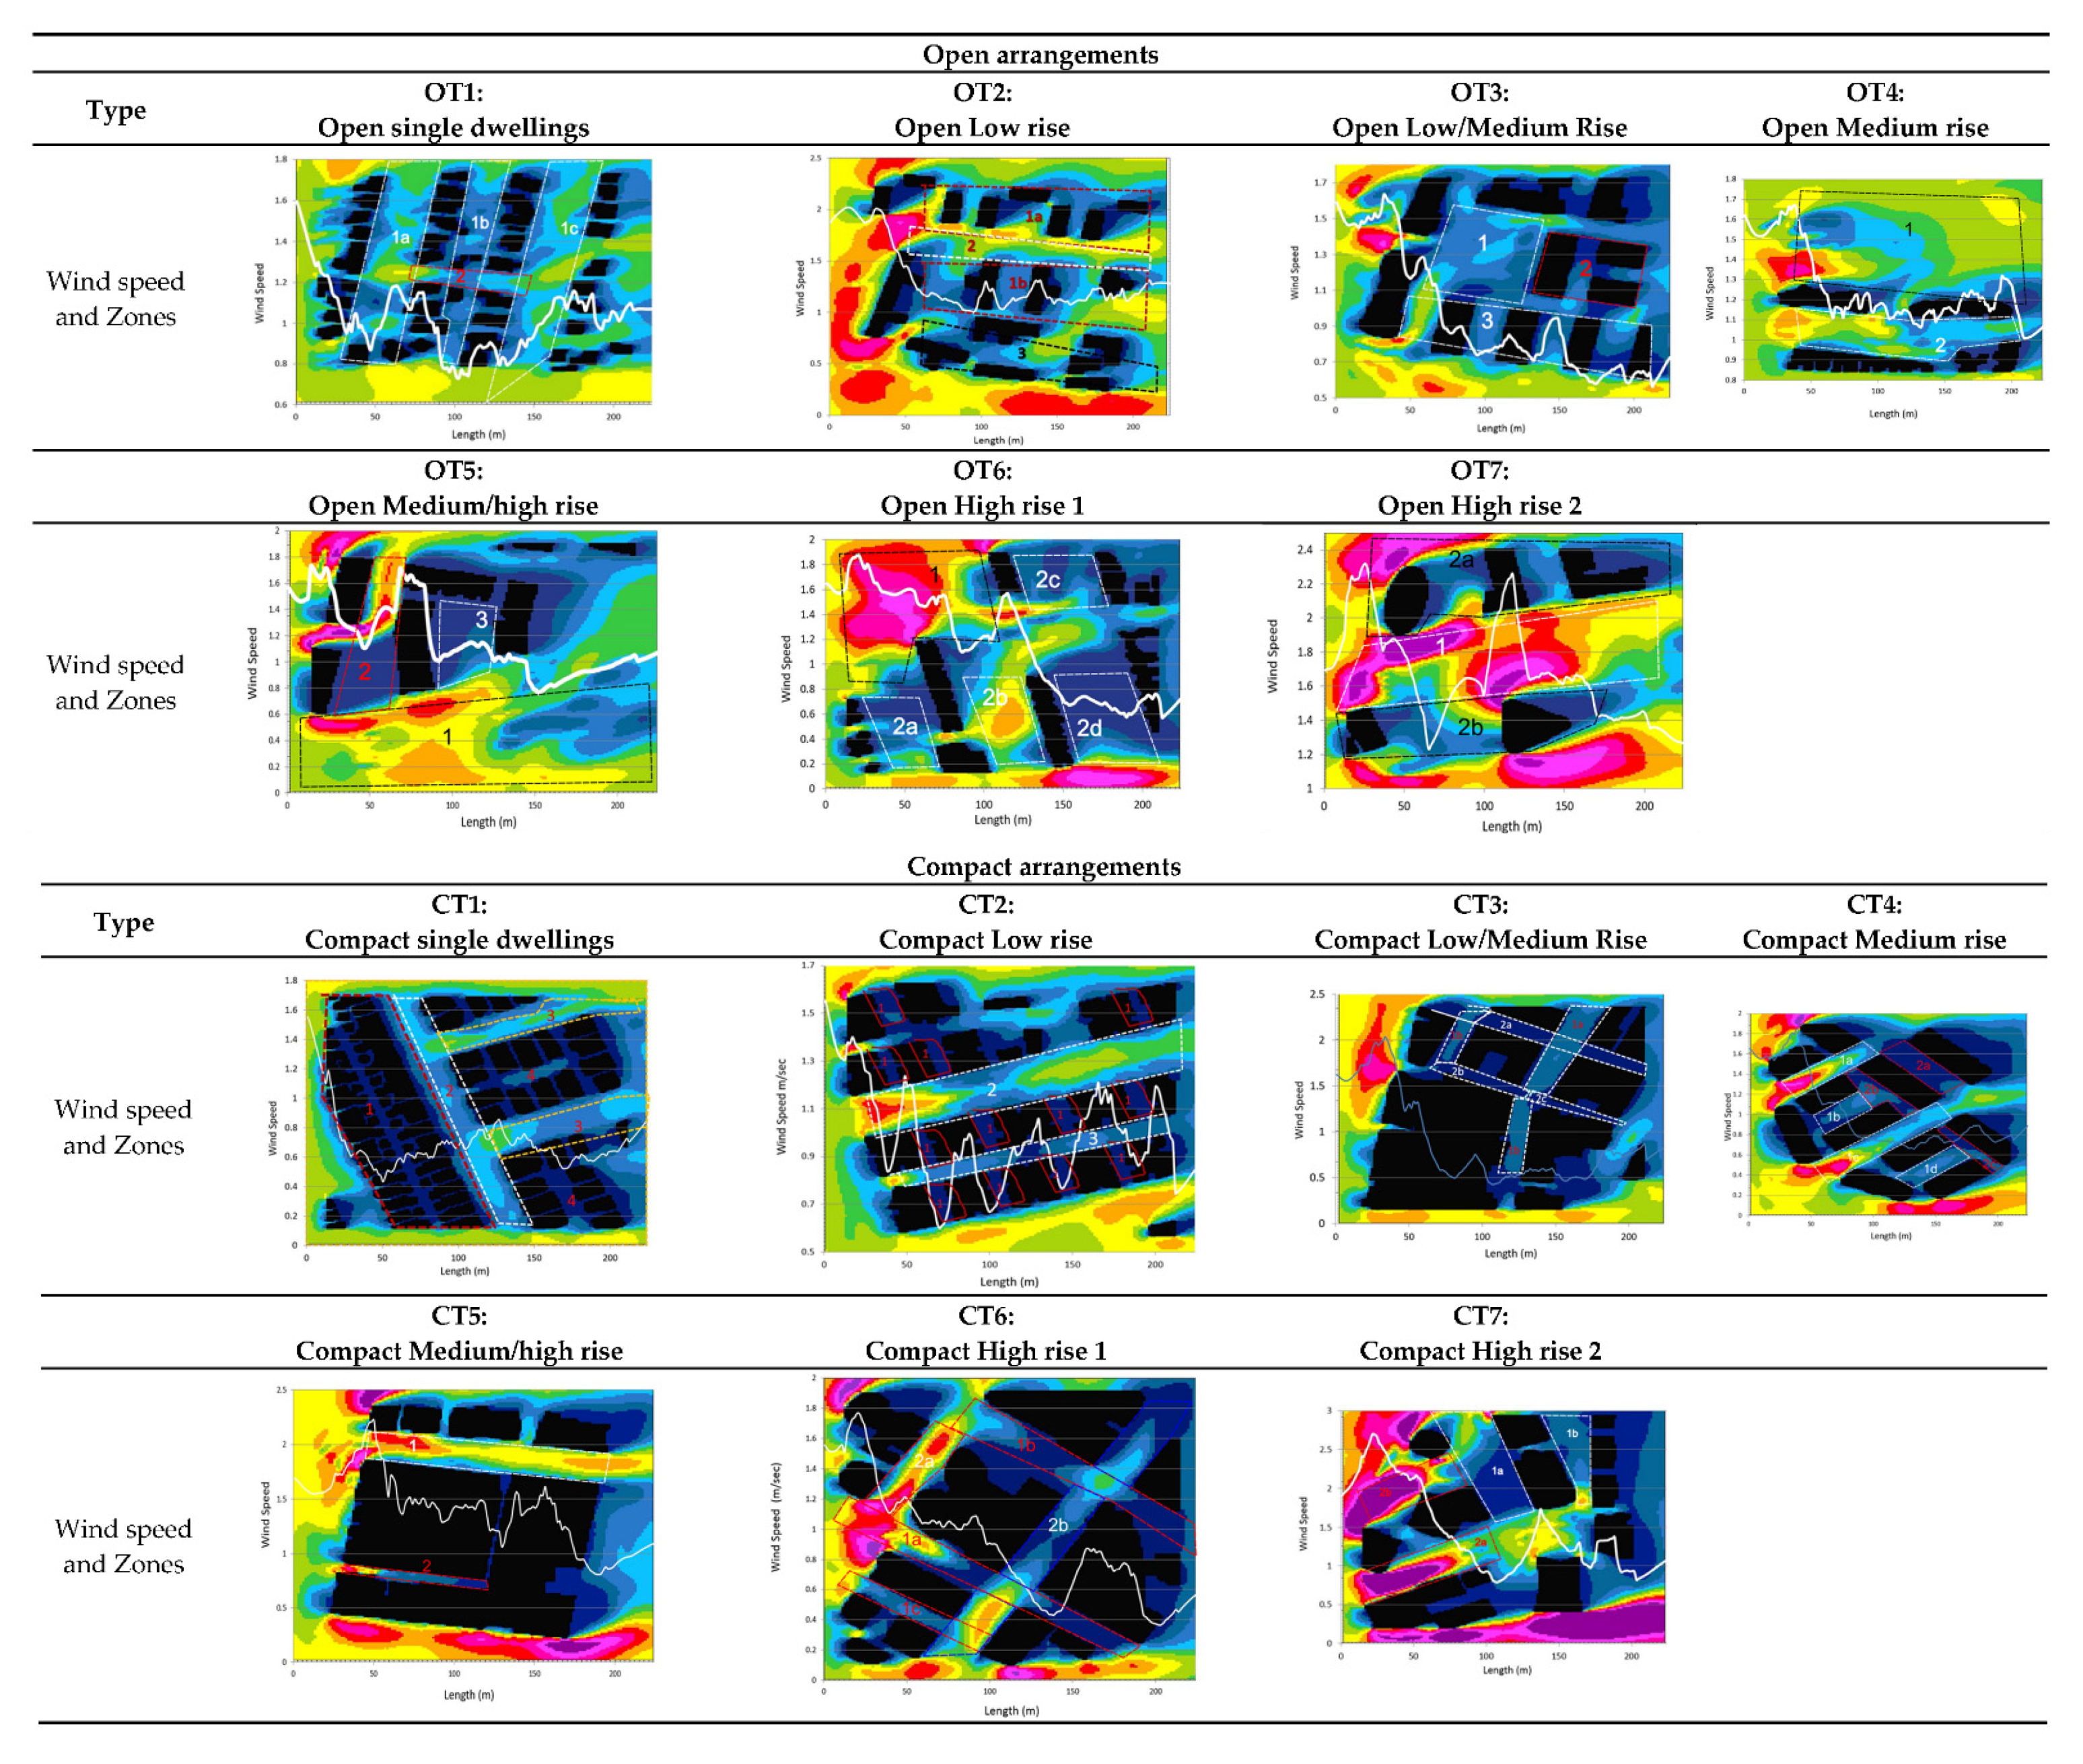
5.1. Simulation Results for the Unmitigated Cases
5.2. Simulation Results for the Mitigated Cases
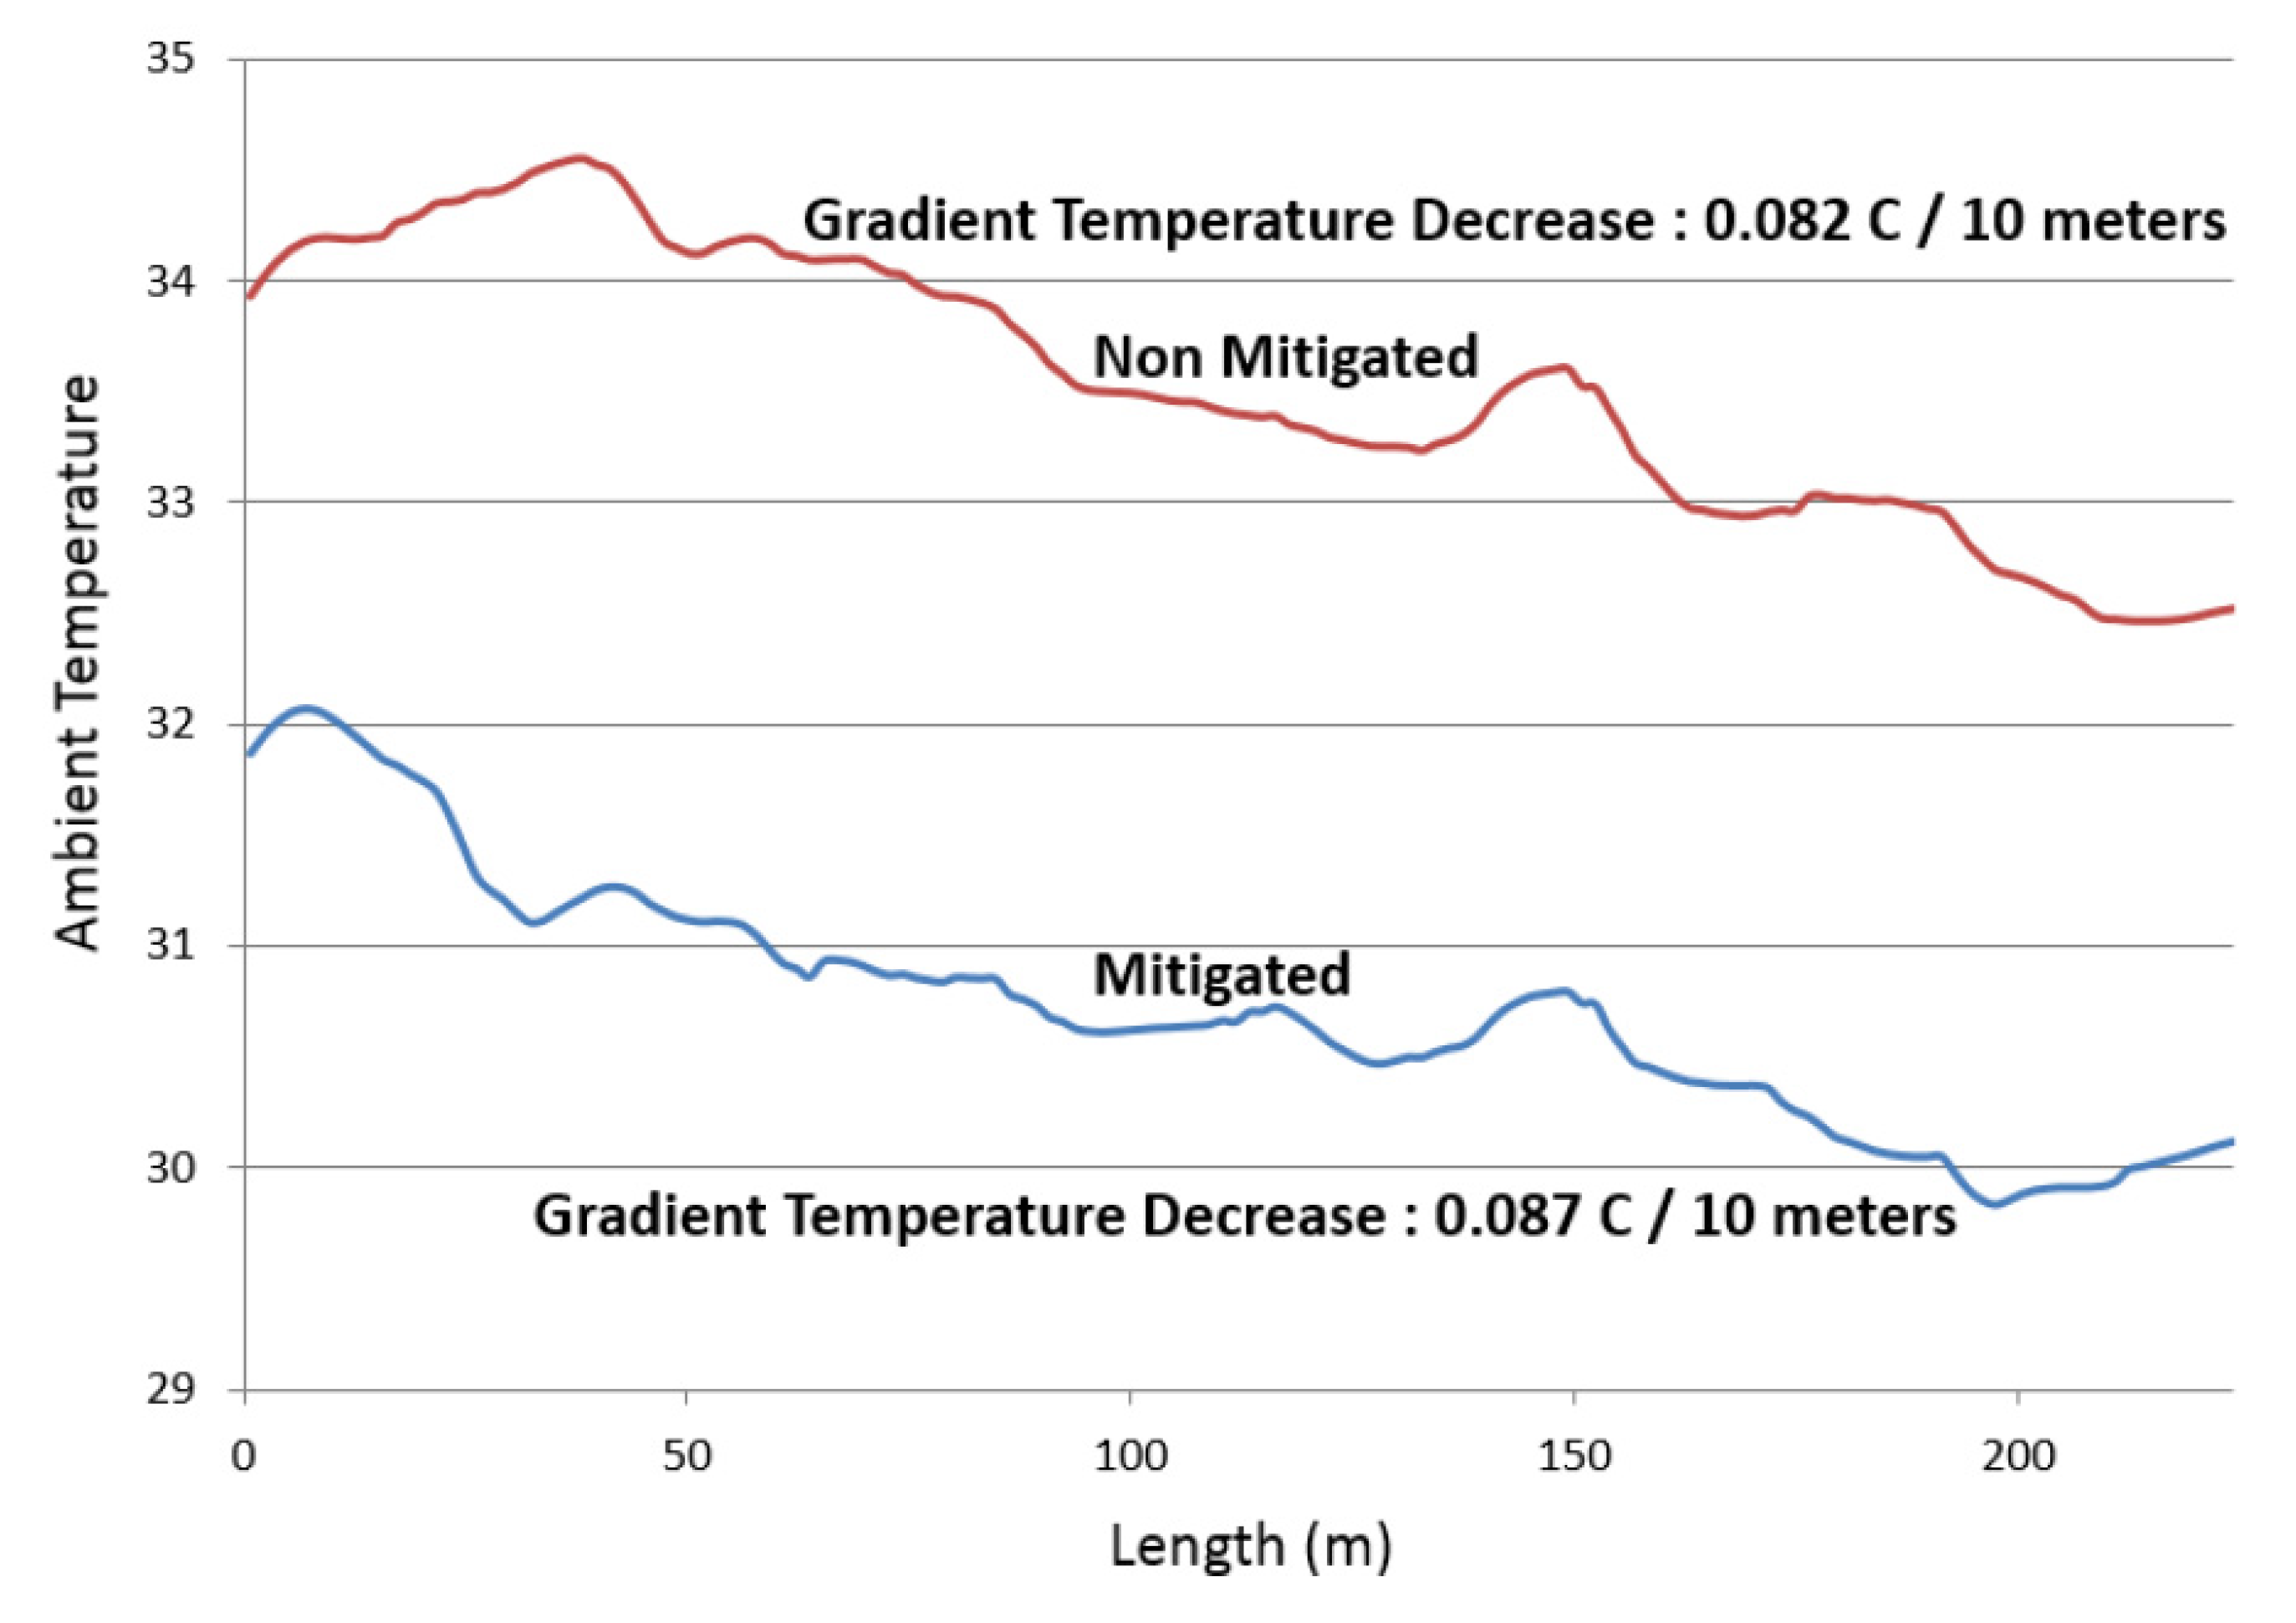
6. Analysis of Results and Discussion
7. Conclusions
Author Contributions
Funding
Informed Consent Statement
Data Availability Statement
Conflicts of Interest
References
- Parker, J. The Leeds urban heat island and its implications for energy use and thermal comfort. Energy Build. 2021, 235, 110636. [Google Scholar] [CrossRef]
- Keat, W.J.; Kendon, E.J.; Bohnenstengel, S.I. Climate change over UK cities: The urban influence on extreme temperatures in the UK climate projections. Clim. Dyn. 2021, 57, 3583–3597. [Google Scholar] [CrossRef]
- Bahi, H.; Rhinane, H.; Bensalmia, A.; Fehrenbach, U.; Scherer, D. Effects of urbanization and seasonal cycle on the surface urban heat island patterns in the coastal growing cities: A case study of Casablanca, Morocco. Remote Sens. 2016, 8, 829. [Google Scholar] [CrossRef] [Green Version]
- Kolokotsa, D.; Psomas, A.; Karapidakis, E. Urban heat island in southern Europe: The case study of Hania, Crete. Sol. Energy 2009, 83, 1871–1883. [Google Scholar] [CrossRef]
- Martinelli, A.; Kolokotsa, D.-D.; Fiorito, F. Urban heat island in mediterranean coastal cities: The case of Bari (Italy). Climate 2020, 8, 79. [Google Scholar] [CrossRef]
- Santamouris, M. Recent progress on urban overheating and heat island research. Integrated assessment of the energy, environmental, vulnerability and health impact. Synergies with the global climate change. Energy Build. 2020, 207, 109482. [Google Scholar] [CrossRef]
- Castaldo, V.; Coccia, V.; Cotana, F.; Pignatta, G.; Pisello, A.; Rossi, F. Thermal-energy analysis of natural “cool” stone aggregates as passive cooling and global warming mitigation technique. Urban Clim. 2015, 14, 301–314. [Google Scholar] [CrossRef]
- Guha, A.; Han, J.; Cummings, C.; McLennan, D.A.; Warren, J.M. Differential ecophysiological responses and resilience to heat wave events in four co-occurring temperate tree species. Environ. Res. Lett. 2018, 13, 065008. [Google Scholar] [CrossRef]
- Bunker, A.; Wildenhain, J.; Vandenbergh, A.; Henschke, N.; Rocklöv, J.; Hajat, S.; Sauerborn, R. Effects of air temperature on climate-sensitive mortality and morbidity outcomes in the elderly; A systematic review and meta-analysis of epidemiological evidence. EBioMedicine 2016, 6, 258–268. [Google Scholar] [CrossRef] [Green Version]
- Santamouris, M.; Haddad, S.; Saliari, M.; Vasilakopoulou, K.; Synnefa, A.; Paolini, R.; Ulpiani, G.; Garshasbi, S.; Fiorito, F. On the energy impact of urban heat island in Sydney: Climate and energy potential of mitigation technologies. Energy Build. 2018, 166, 154–164. [Google Scholar] [CrossRef]
- Santamouris, M.; Haddad, S.; Fiorito, F.; Osmond, P.; Ding, L.; Prasad, D.; Zhai, X.; Wang, R. Urban heat island and overheating characteristics in Sydney, Australia. An analysis of multiyear measurements. Sustainability 2017, 9, 712. [Google Scholar] [CrossRef]
- Yun, G.Y.; Ngarambe, J.; Duhirwe, P.N.; Ulpiani, G.; Paolini, R.; Haddad, S.; Vasilakopoulou, K.; Santamouris, M. Predicting the magnitude and the characteristics of the urban heat island in coastal cities in the proximity of desert landforms. The case of Sydney. Sci. Total Environ. 2019, 709, 136068. [Google Scholar] [CrossRef] [PubMed]
- Bartesaghi-Koc, C.; Osmond, P.; Peters, A. Quantifying the seasonal cooling capacity of ‘green infrastructure types’ (GITs): An approach to assess and mitigate surface urban heat island in Sydney, Australia. Landsc. Urban Plan. 2020, 203, 103893. [Google Scholar] [CrossRef]
- Khan, H.S.; Santamouris, M.; Paolini, R.; Caccetta, P.; Kassomenos, P. Analyzing the local and climatic conditions affecting the urban overheating magnitude during the Heatwaves (HWs) in a coastal city: A case study of the greater Sydney region. Sci. Total Environ. 2021, 755, 142515. [Google Scholar] [CrossRef] [PubMed]
- Khan, H.S.; Santamouris, M.; Kassomenos, P.; Paolini, R.; Caccetta, P.; Petrou, I. Spatiotemporal variation in urban overheating magnitude and its association with synoptic air-masses in a coastal city. Sci. Rep. 2021, 11, 6762. [Google Scholar] [CrossRef] [PubMed]
- Akbari, H.; Cartalis, C.; Kolokotsa, D.; Muscio, A.; Pisello, A.L.; Rossi, F.; Santamouris, M.; Synnefa, A.; Wong, N.H.; Zinzi, M. Local climate change and urban heat island mitigation techniques—The state of the art. J. Civ. Eng. Manag. 2015, 22, 1–16. [Google Scholar] [CrossRef] [Green Version]
- Vuckovic, M.; Maleki, A.; Mahdavi, A. Strategies for development and improvement of the urban fabric: A Vienna case study. Climate 2018, 6, 7. [Google Scholar] [CrossRef] [Green Version]
- Manoli, G.; Fatichi, S.; Schläpfer, M.; Yu, K.; Crowther, T.W.; Meili, N.; Burlando, P.; Katul, G.G.; Bou-Zeid, E. Magnitude of urban heat islands largely explained by climate and population. Nature 2019, 573, 55–60. [Google Scholar] [CrossRef]
- Lin, P.; Lau, S.S.Y.; Qin, H.; Gou, Z. Effects of urban planning indicators on urban heat island: A case study of pocket parks in high-rise high-density environment. Landsc. Urban Plan. 2017, 168, 48–60. [Google Scholar] [CrossRef]
- Morakinyo, T.E.; Lam, Y.F. Simulation study on the impact of tree-configuration, planting pattern and wind condition on street-canyon’s micro-climate and thermal comfort. Build. Environ. 2016, 103, 262–275. [Google Scholar] [CrossRef]
- Hien, W.N.; Yok, T.P.; Yu, C. Study of thermal performance of extensive rooftop greenery systems in the tropical climate. Build. Environ. 2007, 42, 25–54. [Google Scholar] [CrossRef]
- Lin, Y.; Wang, Z.; Jim, C.Y.; Li, J.; Deng, J.; Liu, J. Water as an urban heat sink: Blue infrastructure alleviates urban heat island effect in mega-city agglomeration. J. Clean. Prod. 2020, 262, 121411. [Google Scholar] [CrossRef]
- Fahed, J.; Kinab, E.; Ginestet, S.; Adolphe, L. Impact of urban heat island mitigation measures on microclimate and pedestrian comfort in a dense urban district of Lebanon. Sustain. Cities Soc. 2020, 61, 102375. [Google Scholar] [CrossRef]
- Santamouris, M.; Paolini, R.; Haddad, S.; Synnefa, A.; Garshasbi, S.; Hatvani-Kovacs, G.; Gobakis, K.; Yenneti, K.; Vasilakopoulou, K.; Feng, J. Heat mitigation technologies can improve sustainability in cities. An holistic experimental and numerical impact assessment of urban overheating and related heat mitigation strategies on energy consumption, indoor comfort, vulnerability and heat-related mortality and morbidity in cities. Energy Build. 2020, 217, 110002. [Google Scholar] [CrossRef]
- Santamouris, M.; Yun, G.Y. Recent development and research priorities on cool and super cool materials to mitigate urban heat island. Renew. Energy 2020, 161, 792–807. [Google Scholar] [CrossRef]
- Gao, K.; Santamouris, M.; Feng, J. On the cooling potential of irrigation to mitigate urban heat island. Sci. Total Environ. 2020, 740, 139754. [Google Scholar] [CrossRef] [PubMed]
- Kolokotsa, D.; Lilli, A.A.; Lilli, M.A.; Nikolaidis, N.P. On the impact of nature-based solutions on citizens’ health & well being. Energy Build. 2020, 229, 110527. [Google Scholar] [CrossRef]
- Loeffler, R.; Österreicher, D.; Stoeglehner, G. The energy implications of urban morphology from an urban planning perspective—A case study for a new urban development area in the city of Vienna. Energy Build. 2021, 252, 111453. [Google Scholar] [CrossRef]
- Wang, Y.; Ni, Z.; Hu, M.; Chen, S.; Xia, B. A practical approach of urban green infrastructure planning to mitigate urban overheating: A case study of Guangzhou. J. Clean. Prod. 2021, 287, 124995. [Google Scholar] [CrossRef]
- Vallati, A.; Mauri, L.; Colucci, C.; Ocłoń, P. Effects of radiative exchange in an urban canyon on building surfaces’ loads and temperatures. Energy Build. 2017, 149, 260–271. [Google Scholar] [CrossRef]
- Lin, P.; Gou, Z.; Lau, S.S.-Y.; Qin, H. The Impact of urban design descriptors on outdoor thermal environment: A literature review. Energies 2017, 10, 2151. [Google Scholar] [CrossRef] [Green Version]
- Norton, B.A.; Coutts, A.M.; Livesley, S.J.; Harris, R.J.; Hunter, A.M.; Williams, N.S.G. Planning for cooler cities: A framework to prioritise green infrastructure to mitigate high temperatures in urban landscapes. Landsc. Urban Plan. 2015, 134, 127–138. [Google Scholar] [CrossRef]
- Lindholm, O.; Rehman, H.U.; Reda, F. Positioning positive energy districts in european cities. Buildings 2021, 11, 19. [Google Scholar] [CrossRef]
- de Dear, R.; Kim, J.; Parkinson, T. Residential adaptive comfort in a humid subtropical climate—Sydney Australia. Energy Build. 2018, 158, 1296–1305. [Google Scholar] [CrossRef]
- Stewart, I.D.; Oke, T.R. Local climate zones for urban temperature studies. Bull. Am. Meteorol. Soc. 2012, 93, 1879–1900. [Google Scholar] [CrossRef]
- Garshasbi, S.; Haddad, S.; Paolini, R.; Santamouris, M.; Papangelis, G.; Dandou, A.; Methymaki, G.; Portalakis, P.; Tombrou, M. Urban mitigation and building adaptation to minimize the future cooling energy needs. Sol. Energy 2020, 204, 708–719. [Google Scholar] [CrossRef]
- Morakinyo, T.E.; Lau, K.K.-L.; Ren, C.; Ng, E. Performance of Hong Kong’s common trees species for outdoor temperature regulation, thermal comfort and energy saving. Build. Environ. 2018, 137, 157–170. [Google Scholar] [CrossRef]
- Bruse, M. Modelling and strategies for improved urban climates. In Proceedings of the Biometeorology and Urban Climatology at the Turn of the Millennium, Sydney, NSW, Australia, 8–12 November 1999. [Google Scholar]
- Masson-Delmotte, V.; Zhai, P.; Pörtner, H.-O.; Roberts, D.; Skea, J.; Shukla, P.R.; Pirani, A.; Moufouma-Okia, W.; Péan, C.; Pidcock, R.; et al. (Eds.) IPCC, 2018: Global Warming of 1.5°C; IPCC: Geneva, Switzerland, 2018. [Google Scholar]
- Pachauri, R.K.; Allen, M.R.; Barros, V.R.; Broome, J.; Cramer, W.; Christ, R.; Church, J.A.; Clarke, L.; Dahe, Q.; Dasgupta, P.; et al. Contribution of Working Groups I, II and III to the Fifth Assessment Report of the Intergovernmental Panel on Climate Change. In Climate Change 2014: Synthesis Report; Pachauri, R., Meyer, L., Eds.; IPCC: Geneva, Switzerland, 2014; p. 151. ISBN 978-92-9169-143-2. [Google Scholar]
- Cilek, M.U.; Cilek, A. Analyses of land surface temperature (LST) variability among local climate zones (LCZs) comparing Landsat-8 and ENVI-met model data. Sustain. Cities Soc. 2021, 69, 102877. [Google Scholar] [CrossRef]
- Liu, Z.; Cheng, W.; Jim, C.; Morakinyo, T.E.; Shi, Y.; Ng, E. Heat mitigation benefits of urban green and blue infrastructures: A systematic review of modeling techniques, validation and scenario simulation in ENVI-met V4. Build. Environ. 2021, 200, 107939. [Google Scholar] [CrossRef]
- López-Cabeza, V.; Galán-Marín, C.; Rivera-Gómez, C.; Fernández, J.R. Courtyard microclimate ENVI-met outputs deviation from the experimental data. Build. Environ. 2018, 144, 129–141. [Google Scholar] [CrossRef]
- Forouzandeh, A. Prediction of surface temperature of building surrounding envelopes using holistic microclimate ENVI-met model. Sustain. Cities Soc. 2021, 70, 102878. [Google Scholar] [CrossRef]
- Oke, T.R. Boundary Layer Climates, 2nd ed.; Methuen & Co. Ltd.: London, UK, 1987; ISBN 9780415043199. [Google Scholar]


| Type | Description | Figure | No of Storeys | People per Hectare | Location | Amenities |
|---|---|---|---|---|---|---|
| T1: Single Dwellings | Single dwellings areas include houses, terrace houses, dual occupancies, and semi-detached dwellings. |  | 1–2 | 30–100 | Suburban areas | Local parks, distant shops |
| T2: Low Rise | Low rise housing typically involves townhouses/terrace housing or small-scale buildings with street-level retail shops and cafes with residential apartments above. |  | 3–4 | 70–200 | Close to village centers, along transport corridors | Parks, shops |
| T3: Low/Medium Rise | Low/medium-rise housing involves apartment buildings sometimes with cafes or small shops at the ground level. |  | 5–6 | 150–300 | Close to town centers and urban renewal areas | Park, shops, swimming pools |
| T4: Medium Rise | Medium rise hosing involves apartment buildings, sometimes with cafes or medium shops at the ground level. |  | 7–8 | 250–400 | Urban corridors, urban renewal areas, city centers | Parks, shops, gyms, child cares, swimming pools, buses, trains |
| T5: Medium/High Rise | Medium /high-rise housing involves apartment buildings, sometimes with retail, medium, and large shops at the ground level. |  | 9–12 | 300–400 | Urban corridors, urban renewal areas, near railway stations | Parks, supermarket, gyms, child cares, swimming pools, buses, trains, theatres/cinemas |
| T6: High Rise 1 | High rise housing 1 comprises standalone apartment buildings and mixed-use buildings that incorporate retail shops and/or commercial uses on the lower levels. |  | 13–25 | 400–800 | Near transport nodes, urban renewal areas, city centers | Parks, jobs, supermarkets, gyms, child cares, swimming pools, buses, trains, theatres/cinemas |
| T7: High Rise 2 | High rise housing 1 comprises standalone residential and mixed-use towers that incorporate retail shops and/or commercial uses on the lower levels. |  | 25+ | 600–1200 | City centers, near railway stations | Parks, jobs, supermarkets, gyms, clubs, swimming pools, buses, theatres/cinemas, major railway st. |
| Open Arrangements | |||||||
|---|---|---|---|---|---|---|---|
| Type | OT1: Open Single Dwellings | OT2: Open Low Rise | OT3: Open Low/Medium Rise | OT4: Open Medium Rise | OT5: Open Medium/High Rise | OT6: Open High Rise 1 | OT7: Open High Rise 2 |
| Figure |  |  |  |  |  |  |  |
| Region in Sydney |  |  |  |  |  |  |  |
| Location | Normanhurst | Kooloora | Rosebery | Raleigh Park | Parramatta | Waterloo | Syndey Olympic Park |
| No. Storeys | 1 | 3 | 5–6 | 8 | 9–12 | 18 | 30–35 |
| Building height | 4–8 | 5–12 | 9–18 | 25–30 | 21–42 | 60 | 100–130 |
| Street width | 25–35 | 25–30 | 15–20 | 35–45 | 20–30 | 45–55 | 30–70 |
| Building size | 200–350 | 250–500 | 1000–2000 | 1000–1500 | 1000–1500 | 1000 | 1000–1500 |
| Compact arrangements | |||||||
| Type | CT1: Compact single dwellings | CT2: Compact Low rise | CT3: Compact Low/Medium Rise | CT4: Compact Medium rise | CT5: Compact Medium/high rise | CT6: Compact High rise 1 | CT7: Compact High rise 2 |
| Figure |  |  |  |  |  |  |  |
| Region in Sydney |  |  |  |  |  |  |  |
| Location | Kellyville | Epping | Meadowback | Harold Park | Mascot | Wentworth Point | Chatswood |
| No. Storeys | 1–2 | 3–4 | 6 | 7–8 | 10–12 | 15–25 | 35–40 |
| Building height | 4–12 | 8–12 | 12–18 | 21–30 | 28–42 | 60–75 | 130–145 |
| Street width | 25–30 | 15–30 | 15–20 | 20–25 | 25–30 | 25–30 | 25–40 |
| Building size | 150–300 | 650–1000 | 1000–2000 | 1000–1500 | 4000–6000 | 1500–2000 | 1000–1500 |
| Code | Name | Construction | ||
|---|---|---|---|---|
| Outside Layer | 1st Layer | 2nd Layer | ||
| 000000 | Default wall-moderate insulation | 0100PL (1cm) | 0100IN (11 cm) | 0100CO (6 cm) |
| 0100Q2 | CoolRoof-moderate insulation | 0100Q1 (1 cm) | 0100FE (11 cm) | 0100F3 (6 cm) |
| Code | Name | Absorption | Reflection | Emissivity | Specific Heat (J/(kgK)) | Thermal Conductivity (w/(mK) | Density (kg/m3) |
|---|---|---|---|---|---|---|---|
| 0100PL | Default Plaster | 0.50 | 0.50 | 0.90 | 850 | 0.60 | 1500 |
| 0100Q1 | CoolPaint | 0.30 | 0.70 | 0.90 | 830 | 0.84 | 1856 |
| 0100IN | Default Insulation | 0.50 | 0.50 | 0.90 | 1500 | 0.07 | 400 |
| 0100CO | Default Concrete | 0.50 | 0.50 | 0.90 | 850 | 1.60 | 2220 |
| 0100F3 | Moderate insulation | 0.42 | 0.45 | 0.90 | 1033 | 1.00 | 1687 |
| Code | Name | Albedo | Emissivity | Used in OT | Used in CT |
|---|---|---|---|---|---|
| 0100ST | Asphalt Road | 0.2 | 0.9 | 2 | |
| 0100PD | Concrete Pavement Dark | 0.20 | 0.90 | 1-6-7 | 1-3 |
| 0100PG | Concrete Pavement Gray | 0.50 | 0.90 | 1-3-4-5-6-7 | 1-2-3-7 |
| 0100PL | Concrete Pavement Light | 0.80 | 0.90 | 1-3-4-5-7 | 1-2-3-5-7 |
| 0100Q3 | Cool Pavement | 0.50 | 0.90 | 1-2-3-4-5-6-7 | 1-2-3-4-5-6-7 |
| 0100Q5 | Cool Asphalt Road | 0.55 | 0.90 | 1-2-3-4-5-6-7 | 1-2-3-4-5-6-7 |
| 0100KK | Brick road (red stones) | 0.3 | 0.9 | 2-7 | |
| 0100GG | Dark Granit Pavement | 0.3 | 0.9 | 3 | |
| 0100WW | Deepwater (swimming pools) | 0.00 | 0.96 | 1-4 | 1- |
| Code | Name | OT | CT |
|---|---|---|---|
| 0100XX | Grass 25 cm aver. Dense | 1-2-3-4-5-6 | 1-2-3-4-5-6-7 |
| 0100H2 | Hedge dense, 2 m | 1-3-4-5-6 | 7 |
| 0100H4 | Hedge dense, 4 m | 1 | |
| 01ALDM | Conic, large trunk, dense, medium (15 m) | 4 | |
| 01ALDL | Conic, large trunk, dense, large (25 m) | 4 | |
| 01ALDS | Conic, large trunk, dense, small (5 m) | 4 | |
| 01CMSS | Cylindric, medium trunk, sparse, small (5 m) | 5 | |
| 01CSSS | Cylindric, small trunk, sparse, small (5 m) | 5 | |
| 01CLSS | Cylindric, large trunk, sparse, small (5 m) | 5 | |
| 01CLDM | Cylindric, large trunk, dense, medium (15 m) | 1-3-4-5-6 | 1-2-3-5-6-7 |
| 01CLDS | Cylindric, large trunk, dense, small (5 m) | 1-3-4 | 1-2-3-5-6-7 |
| 01CSDS | Cylindric, small trunk, dense, small (5 m) | 3-4-6 | 1 |
| 01CLDL | Cylindric, large trunk, dense, large (25 m) | 3-4 | 1-2-3-7 |
| 01CSDM | Cylindric, small trunk, dense, medium (15 m) | 3-4-6 | 1 |
| 01CMDM | Cylindric, medium trunk, dense, medium (15 m) | 1-4-5-6 | |
| 01CLDL | Cylindric, large trunk, dense, large (25 m) | 1-2-6 | 7 |
| 01HLDL | Heart-shaped, large trunk, dense, large (25 m) | 1 | 2 |
| 01PSDS | Palm, small trunk, dense, small (5 m) | 7 | |
| 01CMDS | Cylindric, medium trunk, dense, small (5 m) | 1-4-5 | 7 |
| 01PSDS | Palm, small trunk, dense, small (5 m) | 1 | |
| 01PLDS | Palm, large trunk, dense, small (5 m) | 2-4-6 | 3-7 |
| 01PLDM | Palm, large trunk, dense, medium (15 m) | 1-4 | 6-7 |
| 01PLDL | Palm, large trunk, dense, large (25 m) | 2 | 6 |
| 01OMDS | Cylindric, medium trunk, dense, small (5 m) | 6 | |
| 01OLDM | Cylindric, large trunk, dense, medium (15 m) | 2-4 | 6 |
| 01CMDL | Cylindric, medium trunk, dense, large (25 m) | 1-3-4-6 | |
| 01OLDS | Cylindric, large trunk, dense, small (5 m) | 2 | 6 |
| 01OLDL | Cylindric, large trunk, dense, large (25 m) | 2 | 6 |
| 01SLDS | Spherical, large trunk, dense, small (5 m) | 6 | |
| 01SMSL | Spherical, medium trunk, sparse, large (25 m) | 6 | |
| 01SMDS | Spherical, medium trunk, dense, small (5 m) | 6 | |
| 01CLSM | Cylindric, large trunk, sparse, medium (15 m) | 6 | |
| 01SMDM | Spherical, medium trunk, dense, medium (15 m) | 6 |
| Open Precincts | ||||
|---|---|---|---|---|
| Type | OT1: Open Single Dwellings | OT2: Open Low Rise | OT3: Open Low/Medium Rise | |
| Envimet Model |  | |||
| OT4: Open Medium rise | OT5: Open Medium/high rise | OT6: Open High rise 1 | OT7: Open High rise 2 | |
| ENVI-met Model |  | |||
| Compact precincts | ||||
| Type | CT1: Compact single dwellings | CT2: Compact Low rise | CT3: Compact Low/Medium Rise | CT4: Compact Medium rise |
| ENVI-met Model |  | |||
| CT5: Compact Medium/high rise | CT6: Compact High rise 1 | CT7: Compact High rise 2 | ||
| ENVI-met Model |  | |||
| Urban Canopy Parameters | Base Run and Unmitigated Scenario | Mitigated Scenario Values | |||||
|---|---|---|---|---|---|---|---|
| Urban Categories | Cat | Building Height | Urban Fraction | Roof Albedo | Road Albedo | Roof Albedo | Roof Albedo |
| Commercial Business Dist. | CBT | 28 | 0.95 | 0.15 | 0.08 | 0.6 | 0.6 |
| High Density | HD | 13 | 0.66 | 0.15 | 0.08 | 0.6 | 0.6 |
| Medium Density | MD | 6 | 0.62 | 0.15 | 0.08 | 0.6 | 0.6 |
| Low Density | LD | 4 | 0.55 | 0.15 | 0.08 | 0.6 | 0.6 |
| Industrial | IN | 6 | 0.60 | 0.6 | 0.08 | 0.6 | 0.6 |
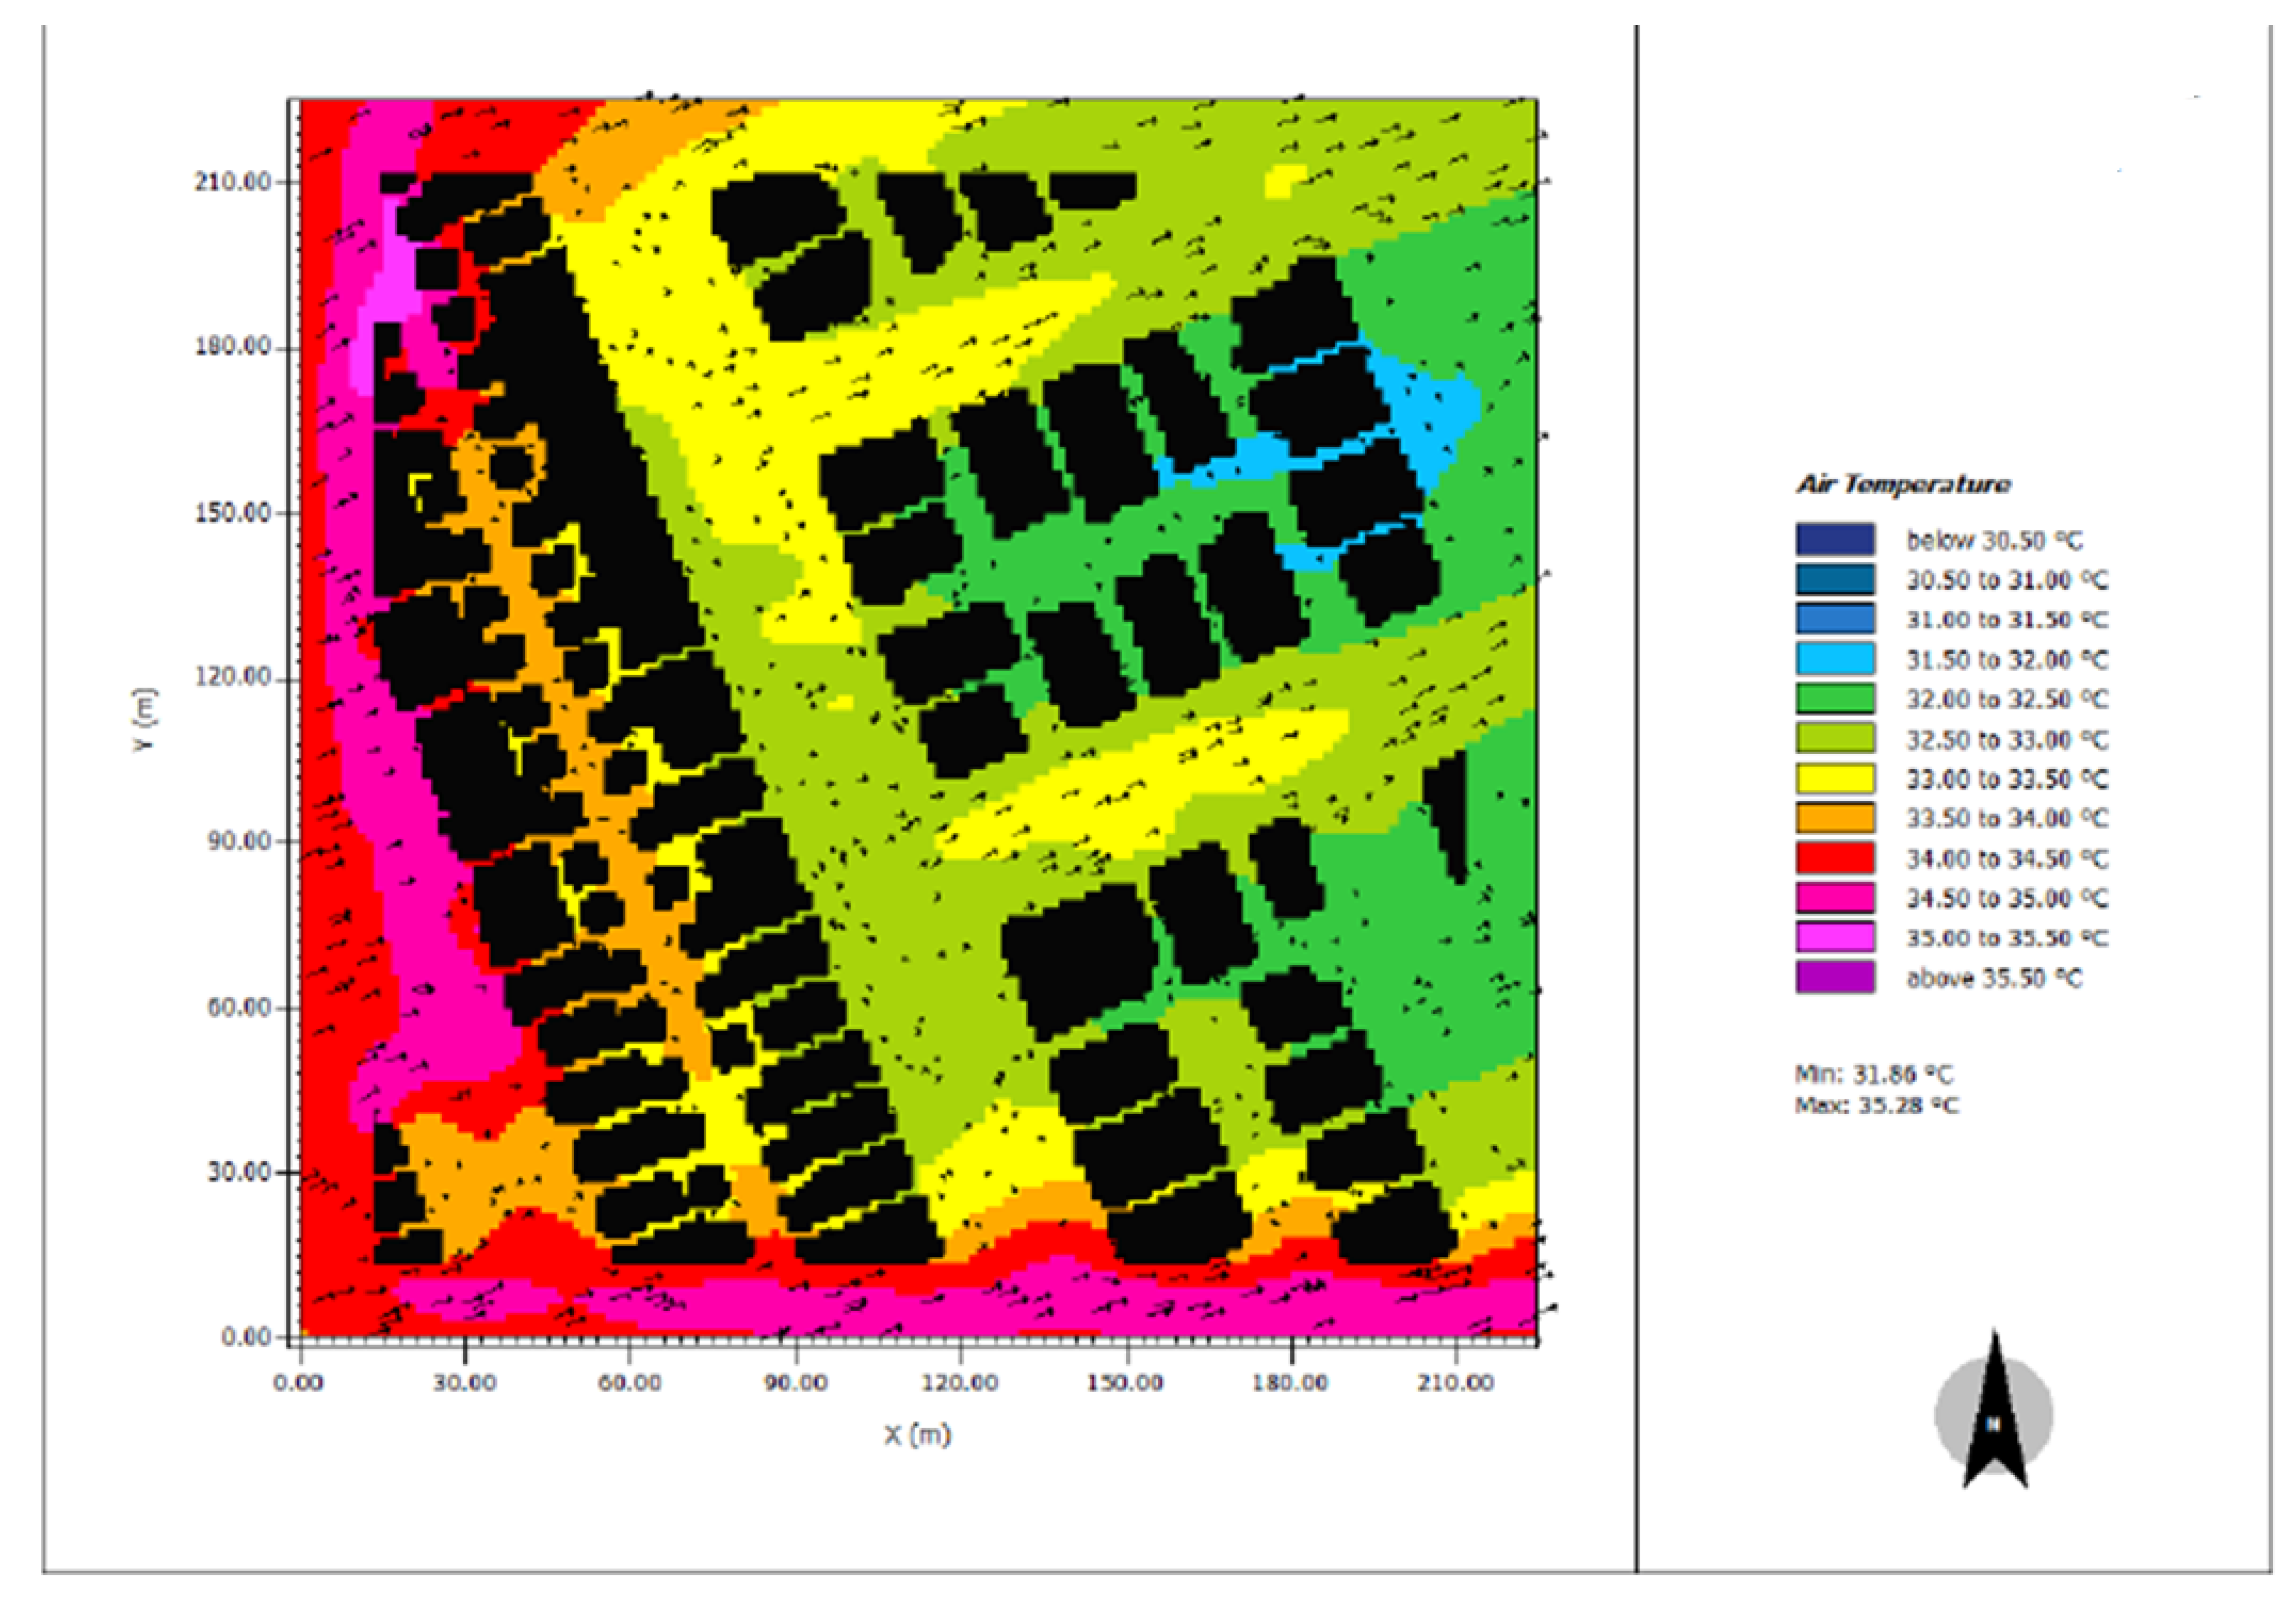
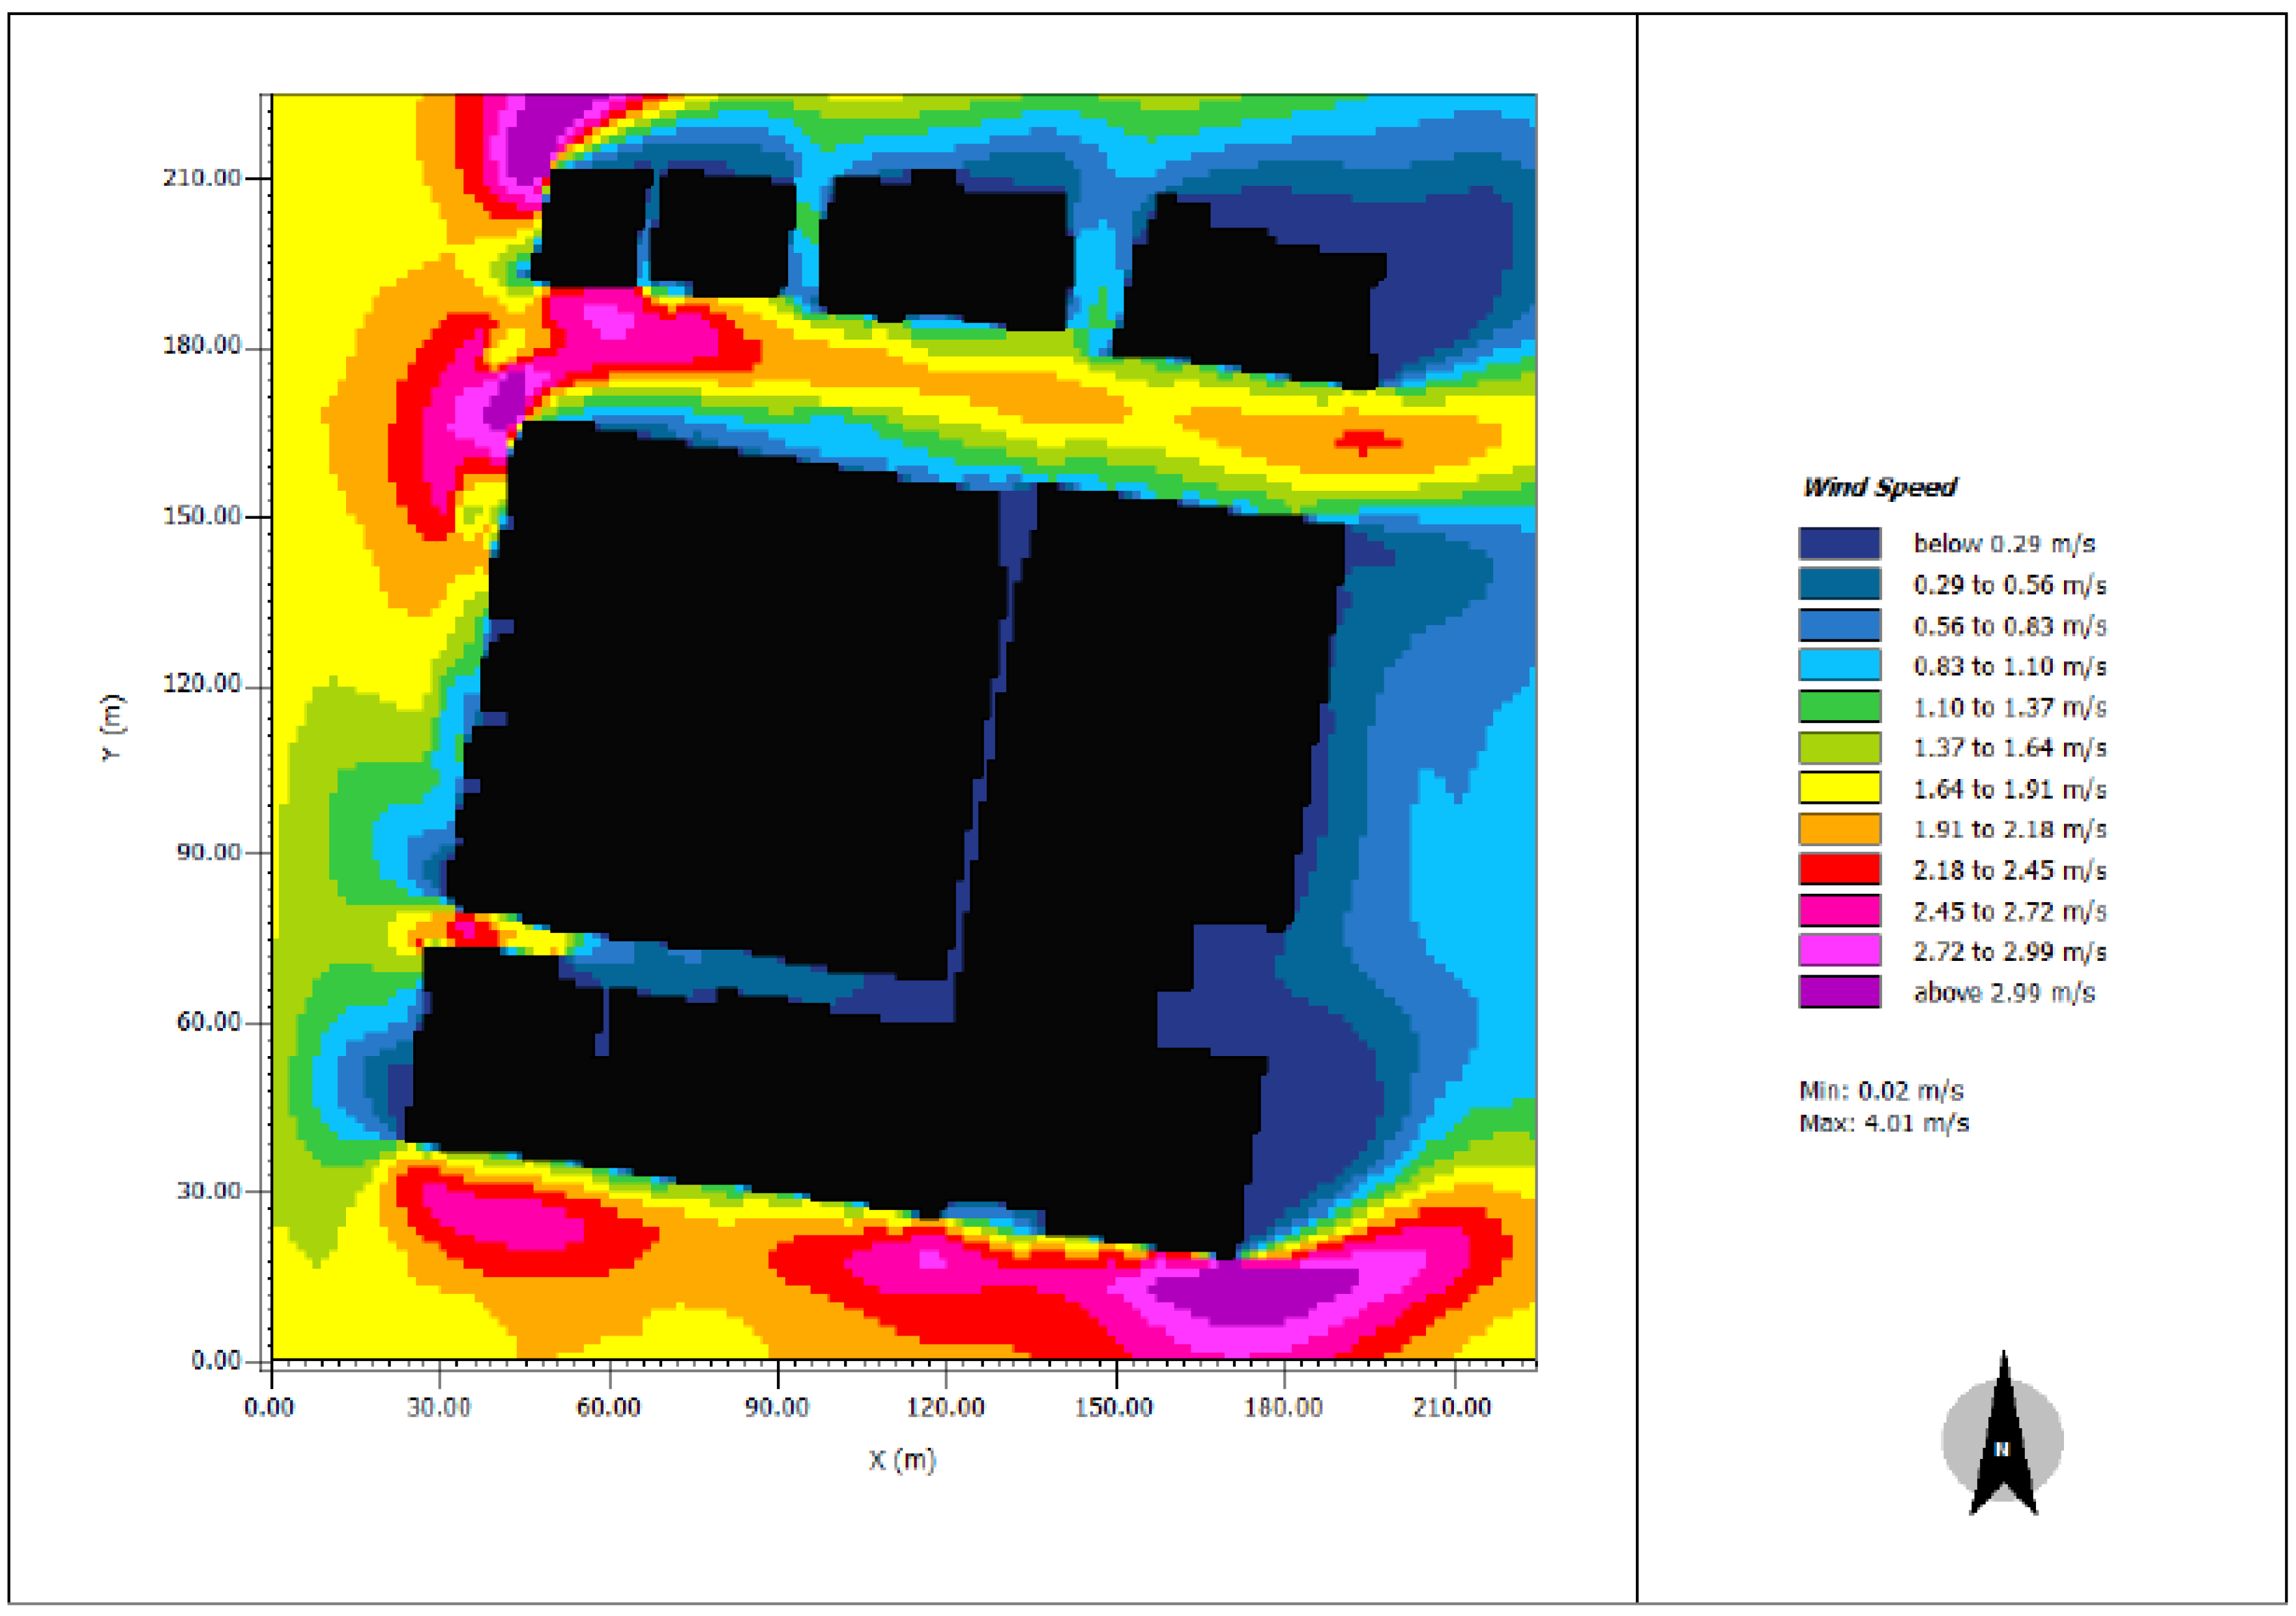
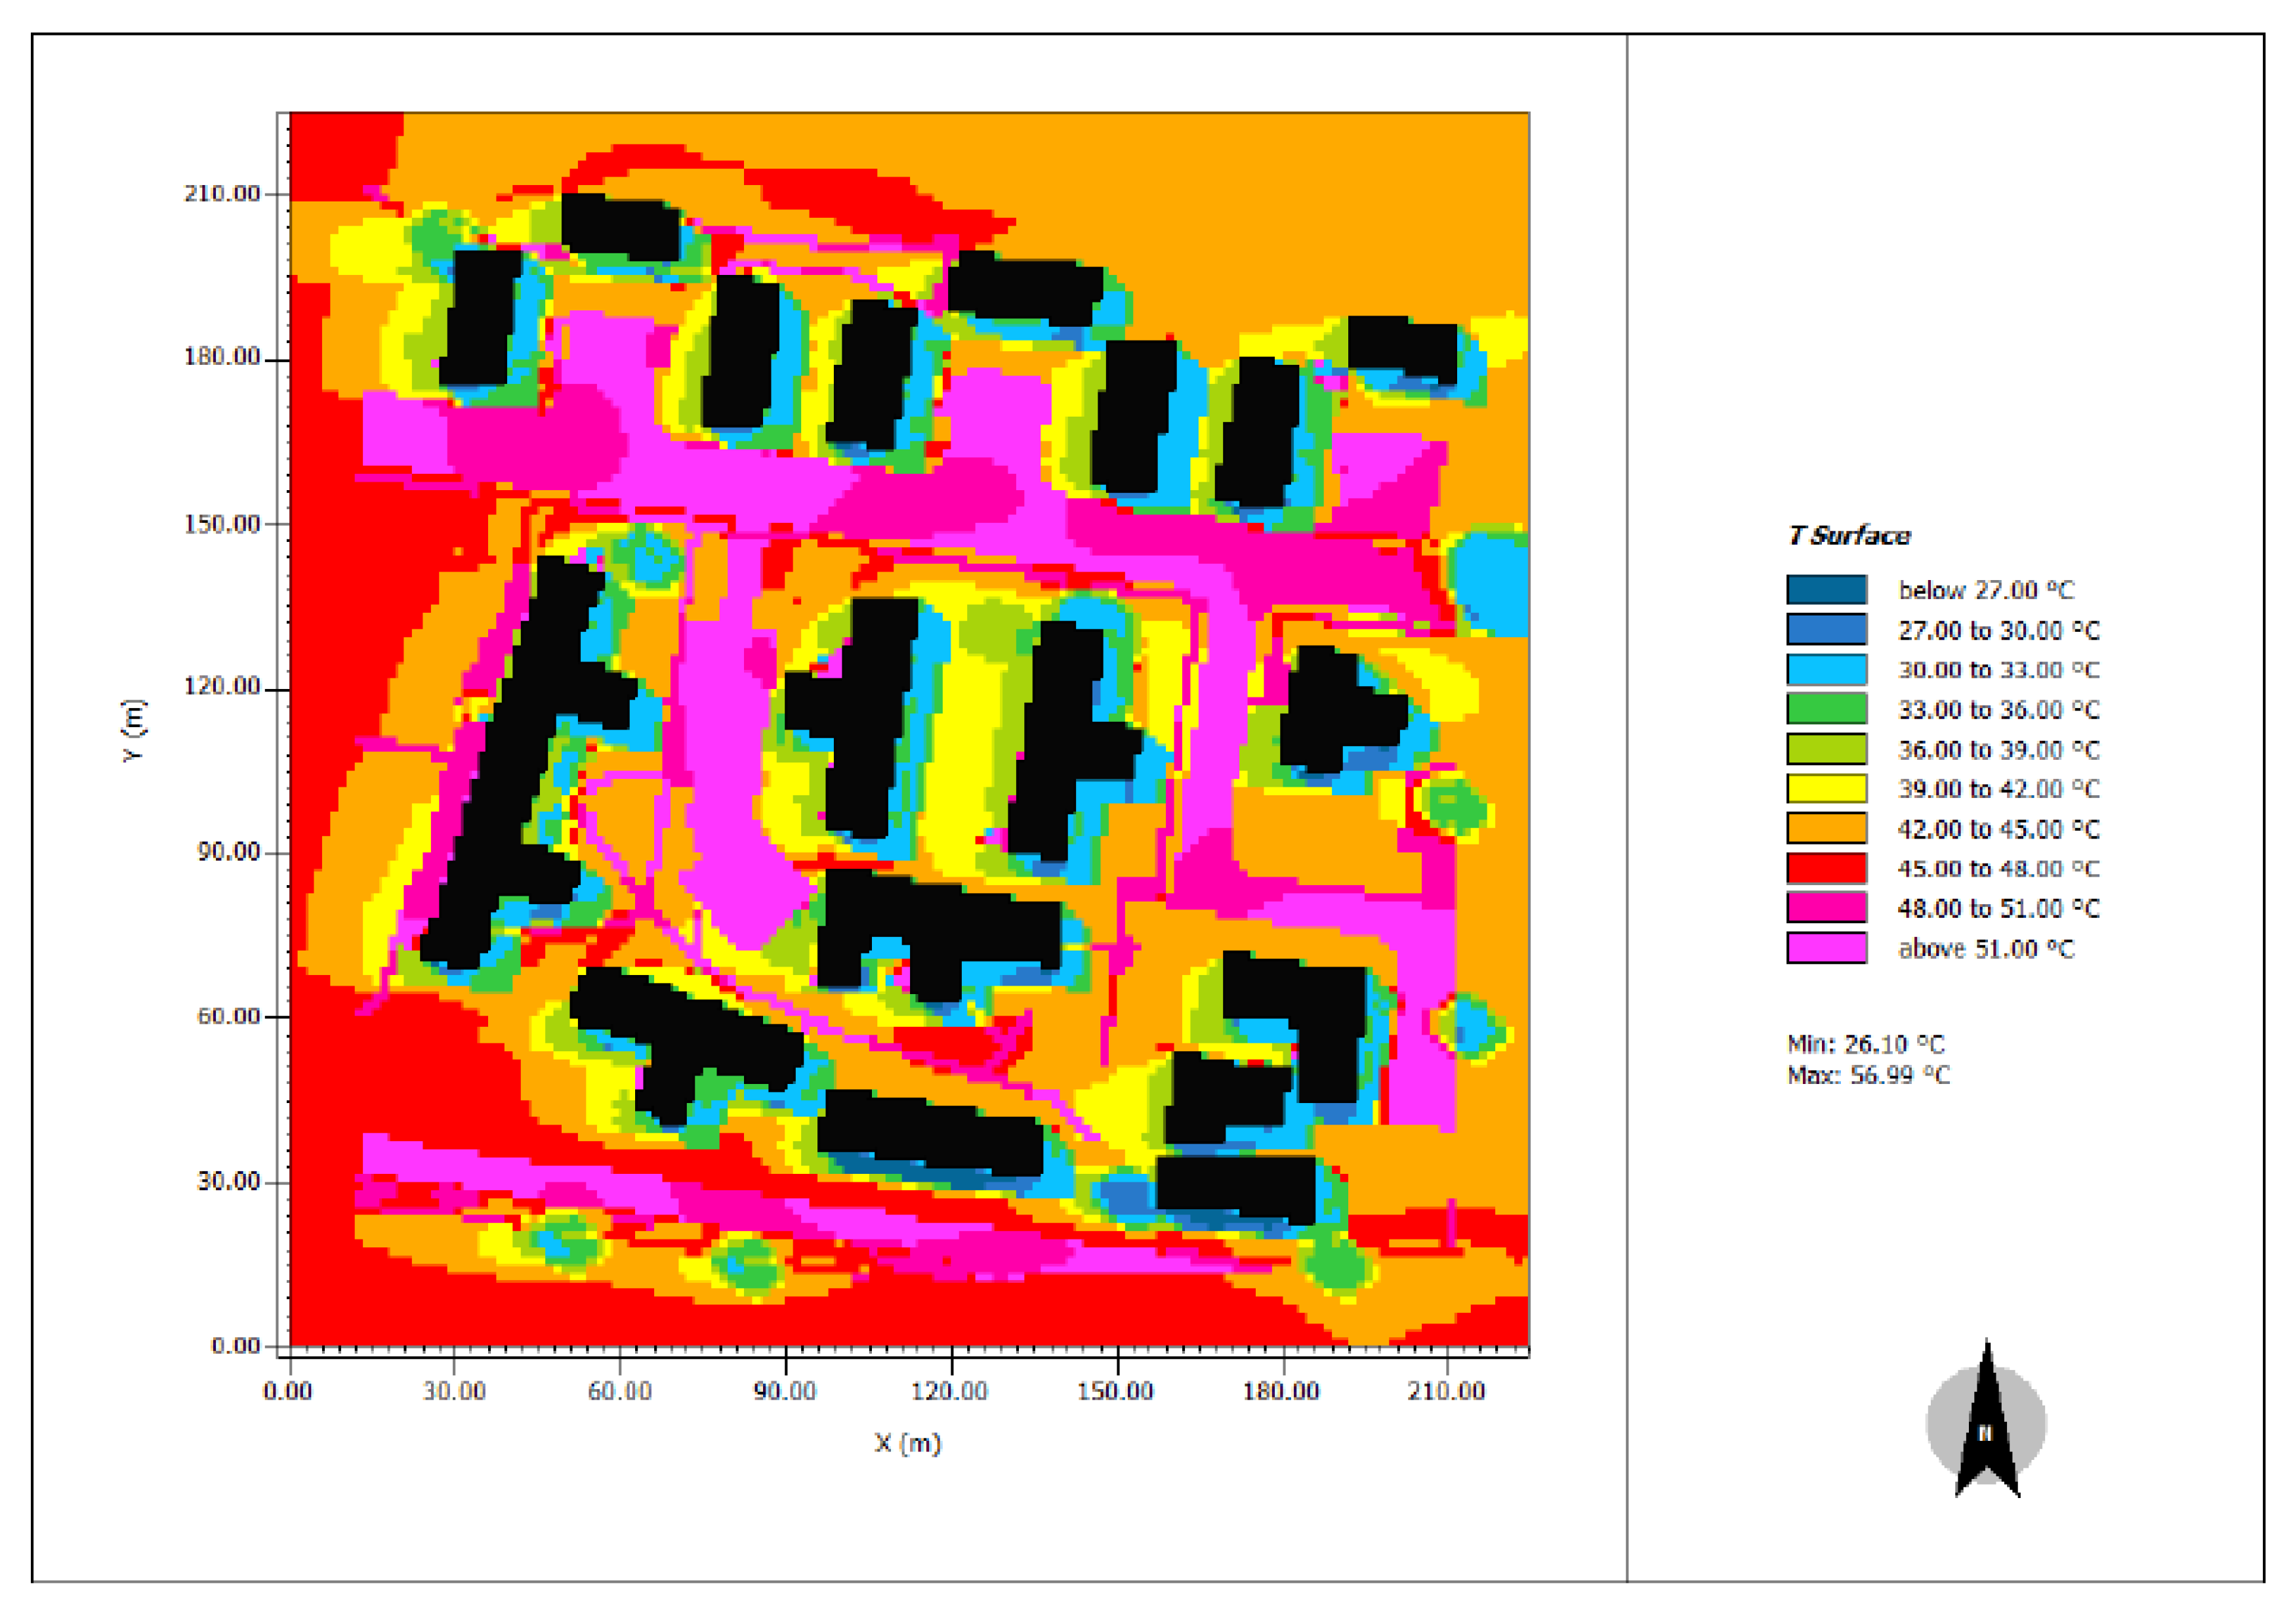
| Precinct | Air Temperature Range (°C) | Maximum Wind Speed (m/s) | Surface Temperature Range (°C) | UTCI Range (°C) |
|---|---|---|---|---|
| CT1 | 31.9–35.3 | 2 | 26.6–57.8 | 35.0–43.6 |
| CT2 | 31.8–34.9 | 2.8 | 25.8–55.9 | 34.6–43.2 |
| CT3 | 31.7–35.3 | 2.3 | 27.4–57.0 | 34.5–43.7 |
| CT4 | 32.2–35.6 | 3.2 | 27.7–57.0 | 34.5–43.8 |
| CT5 | 32.0–35.0 | 4 | 26.1–56.3 | 33.8–43.4 |
| CT6 | 31.0–34.6 | 3.4 | 24.4–55.6 | 31.9–41.5 |
| CT7 | 31.5–34.4 | 5.1 | 24.5–55.4 | 30.9–41.5 |
| OT1 | 32.1–34.7 | 1.8 | 25.5–56.2 | 35.2–43.4 |
| OT2 | 31.9– 35.2 | 2.1 | 26.1–57.0 | 34.4–43.5 |
| OT3 | 31.9–35.2 | 2.4 | 26.0–58.4 | 34.1–44.0 |
| OT4 | 32.2–34.6 | 2.3 | 24.3–56.6 | 34.9–43.5 |
| OT5 | 31.6–34.8 | 3.7 | 25.9–57.1 | 34.0–43.0 |
| OT6 | 32.3–34.7 | 3.4 | 25.4–56.6 | 32.9–42.9 |
| OT7 | 31.9–34.9 | 4.1 | 25.5–56.8 | 32.9–42.6 |
| Ambient Temperature Statistical Results (°C) | Percentiles | |||||||||||
|---|---|---|---|---|---|---|---|---|---|---|---|---|
| Layout | TMax 1 | TMin 1 | Mean | Median | Std. | TMax 2 | TMin 2 | 25 | 50 | 75 | 90 | 95 |
| OT1 | 33 | 27.9 | 31 | 30.6 | 0.9 | 33 | 26.3 | 30.3 | 30.6 | 31.8 | 32.4 | 32.5 |
| OT2 | 32.2 | 28.5 | 30.4 | 30.3 | 0.8 | 32.5 | 25.1 | 29.9 | 30.3 | 30.8 | 31.4 | 31.8 |
| OT3 | 32.7 | 27.7 | 30.8 | 30.8 | 1 | 32.7 | 24.8 | 30 | 30.8 | 31.5 | 32.1 | 32.4 |
| OT4 | 32.7 | 29.8 | 31.3 | 31.3 | 0.9 | 32.9 | 22.1 | 30.9 | 31.3 | 31.6 | 32.4 | 32.6 |
| OT5 | 32.9 | 28.8 | 31.1 | 31 | 0.8 | 32.9 | 26.6 | 30.5 | 31 | 31.7 | 32.3 | 32.6 |
| OT6 | 32.7 | 27.7 | 30.2 | 30.5 | 1.7 | 32.7 | 18.6 | 29.7 | 30.5 | 31.1 | 31.8 | 32 |
| OT7 | 33 | 29.2 | 31.2 | 31.1 | 0.8 | 33.1 | 26.3 | 30.7 | 31.1 | 31.6 | 32.2 | 32.5 |
| CT1 | 33.4 | 28.4 | 31.1 | 30.8 | 1 | 33.4 | 25.8 | 30.4 | 30.8 | 31.8 | 32.7 | 32.8 |
| CT2 | 33 | 28 | 31.2 | 31.2 | 1 | 33 | 25.7 | 30.5 | 31.2 | 32.1 | 32.5 | 32.6 |
| CT3 | 32.9 | 27.9 | 31 | 30.7 | 0.9 | 32.9 | 27.1 | 30.2 | 30.7 | 31.8 | 32.4 | 32.7 |
| CT4 | 33.2 | 29.3 | 31.4 | 31.3 | 0.8 | 33.2 | 26.3 | 30.9 | 31.3 | 32 | 32.5 | 32.7 |
| CT5 | 33.2 | 28.3 | 31.5 | 31.3 | 1 | 33.2 | 27.2 | 30.7 | 31.3 | 32.3 | 32.8 | 33 |
| CT6 | 32.7 | 27.5 | 30.4 | 30.2 | 1 | 32.7 | 24.5 | 29.7 | 30.2 | 31.1 | 31.8 | 32 |
| CT7 | 32.4 | 28.2 | 30.4 | 30.2 | 0.8 | 32.4 | 27.1 | 29.8 | 30.2 | 31 | 31.6 | 31.9 |
| CT1 | CT2 | CT3 | CT4 | CT5 | CT6 | CT7 | OT1 | OT2 | OT3 | OT4 | OT5 | OT6 | OT7 | |
|---|---|---|---|---|---|---|---|---|---|---|---|---|---|---|
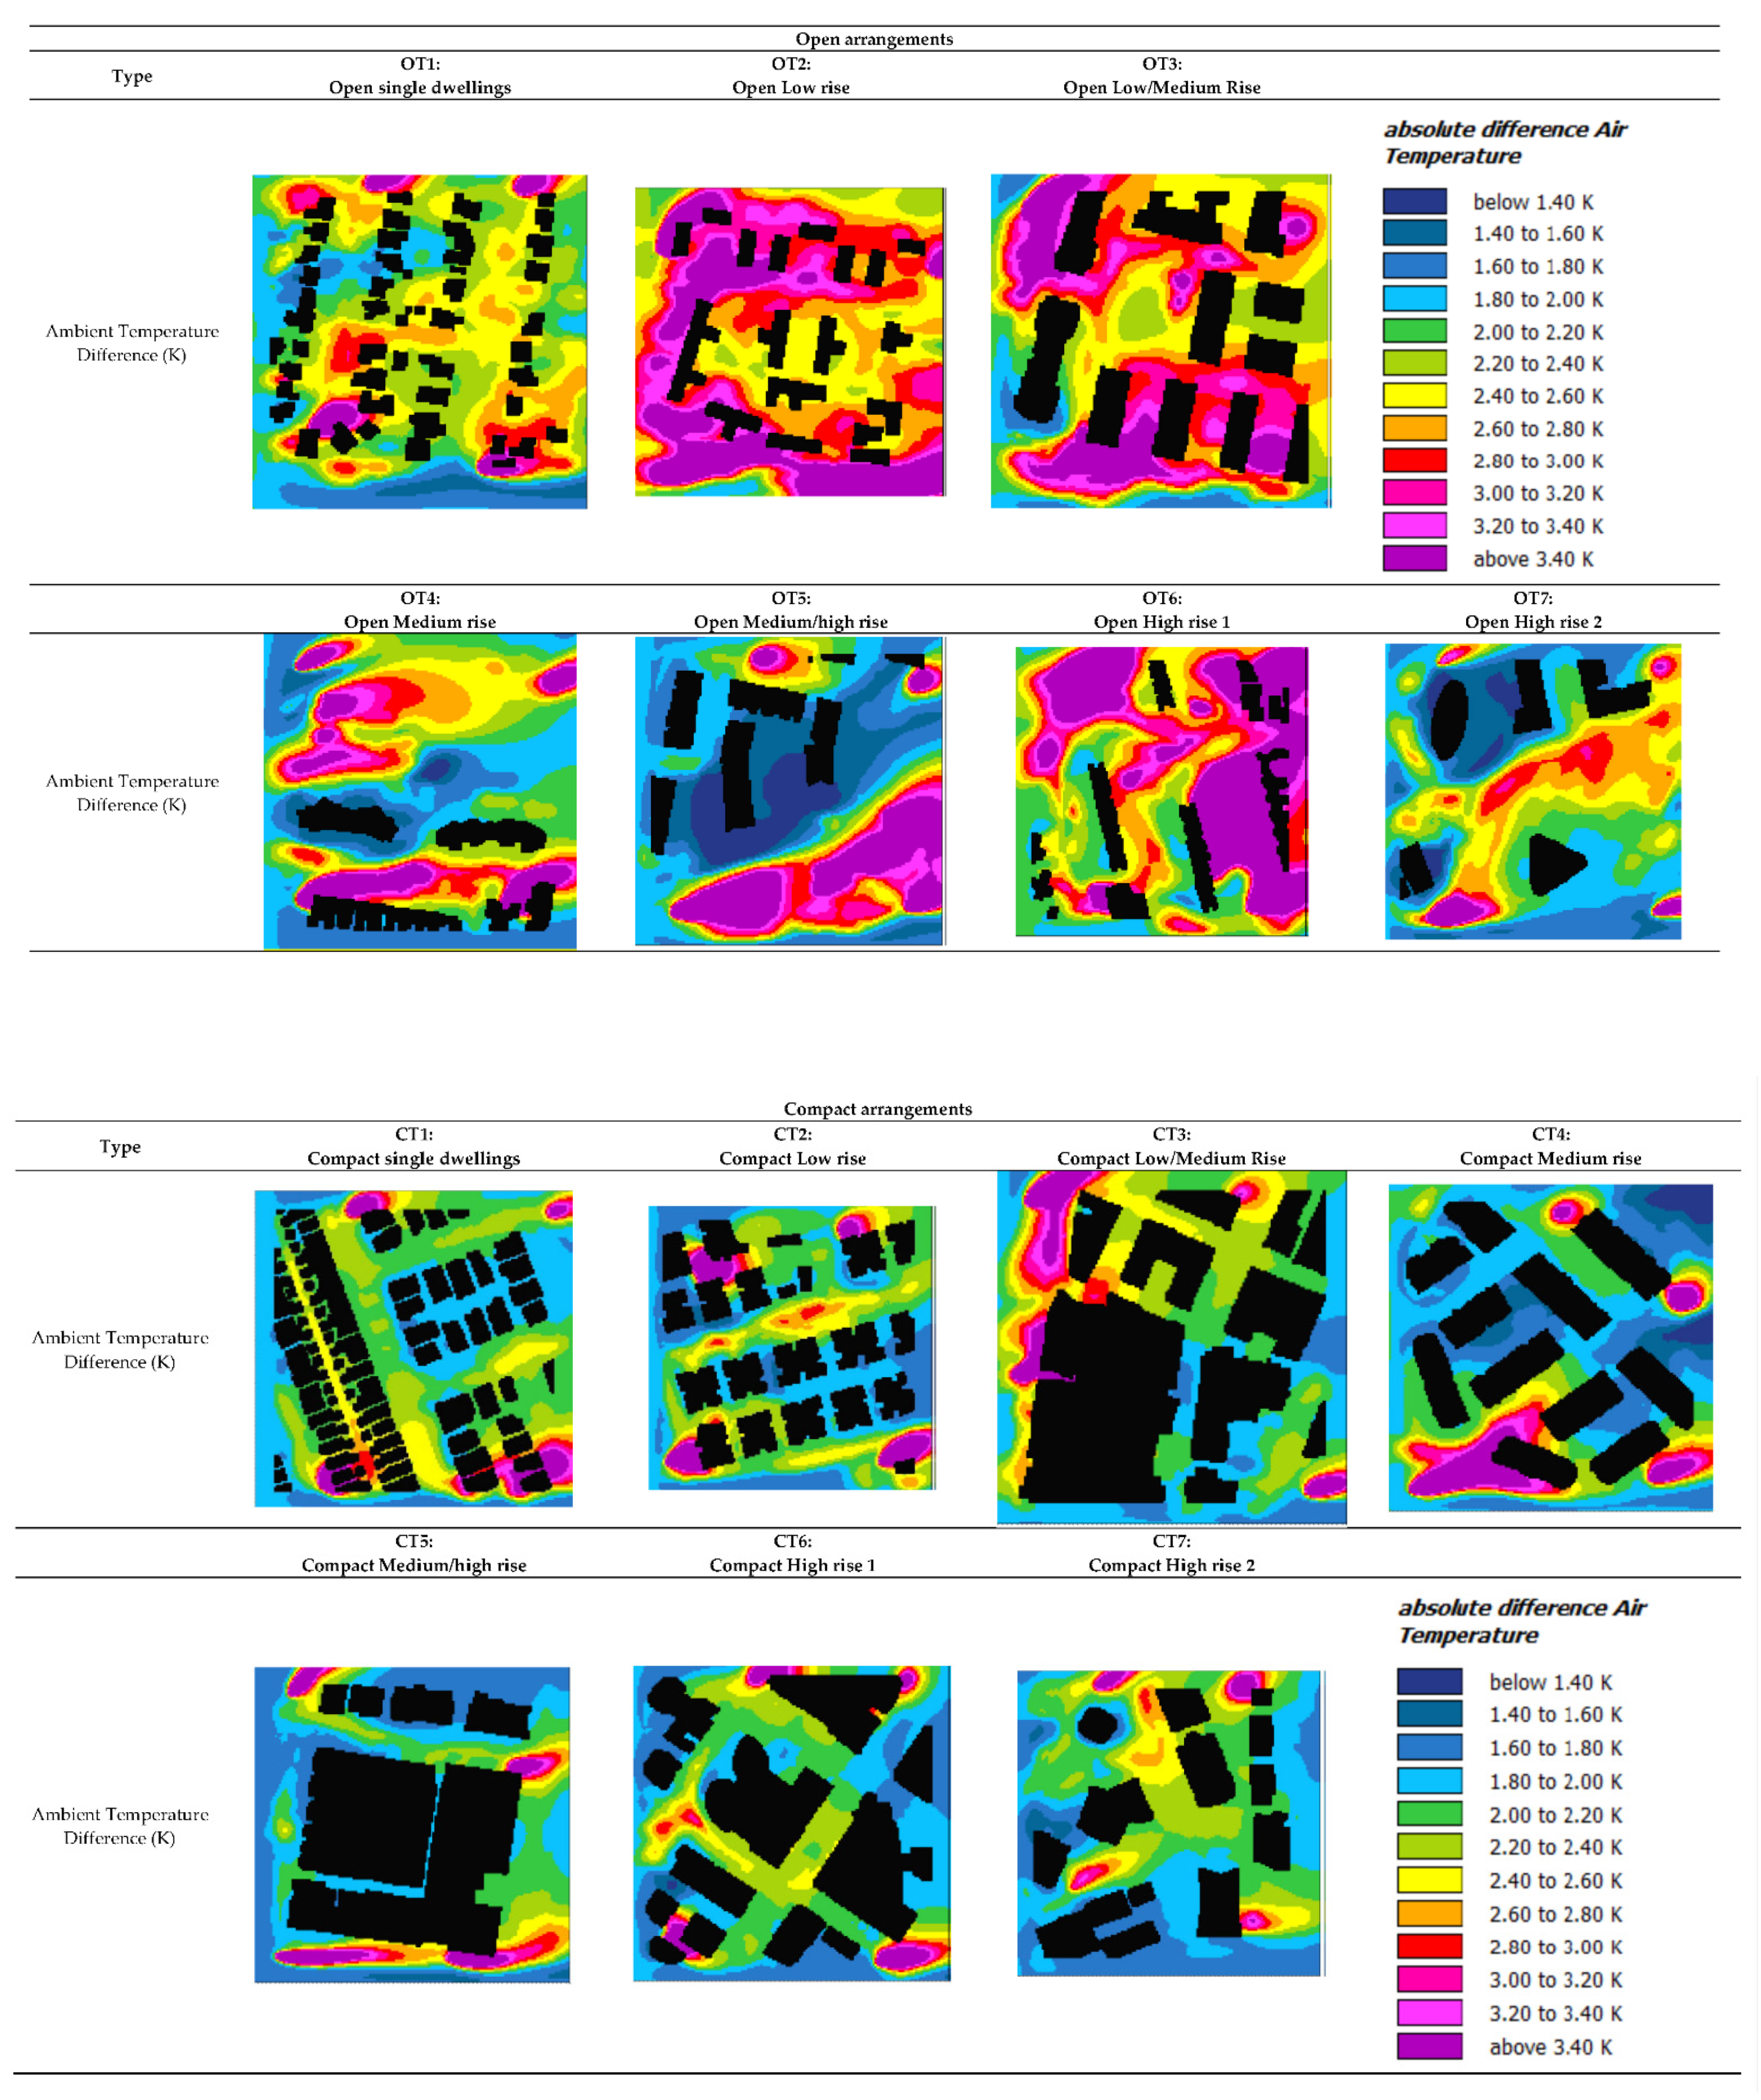
| Mean | 2.20 | 2.22 | 2.32 | 2.14 | 2.13 | 2.13 | 2.09 | 2.33 | 3.04 | 2.78 | 2.39 | 2.27 | 3.26 | 2.16 |
| Std. | 0.48 | 0.69 | 0.63 | 0.70 | 0.61 | 0.52 | 0.37 | 0.51 | 0.68 | 0.73 | 0.90 | 0.89 | 1.49 | 0.56 |
| Minimum | 1.42 | 1.41 | 1.64 | 1.10 | 1.57 | 1.37 | 1.54 | 1.48 | 1.88 | 1.62 | 1.21 | 0.93 | 1.69 | 0.81 |
| Maximum | 8.18 | 8.17 | 7.59 | 6.84 | 7.25 | 7.74 | 5.20 | 7.33 | 8.76 | 9.59 | 11.98 | 7.70 | 14.50 | 7.35 |
| Mitigated GTD across the Precincts (K/100 m) | ||||||
|---|---|---|---|---|---|---|
| 1.1 | 0.95 | 0.90 | 0.87 | 0.84 | 0.84 | 0.83 |
| CT1 | OT6 | OT1 | OT3 | CT6 | OT2 | CT2 |
| 0.80 | 0.77 | 0.70 | 0.68 | 0.58 | 0.42 | 0.4 |
| OT4 | CT3 | OT5 | CT4 | CT5 | CT7 | OT7 |
| Unmitigated GTD across the Precincts (K/100 m) | ||||||
| 0.93 | 0.82 | 0.79 | 0.75 | 0.73 | 0.73 | 0.70 |
| CT1 | OT3 | CT2 | CT6 | CT3 | OT1 | OT6 |
| 0.69 | 0.66 | 0.60 | 0.53 | 0.50 | 0.30 | 0.24 |
| OT2 | CT4 | OT4 | OT5 | CT5 | CT7 | OT7 |
Publisher’s Note: MDPI stays neutral with regard to jurisdictional claims in published maps and institutional affiliations. |
© 2022 by the authors. Licensee MDPI, Basel, Switzerland. This article is an open access article distributed under the terms and conditions of the Creative Commons Attribution (CC BY) license (https://creativecommons.org/licenses/by/4.0/).
Share and Cite
Kolokotsa, D.; Lilli, K.; Gobakis, K.; Mavrigiannaki, A.; Haddad, S.; Garshasbi, S.; Mohajer, H.R.H.; Paolini, R.; Vasilakopoulou, K.; Bartesaghi, C.; et al. Analyzing the Impact of Urban Planning and Building Typologies in Urban Heat Island Mitigation. Buildings 2022, 12, 537. https://doi.org/10.3390/buildings12050537
Kolokotsa D, Lilli K, Gobakis K, Mavrigiannaki A, Haddad S, Garshasbi S, Mohajer HRH, Paolini R, Vasilakopoulou K, Bartesaghi C, et al. Analyzing the Impact of Urban Planning and Building Typologies in Urban Heat Island Mitigation. Buildings. 2022; 12(5):537. https://doi.org/10.3390/buildings12050537
Chicago/Turabian StyleKolokotsa, Dionysia, Katerina Lilli, Kostas Gobakis, Angeliki Mavrigiannaki, Shamila Haddad, Samira Garshasbi, Hamed Reza Heshmat Mohajer, Riccardo Paolini, Konstantina Vasilakopoulou, Carlos Bartesaghi, and et al. 2022. "Analyzing the Impact of Urban Planning and Building Typologies in Urban Heat Island Mitigation" Buildings 12, no. 5: 537. https://doi.org/10.3390/buildings12050537