Article

Best Fit for Common Purpose: A Multi-Stakeholder Design Optimization Methodology for Construction Management

by
Dmitry Zhilyaev
1,*,
Ruud Binnekamp
2 and
A. M. Rogier Wolfert
1
1
Faculty of Civil Engineering and Geosciences, Delft University of Technology, 2628 CN Delft, The Netherlands
2
Faculty of Architecture and the Built Environment, Delft University of Technology, 2628 BL Delft, The Netherlands
*
Author to whom correspondence should be addressed.
Buildings 2022, 12(5), 527; https://doi.org/10.3390/buildings12050527
Submission received: 24 February 2022 / Revised: 4 April 2022 / Accepted: 15 April 2022 / Published: 21 April 2022

Abstract

:
Within traditional design processes, decisions are often made based on individualistic values and late-stage assessments conducted on a predefined set of design alternatives potentially leading to suboptimal design decisions and conflicts. The issues are further amplified by the growing complexity of construction project management where an increasing number of stakeholders are involved. To address those issues, a shift is needed towards a collaborative early stage optimization-based design process. The current optimization-based design approaches are not appropriately integrating stakeholders and their preferences in the optimization process and thereby not reflecting the real-life design and construction process. In this study, we present a pioneering multi-stakeholder design methodology combining preference function modeling theory and a priori optimization enabling stakeholders to find the group-optimal design fairly representing their preferences. The application of the developed methodology is demonstrated on a real-life multi-storey building design case. The study provides a novel approach for managing design and construction projects for academic and industry stakeholders. It also sets the foundation for the further development of stakeholder-oriented optimization-based design.

1. Introduction

The global challenges caused by global warming, rapid urbanization, economic instability, and the ever-reducing affordability of housing call for rethinking and improvement of the ways we design and construct new buildings and renovate the existing ones. Aiming to answer this call, the research agenda of “better buildings” has been expanding rapidly over the last several decades, resulting in the development of multiple research domains and themes such as green buildings [1,2,3,4], low- and zero-carbon buildings [5,6,7,8], passive buildings [9,10], sustainable buildings [11,12], circular buildings [13,14], resilient buildings [15,16], smart buildings [17,18], and healthy buildings [19,20]. Some of the themes have made their way to statutes, building codes, standards, and certification schemes and certain ideas have been adopted by practitioners but there is still a very long way to go if we want to meet present and future challenges.
Moving towards practical implementation of “better construction” will have a major effect on the way construction projects are being developed. The project development and design processes in the construction industry are still often disconnected and based on individualistic principles where each involved party seeks to maximize their own local gains and optimize their own part of the project development chain, which can result in suboptimal performance on the project level [21,22]. With the increasing complexity of the projects and a greater number of internal and external stakeholders and perspectives involved, it will become harder to come to a consensus and that, as a consequence, could result in conflicts, project delays, and expanding project costs [4,23,24,25,26]. Moving forward, the process will need to become more integrated, streamlined, and actively involve multiple stakeholders at all the stages of project development, starting from the earliest ones [21,25,27,28].
Further, effective implementation of “better construction” will not be possible without a shift away from the currently prevailing assessment-based project development approach. Assessments play an important role in the construction sector but, in their current form, they cannot ensure the optimality of the final design. For example, LCA is a well-developed and standardized assessment method that sees ever-increasing adaptation by the construction sector. In the Netherlands and France, it is now mandatory to conduct an LCA for all new construction projects [29]. However, it relies on comprehensive and detailed data that are often not available in the early stages of project development. Thus, LCAs (and other assessments) are often conducted in the late stages of project development when it is hard or not even possible to change the final design [30]. In addition, assessments often imply that the choice is made among a set of predefined alternatives, but this approach cannot guarantee that there is no superior design option that was for some reason not included in the assessment.
The shift from assessment-based methods to optimization-based ones promises a number of major benefits. It can enable stakeholders’ collaboration from the early stages of the project’s development, help in finding a consensus, ensure that the stakeholder’s preferences (here and in the following text we use the term “preference” to define the expected value (economic, environmental, social, aesthetic, or any other) of the object designed for a stakeholder in an a priori optimization-based design process) are reflected in the final design, speed up the project’s development and delivery, and, ultimately, provide a higher value for stakeholders involved. Not surprisingly, this area has received a lot of attention in recent years; e.g., refs. [31,32] provided a review of algorithms and tools used in building design optimization, ref. [33] developed a review of simulation-based optimization methods with a focus on the challenges that the field is facing, and [34] reviewed the energy-efficiency optimization of buildings from the perspective of architects.
As pointed out above, the number of studies on optimization in building design is quite large. Nevertheless, there are still some issues that have not been addressed and there is space for improvement. Most of the studies on building design optimization that can be found in the literature focus on the technical aspect of the process, ignoring the stakeholders’ involvement component and the group dynamics of the real-world design process. Those studies are predominantly based on a posteriori approaches and the construction of Pareto frontiers for multiple conflicting objectives (e.g., [31,35,36,37,38]). In such approaches, stakeholders are mostly seen as taking part at the end of the optimization process and selecting an alternative from the Pareto frontier or are not even considered at all. However, in real-world design processes, stakeholders are an essential part of the process and if we want to fairly model a group decision-making process, the result of the optimization should respect their preferences. Further, while a posteriori approaches have their advantages, they imply that stakeholders and their preferences come at the end of the optimization process. In contrast, the real-world design process starts from stakeholders and their preferences and it is, thus, inherently an a priori preferences-first process. In addition, a posteriori optimizations can become very complex and hard for stakeholders to understand as the number of objectives increases. Those approaches are also generally very computationally demanding and slow as they rely on the calculation of multiple optimal solutions (and there can be hundreds or thousands) and each solution requires a separate optimization run [39].
Some studies have coupled a posteriori optimization and a Pareto frontier search with a consequent selection of the final solution utilizing multi-criteria decision-making methods (MCDMs) (see, e.g., [40,41,42,43]). While those approaches are a logical extension of pure a posteriori optimization and make the decision-making process easier for stakeholders, they are still not without issues. The whole process becomes even more resource-demanding and complex as, in addition to the generation of multiple solutions, an MCDM process needs to take place. Making on-the-fly changes to the problem configuration (e.g., adding another objective) in such systems is hard and time-consuming as it would require a full recalculation of Pareto frontiers and re-evaluation of the consecutive MCDM process.
When it comes to a priori approaches where stakeholders provide their preferences up front and separate objectives are aggregated into one with a consequent single-objective optimization run, only a few studies can be found that apply it to building design optimization and decision-making [44,45,46]. Yet, those studies only consider objectives’ weights as a form of representing stakeholders’ preferences. In real-world scenarios, however, stakeholders also have some wishes and preferences regarding the numerical values of objectives they are willing to achieve but those considerations are not taken into account. For example, if a stakeholder wants to maximize the profit, they also normally have some expectations for the profit level they are targeting, the level that is below the target but still deemed to be acceptable, and the level that is not acceptable.
A priori approaches are sometimes criticized for their inability to illustrate the trade-offs between objectives in a way that a Pareto frontier can. However, making the a priori process iterative or adding a sensitivity analysis can help to resolve this. In particular, through an iterative approach stakeholders can learn how their inputs and changes are impacting the optimum and provide a similar illustration of the underlying trade-offs and interplays between the objectives. In addition, a priori approaches are more stakeholder-oriented, faster, and easier to understand. They are also sufficiently more flexible when it comes to making changes to the optimization problem configuration. Due to these qualities, their application can make the design process more dynamic and flexible and foster collaboration.
Another general shortcoming of most of the studies on building design optimization and decision-making is in their approach to measuring and modeling stakeholders’ preferences for multiple objectives. As mentioned before, in building design optimization studies, stakeholders’ preferences at best are provided in the form of objectives’ weights. A notable exception to this is a series of studies by Geyer [47,48,49] that utilized preference functions (or utility functions, as they are called by the author) to describe the variation in the desirability of different numerical values of objectives for stakeholders. However, those studies are still reliant on the building of Pareto frontiers with the associated downsides already mentioned above. When it comes to studies utilizing MCDMs, most are based on methods (with the most common being analytic hierarchy process (AHP) [50,51]) that, as was shown by Barzilai in [52], do not measure and aggregate preferences in a mathematically correct way and utilize the operations of addition and multiplication on scales where those operations are not defined. Barzilai has also proposed an alternative theory for preference modeling that overcomes the shortcomings of the existing methods, the preference function theory (PFM) [52]. Binnekamp [53] has made the first step in applying this theory within the built environment domain. However, this work only presented an initial proof of concept and not an operational optimization-based design methodology that can be applied to real-world projects.
To address the abovementioned issues, this work aims to answer the following questions:
  • How can early stage design optimization be implemented?
  • How can we ensure that the design optimization properly reflects the real-world design and construction processes?
  • How can we better involve stakeholders in the design optimization process?
  • How should stakeholders’ preferences be measured and used within the optimization?
  • How can optimization and stakeholder-driven design be integrated within a decision-making tool for construction management?
To answer these questions and fill the existing gaps, this paper focuses on the main objective of developing a novel methodology for integrated stakeholder-oriented building design optimization that is based on an iterative a priori approach for finding the best-fitting design solution. The methodology is operationalized by means of a multi-criteria design optimization and decision-making tool that:
  • Reflects the real-world project design and construction process where stakeholders play an essential role;
  • Automates the decision-making process within building design and construction;
  • Uses a mathematically correct way of preference modeling by utilizing the PFM theory;
  • Is not computationally demanding, intuitive in use, and adaptive to changing stakeholders’ demands;
  • Can be applied to the early stages of design and construction development.
Tied to the main objective, this work also addresses the two ancillary objectives of applying the proposed methodology and the tool developed to a demonstrator case of early stage multi-storey building design optimization and outlining the directions for the further development of stakeholder-oriented optimization-based design.

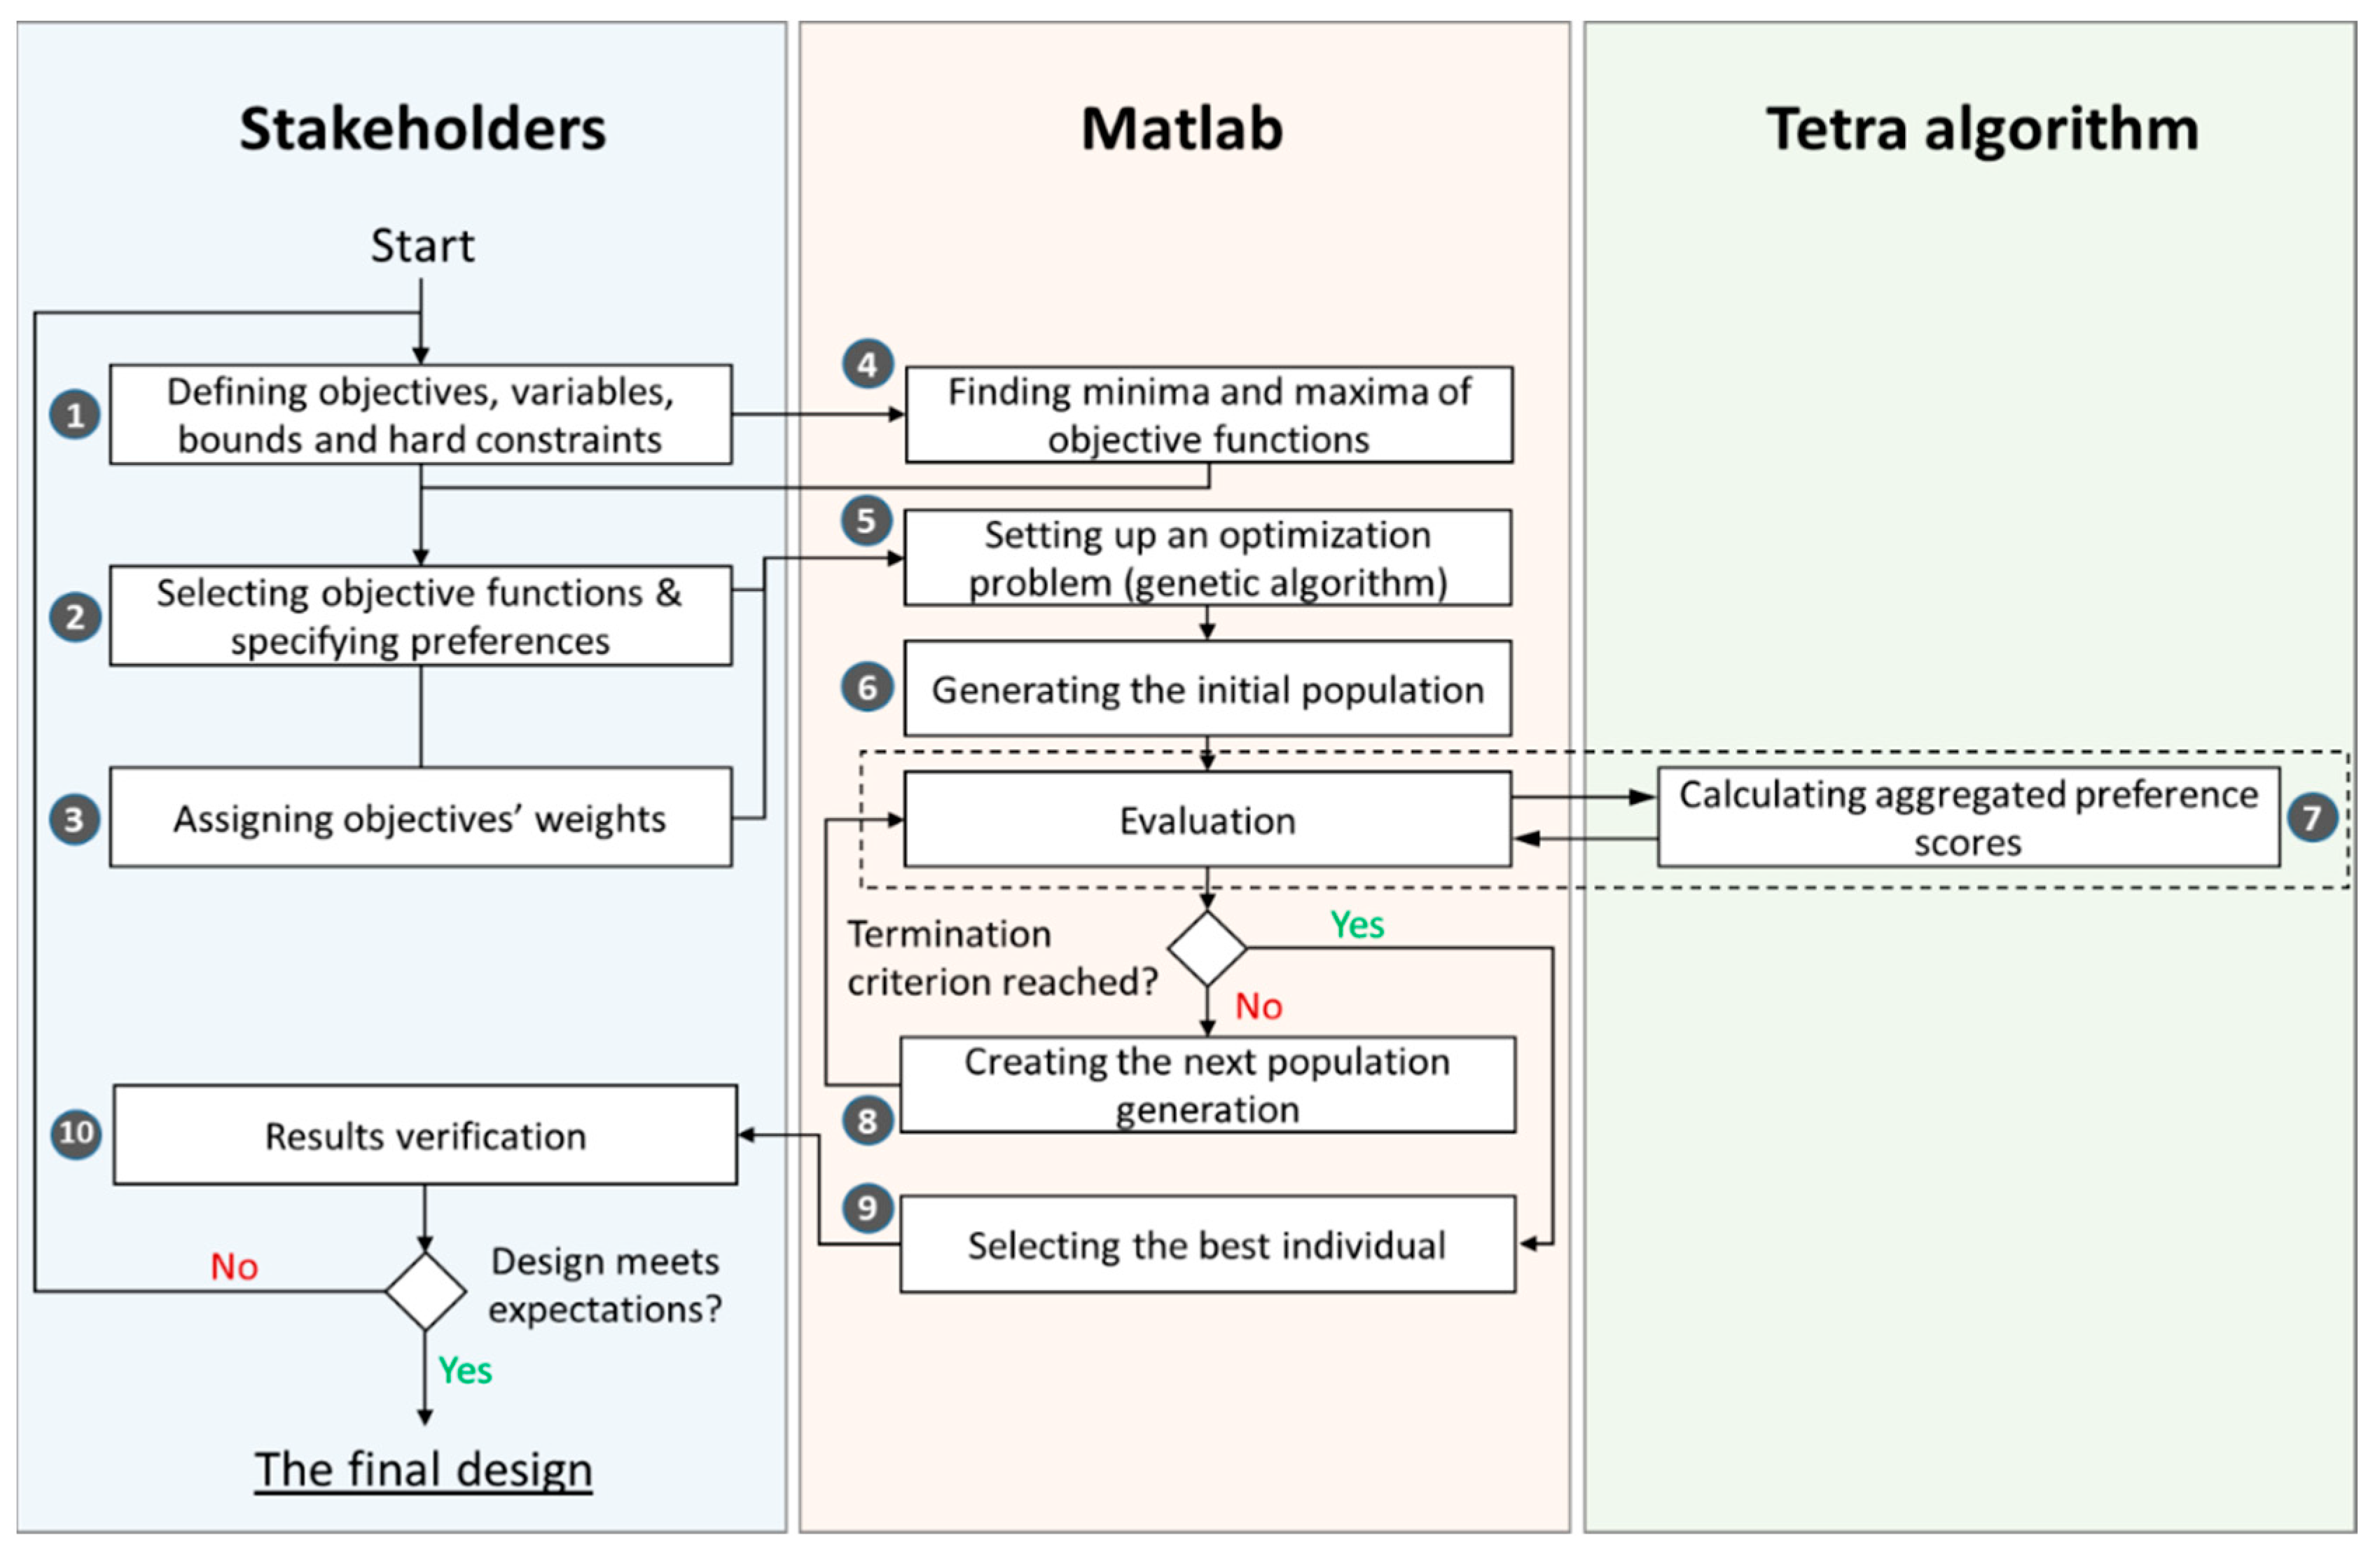
2. Materials and Methods

This section describes the developed methodology step-by-step and Figure 1 shows the overall flowchart of the methodology. The numbers in the figure refer to the steps below.
Step 1. Defining the design problem
Our method starts with stakeholders, who provide the necessary information to set up the design problem. They start by defining design variables (defined by a vector x = ( x 1 , x 2 , x N ) ) that represent the design parameters that can be varied; the bounds of the design variables ( l b i x i u b i ,   i = 1 N ) that provide the interval in which the design variables can change; objectives ( f 1 ( x ) ,   f 2 ( x ) , f M ( x ) ) that quantify the performance of the design across different domains (economic, environmental, social, functional, aesthetic, and so on); inequality constraints ( g j ( x ) 0 , j = 1 , 2 , J ); and equality constraints ( h k ( x ) = 0 , k = 1 , 2 , K ) .
Step 2. Finding the minima and maxima of the objective functions
At the next step, we run multiple optimizations (the total number of which is equal to 2 M ) in Matlab to find the minima and maxima of the objective functions given the data on design variables, bounds, and constraints. The optimization problems are defined as follows:
min x   f m ( x ) ,           m = 1 , 2 , M
min x f m ( x ) ,           m = 1 , 2 , M
subject to
g j ( x ) 0 ,           j = 1 ,   2 , , J
h k ( x ) = 0 ,           k = 1 ,   2 , , K
l b i x i u b i ,           i = 1 ,   2 , ,   N
For compactness, linear and nonlinear constraints are grouped together: g j ( x ) includes both linear and nonlinear inequality constraints and h k ( x ) includes both linear and nonlinear equality constraints. The algorithm used in the optimizations is selected based on the objective functions on hand.
Step 3. Defining preferences
As was mentioned in the Introduction section, the studies that are currently available in the literature either do not utilize preferences at all (e.g., in most a posteriori studies based on building a Pareto frontier), utilize them only partially (e.g., only use objectives’ weights as stakeholders’ inputs), or rely on preference modeling approaches that were shown to have issues when it comes to the mathematical foundations. For example, in the case of one of the most commonly used decision-making methods—analytic hierarchy process (AHP)—the preference is measured by defining the ratio p 1 / p 2 , where p 1 and p 2 are preferences for two alternatives. However, as Barzilai argues in [52], such a ratio is not well defined as a ratio is not defined for two time values or potential energies.
The design optimization methodology proposed in this study is based on the PFM theory proposed by Barzilai [52]. Instead of commonly used utility and ratio scales, the method relies on measuring preferences on affine scales, thus making the mathematical operations possible. The affine scale is defined as:
k = p 1 p 2 p 3 p 4
where p 1 , p 2 , p 3 ,   p 4 are four preference points on an affine scale defined by the scalar value k . The number of points needed to define the scale can be reduced to three (in this case, k = p 1 p 2 p 2 p 3   ) but not less than that. By measuring preferences in this way, we avoid issues related to the selection of the unit and the absolute zero of measurement that are inherent in other methods commonly used in the literature. This enables us to use preferences as a part of the design optimization and group decision-making process. In this paper there is no room for an extensive description to the fundamentals of PFM theory and only the necessary high-level findings are incorporated. For further details the reader is referred to Barzilai [52].
In our method, the elicitation of preferences is implemented in a visual manner. In accordance with the PFM methodology, preferences are measured on a preference scale that ranges from 0 to 100. For each of the objectives, a stakeholder needs to provide three points that represent the worst possible case (measured at 0 on the preference scale), the best possible case (measured at 100 on the preference scale), and a point in-between. In order to simplify the task for the stakeholders, we calculate the minima and maxima of each of the objective functions (see the previous step) and select those as the worst and the best cases. Then, stakeholders need to provide only a single in-between point. However, there might be cases where a stakeholder disagrees with the predefined best and worst options. In this case, the values can be over-ridden and the stakeholder can indicate their own values for the best and worst options. Currently, we are working with three preference points. However, within a satellite research project, we are also conducting experiments with real-world stakeholders to determine the optimal way of collecting preference information. If the current three-point method is found to not be flexible enough, we could provide stakeholders with the possibility of selecting more points.
When three points are provided, we can build a curve that passes through them—a so-called preference curve. The mathematical representation of a preference curve is referred to as the preference function. In order to fit a curve passing through three points, we use the Piecewise Cubic Hermite Interpolating Polynomial (PCHIP). Compared with the standard cubic spline, the PCHIP eliminates overshoots (the fitted curve never goes above the highest point), which is an important quality when dealing with preferences that should be mapped on a fixed interval. Figure 2 shows an illustration of a preference curve building on a hypothetical example of a construction costs objective.
By means of preference functions ( p 1 ( f 1 ) , p 2 ( f 2 ) , ,   p M ( f M ) ), we convert our problem into the preference form where the ultimate goal is to maximize the aggregated preference score. Our objectives can, thus, be rewritten as:
f 1 * ( x ) = p 1 ( f 1 ( x ) ) ,   f 2 * ( x ) = p 2 ( f 2 ( x ) ) , ,   f M * ( x ) = p N ( f N ( x ) )
All objectives are now measured on the preference scale, thus avoiding the issues arising from the difference in the unit of measurement between the objectives.
Step 4. Specifying weights
Stakeholders provide weights ( w 1 , w 2 , , w M ) for each of the objectives. The weights should give 1 in sum. Within a collaborative design process, one might expect the weights to be spread among the objectives. However, in some cases, there might be a single stakeholder whose preferences dominate the rest of the stakeholders (e.g., the investor). In this case, most or even all of the weight can be put towards this stakeholder and the problem will turn into a single-stakeholder one. The resulting design solution will be the one that satisfies the preferences of this single stakeholder.
Step 5. Setting up the optimization problem
The design variables, their bounds, the objectives, and the constraints are now fed into Matlab and the optimization problem is set up. Various algorithms and approaches can be utilized at this step. We use a genetic algorithm (GA) as it can handle complex nonlinear mixed-integer optimization problems.
Step 6. Initial population generation
Based on the input data, the GA generates the initial population where each member of the population represents a possible design solution. For each member, we calculate the values of the objective functions in the preference form (measured on the preference scale).
Step 7. Preference aggregation and evaluation
Now, when we have preference scores for each of the objectives for all members of the population, we need to aggregate those preferences into a final score that best reflects all the individual values. This aggregated preference score is used as the final optimization objective that the GA is trying to maximize. A straightforward and commonly accepted approach for aggregating preferences is to use the weighted mean of the individual preferences. However, this is not correct as the operations of addition and multiplication are not defined on this scale (see the information on the measurement of preferences above). Instead, aggregation should be done within the affine space to synthesize an overall preference score that provides the “best” fit of all weighted (relative) scores for all the stakeholders’ objectives. In other words, the correct way of aggregating preference scores is based on finding the aggregated preference that minimizes the least-squares difference between this overall preference and each of the individual scores in the affine space (Barzilai [52]).
Therefore, our final optimization problem can be rewritten as:
min x P * ( f 1 * ( x ) , f 2 * ( x ) , , f M * ( x ) , w 1 , w 2 , , w M )
subject to
g j ( x ) 0 ,           j = 1 ,   2 , , J
h k ( x ) = 0 ,           k = 1 ,   2 , , K
l b i x i u b i   ,           i = 1 ,   2 , ,   N
where P * is the aggregated preference score calculated using the PFM theory.
The synthesis of the aggregated preference using the PFM theory was implemented as a solver inside of the software tool called Tetra [54]. Tetra is a standalone multi-criteria decision-making program that enables the selection of the best alternative for both single- and multi-stakeholder cases. However, since Tetra was originally developed as a tool for decision-making, it relies on stakeholders providing a list of possible alternatives to select from and, thus, is not well-suited for use in optimization problems where the alternatives are generated and not predefined. To overcome this, instead of the desktop version, we use a web version of Tetra ver. 3.5.1. It runs on a server and accepts data (preference scores and weights) in a special format based on XML. The calculations take place on the server and the results are provided as an XML file. In our case, the resulting file contains the aggregated preference scores for each member of the population. Tetra, thus, plays the role of an external objective function connected to the GA in Matlab.
The results are then evaluated by the GA and the algorithm checks the termination criteria. If none are satisfied, it proceeds to the next generation (Step 8). If a termination criterion is satisfied, we proceed to Step 9.
Step 8. Next generation
The GA obtains the next generation of the population by the means of survival, mutation, and crossover and iterates through Step 7.
Step 9. Selecting the best individual
When a termination criterion is satisfied, the GA selects the best individual from the population. The best individual is a representation of the optimal design solution.
Step 10. Results verification
The solution is then presented to stakeholders. If the result satisfies the stakeholders and no changes to the problem configuration are necessary, it is selected as the final design. Otherwise, the stakeholders can decide to change some parameters of the design problem or modify their inputs. For example, they might want to modify their preferences or objective weights or bring more stakeholders to the table. In that case, the process returns to the beginning and starts again.
After each iteration, the stakeholders can compare the optimal designs from each run between each other. Through that, they can obtain an understanding of how their actions are influencing the result. This can help to uncover bottlenecks and have an educational effect. The process stops when the stakeholders agree that no more changes are required.

3. Demonstrator Case

3.1. Description of the Demonstrator Case Building

The demonstrator case was developed in cooperation with Heijmans (Rosmalen, the Netherlands), one of the largest design and construction contractors in the Netherlands. The selected case aims to demonstrate the application of the methodology described above and is applied to the early design stage of non-residential multi-storey building development.
The demonstrator case is based on Autodesk Revit models provided by Heijmans. As our case is concerned specifically with the early stages of project development, the building models only included three of six shearing layers: Site, Structure, and Skin (in accordance with the classification by Stewart Brand [55]). The original models were not parametrized and had a fixed gross floor area (1000 m2) and number of floors (5). In total, three complete building models were shared with us, each characterized by different sets of materials used for the façade and the structural elements:
  • A concrete frame and brick façade with Rockwool insulation;
  • A structural steel profile frame and hollow concrete slabs with a steel sandwich panel façade with polyisocyanurate insulation;
  • A cross-laminated timber frame with a wooden joist floor and a timber frame façade with mineral wool insulation.
The models are shown in Figure 3. Details of the material composition for each model can be found in Appendix A.
In order to use the models in the optimization, they were parametrized in the following way:
  • First, for each of the models, the amount of materials per floor was calculated. As each model includes two parts—a façade and a frame—separately, in total six initial calculations were made. The materials used in Autodesk Revit models were mapped to the closest possible analogues available in the LCA software OneClick LCA [56];
  • The scaling of the floor area was implemented in relation to the original total gross area:
    • It was assumed that the window-to-wall ratio (WWR = 0.35) and the ratio of length to width of the building (3.49) will be preserved when the floor area changes;
    • The total volume of materials used in the ceiling and vertical structural elements was assumed to change proportionally to the total floor area;
    • The total volume of materials used in walls was assumed to change proportionally to the perimeter length of the building whilst taking into account the scaling of the windows’ area;
    • The total volume of materials used in horizontal structural elements was assumed to be proportional to the length or the width of the building (depending on the element orientation);
  • To estimate the total volume of materials used in a building, first, the volume per storey was calculated based on the floor area and then the resulting value was multiplied by the number of floors;
  • The resulting total volume of materials used in a building was calculated based on the floor area and the number of floors. The foundation of all building variants was assumed to be the same (500 mm thick concrete).
The material characteristics (embodied carbon emissions and prices) were obtained from the database available inside of OneClick LCA [56]. Embodied carbon emissions are based on environmental product declarations with emissions from transportation added to them. Table 1 provides information on all material characteristics used in the model.

3.2. Design Problem Specification

For the demonstrator, we assumed the following set of design variables: floor area, number of floors, set of the building’s envelope materials, set of the building’s internal structural frame materials, and distance from the nearest railway station (see Table 2).
For objectives, the following were selected:
  • Construction costs (EUR) (only includes the cost of materials, and all other costs (e.g., labor) were assumed to be constant);
  • Embodied carbon emissions (kg CO2eq) (based on environmental product declarations (EPDs));
  • Expected profit from renting the building out (EUR/month) (based on the total floor area of the building and the rental costs per m2);
  • Location (km) (characterized by the distance from the nearest railway station to a planned construction site).
The final equations used for the calculation of objectives can be found in Appendix B. It is worth mentioning that in real-world problems such a simplification of objectives is often not possible. However, as was mentioned above, the purpose of the simplified demonstrator case is to illustrate the methodology developed. In the future, we expect to work with more comprehensive building design cases where the calculations of objectives (building performance indicators) will be performed using external software tools such as EnergyPlus [57] for building energy consumption, OpenLCA [58] or Brightway2 [59] for the calculation of environmental impacts, etc. The methodology presented in this paper is universal and acts as a decision-making layer that can be built on top of any underlying calculations.
For this demonstrator, we did not include any constraints and the solution space is only limited by the design variables’ boundaries. However, the model can work with both linear and non-linear constraints.

3.3. Optimization Problem Specification

Given the design variables (Table 1) and objectives (refer to Appendix B for the equations), the optimization problem we are dealing with is a mixed-integer nonlinear optimization problem. To solve the optimization problem, we used the ga solver in Matlab. The parameters of the solver were tweaked over time in order to ensure the desired speed-to-precision ratio. In order to decrease the running time and the number of requests sent to the server, the algorithm was set up to work in the vectorized form. The final chosen parameters of the solver are provided in Table 3. If a parameter is not mentioned in the table, the default value provided in Matlab was used. A relatively low value of the crossover fraction was selected in order to preserve the diversity of the population. It was also observed that this ratio results in shorter running times compared with other values.
As was mentioned in the Methods section, before running the main optimization routine, we first found the minima and maxima for all of the objective functions taking into account the design variables’ bounds. Table 4 provides those values for all objectives used in the demonstrator.
Once the minima and maxima have been calculated, stakeholders construct preference curves for objectives they are interested in. For the first demonstrator case, we did not involve real stakeholders and instead provide a possible scenario of the design development. In order to illustrate the iterative nature of our method, we simulated a five-iteration design optimization process. Thus, the optimization model was run five times with different input parameters. For the purposes of comparison, we also ran the same optimization but using the weighted mean of preferences instead of Tetra for the aggregation of the individual preference scores. A detailed description of the parameters used in each iteration is provided in the next section.

3.4. Description of the Design Process Iterations Used in the Study

The iterative a priori process is one of the key features of the proposed method. It makes it possible to make major changes to the problem configuration (e.g., adding or removing objectives, changing stakeholders’ preferences, or modifying constraints) with relative ease and quickly see the outcome of those changes. It allows stakeholders to explore the underlying causal relationships and collaborate in real-time and has an educational effect.
We illustrate the iterative process and a possible design problem evolution on the demonstrator case. Figure 4 panel (a) provides a visual overview of the iterations and the corresponding input parameters used in the optimization runs.
Iteration 1
In the first iteration, we assumed that stakeholders are only interested in minimizing the construction costs and maximizing the profit from rent. These two objectives have an equal weight of 0.5 and the two other objectives were omitted and, thus, have no weight. The preferences are linear on the interval of values that the objective functions take.
Iteration 2
The stakeholders have made changes to their preference inputs that are now nonlinear. The requirement for Construction costs has become more strict (the preference score for the middle point decreased from 50 to 20), while for Profit from rent the change is in the opposite direction, as it has been relaxed (the preference score for the middle point increased from 50 to 80).
Iteration 3
It was decided that Location should also be considered one of the objectives. This third objective was brought in, and the preference curve was defined as being equal to 0 at the extreme points (0.2 km and 15 km) with a peak preference at 5 km. All three objectives have equal weights.
Iteration 4
A new stakeholder was involved that is interested in bringing in environmental considerations. Thus, a fourth objective—Embodied carbon emissions—has been added. The preference curve for Embodied carbon emissions was assumed to be linear and the weights of all four objectives to be equal.
Iteration 5
It was decided that the profit objective is more important than the other objectives. Thus, the weights of the objectives were modified. The weight for the Profit from rent objective was increased to 0.4 while all other objectives had an equal weight of 0.2.

4. Results of the Demonstrator Case

Figure 4 panel (b) shows how the optimum design changes at each iteration. The top row shows the optimal values of variables and the bottom row shows the corresponding values of the objective functions. Our starting design at Iteration 1 is characterized by the largest possible Profit from rent. When the preference curve for Construction costs was modified to be more strict at Iteration 2, the optimum shifted significantly and the floor area decreased from 2500 m2 to 1180 m2. As a consequence, the profit saw a two-fold decrease while construction costs reduced from 3.3 million EUR to 1.5 million EUR. The introduction of the third objective at Iteration 3 resulted in Distance to a railway station increasing from 0.2 km to 5 km. The floor area has seen a slight increase (by 51 m2), resulting in a minor increase in Construction costs and Profit from rent. The inclusion of Embodied carbon emissions into the model at Iteration 4 had a major effect on the optimum: the number of floors and the floor area reached their lower boundaries. In this configuration, Construction costs reached the absolute possible minimum. Embodied carbon emissions were also close to the absolute minimum. However, while the preferences related to Construction costs and Embodied carbon emissions were well-satisfied, Profit from rent decreased from the best possible value of 5.2 million EUR/month at Iteration 1 to a near-bottom value of 0.3 million EUR/month. Increasing the weight of Profit from rent at Iteration 5 resulted in it growing to 4.2 million EUR/month. The floor area increased to 2031 m2 and the number of floors moved back from 2 to 10. In addition, the optimum set of the building’s structural frame materials changed from 2 (Structural steel profile frame and a hollow concrete slabs floor) to 3 (Cross-laminated timber frame with a wooden joist floor).
From the simulation results, it can be observed that the floor area is the most sensitive variable to the model parameters. The set of the building’s facade materials variable, on the contrary, is not sensitive and did not change in any of the iterations. Comparing the results obtained using Tetra for handling the preferences and the aggregation using the weighted mean, it can be seen from Figure 4 panel (b) that the difference in the optimal design is large. While in the simplest configuration with two objectives and linear preferences at Iteration 1 the optima were exactly the same, the difference grew with each new iteration and reached its peak at the final iteration. Thus, the importance of using a correct method for handling the preferences increases with the complexity of the problem. While our demonstrator case was relatively simple, many of the real-world design optimization problems would include even more stakeholders and objectives and using a simplistic method of preference aggregation (such as the weighted mean) can result in a suboptimal design.

5. Discussion

5.1. Limitations

The limitations of this study are related to the demonstrator case. Since the main aim of the paper was to present a novel methodology for design optimization and decision-making, the demonstrator case was chosen to be relatively simplistic. Only a limited set of variables and objectives was used. The building model was not detailed (it was only concerned with the Site, Structure, and Skin shearing layers) and was manually parametrized in a simple manner that leaves some room for improvement. Further, the approach to the data collection was also simplified and most of the data originated from OneClick LCA. Moreover, the iterative design process and all the corresponding parameters used in the demonstrator did not involve real stakeholders and were pre-defined. Lastly, we assumed that in our case each stakeholder only provides preferences for a single objective. In real-world scenarios, there can be cases where several stakeholders have overlapping preferences for a single objective. Such cases can be handled within the PFM methodology but have not been considered yet.
Nonetheless, despite the abovementioned simplifications, we believe that the demonstrator case study developed was more than enough to illustrate the application of the proposed method. Its relative simplicity also made it easier to visualize the results. Our future work will aim to address all the limitations and apply the model to more complex real-world design projects.

5.2. Steps for Further Development

Our future work will focus on refining and extending the proposed methodology and applying it to more complex real-world design and construction problems. The next steps include:
  • Developing the user interface and running a series of workshops with real-world stakeholders in order to obtain feedback and refine the methodology and the tool (‘Preferendus’);
  • Validation of the methodology and the developed tool in design offices on more complex cases that include more objectives from different domains (expanding it to cover energy modeling, social aspects, circularity, resilience, ecosystem services provision, and more) and more complex stakeholder structures (e.g., stakeholders with overlapping preferences);
  • In addition to whole-building design, implementing the methodology for more specific cases of design decision-making and specifically the selection of building materials. The selection of building materials is a challenging topic due to the overwhelming number of existing options, each promising specific advantages (e.g., traditional mass-market materials vs. circular materials vs. low-carbon materials vs. bio-based materials), and the selection process can be streamlined and simplified by implementing an automated preference-based decision-making system. In this context, the methodology will also be applied to a case of insulation material selection within the NRG-Storage Horizon 2020 project that this work is affiliated with;
  • Integration of the methodology with parametric building design software (e.g., Rhino Grasshopper). Parametric design software allows us to seamlessly connect the building design variables to multiple different objectives such as energy consumption, environmental impacts, thermal comfort, and structural strength. Building a stakeholder-oriented layer on top of the existing parametric design functionality would allow us to properly account for stakeholders’ preferences and have a fully integrated design process from preferences to the final CAD model;
  • Extending the methodology to include a stalemate resolver for the automated resolution of design deadlocks where the design solution space becomes over-constrained by stakeholders and no feasible solution can be found without relaxing some of the negotiable constraints (by negotiable constraints, we mean design constraints specified by stakeholders that can, in theory, be moved and modified during the design process such as the maximum budget, etc.);
  • Developing the methodology to further allow for finding a compromise design solution using a preference-based goal attainment approach;
  • As the core methodology presented in this study can be applied to preference-based optimization (any optimization process that should consider stakeholders’ preferences) in any context, exploring the possibility of expanding the tool to be applicable in other fields such as supply chain management, asset management, etc.

6. Conclusions

The novel methodology presented in this study fills the existing gaps outlined in the Introduction section. We showcased a new multi-criteria optimization and decision-making tool that better reflects the real-world design process and utilizes the preference function modeling theory that resolves issues related to the measurement and aggregation of preferences found in the literature. The tool enables decision-makers to find the final design that reflects all stakeholders’ concurrent preferences: the best fit for common purpose. Based on the iterative a priori approach, the tool has the advantage of being flexible and fast, allowing stakeholders to explore and learn about the consequences of their actions.
The application of the tool was demonstrated on a multi-storey building design optimization case study with a focus on early stage design. The case highlighted the main difference of the tool compared with the existing solutions—the stakeholder-first approach. The preferences of stakeholders were considered as a starting point and the solution obtained reflected the preferences of all stakeholders involved. Compared to the most commonly used a posteriori approaches, our study expands the commonly used notion of preference, as we consider not only the weights of objectives but also the expectation levels for different numerical values of objective functions. This makes it possible to ensure that the optimum obtained has a better alignment with the predetermined expectations of stakeholders that always exist.
The flexibility and the iterative nature of the tool were showcased through a five-iteration design process where the problem configuration was adjusted between iterations. Even major changes to the configuration—such as adding an objective—were easy to execute. The combination of the fast speed of the selected a priori approach and the aggregation of multiple objectives into one makes the tool well-suited as a collaborative learning and exploration tool. Stakeholders can easily change the parameters and quickly see how the result changes, allowing them to learn about the underlying causal relationships.
Comparing the results obtained using the PFM methodology for preference modeling and a simple weighted mean showed major differences in optimal results between the two. While using the weighted mean could be an attractive option due to the simplicity and higher speed, our results highlight the importance of using a correct approach to modeling stakeholders’ preferences for obtaining an accurate solution.

Author Contributions

Conceptualization, D.Z., A.M.R.W. and R.B.; methodology, D.Z., A.M.R.W. and R.B.; software, D.Z.; validation, D.Z., A.M.R.W. and R.B.; formal analysis, D.Z.; investigation, D.Z.; data curation, D.Z.; writing—original draft preparation, D.Z.; writing—review and editing, D.Z., A.M.R.W. and R.B.; visualization, D.Z.; supervision, A.M.R.W.; project administration, A.M.R.W.; funding acquisition, A.M.R.W. All authors have read and agreed to the published version of the manuscript.

Funding

This research was funded by the European Commission NRG-STORAGE project (project no. GA 870114).

Institutional Review Board Statement

Not applicable to our study.

Informed Consent Statement

Not applicable to our study.

Data Availability Statement

Not applicable.

Acknowledgments

The authors thank Heijmans N.V. for providing the demonstrator case. The authors would also like to thank T. Huijsmans and H. Jonkers of TU Delft for their valuable feedback.

Conflicts of Interest

The authors declare no conflict of interest.

Appendix A. Material Composition of Frame and Façade Options

The table below shows the material composition of all the structural frame and façade options used in this study. The values provided are for a single floor with a floor area of 1000 m2. As was mentioned above, the foundation was assumed to be the same for all design variants; so, it is provided separately in the table as well. Note that the units are different for different materials.
Table A1. Material composition of structural frame and façade options.
MaterialUnitFrameFaçade
Foundation1—Concrete Frame2—Structural Steel Profile Frame and a Hollow Concrete Slabs Floor3—Cross-Laminated Timber Frame with a Wooden Joist Floor1—Brick and Rockwool Insulation2—Steel Sandwich Panel Façade with Polyisocyanurate Insulation3—Timber Frame Façade with Mineral Wool Insulation
Ready-mix concrete, normal strength, generic, C 28/35 (4000/5000 PSI) with CEM I, 0% recycled binders (300 kg/m3; 18.7 lbs/ft3 total cement)m30329.100000
Ready-mix concrete, normal-strength, generic, C 40/50 (5800/7300 PSI), 0% recycled binders in cement (400 kg/m3/24.97 lbs/ft3)m3500.014.700000
Rock wool insulation, unfaced, L = 0.035–0.04 W/mK, 40 mm, 1.2 kg/m2, 30 kg/m3, Lambda = 0.035 W/(m.K), ProRox LF 970 (ROCKWOOL)m3000058.200
Wall bricks, 575 kg/m3 (Ziegel)m3000036.400
Hot-dip galvanised structural steel, 0.45–1.5 mm, 7850 kg/m3 (Ruukki)m3001.20000
Structural steel profiles, generic, 90% recycled content (typical), I, H, U, L, and T sections, S235, S275 and S355m3006.03.6000
Hollow core concrete slab, HDF27, C 40/50, 270 mm, 344 kg/m2, reinforcing 12.7 kg/ton (Strängbetong)m200945.00000
Aluminium profile, 2700.0 kg/m3m3000000.20
Sandwich panel with polyisocyanurate (PIR) foam and double steel siding, U = 0.21 W/(m2K), 100.9 mm (Total), 0.5 mm (Outer sheet), 0.4 mm (Liner sheet), 100 mm (Insulation), 12.11 kg/m2, 120.02 kg/m3, SAB WB 100.1000 (SAB-profile, Tata Steel Europe)m200000363.90
Aluminium profiled sheets, thickness 0.7 mm, height of profile 65 mm, 2.9 kg/m2 (European Association for Panels and Profiles)m200000363.90
Cross-laminated timber, 491.65 kg/m3, T:51–500 mm, max width: 2.95–4.80 m, max length: 16–20 m, X-Lam (Studiengemeinschaft Holzleimbau e.V.)m300088.9003.1
Wooden joist floor assembly, 278 mm, incl. 225 mm mineral wool insulationm2000688.1000
Timber frame external wall assembly, incl. mineral wool insulationm2000000363.9

Appendix B

Appendix B.1. Equations for Calculating the Volume of Materials Used in the Model

The material composition of the building influences two of the objectives—Embodied carbon emissions and Construction costs. As mentioned in Section 3.1, the model was parameterized in order to make it suitable for use in optimization. The amount of materials used in the design will, thus, depend on four variables: Floor area a , Number of floors n , Set of the building’s structural frame materials m 1 , and Set of the building’s facade materials m 2 . The calculations were conducted in matrix form. The total number of unique materials used in our design optimization problem was 13 (see Table 1) and that was the length of the material vector that was used as a basis in the problem. For example, the vector v = [ 1 , 0 , 0 , 0 , 0 , 0 , 0 , 0 , 0 , 0 , 0 , 0 , 1 ] includes 1 m3 of “Ready-mix concrete, normal strength, generic, C 28/35 (4000/5000 PSI) with CEM I, 0% recycled binders (300 kg/m3; 18.7 lbs/ft3 total cement)” and 1 m2 of “Timber frame external wall assembly, incl. mineral wool insulation”. Note that since the data provided in EPDs can be measured using different units, the vector contains both values measured in m2 and m3.
As was mentioned in Section 3.1, the original models that were shared with us were not parameterized and the original gross floor area of those building designs was fixed at 1000 m2. In further equations, it is denoted as a 0 . The proportions of the floor area were assumed to be constant (the length-to-width ratio of the building is equal to 3.49). The equations provided below are sometimes defined through the length of the building that—given the fixed proportions—can be defined as:
s = a / 3.49
Independently of the design option, the foundation was always assumed to be the same 0.5 m thick concrete slab. Thus, the vector representing the material composition related to the foundation can be defined as:
f = [ 0 , a 0.5 , 0 , 0 , 0 , 0 , 0 , 0 , 0 , 0 , 0 , 0 , 0 ]
The amount of materials used in the internal frame construction was defined as:
M 1 = { [ ( 18.8 s 27.2 ) 0.1 + a 0.3 ,   27 3.4 0.16 a a 0 , 0 , 0 , 0 , 0 , 0 , 0 , 0 , 0 , 0 , 0 , 0 ] ,   w h e n   m 1 = 1 [ 0 , 0 , 0 , 0 , 27 0.046 a a 0 ,   27 0.011 ( a a 0 ) +   ( s 3 0.3 ( a a 0 ) ) 0.009 2 a a 0 +   ( 3.49 s 9 0.3 ( a a 0 ) ) 0.023 3 a a 0 +   ( 3.49 s 9 0.3 ( a a 0 ) ) 0.0016 4 a a 0 +   40 2 0.009 + 40 2 0.0027 ( 0.2 s ) , ( s 0.85 ( a a 0 ) ) ( 3.49 s 0.3 ( a a 0 ) ) , 0 , 0 , 0 , 0 , 0 , 0 ] ,   w h e n   m 1 = 2 [ 0 , 0 , 0 , 0 , 0 , ( 2 27 0.021 + 2 4 0.02 + 2 14 0.025 + 2 7 0.037 + 2 2 0.018 ) a a 0 + 2 27 0.001 ( a a 0 ) + ( 6 16 0.0001 + 6 8 0.002 ) a a 0 + 4 ( 3.49 s 6 ) 0.004 , 0 , 0 , 0 , 0 , ( 4 0.483 + 16 0.727 + 7 1.087 ) a a 0 + ( 9 0.2 ( s 1.1 ) + 2 ( 3.49 s 2.92 ) 0.2 + 0.3 ( 3.49 s 3.2 ) ) a a 0 , ( 3.49 s 2 9 s ( a a 0 ) 2 3.49 s ( a a 0 ) 0.7 3.49 s ( a a 0 ) ) , 0 ] ,   w h e n   m 1 = 3 }
The amount of materials used in the façade was defined as:
M 2 = { [ 0 , 0 , 21.5 s 0.16 , 21.5 s 0.1 , 0 , 0 , 0 , 0 , 0 , 0 , 0 , 0 , 0 ] ,   w h e n   m 2 = 1 [ 0 , 0 , 0 , 0 , 0 , 0 , 0 , 4 0.005 a a 0 + 82 0.002 a a 0 , 21.5 s , 21.5 s , 0 , 0 , 0 ] ,   w h e n   m 2 = 2 [ 0 , 0 , 0 , 0 , 0 , 0 , 0 , 0 , 0 , 0 , 4 0.786 ( a a 0 ) , 0 , 21.5 s ] ,   w h e n   m 2 = 3

Appendix B.2. Calculation of the Objectives

Appendix B.2.1. Embodied Carbon Emissions

The vector of values for embodied carbon emissions can be represented as (the values are also provided in Table 1):
e e = [ 292.13 ,   386.96 ,   35.25 ,   138.29 ,   20794.65 ,   6033.17 ,   46.78 ,   29289 ,   37.2 ,   27 ,   187.23 ,   36 ,   65 ]
In addition to the values provided in EPDs, we also included the transportation emissions. Those were taken directly from OneClick LCA and converted into the same units as the corresponding values from EPDs. The vector of transportation emissions can be written as:
e t = [ 18.72 ,   18.72 ,   0.069 ,   1.32 ,   111.24 ,   111.24 ,   0.79 ,   48.60 ,   0.20 ,   0.03 ,   4.14 ,   0.45 ,   0.73 ]
The overall emissions vector is a sum of the embodied carbon emissions obtained from EPDs and the transportation emissions:
e = e e + e t
The embodied carbon emissions can be calculated as follows:
E = n ( M 1 T · e + M 2 T · e ) + f T · e

Appendix B.2.2. Construction Costs

The vector of values for costs can be represented as (the values are also provided in Table 1):
c = [ 344.87 ,   348 ,   57 ,   115 ,   5976.96 ,   5976.96 ,   60.64 ,   8920 ,   49.92 ,   6.24 ,   544.93 ,   132 ,   110 ]
The construction costs can be calculated as follows:
C = n ( M 1 T · c + M 2 T · c ) + f T · c

Appendix B.2.3. Profit from Rent

Expected profit from rent was assumed to be dependent on the total area of the building and the distance to the railway station (denoted as dist). The objective for the expected profit from rent was defined as follows:
P = a n ( 2 10 7 d 2 0.58 10 2 d + 206.5 )
The part in brackets is based on the average prices for the office space for the four biggest cities in the Netherlands (Amsterdam, Rotterdam, the Hague, and Utrecht) [60] and a study on the influence of the distance to a railway station on real estate prices [61].

Appendix B.2.4. Location Objective

Location is simply the distance to the railway station:
L = d

References

  1. Kubba, S. Handbook of Green Building Design and Construction: LEED, BREEAM, and Green Globes; Butterworth-Heinemann: Oxford, UK, 2012; ISBN 978-0-12-385129-1. [Google Scholar]
  2. Kibert, C.J. Sustainable Construction: Green Building Design and Delivery; John Wiley & Sons: Hoboken, NJ, USA, 2016; ISBN 978-1-119-05517-4. [Google Scholar]
  3. Xijiang, T. Green Building Design Method Based on System Ecology. Energy Syst. 2020, 1–18. [Google Scholar] [CrossRef]
  4. Mok, K.Y.; Shen, G.Q.; Yang, R. Stakeholder Complexity in Large Scale Green Building Projects: A Holistic Analysis towards a Better Understanding. Eng. Constr. Archit. Manag. 2018, 25, 1454–1474. [Google Scholar] [CrossRef]
  5. Tresidder, E. Accelerated Optimisation Methods for Low-Carbon Building Design. Ph.D. Dissertation, De Montfort University, Leicester, UK, 2014. [Google Scholar]
  6. Barbhuiya, S.; Barbhuiya, S.; Nikraz, H. Adaptation to the Future Climate: A Low Carbon Building Design Challenge. Procedia Eng. 2013, 51, 194–199. [Google Scholar] [CrossRef] [Green Version]
  7. Jankovic, L. Designing Zero Carbon Buildings: Using Dynamic Simulation Methods, 2nd ed.; Routledge: London, UK, 2017; ISBN 978-1-315-62090-9. [Google Scholar]
  8. Jones, P.; Hou, S.S.; Li, X. Towards Zero Carbon Design in Offices: Integrating Smart Facades, Ventilation, and Surface Heating and Cooling. Renew. Energy 2015, 73, 69–76. [Google Scholar] [CrossRef] [Green Version]
  9. Sodha, M.S.; Bansal, N.K.; Bansal, P.K.; Kumar, A.; Malik, M.A.S. Solar Passive Building: Science and Design; Pergamon Press: Oxford, UK, 1986. [Google Scholar]
  10. Tian, Z.; Zhang, X.; Jin, X.; Zhou, X.; Si, B.; Shi, X. Towards Adoption of Building Energy Simulation and Optimization for Passive Building Design: A Survey and a Review. Energy Build. 2018, 158, 1306–1316. [Google Scholar] [CrossRef]
  11. Keeler, M.; Vaidya, P. Fundamentals of Integrated Design for Sustainable Building; John Wiley & Sons: Hoboken, NJ, USA, 2016; ISBN 978-1-118-88191-0. [Google Scholar]
  12. Bunz, K.R.; Henze, G.P.; Tiller, D.K. Survey of Sustainable Building Design Practices in North America, Europe, and Asia. J. Archit. Eng. 2006, 12, 33–62. [Google Scholar] [CrossRef]
  13. Ghaffar, S.H.; Burman, M.; Braimah, N. Pathways to Circular Construction: An Integrated Management of Construction and Demolition Waste for Resource Recovery. J. Clean. Prod. 2020, 244, 118710. [Google Scholar] [CrossRef]
  14. Kanters, J. Circular Building Design: An Analysis of Barriers and Drivers for a Circular Building Sector. Buildings 2020, 10, 77. [Google Scholar] [CrossRef]
  15. Alfraidi, Y.; Boussabaine, A.H. Design Resilient Building Strategies in Face of Climate Change. Int. J. Archit. Civ. Constr. Sci. 2015, 9, 23–28. [Google Scholar] [CrossRef]
  16. Hosseini, M. Toward Resilient Building Design in Energy Performance under Climate Change. Ph.D. Thesis, Concordia University, Montreal, QC, Canada, 2021. [Google Scholar]
  17. Buckman, A.H.; Mayfield, M.; Beck, S.B.M. What Is a Smart Building? Smart Sustain. Built Environ. 2014, 3, 92–109. [Google Scholar] [CrossRef]
  18. Eini, R.; Linkous, L.; Zohrabi, N.; Abdelwahed, S. A Testbed for a Smart Building: Design and Implementation. In Proceedings of the Fourth Workshop on International Science of Smart City Operations and Platforms Engineering, Montreal, QC, Canada, 15 April 2019; Association for Computing Machinery: New York, NY, USA, 2019; pp. 1–6. [Google Scholar]
  19. Loftness, V.; Hakkinen, B.; Adan, O.; Nevalainen, A. Elements That Contribute to Healthy Building Design. Environ. Health Perspect. 2007, 115, 965–970. [Google Scholar] [CrossRef] [PubMed] [Green Version]
  20. Spengler, J.D.; Chen, Q. Indoor Air Quality Factors in Designing a Healthy Building. Annu. Rev. Energy Environ. 2000, 25, 567–600. [Google Scholar] [CrossRef] [Green Version]
  21. Aapaoja, A.; Haapasalo, H.; Söderström, P. Early Stakeholder Involvement in the Project Definition Phase: Case Renovation. ISRN Ind. Eng. 2013, 2013, e953915. [Google Scholar] [CrossRef] [Green Version]
  22. Huang, D.; Liu, J.; Tang, C. Stakeholders Management in Construction Project: A Case of Hydropower Station Project. In Proceedings of the 17th International Symposium on Advancement of Construction Management and Real Estate; Wang, J., Ding, Z., Zou, L., Zuo, J., Eds.; Springer: Berlin/Heidelberg, Germany, 2014; pp. 605–613. [Google Scholar]
  23. Chan, A.P.C.; Chan, D.W.M.; Chiang, Y.H.; Tang, B.S.; Chan, E.H.W.; Ho, K.S.K. Exploring Critical Success Factors for Partnering in Construction Projects. J. Constr. Eng. Manag. 2004, 130, 188–198. [Google Scholar] [CrossRef]
  24. Nguyen, L.D.; Le-Hoai, L.; Tran, D.Q.; Dang, C.N.; Nguyen, C.V. Effect of Project Complexity on Cost and Schedule Performance in Transportation Projects. Constr. Manag. Econ. 2019, 37, 384–399. [Google Scholar] [CrossRef]
  25. El Touny, A.S.; Ibrahim, A.H.; Mohamed, H.H. An Integrated Sustainable Construction Project’s Critical Success Factors (ISCSFs). Sustainability 2021, 13, 8629. [Google Scholar] [CrossRef]
  26. Durdyev, S.; Hosseini, M.R. Causes of Delays on Construction Projects: A Comprehensive List. Int. J. Manag. Proj. Bus. 2019, 13, 20–46. [Google Scholar] [CrossRef]
  27. Wu, G. A Multi-Objective Trade-Off Model in Sustainable Construction Projects. Sustainability 2017, 9, 1929. [Google Scholar] [CrossRef] [Green Version]
  28. Ng, S.T.; Rose, T.M.; Mak, M.; Chen, S.E. Problematic Issues Associated with Project Partnering—The Contractor Perspective. Int. J. Proj. Manag. 2002, 20, 437–449. [Google Scholar] [CrossRef]
  29. Eurima. Life Cycle Assessment of Buildings—A Future-Proofed Solution in the Digitalised World of Tomorrow; White paper; Eurima: Brussels, Belgium, 2017; Available online: https://www.eurima.org/uploads/files/modules/articles/1584367144_SC%20Eurima_LCA_WhitePaper_Final_20170915.pdf (accessed on 14 April 2022).
  30. Meex, E.; Hollberg, A.; Knapen, E.; Hildebrand, L.; Verbeeck, G. Requirements for Applying LCA-Based Environmental Impact Assessment Tools in the Early Stages of Building Design. Build. Environ. 2018, 133, 228–236. [Google Scholar] [CrossRef]
  31. Machairas, V.; Tsangrassoulis, A.; Axarli, K. Algorithms for Optimization of Building Design: A Review. Renew. Sustain. Energy Rev. 2014, 31, 101–112. [Google Scholar] [CrossRef]
  32. Evins, R. A Review of Computational Optimisation Methods Applied to Sustainable Building Design. Renew. Sustain. Energy Rev. 2013, 22, 230–245. [Google Scholar] [CrossRef]
  33. Nguyen, A.-T.; Reiter, S.; Rigo, P. A Review on Simulation-Based Optimization Methods Applied to Building Performance Analysis. Appl. Energy 2014, 113, 1043–1058. [Google Scholar] [CrossRef]
  34. Shi, X.; Tian, Z.; Chen, W.; Si, B.; Jin, X. A Review on Building Energy Efficient Design Optimization Rom the Perspective of Architects. Renew. Sustain. Energy Rev. 2016, 65, 872–884. [Google Scholar] [CrossRef]
  35. Zhai, Y.; Wang, Y.; Huang, Y.; Meng, X. A Multi-Objective Optimization Methodology for Window Design Considering Energy Consumption, Thermal Environment and Visual Performance. Renew. Energy 2019, 134, 1190–1199. [Google Scholar] [CrossRef]
  36. Shi, X. Design Optimization of Insulation Usage and Space Conditioning Load Using Energy Simulation and Genetic Algorithm. Energy 2011, 36, 1659–1667. [Google Scholar] [CrossRef]
  37. Dino, I.G.; Üçoluk, G. Multiobjective Design Optimization of Building Space Layout, Energy, and Daylighting Performance. J. Comput. Civ. Eng. 2017, 31, 04017025. [Google Scholar] [CrossRef]
  38. Zhang, L.; Zhang, L.; Wang, Y. Shape Optimization of Free-Form Buildings Based on Solar Radiation Gain and Space Efficiency Using a Multi-Objective Genetic Algorithm in the Severe Cold Zones of China. Sol. Energy 2016, 132, 38–50. [Google Scholar] [CrossRef]
  39. Rachmawati, L.; Srinivasan, D. Preference Incorporation in Multi-Objective Evolutionary Algorithms: A Survey. In Proceedings of the 2006 IEEE International Conference on Evolutionary Computation, Vancouver, BC, Canada, 16–21 July 2006; pp. 962–968. [Google Scholar]
  40. Harkouss, F.; Fardoun, F.; Biwole, P.H. Optimal Design of Renewable Energy Solution Sets for Net Zero Energy Buildings. Energy 2019, 179, 1155–1175. [Google Scholar] [CrossRef]
  41. Shao, Y.; Geyer, P.; Lang, W. Integrating Requirement Analysis and Multi-Objective Optimization for Office Building Energy Retrofit Strategies. Energy Build. 2014, 82, 356–368. [Google Scholar] [CrossRef]
  42. Chaturvedi, S.; Rajasekar, E.; Natarajan, S. Multi-Objective Building Design Optimization under Operational Uncertainties Using the NSGA II Algorithm. Buildings 2020, 10, 88. [Google Scholar] [CrossRef]
  43. Ascione, F.; Bianco, N.; De Stasio, C.; Mauro, G.M.; Vanoli, G.P. Simulation-Based Model Predictive Control by the Multi-Objective Optimization of Building Energy Performance and Thermal Comfort. Energy Build. 2016, 111, 131–144. [Google Scholar] [CrossRef]
  44. Senel Solmaz, A.; Halicioglu, F.H.; Gunhan, S. An Approach for Making Optimal Decisions in Building Energy Efficiency Retrofit Projects. Indoor Built Environ. 2018, 27, 348–368. [Google Scholar] [CrossRef]
  45. Islam, H.; Jollands, M.; Setunge, S.; Bhuiyan, M.A. Optimization Approach of Balancing Life Cycle Cost and Environmental Impacts on Residential Building Design. Energy Build. 2015, 87, 282–292. [Google Scholar] [CrossRef]
  46. Bre, F.; Silva, A.S.; Ghisi, E.; Fachinotti, V.D. Residential Building Design Optimisation Using Sensitivity Analysis and Genetic Algorithm. Energy Build. 2016, 133, 853–866. [Google Scholar] [CrossRef]
  47. Geyer, P. Component-Oriented Decomposition for Multidisciplinary Design Optimization in Building Design. Adv. Eng. Inform. 2009, 23, 12–31. [Google Scholar] [CrossRef]
  48. Geyer, P. Multidisciplinary Grammars Supporting Design Optimization of Buildings. Res. Eng. Des. 2008, 18, 197–216. [Google Scholar] [CrossRef]
  49. Geyer, P. Embedding Optimization in the Design Process of Buildings—A Hall Example. In Proceedings of the 24th W78 Conference, Maribor, Slovenia, 26–29 June 2007; pp. 689–698. [Google Scholar]
  50. Nadkarni, R.R.; Puthuvayi, B. A Comprehensive Literature Review of Multi-Criteria Decision Making Methods in Heritage Buildings. J. Build. Eng. 2020, 32, 101814. [Google Scholar] [CrossRef]
  51. Tan, T.; Mills, G.; Papadonikolaki, E.; Liu, Z. Combining Multi-Criteria Decision Making (MCDM) Methods with Building Information Modelling (BIM): A Review. Autom. Constr. 2021, 121, 103451. [Google Scholar] [CrossRef]
  52. Barzilai, J. Preference Function Modelling: The Mathematical Foundations of Decision Theory. In Trends in Multiple Criteria Decision Analysis; Ehrgott, M., Figueira, J.R., Greco, S., Eds.; International Series in Operations Research & Management Science; Springer: Boston, MA, USA, 2010; pp. 57–86. ISBN 978-1-4419-5904-1. [Google Scholar]
  53. Binnekamp, R. Preference-Based Design in Architecture; IOS Press: Amsterdam, The Netherlands, 2010. [Google Scholar]
  54. Scientific Metrics: Home. Available online: https://scientificmetrics.com/ (accessed on 10 February 2022).
  55. Brand, S. How Buildings Learn: What Happens after They’re Built; Viking: New York, NY, USA, 1994; ISBN 978-0-670-83515-7. [Google Scholar]
  56. World’s Fastest Building Life Cycle Assessment Software—One Click LCA. Available online: https://www.oneclicklca.com/ (accessed on 25 October 2021).
  57. EnergyPlus. Available online: https://energyplus.net/ (accessed on 23 February 2022).
  58. OpenLCA.Org. OpenLCA Is a Free, Professional Life Cycle Assessment (LCA) and Footprint Software with a Broad Range of Features and Many Available Databases, Created by GreenDelta since 2006. Available online: https://www.openlca.org/ (accessed on 23 February 2022).
  59. Brightway2 LCA Framework. Available online: https://brightway.dev/ (accessed on 23 February 2022).
  60. NVM Business. Kantoren in Cijfers 2021 Statistiek van de Nederlandse Kantorenmarkt; NVM Bussiness: Utrecht, The Netherlands, 2021. [Google Scholar]
  61. Debrezion, G.; Pels, E.; Rietveld, P. The Impact of Rail Transport on Real Estate Prices: An Empirical Analysis of the Dutch Housing Market; Tinbergen Institute Discussion Papers; Tinbergen Institute: Amsterdam, The Netherlands, 2006. [Google Scholar]
Figure 1. Methodology flowchart.
Buildings 12 00527 g001
Figure 2. An example of obtaining a preference curve.
Buildings 12 00527 g002
Figure 3. Material options for the façade and structural frame of the demonstrator case provided by Heijmans.
Buildings 12 00527 g003
Figure 4. (a) Preference curves and weights for all iterations; (b) The results of optimization runs for each iteration showing the optimal values of design variables and objectives.
Buildings 12 00527 g004
Table 1. Characteristics of materials that were used in this study.
Material (the Full Name as it Appears in OneClick LCA)UnitEmbodied Carbon, kg CO2eq/UnitTotal Emissions from Transport, kg CO2eq/UnitPrice, EUR/Unit
Ready-mix concrete, normal strength, generic, C 28/35 (4000/5000 PSI) with CEM I, 0% recycled binders (300 kg/m3; 18.7 lbs/ft3 total cement)m3292.1318.72344.87
Ready-mix concrete, normal-strength, generic, C 40/50 (5800/7300 PSI), 0% recycled binders in cement (400 kg/m3/24.97 lbs/ft3)m3386.9618.72348
Rock wool insulation, unfaced, L = 0.035–0.04 W/mK, 40 mm, 1.2 kg/m2, 30 kg/m3, Lambda = 0.035 W/(m.K), ProRox LF 970 (ROCKWOOL)m335.250.0757
Wall bricks, 575 kg/m3 (Ziegel)m3138.291.32115
Hot-dip galvanised structural steel, 0.45–1.5 mm, 7850 kg/m3 (Ruukki)m320,794.65111.245976.96
Structural steel profiles, generic, 90% recycled content (typical), I, H, U, L, and T sections, S235, S275 and S355m36033.17111.245976.96
Hollow core concrete slab, HDF27, C 40/50, 270 mm, 344 kg/m2, reinforcing 12.7 kg/ton (Strängbetong)m246.780.7960.64
Aluminium profile, 2700.0 kg/m3m329,28948.608920
Sandwich panel with polyisocyanurate (PIR) foam and double steel siding, U = 0.21 W/(m2K), 100.9 mm (Total), 0.5 mm (Outer sheet), 0.4 mm (Liner sheet), 100 mm (Insulation), 12.11 kg/m2, 120.02 kg/m3, SAB WB 100.1000 (SAB-profile, Tata Steel Europe)m237.20.2049.92
Aluminium profiled sheets, thickness 0.7 mm, height of profile 65 mm, 2.9 kg/m2 (European Association for Panels and Profiles)m2270.036.24
Cross-laminated timber, 491.65 kg/m3, T: 51–500 mm, max width: 2.95–4.80 m, max length: 16–20 m, X-Lam (Studiengemeinschaft Holzleimbau e.V.)m3187.234.15544.93
Wooden joist floor assembly, 278 mm, incl. 225 mm mineral wool insulationm2360.45132
Timber frame external wall assembly, incl. mineral wool insulationm2650.73110
Table 2. Design variables used in the demonstrator case.
NameBoundsType
Floor area700–2500 m2Continuous
Number of floors2–10Integer
Set of the building’s facade materials1—Brick and Rockwool insulation
2—Steel sandwich panel façade with polyisocyanurate insulation
3—Timber frame façade with mineral wool insulation
Categorical
Set of the building’s structural frame materials1—Concrete frame
2—Structural steel profile frame and a hollow concrete slabs floor
3—Cross-laminated timber frame with a wooden joist floor
Categorical
Distance from a railway station0.2–15 kmContinuous
Table 3. ga solver parameters.
ParameterValue
Population size (‘PopulationSize’)250
Max. generations (‘MaxGenerations’)400
Max. stall generations (‘MaxStallGenerations’)20
Function Tolerance (‘FunctionTolerance’)1E-9
Vectorized form (‘UseVectorized’)true
Elite population size (‘EliteCount’)30
Crossover fraction (‘CrossoverFraction’)0.5
Table 4. Minima and maxima of objective functions.
NameMinimum Value Given the Design Variables’ BoundsMaximum Value Given the Design Variables’ Bounds
Embodied carbon, kg CO2eq241,9503,992,042
Construction costs, EUR 272,6755,636,095
Profit from rent, EUR288,9785,162,471
Location, km0.215
Publisher’s Note: MDPI stays neutral with regard to jurisdictional claims in published maps and institutional affiliations.

