
Implementation of BIM Energy Analysis and Monte Carlo Simulation for Estimating Building Energy Performance Based on Regression Approach: A Case Study

 ,
,  ,
,
Abstract
:1. Introduction
2. Literature Review
3. Methodology
3.1. BIM Modeling
3.2. Building Elements and Properties
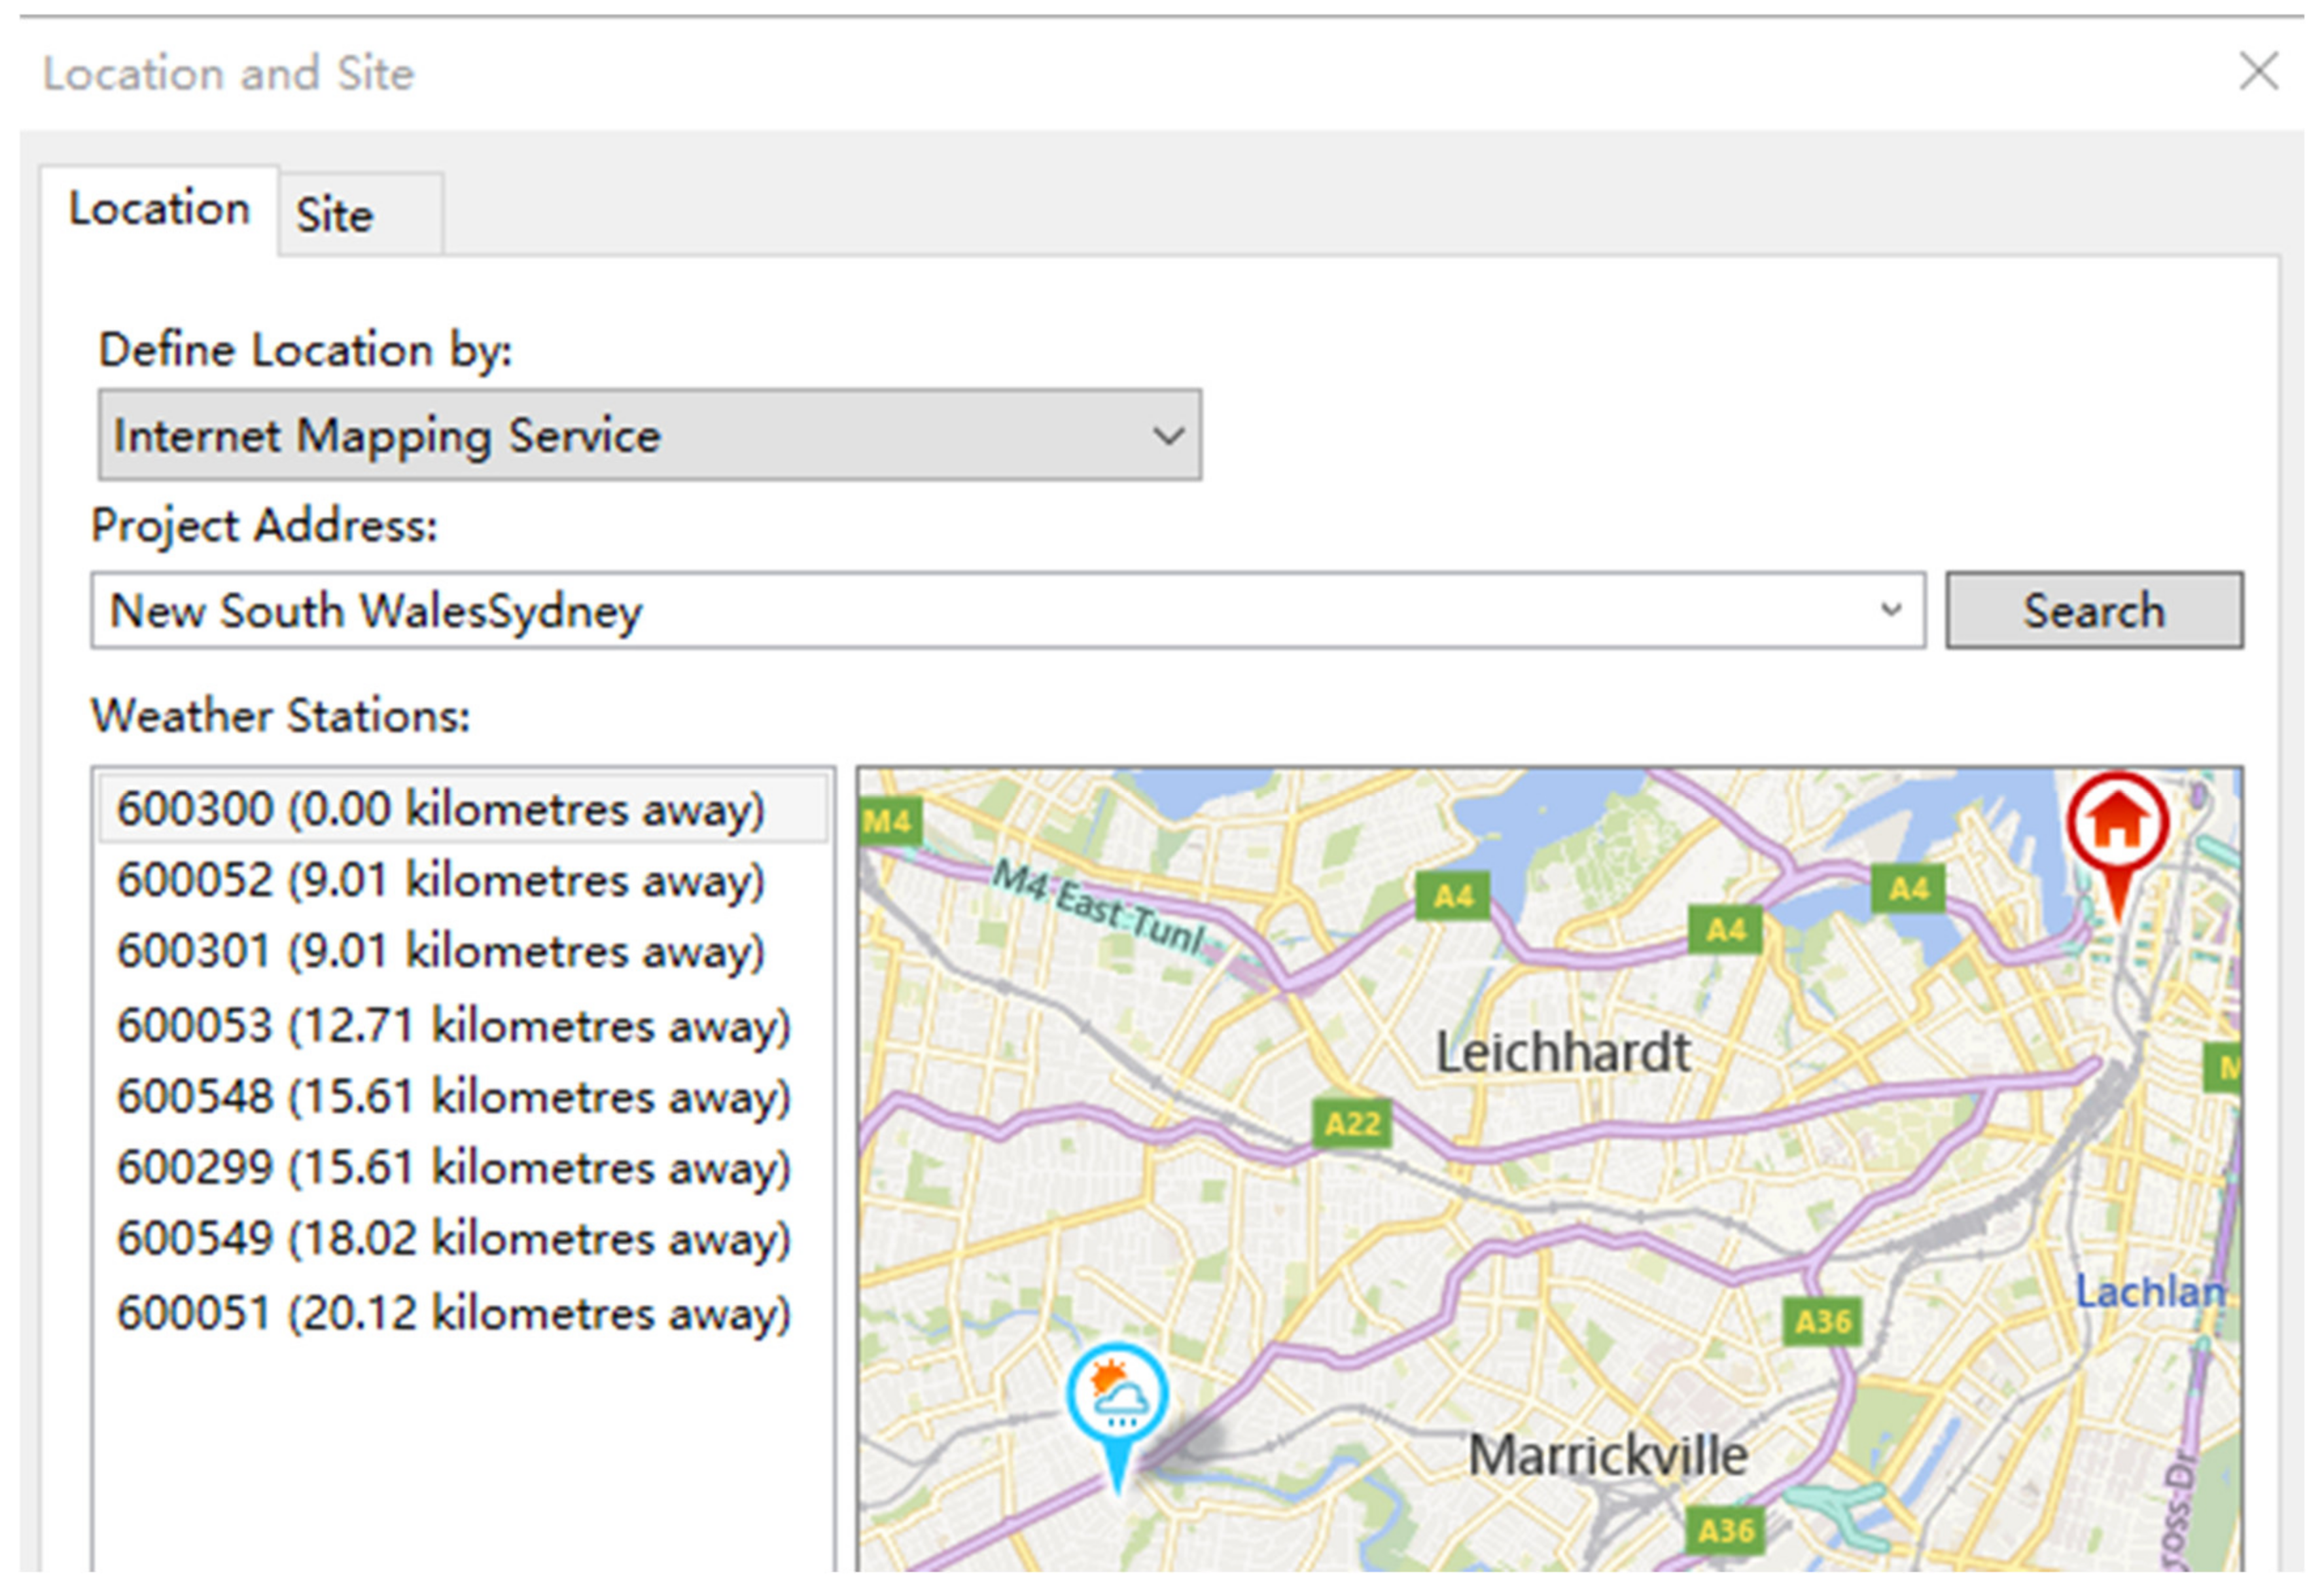
3.3. Energy Simulation in Green Building Studio
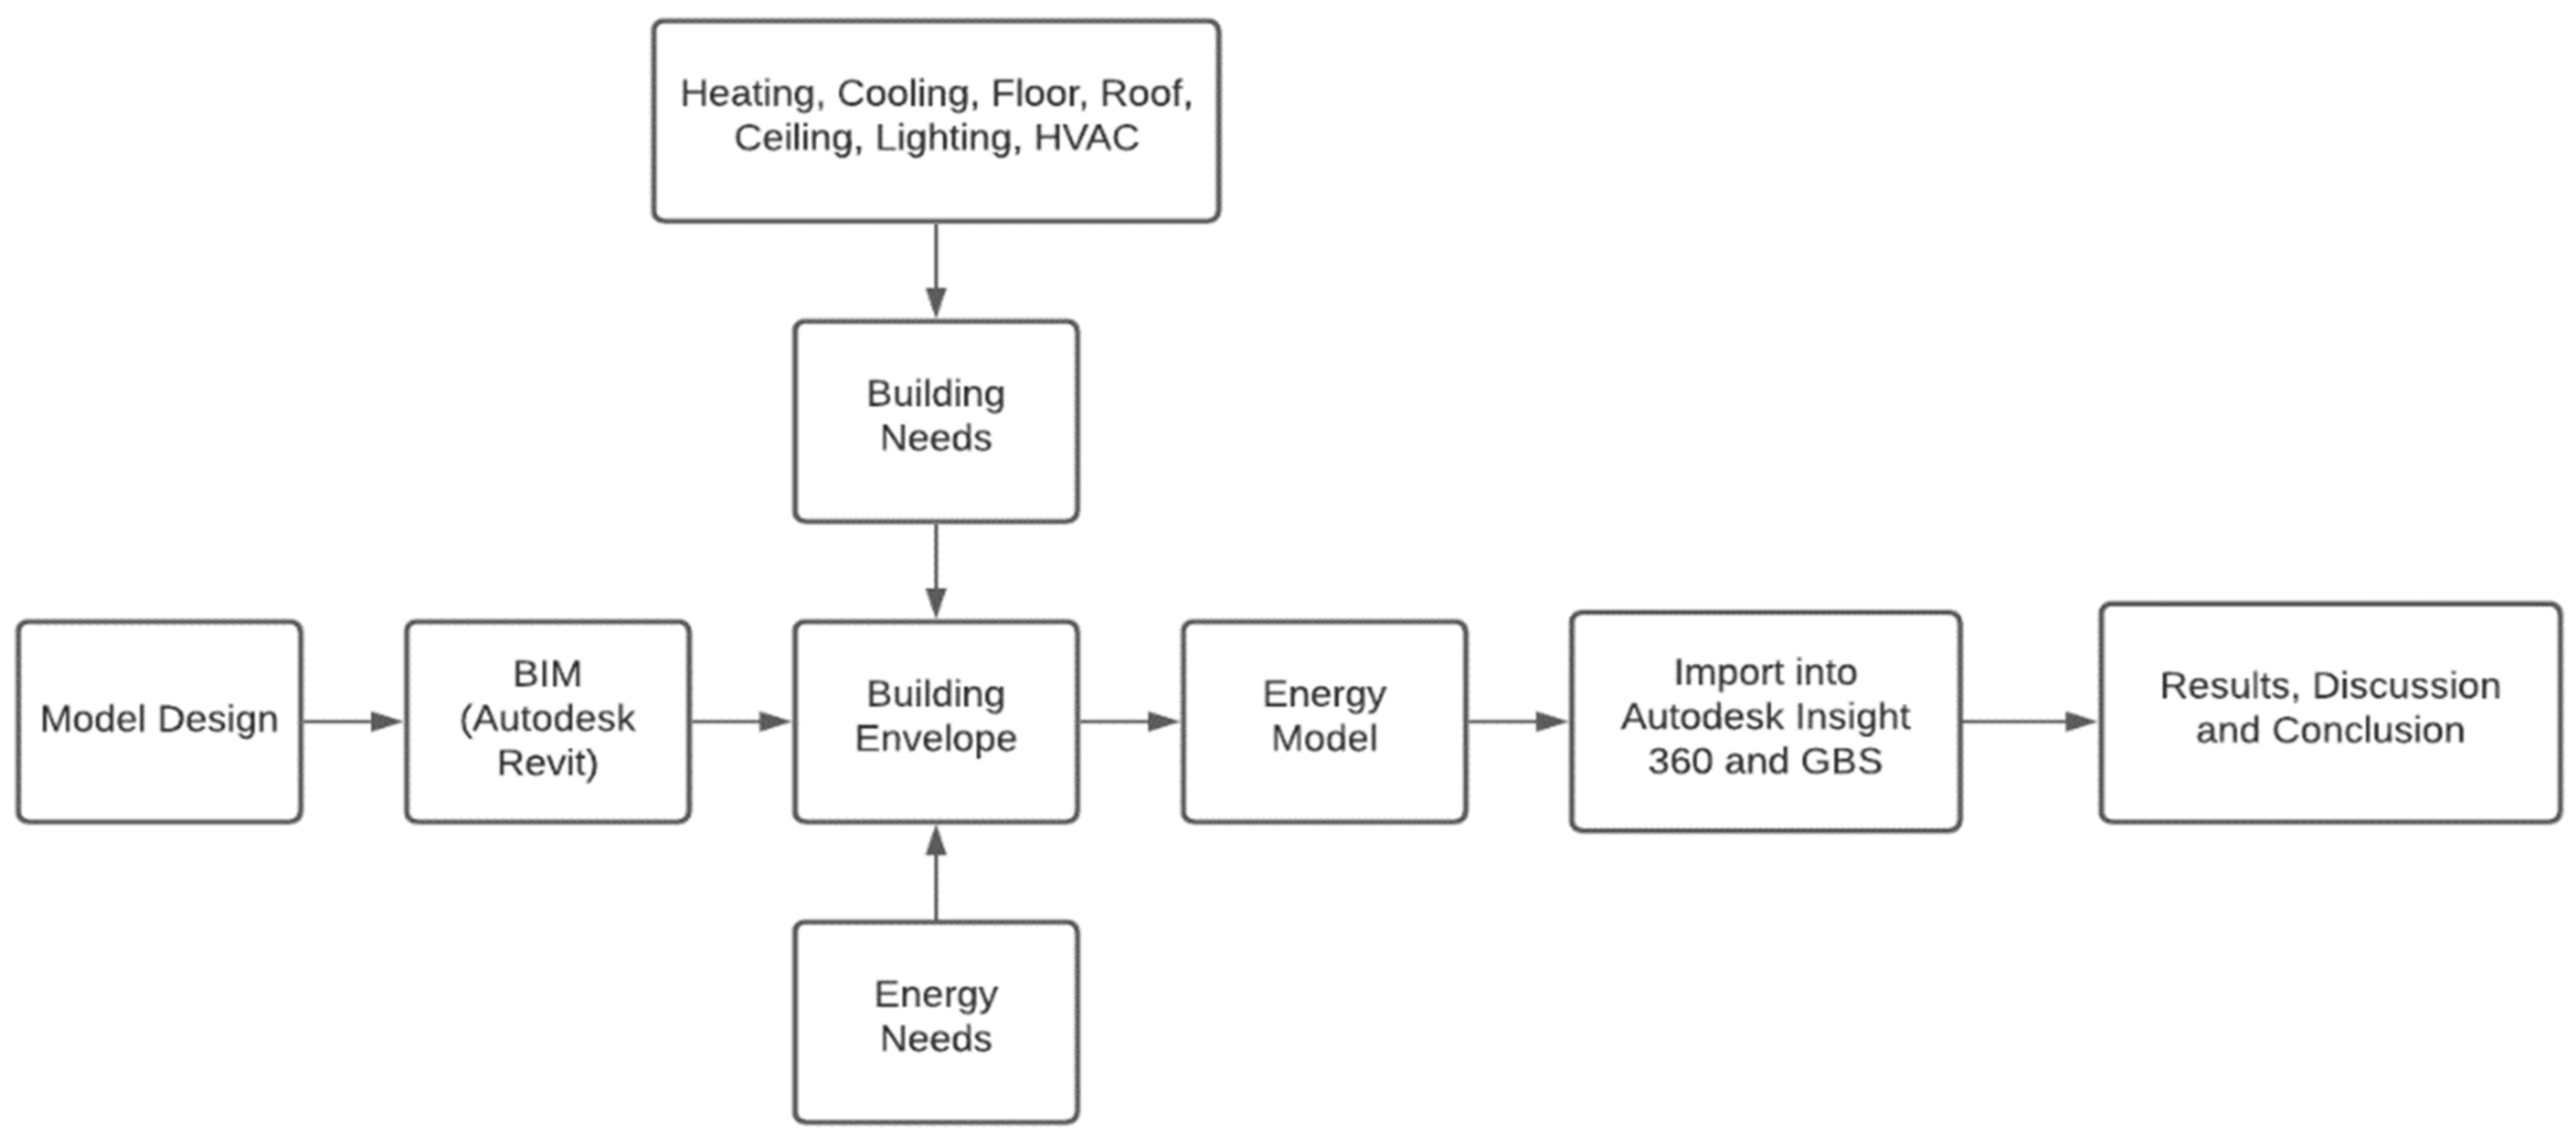
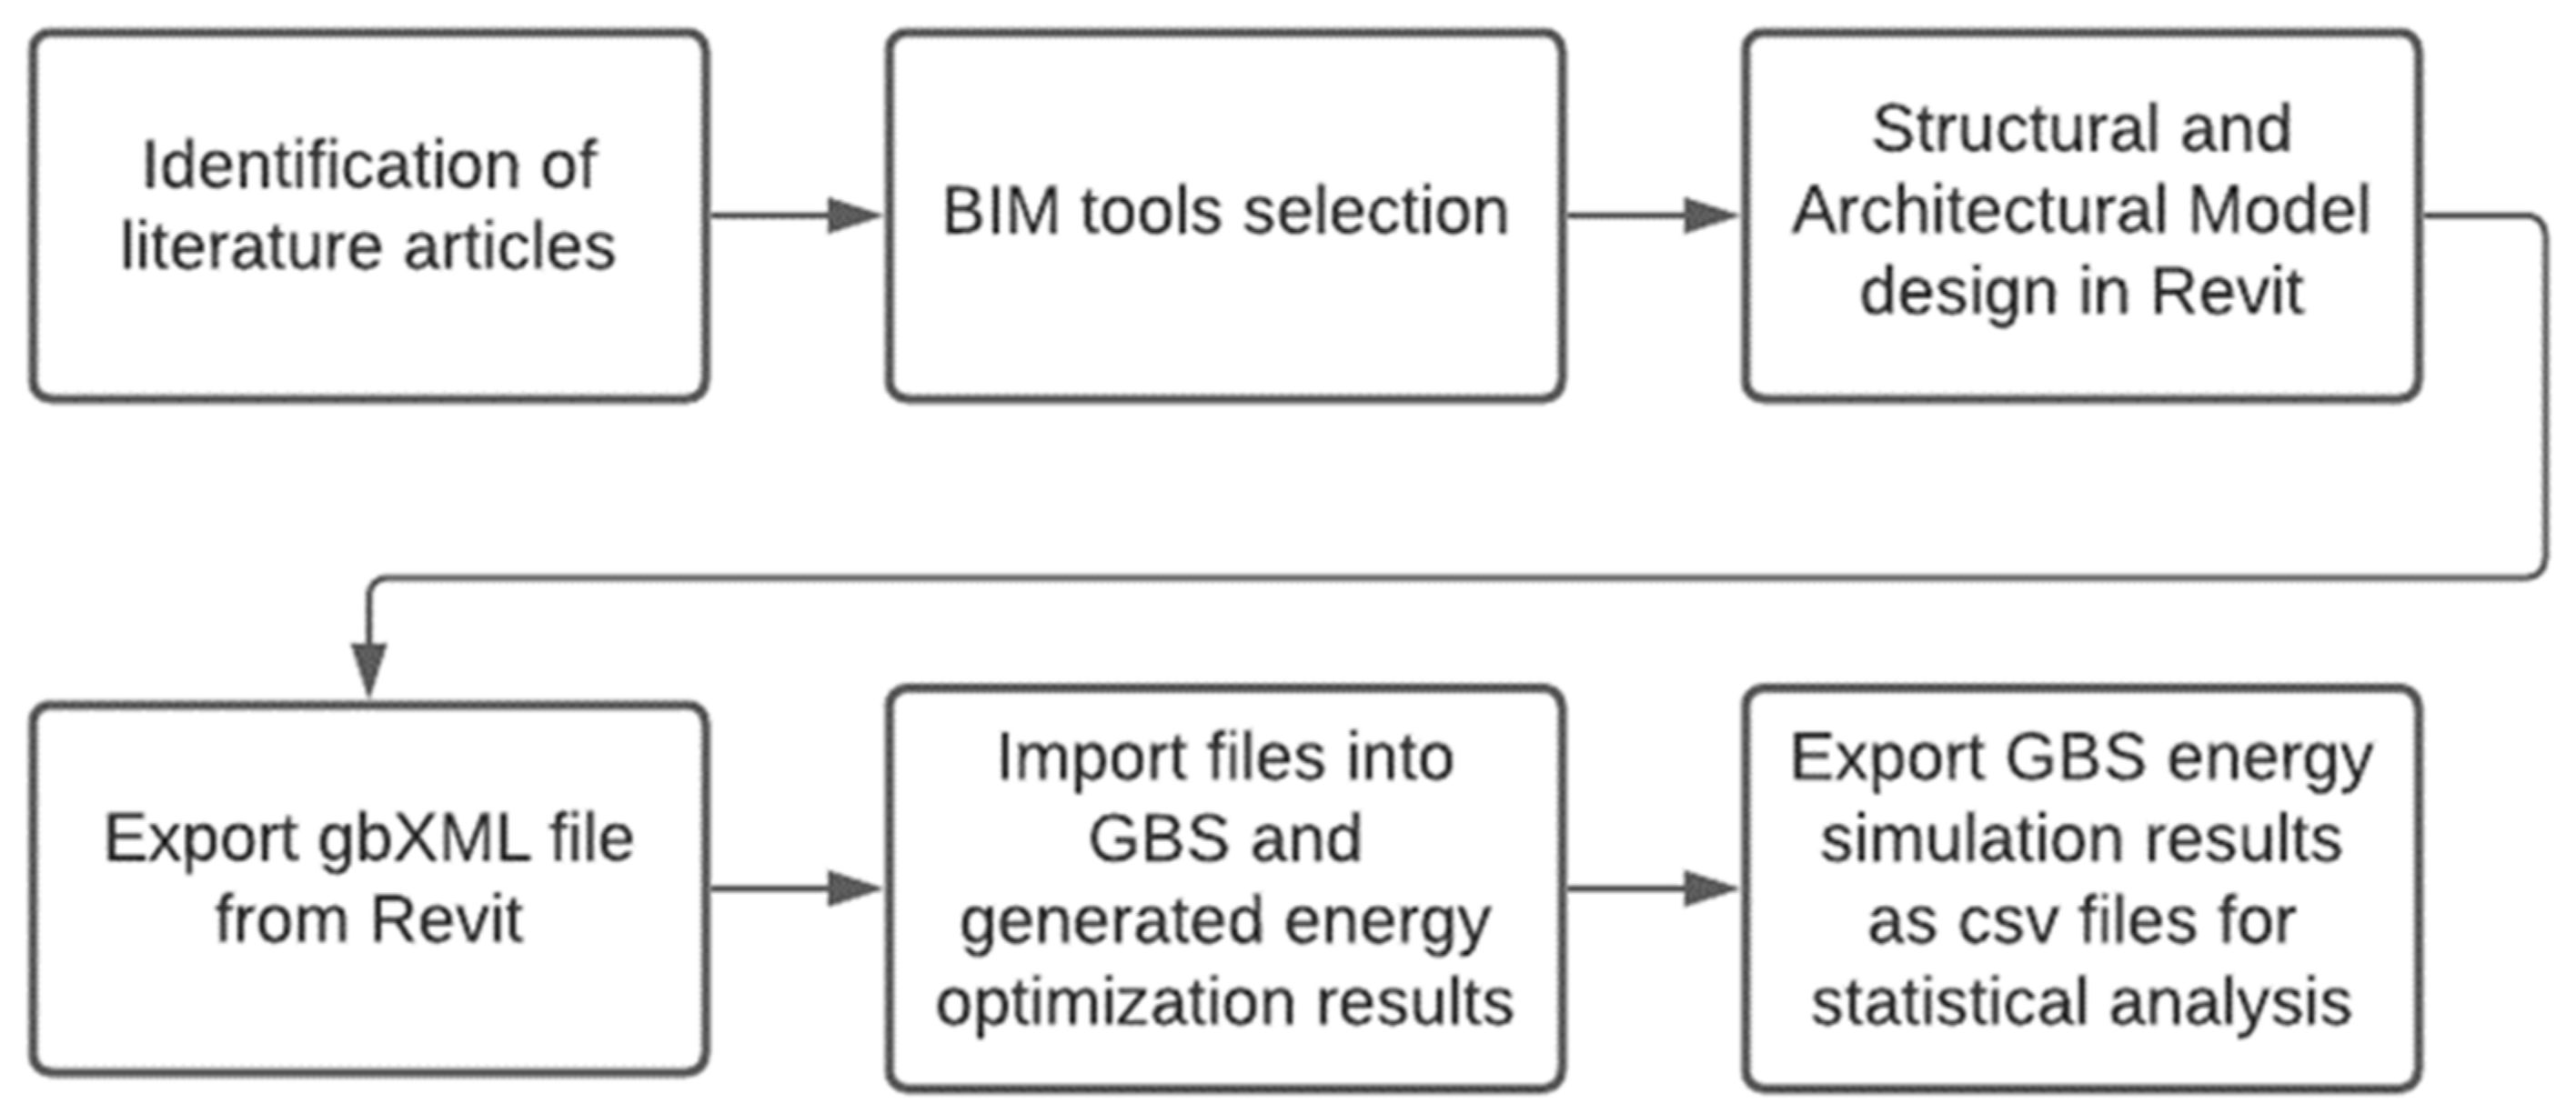
3.3.1. Energy Simulation Workflow
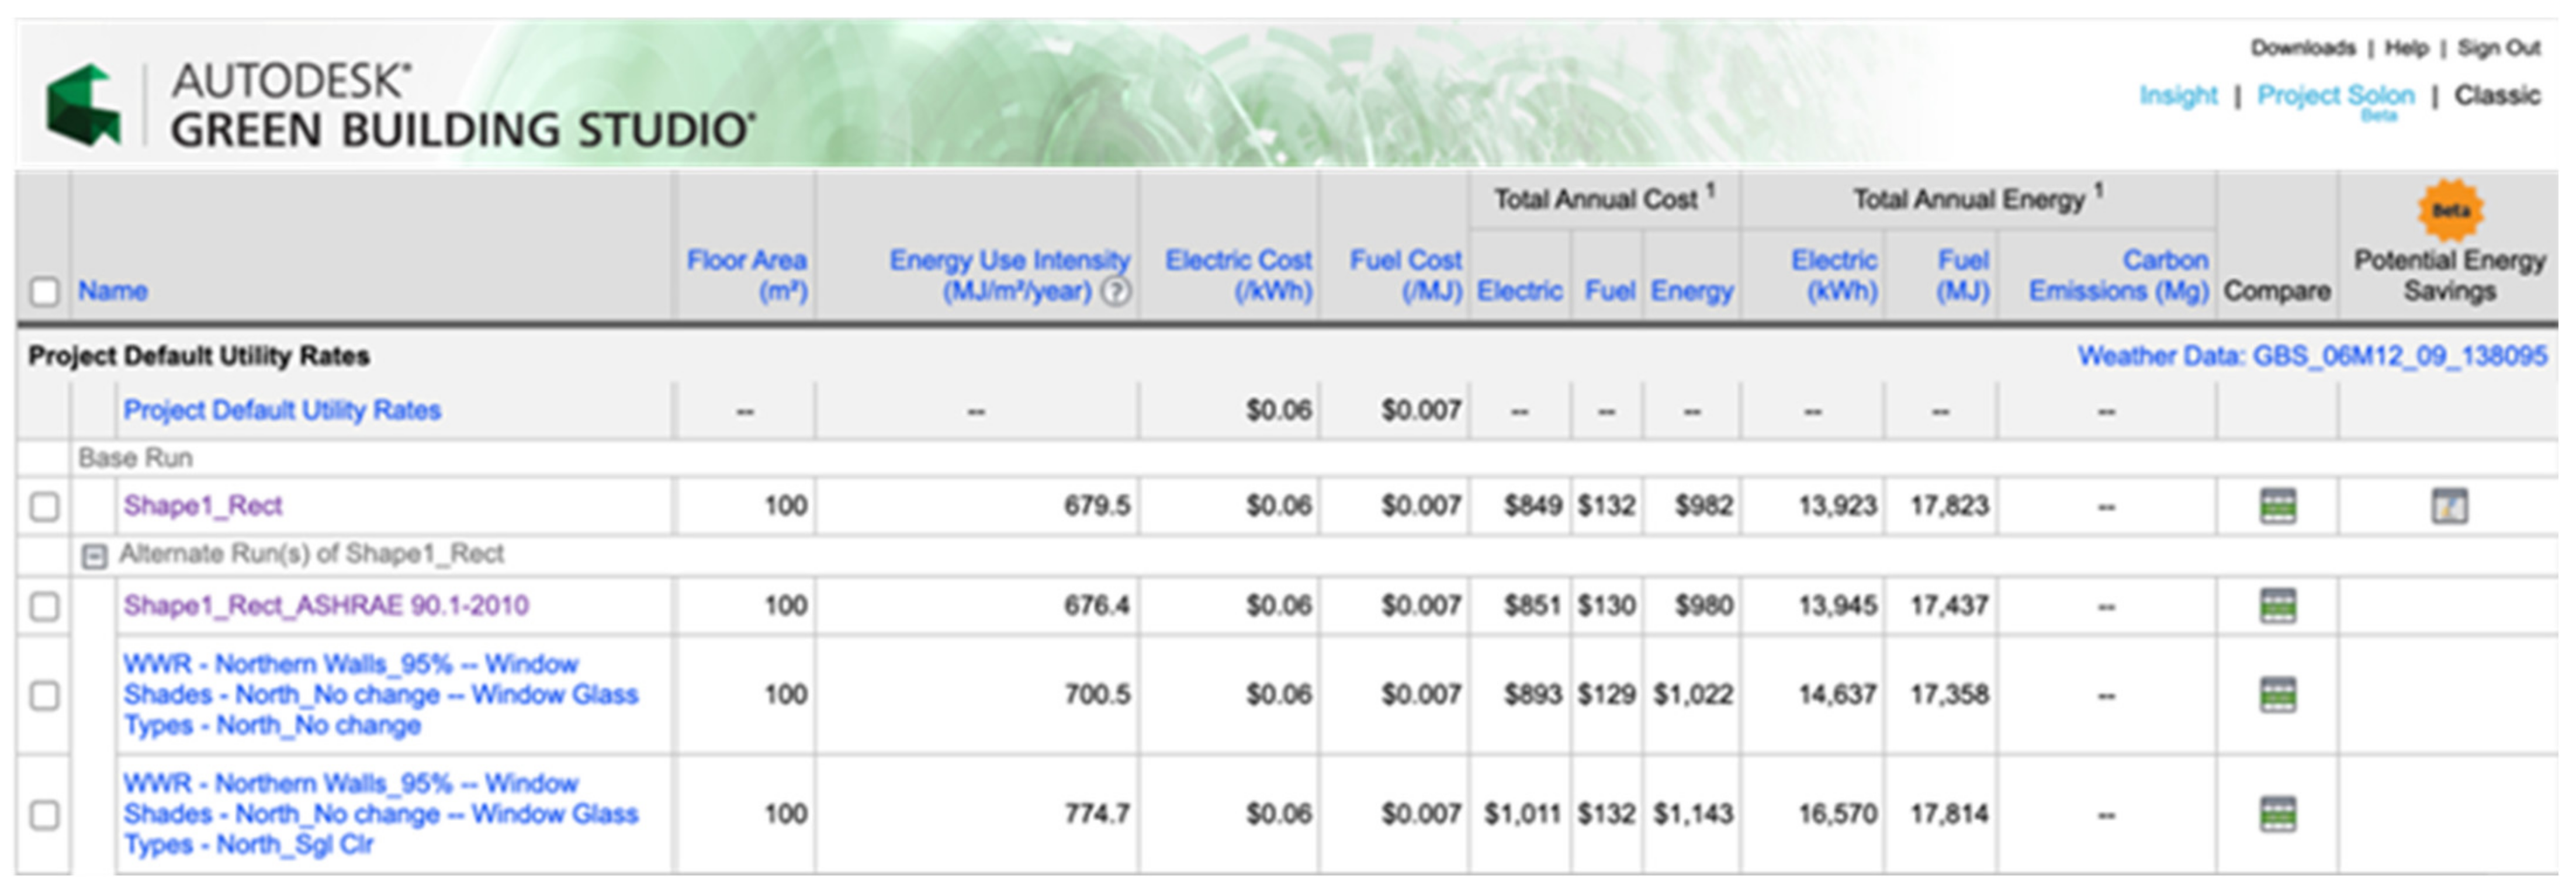
3.3.2. Energy Simulation Outputs
- Customizable charts of heat or cooling loads;
- Energy use intensity (EUI);
- Electric cost and fuel cost;
- Customizable parametric studies;
- Annual carbon footprint;
- Building properties summary of construction areas, equipment capacities;
- Design review file.
3.3.3. Assumptions and Default Values in GBS
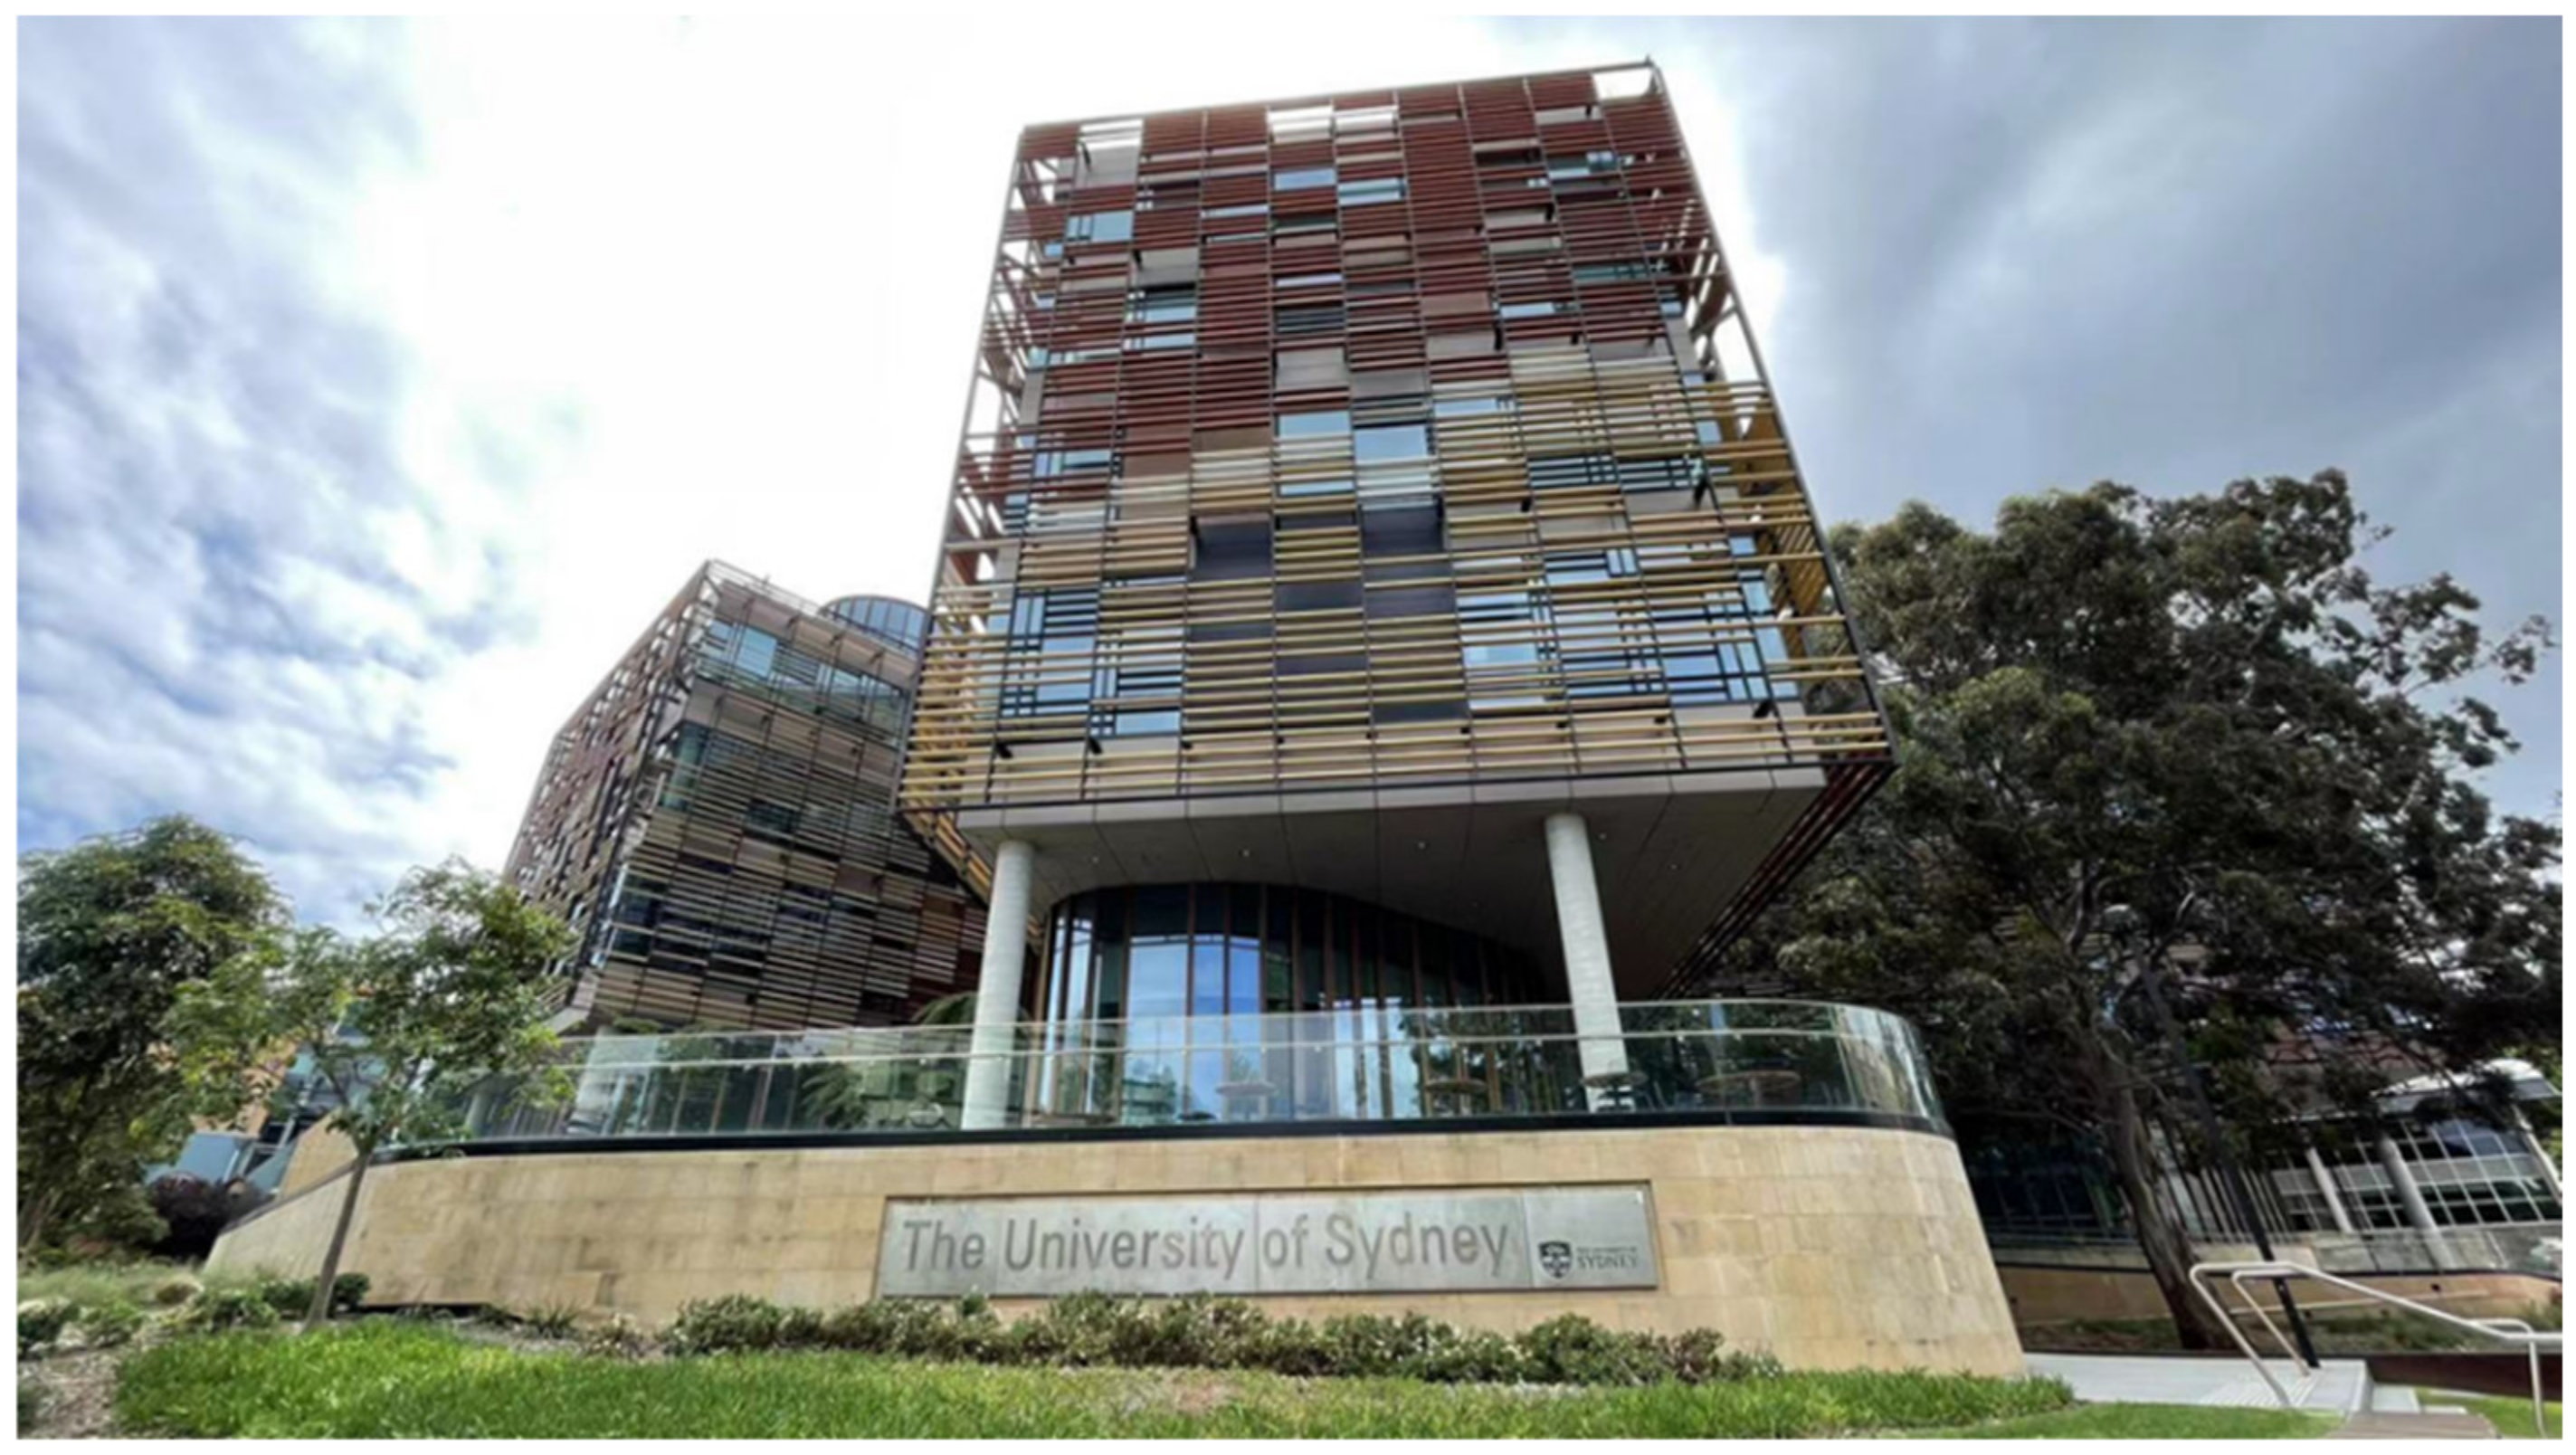
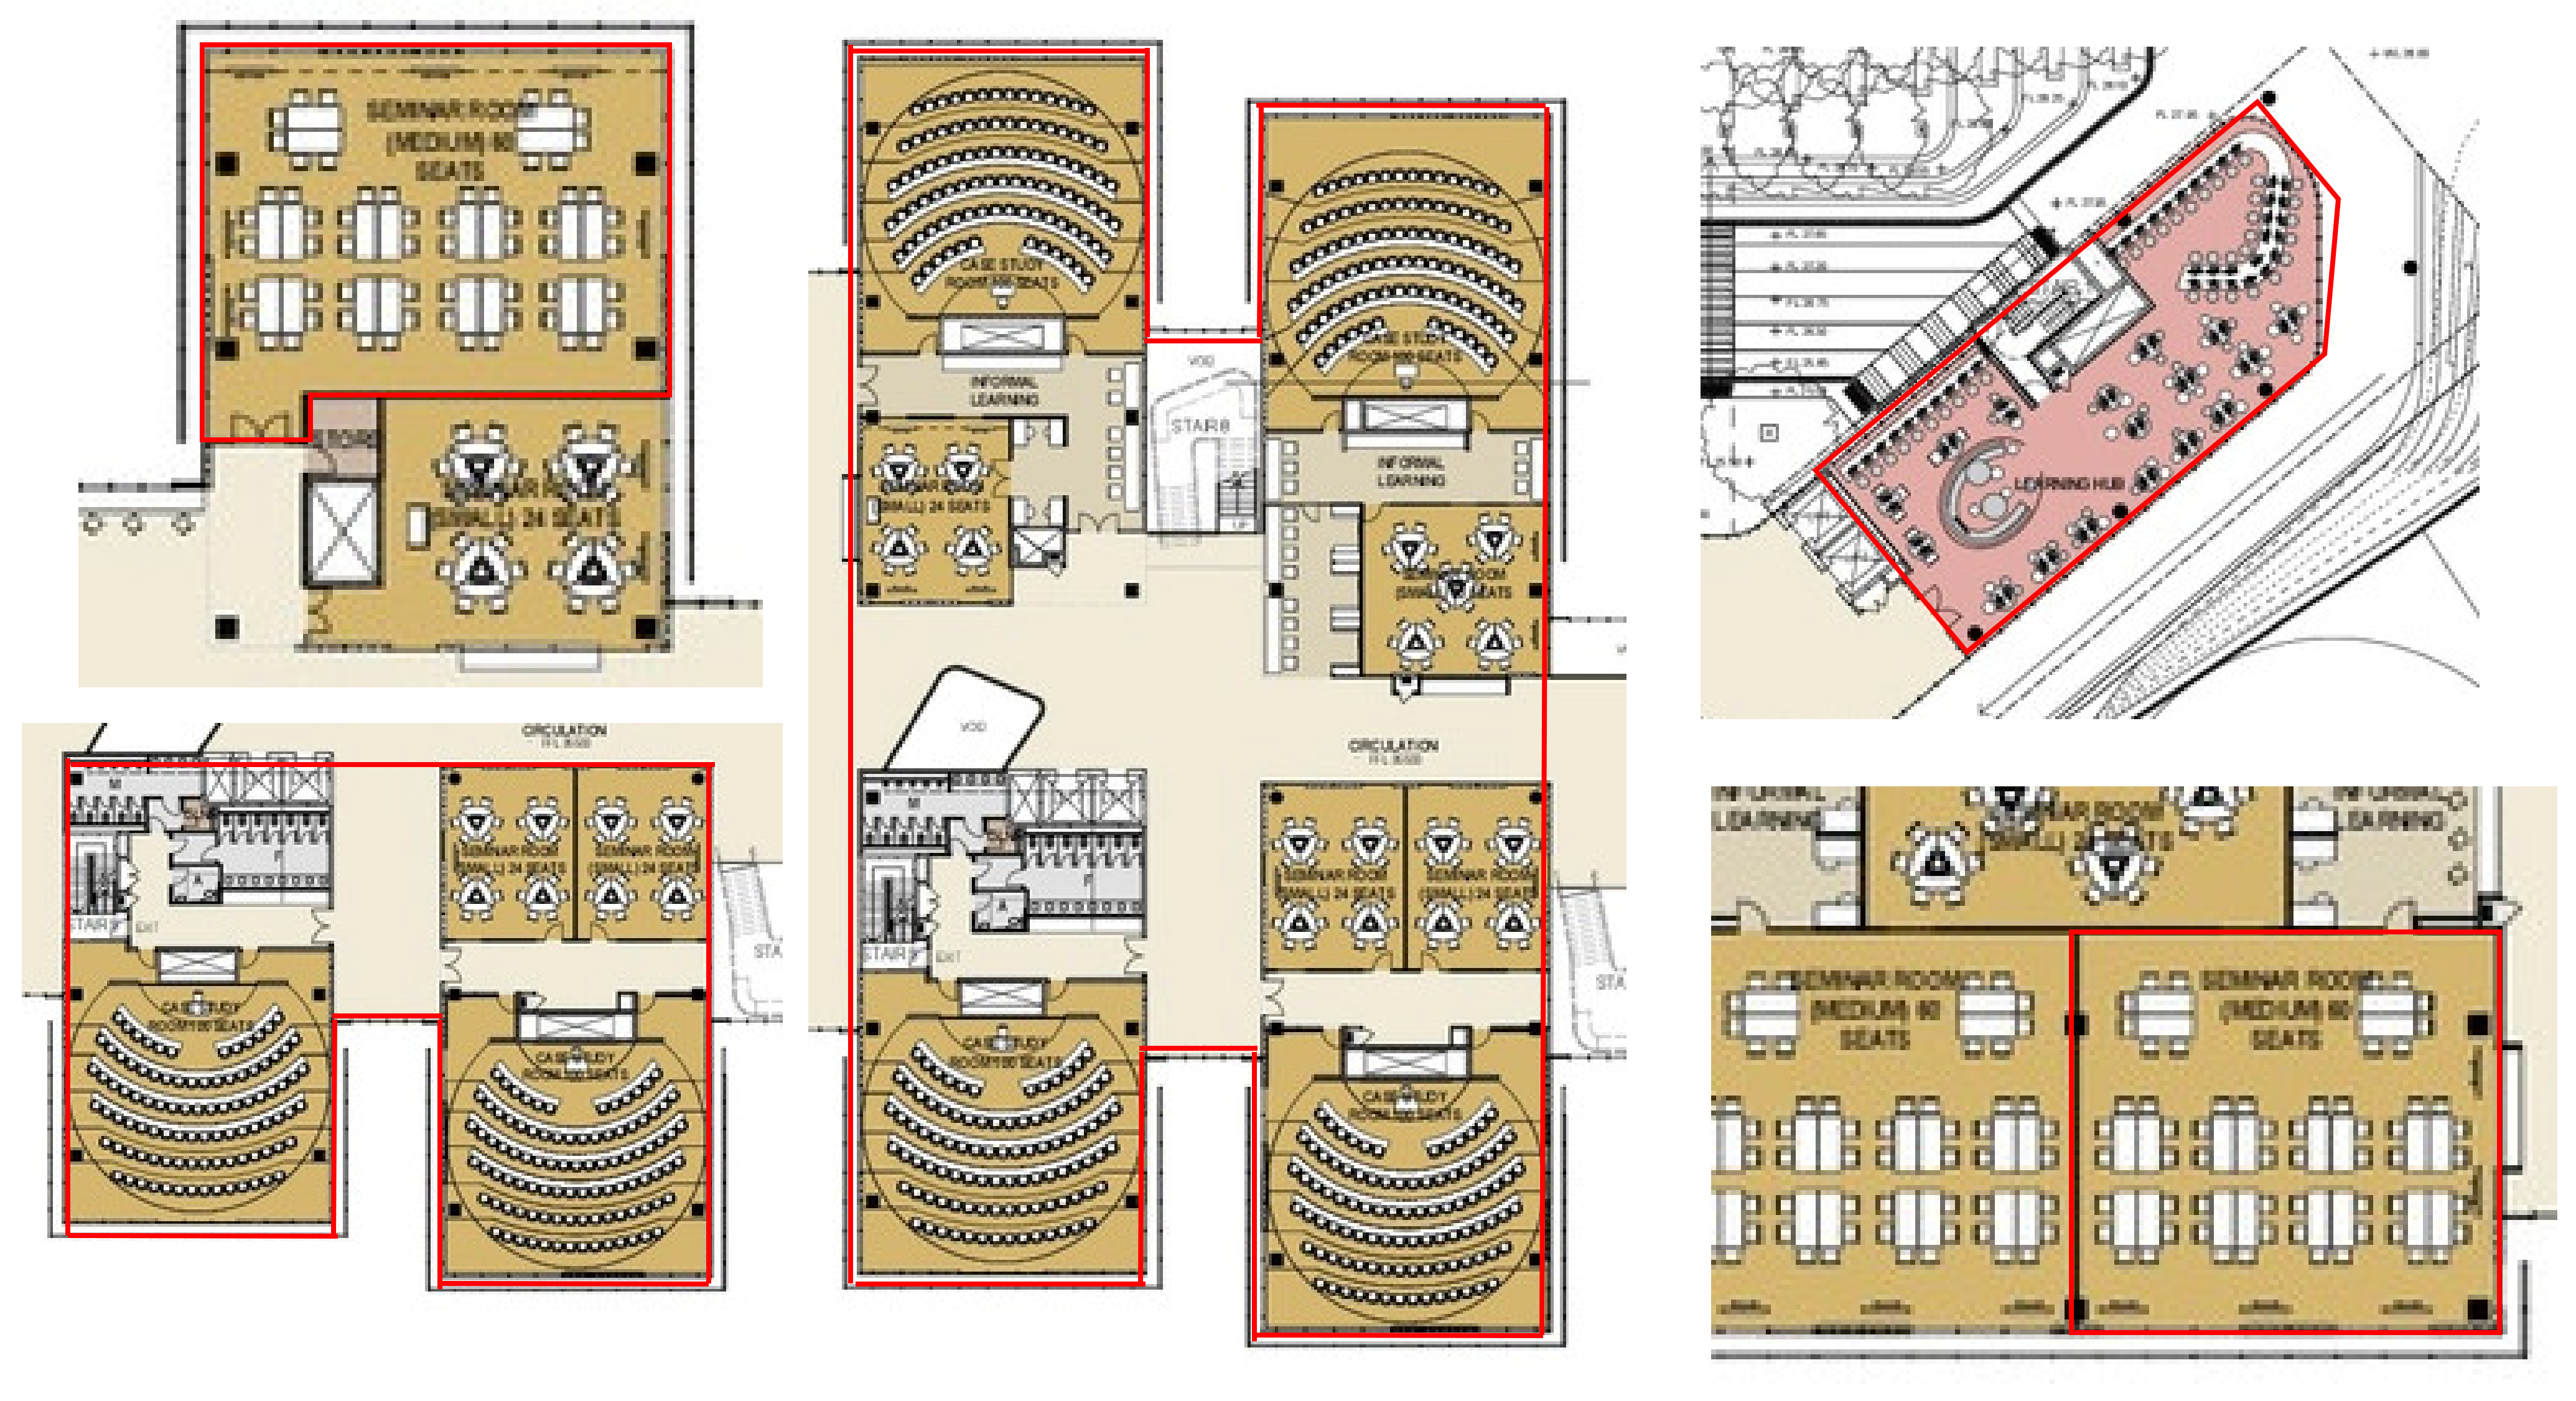
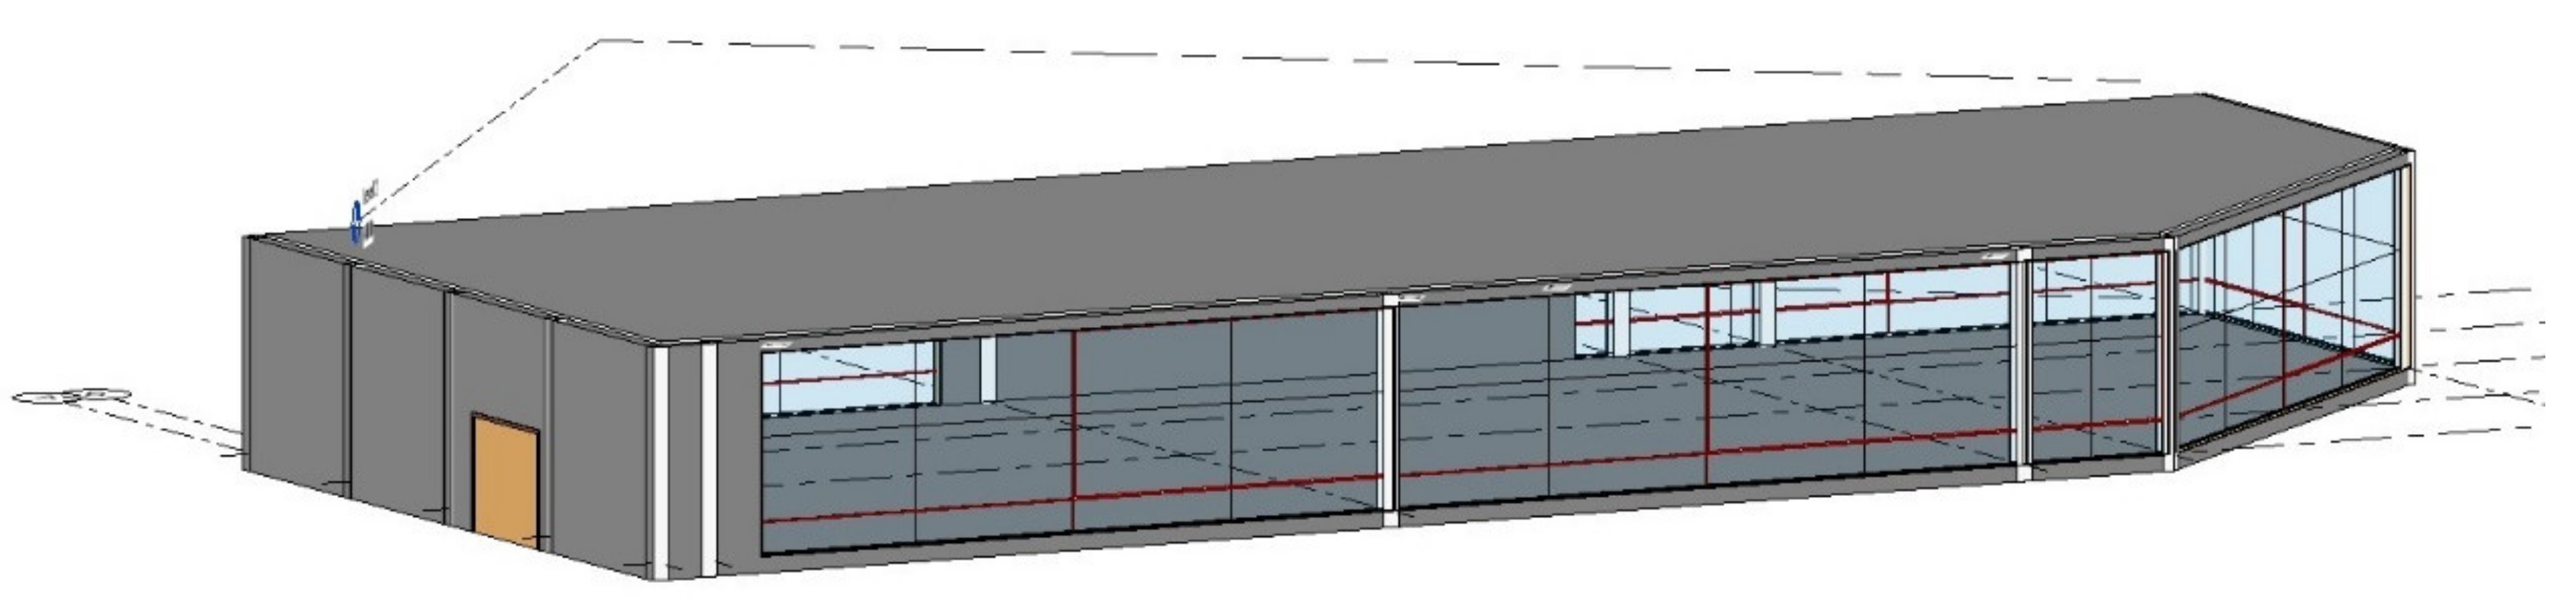
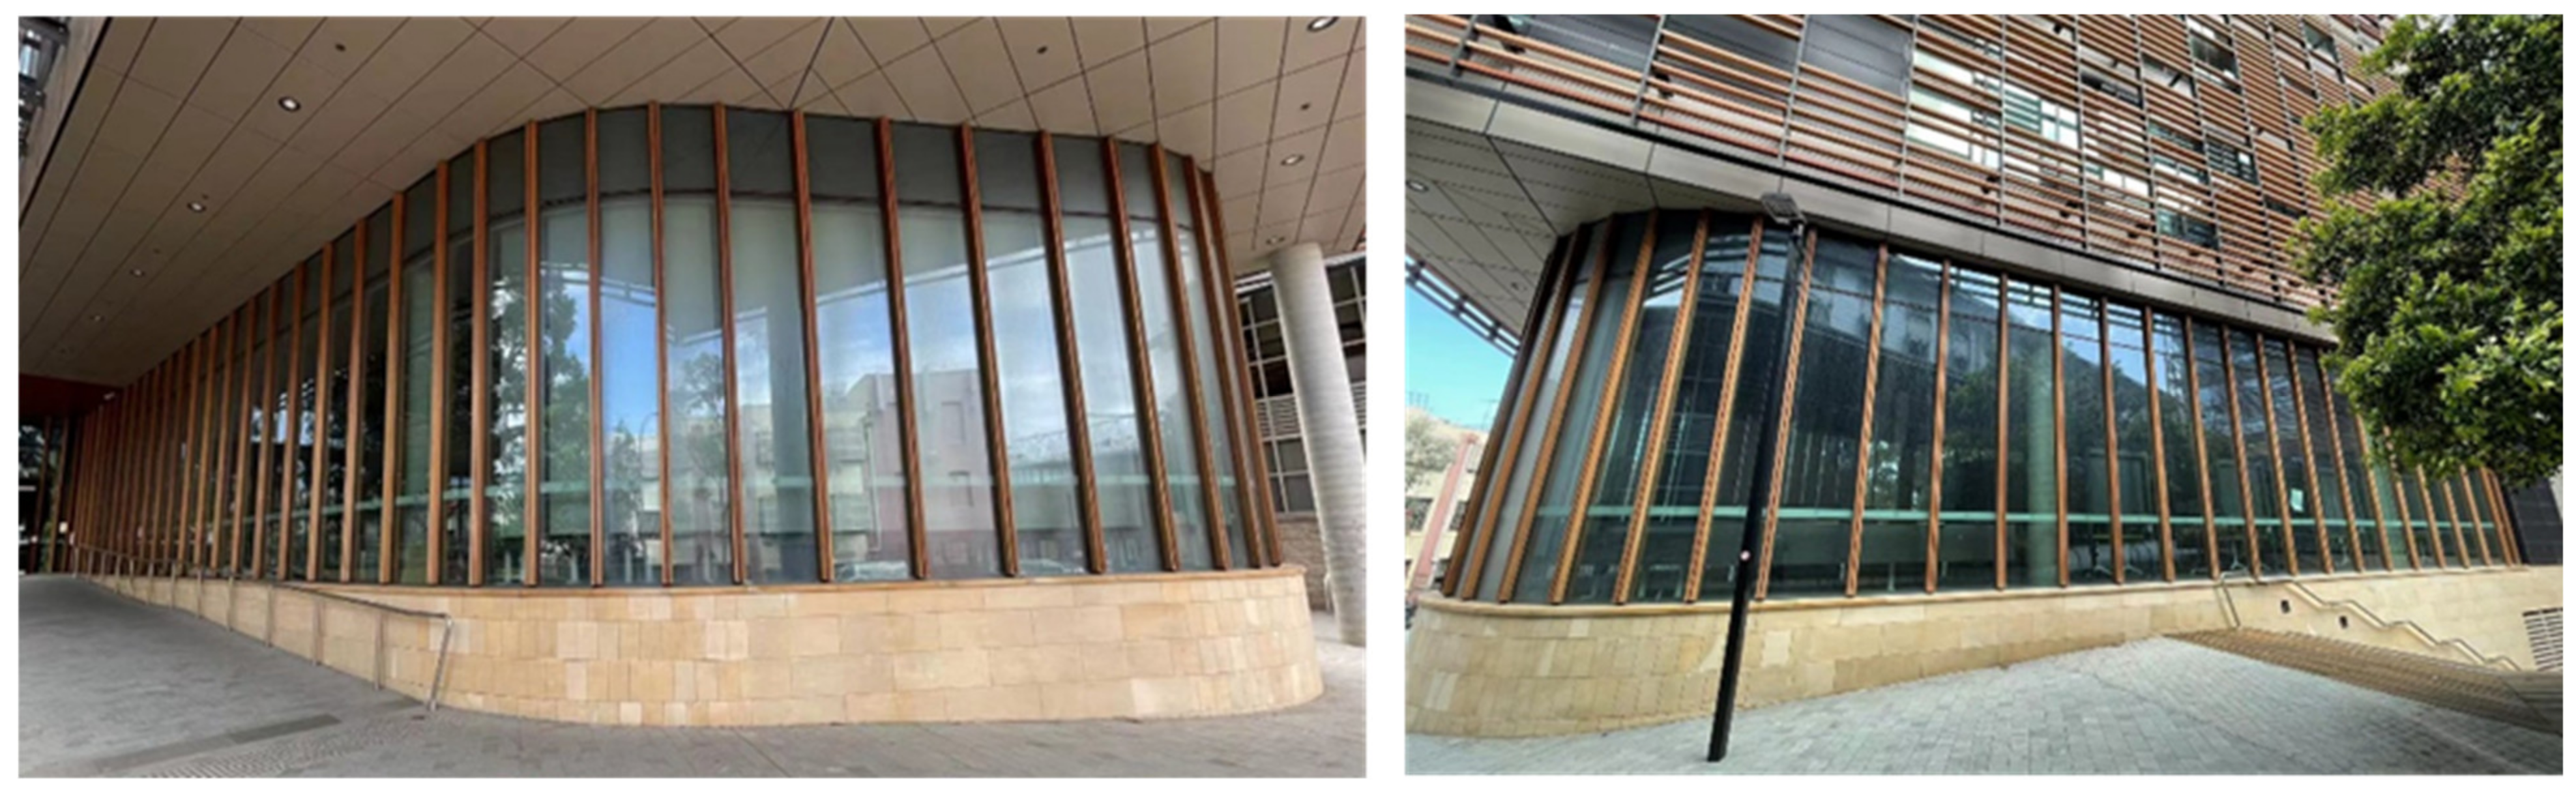
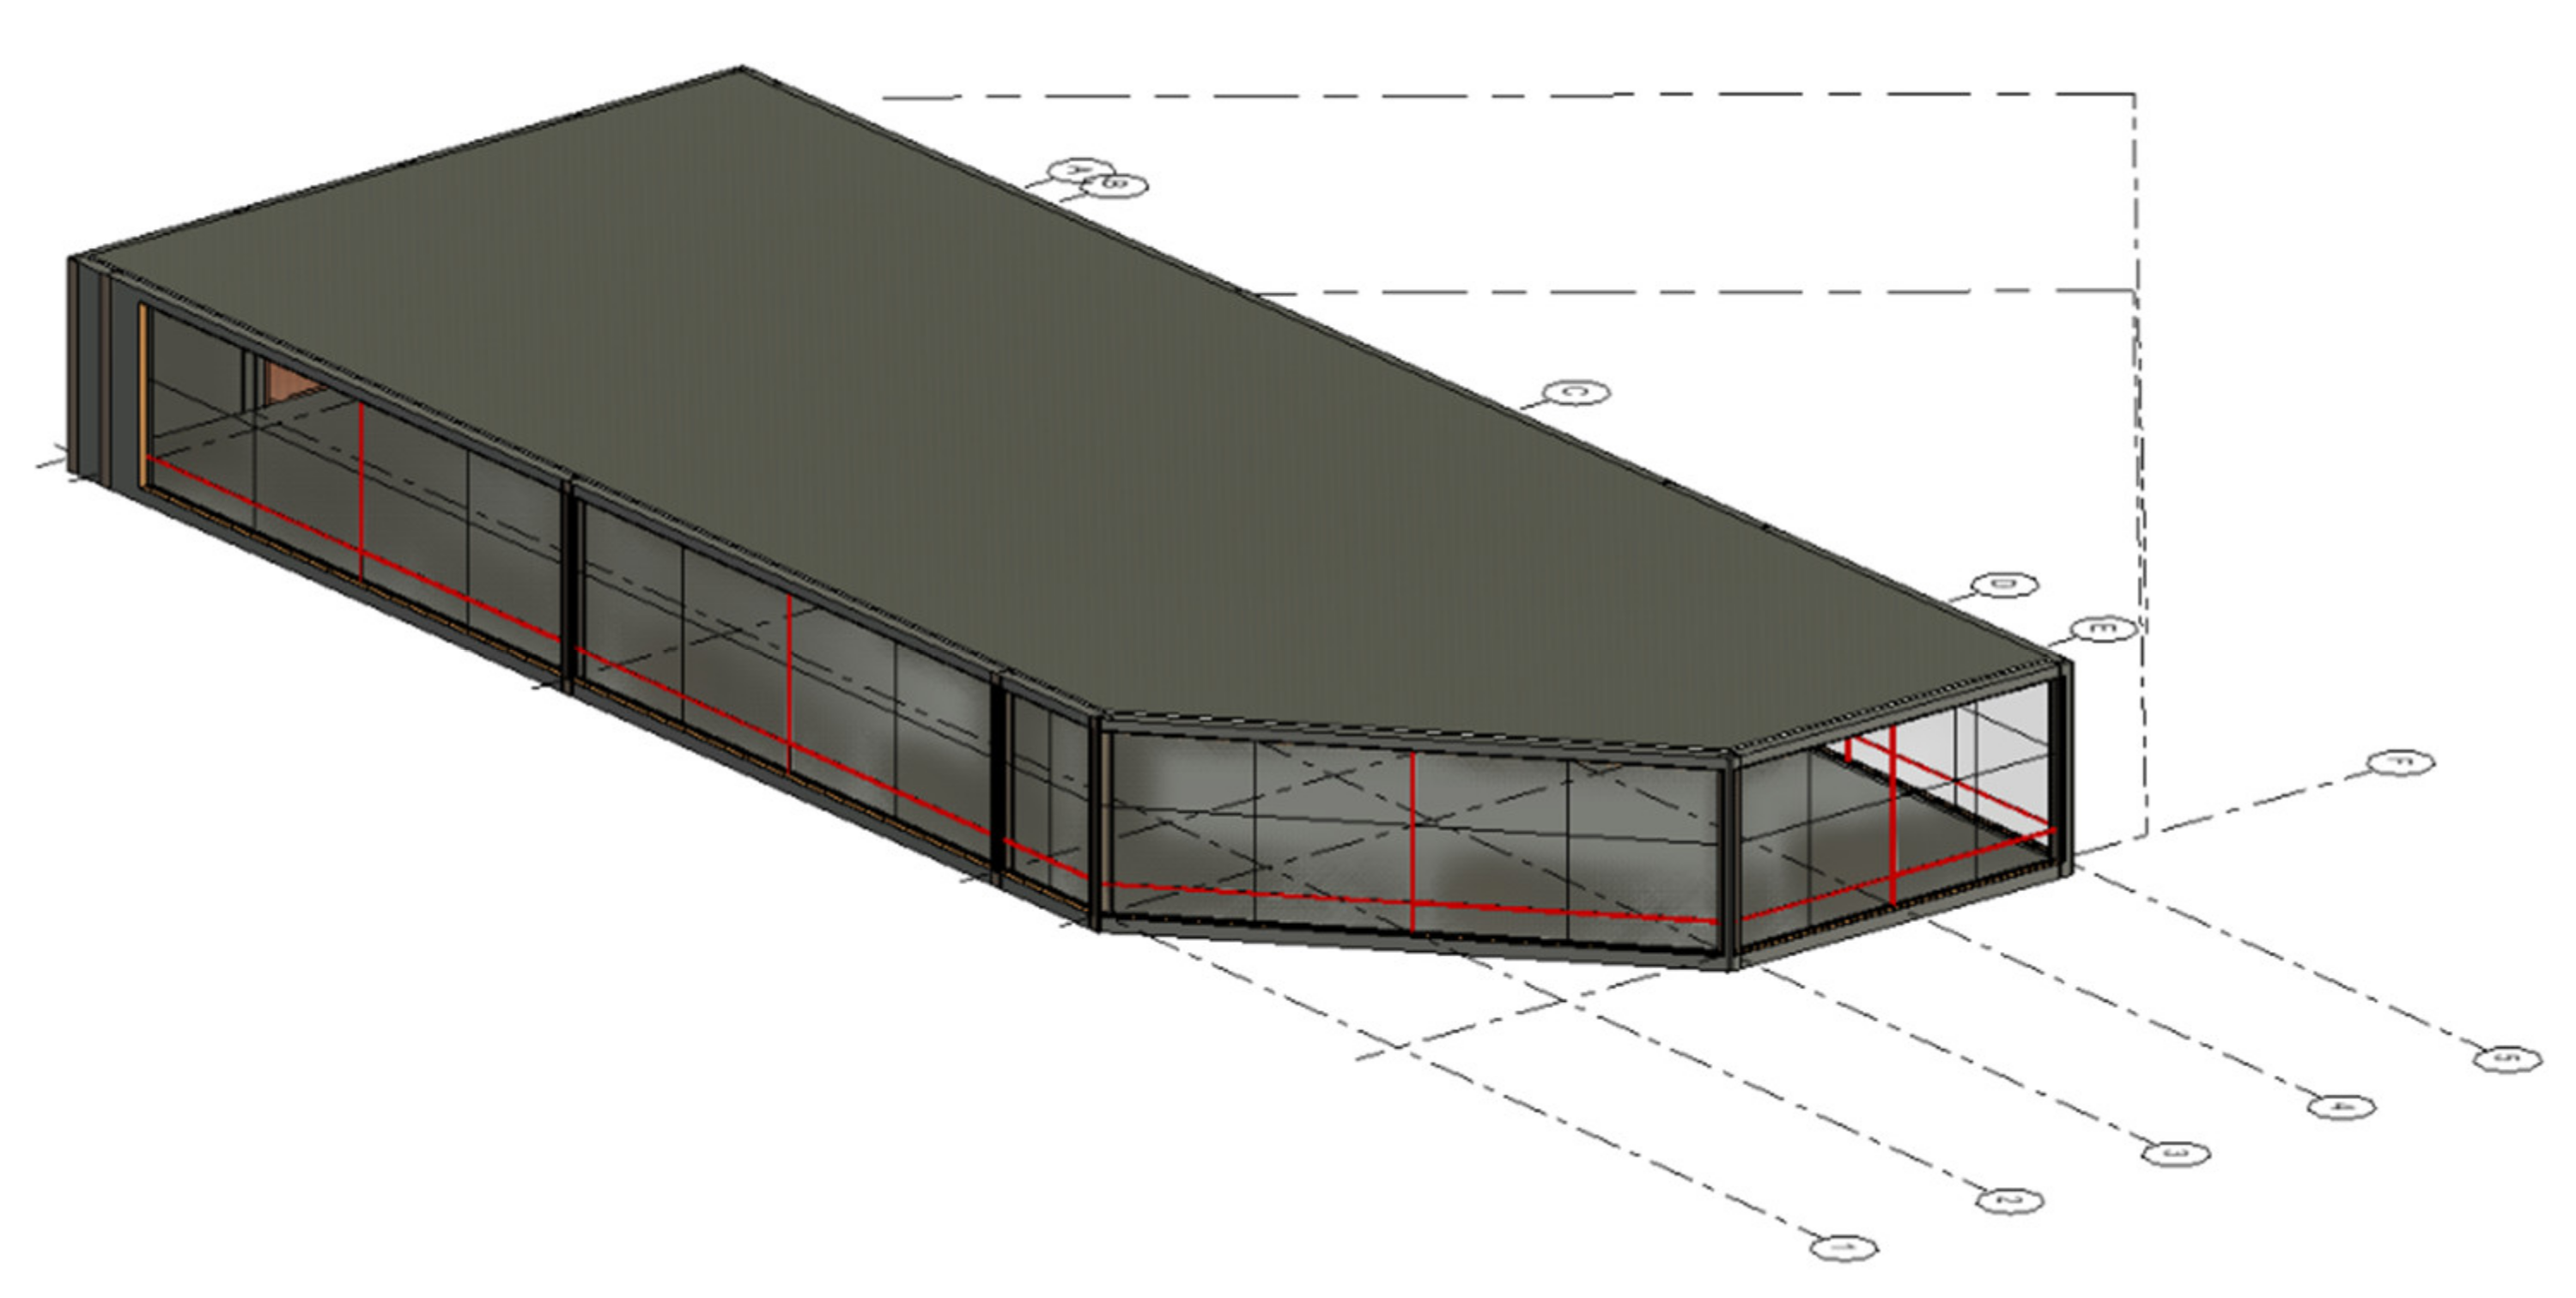
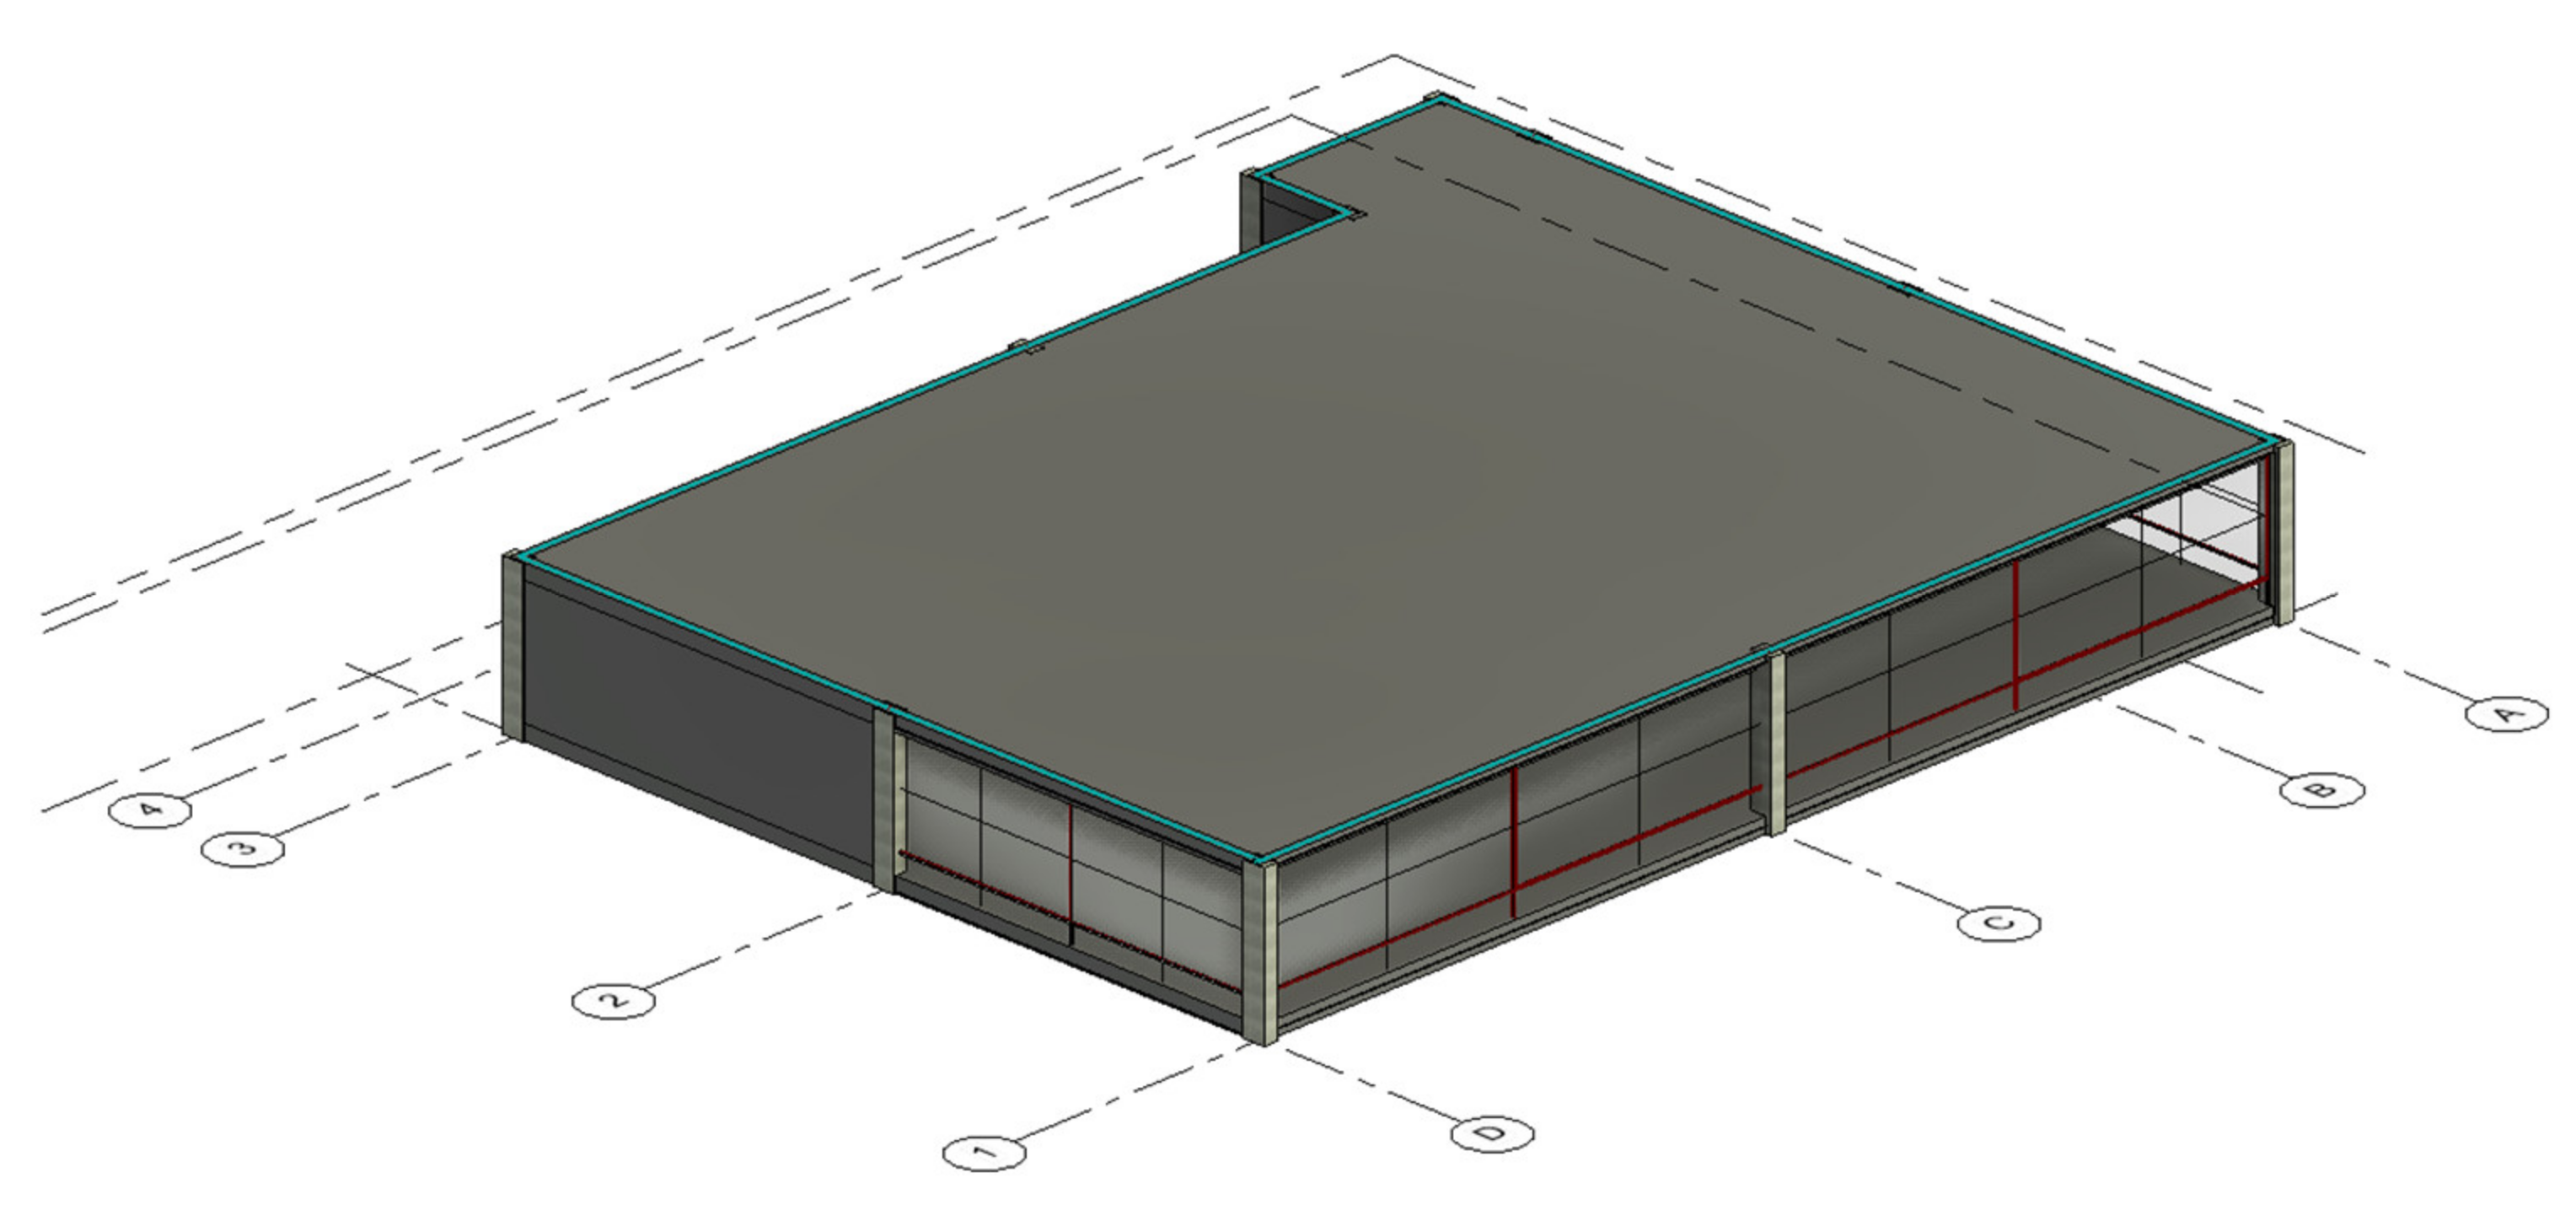
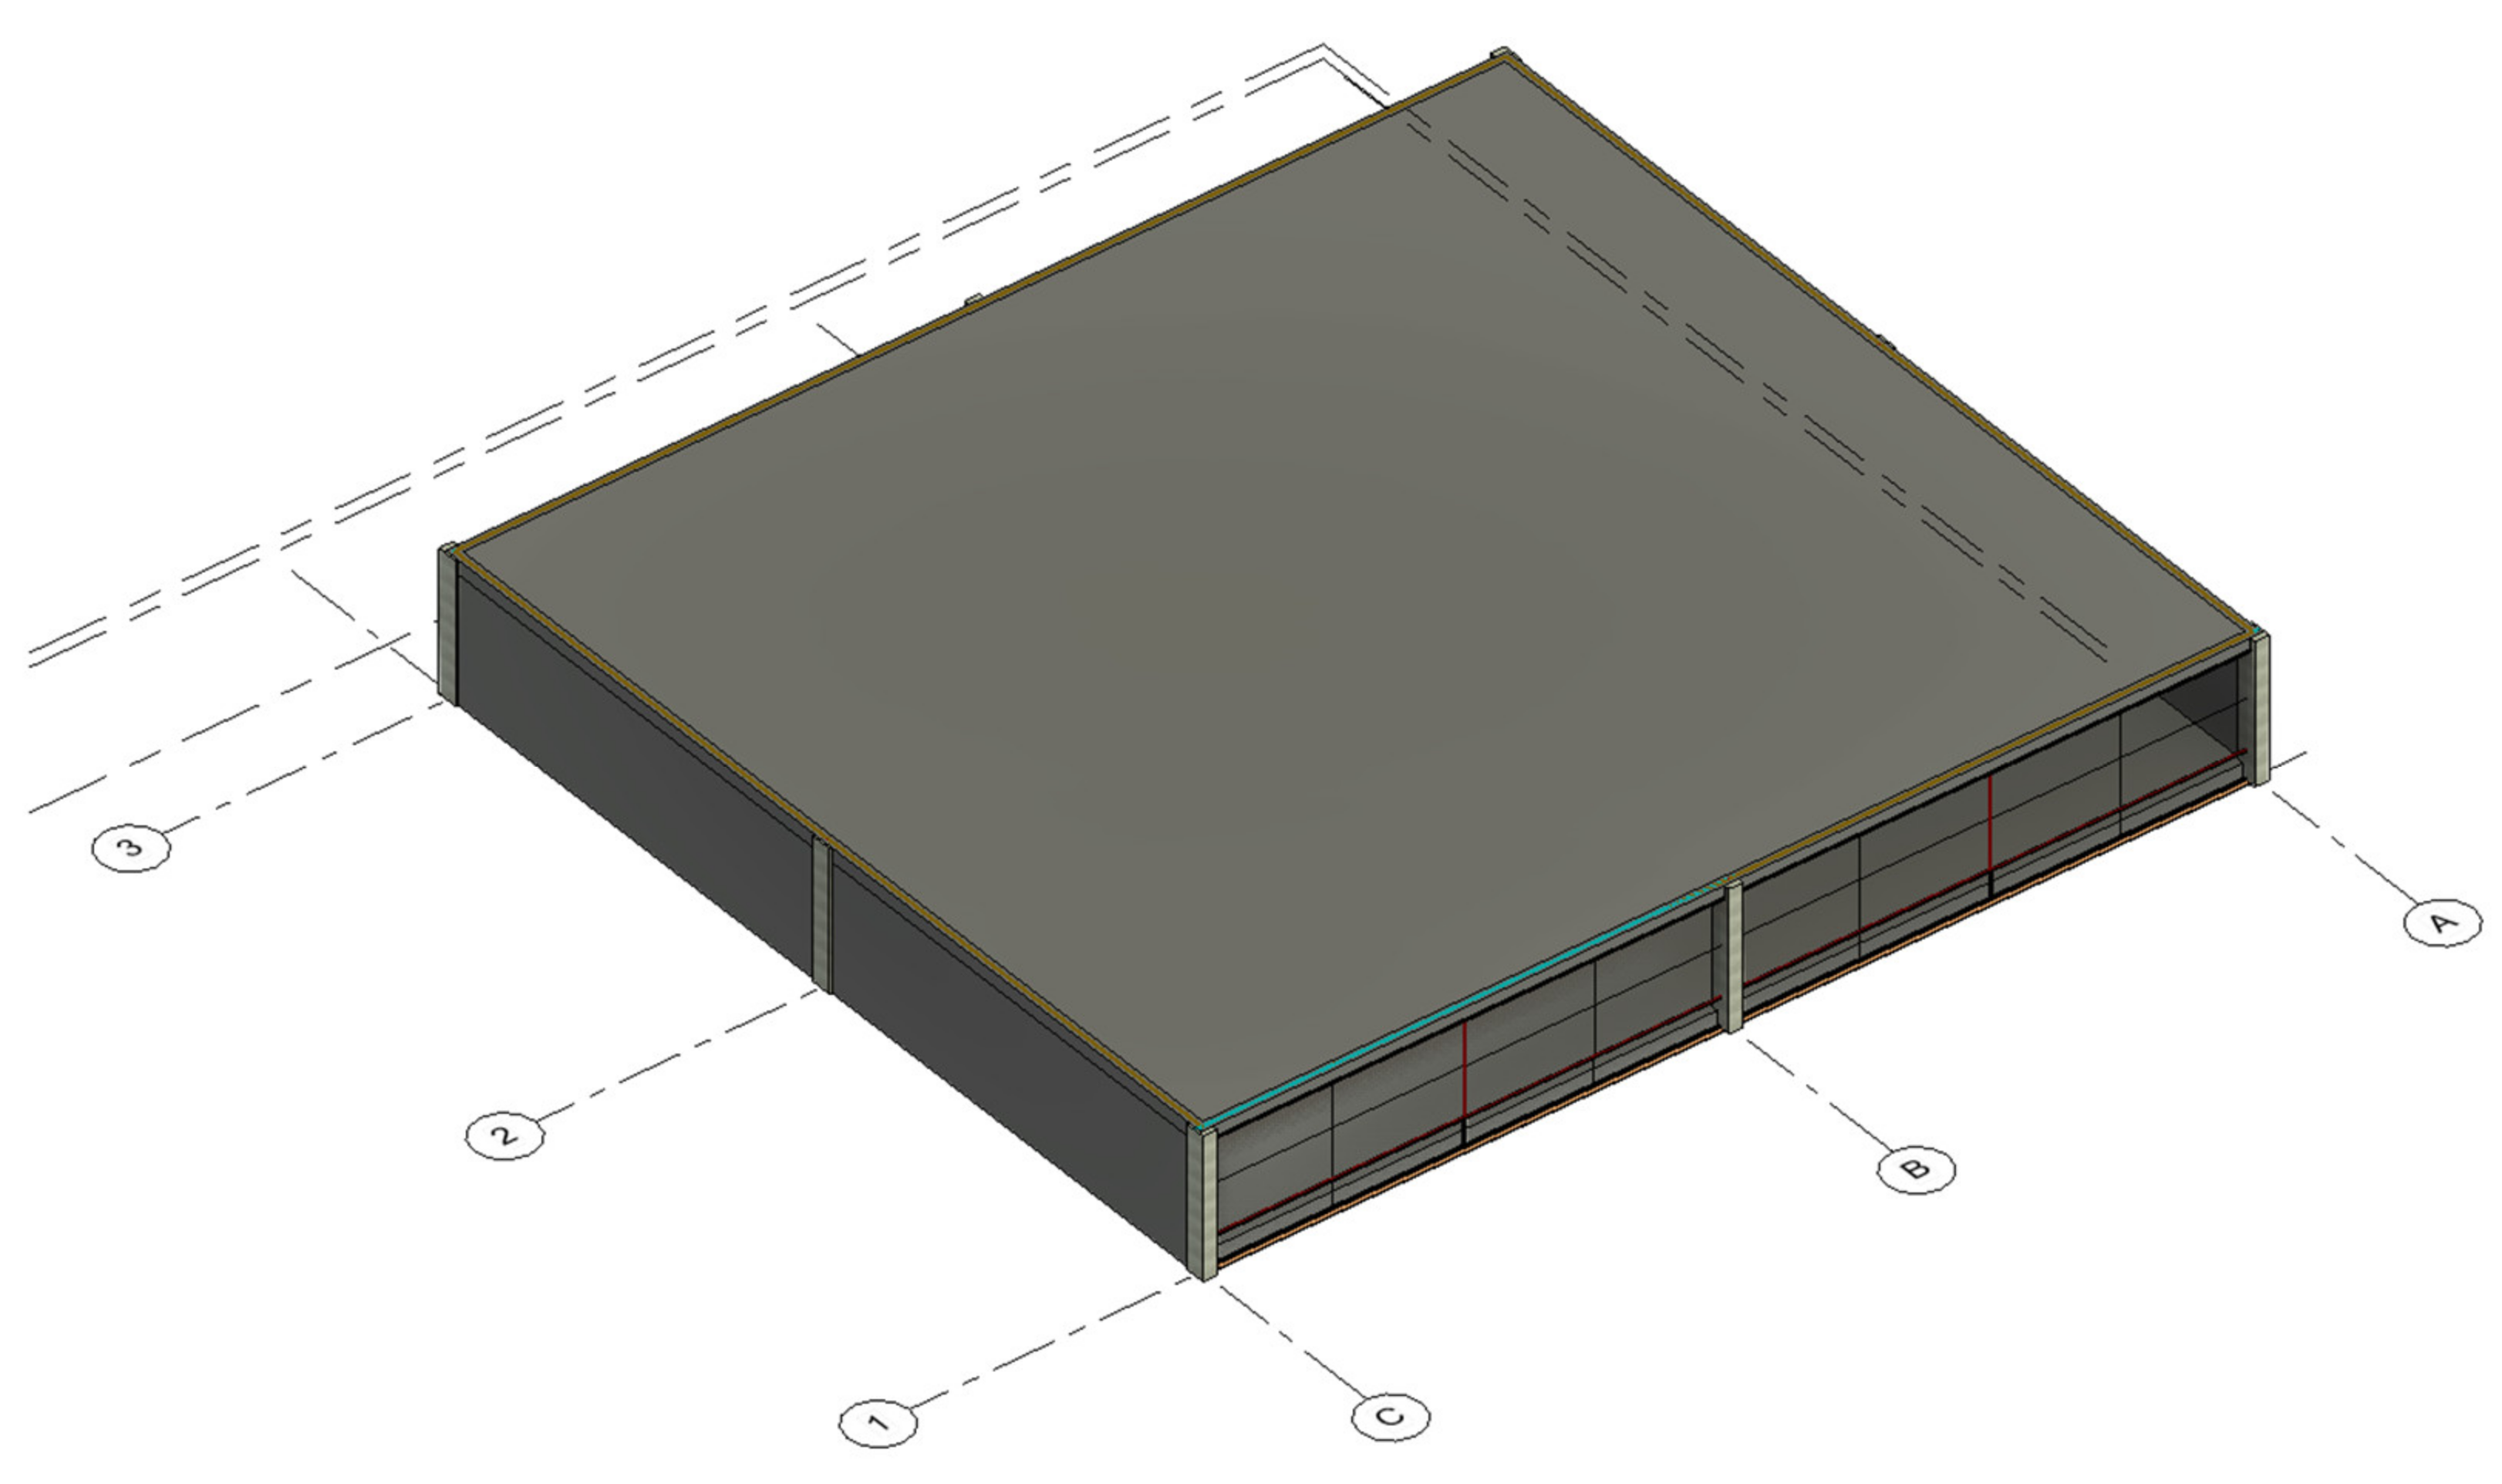
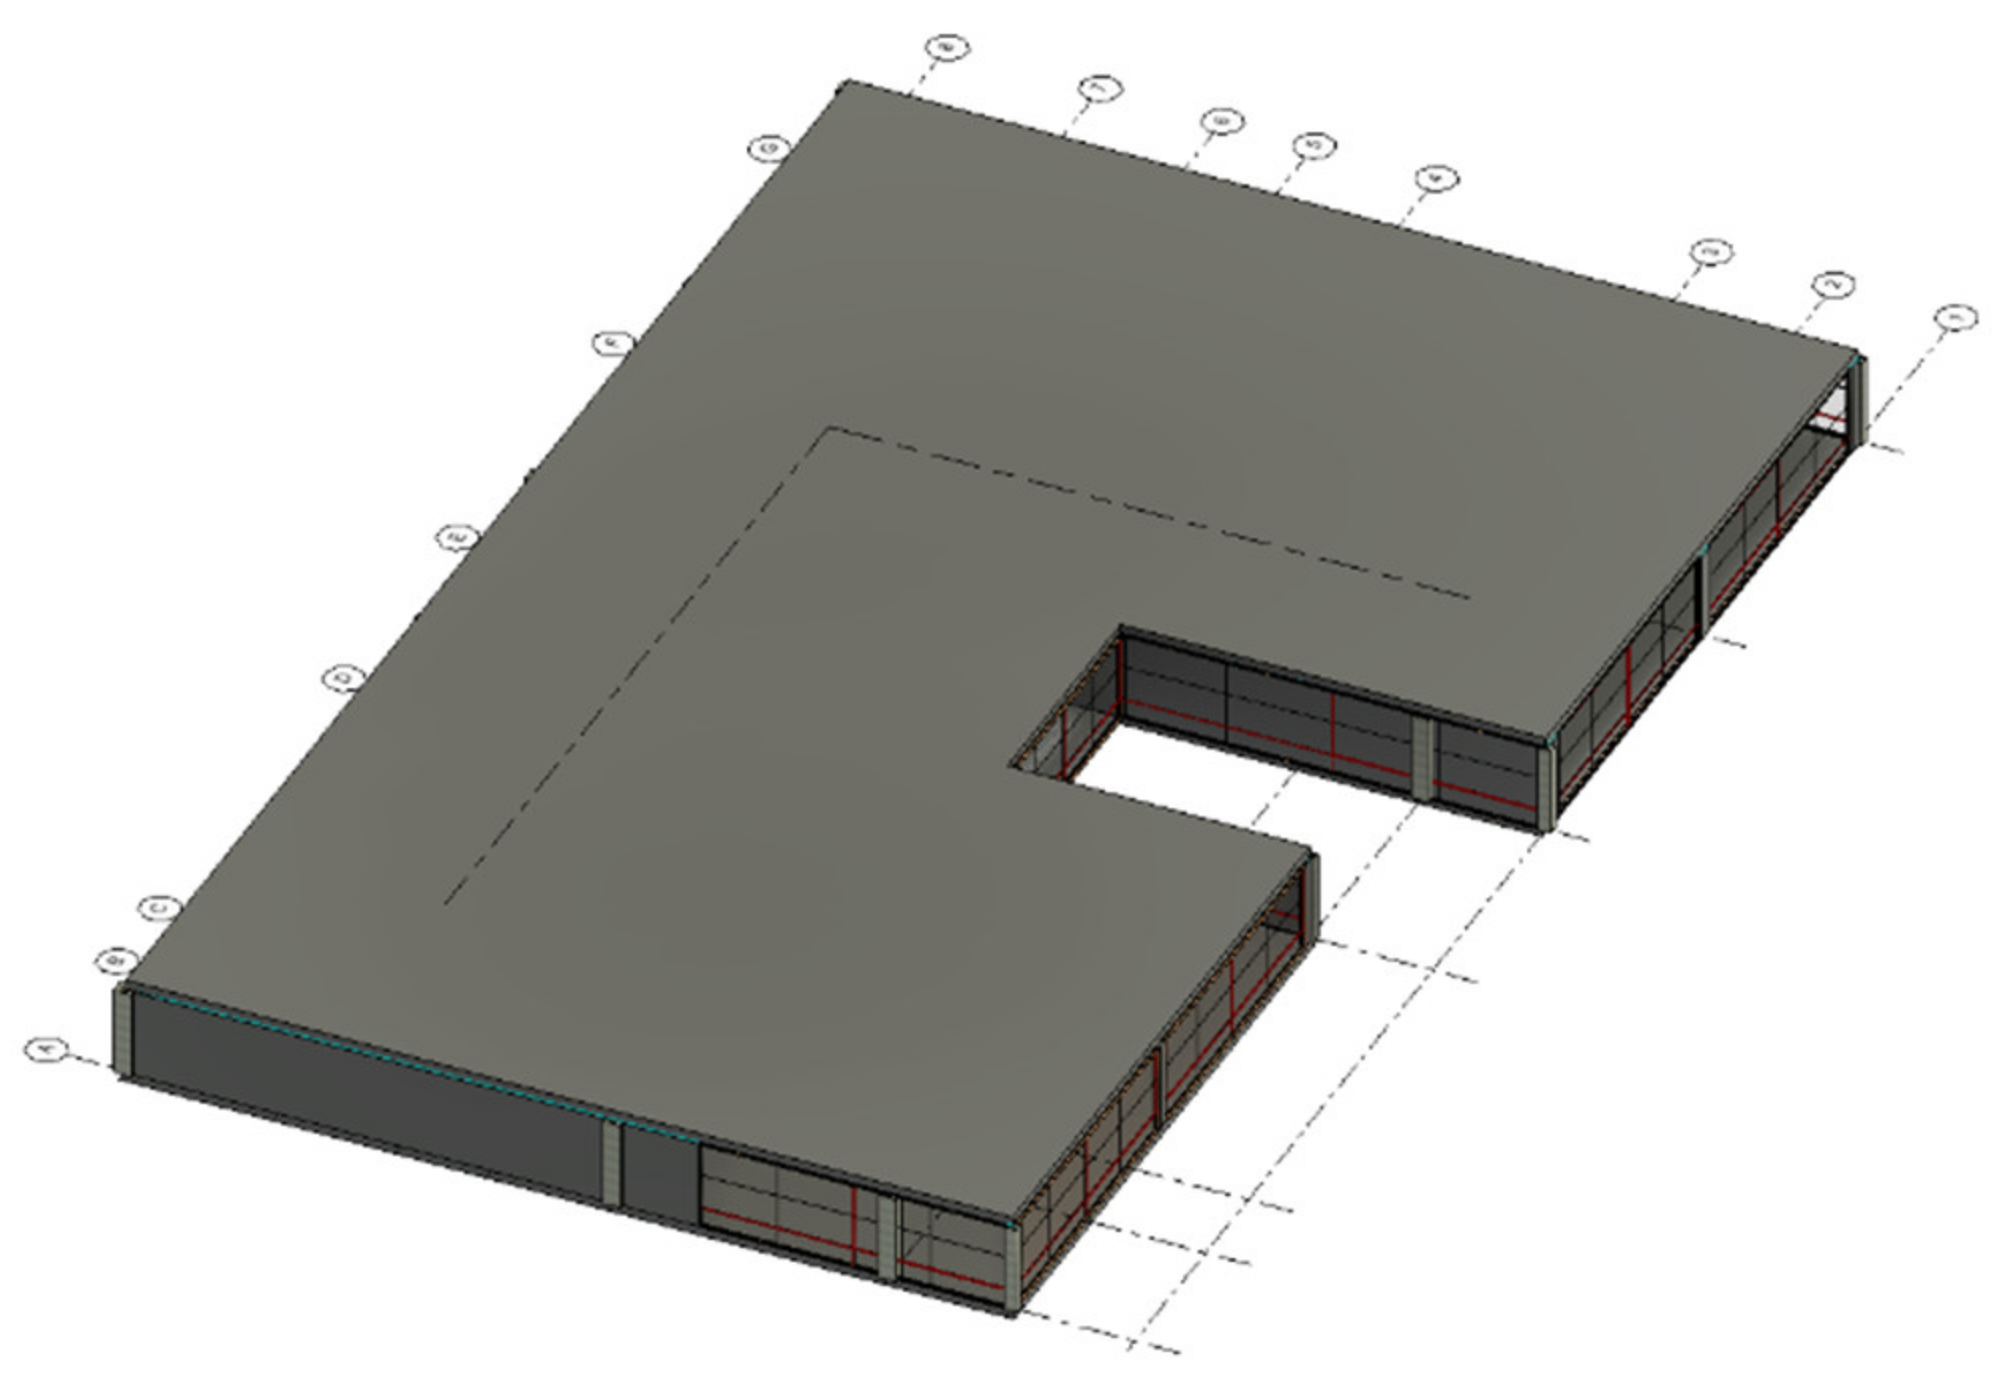
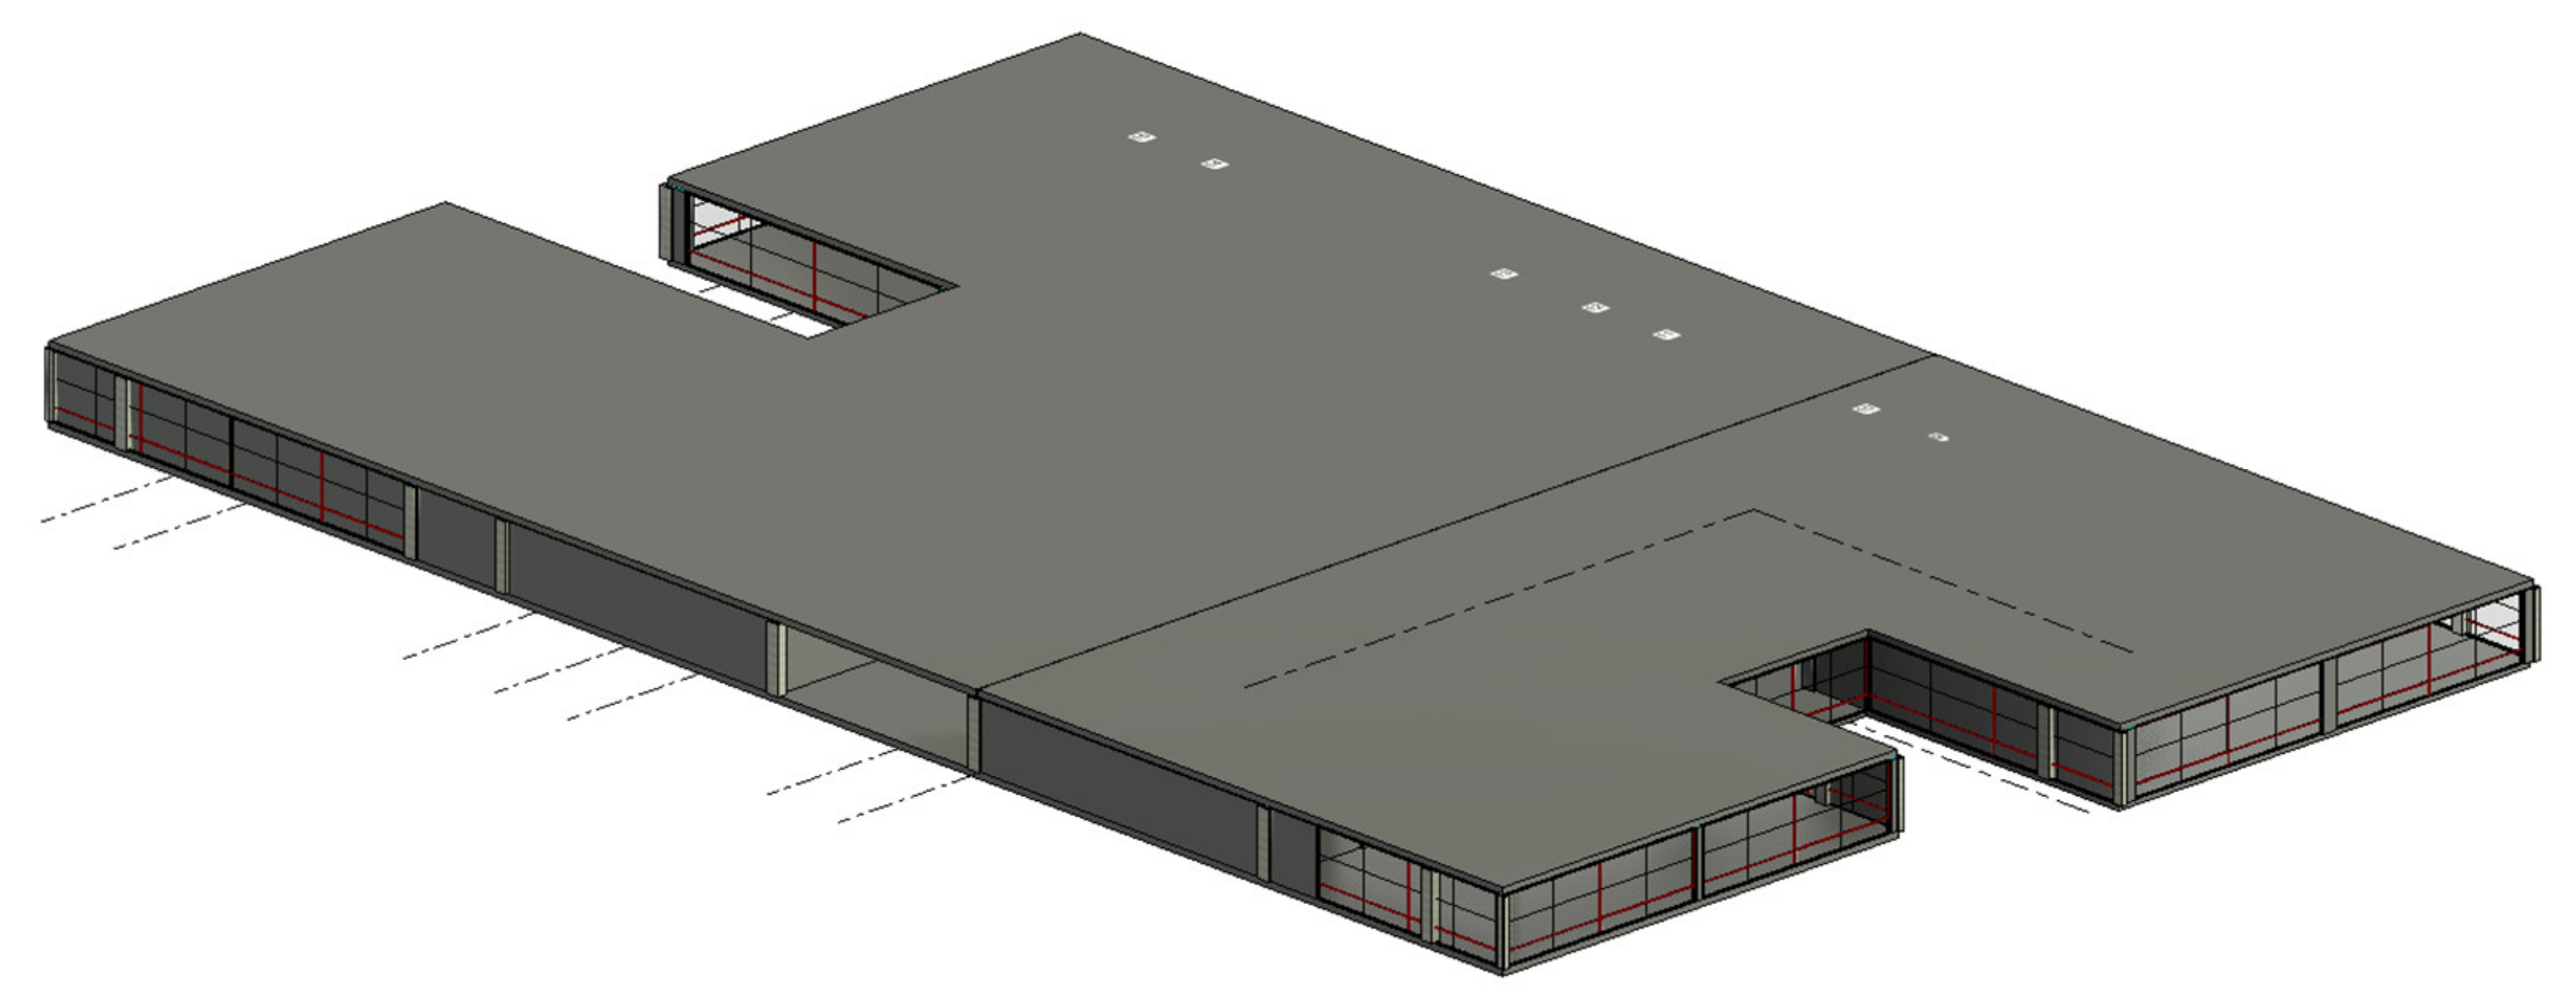
3.4. Case Study
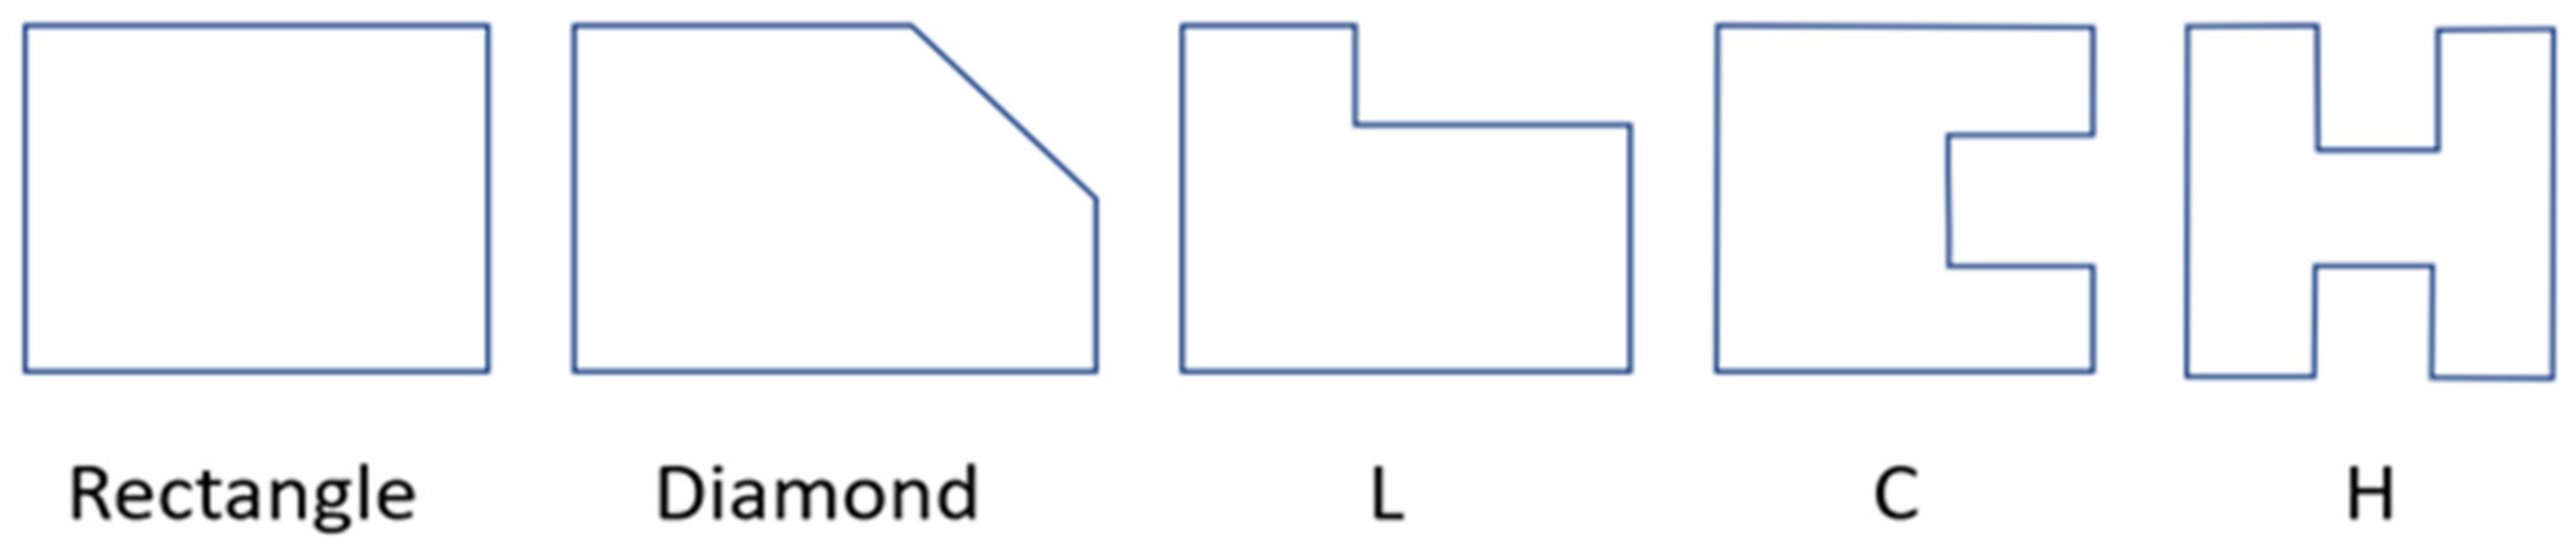
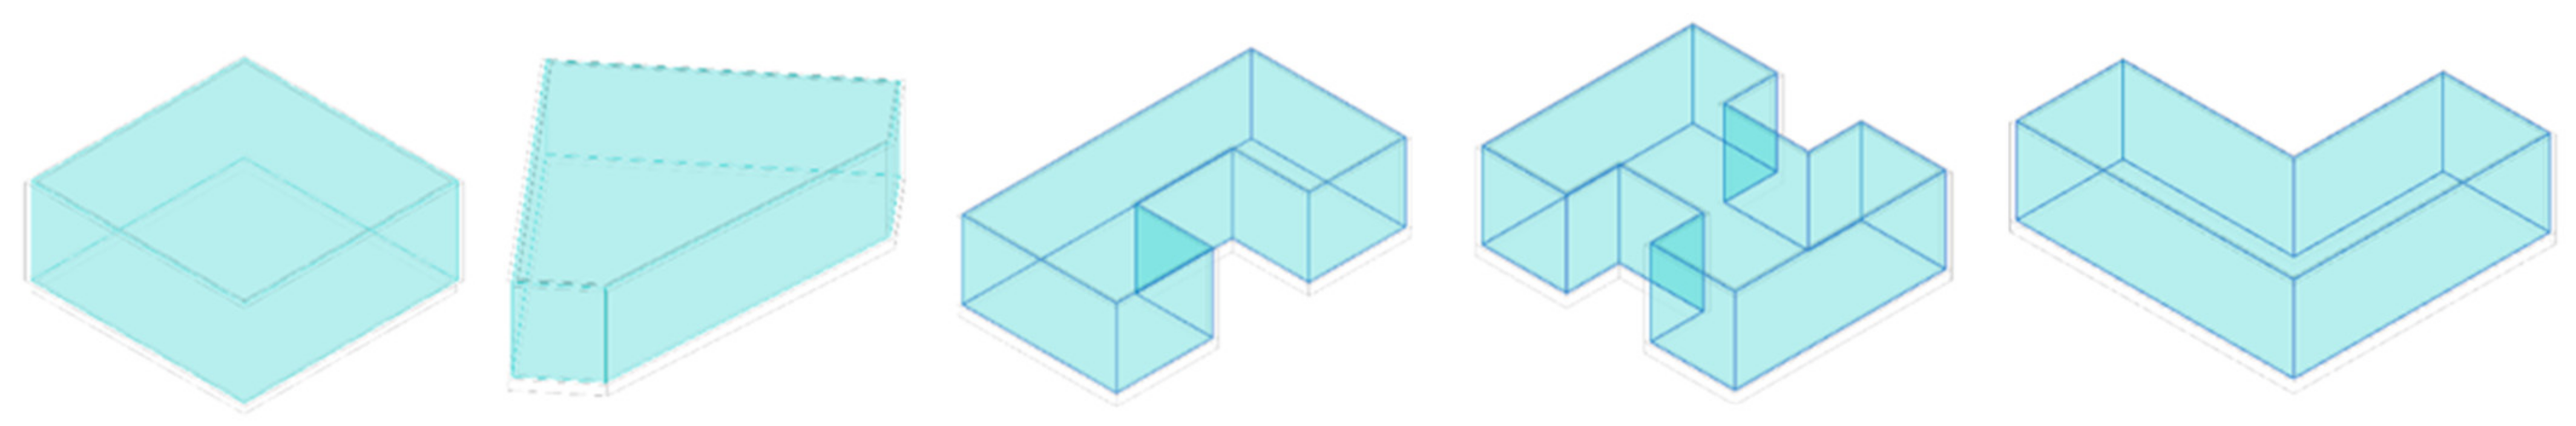
- The curved glass curtain walls are simplified to curtain walls with angles in the diamond shape model.
- Complex interior spaces in H shape and U shape were simplified to main walls only.
- The perimeter gaps of the H shape and U shape were filled with walls.
3.5. Design Variables
3.6. Monte Carlo Simulation
3.7. Regression Analysis
3.8. Goodness of Fit
- yi is the value of observation i;
- ŷi is the predicted value of y for observation i;
- ŷ is the mean of y value.
4. Results
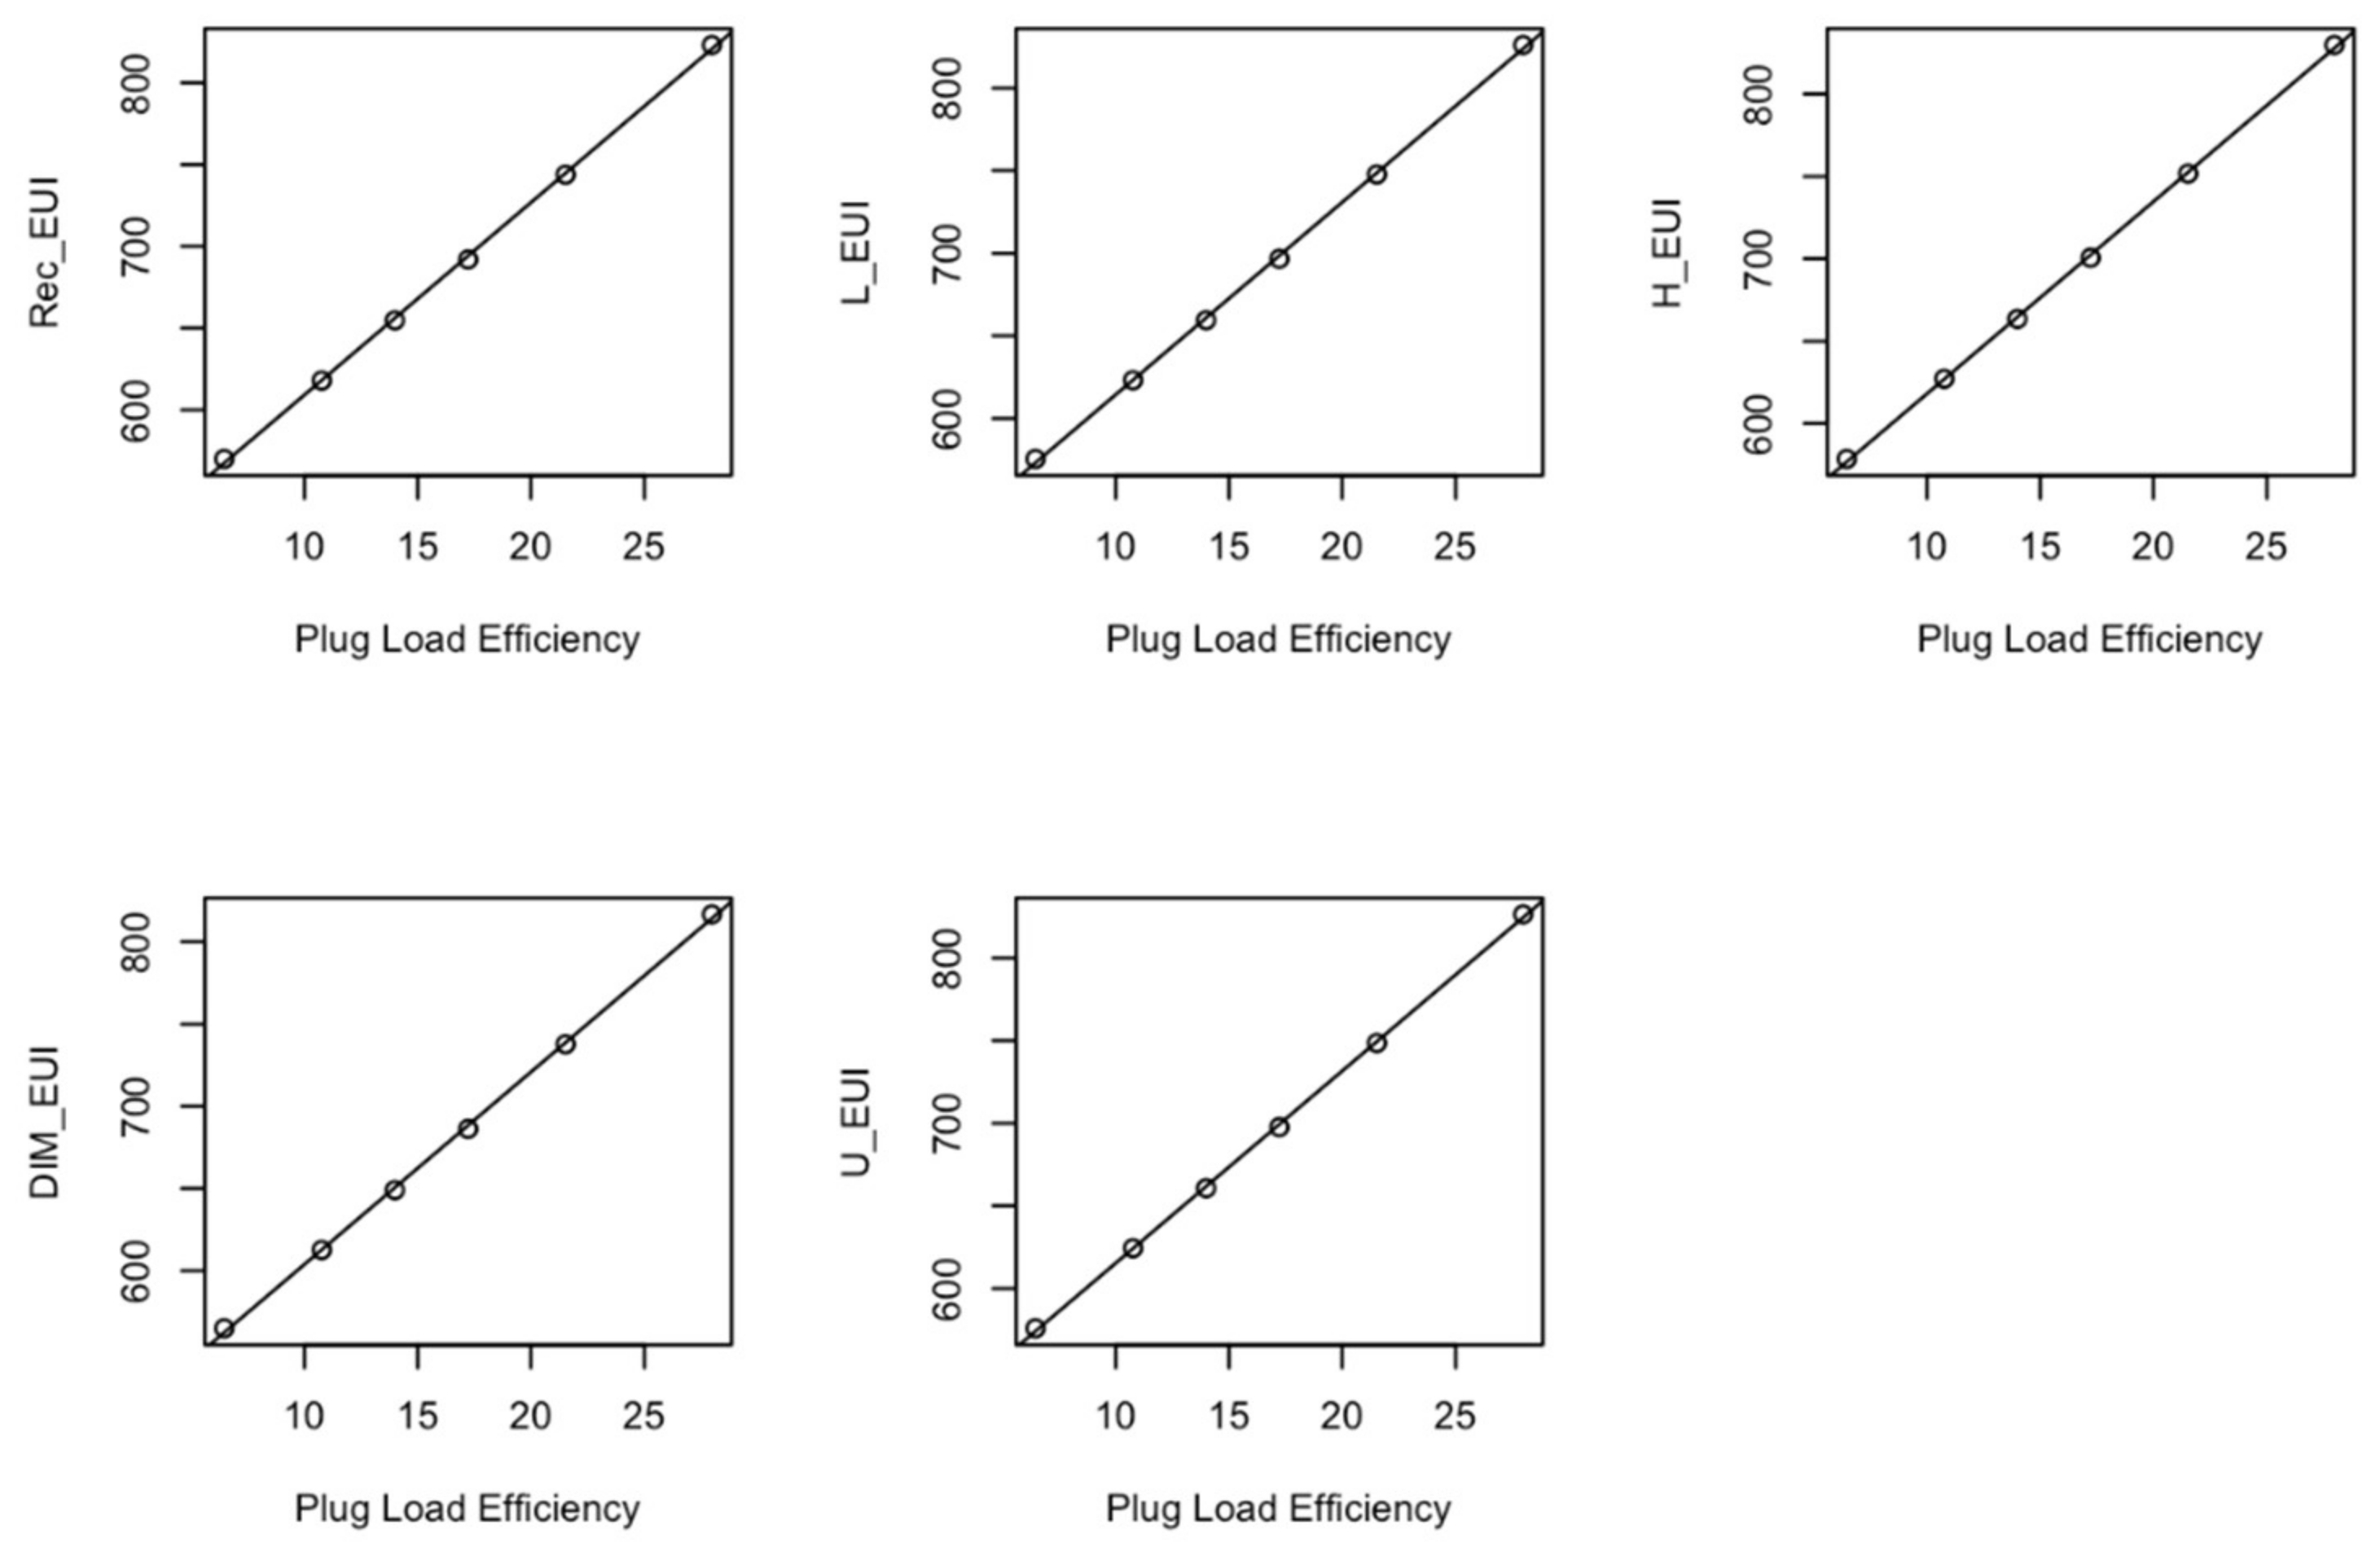
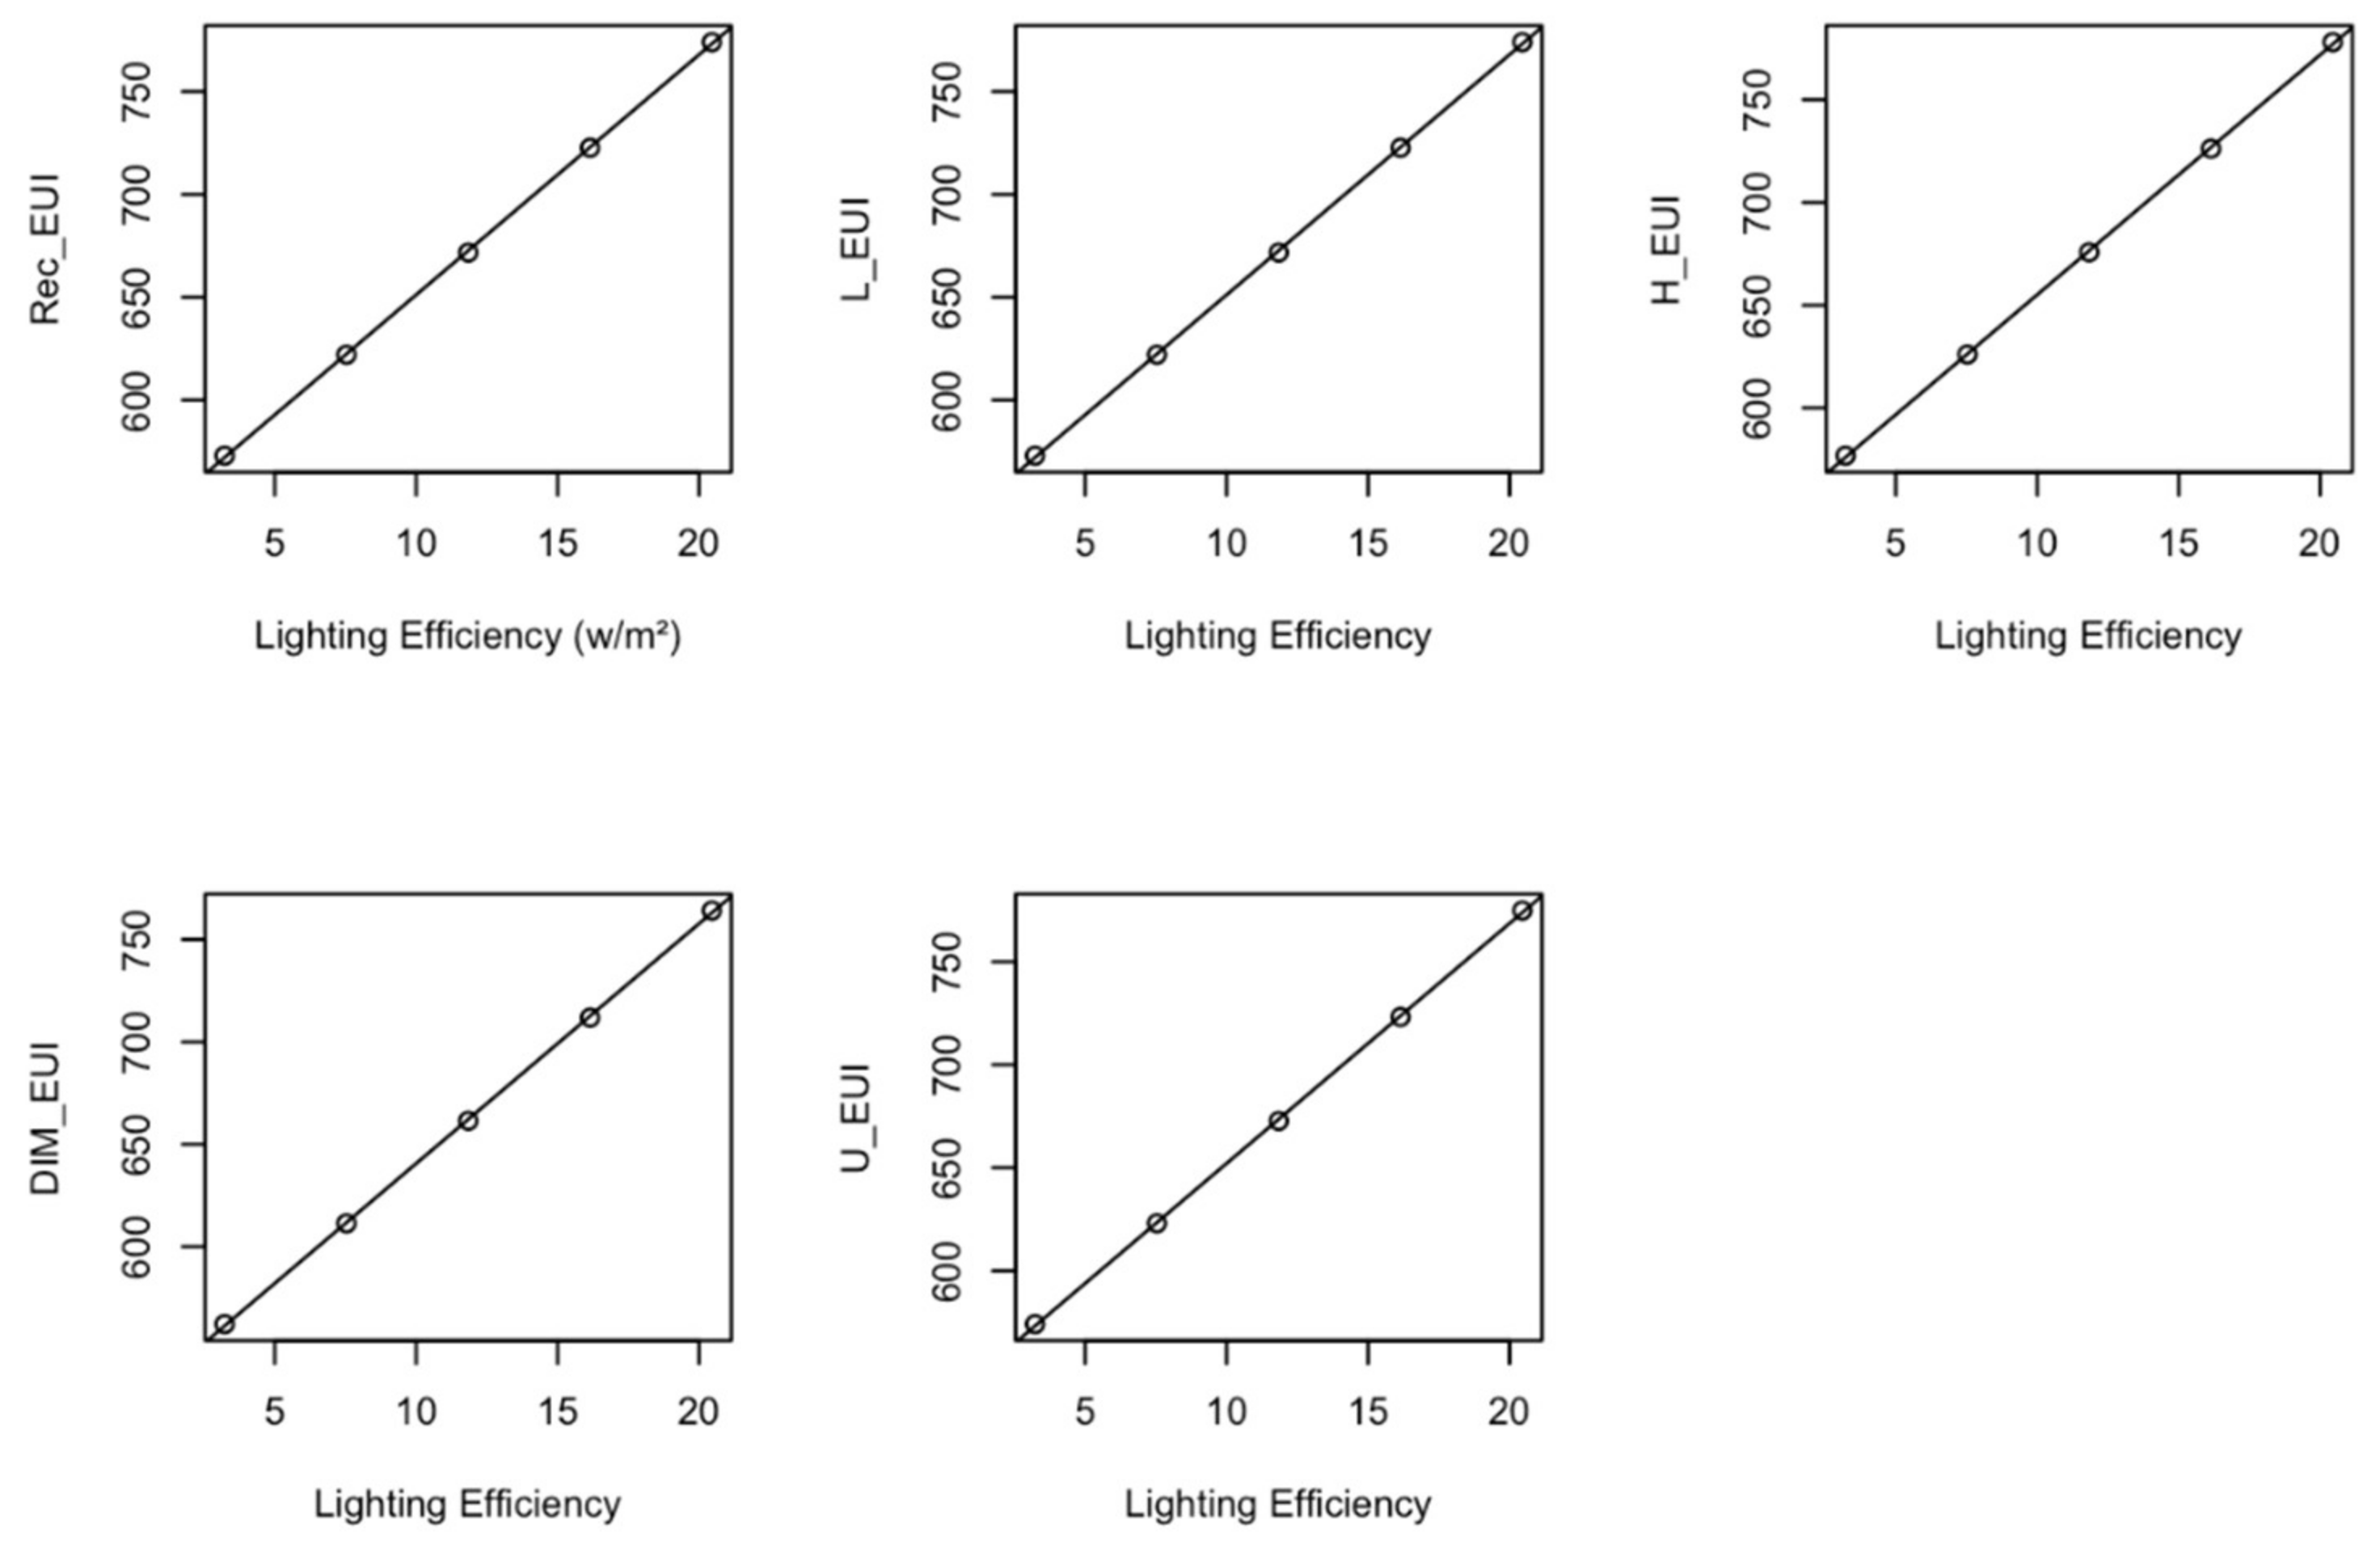
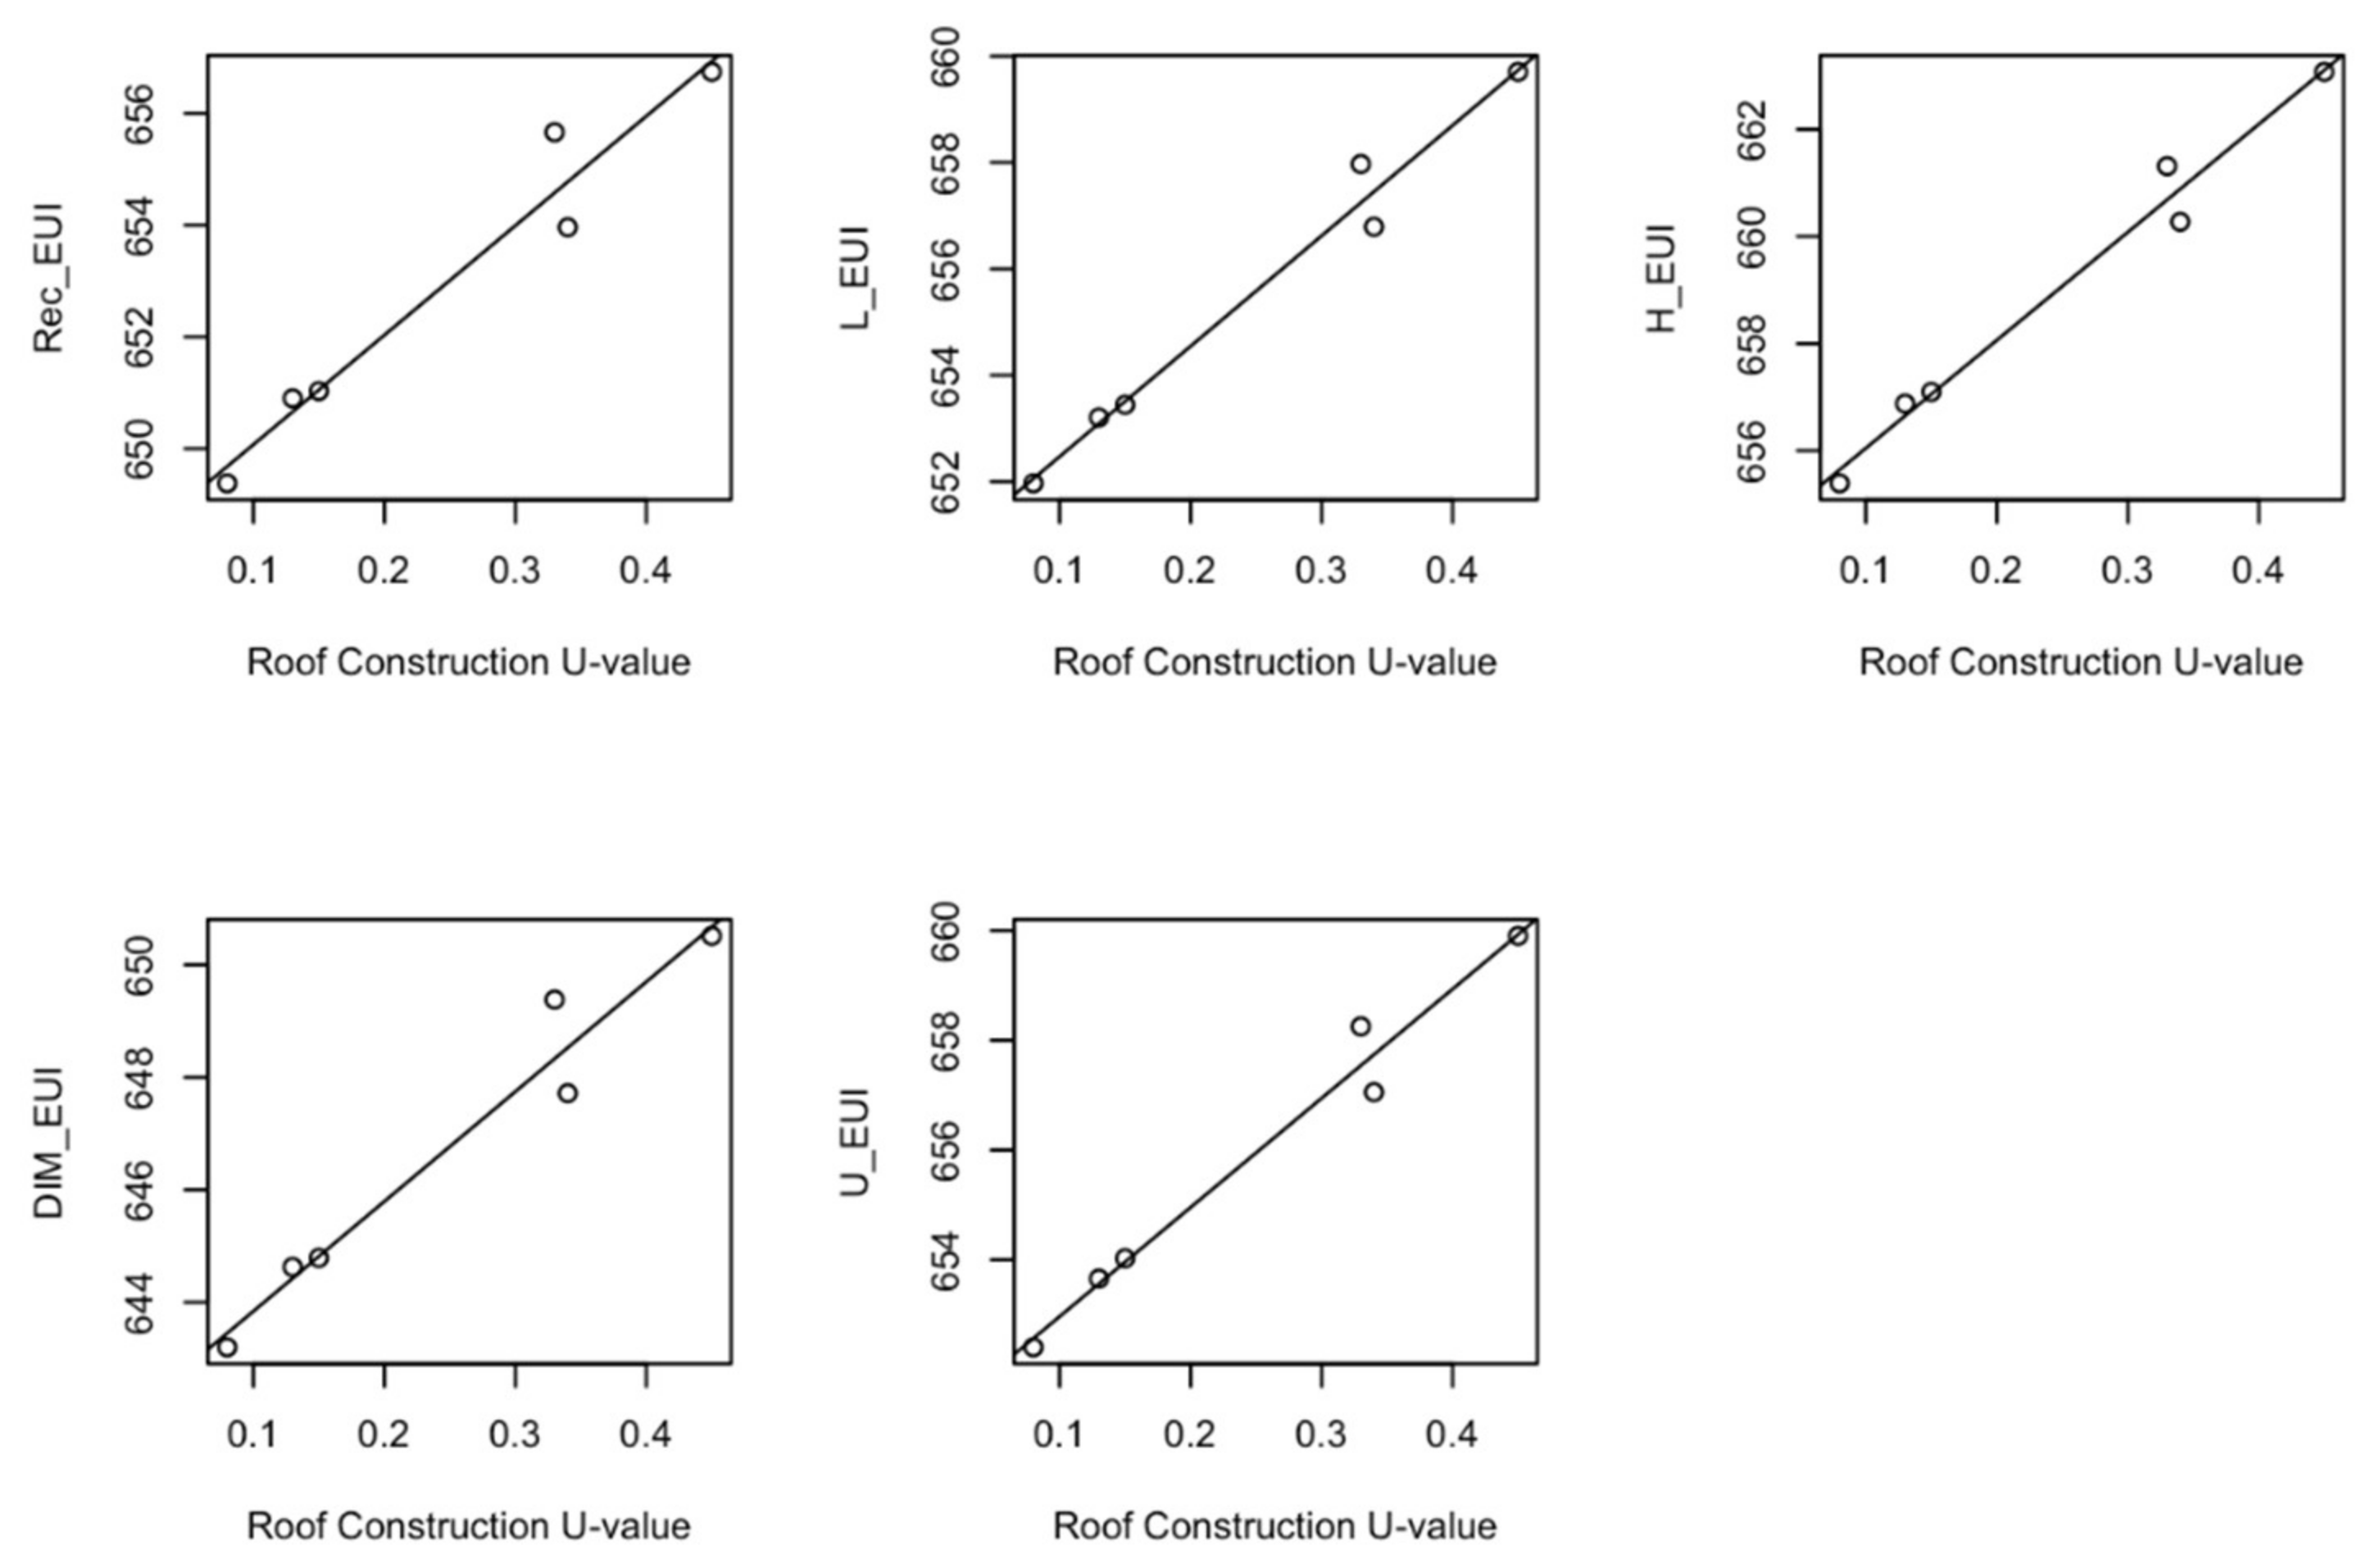
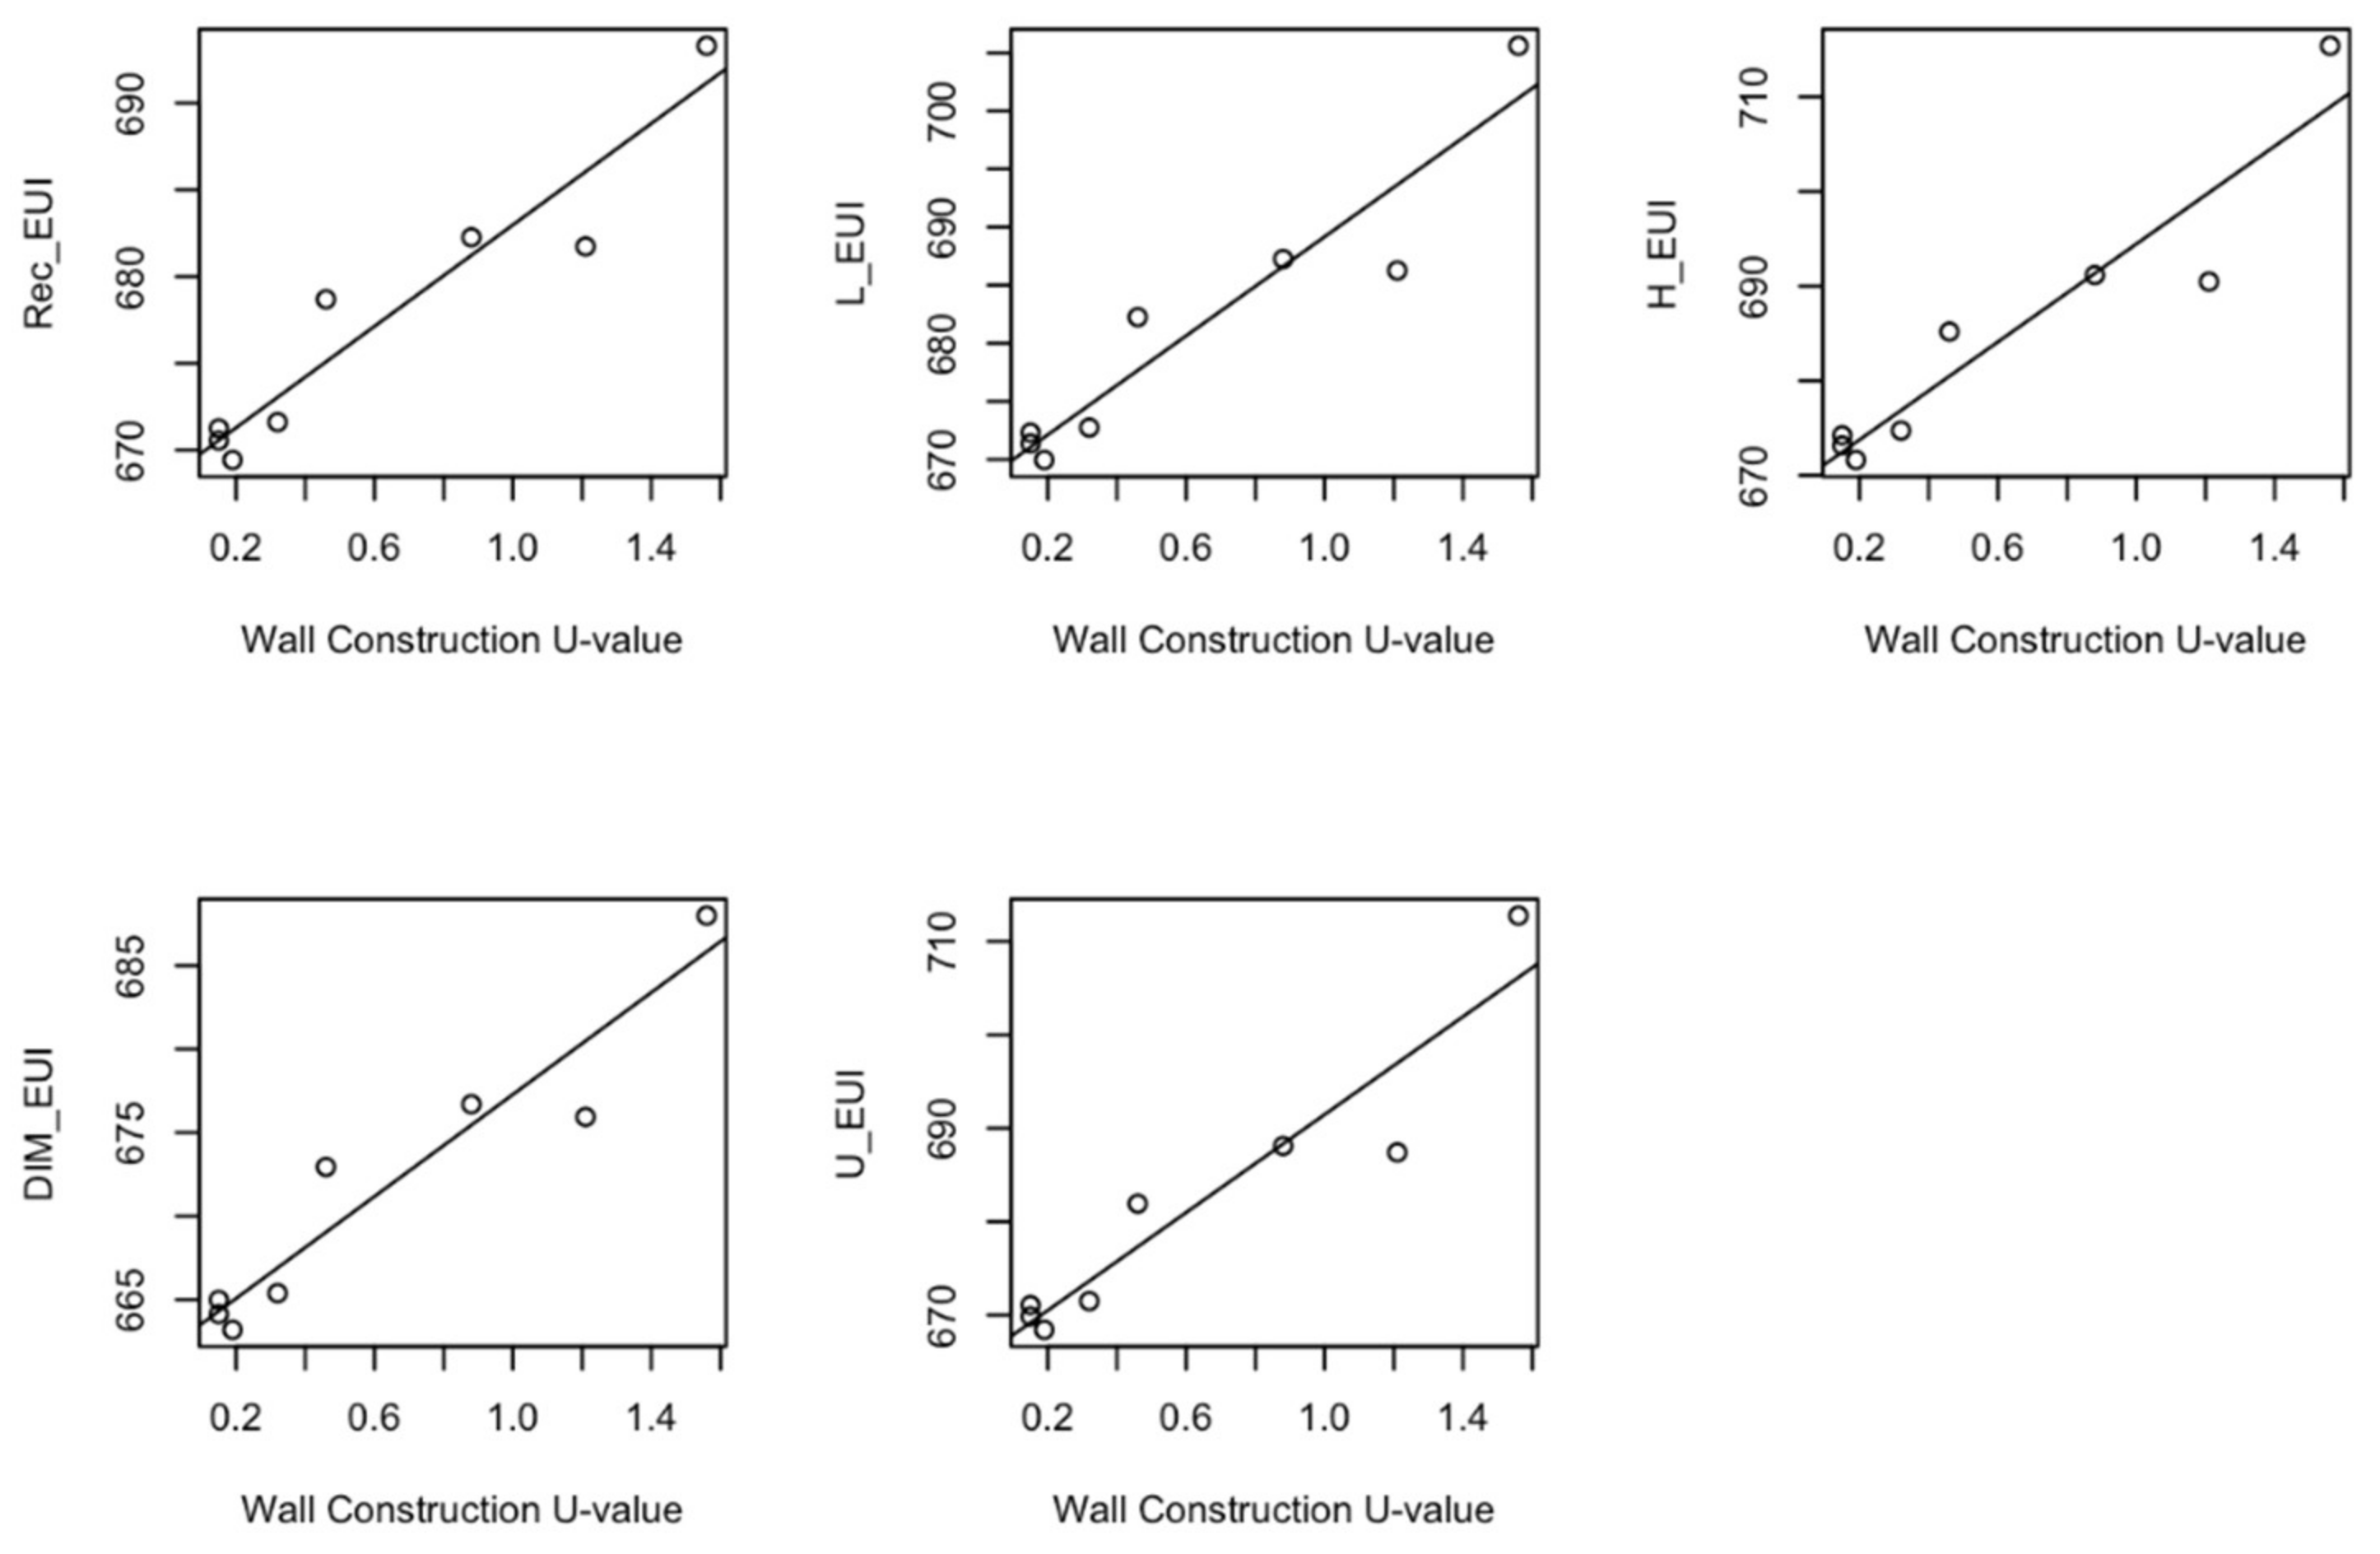
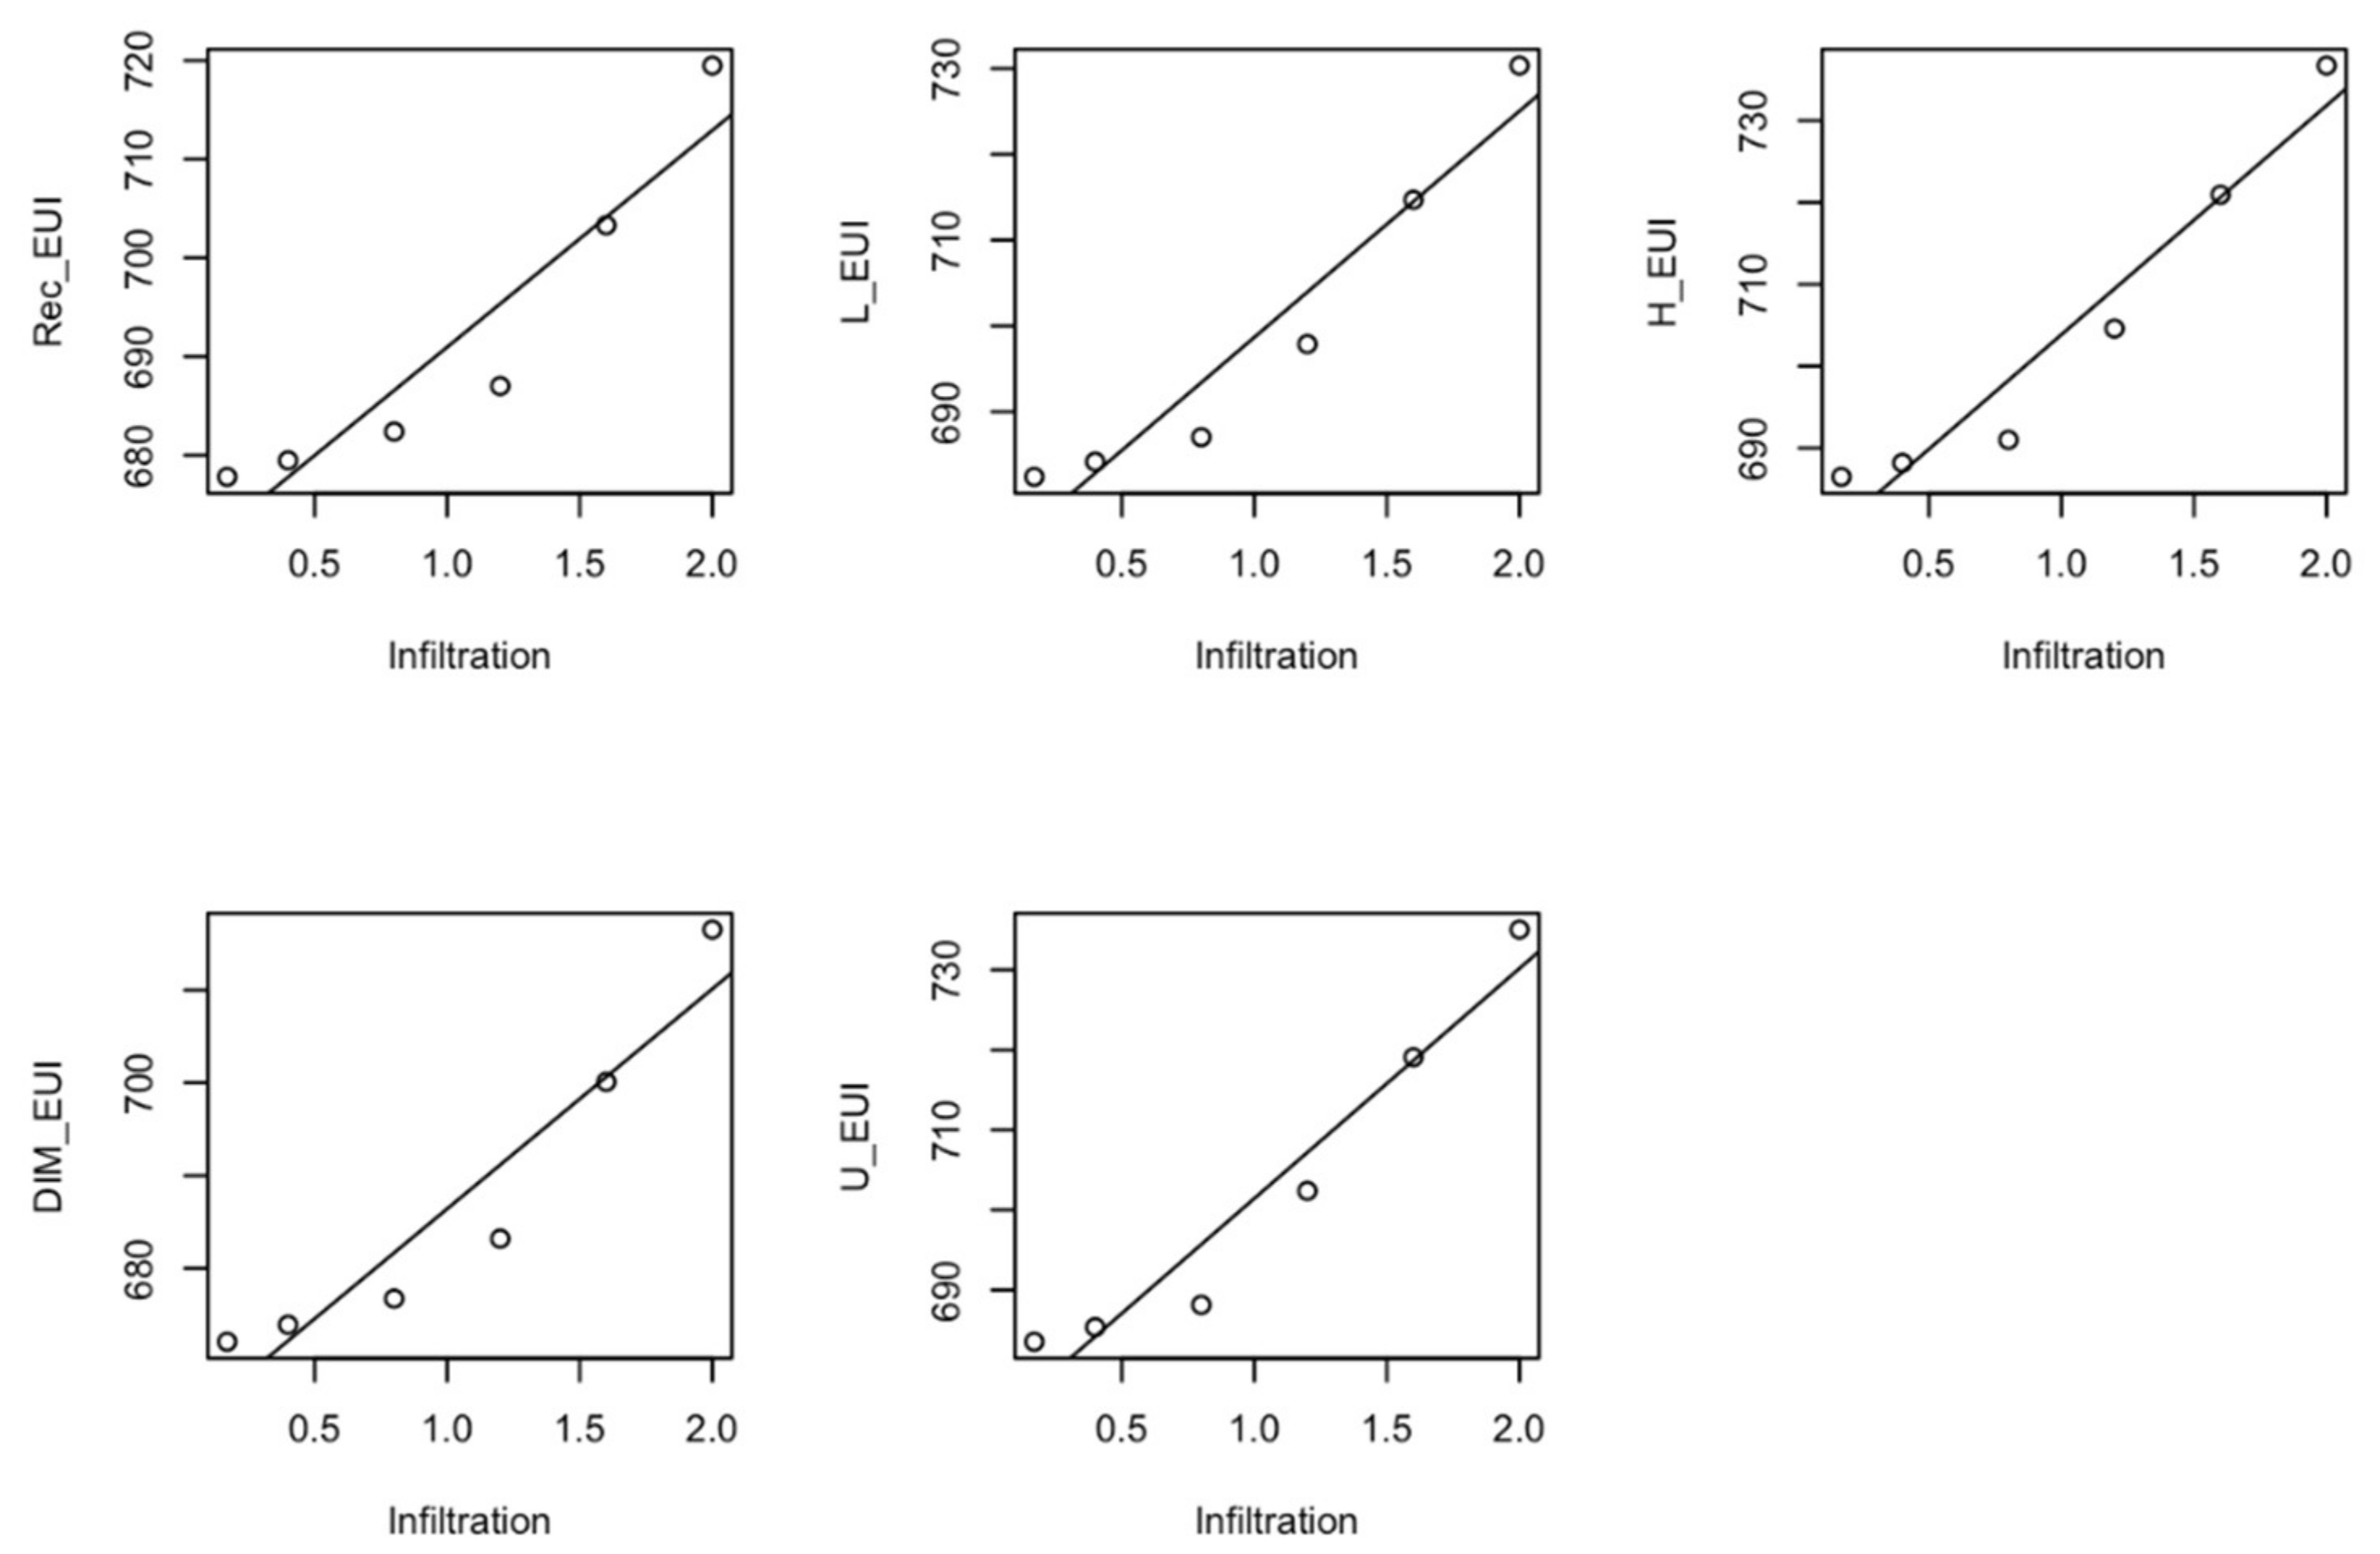
4.1. Linear Regression Models
4.2. Regression Models Validation
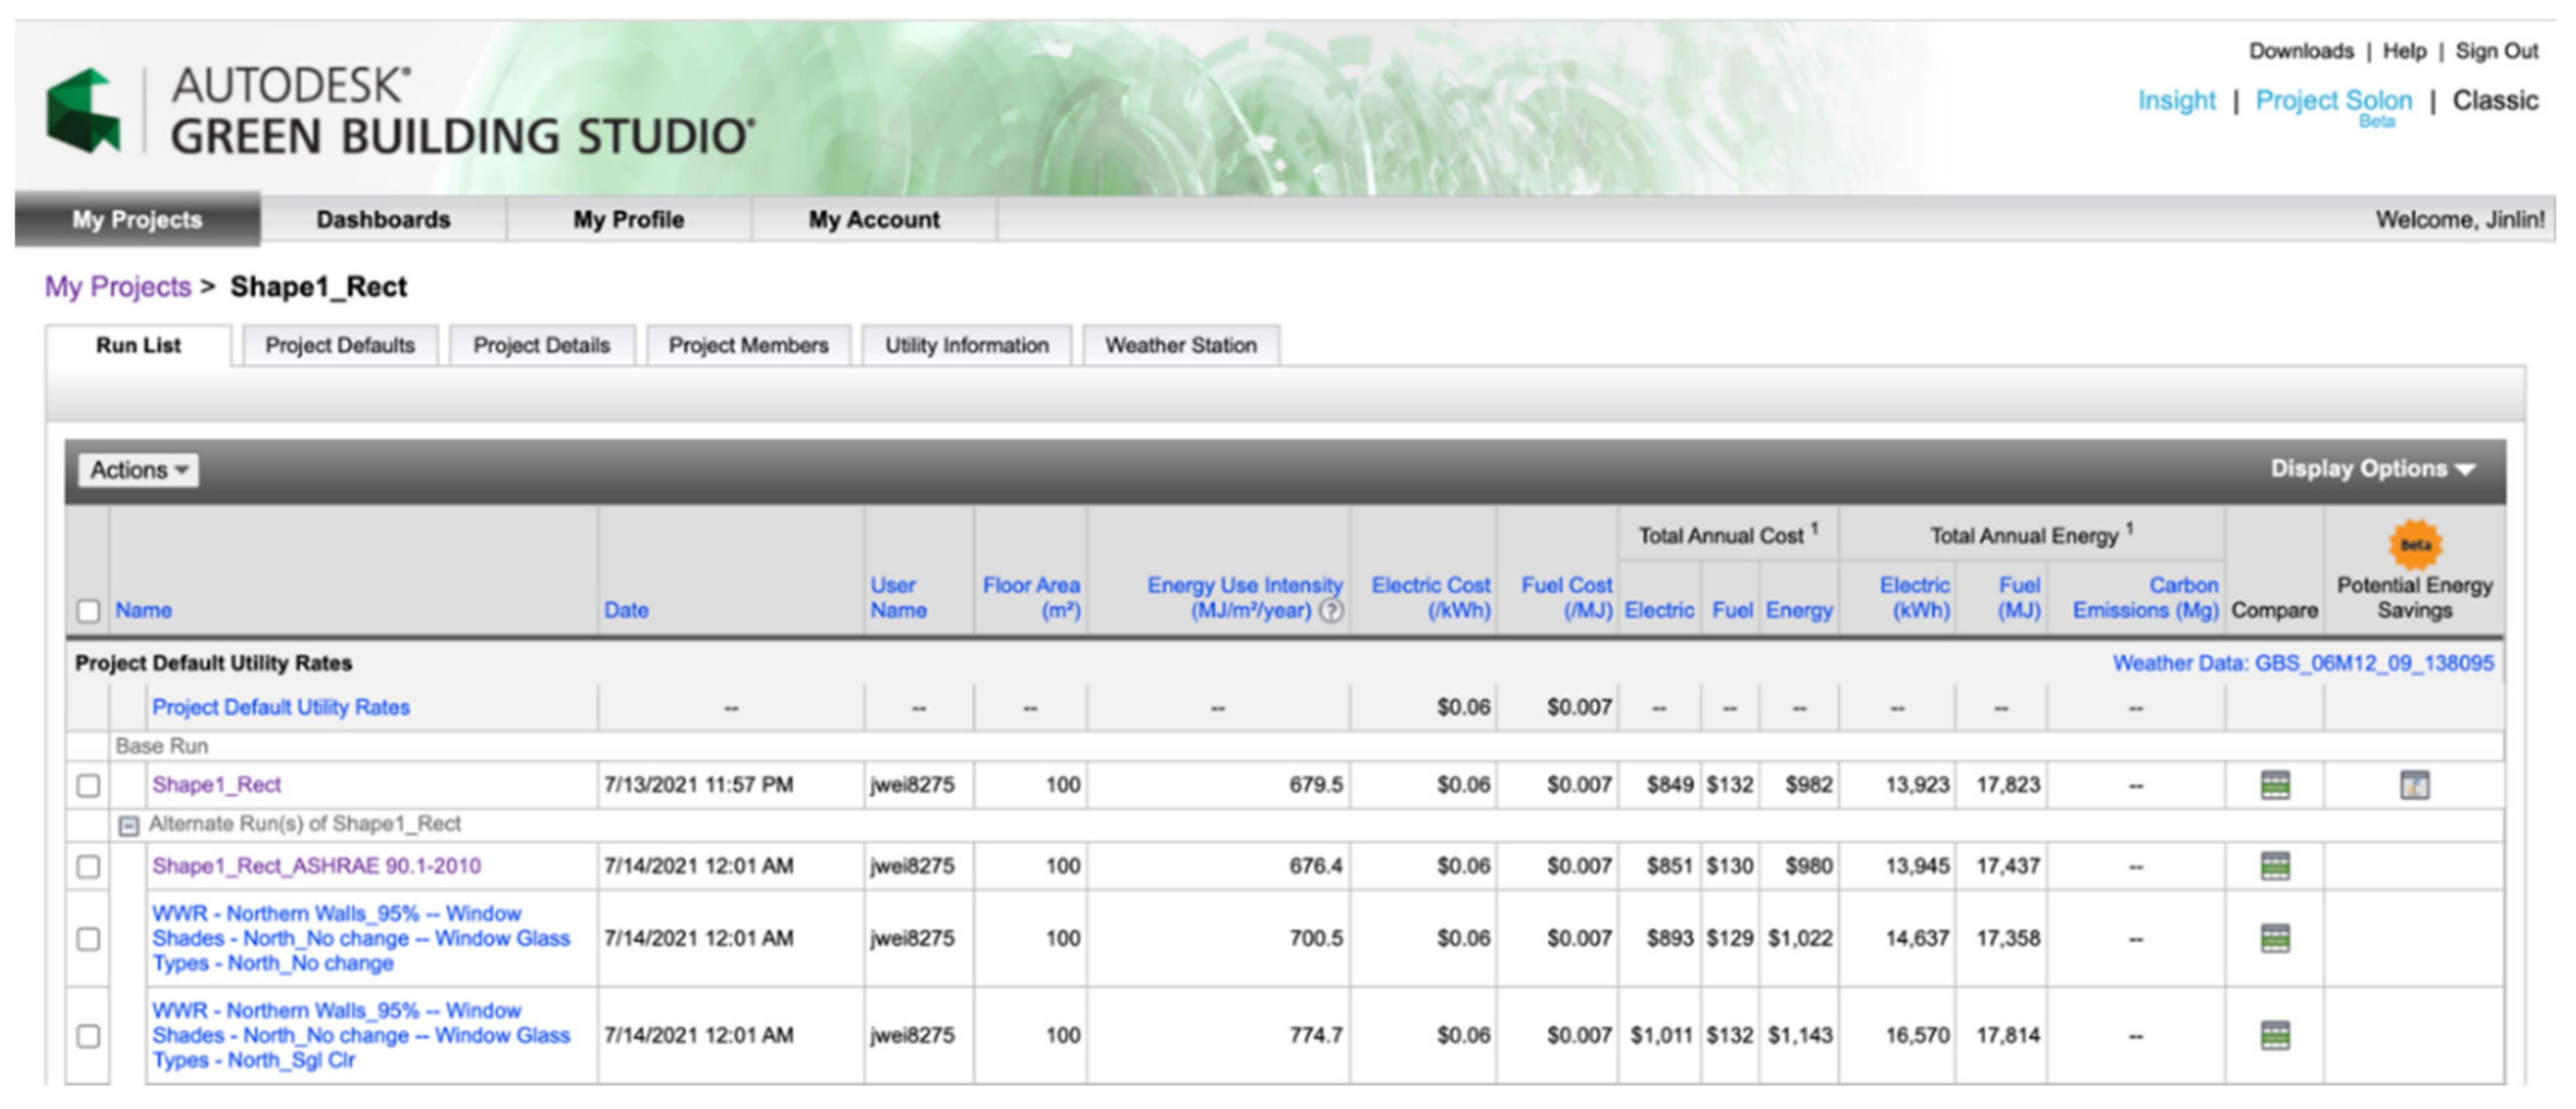
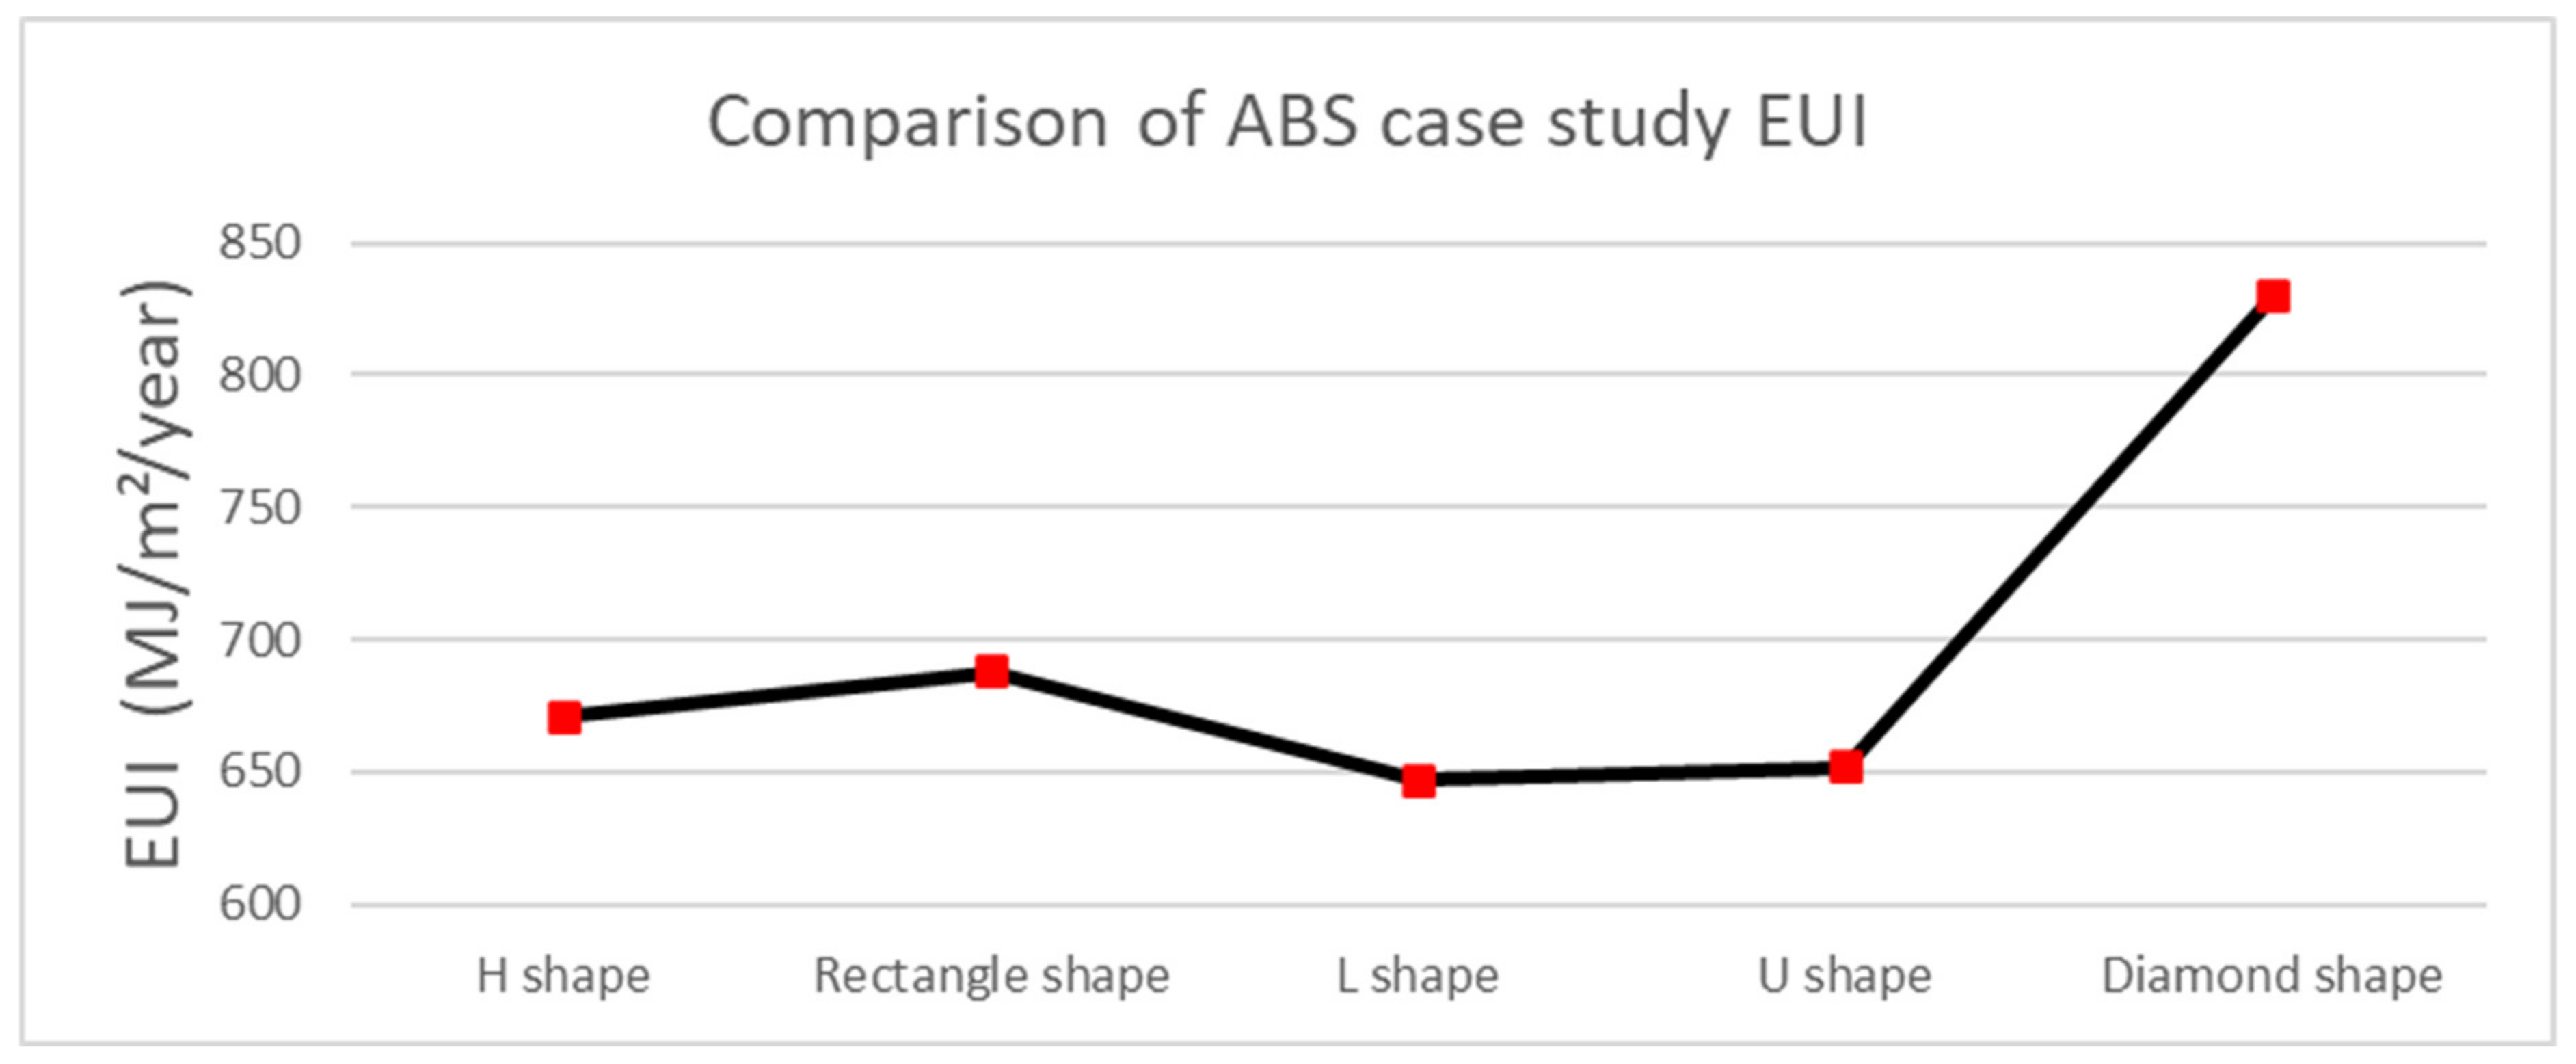
4.2.1. ABS Case Study—Base Run Result
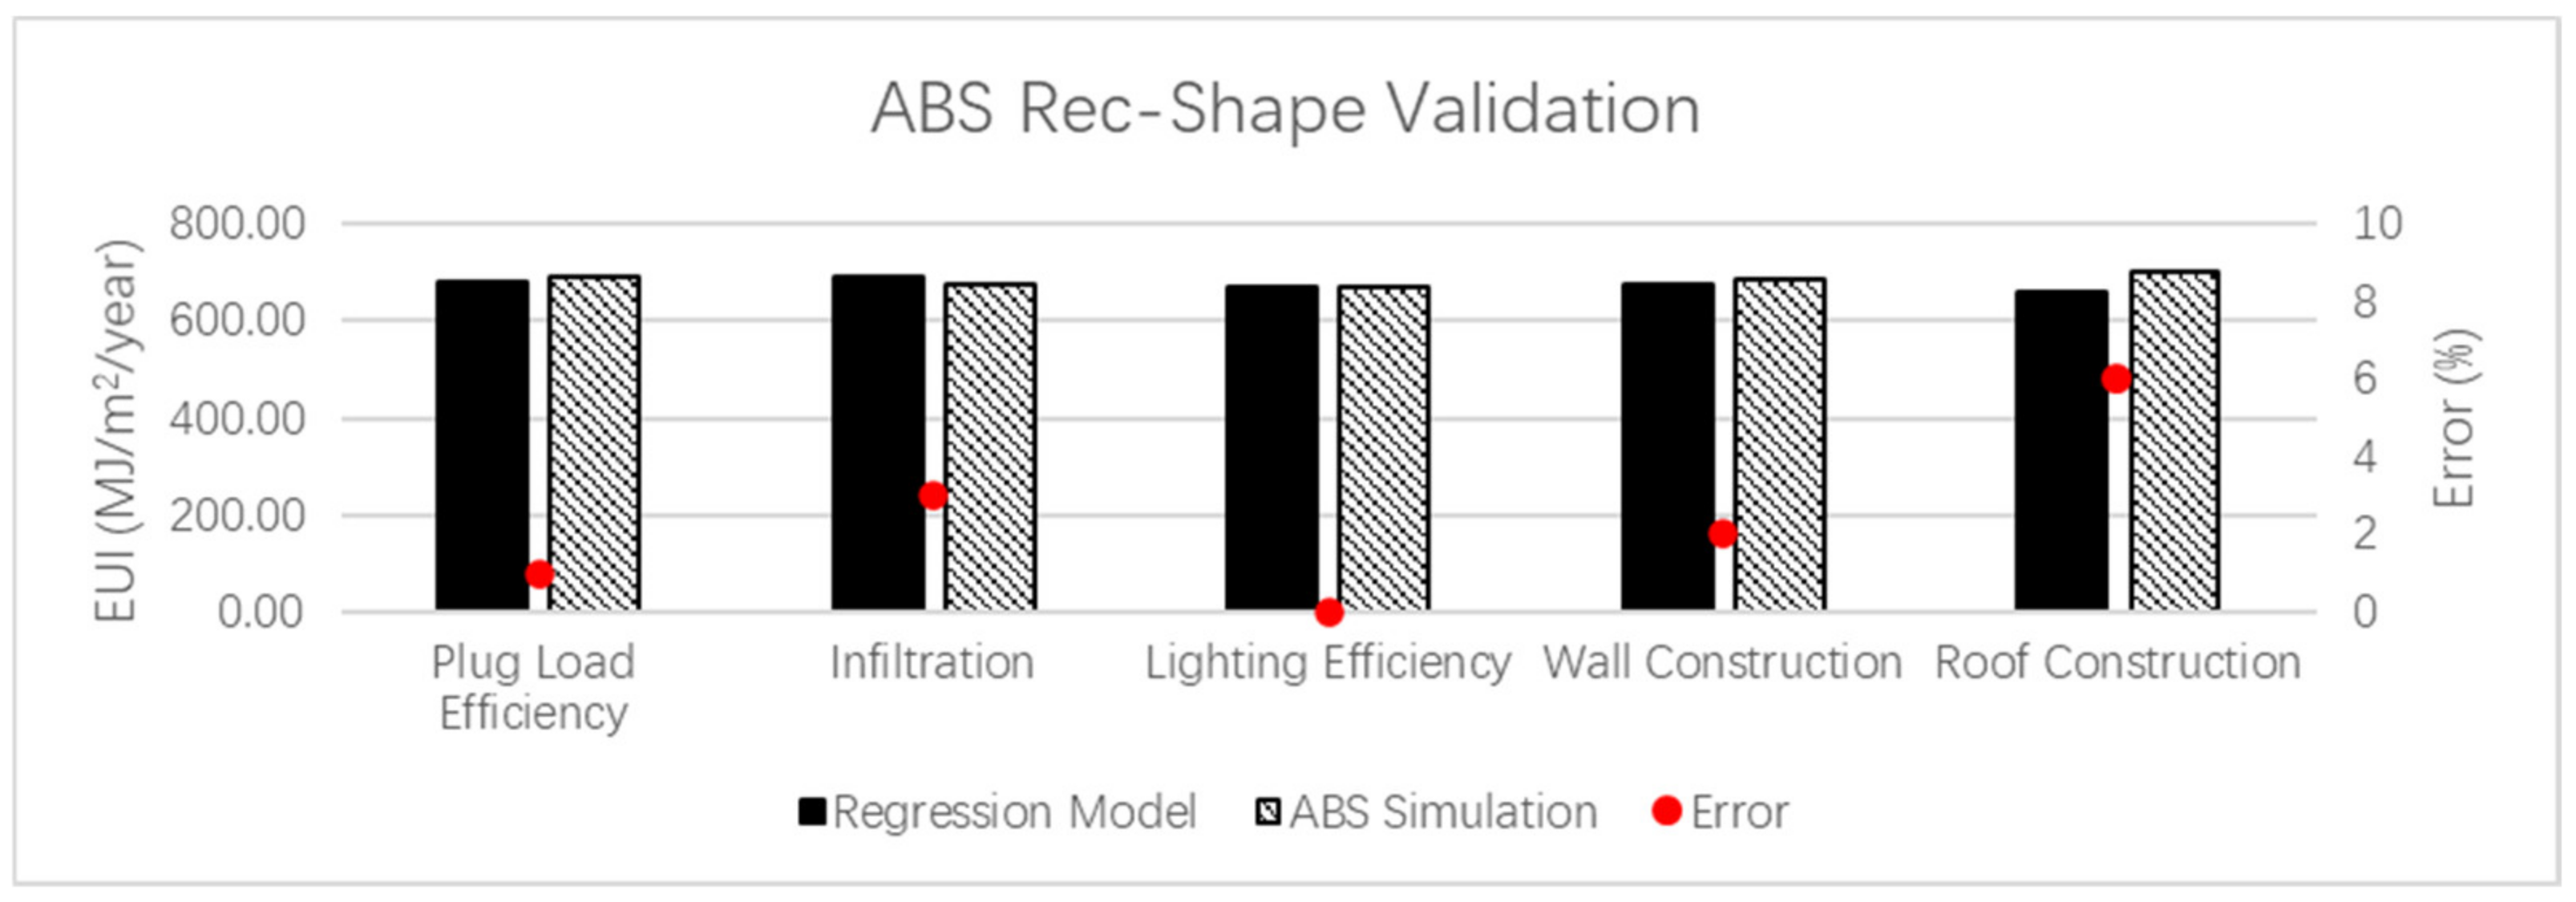
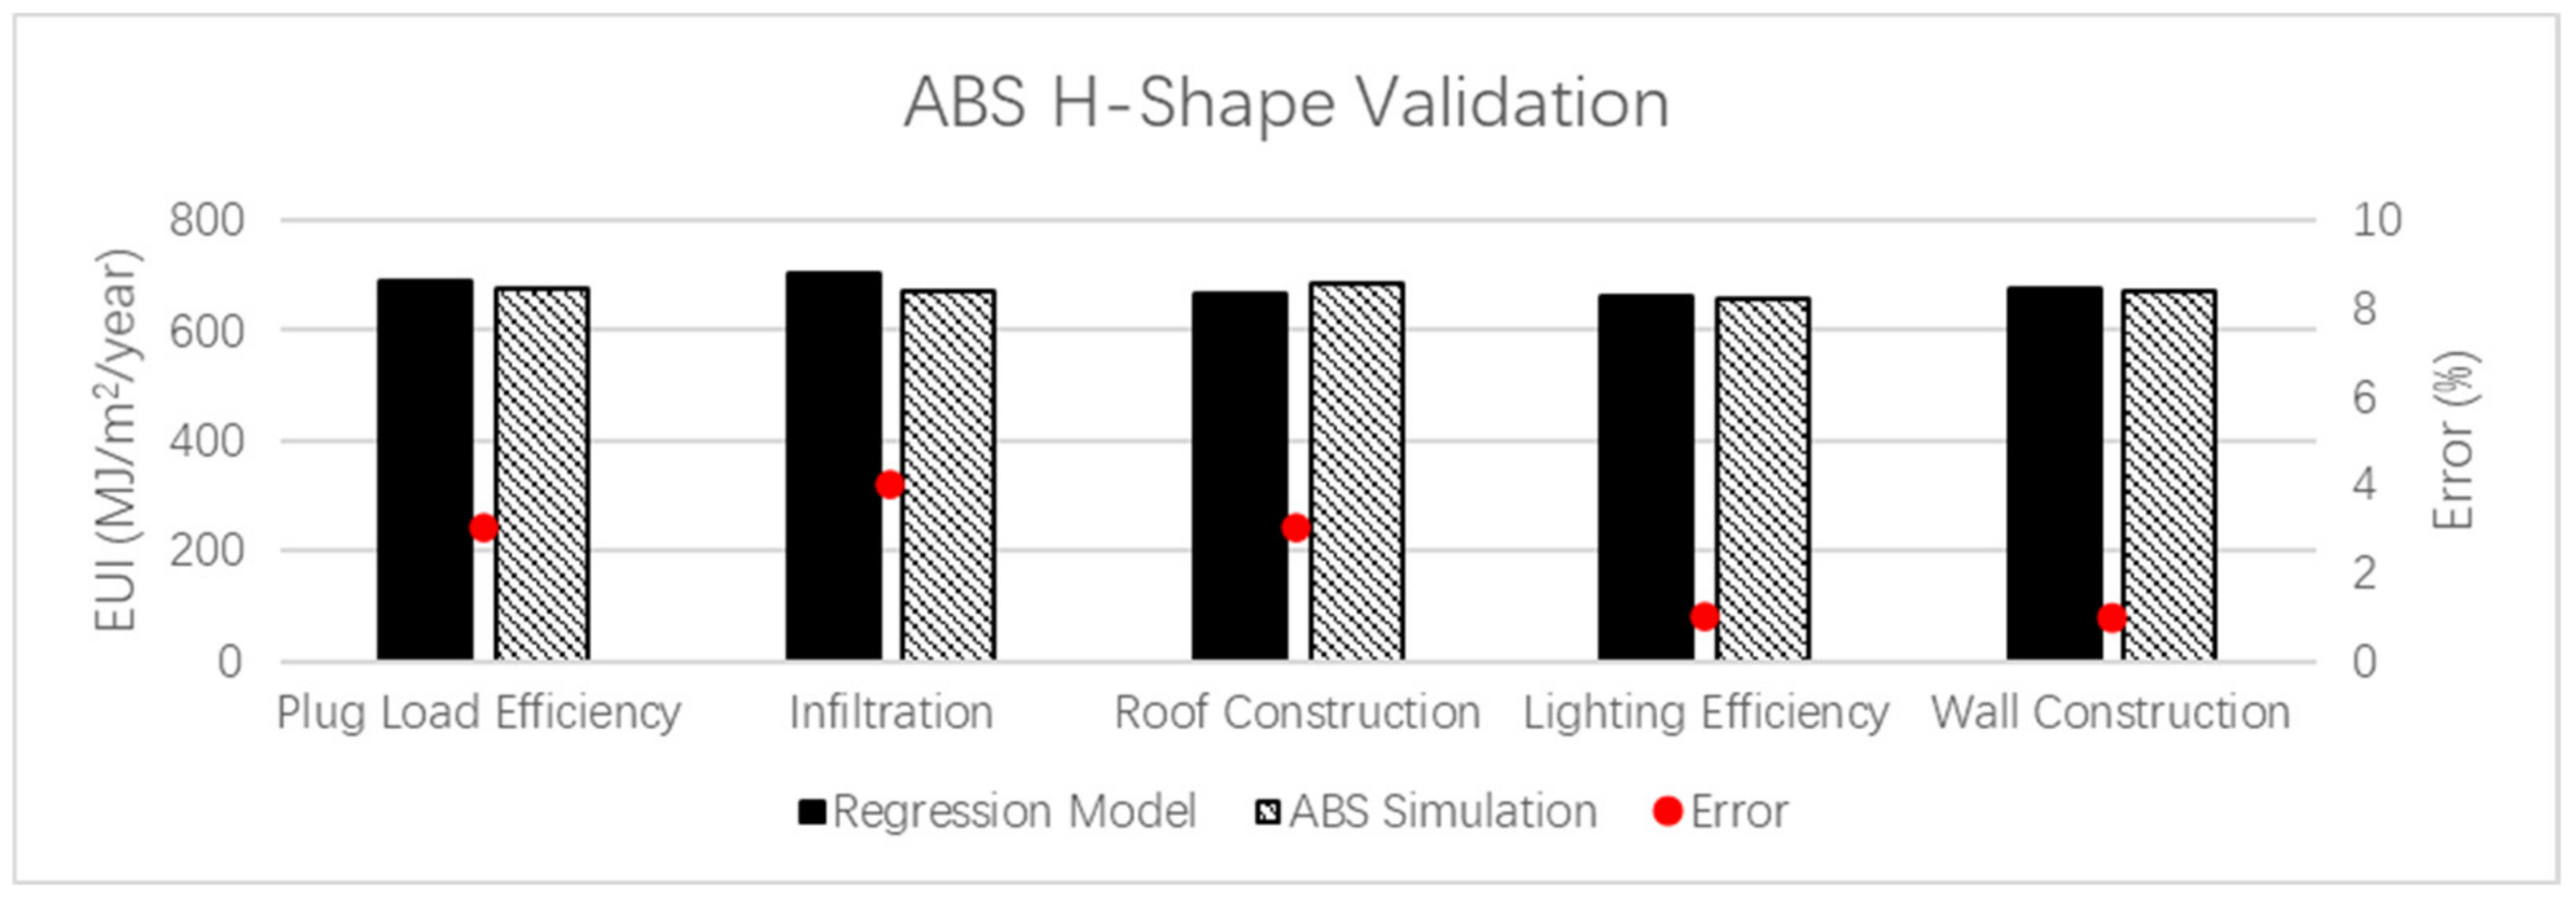
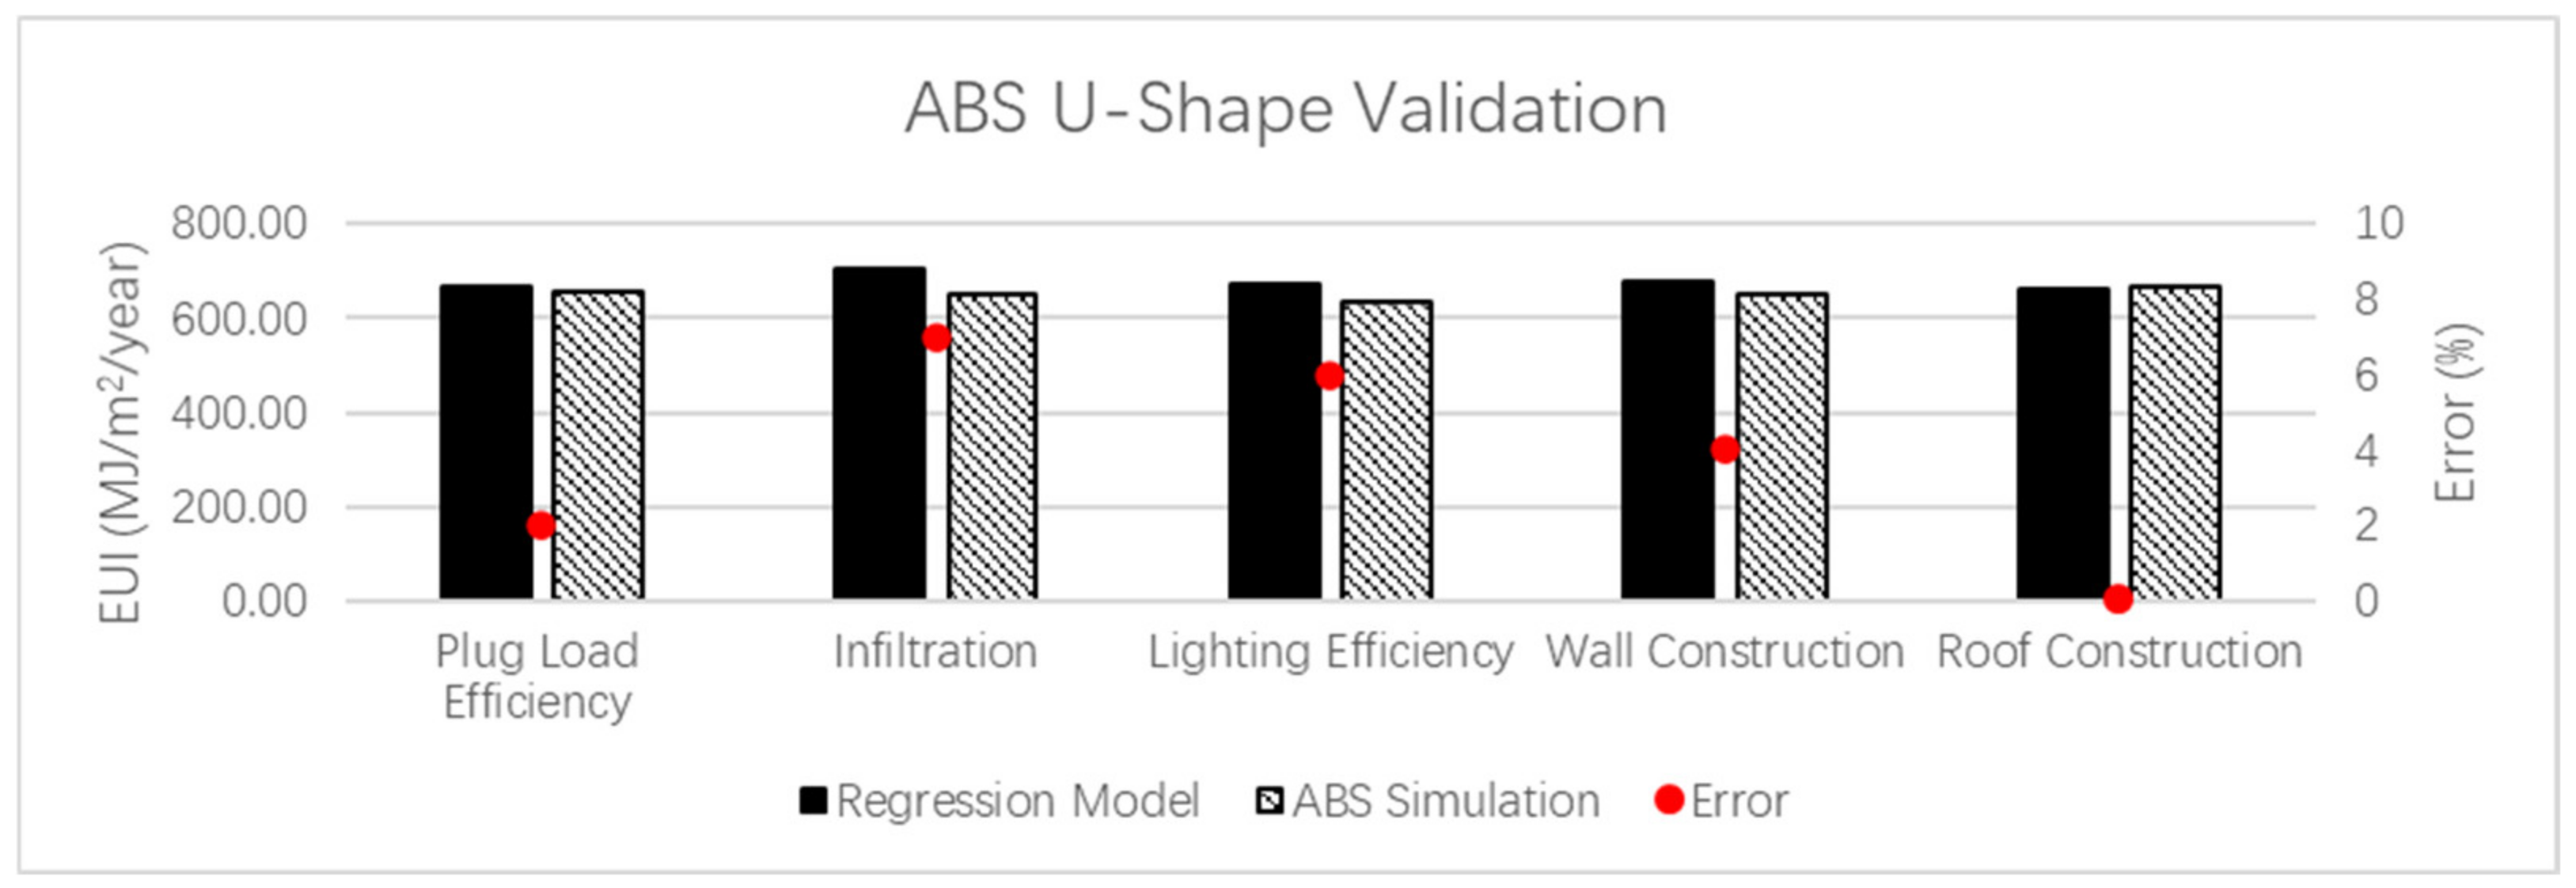
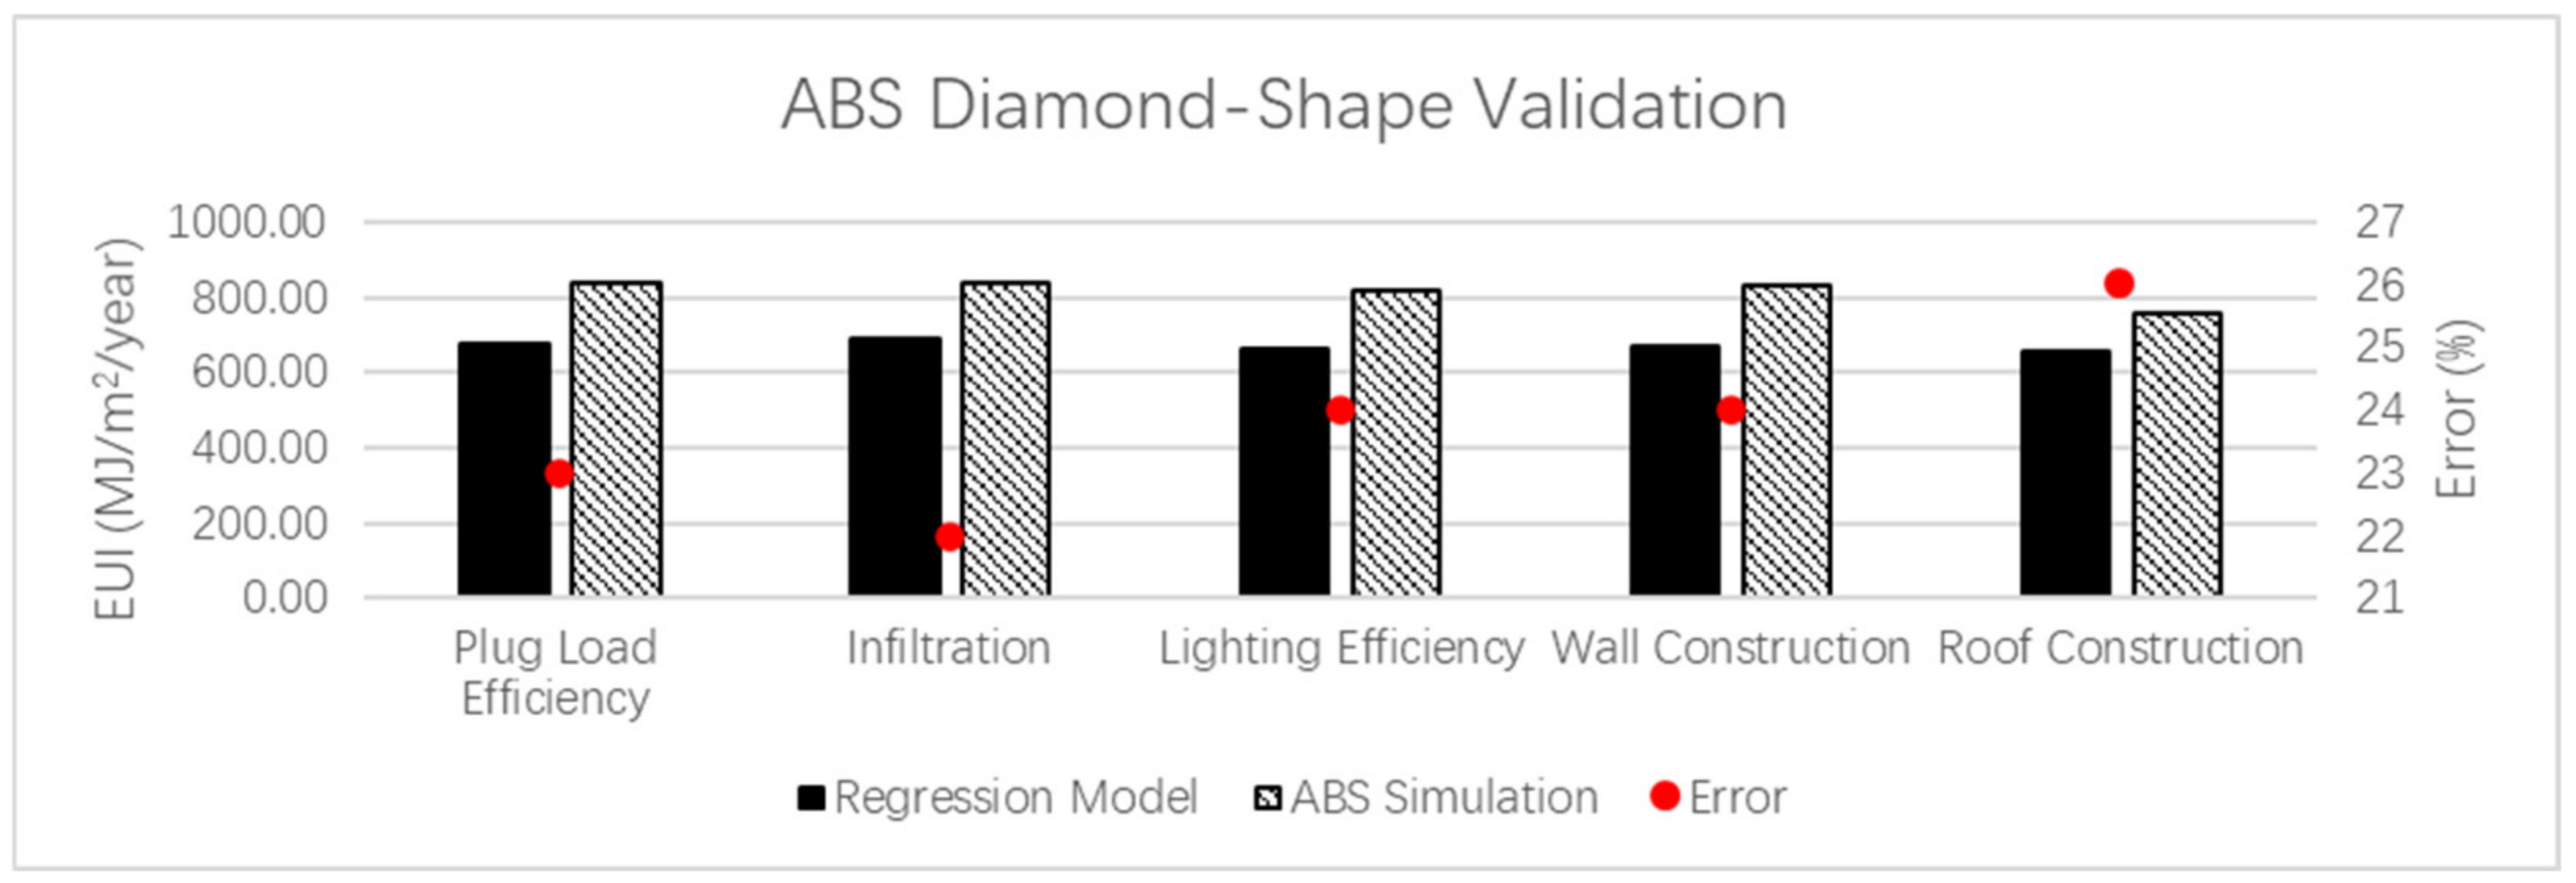
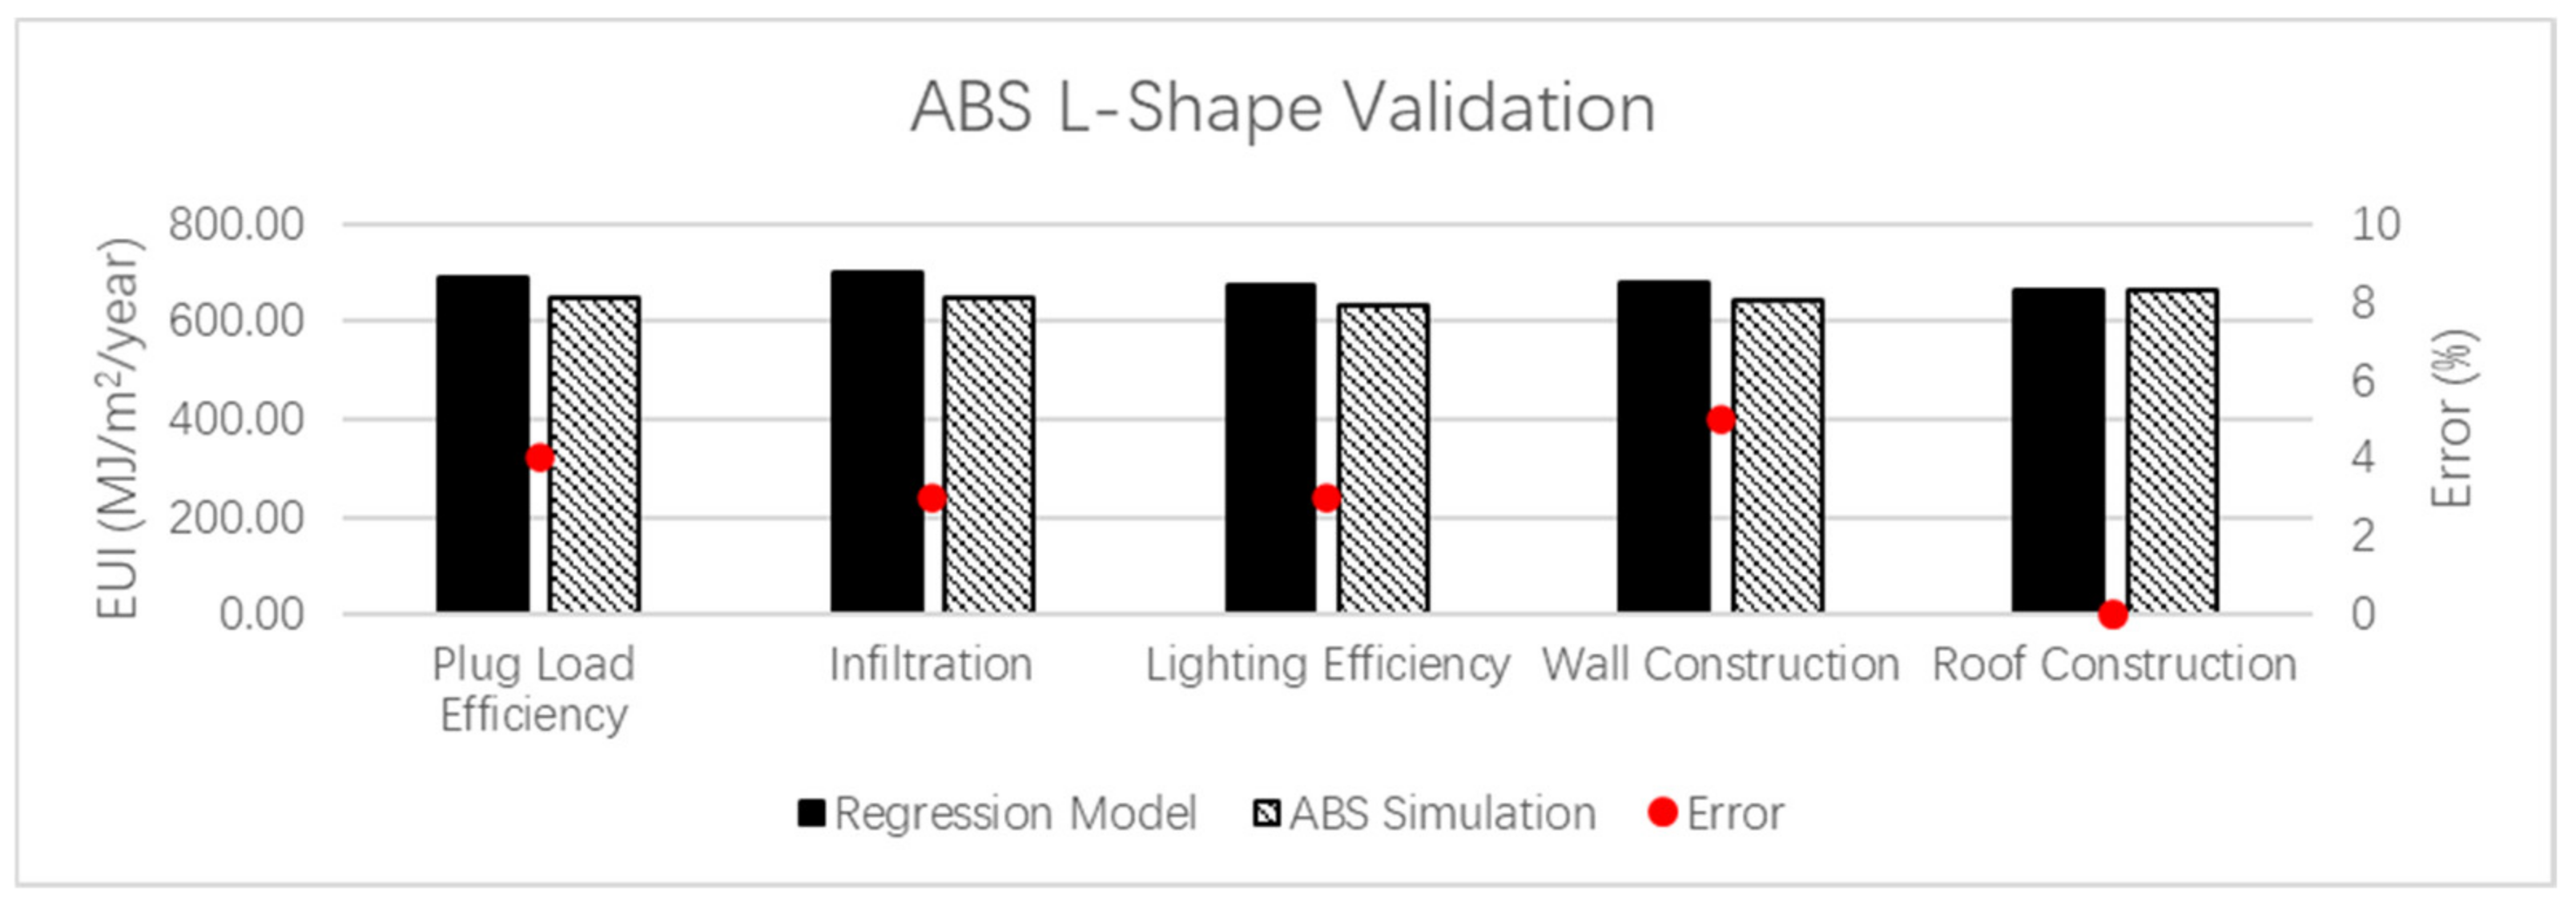
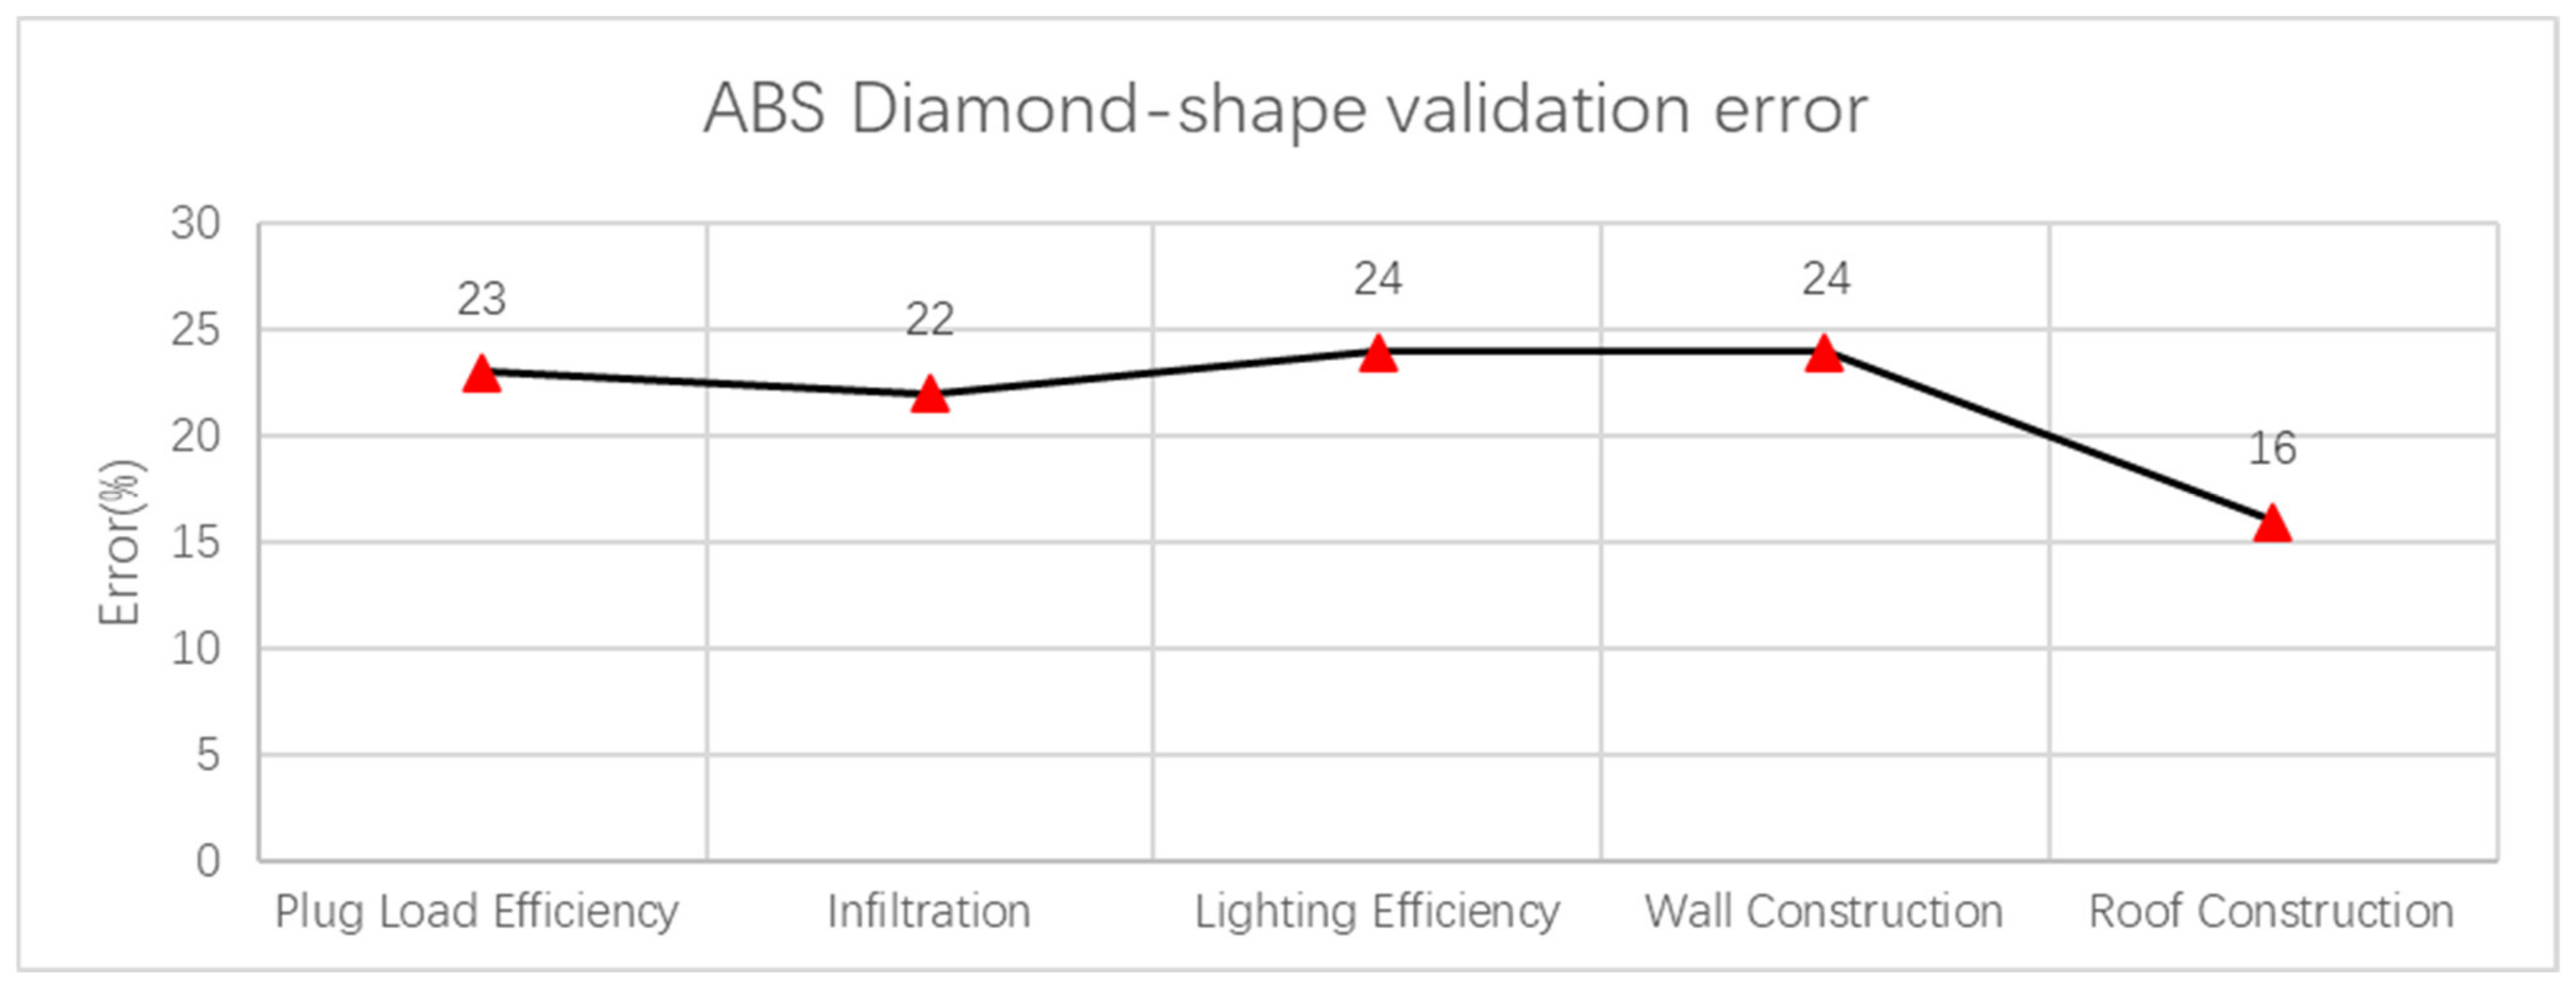
4.2.2. ABS Case Study—Validation
5. Discussion
6. Conclusions
- Due to the uncertainty and complexity of real-world models, models that include more significant parameters are recommended.
- The prototype model approach in this study has achieved success to some extent and can be used in future studies.
- Future modeling using BIM software could consider the energy setting and compare the influence of energy setting on the energy performance.
- Life cycle energy cost and other cost-related data generated by GBS can be further explored. A likewise regression analysis can be employed to develop equations.
- Cost-efficient alternatives need to be further identified based on the analysis of life cycle cost for the energy model.
- Due to the impact of COVID, measuring data comparison is not conducted. Acquiring the measured date is essential to improve the accuracy of the energy performance model.
- Further research could compare the current building design with BCA/Green Star regulations.
Author Contributions
Funding
Institutional Review Board Statement
Informed Consent Statement
Data Availability Statement
Acknowledgments
Conflicts of Interest
Appendix A


References
- Gervasio, H.; Santos, P.; Martins, R.; Simoesdasilva, L. A macro-component approach for the assessment of building sustainability in early stages of design. Build. Environ. 2014, 73, 256–270. [Google Scholar] [CrossRef]
- Yang, L.; Yan, H.; Lam, J.C. Thermal comfort and building energy consumption implications—A review. Appl. Energy 2014, 115, 164–173. [Google Scholar] [CrossRef]
- Lu, Y.; Wang, S.; Zhao, Y.; Yan, C. Renewable energy system optimization of low/zero energy buildings using single-objective and multi-objective optimization methods. Energy Build. 2015, 89, 61–75. [Google Scholar] [CrossRef]
- Liu, Y.; Yang, L.; Zheng, W.; Liu, T.; Zhang, X.; Liu, J. A novel building energy efficiency evaluation index: Establishment of calculation model and application. Energy Convers. Manag. 2018, 166, 522–533. [Google Scholar] [CrossRef]
- Zhao, H.-X.; Magoulès, F. A review on the prediction of building energy consumption. Renew. Sustain. Energy Rev. 2012, 16, 3586–3592. [Google Scholar] [CrossRef]
- Amasyali, K.; El-Gohary, N.M. A review of data-driven building energy consumption prediction studies. Renew. Sustain. Energy Rev. 2018, 81, 1192–1205. [Google Scholar] [CrossRef]
- Harish, V.S.K.V.; Kumar, A. A review on modeling and simulation of building energy systems. Renew. Sustain. Energy Rev. 2016, 56, 1272–1292. [Google Scholar] [CrossRef]
- Shiel, P.; Tarantino, S.; Fischer, M. Parametric analysis of design stage building energy performance simulation models. Energy Build. 2018, 172, 78–93. [Google Scholar] [CrossRef]
- Wu, J.; Lian, Z.; Zheng, Z.; Zhang, H. A method to evaluate building energy consumption based on energy use index of different functional sectors. Sustain. Cities Soc. 2020, 53, 101893. [Google Scholar] [CrossRef]
- Sadineni, S.B.; Madala, S.; Boehm, R.F. Passive building energy savings: A review of building envelope components. Renew. Sustain. Energy Rev. 2011, 15, 3617–3631. [Google Scholar] [CrossRef]
- Hygh, J.S.; DeCarolis, J.; Hill, D.B.; Ranjithan, S.R. Multivariate regression as an energy assessment tool in early building design. Build. Environ. 2012, 57, 165–175. [Google Scholar] [CrossRef]
- Catalina, T.; Iordache, V.; Caracaleanu, B. Multiple regression model for fast prediction of the heating energy demand. Energy Build. 2013, 57, 302–312. [Google Scholar] [CrossRef]
- Choi, I.Y.; Cho, S.H.; Kim, J.T. Energy consumption characteristics of high-rise apartment buildings according to building shape and mixed-use development. Energy Build. 2012, 46, 123–131. [Google Scholar] [CrossRef]
- Lam, J.C.; Wan, K.K.; Liu, D.; Tsang, C. Multiple regression models for energy use in air-conditioned office buildings in different climates. Energy Convers. Manag. 2010, 51, 2692–2697. [Google Scholar] [CrossRef]
- Aranda, A.; Ferreira, G.; Mainar-Toledo, M.; Scarpellini, S.; Sastresa, E.L. Multiple regression models to predict the annual energy consumption in the Spanish banking sector. Energy Build. 2012, 49, 380–387. [Google Scholar] [CrossRef]
- Negendahl, K.; Nielsen, T.R. Building energy optimization in the early design stages: A simplified method. Energy Build. 2015, 105, 88–99. [Google Scholar] [CrossRef]
- Suga, K.; Kato, S.; Hiyama, K. Structural analysis of Pareto-optimal solution sets for multi-objective optimization: An application to outer window design problems using Multiple Objective Genetic Algorithms. Build. Environ. 2010, 45, 1144–1152. [Google Scholar] [CrossRef]
- Hamdy, M.; Hasan, A.; Siren, K. Applying a multi-objective optimization approach for Design of low-emission cost-effective dwellings. Build. Environ. 2011, 46, 109–123. [Google Scholar] [CrossRef]
- Hui, S.C. Low energy building design in high density urban cities. Renew. Energy 2001, 24, 627–640. [Google Scholar] [CrossRef]
- Mahdavi, A.; Doppelbauer, E.-M. A performance comparison of passive and low-energy buildings. Energy Build. 2010, 42, 1314–1319. [Google Scholar] [CrossRef]
- Abu Bakar, N.N.; Hassan, M.Y.; Abdullah, H.; Rahman, H.A.; Abdullah, M.P.; Hussin, F.; Bandi, M. Energy efficiency index as an indicator for measuring building energy performance: A review. Renew. Sustain. Energy Rev. 2015, 44, 1–11. [Google Scholar] [CrossRef]
- Egan, J.; Finn, D.; Soares, P.H.D.; Baumann, V.A.R.; Aghamolaei, R.; Beagon, P.; Neu, O.; Pallonetto, F.; O’Donnell, J. Definition of a useful minimal-set of accurately-specified input data for Building Energy Performance Simulation. Energy Build. 2018, 165, 172–183. [Google Scholar] [CrossRef] [Green Version]
- Krygiel, E.; Nies, B. Green BIM: Successful Sustainable Design with Building Information Modeling; John Wiley & Sons: Hoboken, NJ, USA, 2008. [Google Scholar]
- Cheung, F.K.; Rihan, J.; Tah, J.; Duce, D.; Kurul, E. Early stage multi-level cost estimation for schematic BIM models. Autom. Constr. 2012, 27, 67–77. [Google Scholar] [CrossRef]
- Crawley, D.B.; Lawrie, L.K.; Winkelmann, F.C.; Buhl, W.; Huang, Y.; Pedersen, C.O.; Strand, R.K.; Liesen, R.J.; Fisher, D.E.; Witte, M.J.; et al. EnergyPlus: Creating a new-generation building energy simulation program. Energy Build. 2001, 33, 319–331. [Google Scholar] [CrossRef]
- Abanda, F.; Byers, L. An investigation of the impact of building orientation on energy consumption in a domestic building using emerging BIM (Building Information Modelling). Energy 2016, 97, 517–527. [Google Scholar] [CrossRef]
- Asadi, S.; Amiri, S.S.; Mottahedi, M. On the development of multi-linear regression analysis to assess energy consumption in the early stages of building design. Energy Build. 2014, 85, 246–255. [Google Scholar] [CrossRef]
- Maile, T.; Bazjanac, V.; Fischer, M. A method to compare simulated and measured data to assess building energy performance. Build. Environ. 2012, 56, 241–251. [Google Scholar] [CrossRef]
- Planas, C.; Cuerva, E.; Alavedra, P. Effects of the type of facade on the energy performance of office buildings representative of the city of Barcelona. Ain Shams Eng. J. 2018, 9, 3325–3334. [Google Scholar] [CrossRef]
- Cetiner, I.; Özkan, E. An approach for the evaluation of energy and cost efficiency of glass façades. Energy Build. 2005, 37, 673–684. [Google Scholar] [CrossRef]
- Yu, C.; Du, J.; Pan, W. Improving accuracy in building energy simulation via evaluating occupant behaviors: A case study in Hong Kong. Energy Build. 2019, 202, 109373. [Google Scholar] [CrossRef]
- Gao, X.; Malkawi, A. A new methodology for building energy performance benchmarking: An approach based on intelligent clustering algorithm. Energy Build. 2014, 84, 607–616. [Google Scholar] [CrossRef]
- Bilous, I.; Deshko, V.; Sukhodub, I. Parametric analysis of external and internal factors influence on building energy performance using non-linear multivariate regression models. J. Build. Eng. 2018, 20, 327–336. [Google Scholar] [CrossRef]
- Ciulla, G.; D’Amico, A. Building energy performance forecasting: A multiple linear regression approach. Appl. Energy 2019, 253, 113500. [Google Scholar] [CrossRef]
- Lee, J.; Ham, Y. Impact Analysis on the Variations of the Thermo-physical Property of Building Envelopes and Occupancy in Building Energy Performance Assessment. Procedia Eng. 2016, 145, 556–564. [Google Scholar] [CrossRef] [Green Version]
- Tushar, Q.; Bhuiyan, M.A.; Zhang, G. Energy simulation and modeling for window system: A comparative study of life cycle assessment and life cycle costing. J. Clean. Prod. 2021, 330, 129936. [Google Scholar] [CrossRef]
- Habibi, S. Role of BIM and energy simulation tools in designing zero-net energy homes. Constr. Innov. 2021, 22, 101–119. [Google Scholar] [CrossRef]
- Li, X.; Liu, S.; Zhao, L.; Meng, X.; Fang, Y. An integrated building energy performance evaluation method: From parametric modeling to GA-NN based energy consumption prediction modeling. J. Build. Eng. 2021, 45, 103571. [Google Scholar] [CrossRef]
- Morsali, S.; Akbarian, S.; Gari, Z.H.Z. Simulation of the roof shapes and building orientation on the energy performance of the buildings. J. Build. Pathol. Rehabil. 2021, 6, 36. [Google Scholar] [CrossRef]
- González, J.; Soares, C.A.P.; Najjar, M.; Haddad, A.N. BIM and BEM Methodologies Integration in Energy-Efficient Buildings Using Experimental Design. Buildings 2021, 11, 491. [Google Scholar] [CrossRef]
- Alothman, A.; Ashour, S.; Krishnaraj, L. Energy Performance Analysis of Building for Sustainable Design Using Bim: A Case Study on Institute Building. Int. J. Renew. Energy Res. 2021, 11, 556–565. [Google Scholar]
- Xu, X.; Mumford, T.; Zou, P.X. Life-cycle building information modelling (BIM) engaged framework for improving building energy performance. Energy Build. 2020, 231, 110496. [Google Scholar] [CrossRef]
- Lim, Y.W.; Chong, H.Y.; Ling, P.C.; Tan, C.S. Application of building information modelling (BIM) in analysing the building energy performances of an office building. Int. J. Adv. Sci. Technol. 2020, 29, 262–282. [Google Scholar]
- Chicco, D.; Warrens, M.J.; Jurman, G. The coefficient of determination R-squared is more informative than SMAPE, MAE, MAPE, MSE and RMSE in regression analysis evaluation. PeerJ Comput. Sci. 2021, 7, e623. [Google Scholar] [CrossRef]


| Aim | Method | Findings and Limitations |
|---|---|---|
| Providing a more comprehensive approach to benchmarking building energy [32]. | The clustering concept based on Fayyad’s model (feature selection, clustering algorithm adaptation, results validation based on the data from the national database CBECS and local actual buildings, and interpretation). | Compared with the Energy Star approach, the clustering approach can incorporate all the statistically significant building characteristics affecting energy usage. |
| Developing a building energy performance analysis tool based on regression model for internal air temperature prediction [33]. | Simulation modeling analysis based on the EnergyPlus software; multivariate regression model analysis based on the EnergyPlus software. | Utility of building energy performance analysis based on regression model can provide high accuracy results for internal air temperature prediction in the circumstances with numerous internal and external influential factors. |
| Offering a new simple estimating tool for building energy consumption-based linear regression model without an expert user [34]. | Comprehensive analysis with TRNSYS software and the multiple linear regression method; sensitivity analysis using the Pearson coefficient. | The use of multiple linear regression can simply and immediately determine building energy balance for evaluation phases in energy planning. |
| Evaluating the impact on building energy analysis due to the variations of the thermo-physical property of building envelopes and occupancy [35,36]. | Data analysis using gbXML-based on BIM; regression analysis. | The impact and the relative sensitivity of occupancy variations may become greater in the warmer location as the number of occupants increases. This research is still needed for the normalization of variables in further studies. In addition, the reference model is also required to use through various simulation engines to improve the accuracy comparison on the building energy performance. |
| Providing an optimizing measure for the building windows system through integration operational efficiency with comprehensive life cycle assessment (LCA) and life cycle costing (LCC) [35,36]. | Life cycle assessment and life cycle costing analysis based on the FirstRate5 software; multiple linear regression analyses; Monte Carlo simulation; thermal energy simulation; simulation and modeling based on BIM. | 1. The minimum opening of windows on the wall is an energy-saving option. 2. Comparing the windows’ opening and solar aperture can determine that larger windows will cause excessive energy consumption in the cold-temperate zone. 3. Solar aperture on energy consumption is more significant than the U-value in the warm-temperate zone. 4. The major environmental impacts at various life cycle stages are usually identified by the LCA of different framed windows. 5. Optimum performance of windows varies with climate, longitude, latitude and solar radiation. |
| Evaluating the capacity of BIM technology design and address zero-net energy houses (ZEHs) [37]. | Building information modeling analysis based on BIM and a simulation analysis based on BPS tools. | The interoperability of the BIM system with BPS tools shows that BIM plays a key role be in achieving net-zero levels for an existing residential house. However, BIM is still not good at determining the storage capacity of phase change materials (PCMs). |
| Presenting an efficient method integrated with building information modeling, energy simulation, and energy consumption prediction for building energy performance evaluation [38]. | 3D building energy modeling based on generic modeling (GM) approach; simulation analysis via the EnergyPlus software; Genetic Algorithm-Neural Network (GA-NN) for building energy consumption prediction model. | This building energy prediction method based on generating models and data depending on parametric modeling is more effective, user-friendly, and reliable for building projects. Limitations: (1) this approach still need to be improved for the design phase in complex building structures; (2) there is still a gap between the actual data and the result calculated by EnergyPlus. |
| Investigating the effects of roof shapes and buildings directly on the energy consumption of the residential buildings [39]. | Modeling simulation analysis based on REVIT Autodesk Solar Analysis software. | Compared with flat roofs, gable and hip roofs are more stable regarding energy consumption in terms of orientation. Building orientation will provide a more significant impact on building energy performance than flat roof shape. |
| Investigating the availability of integrating the BIM and BEM methodologies for building energy performance analysis [40]. | Experimental design via Autodesk Insight; modeling analysis based on AutoCAD and Autodesk REVIT | The energy performance can be effectively improved by the application of the linkage between the BIM and BEM methodologies in one environment: REVIT on Autodesk, Insight, and Green Building Studio. More information of the materials’ thermal properties still needs to be added; the accuracy was not verified for the climatic conditions in the database of Autodesk REVIT. |
| A case study to assess the validity of BIM in the building design phase for sustainable buildings [41]. | Building modeling by Revit Architecture 2018; simulation analysis based on the Green Building Studio. | BIM can effectively assist in evaluating the energy efficiency and cost of the building using Green Building Studio and Autodesk Revit 2018. |
| Developing life cycle BIM engaged framework for addressing the building energy performance gap (BEPG) [42]. | Literature review; semi-structured interview; qualitative analysis based on Nvivo® software. | BIM can be used as a functional enabler to address the building energy performance gap (BEPG). However, the real BIM platform still needs to be developed and validated in actual projects in future studies. |
| To analyze the impact of the existing type of lighting (Ao) and glazing materials for the energy performance of commercial building [43]. | Virtual modeling by the ArchiCAD software; manual observation; the energy evaluation via the ArchiCAD software. | BIM can effectively address various issues in the construction industry; the building energy consumption will be impacted by different types of frame materials; energy-efficient lighting such as LEDs can reduce building energy consumption. |
| Constant Parameters | |
|---|---|
| Building type | School or University |
| Location | Sydney, NSW |
| Building area | 100 m2 |
| Analysis year | 2021 |
| Floor-to-ceiling height | 3 m |
| Floor construction | Floor-Grnd-Susp_65Scr-80Ins-100Blk-75PC |
| Wall construction | Basic wall (wall-Ext 102Bwk -75Ins-100BlK-12P) |
| Ceiling construction | Compound ceiling—Plain R2 |
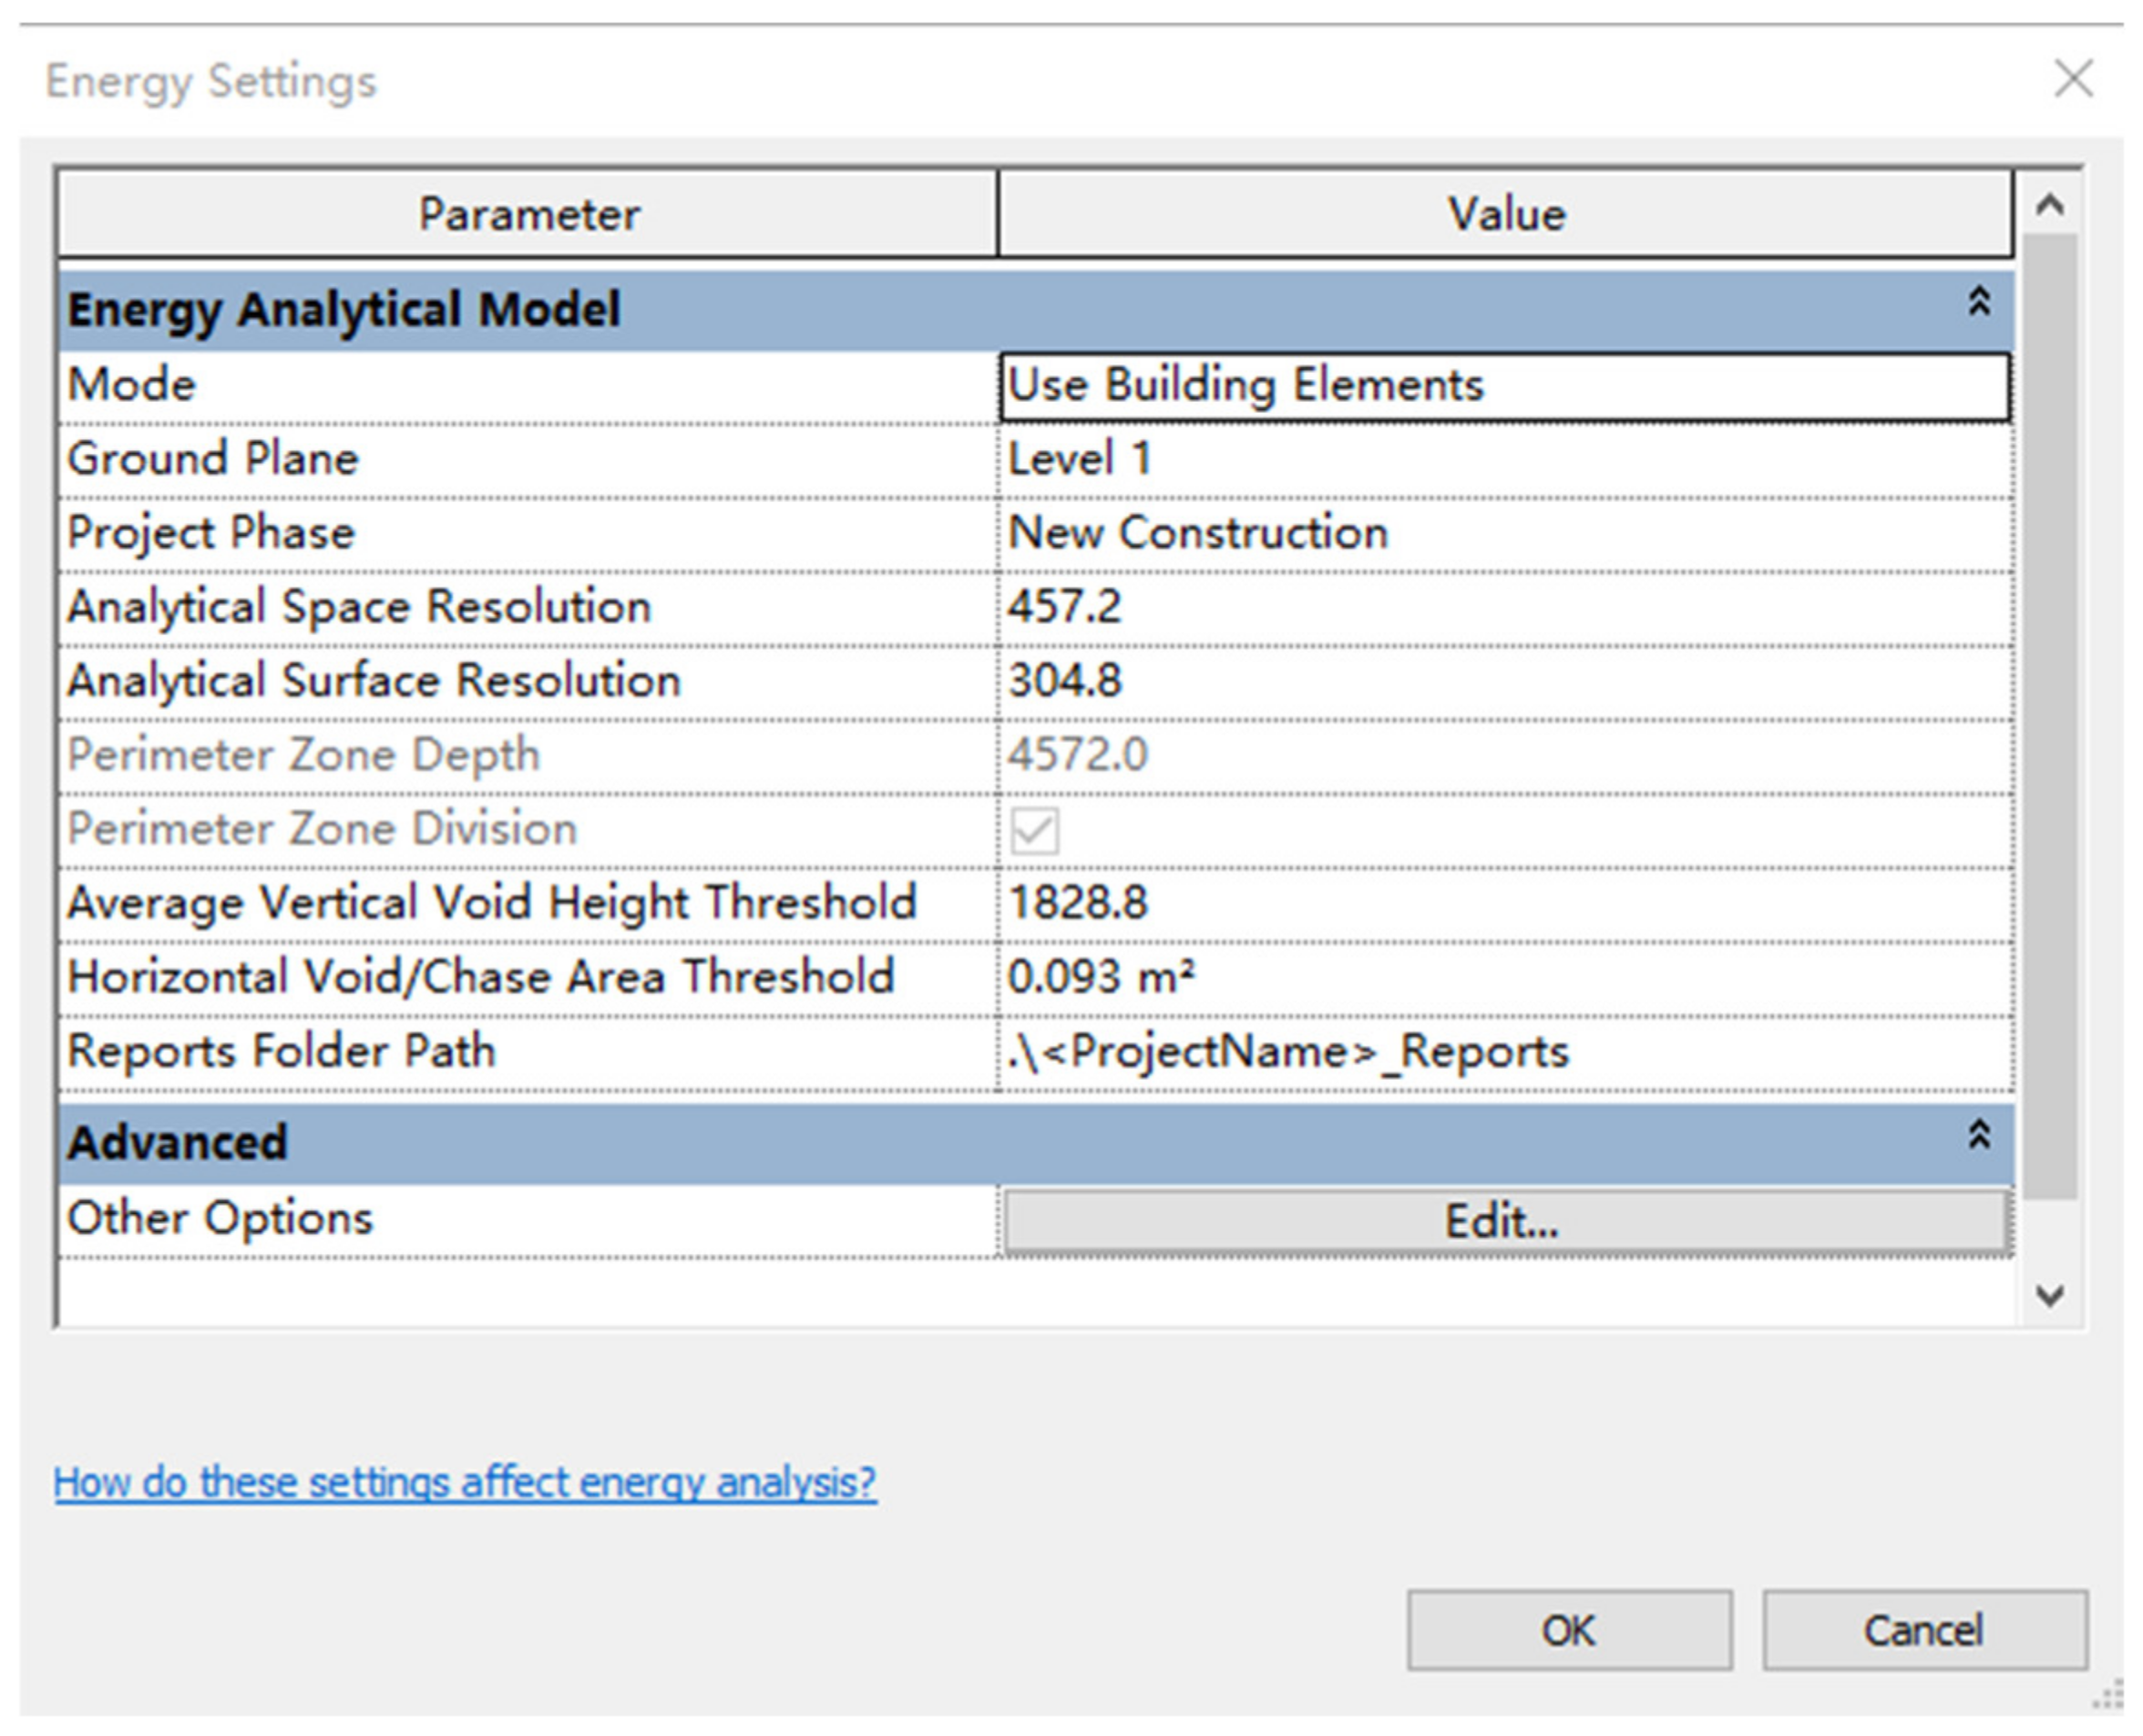
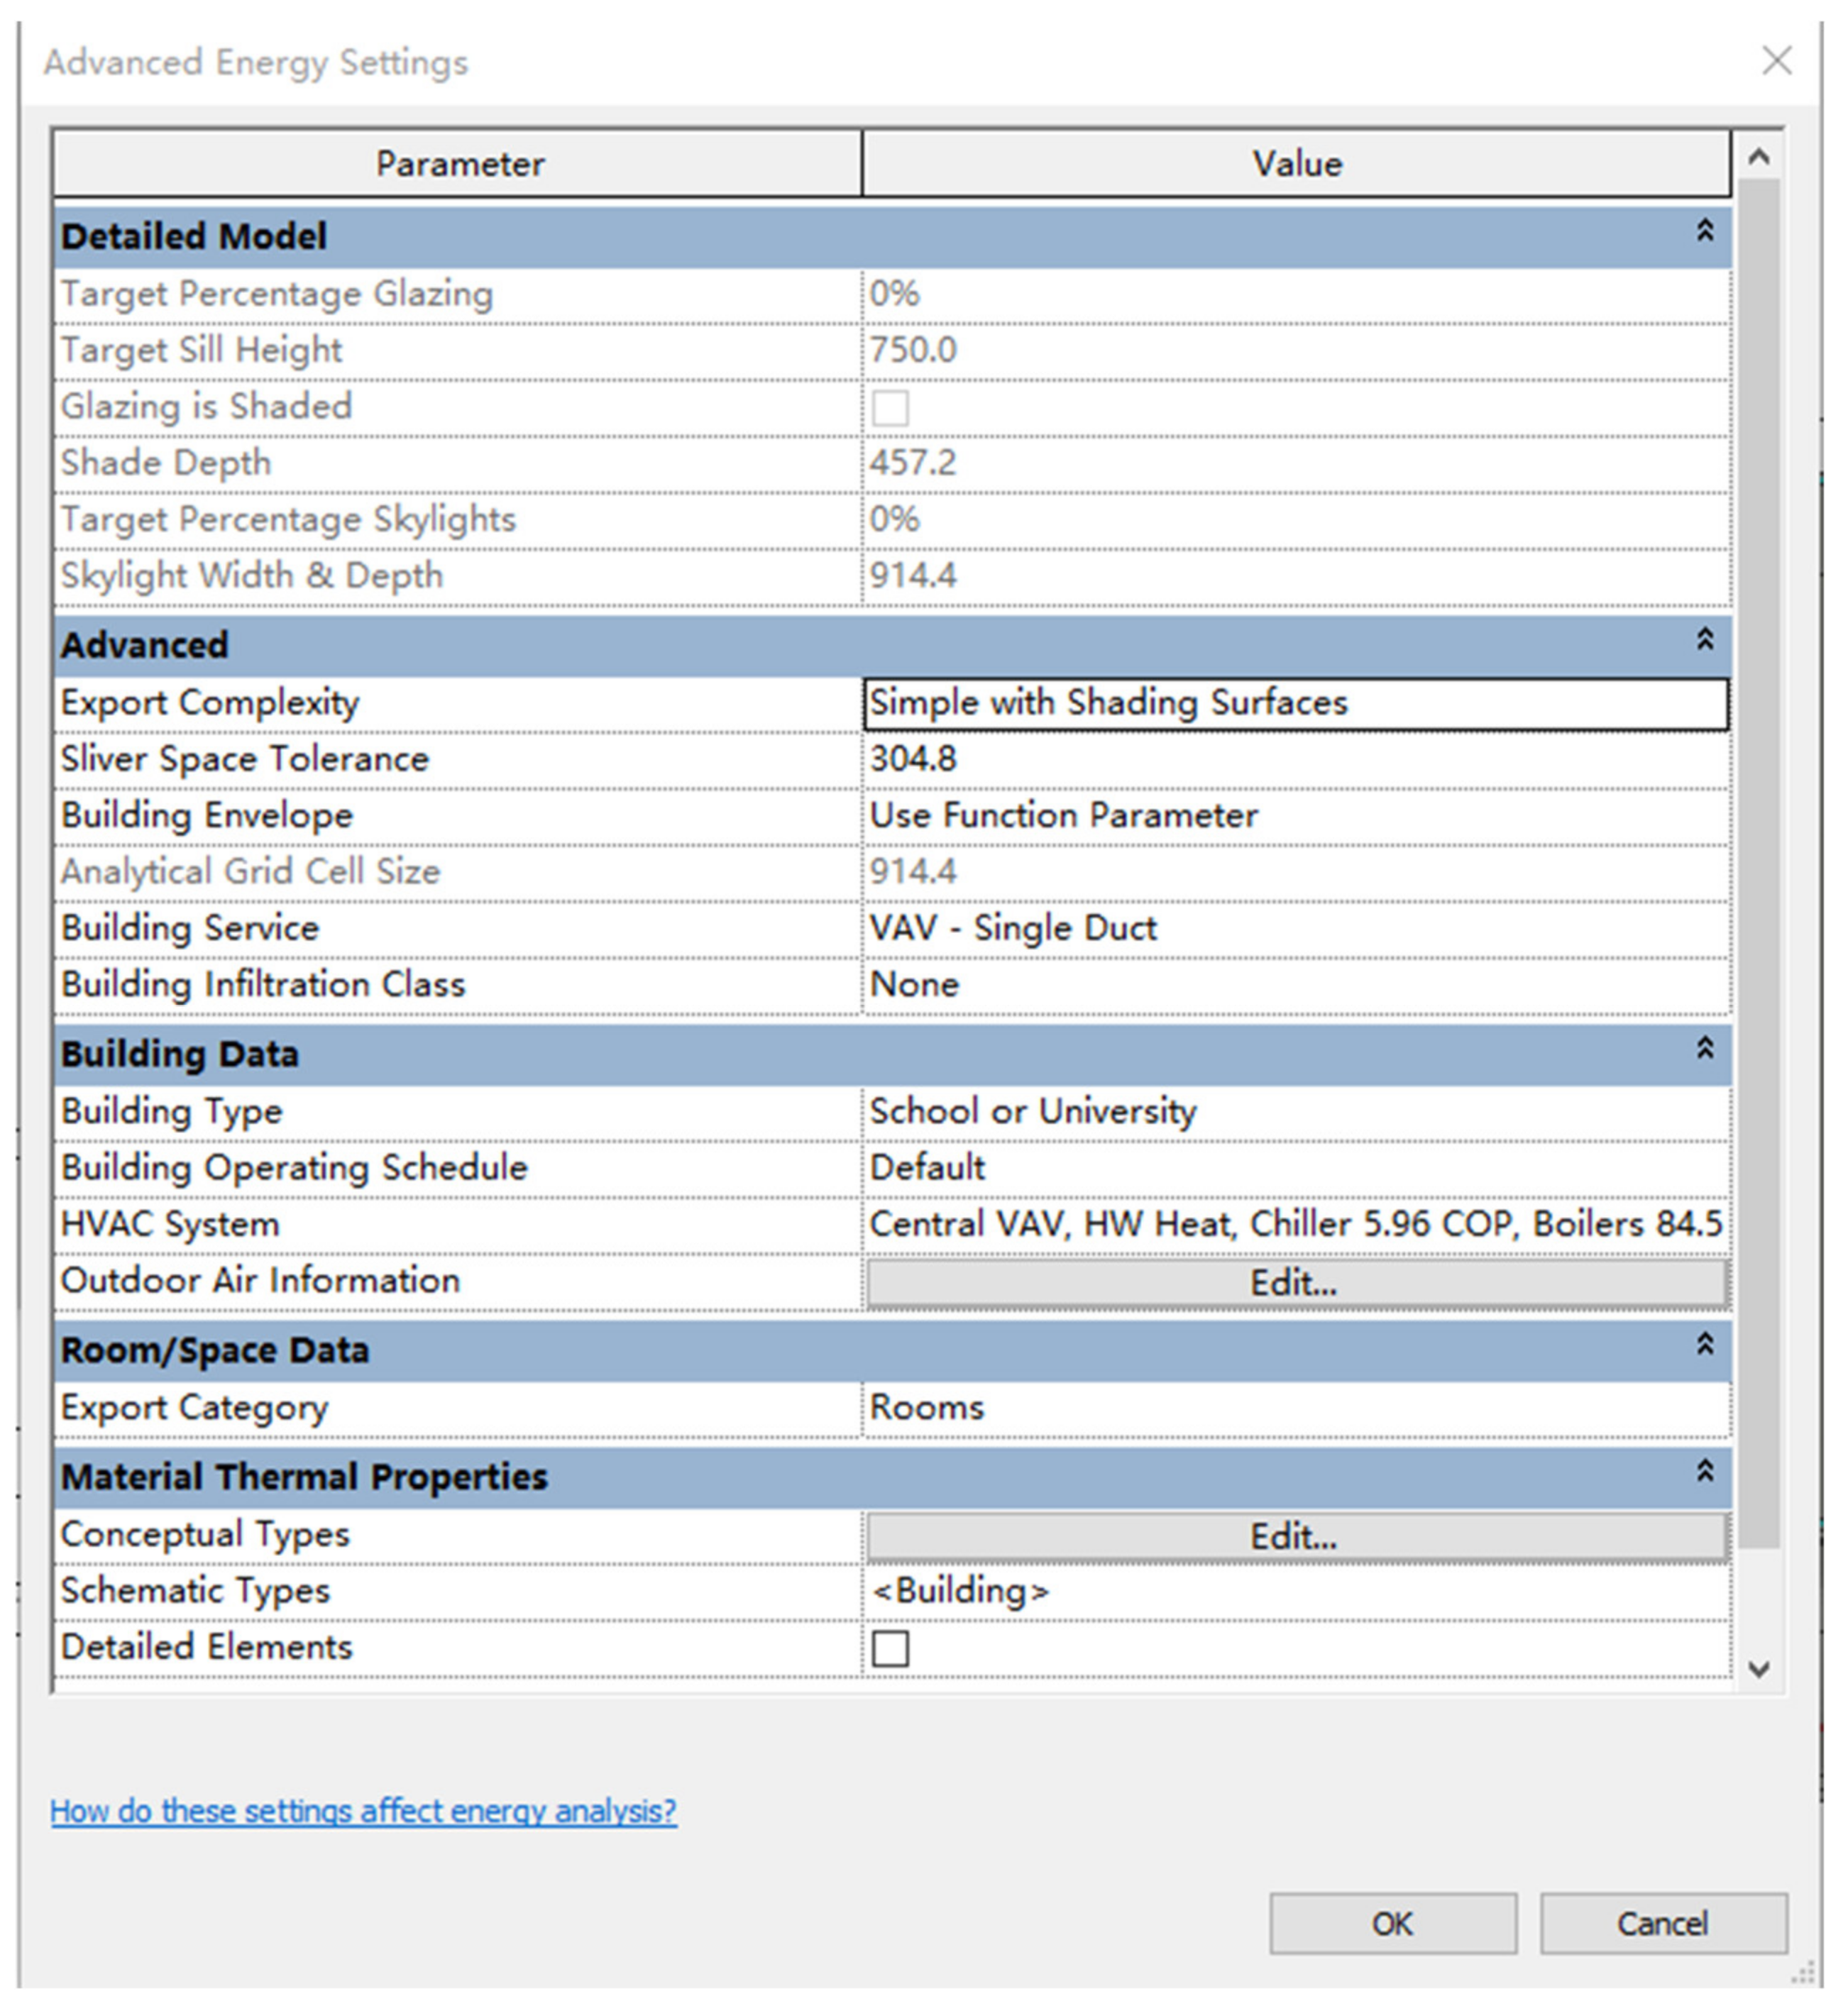
| Energy Settings | |
|---|---|
| Energy analytical model mode | Use building elements |
| Building service | VAV-Single Duct |
| Building infiltration class | None |
| HVAC default system | Central VAV, HW Heat, Chiller 5.96 COP, Boiler 84.5 eff |
| Export Category | Rooms |
| Material Thermal Properties | |
|---|---|
| Roofs | 4 in lightweight concrete, U = 1.2750 W/(m2·K) |
| Exterior Walls | 8 in lightweight concrete block, U = 0.8108 W/(m2·K) |
| Interior Walls | Frame partition with ¾ in gypsum board, U = 1.4733 W/(m2·K) |
| Ceilings | 8 in lightweight concrete ceiling, U = 1.3610 W/(m2·K) |
| Floors | Passive floor, no insulation, tile or vinyl, U = 2.9582 W/(m2·K) |
| Slabs | Un-insulated solid, U = 0.7059 W/(m2·K) |
| Doors | Metal, U = 3.7021 W/(m2·K) |
| Exterior Windows | Large, double-glazed windows (reflective coating)—industry, U = 2.9214 W/(m2·K), SHGC = 0.13 |
| Interior Windows | Large single-glazed windows, U = 3.6898 W/(m2·K), SHGC = 0.86 |
| Skylights | Large, double-glazed windows (reflective coating)—industry, U = 2.9214 W/(m2·K), SHGC = 0.13 |
| Energy Settings | Baseline |
|---|---|
| Schedule | California Non-residential New Construction Baseline Study 1999 |
| Thermal parameters of the envelope | ASHRAE 90.1 2007 and ASHRAE 90.2 2007 |
| Equipment power density and DHW loads | California 2005 Title 24 Energy Code |
| The density of occupancy and ventilation | ASHRAE 62.1-2007 |
| HVAC system | 2003 Commercial Buildings Energy Consumption Survey |
| Parameter | Analysis Methods | |
|---|---|---|
| 1 | Wall Construction (U-Value) | Tried to carry out linear regression analysis with U-value and R-value. Analysis with U-value accepted. |
| 2 | Roof Construction (U-Value) | Tried to carry out linear regression analysis with U-value and R-value. Analysis with U-value accepted. |
| 3 | Infiltration (ACH) | ACH (air change per hour) was used in the regression analysisRanges from 0.17 to 2 L/s/m3. |
| 4 | Lighting Efficiency | Lighting efficiency ranges from 0.3 to 1.9 w/sf, equivalent to 3.23 to 20.44 W/m2. |
| 5 | Plug Load Efficiency | Ranges from 0.6 to 2.6 W/sf, equivalent to 6.46 to 27.98 W/m2. |
| Wall Construction: y = α + βx | |||||
|---|---|---|---|---|---|
| S1-Rec | S2-L | S3-H | S4-DMD | S5-U | |
| α | 668.36 | 667.86 | 668.59 | 662.01 | 665.27 |
| β | 14.62 | 21.31 | 25.87 | 15.27 | 26.20 |
| R2 | 0.896 | 0.881 | 0.875 | 0.893 | 0.875 |
| Plug Load Efficiency: y = α + βx | |||||
|---|---|---|---|---|---|
| S1-Rec | S2-L | S3-H | S4-DMD | S5-U | |
| α | 491.45 | 497.96 | 501.40 | 486.75 | 498.96 |
| β | 11.77 | 11.64 | 11.67 | 11.71 | 11.63 |
| R2 | 0.999 | 0.999 | 0.999 | 0.999 | 0.999 |
| Infiltration: y = α + βx | |||||
|---|---|---|---|---|---|
| S1-Rec | S2-L | S3-H | S4-DMD | S5-U | |
| α | 668.98 | 672.33 | 675.86 | 662.72 | 672.70 |
| β | 21.97 | 26.35 | 28.00 | 23.70 | 28.74 |
| R2 | 0.853 | 0.907 | 0.919 | 0.871 | 0.920 |
| Roof Construction: y = α + βx | |||||
|---|---|---|---|---|---|
| S1-Rec | S2-L | S3-H | S4-DMD | S5-U | |
| α | 646.74 | 649.29 | 652.85 | 640.60 | 649.82 |
| β | 25.33 | 25.40 | 25.10 | 24.91 | 24.72 |
| R2 | 0.998 | 0.999 | 0.999 | 0.998 | 0.998 |
| Lighting Efficiency: y = α + βx | |||||
|---|---|---|---|---|---|
| S1-Rec | S2-L | S3-H | S4-DMD | S5-U | |
| α | 528.71 | 534.52 | 538.343 | 523.53 | 535.74 |
| β | 11.87 | 11.67 | 11.67 | 11.71 | 11.64 |
| R2 | 0.999 | 0.999 | 0.999 | 0.999 | 0.999 |
| Floor Area (m2) | EUI (MJ/m2/Year) | Floor-to-Ceiling Height (mm) | |
|---|---|---|---|
| H shape | 2824 | 671.0 | 3000 |
| Rectangle shape | 440 | 687.7 | 3000 |
| L shape | 342 | 646.7 | 3000 |
| U shape | 1119 | 651.8 | 3000 |
| Diamond shape | 604 | 829.7 | 4000 |
Publisher’s Note: MDPI stays neutral with regard to jurisdictional claims in published maps and institutional affiliations. |
© 2022 by the authors. Licensee MDPI, Basel, Switzerland. This article is an open access article distributed under the terms and conditions of the Creative Commons Attribution (CC BY) license (https://creativecommons.org/licenses/by/4.0/).
Share and Cite
Tahmasebinia, F.; Jiang, R.; Sepasgozar, S.; Wei, J.; Ding, Y.; Ma, H. Implementation of BIM Energy Analysis and Monte Carlo Simulation for Estimating Building Energy Performance Based on Regression Approach: A Case Study. Buildings 2022, 12, 449. https://doi.org/10.3390/buildings12040449
Tahmasebinia F, Jiang R, Sepasgozar S, Wei J, Ding Y, Ma H. Implementation of BIM Energy Analysis and Monte Carlo Simulation for Estimating Building Energy Performance Based on Regression Approach: A Case Study. Buildings. 2022; 12(4):449. https://doi.org/10.3390/buildings12040449
Chicago/Turabian StyleTahmasebinia, Faham, Ruifeng Jiang, Samad Sepasgozar, Jinlin Wei, Yilin Ding, and Hongyi Ma. 2022. "Implementation of BIM Energy Analysis and Monte Carlo Simulation for Estimating Building Energy Performance Based on Regression Approach: A Case Study" Buildings 12, no. 4: 449. https://doi.org/10.3390/buildings12040449