
Microscopical Resource Allocation for Large-Scale Apartment Foundation Work Using Queuing Systems


Abstract
:1. Introduction
2. Literature Review
2.1. Resource Management in Frame Construction
2.2. Microscopic Viewpoint Analysis of the Resource Planning
2.3. Queuing System
3. Preliminary Investigation of the Case Project
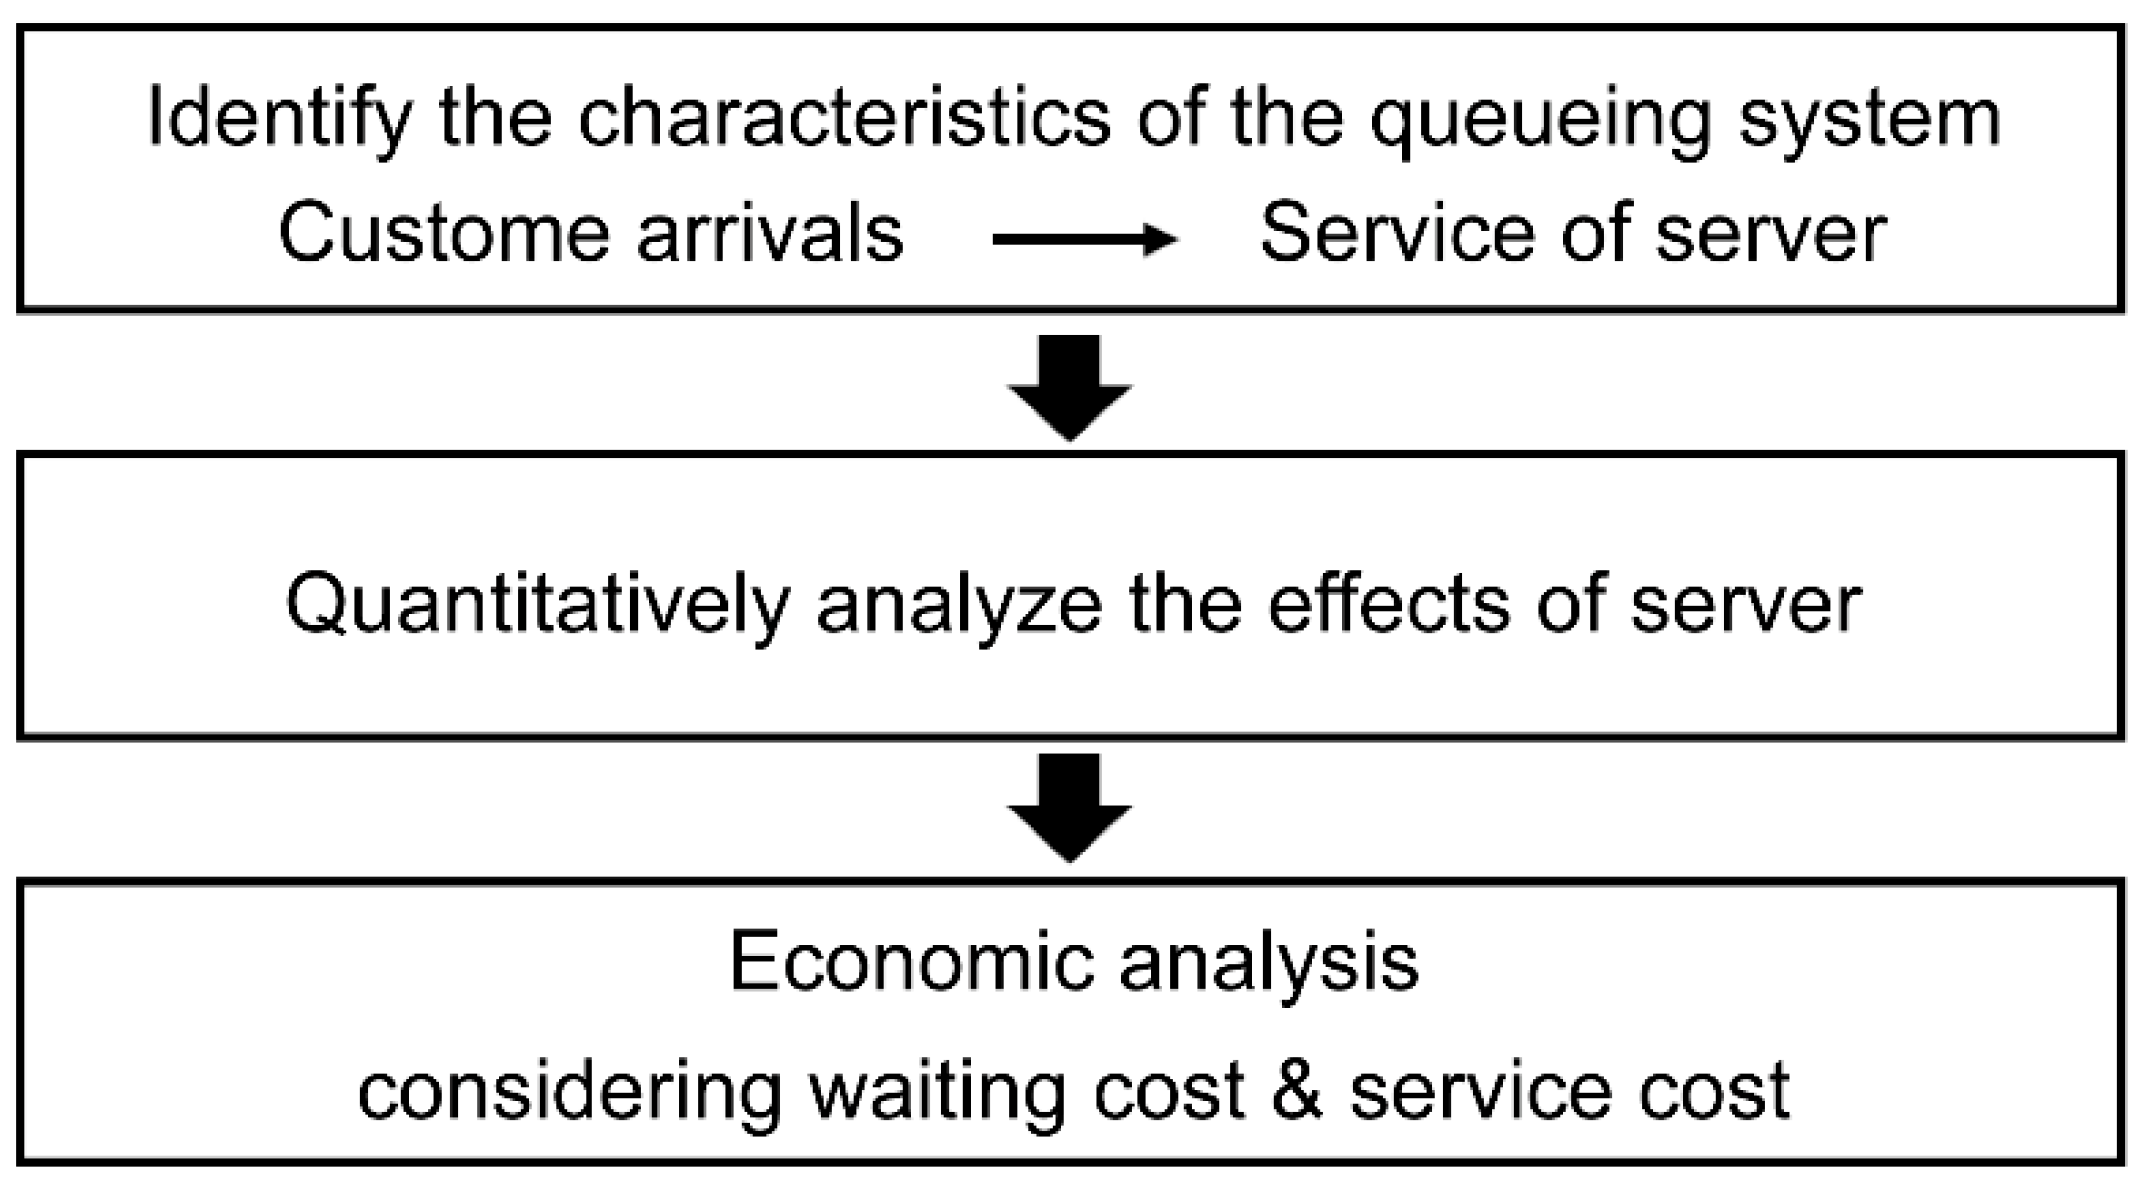
4. Research Method
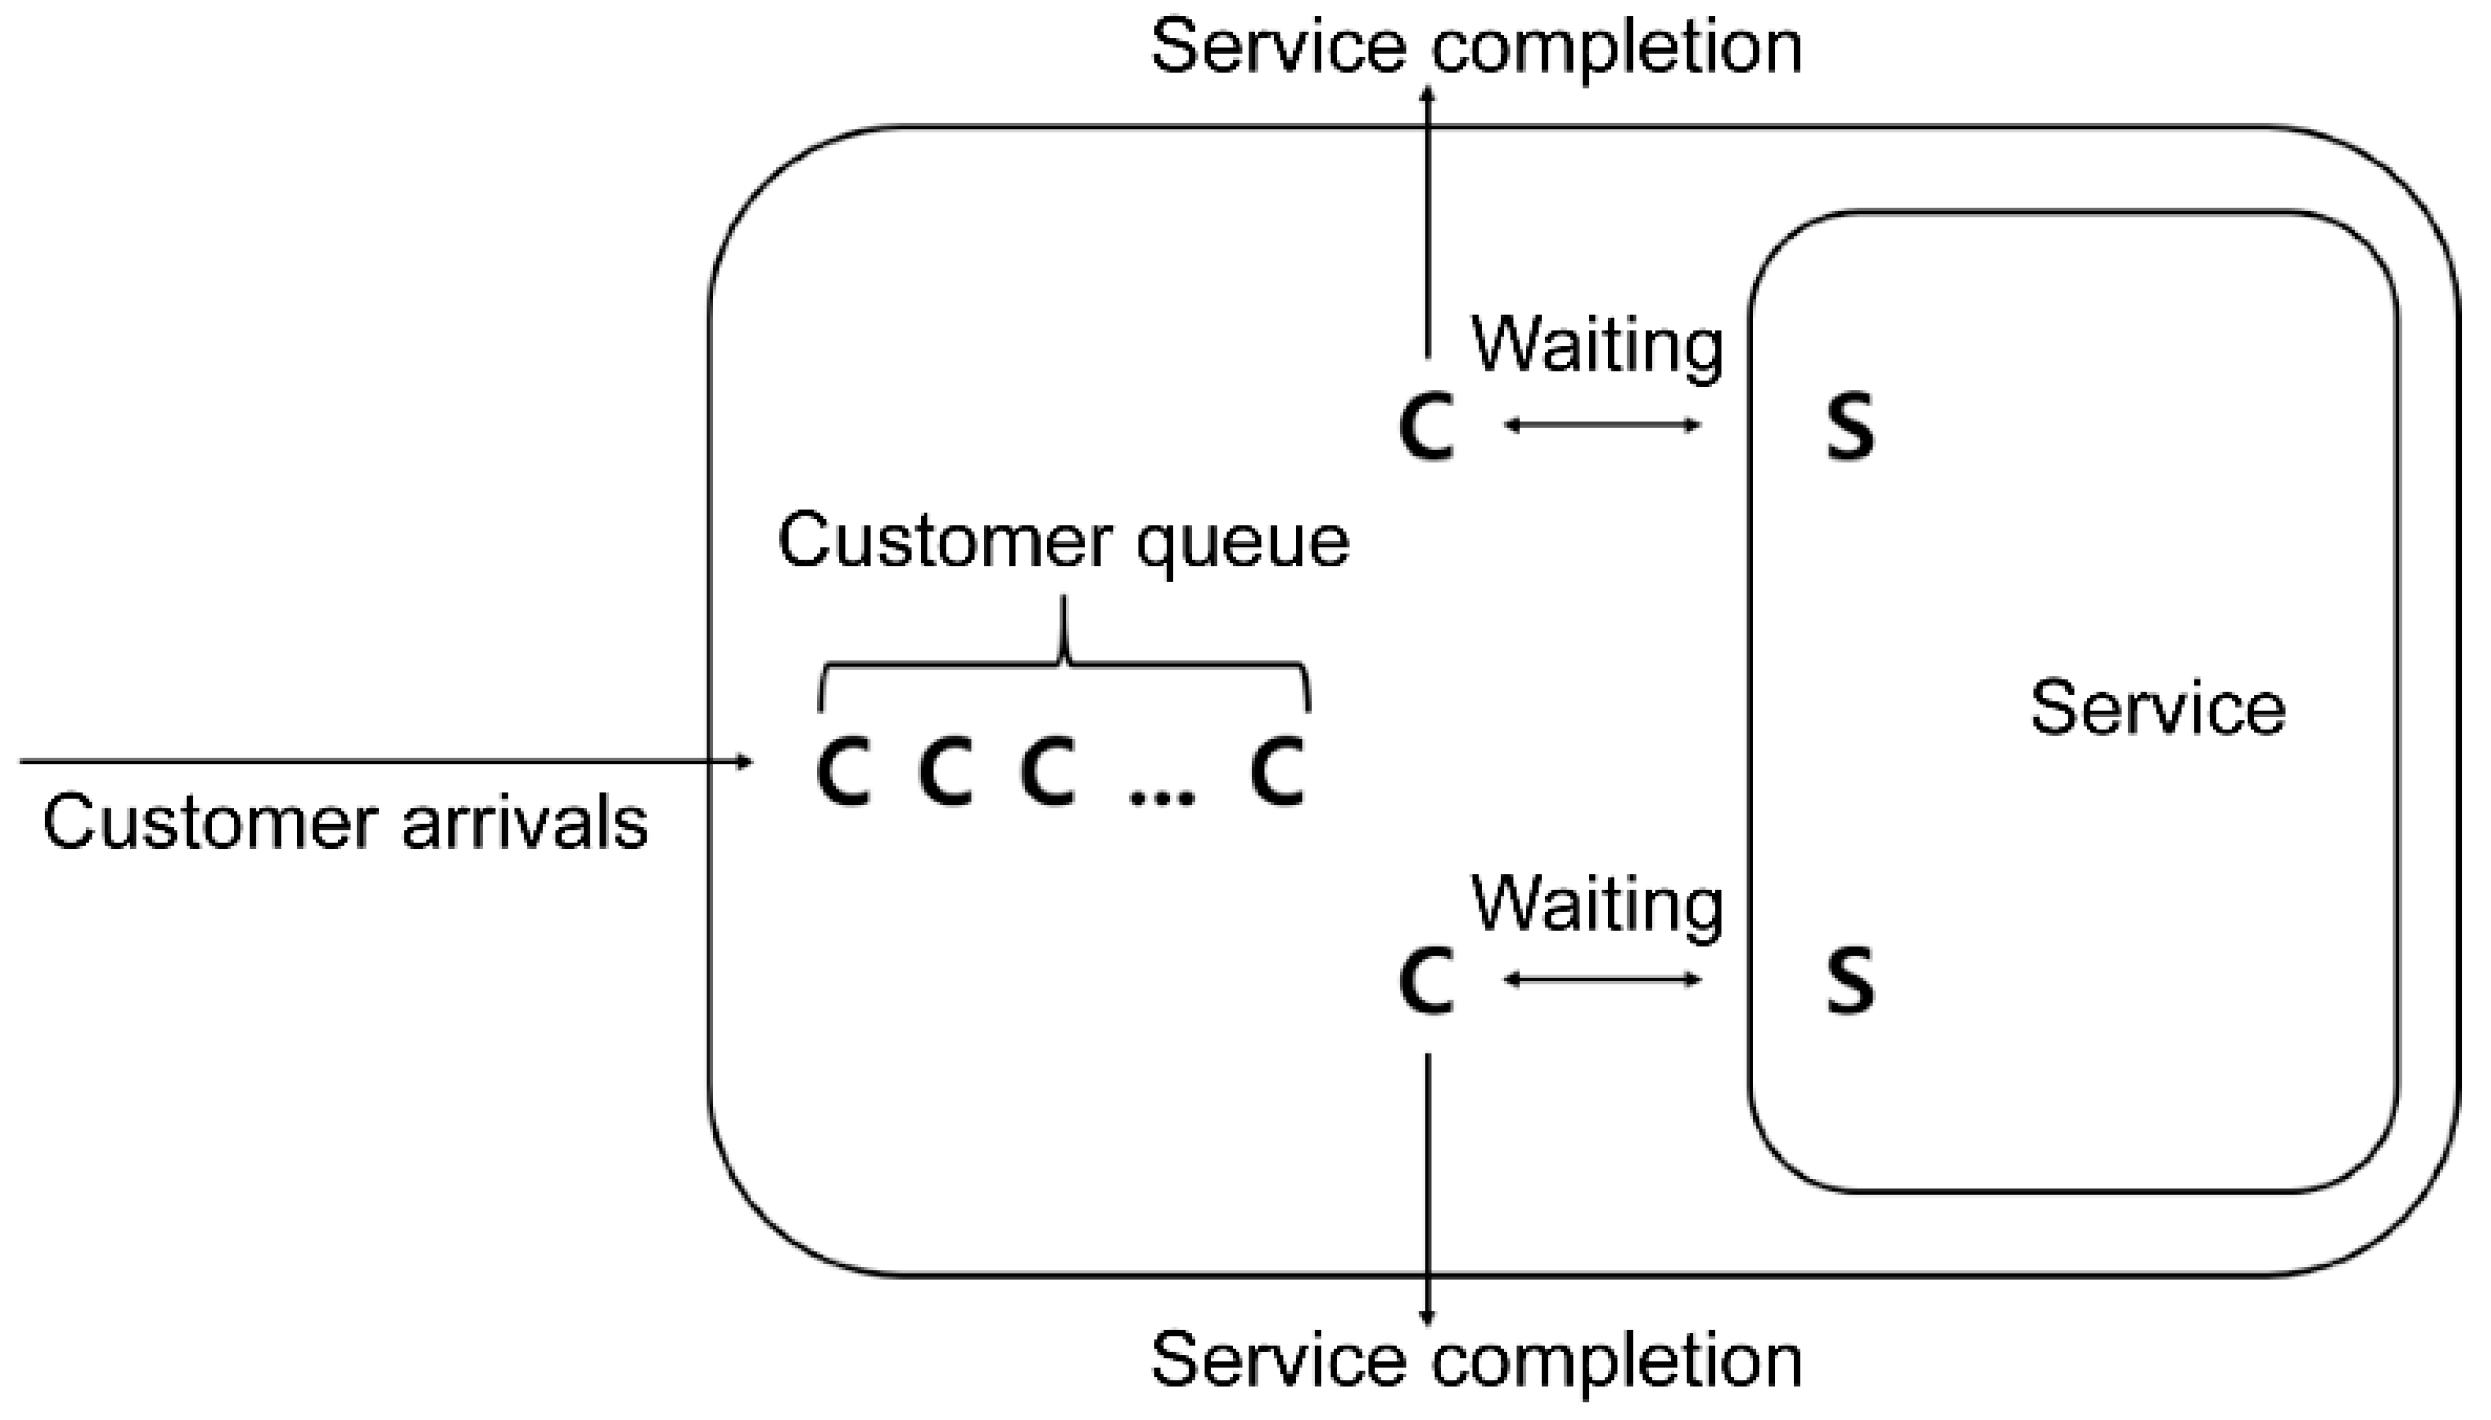
4.1. Characterization of the Queuing System
- The inter-arrival time is evenly and independently distributed based on the probability.
- Every customer arriving at the queueing system waits until the service is completed.
- The number of customers is infinite, considering that there is one infinite queue in the queuing system.
- Customers in the queueing system follow the first-come, first-served rule.
- The queueing system comprises a fixed number of servers, and each server can provide services to all customers.
- One server serves each customer individually.
- The server service time is distributed evenly and independently and follows an exponential or deterministic distribution.
4.2. Quantitative Analysis of the Server
4.2.1. Basic Performance Indicators of the M/M/S Queueing Model
4.2.2. Economic Analysis Based on the Waiting and Service Costs
4.3. Interview Design
- One concrete pouring team component.
- Maximum workable amount per day of one concrete pouring team and its standards (when pouring foundation concrete).
- Input cost per day for one concrete pouring team.
- In case of delay in construction period, additional work cost of pouring team
- Decision-making criteria when determining the number of pouring team.
- Concrete pouring process.
- Reasons and standards for zoning at the construction site.
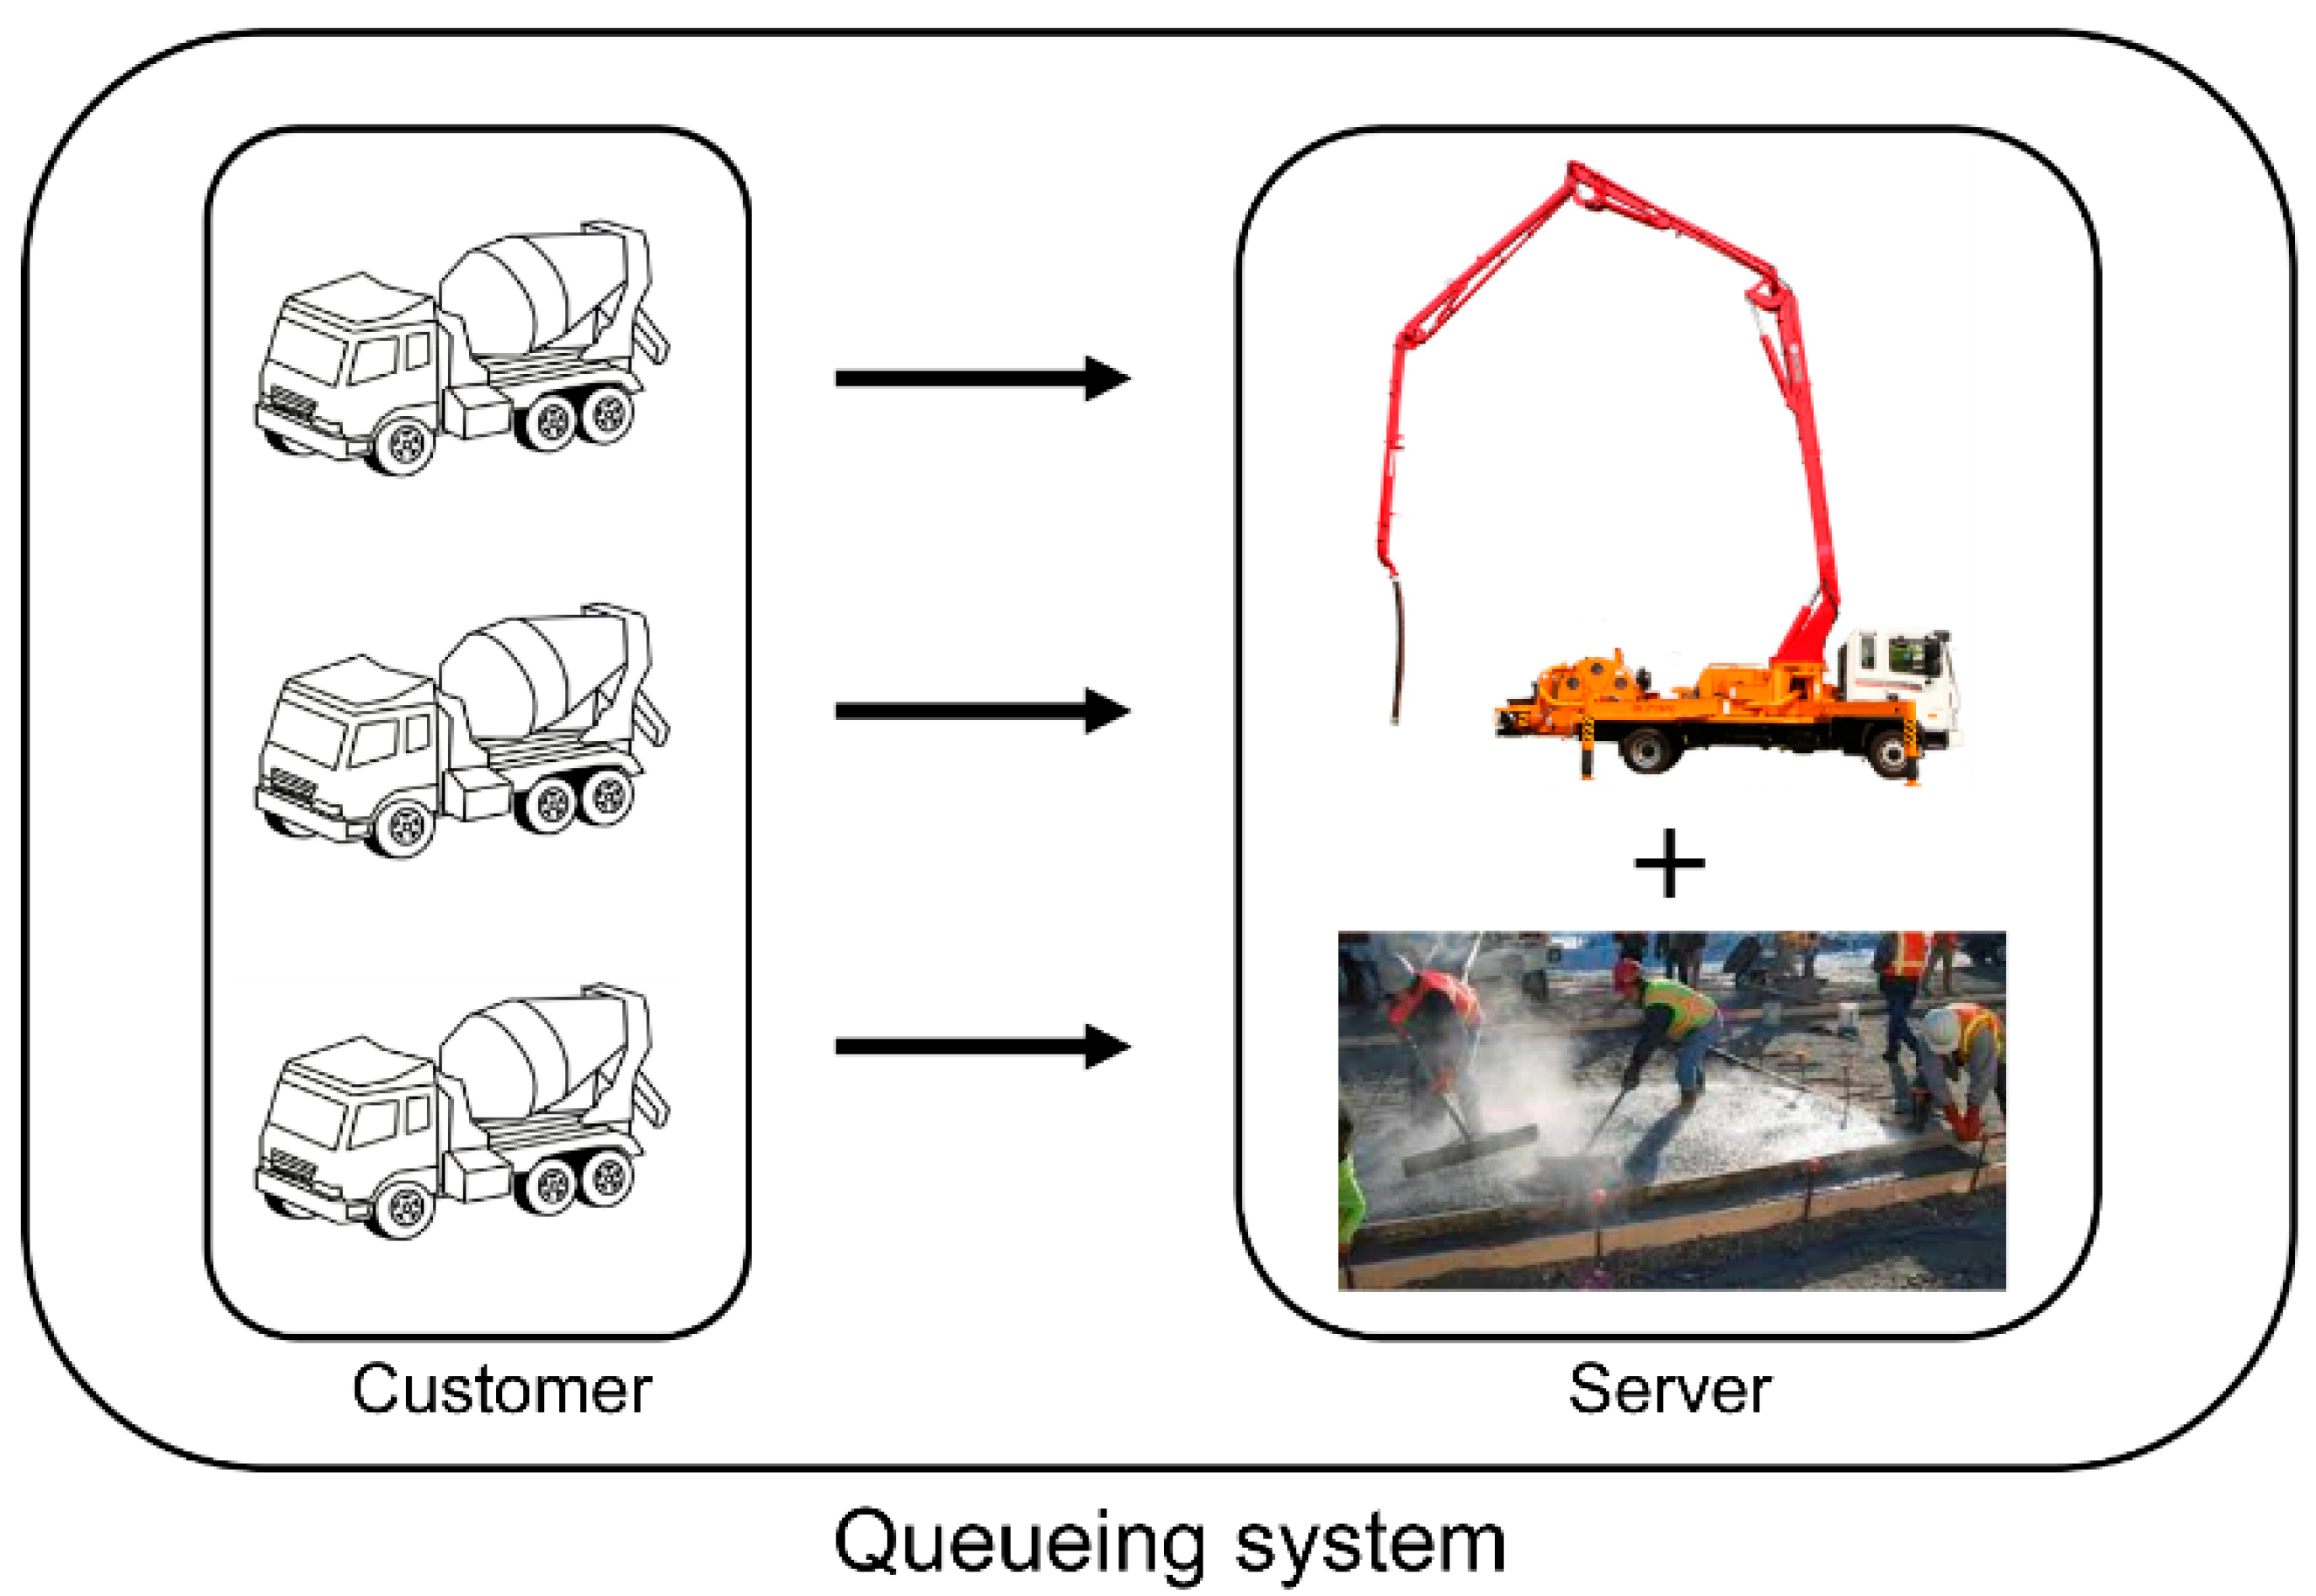
5. Case Study
5.1. Project Description and Data Collection
5.2. Data Analysis
5.2.1. Basic Performance Analysis in the Queueing Model
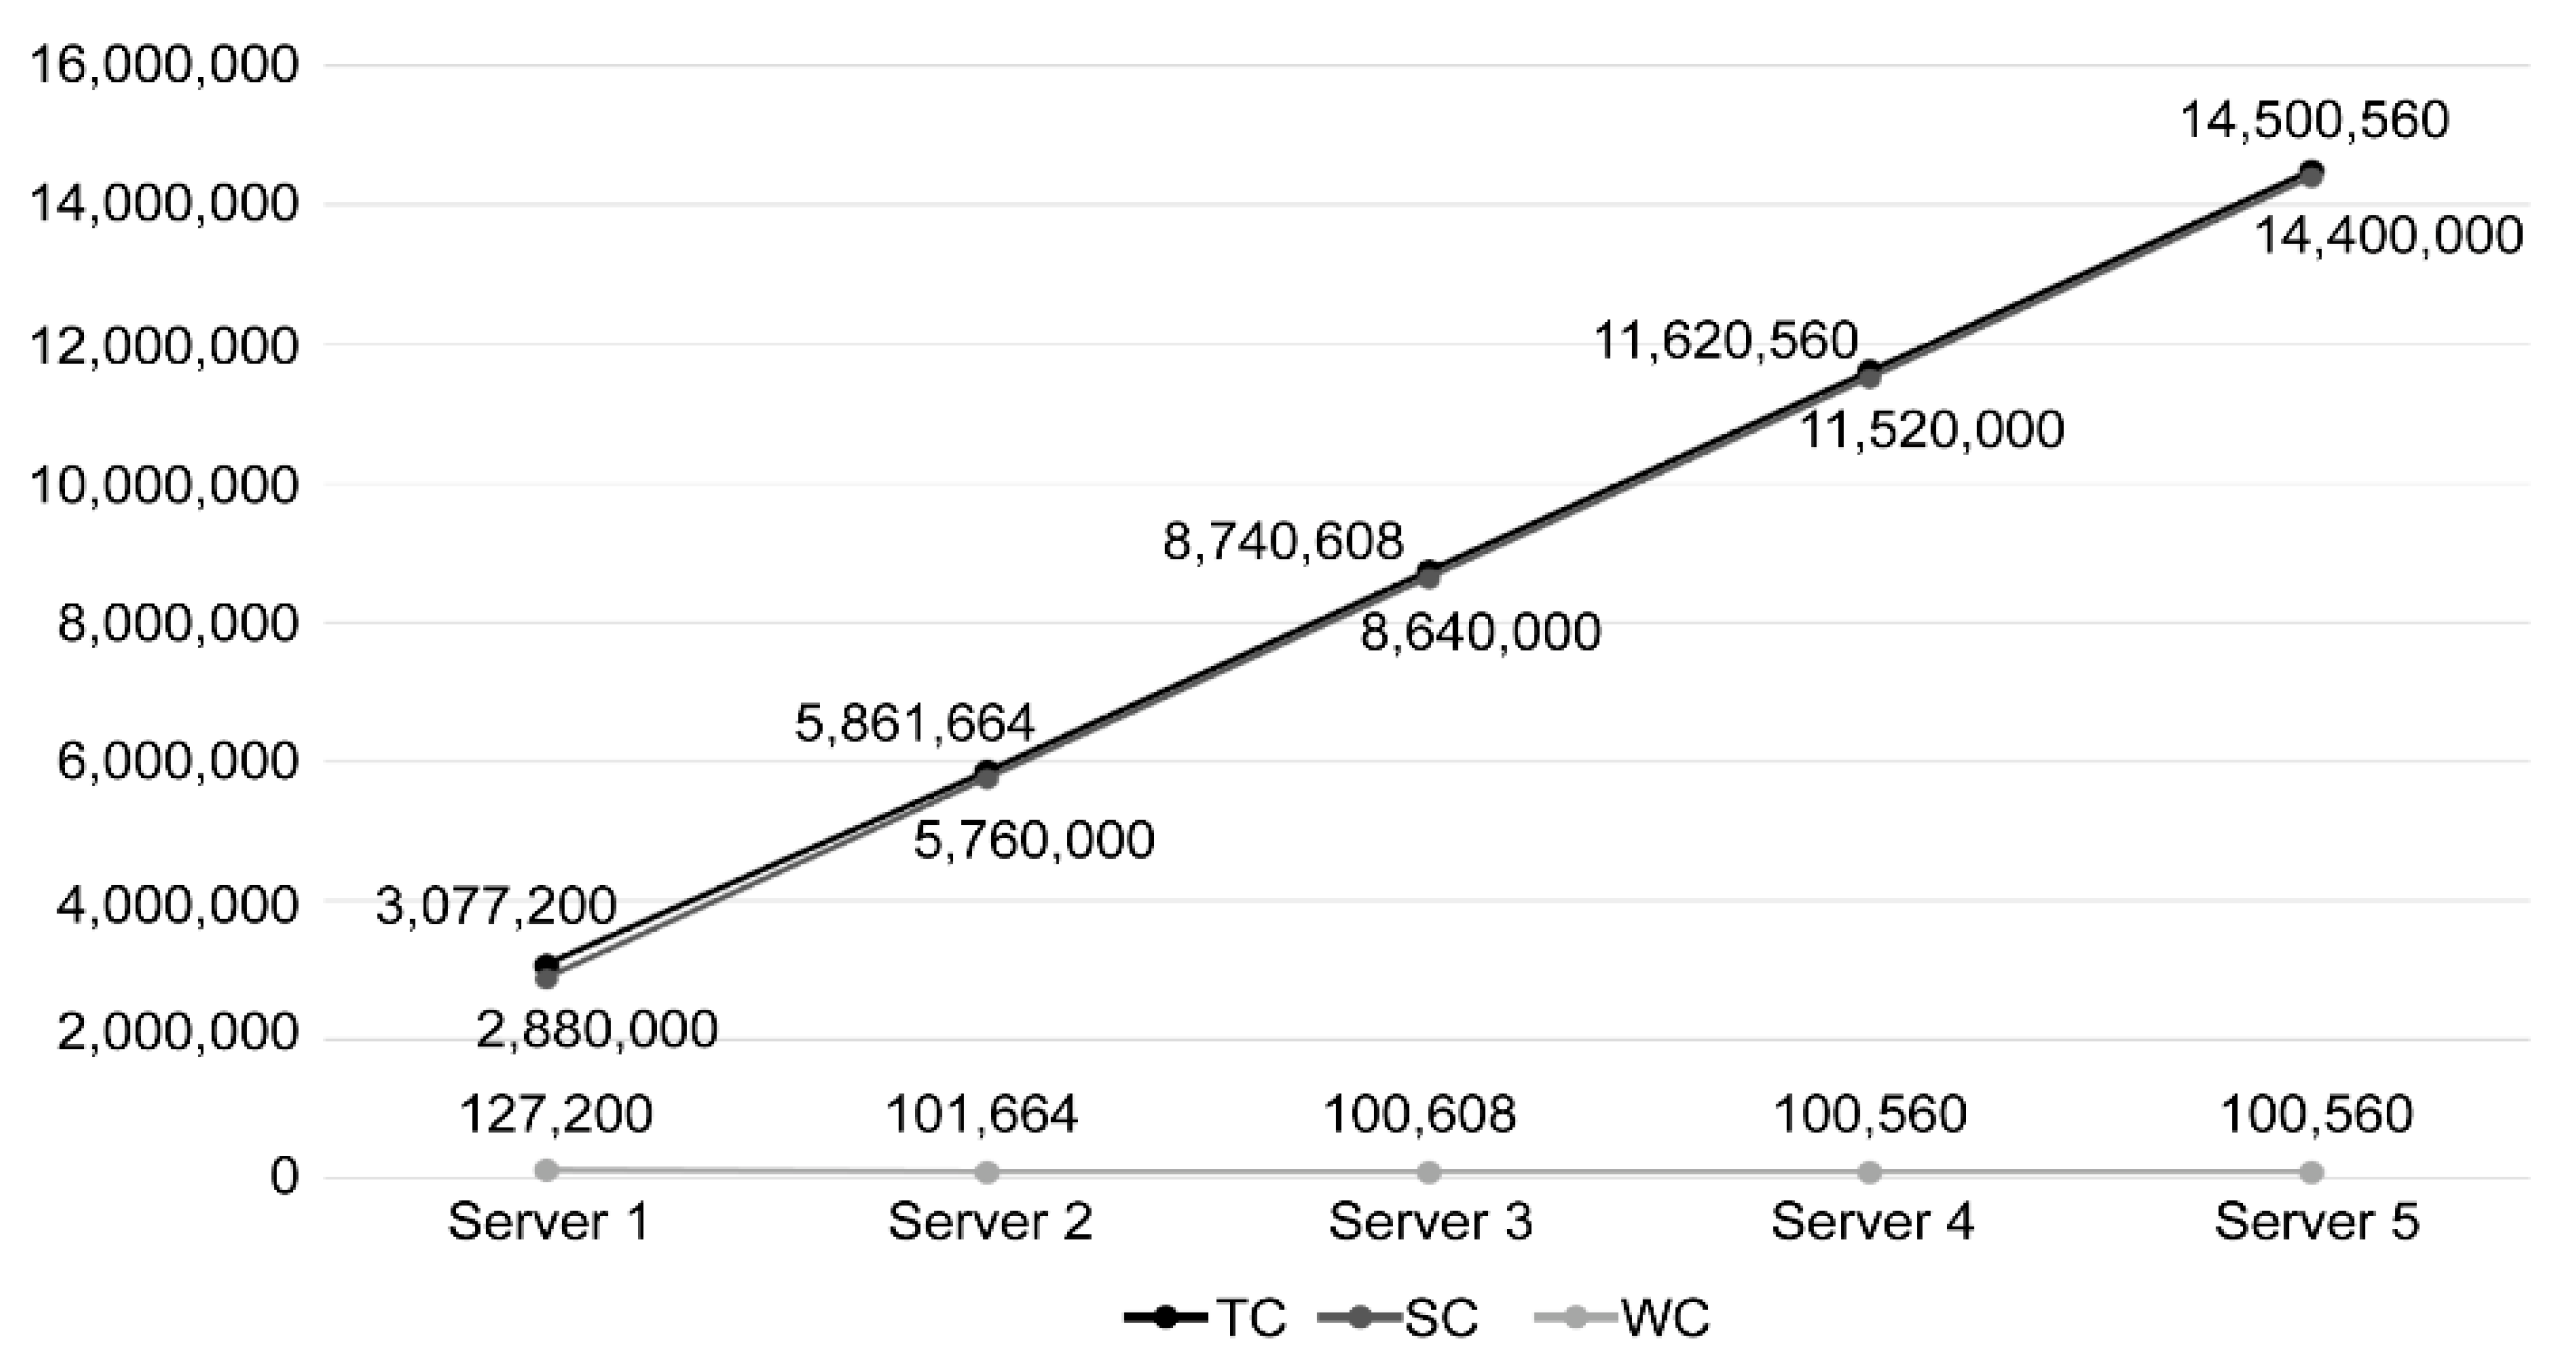
5.2.2. Economic Analysis of the Input Server
6. Discussion
7. Conclusions
Author Contributions
Funding
Institutional Review Board Statement
Informed Consent Statement
Data Availability Statement
Acknowledgments
Conflicts of Interest
References
- Dabirian, S.; Abbaspour, S.; Khanzadi, M.; Ahmadi, M. Dynamic modelling of human resource allocation in construction projects. Int. J. Constr. Manag. 2019, 1–10. [Google Scholar] [CrossRef]
- Hegazy, T. Optimization of resource allocation and leveling using genetic algorithms. J. Constr. Eng. Manag. 1999, 125, 167–175. [Google Scholar] [CrossRef]
- Park, M. Model-based dynamic resource management for construction projects. Autom. Constr. 2005, 14, 585–598. [Google Scholar] [CrossRef]
- Zhong, Y.; Chen, Z.; Zhou, Z.; Hu, H. Uncertainty analysis and resource allocation in construction project management. Eng. Manag. J. 2018, 30, 293–305. [Google Scholar] [CrossRef]
- Anvuur, A.M.; Kumaraswamy, M.M. Effects of teamwork climate on cooperation in crossfunctional temporary multi-organization workgroups. J. Constr. Eng. Manag. 2016, 142, 04015054. [Google Scholar] [CrossRef] [Green Version]
- Jun, D.H.; El-Rayes, K. Multiobjective optimization of resource leveling and allocation during construction scheduling. J. Constr. Eng. Manag. 2011, 137, 1080–1088. [Google Scholar] [CrossRef]
- Lu, H.; Wang, H.; Xie, Y.; Wang, X. Study on construction material allocation policies: A simulation optimization method. Autom. Constr. 2018, 90, 201–212. [Google Scholar] [CrossRef]
- Halligan, D.W.; Demsetz, L.A.; Brown, J.D.; Pace, C.B. Action-response model and loss of productivity in construction. J. Constr. Eng. Manag. 1994, 120, 47–64. [Google Scholar] [CrossRef]
- Asgari, S.; Afshar, A.; Madani, K. Cooperative game theoretic framework for joint resource management in construction. J. Constr. Eng. Manag. 2014, 140, 04013066. [Google Scholar] [CrossRef]
- Kumaraswamy, M.M.; Matthews, J.D. Improved subcontractor selection employing partnering principles. J. Manag. Eng. 2000, 16, 47–57. [Google Scholar] [CrossRef]
- Nobbs, H. Future Role of Construction Specialists; The Business Round Table: London, UK, 1993. [Google Scholar]
- Arditi, D.; Chotibhongs, R. Issues in subcontracting practice. J. Constr. Eng. Manag. 2005, 131, 866–876. [Google Scholar] [CrossRef]
- Lucko, G.; Thompson, R.C., Jr.; Su, Y.; Huynh, H.T. Subcontractor Schedule Performance: Finance-Inspired Schedule Beta Indices; CRC Press: Boca Raton, FL, USA, 2020. [Google Scholar] [CrossRef]
- Stamatiou, D.R.I.; Kirytopoulos, K.A.; Ponis, S.T.; Gayialis, S.; Tatsiopoulos, I. A process reference model for claims management in construction supply chains: The contractors’ perspective. Int. J. Constr. Manag. 2019, 19, 382–400. [Google Scholar] [CrossRef]
- Yang, L.; Lou, J.; Zhao, X. Risk response of complex projects: Risk association network method. J. Manag. Eng. 2021, 37, 05021004. [Google Scholar] [CrossRef]
- Zarei, B.; Sharifi, H.; Chaghouee, Y. Delay causes analysis in complex construction projects: A semantic network analysis approach. Prod. Plan. Control 2018, 29, 29–40. [Google Scholar] [CrossRef]
- Statistical Korea Government Office. Available online: http://www.index.go.kr/potal/main/EachDtlPageDetail.do?idx_cd=1242 (accessed on 19 June 2021).
- Yang, Y.-C.; Park, C.-J.; Kim, J.-H.; Kim, J.-J. Management of daily progress in a construction project of multiple apartment buildings. J. Constr. Eng. Manag. 2007, 133, 242–253. [Google Scholar] [CrossRef] [Green Version]
- Ballesteros-Pérez, P.; Phua, F.T.T.; Mora-Melià, D. Human resource allocation to multiple projects based on members’ expertise, group heterogeneity, and social cohesion. J. Constr. Eng. Manag. 2019, 145, 04018134. [Google Scholar] [CrossRef] [Green Version]
- Theerathon, T. Multiple Project Resource Scheduling for Construction. Ph.D. Dissertation, The University of Michigan, Ann Arbor, MI, USA, 2004. Available online: https://www.proquest.com/dissertations-theses/multiple-project-resource-scheduling-construction/docview/305180827/se-2?accountid=11283 (accessed on 30 June 2021).
- Koulinas, G.K.; Anagnostopoulos, K.P. Construction resource allocation and leveling using a threshold accepting-based hyperheuristic algorithm. J. Constr. Eng. Manag. 2011, 138, 854–863. [Google Scholar] [CrossRef]
- Brandenburg, S.G.; Haas, C.T.; Byrom, K. Strategic management of human resources in construction. J. Manag. Eng. 2006, 22, 89–96. [Google Scholar] [CrossRef] [Green Version]
- Lin, K.-L. Human resource allocation for remote construction projects. J. Manag. Eng. 2011, 27, 13–20. [Google Scholar] [CrossRef]
- Cho, T.-J.; Choi, J.-S. Case studies: Schedule delay factors and delay prevention program for concrete frame works in apartment construction project. Build. Constr. Manag. 2011, 11, 9–17. [Google Scholar] [CrossRef]
- Kim, J.-W.; Ham, N.; Kim, J.-J. Quantitative analysis of waiting length and waiting time for frame construction work activities using a queue model: Focusing on Korean apartment construction. Sustainability 2021, 13, 3778. [Google Scholar] [CrossRef]
- Seo, S.J.; Baik, H.S. A Field Study on the Spacial Changing Uses of Service Facilities in Multi-Family Housing. J. Archit. Plann. Res. 2004, 20, 219–230. Available online: http://www.dbpia.co.kr/journal/articleDetail?nodeId=NODE00569887 (accessed on 6 July 2021).
- Zavadskas, E.K.; Turskis, Z.; Antuchevicienė, J. Selecting a contractor by using a novel method for multiple attribute analysis: Weighted aggregated sum product assessment with grey values (WASPAS-G). Stud. Inform. Control 2015, 24, 141–150. [Google Scholar] [CrossRef] [Green Version]
- Afshar, M.R.; Shahhosseini, V.; Sebt, M.H. Optimal sub-contractor selection and allocation in a multiple construction project: Project portfolio planning in practice. J. Oper. Res. Soc. 2020, 1–14. [Google Scholar] [CrossRef]
- Hinze, J.; Tracey, A. The contractor-subcontractor relationship: The subcontractor’s view. J. Constr. Eng. Manag. 1994, 120, 274–287. [Google Scholar] [CrossRef]
- Monghasemi, S.; Nikoo, M.R.; Fasaee, M.A.K.; Adamowski, J. A novel multi criteria decision making model for optimizing time–cost–quality trade-off problems in construction projects. Expert Syst. Appl. 2015, 42, 3089–3104. [Google Scholar] [CrossRef]
- Erdogan, S.A.; Šaparauskas, J.; Turskis, Z. Decision making in construction management: AHP and expert choice approach. Procedia Eng. 2017, 172, 270–276. [Google Scholar] [CrossRef]
- Biruk, S.; Jaśkowski, P.; Czarnigowska, A. Minimizing project cost by integrating subcontractor selection decisions with scheduling. IOP Conf. Ser. Mater. Sci. Eng. 2017, 245, 072007. [Google Scholar] [CrossRef]
- Kandil, A.; El-Rayes, K. Parallel genetic algorithms for optimizing resource utilization in large-scale construction projects. J. Constr. Eng. Manag. 2006, 132, 491–498. [Google Scholar] [CrossRef]
- McTague, B.; Jergeas, G. Productivity Improvements on Alberta Major Construction Projects, Construction Productivity Improvement Report/Project Evaluation Tool; Alberta Economic Development: Calgary, AB, Canada, 2002. [Google Scholar]
- Halpin, D.W. CYCLONE—Method for Modeling Job Site Processes. J. Constr. Div. 1977, 103, 489–499. Available online: https://trid.trb.org/view/59949 (accessed on 17 July 2021). [CrossRef]
- Halpin, D.W.; Riggs, L.S. Planning and Analysis of Construction Operations; John Wiley & Sons: New York, NY, USA, 1992. [Google Scholar]
- Liu, L.Y. COOPS: Construction Object-Oriented Simulation System. Dissertation/Thesis ProQuest Dissertations Publishing. 1991. Available online: https://search.lib.umich.edu/articles/record/FETCH-proquest_journals_3039818553 (accessed on 17 July 2021).
- Martinez, J.C. Stroboscope: State and Resource Based Simulation of Construction Processes. Dissertation/Thesis ProQuest Dissertations Publishing. 1996. Available online: https://search.lib.umich.edu/articles/record/FETCH-proquest_journals_3042474933 (accessed on 18 July 2021).
- Chang, D.M. RESQUE: A Resource Based Simulation System for Construction Process Planning. Network, Allocation. Dissertation/Thesis, ProQuest Dissertations Publishing. 1986. Available online: https://search.lib.umich.edu/articles/record/FETCHproquest_journals_3034315783 (accessed on 18 July 2021).
- Hawng, D.; Kwon, O.; Choi, Y. Lifting work process optimization method in high-rise building construction through improvement of CYCLONE modeling method. KJCEM Korean J. Constr. Eng. Manag. 2017, 18, 58–70. [Google Scholar] [CrossRef] [Green Version]
- Dozzi, S.; AbouRizk, S. Productivity in Construction; National Research Council: Ottawa, ON, Canada, 1993; Available online: http://web.mit.edu/parmstr/Public/NRCan/nrcc37001.pdf (accessed on 20 July 2021).
- Bernolak, I. Effective measurement and successful elements of company productivity: The basis of competitiveness and world prosperity. Int. J. Prod. Econ. 1997, 52, 203–213. [Google Scholar] [CrossRef]
- Hajo, A.; Van der Aalst, W. The effectiveness of workflow management systems: Predictions and lessons learned. Int. J. Inf. Manag. 2005, 25, 458–472. [Google Scholar] [CrossRef]
- Lawrence, P. Workflow Handbook; John Wiley & Sons: New York, NY, USA, 1997. [Google Scholar]
- Zhuge, H.; Cheung, T.; Pung, H. A timed workflow process model. J. Syst. Softw. 2001, 55, 231–243. [Google Scholar] [CrossRef] [Green Version]
- Chang, D.; Son, J.H.; Kim, M.H. Critical path identification in the context of a workflow. Inf. Softw. Technol. 2002, 44, 405–417. [Google Scholar] [CrossRef]
- Li, H.; Yang, Y. Dynamic checking of temporal constraints for concurrent workflows. Electron. Commer. Res. Appl. 2005, 4, 124–142. [Google Scholar] [CrossRef]
- Son, J.H.; Sun Kim, J.; Ho Kim, M. Extracting the workflow critical path from the extended well-formed workflow schema. J. Comput. Syst. Sci. 2005, 70, 86–106. [Google Scholar] [CrossRef] [Green Version]
- Jeong, K.; Cho, H.; Don, T. Integration of queueing network and IDEF3 for business process analysis. Bus. Process Manag. J. 2008, 14, 471–482. [Google Scholar] [CrossRef] [Green Version]
- Truong, N.K.V.; Choi, Y.; Kim, I.; Shin, S.; Hwang, W.J. A probabilistic approach to workflow time analysis for business process management. World Acad. Sci. Eng. Technol. 2009, 53, 797–801. [Google Scholar]
- Hillier, F.S.; Hillier, M.S. Introduction to Management Science: A Modeling and Case Studies Approach with Spreadsheets; McGraw-Hill Education: New York, NY, USA, 2010. [Google Scholar]
- Ham, N.; Moon, S.; Kim, J.-H.; Kim, J.-J. Optimal BIM staffing in construction projects using queueing model. Autom. Constr. 2020, 113, 103123. [Google Scholar] [CrossRef]
- Bhattacharjee, P.; Ray, P.K. Patient flow modelling and performance analysis of healthcare delivery processes in hospitals: A review and reflections. Comput. Ind. Eng. 2014, 78, 299–312. [Google Scholar] [CrossRef]
- Gillard, J.; Knight, V. Using singular spectrum analysis to obtain staffing level requirements in emergency units. J. Oper. Res. Soc. 2014, 65, 735–746. [Google Scholar] [CrossRef] [Green Version]
- Schwarz, J.A.; Selinka, G.; Stolletz, R. Performance analysis of time-dependent queueing systems: Survey and classification. Omega 2016, 63, 170–189. [Google Scholar] [CrossRef] [Green Version]
- Kolesar, P.J.; Rider, K.L.; Crabill, T.B.; Walker, W.E. A queuing-linear programming approach to scheduling police patrol cars. Oper. Res. 1975, 23, 1045–1062. [Google Scholar] [CrossRef] [Green Version]
- Ingolfsson, A.; Amanul Haque, M.; Umnikov, A. Accounting for time-varying queueing effects in workforce scheduling. Eur. J. Oper. Res. 2002, 139, 585–597. [Google Scholar] [CrossRef]
- Bookbinder, J.; Martell, D. Time-dependent queueing approach to helicopter allocation for forest fire initial-attack *. Inform. Rev. 1979, 17, 58–70. [Google Scholar] [CrossRef]
- Koopman, B.O. Air-terminal queues under time-dependent conditions. Oper. Res. 1972, 20, 1089–1114. [Google Scholar] [CrossRef]
- Bookbinder, J. Multiple queues of aircraft under time-dependent conditions. Inform. Rev. 1986, 24, 280–288. [Google Scholar] [CrossRef]
- Jung, W. Recoverable inventory systems with time-varying demand. Prod. Inventory Manag. J. 1993, 34, 77. [Google Scholar]
- Chakroborty, P.; Gill, R.; Chakraborty, P. Analysing queueing at toll plazas using a coupled, multiple-queue, queueing system model: Application to toll plaza design. Transp. Plan. Technol. 2016, 39, 675–692. [Google Scholar] [CrossRef]
- Zhang, M.; Ji, S.; Zhou, K. Modelling and application on the extension scale of port based on queueing theory. In Proceedings of the 2010 Ninth International Symposium on Distributed Computing and Applications to Business, Engineering and Science, Hong Kong, China, 10–12 August 2010; pp. 663–666. [Google Scholar] [CrossRef]
- Teknomo, K. Queuing rule of thumb based on M/M/s queuing theory with applications in construction management, civil engineering dimension. Civ. Eng. 2012, 14, 139–146, (Special Edition). [Google Scholar] [CrossRef] [Green Version]
- Kim, H.; Yoo, M.; Kim, J.; Choi, C. Performance analysis of BIM labor using case analysis. J. KIBIM 2017, 7, 31–39. [Google Scholar] [CrossRef]
- Hillier, F.S.; Liebernman, G.J. Introduction to Operation Research; McGraw-Hill Education: Seoul, Korea, 2013. [Google Scholar]
- Little, J.D.C. A proof of the queuing formula: L = λW. Oper. Res. 1961, 9, 383–387. [Google Scholar] [CrossRef]
- Burgess, A.R.; Killebrew, J.B. Variation in activity level on a cyclical arrow diagram. J. Ind. Eng. 1962, 13, 76–83. [Google Scholar]


| Zone | Date | Workload (m3) | |
|---|---|---|---|
| 1 | 28 March 2018 | 456 |  |
| 2 | 3 April 2018 | 336 | |
| 3 | 15 April 2018 | 1747 | |
| 4 | 17 April 2018 | 492 | |
| 5 | 21 April 2018 | 2010 | |
| 6 | 27 April 2018 | 1704 | |
| 7 | 28 April 2018 | 1134 | |
| 8 | 5 May 2018 | 2076 | |
| 9 | 9 May 2018 | 696 | |
| 10 + 11 | 14 May 2018 | 2290 | |
| 12 | 23 May 2018 | 1692 | |
| 13 + 14 + 15 | 29 May 2018 | 2265 | |
| 16 + 17 | 31 May 2018 | 1392 | |
| 18 | 12 June 2018 | 792 | |
| 19 | 14 June 2018 | 384 | |
| 20 | 16 June 2018 | 1296 | |
| 21 + 22 | 19 June 2018 | 756 | |
| 23 | 20 June 2018 | 222 | |
| 24 | 12 July 2018 | 552 | |
| 25 | 18 July 2018 | 478 | |
| 26 | 31 July 2018 | 201 | |
| 27 | 17 October 2018 | 558 | |
| 28 | 27 October 2018 | 322 | |
| 29 | 2 November 2018 | 450 | |
| Category | Description |
|---|---|
| Land area | 54,979 m2 |
| Total households | 1210 units |
| Size | 12 apartment buildings having 2 basement floors and 36 floors above ground, as well as neighborhood living facilities |
| Resources per server team | Pump car, vibrator, 6 workers (including equipment operators) |
| Foundation concrete pouring areas |  |
| Total pouring volume | 24,301 m3 |
| Completion date | 31 October 2018 |
| Zone | Server | λ | μ | ρ | 1 − ρ |
|---|---|---|---|---|---|
| 1 | 2 | 57.00 | 120.00 | 0.2375 | 0.7625 |
| 2 | 2 | 42.00 | 120.00 | 0.175 | 0.825 |
| 3 | 2 | 218.38 | 120.00 | 0.909896 | 0.090104 |
| 4 | 2 | 61.50 | 120.00 | 0.25625 | 0.74375 |
| 5 | 2 | 251.25 | 120.00 | 1.046875 | −0.04688 |
| 6 | 2 | 213.00 | 120.00 | 0.8875 | 0.1125 |
| 7 | 2 | 141.75 | 120.00 | 0.590625 | 0.409375 |
| 8 | 2 | 259.50 | 120.00 | 1.08125 | −0.08125 |
| 9 | 2 | 87.00 | 120.00 | 0.3625 | 0.6375 |
| 10 + 11 | 2 | 286.25 | 120.00 | 1.192708 | −0.19271 |
| 12 | 2 | 211.50 | 120.00 | 0.88125 | 0.11875 |
| 13 + 14 + 15 | 2 | 283.13 | 120.00 | 1.179688 | −0.17969 |
| 16 + 17 | 2 | 174.00 | 120.00 | 0.725 | 0.275 |
| 18 | 2 | 99.00 | 120.00 | 0.4125 | 0.5875 |
| 19 | 2 | 48.00 | 120.00 | 0.2 | 0.8 |
| 20 | 2 | 162.00 | 120.00 | 0.675 | 0.325 |
| 21 + 22 | 2 | 94.50 | 120.00 | 0.39375 | 0.60625 |
| 23 | 2 | 27.75 | 120.00 | 0.115625 | 0.884375 |
| 24 | 2 | 69.00 | 120.00 | 0.2875 | 0.7125 |
| 25 | 2 | 59.75 | 120.00 | 0.248958 | 0.751042 |
| 26 | 2 | 25.13 | 120.00 | 0.104688 | 0.895313 |
| 27 | 2 | 69.75 | 120.00 | 0.290625 | 0.709375 |
| 28 | 2 | 40.25 | 120.00 | 0.167708 | 0.832292 |
| 29 | 2 | 56.25 | 120.00 | 0.234375 | 0.765625 |
| Zone | Server | L | Lq | W | Wq |
|---|---|---|---|---|---|
| 1 | 2 | 0.5033 | 0.0283 | 0.0529 | 0.0029 |
| 2 | 2 | 0.361 | 0.011 | 0.0515 | 0.0015 |
| 3 | 2 | 10.5875 | 8.7675 | 0.2908 | 0.2408 |
| 4 | 2 | 0.5485 | 0.036 | 0.0535 | 0.0035 |
| 5 | 2 | N/A | N/A | N/A | N/A |
| 6 | 2 | 8.359 | 6.584 | 0.2354 | 0.1854 |
| 7 | 2 | 1.8148 | 0.6335 | 0.0765 | 0.0268 |
| 8 | 2 | N/A | N/A | N/A | N/A |
| 9 | 2 | 0.8346 | 0.1096 | 0.0575 | 0.0075 |
| 10 + 11 | 2 | N/A | N/A | N/A | N/A |
| 12 | 2 | 7.8894 | 6.1269 | 0.2238 | 0.1738 |
| 13 +14 + 15 | 2 | N/A | N/A | N/A | N/A |
| 16 + 17 | 2 | 3.0566 | 1.6066 | 0.1054 | 0.0554 |
| 18 | 2 | 0.9941 | 0.1691 | 0.0602 | 0.0102 |
| 19 | 2 | 0.4166 | 0.0166 | 0.052 | 0.002 |
| 20 | 2 | 2.4799 | 1.1299 | 0.0918 | 0.0418 |
| 21 + 22 | 2 | 0.9319 | 0.1444 | 0.0591 | 0.0091 |
| 23 | 2 | 0.2346 | 0.0031 | 0.0506 | 0.0006 |
| 24 | 2 | 0.6268 | 0.0518 | 0.0545 | 0.0045 |
| 25 | 2 | 0.5309 | 0.0329 | 0.0533 | 0.0033 |
| 26 | 2 | 0.2118 | 0.0023 | 0.0505 | 0.0005 |
| 27 | 2 | 0.6351 | 0.0536 | 0.0546 | 0.0046 |
| 28 | 2 | 0.3452 | 0.0097 | 0.0514 | 0.0014 |
| 29 | 2 | 0.4962 | 0.0272 | 0.0529 | 0.0029 |
| Zone | Server 1 | Server 2 | Server 3 | ||||||
|---|---|---|---|---|---|---|---|---|---|
| SC, a | WC, b | TC, a + b | SC, c | WC, d | TC, c + d | SC, e | WC, f | TC, e + f | |
| 1 | 2,880,000 | 434,256 | 3,314,256 | 5,760,000 | 241,584 | 6,001,584 | 8,640,000 | 229,152 | 8,869,152 |
| 2 | 2,880,000 | 258,432 | 3,138,432 | 5,760,000 | 173,280 | 5,933,280 | 8,640,000 | 168,336 | 8,808,336 |
| 4 | 2,880,000 | 504,576 | 3,384,576 | 5,760,000 | 263,280 | 6,023,280 | 8,640,000 | 247,584 | 8,887,584 |
| 9 | 2,880,000 | 1,265,424 | 4,145,424 | 5,760,000 | 400,608 | 6,160,608 | 8,640,000 | 354,144 | 8,994,144 |
| 18 | 2,880,000 | 2,262,816 | 5,142,816 | 5,760,000 | 477,168 | 6,237,168 | 8,640,000 | 406,224 | 9,046,224 |
| 19 | 2,880,000 | 319,968 | 3,199,968 | 5,760,000 | 199,968 | 5,959,968 | 8,640,000 | 192,576 | 8,832,576 |
| 21 + 22 | 2,880,000 | 1,778,784 | 4,658,784 | 5,760,000 | 447,312 | 6,207,312 | 8,640,000 | 386,496 | 9,026,496 |
| 23 | 2,880,000 | 144,576 | 3,024,576 | 5,760,000 | 112,608 | 5,872,608 | 8,640,000 | 111,168 | 8,751,168 |
| 24 | 2,880,000 | 649,392 | 3,529,392 | 5,760,000 | 300,864 | 6,060,864 | 8,640,000 | 278,496 | 8,918,496 |
| 25 | 2,880,000 | 476,160 | 3,356,160 | 5,760,000 | 254,832 | 6,014,832 | 8,640,000 | 240,432 | 8,880,432 |
| 26 | 2,880,000 | 127,200 | 3,007,200 | 5,760,000 | 101,664 | 5,861,664 | 8,640,000 | 100,608 | 8,740,608 |
| 27 | 2,880,000 | 666,912 | 3,546,912 | 5,760,000 | 304,848 | 6,064,848 | 8,640,000 | 281,712 | 8,921,712 |
| 28 | 2,880,000 | 242,304 | 3,122,304 | 5,760,000 | 165,696 | 5,925,696 | 8,640,000 | 161,328 | 8,801,328 |
| 29 | 2,880,000 | 423,936 | 3,303,936 | 5,760,000 | 238,176 | 5,998,176 | 8,640,000 | 226,224 | 8,866,224 |
| Zone | Server 2 | Server 3 | Server 4 | ||||||
|---|---|---|---|---|---|---|---|---|---|
| SC, a | WC, b | TC, a + b | SC, c | WC, d | TC, c + d | SC, e | WC, f | TC, e + f | |
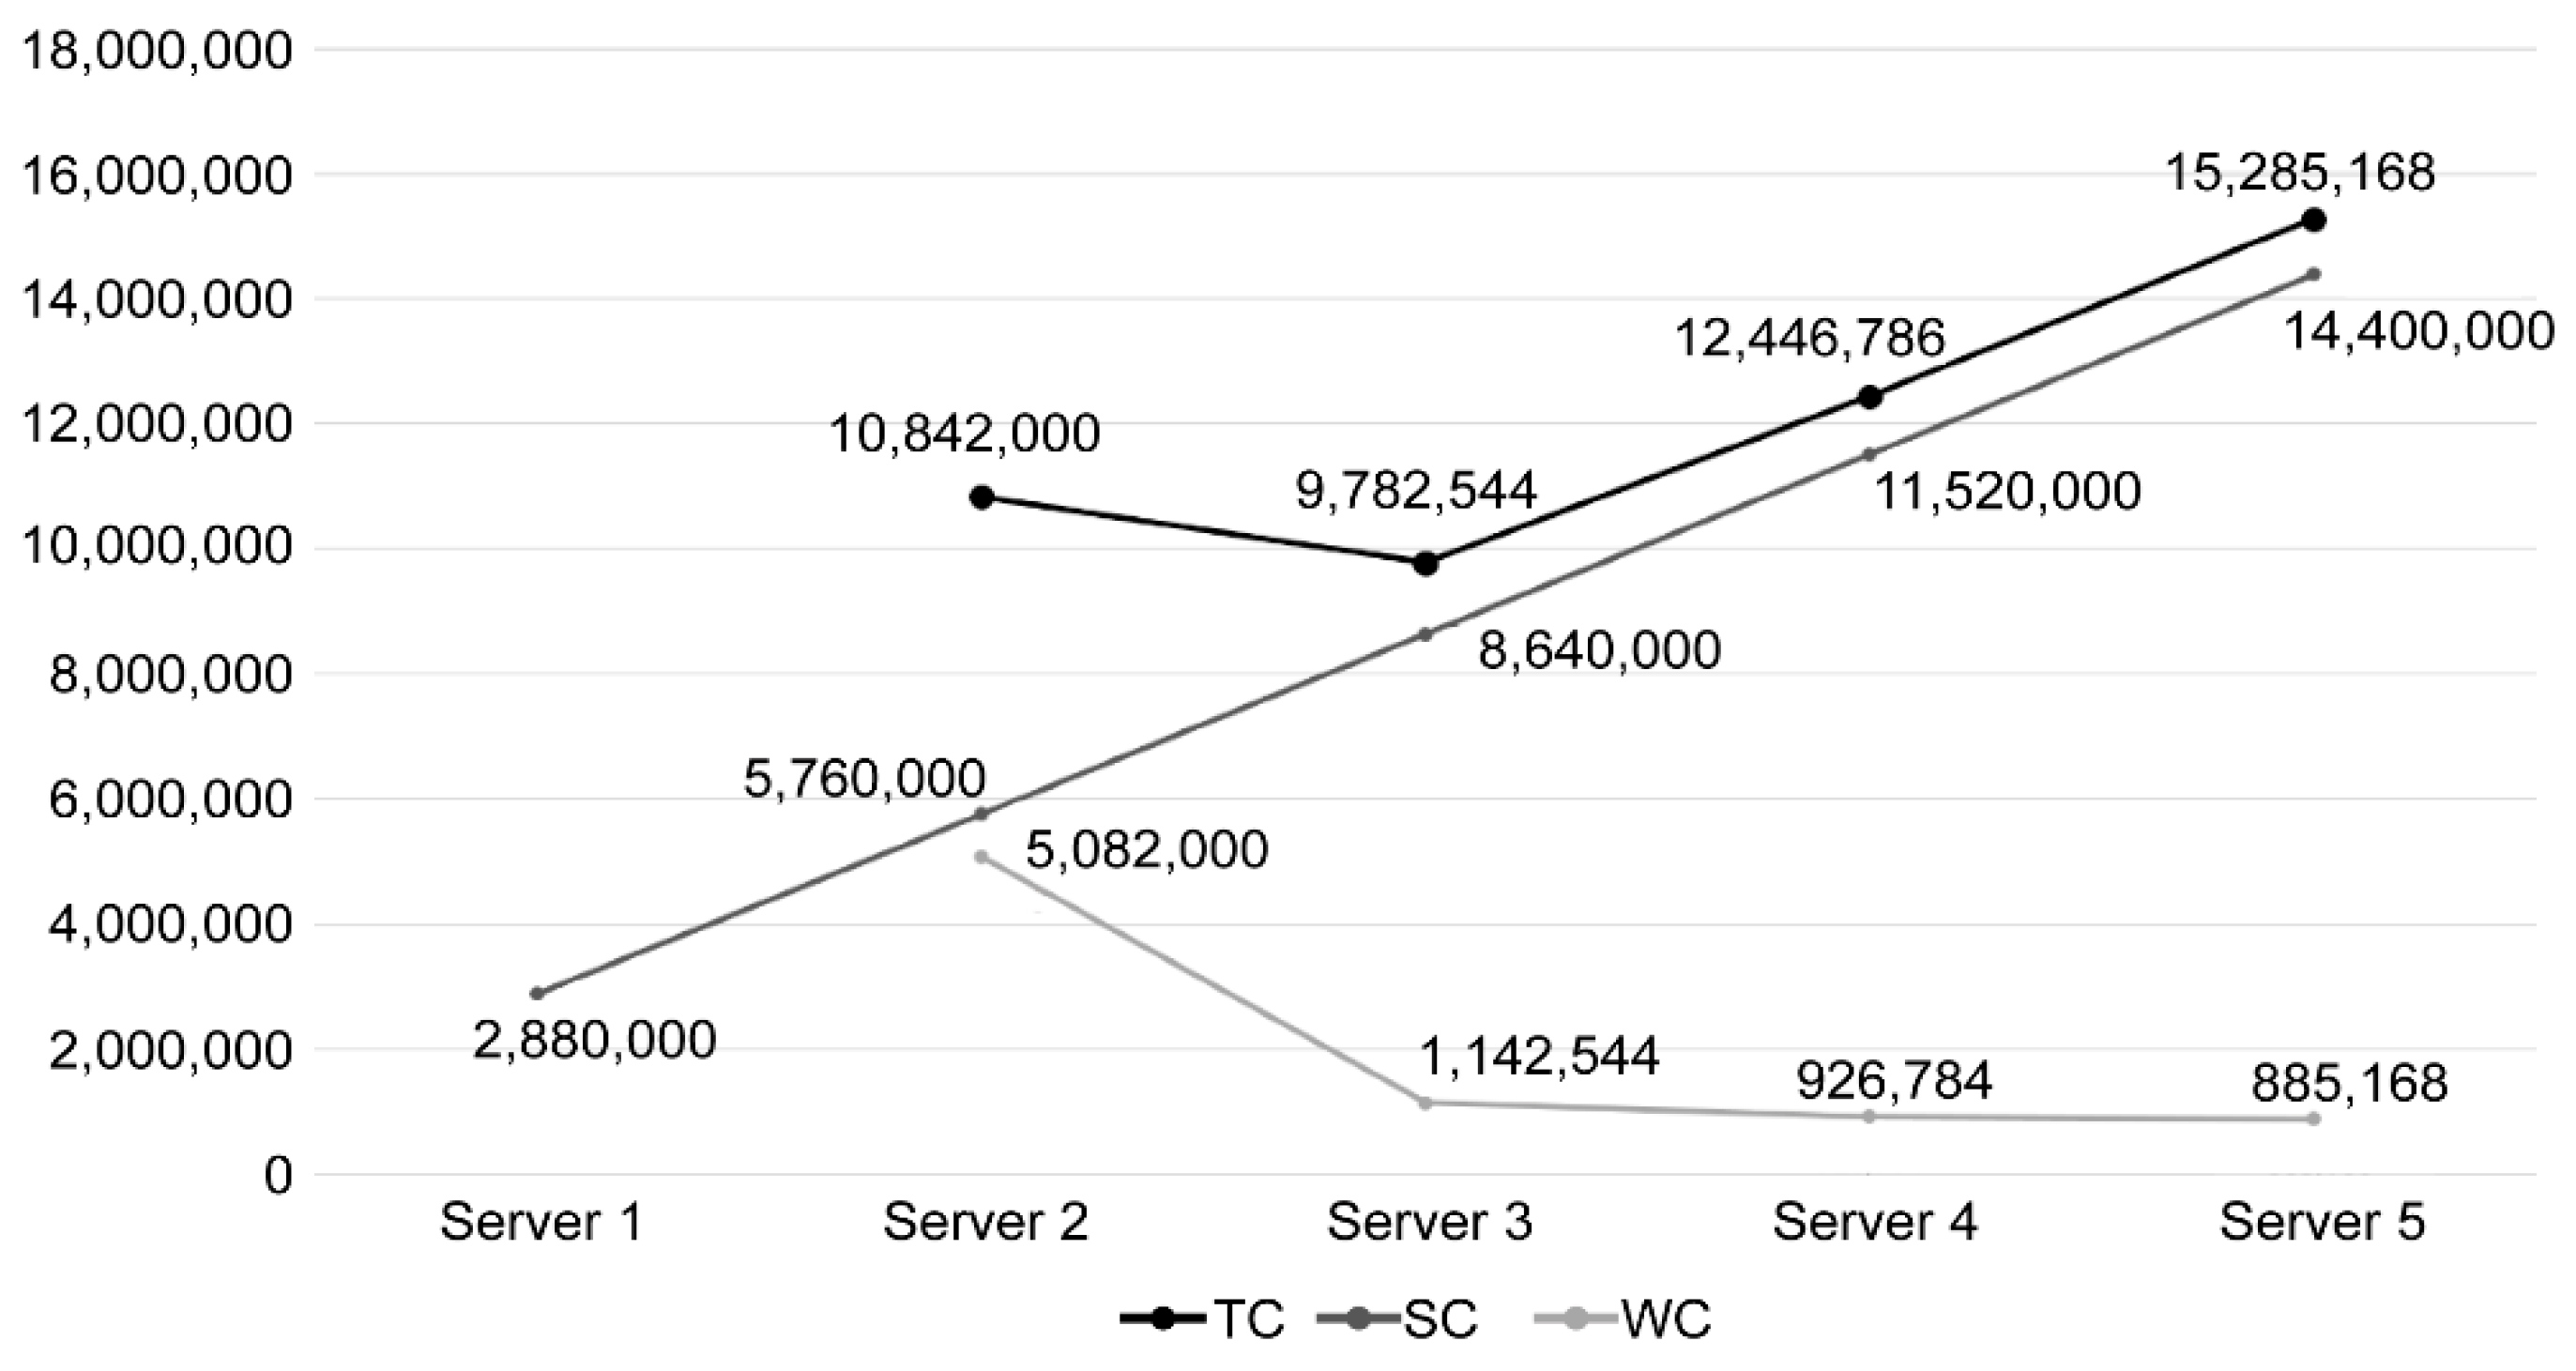
| 3 | 5,760,000 | 5,082,000 | 10,842,000 | 8,640,000 | 1,142,544 | 9,782,544 | 11,520,000 | 926,784 | 12,446,784 |
| 6 | 5,760,000 | 4,012,320 | 9,772,320 | 8,640,000 | 1,091,328 | 9,731,328 | 11,520,000 | 899,232 | 12,419,232 |
| 7 | 5,760,000 | 871,104 | 6,631,104 | 8,640,000 | 609,504 | 9,249,504 | 11,520,000 | 574,176 | 12,094,176 |
| 12 | 5,760,000 | 3,786,912 | 9,546,912 | 8,640,000 | 1,077,648 | 9,717,648 | 11,520,000 | 891,696 | 12,411,696 |
| 16 + 17 | 5,760,000 | 1,467,168 | 7,227,168 | 8,640,000 | 794,448 | 9,434,448 | 11,520,000 | 714,336 | 12,234,336 |
| 20 | 5,760,000 | 1,190,352 | 6,950,352 | 8,640,000 | 721,056 | 9,361,056 | 11,520,000 | 661,152 | 12,181,152 |
| Zone | Server 3 | Server 4 | Server 5 | ||||||
|---|---|---|---|---|---|---|---|---|---|
| SC, a | WC, b | TC, a + b | SC, c | WC, d | TC, c + d | SC, e | WC, f | TC, e + f | |
| 5 | 8,640,000 | 1,548,048 | 10,188,048 | 11,520,000 | 1,109,424 | 12,629,424 | 14,400,000 | 1,029,456 | 15,429,456 |
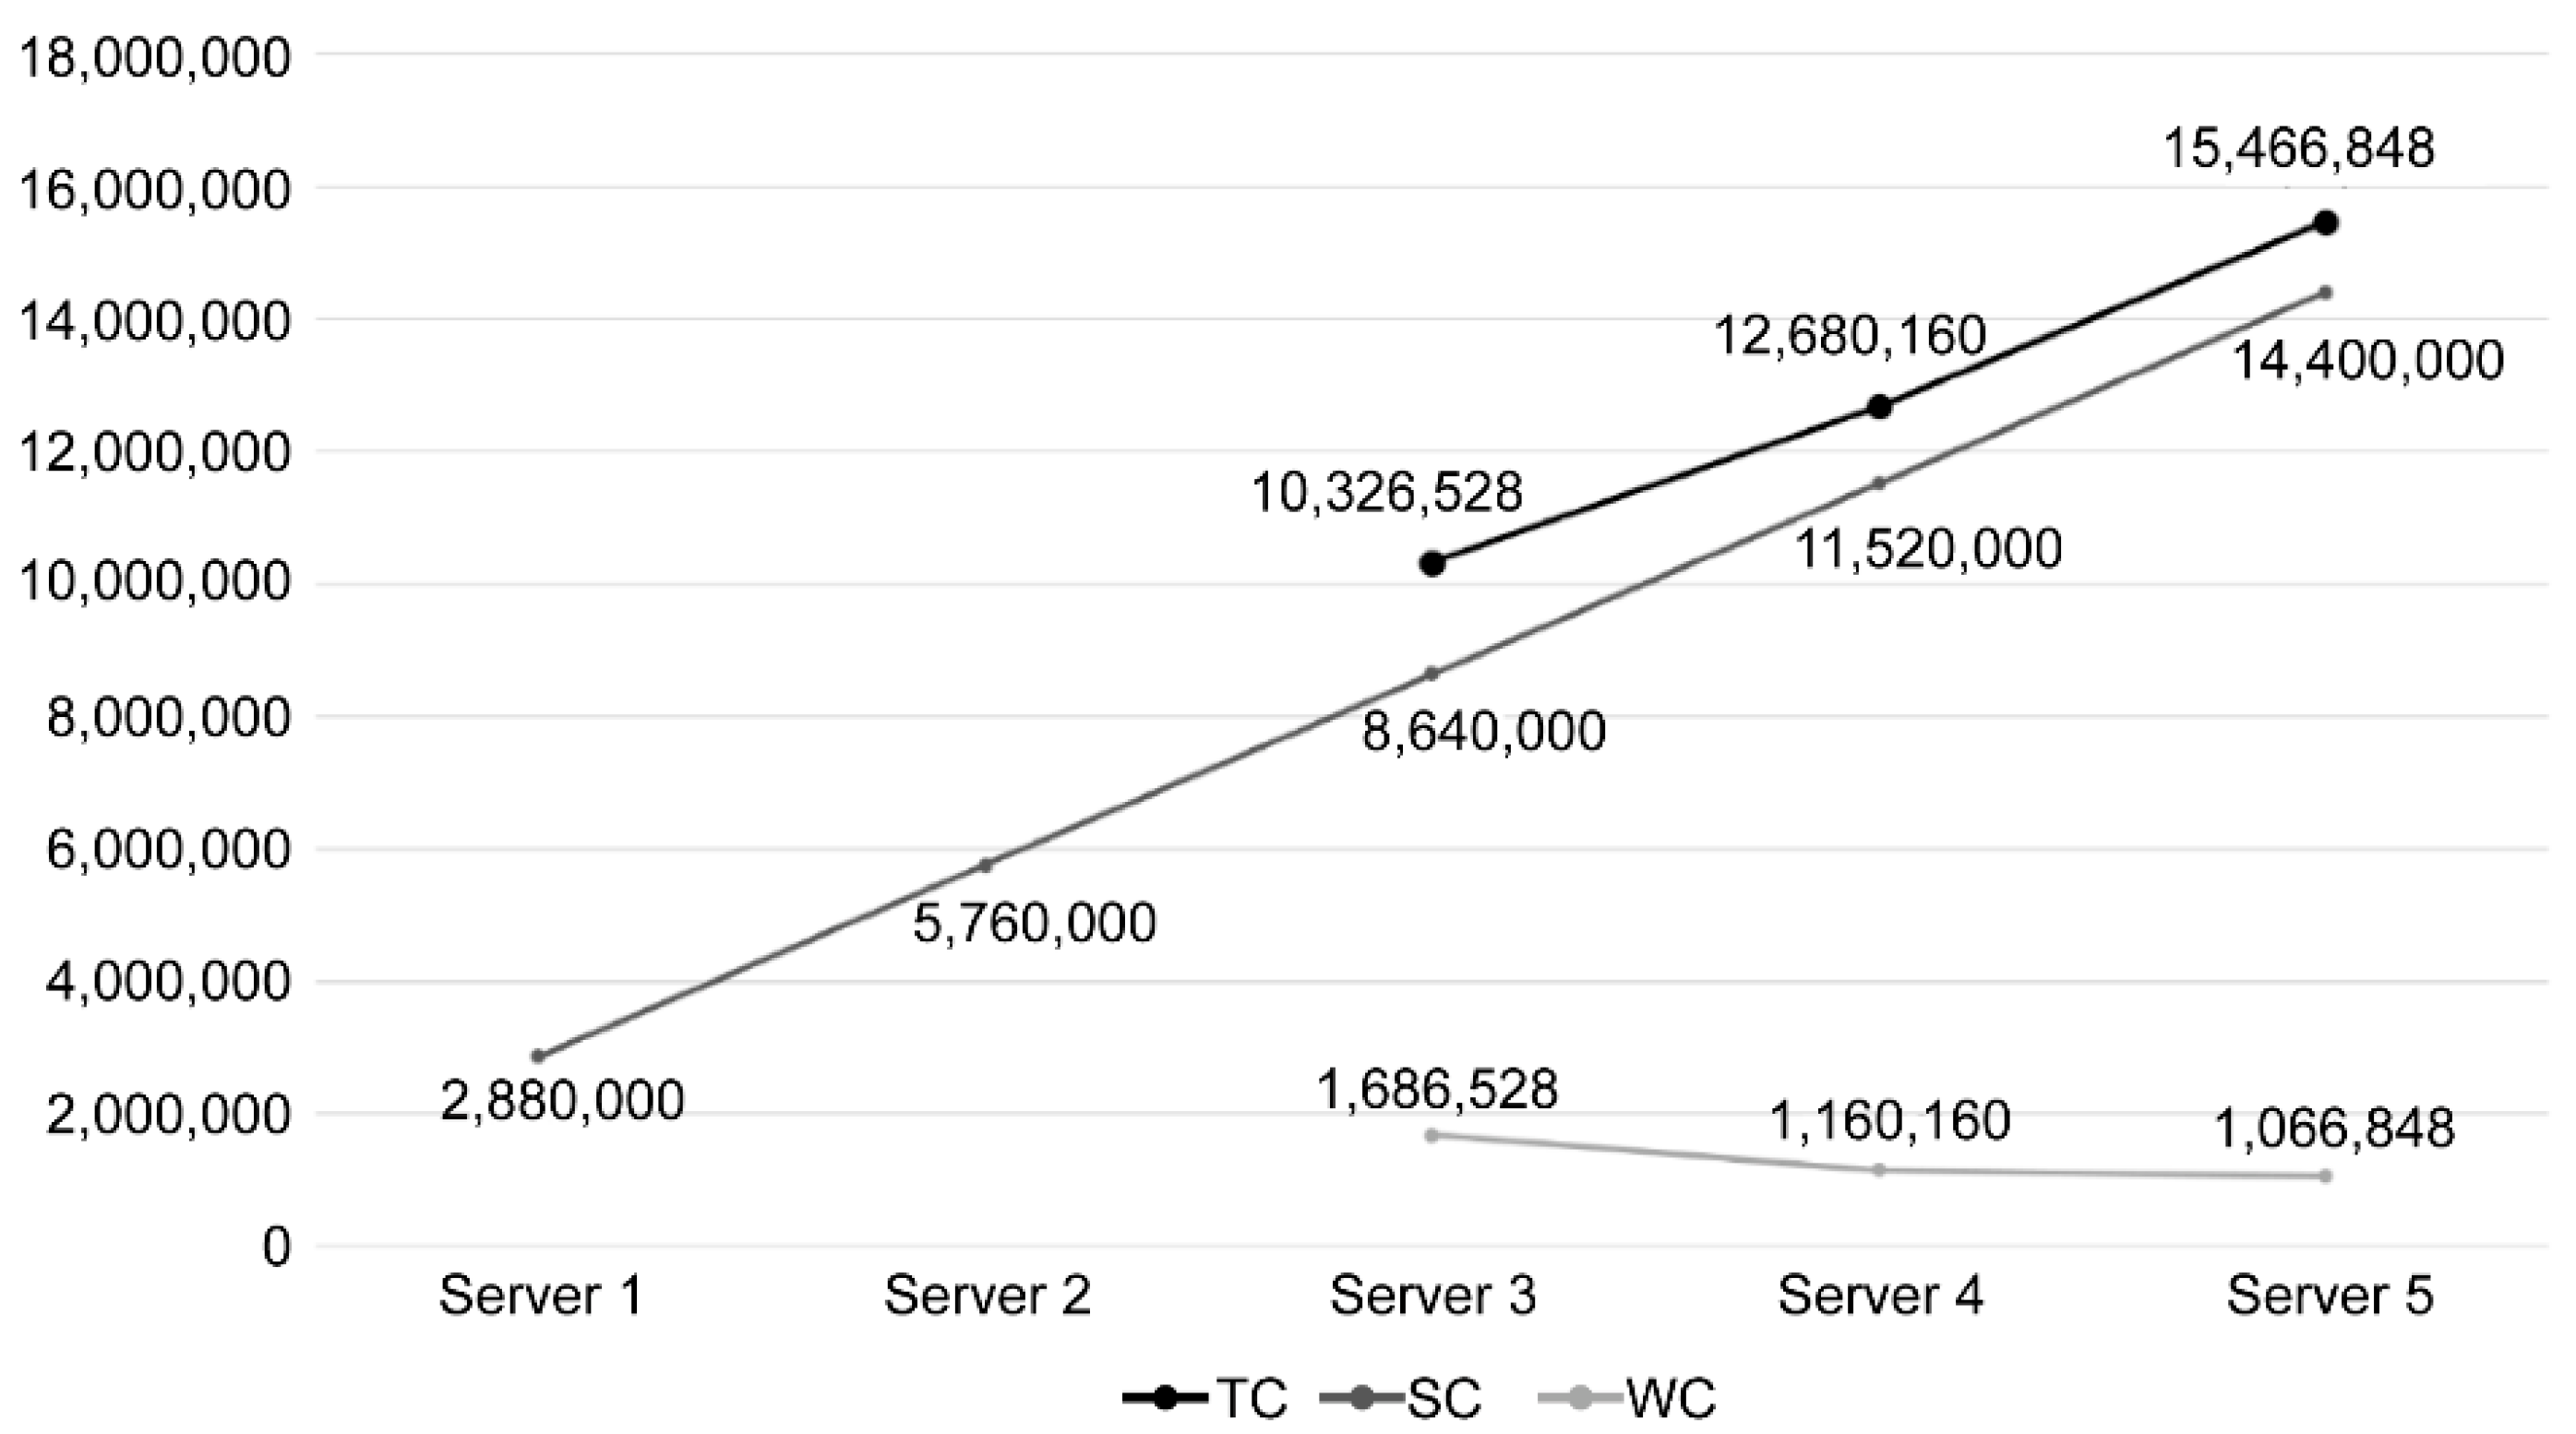
| 8 | 8,640,000 | 1,686,528 | 10,326,528 | 11,520,000 | 1,160,160 | 12,680,160 | 14,400,000 | 1,066,848 | 15,466,848 |
| 10 + 11 | 8,640,000 | 2,336,352 | 10,976,352 | 11,520,000 | 1,345,344 | 12,865,344 | 14,400,000 | 1,193,712 | 15,593,712 |
| 13 + 14 + 15 | 8,640,000 | 2,238,336 | 10,878,336 | 11,520,000 | 1,321,872 | 12,841,872 | 14,400,000 | 1,178,448 | 15,578,448 |
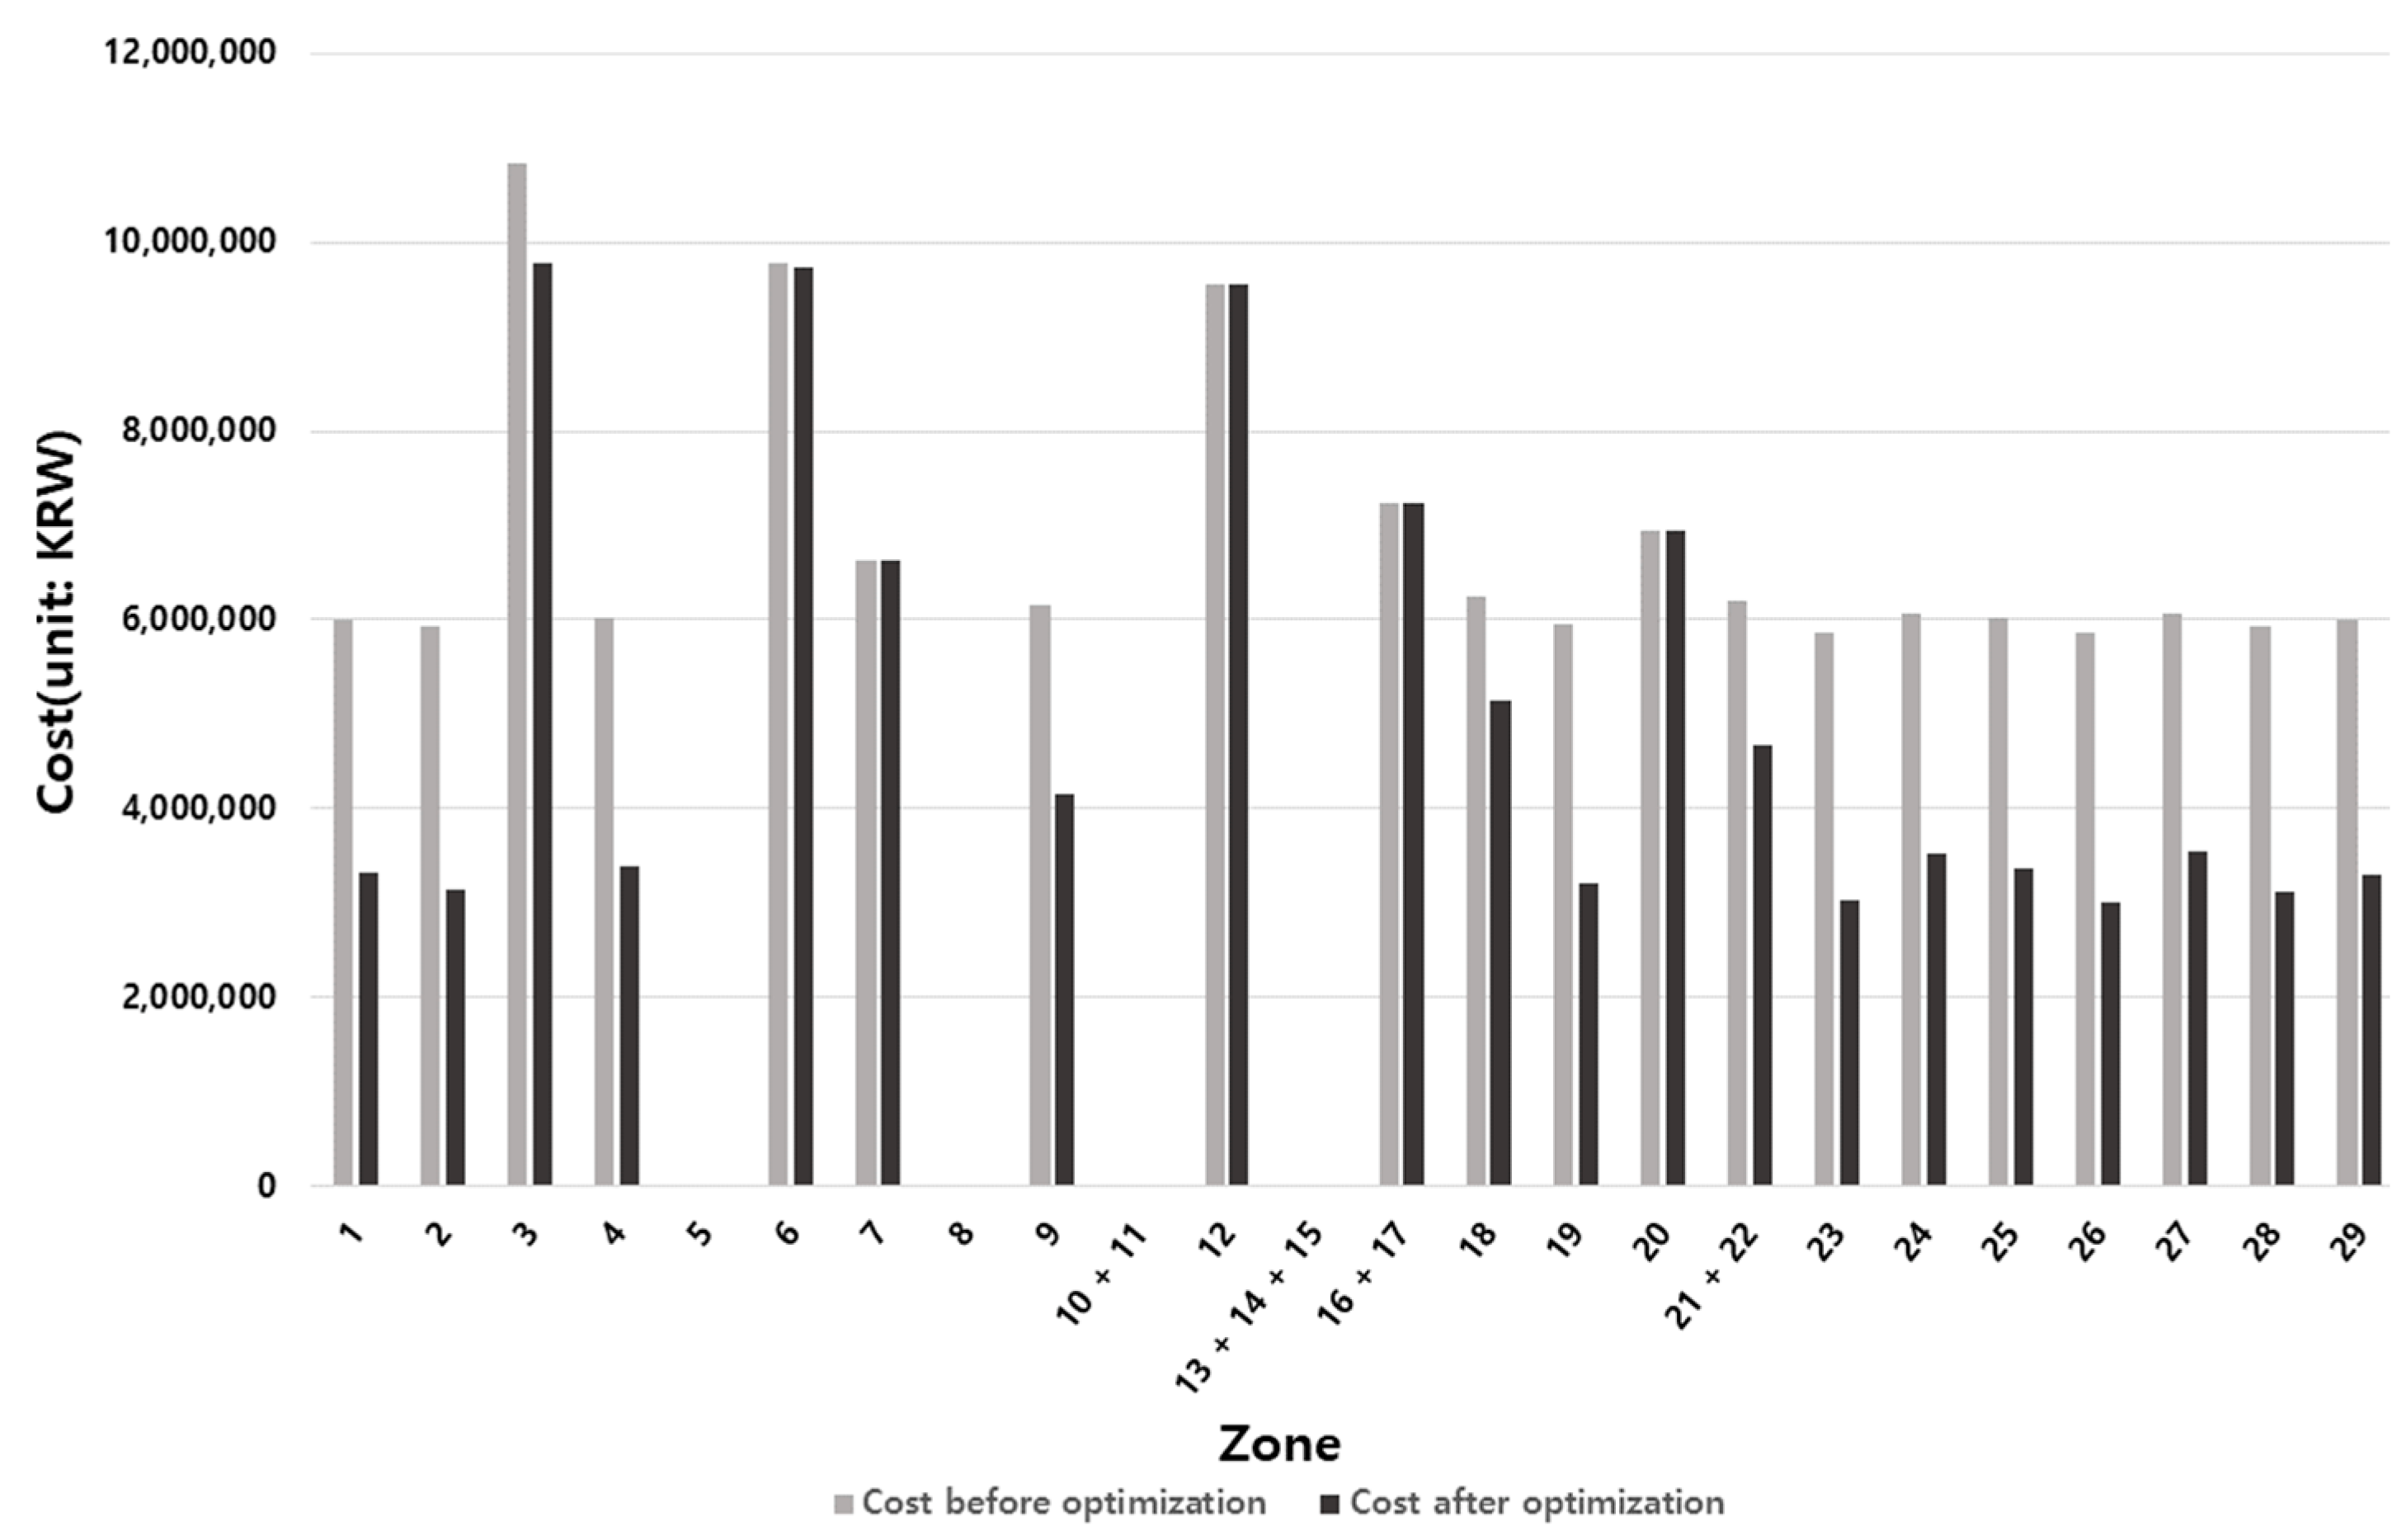
| Zone | Cost before Optimization (a) | Cost after Optimization (b) | Difference in Cost (a–b) |
|---|---|---|---|
| 1 | 6,001,584 | 3,314,256 | 2,687,328 |
| 2 | 5,933,280 | 3,138,432 | 2,794,848 |
| 3 | 10,842,000 | 9,782,544 | 1,059,456 |
| 4 | 6,023,280 | 3,384,576 | 2,638,704 |
| 6 | 9,772,320 | 9,731,328 | 40,992 |
| 7 | 6,631,104 | 6,631,104 | 0 |
| 9 | 6,160,608 | 4,145,424 | 2,015,184 |
| 12 | 9,546,912 | 9,546,912 | 0 |
| 16 + 17 | 7,227,168 | 7,227,168 | 0 |
| 18 | 6,237,168 | 5,142,816 | 1,094,352 |
| 19 | 5,959,968 | 3,199,968 | 2,760,000 |
| 20 | 6,950,352 | 6,950,352 | 0 |
| 21 + 22 | 6,207,312 | 4,658,784 | 1,548,528 |
| 23 | 5,872,608 | 3,024,576 | 2,848,032 |
| 24 | 6,060,864 | 3,529,392 | 2,531,472 |
| 25 | 6,014,832 | 3,356,160 | 2,658,672 |
| 26 | 5,861,664 | 3,007,200 | 2,854,464 |
| 27 | 6,064,848 | 3,546,912 | 2,517,936 |
| 28 | 5,925,696 | 3,122,304 | 2,803,392 |
| 29 | 5,998,176 | 3,303,936 | 2,694,240 |
| Total | 135,291,744 | 99,744,144 | 35,547,600 (26.27%) |
Publisher’s Note: MDPI stays neutral with regard to jurisdictional claims in published maps and institutional affiliations. |
© 2022 by the authors. Licensee MDPI, Basel, Switzerland. This article is an open access article distributed under the terms and conditions of the Creative Commons Attribution (CC BY) license (https://creativecommons.org/licenses/by/4.0/).
Share and Cite
Wee, K.; Ham, N.; Kim, J.-J. Microscopical Resource Allocation for Large-Scale Apartment Foundation Work Using Queuing Systems. Buildings 2022, 12, 89. https://doi.org/10.3390/buildings12020089
Wee K, Ham N, Kim J-J. Microscopical Resource Allocation for Large-Scale Apartment Foundation Work Using Queuing Systems. Buildings. 2022; 12(2):89. https://doi.org/10.3390/buildings12020089
Chicago/Turabian StyleWee, Kyungsoo, Namhyuk Ham, and Jae-Jun Kim. 2022. "Microscopical Resource Allocation for Large-Scale Apartment Foundation Work Using Queuing Systems" Buildings 12, no. 2: 89. https://doi.org/10.3390/buildings12020089