1. Introduction
The environment contains aggressive species that can deteriorate structures [
1,
2,
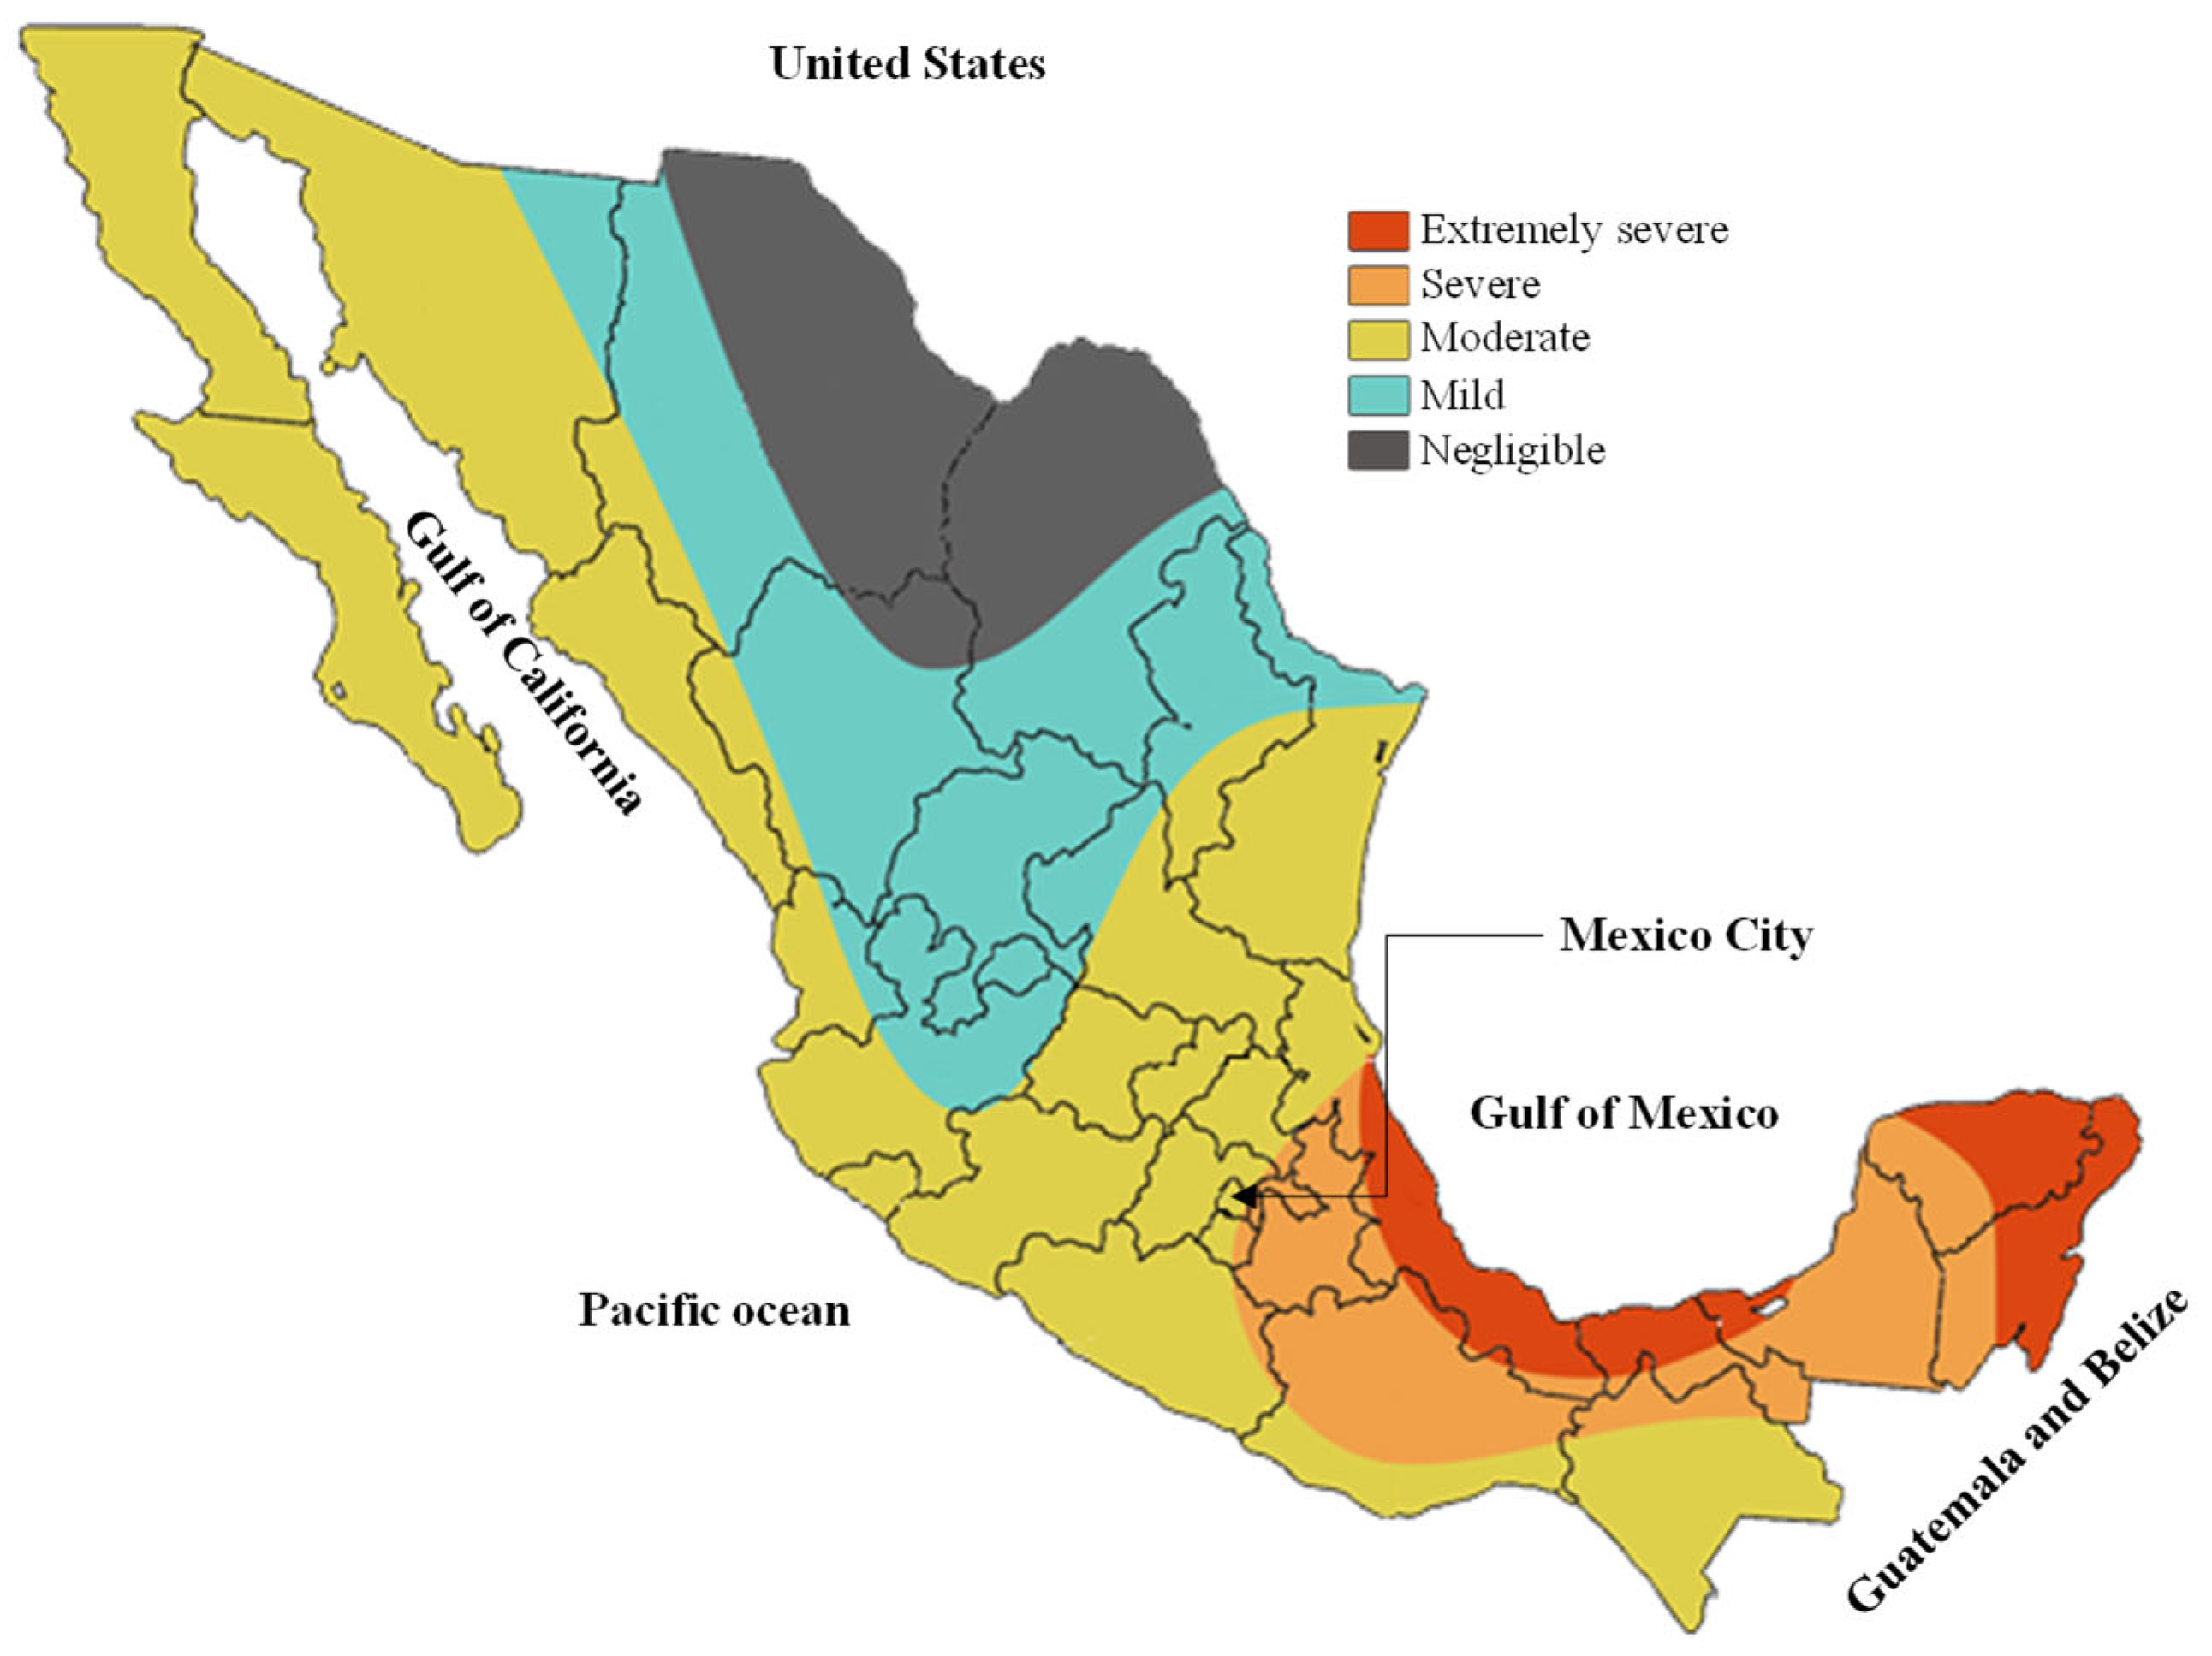
3]. In this context, coastal zones are attractive to human development due to the economic resources. For example, in the Gulf of Mexico (
Figure 1), the coastal zone is prone to high amounts of chloride ions and high humidity, the former being the main cause of corrosion in reinforced concrete (RC) structures [
4,
5]. Additionally, the corrosion rate of the reinforcing steel depends on the structure properties such as cover width and water–cement ratio (
w/
c).
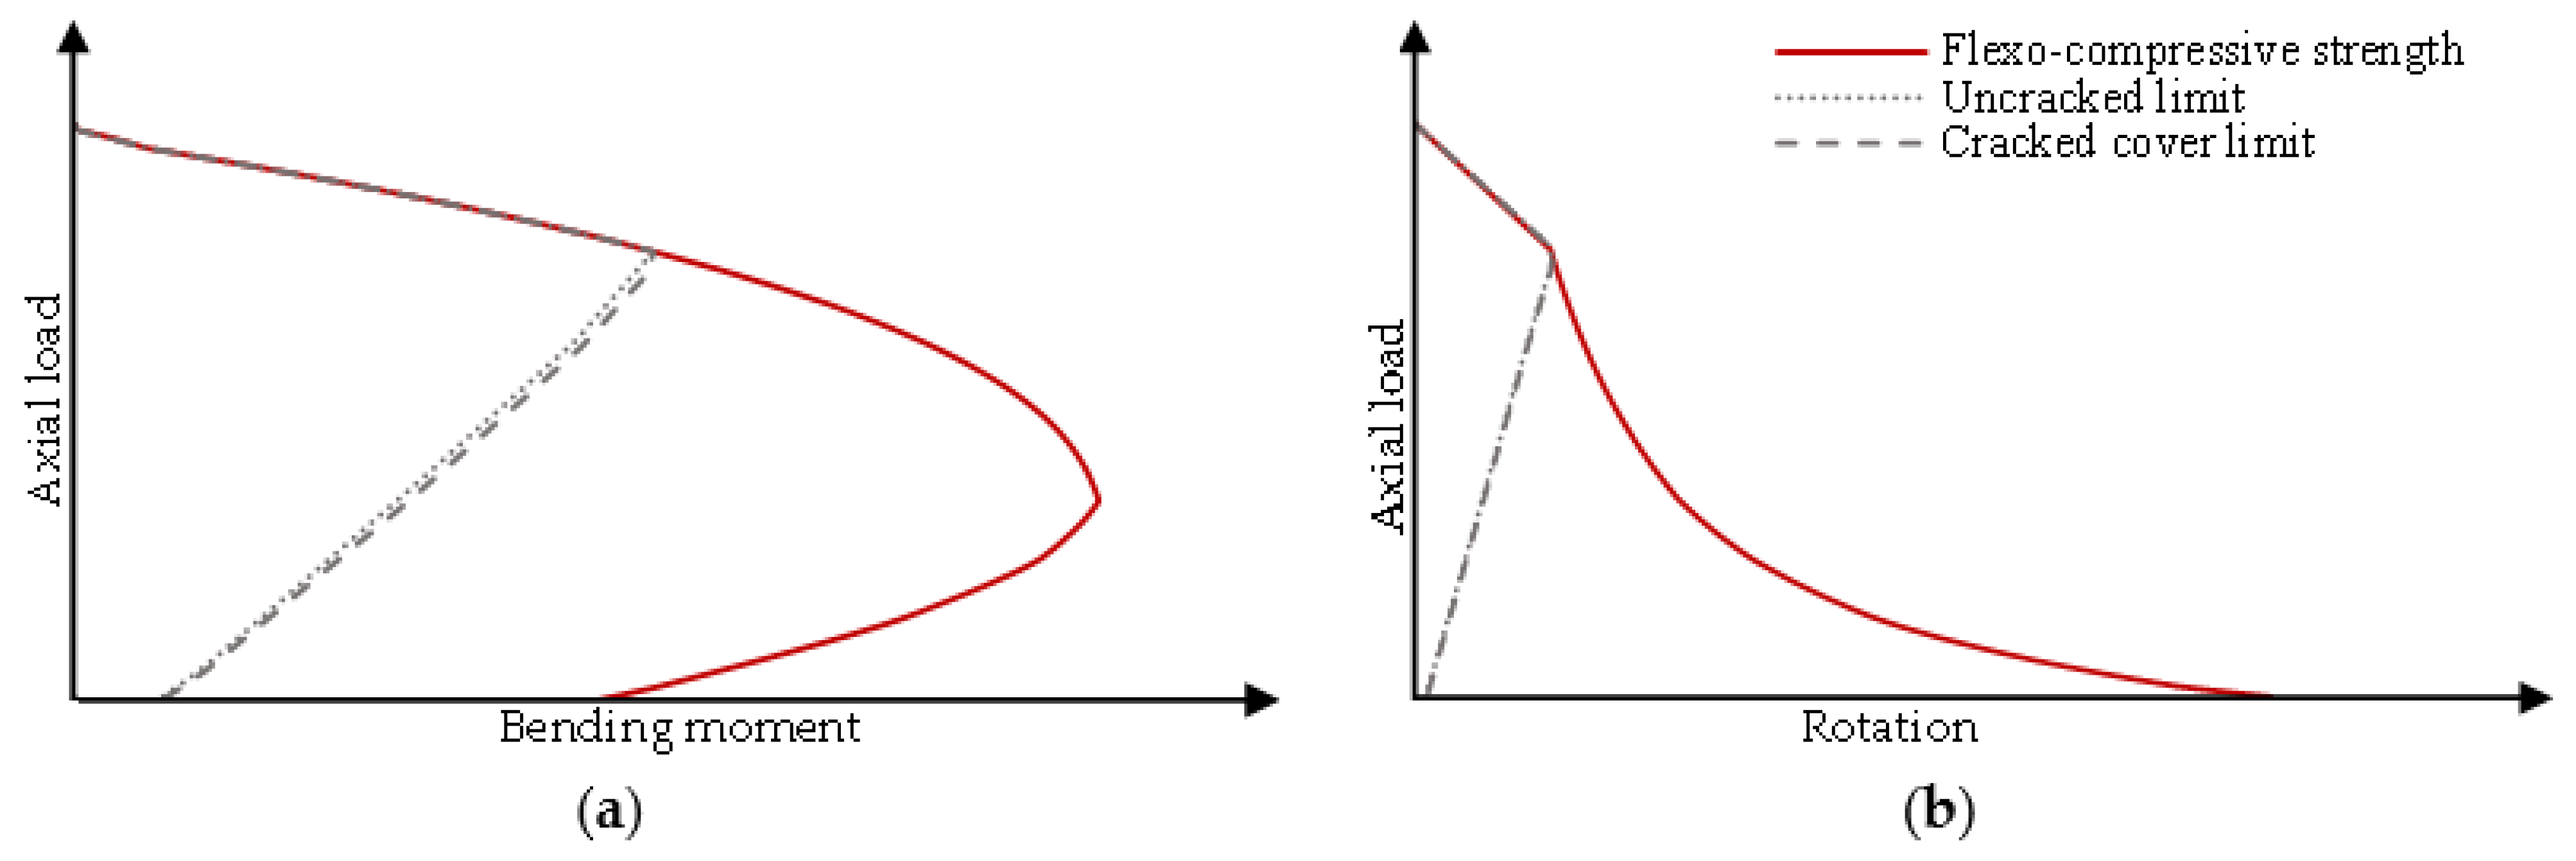
In all human settlements, RC frame buildings are common structures. The structural frames are composed of beams and columns. Flexo-compressive strength capacity can be determined by the axial load-bending moment diagram and the axial load-rotation diagram (
Figure 2). The uncracked limit represents the structural capacity without cracking. The cracked cover limit is the element capacity when the cracking reaches the reinforcing rebar. Because of their behavior and the low tensile capacity of concrete, the frame elements tend to crack, even by the gravitational load and by volumetric changes [
6]. Even when the crack widths of RC elements are limited by design codes [
7,
8], this cracking reduces the corrosion protection of reinforcing steel that provides the concrete cover [
9]. Consequently, deterioration of the structural elements can be incremented within their serviceability limit states (SLS).
Figure 1.
Environmental aggressiveness [
10,
11].
Figure 1.
Environmental aggressiveness [
10,
11].
In the literature, the performance deterioration of different RC structural elements and their joints in the corrosion process was studied, such as: piers [
12,
13], beams [
14,
15,
16], columns [
17], shear walls [
18], and beam-column joints [
19]. In the frame elements, the degradation of the bond strength [
20,
21] and the flexural strength are capacities generally studied [
22,
23]. In contrast, there are few studies about the degradation of concrete strength and flexo-compressive strength in elements [
24,
25]. These degradation strengths have been analyzed in the corrosion level domain (
η) [
20].
η is defined by Equation (1), where
m0 and
m are the mass of longitudinal reinforcement before and after corrosion, respectively. Moreover, some of the studies mentioned above do not relate to the corrosion level and the structure age.
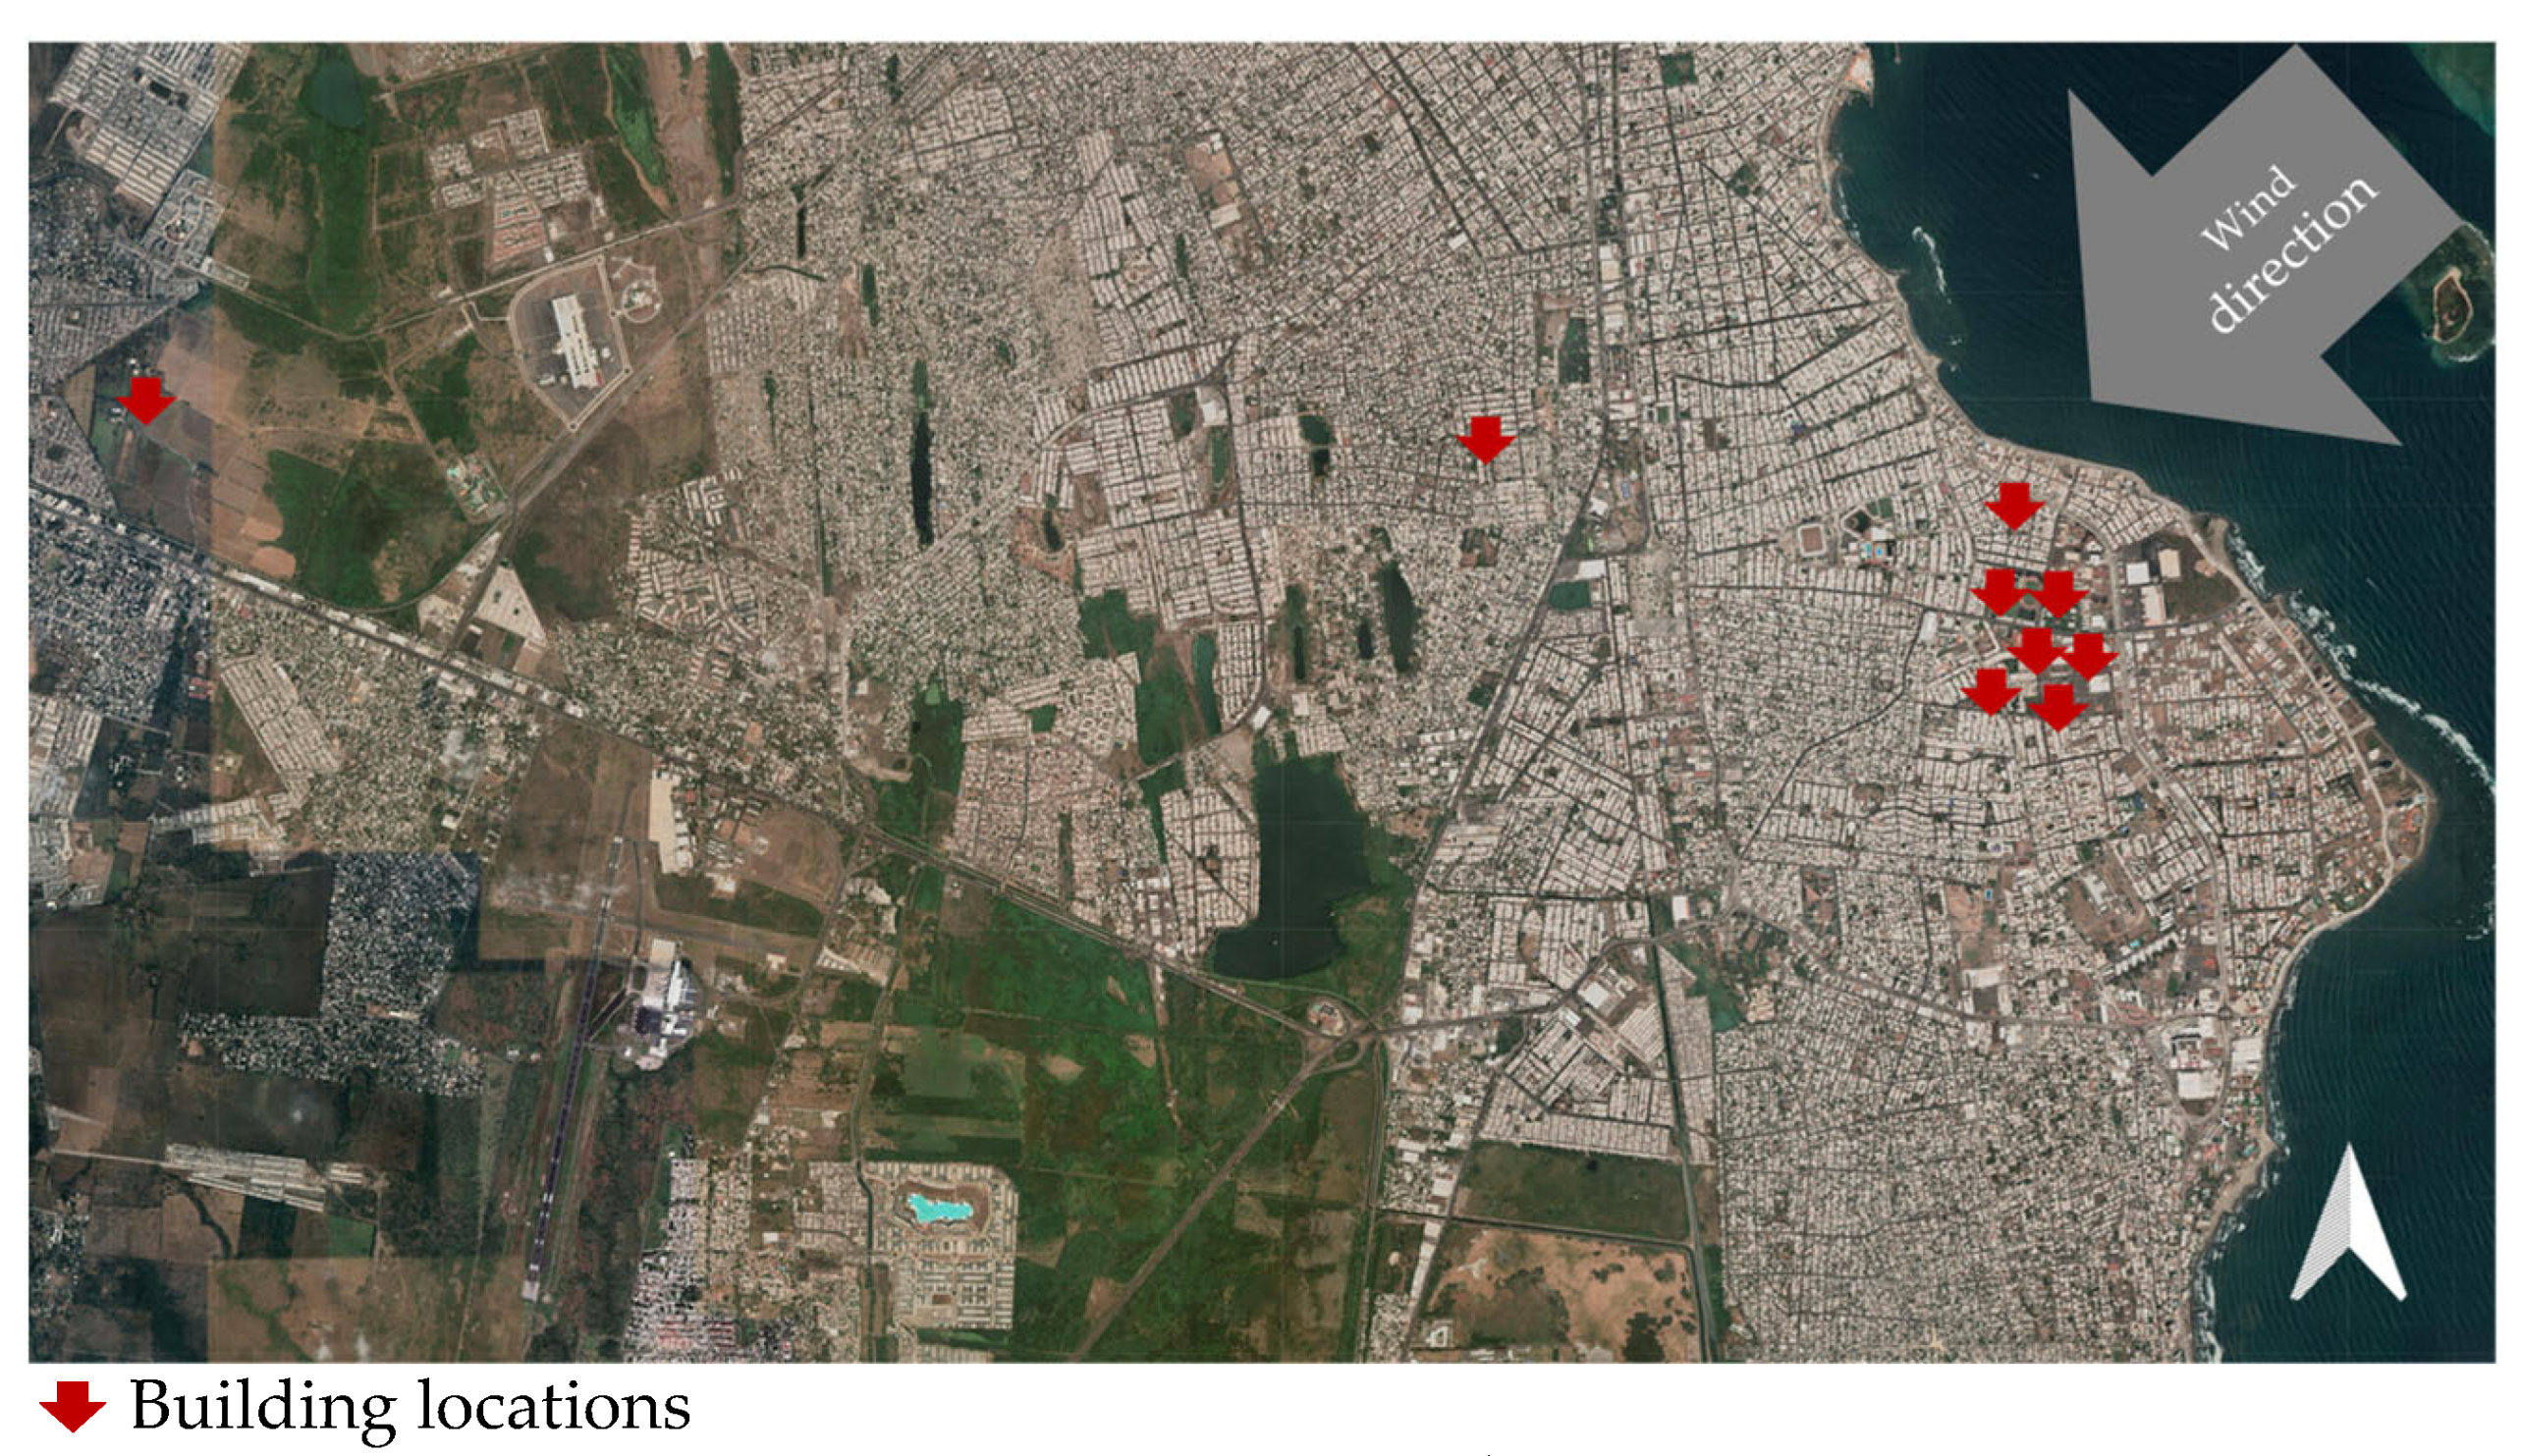
A study considered 39 university buildings built in the coastal environment of Boca del Río [
26].
Figure 3 shows the RC frame buildings that has more deterioration than the expected. The authors concluded in the necessity to evaluate and to calculate the residual capacity of RC frame elements, taking into account their current state. This experience encouraged the present paper.
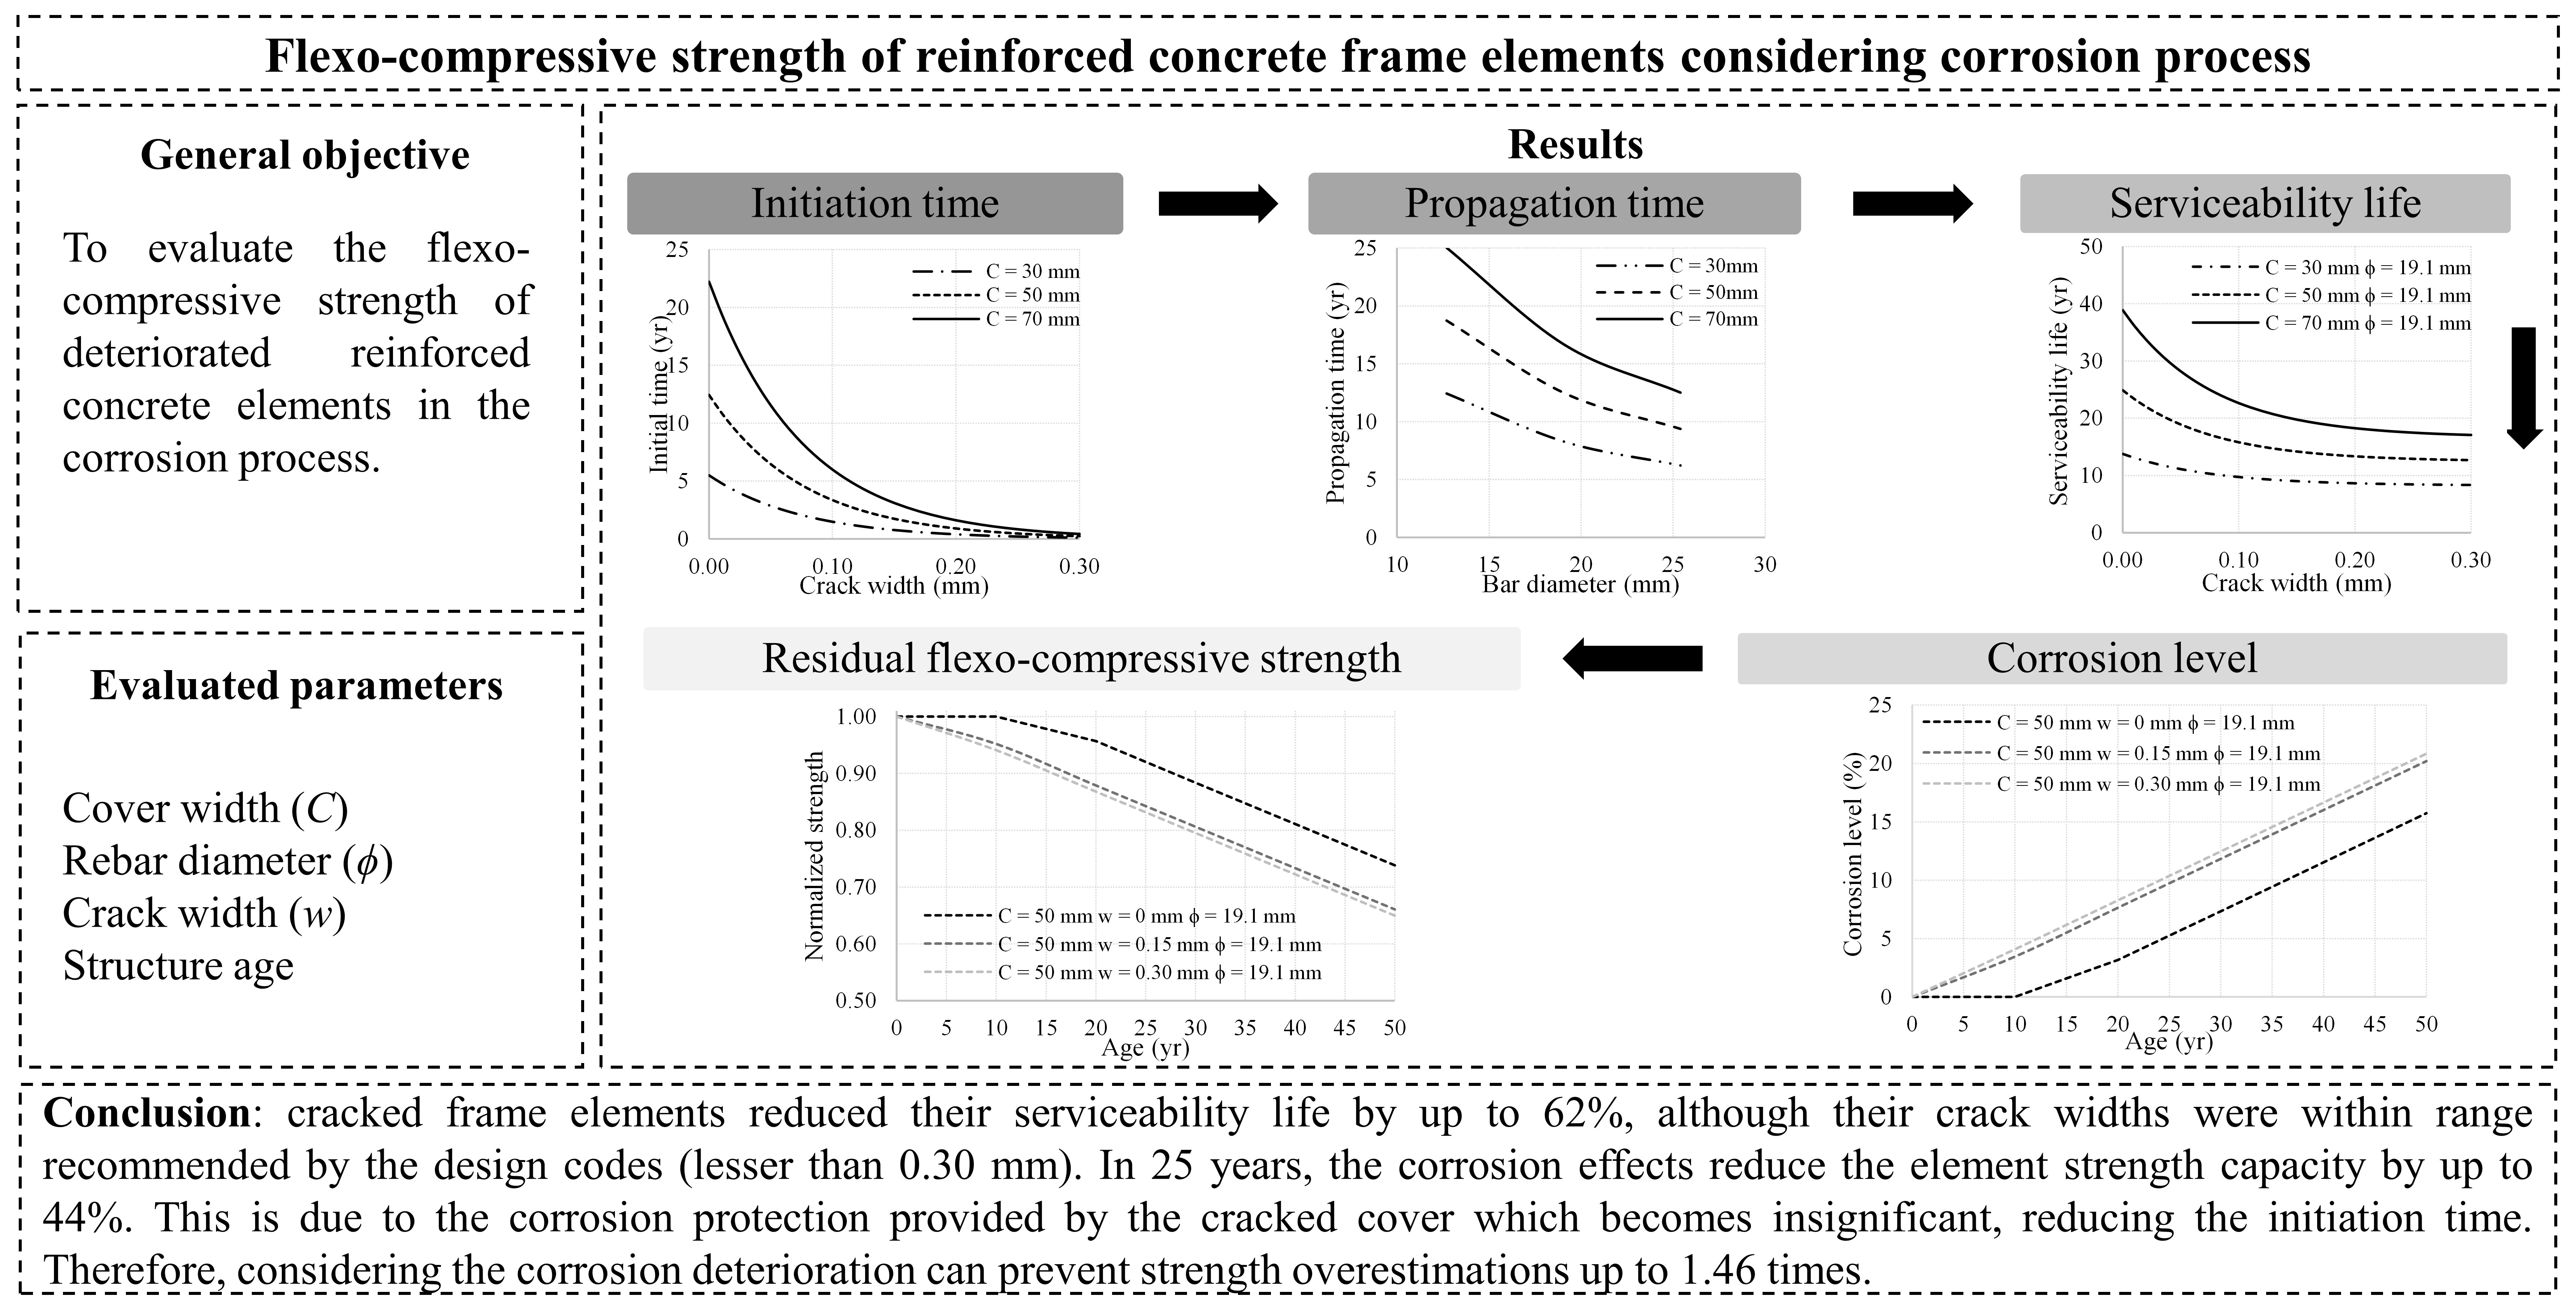
The aim of this paper is to evaluate the flexo-compressive strength capacity of deteriorated RC elements according to its structural age. To that end, an analytical methodology to calculate the residual strength was defined. This allowed consideration of the effects due to cracking in the cover and environmental aggressiveness. To validate the proposed methodology, its analytical results were compared with experimental tests. The strength deterioration was studied using parametric analyses in the structural age domain. The crack width, width cover, and reinforcement ratio were considered variables. The evaluation was focused short columns.
2. Background
2.1. Corrosion Effects in the Material Strength Capacity
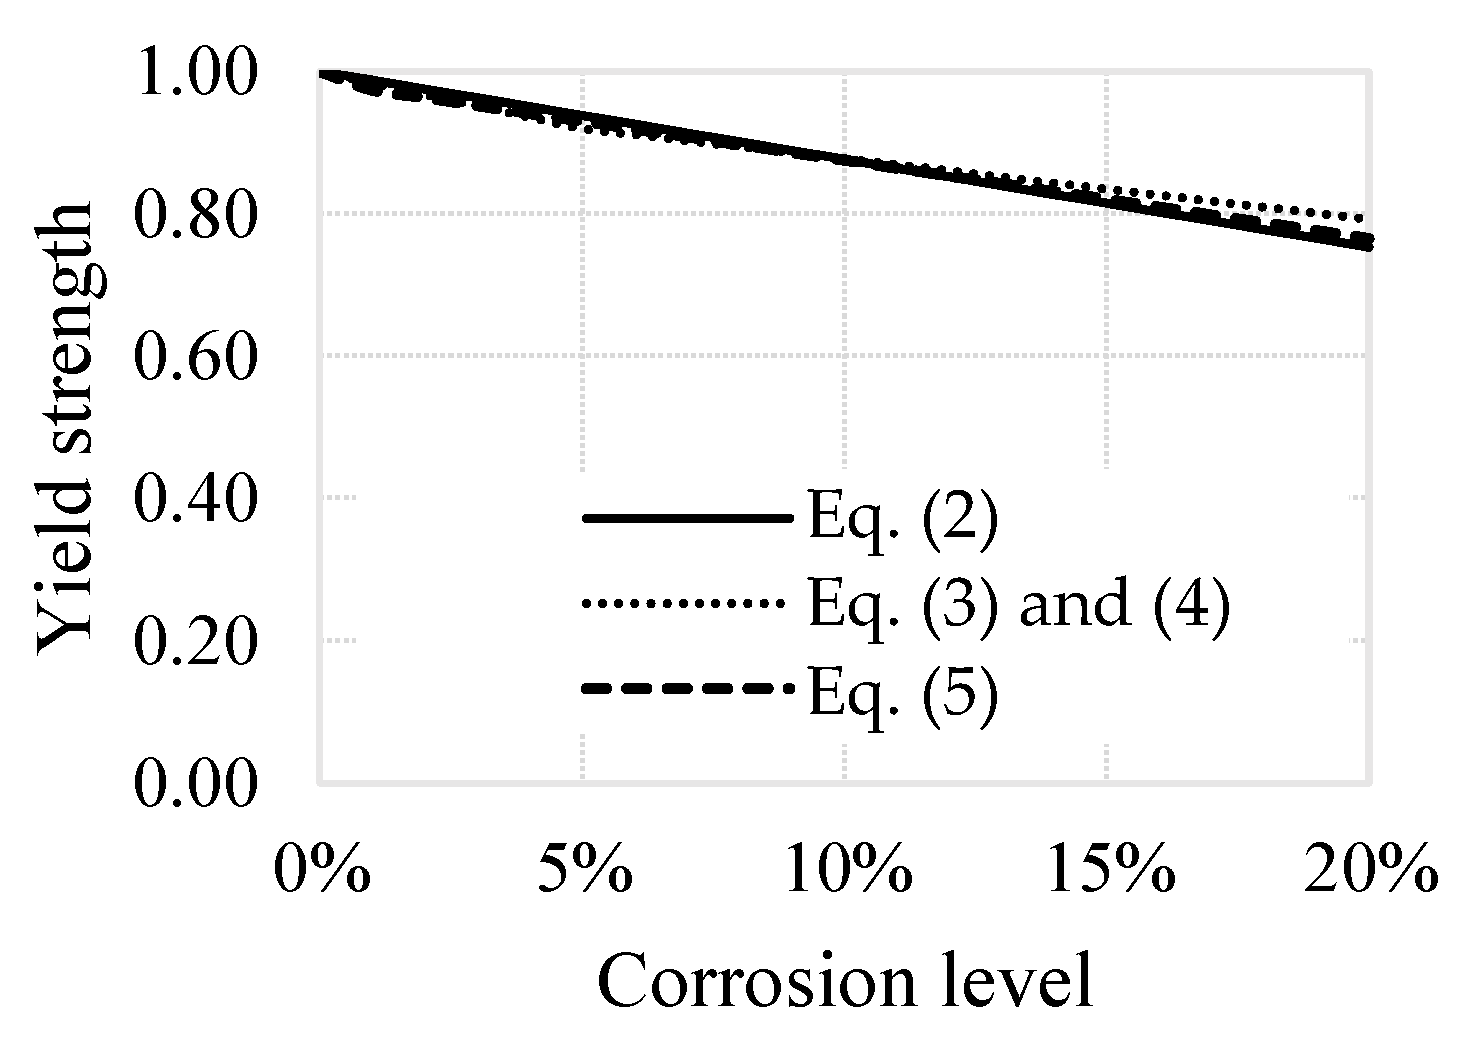
Tensile strength degradation of the reinforcing rebar was studied by Wang et al. [
22] and Kashani et al. [
27]. This degradation is the main result of the transverse area reduction in steel rebar. In this way, there are analytical models (
Figure 4) to estimate the residual yielding force (
Fyc). These models were proposed by Lee and Cho [
28] (Equation (2)), by Wang et at. [
22] (Equations (3) and (4)) and by Guo et al. [
23] (Equation (5)). The yielding force were normalized to forces without corrosion. These models described a similar behavior.
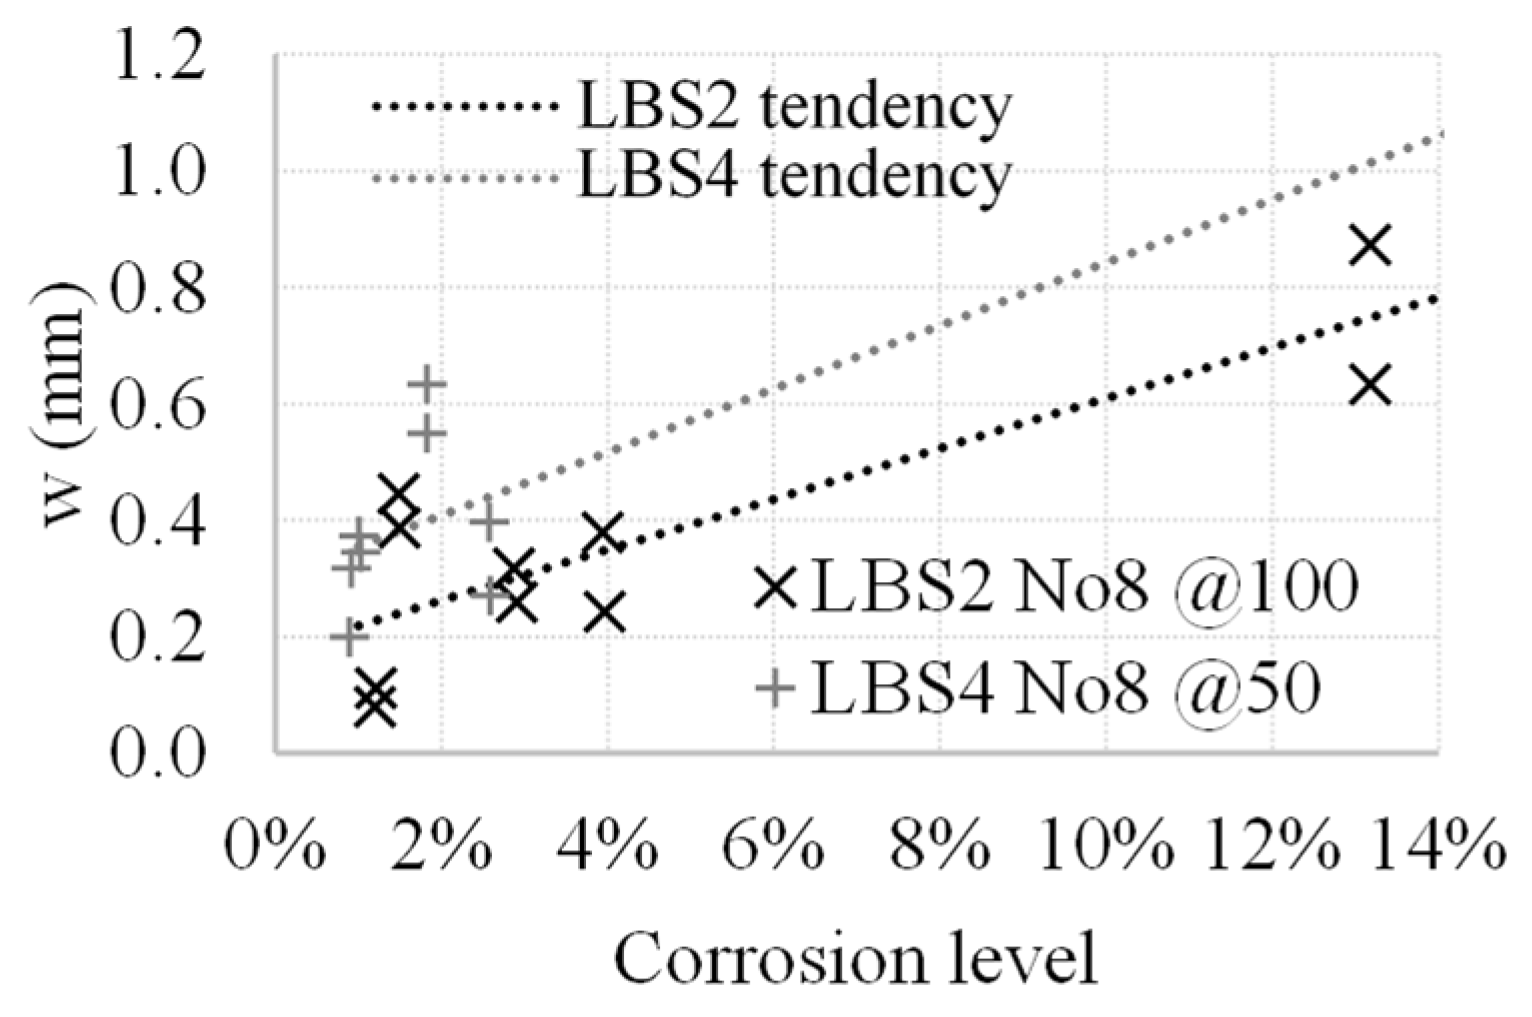
Lin et al. [
20] analyzed the corrosion effects in longitudinal and transverse reinforcement on bound behavior and cracking patterns. Their experiment studied the crack width–corrosion level relation considering the separation between stirrups (
Figure 5). Their experimental specimens had two stirrups separation 100 (LBS2) and 50 cm (LBS4). Mass loss of transverse reinforcement was almost 3.5 times more than the longitudinal reinforcement, due to its closeness to the boundary. Thus, the transverse reinforcement developed a local cross-section loss of around 2.68 times the average mass loss. On the other hand, in the transverse reinforcement, the corrosion reduced the confining ability, increased the crack widths, and changed the cracking pattern.
From the main results found in experiments by [
20], it can determinate that the transverse reinforcement lost its continuity after 0.2 of
η. Therefore, the authors considered that an evaluation of residual strength capacity is limited to 0.2 of
η. Moreover, the concrete cracking can increment around 1.4 times due to the influences of the transverse reinforcement (
Figure 5). This is because the LBS2 specimens had stirrup separations that were double than LBS4 specimens.
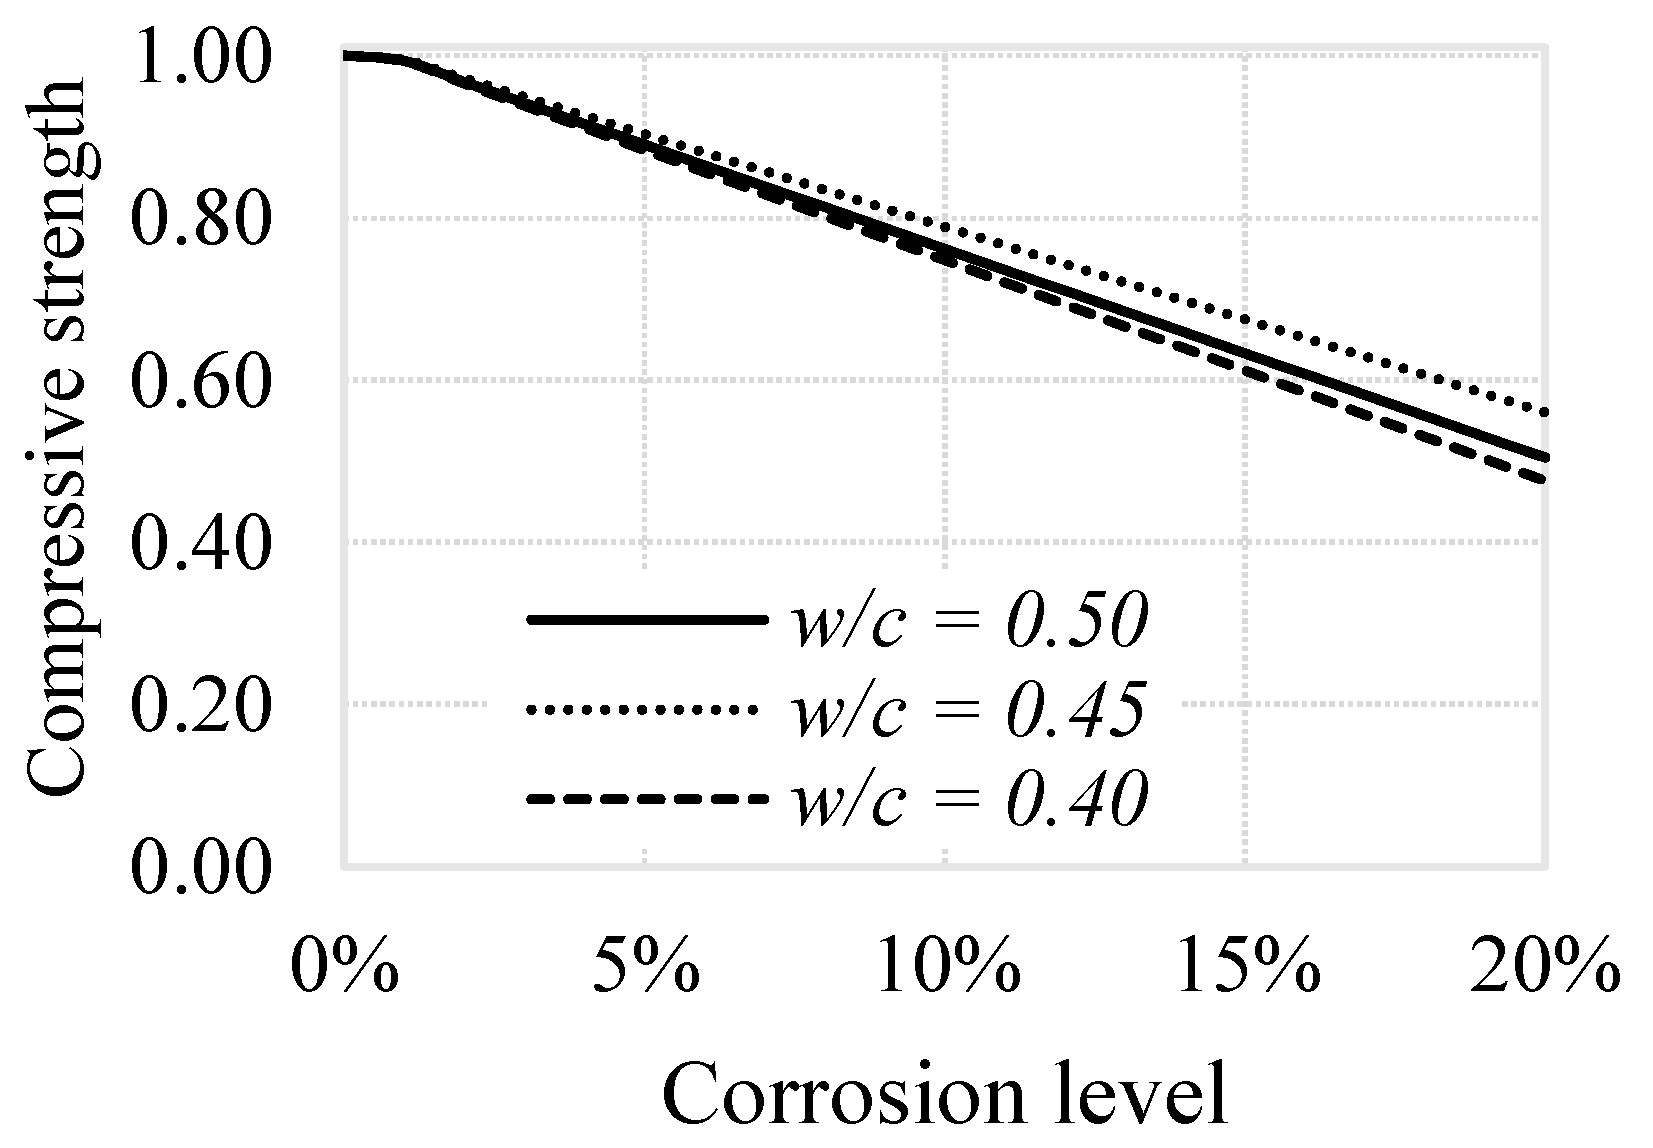
Corrosion degrades the compressive strength capacity that withstands the concrete due to produced cracking. Shayanfar et al. [
29] evaluated the reduced compressive strength (
Fcc) in concretes with different water–cement ratios (
w/
c = 0.4, 0.45 and 0.5,
Figure 6). Their evaluated specimen only had longitudinal rebars. From these results, an analytical model was proposed to calculate the residual strength of concrete (Equation (6)) considering the corrosion level and water–cement ratio of concrete (Equations (7)–(9)).
where:
2.2. Residual Element Strength Capacity
The residual strength of corroded elements has been studied by experimental test using specimens corroded by accelerated methods. The flexo-compressive strength was obtained by applying incremental loads with contact eccentricity [
22,
30]. In contrast, flexure strength is found by incremental load in beams with simple supports [
22,
23].
In the literature, there are different recommendations to calculate the flexo-compressive strength of corroded elements. Tapan and Aboutaha [
31] did not consider the contribution of the concrete cover in one or more element faces according to element states. Campione et al. [
32,
33] related to the corrosion effects, the confinement loss and the critical load axial. On the other hand, this strength was studied in the context of hysteretic behavior. These proposals were focused on the effect of reinforcement degradation [
25,
34]. Yu et al. [
25] analyzed the variability in corrosion damage models and its effect on seismic collapse fragility. They concluded that in the deterioration mechanism due to corrosion, the maximum influence was caused by the yield strength and ultimate deformation. In all these studies, to estimate the residual strength, corrosion level needed to be known. Thus, in order to evaluate existing buildings, the corrosion level is the main parameter to be defined.
2.3. The Estimation of Corrosion Level
In the design codes [
35,
36], a certain level of deterioration in the RC elements are allowable, while the reduction in structural capacity is insignificant. This period where the deterioration is allowable is named ‘serviceability life’. The serviceability life of the RC element (
TL, defined by Equation (10)) considers the initiation time (
ti, Equation (11)) and the propagation time (
tp, Equation (12)). The first time is related to the period where rebar corrosion begins, and the second time is to the additional period for significant degradation of the structural element occurs. In contrast, in the design of RC elements, the cracks are allowable, while the crack widths do not exceed its limit. In a coastal environment, the limit crack width is between 0.15 and 0.30 mm [
7,
8]. In this way, the serviceability life in cracked elements decreases significantly [
9]. This effect must be considered in the structural design.
where:
In the case of chloride-induced corrosion, the serviceability life (Equations (7) and (13)) depends on the corrosion rate (
Vcor), the chloride penetration coefficient (
K), the rebar diameter (
ϕ), and its depth (
dr, in mm). To estimate the cover width (
C), the exposure time (
t in years) is required. The penetration coefficient (
K, Equation (14)) is related to the critical chloride concentration, (
Cth, % weight of cement), the surface chloride concentration (
Cs, % weight of cement), the content of chlorides in raw materials (
Cb, % weight of cement), and the diffusion coefficient (
D). This coefficient is influenced by the crack width (
w, in Equation (15), [
9]).
3. Description of Parametric Analyses
In order to evaluate the residual strength in the domain of the structure age, an analytical methodology is defined. Two parametric analyses are developed (
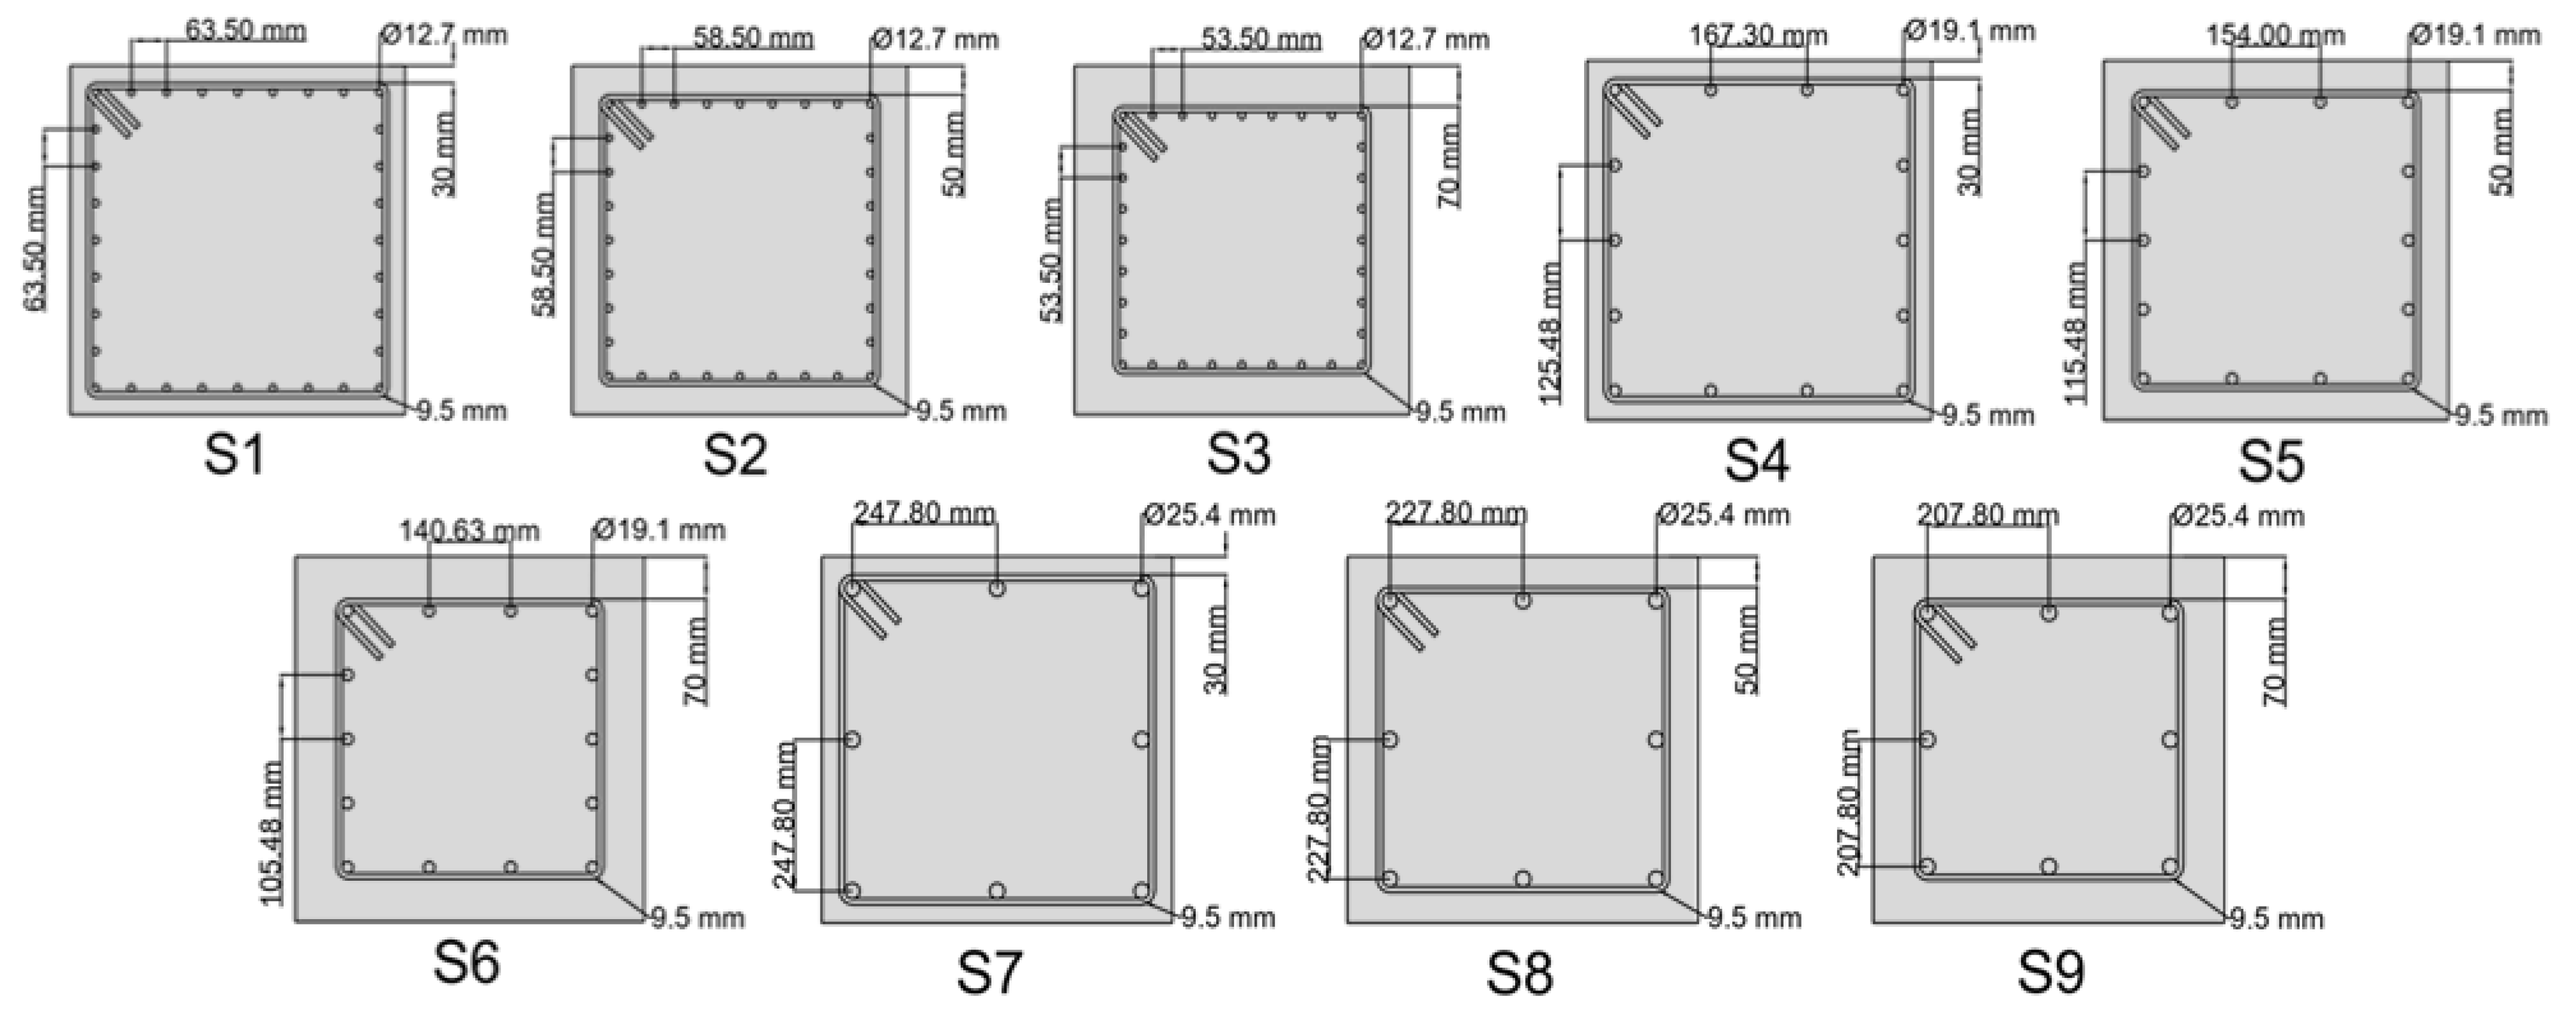
Table 1): in the first, the effect of crack width and rebar diameter on the initiation time and the propagation time are studied. In the second, these effects on the residual strength of structural sections that has different arrangement of reinforcement (
Figure 7) is evaluated. For parametric analyses, a square cross section of 60 cm was considered.
The studied parameters considered as variables are: the crack width (
w), the cover width (
C), the rebar diameter (
ϕ), and the structure age (
as). The structure age is evaluated between 0 and 50 years: that is a serviceability life range of conventional structures [
35,
36]. The crack width range and the concrete properties are defined, taking into account the recommendations for coastal environment [
35] (
Table 2). The reinforcement arrangements proposed represent 1.1% of the reinforcement ratio (9 arrangements, from S1 to S9,
Figure 7). Due to change in the rebar diameter, the effective cover and the effective depth are modified (
Table 3). The location of both parameters is considered at the rebar centroid. The other properties are determined, taking into account typically column sections [
11,
25]. To evaluate the residual strength capacity, corrosion at all bars was assumed as a deterioration case [
31].
4. Determination of Residual Strength
4.1. Proposed Methodolgy
In order to determine the residual strength, the methodology was proposed:
The initiation time (
ti, Equation (11)) is defined according to EHE-08 [
35]. In the penetration coefficient (
K, Equation (14)), the crack width effects on the diffusion coefficient (
D, Equation (15), [
9]) is incorporated.
The exposition time (te, Equation (16)) is the differences between the initiation time and the structure age (as).
The corroded volume of rebar (Rc, Equation (17)) is determined by means of the exposition time (te) and the corrosion rate (Vcorr) and the rebar surface (Sb).
The corrosion level is calculated assuming that uniform corrosion in the length of each bar. Thus, this can be defined by the ratio between the corroded (Ac) and initial areas (A0) of rebar (η, Equation (18)).
The residual strength of the rebar (
FYc, Equation (5), [
23]) and the concrete cover (
Fcc, Equation (6), [
29]) are defined according to the corrosion level. In contrast, the corrosion effects are insignificant in the concrete core.
The residual flexo-compressive strength is determined by the interaction diagram of the axial load and bending moment. The incorporation of the material strengths is assumed according to the method of corrosion effect factors [
25].
The proposed methodology considered the column properties (
C and
w/
c) and the information relative to its current state (
as and
w) that influence the corrosion process. Additionally, the deterioration case of the structural elements [
31] can be evaluated through the difference between the core and the cover concrete.
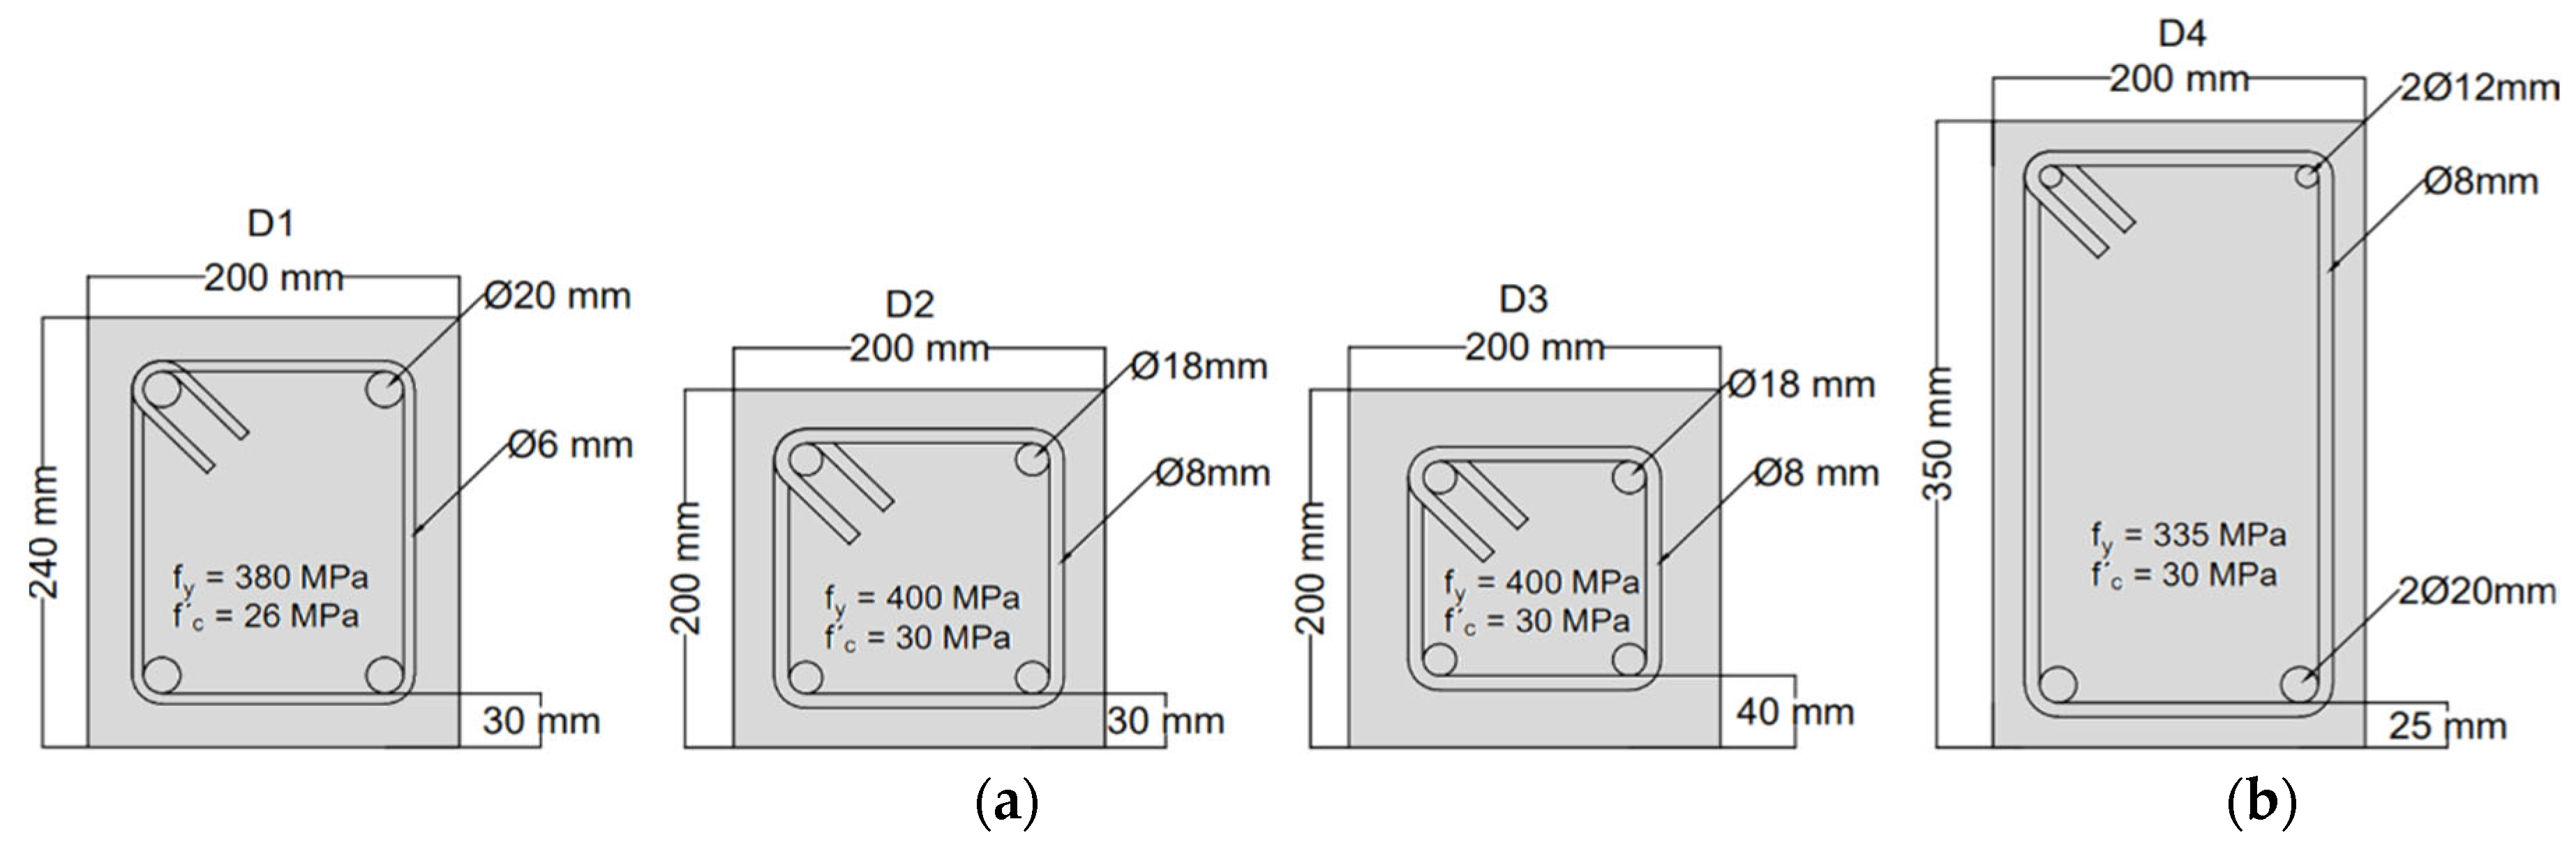
4.2. Validation
The proposed methodology is validated using experimental results. To that effect, it is considered experiments of eccentric compression in columns (D1 [
37]; D2 and D3 [
30], see
Figure 8) and bending experiments (D4 [
23], see
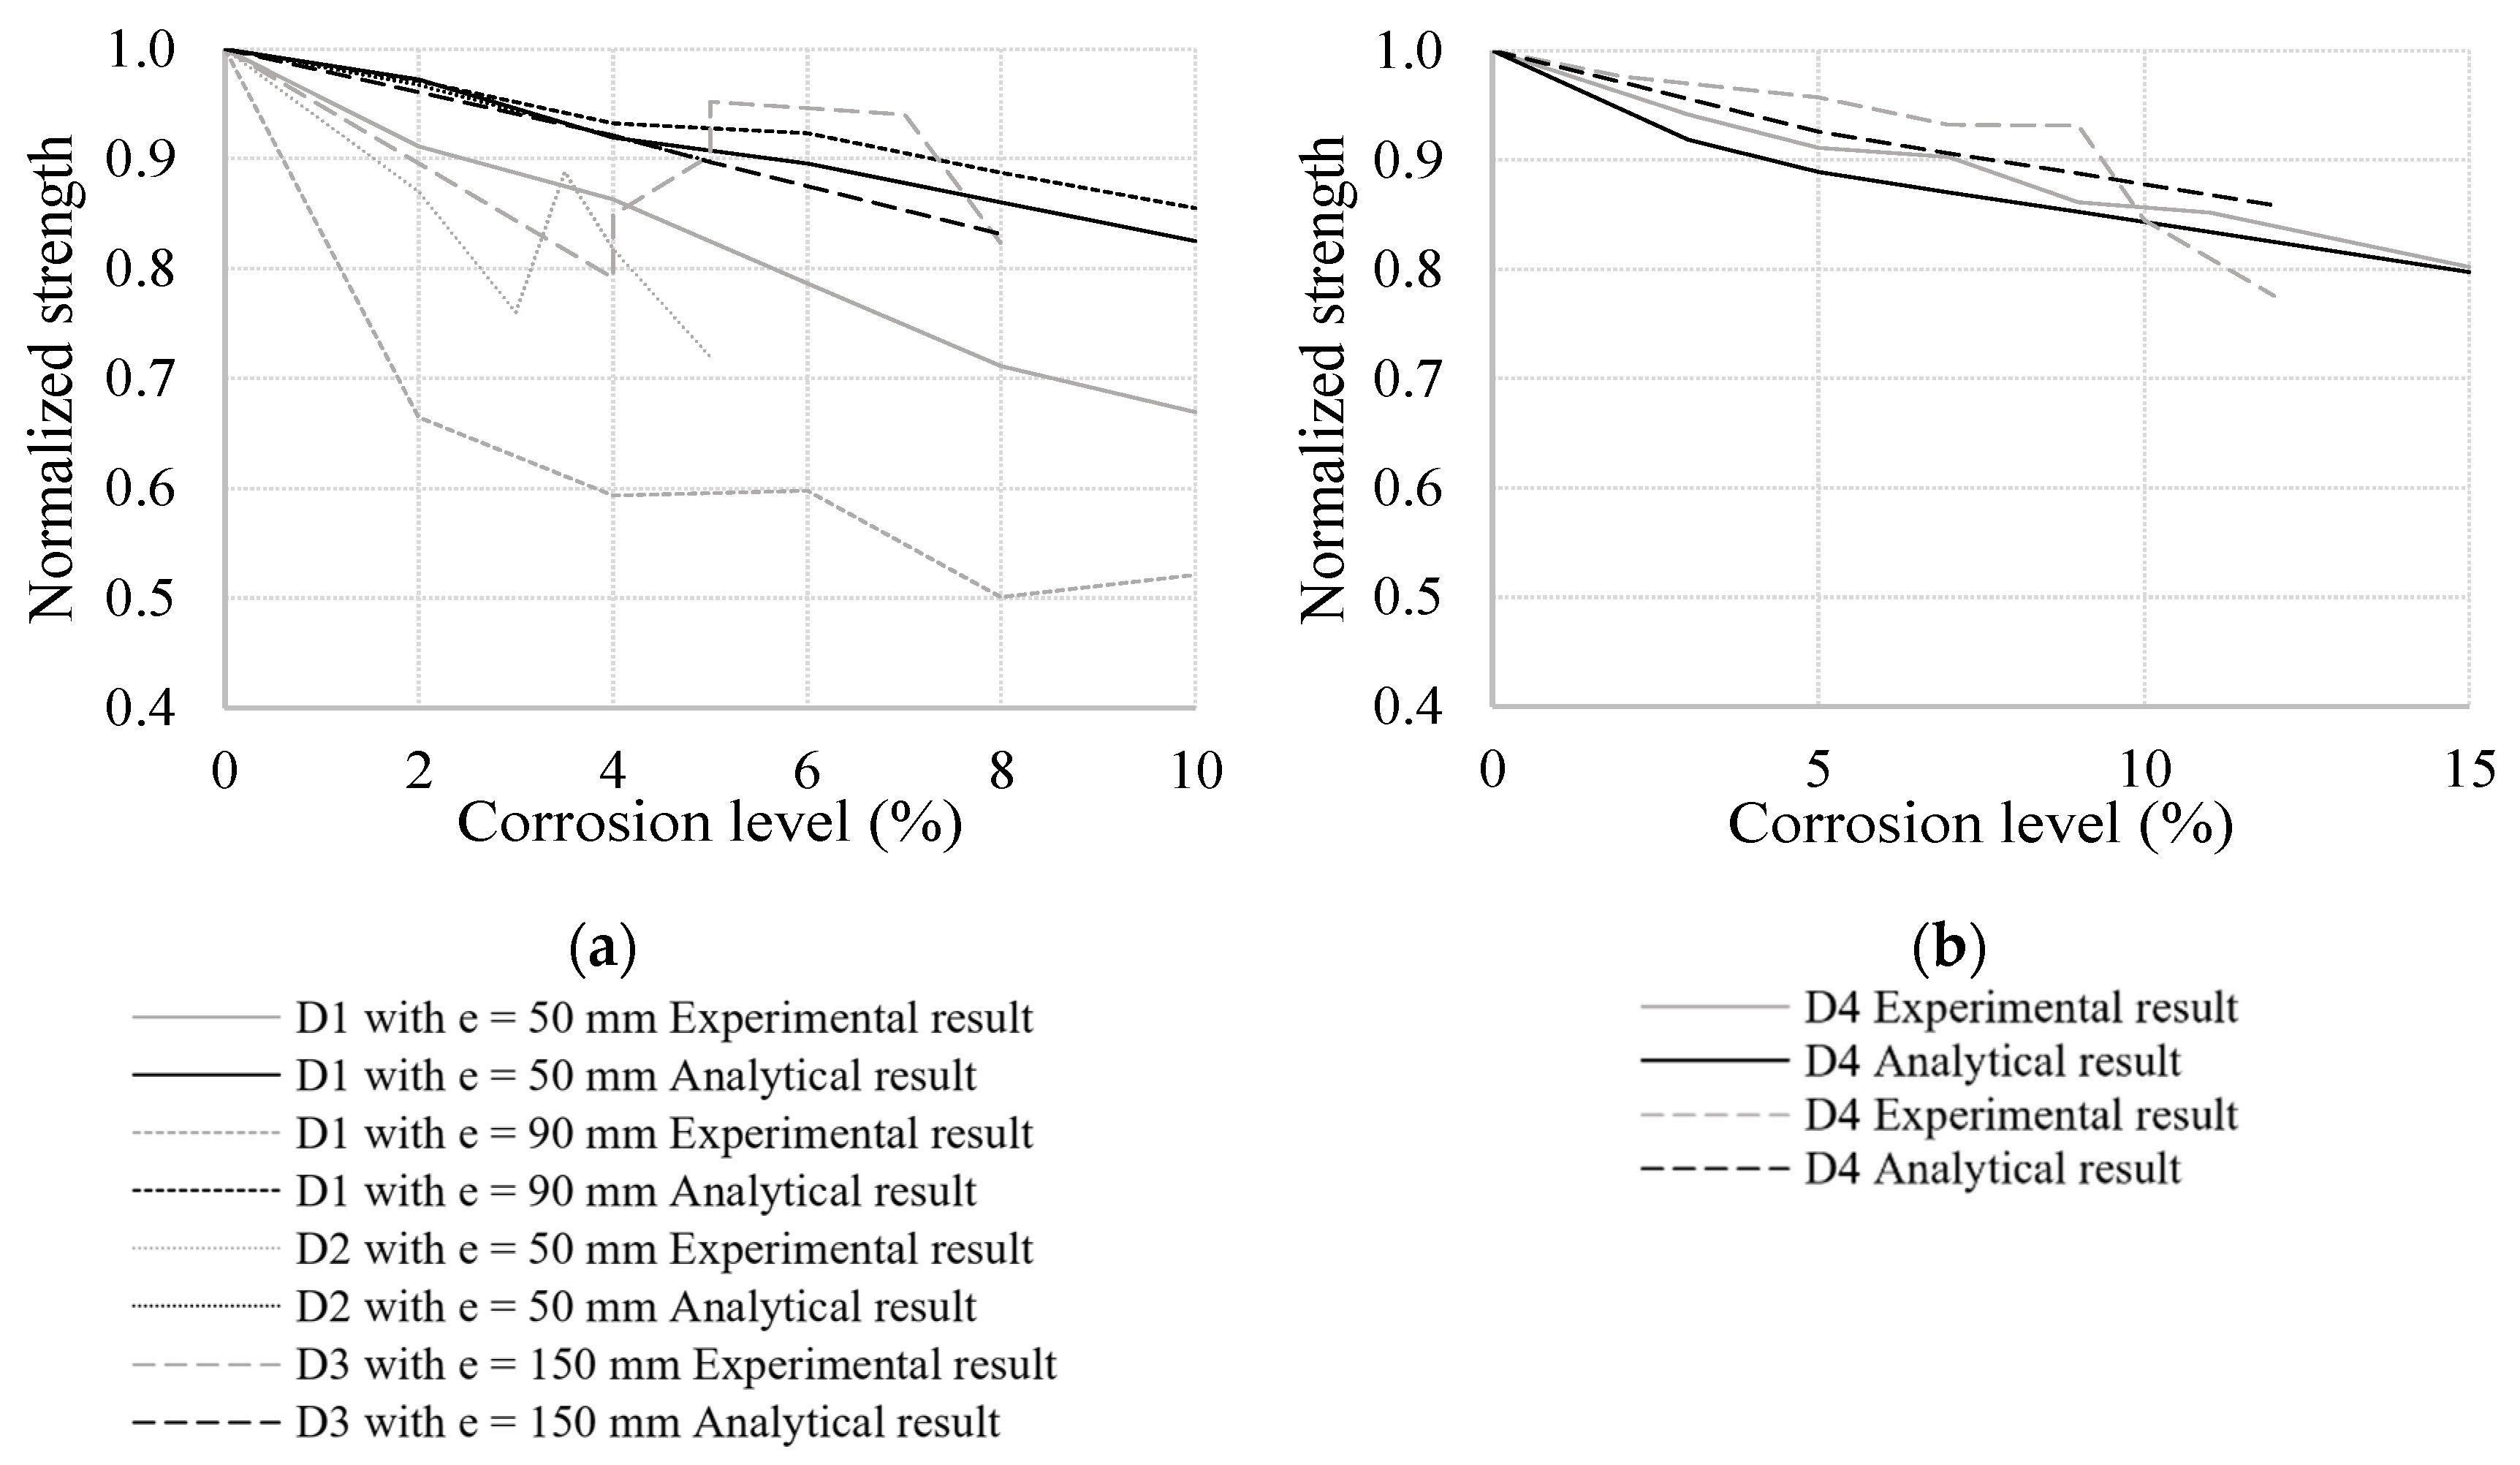
Figure 8). The resistance was calculated by the means of the proposed methodology considering the design specifications and the corrosion level. The experimental and calculated strengths are normalized according to the elements without corrosion. The strength degradation is compared on the level corrosion domain (
Figure 9).
Section D1, whose eccentricity is 90 mm, does not compare due to its uncertain tendency since the 2% corrosion level reduces the strength by 67%. From the validation, a significant difference (up to 20%) obtains in flexo-compressive strength (
Figure 9a); in contrast, in the bending strength capacity, this is neglectable (lower than 10%,
Figure 9b). This difference is because the corrosion level was the average of rebars in the experiments. Moreover, the spalling of the concrete cover caused by stirrup corrosion was not considered in the proposed methodology. In the flexural domain, the difference was lower than in the flexo-compression domain. Where the concrete contribution to the bending strength capacity is insignificant. Thus, the proposed methodology is suitable for estimating the residual flexo-compressive strength of elements whose corrosion level is lower than 20%.
5. Effects on RC Durability
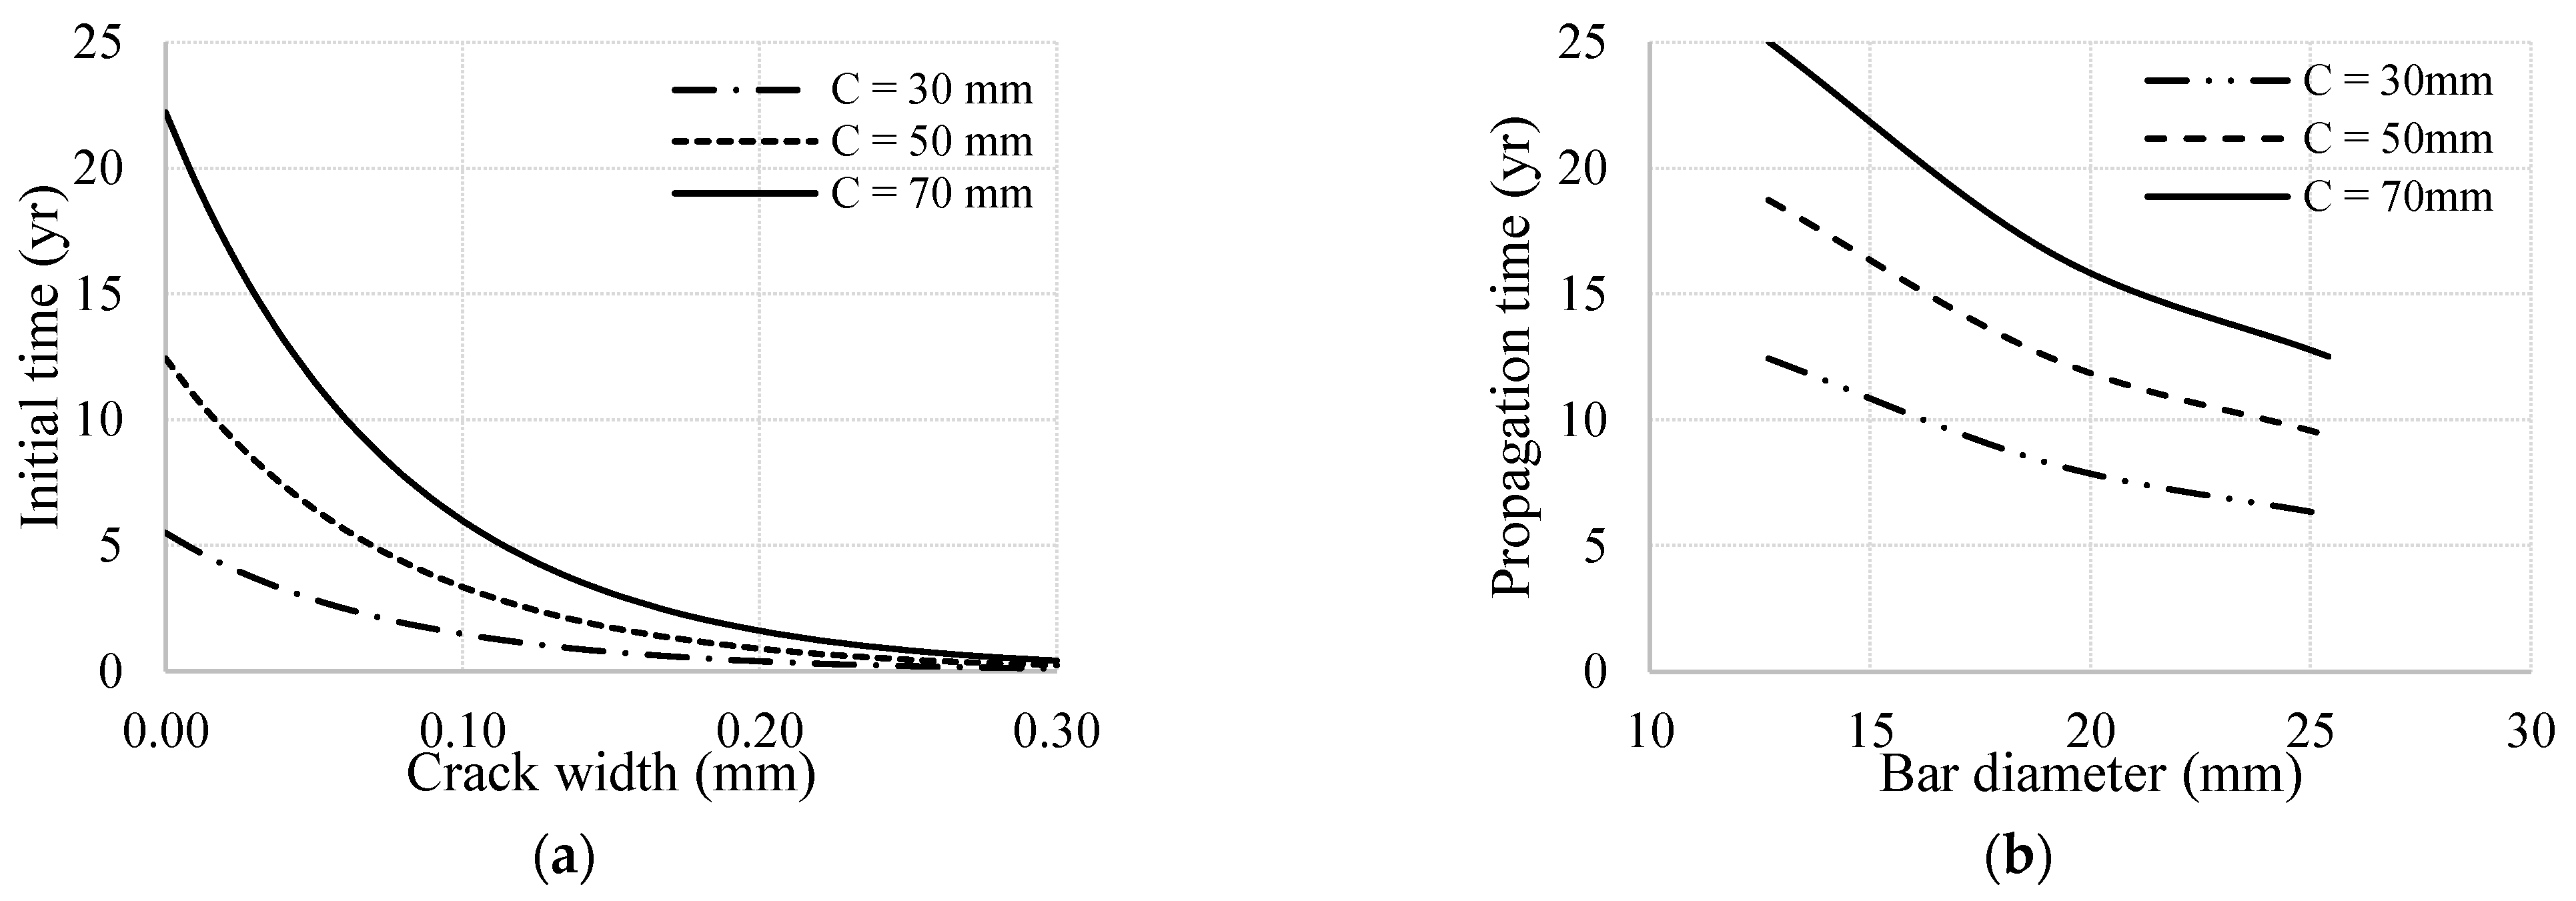
The durability was studied through the serviceability life (TL) that was divided by initiation time (ti) and propagation time (tp). To that effect, the relations of the initiation time-crack width and propagation time—rebar diameter were analyzed. The influences of crack width (w), cover width (C), and the rebar diameter (ϕ) on the durability of reinforced concrete were considered.
The influence of crack width on the initiation time and propagation time was analyzed (
Figure 10). The initiation time is significant influenced by the cover width. In the uncracked elements, the increment of cover width (
C = 3–7 cm) increases the initiation time up to 4 times. In the cracked elements, regardless of the cover width, the change from crack width (
w = 0–0.30 mm) significantly reduces the initiation time (up to 98%,
Figure 10a). In addition, the propagation time reduces 50% due to change the rebar diameter (
ϕ = 12.7–25.4 mm,
Figure 10b). On the other hand, as the cover width increment 20 mm, increases the propagation time by 34%.
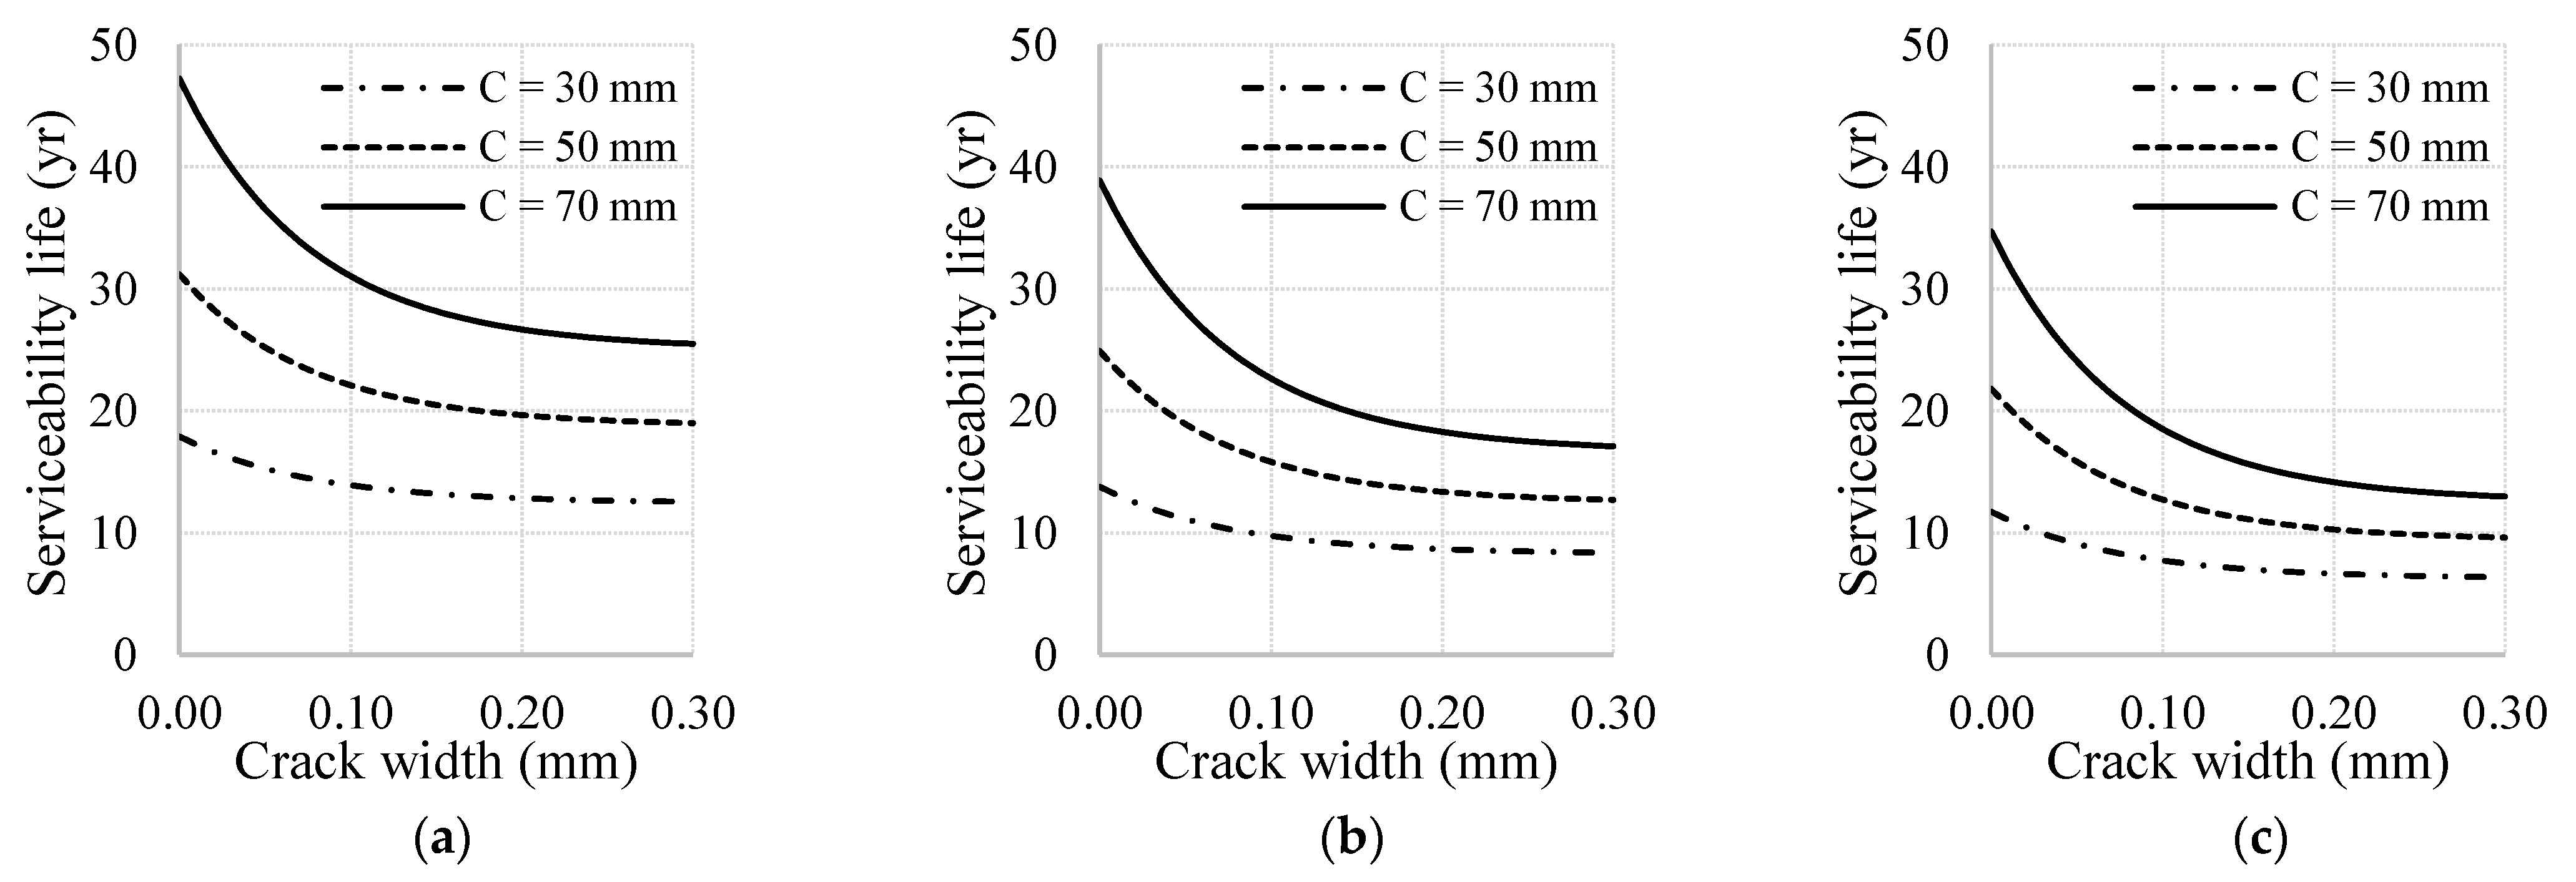
The influences of cover width (
C) and crack width (
w) on the service life of the structural element are studied (
Figure 11). In uncracked sections, a cover increment of 20 mm increases the service life by around 50%. In contrast, in cracked sections (
w = 0.30 mm), the service life increment is up to 34%. Therefore, the service life is reduced up to 36% due to crack width effect.
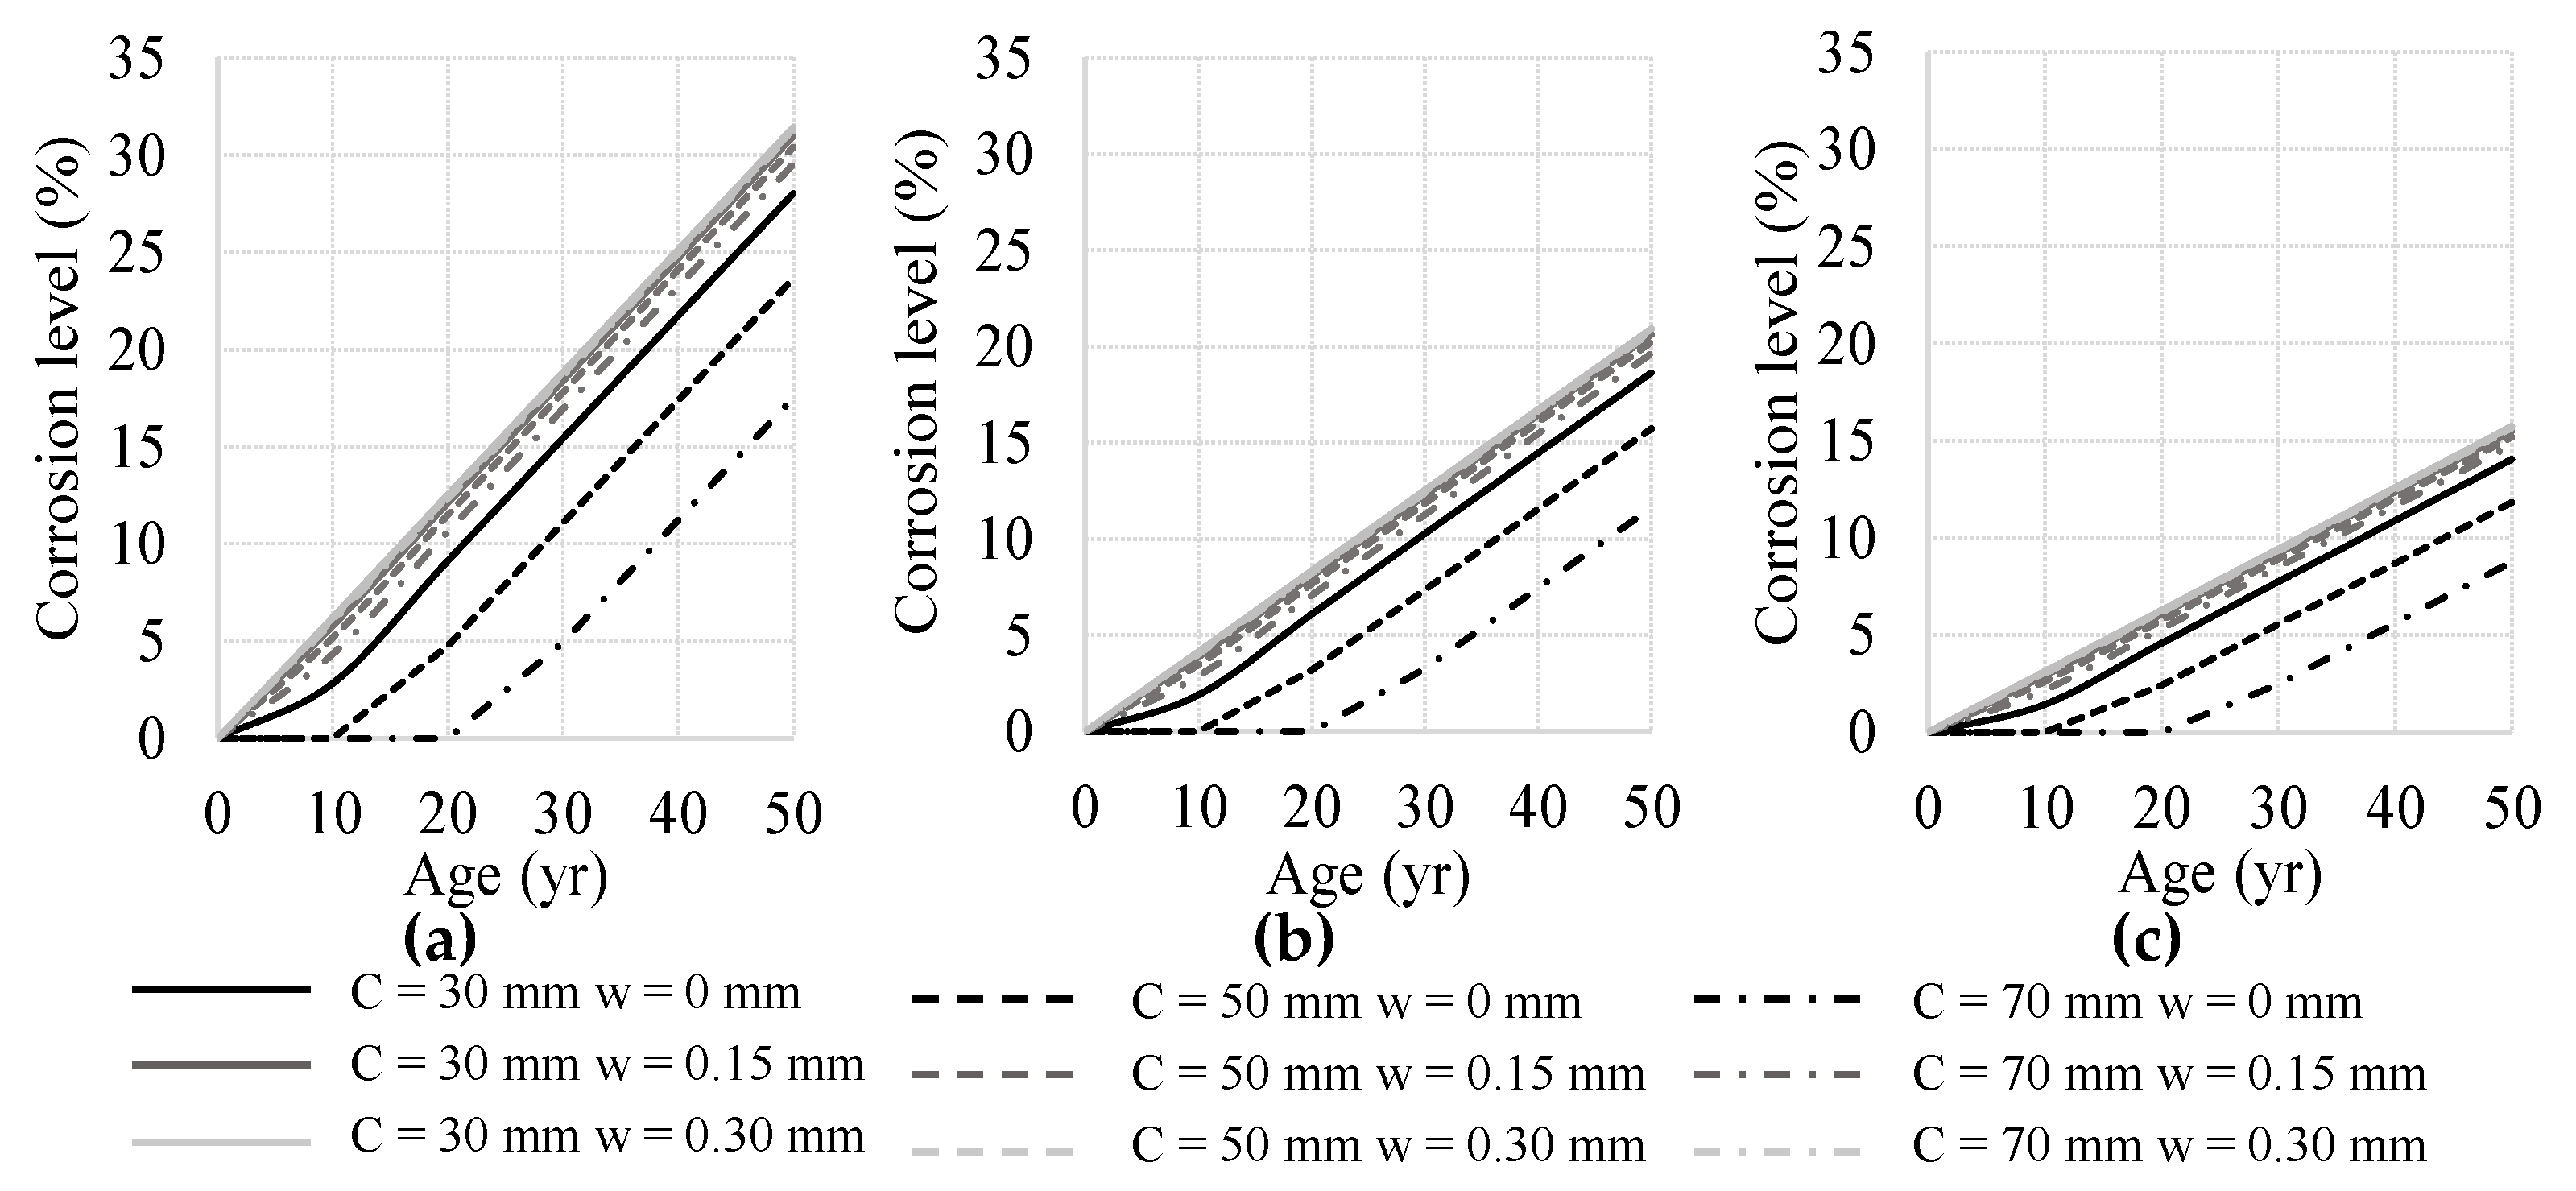
The corrosion level–crack width relation is evaluated in elements with different structure ages (
Figure 12). For the same section, the increment of rebar diameter (
ϕ = 12.7–25.4 mm) reduces the corrosion level up to 50% during its serviceability life. On the other hand, the corrosion level presents significant differences between uncracked and cracked sections by the increment of the cover width and the crack width. This is due to the relation between these parameters and initiation time. In 25 years, the uncracked sections reduce their corrosion level by up to 86%. In contrast, in the cracked sections with a crack width of 0.30 mm, the corrosion level is similar (differences lower than 2%). This difference is reduced to reach structure age of 30 years (differences lower than 8% with
w = 0.15). This is due to the corrosion protection provided by the cracked cover being negligible. Therefore, the maximum corrosion level is reached in the section with the lower rebar diameter (
ϕ = 12.7 mm) and a higher crack width (
w = 0.30 mm).
The initiation time depends on the concrete cover. Regardless of the width cover, the initiation time is significantly reduced (up to 98%) because of the crack with effect, event within its recommended range. It is due to the initiation time which was significantly reduced (up to 98%) because of the cracked cover. As a result, the serviceability life can reduce up to 62% (C = 7 cm).
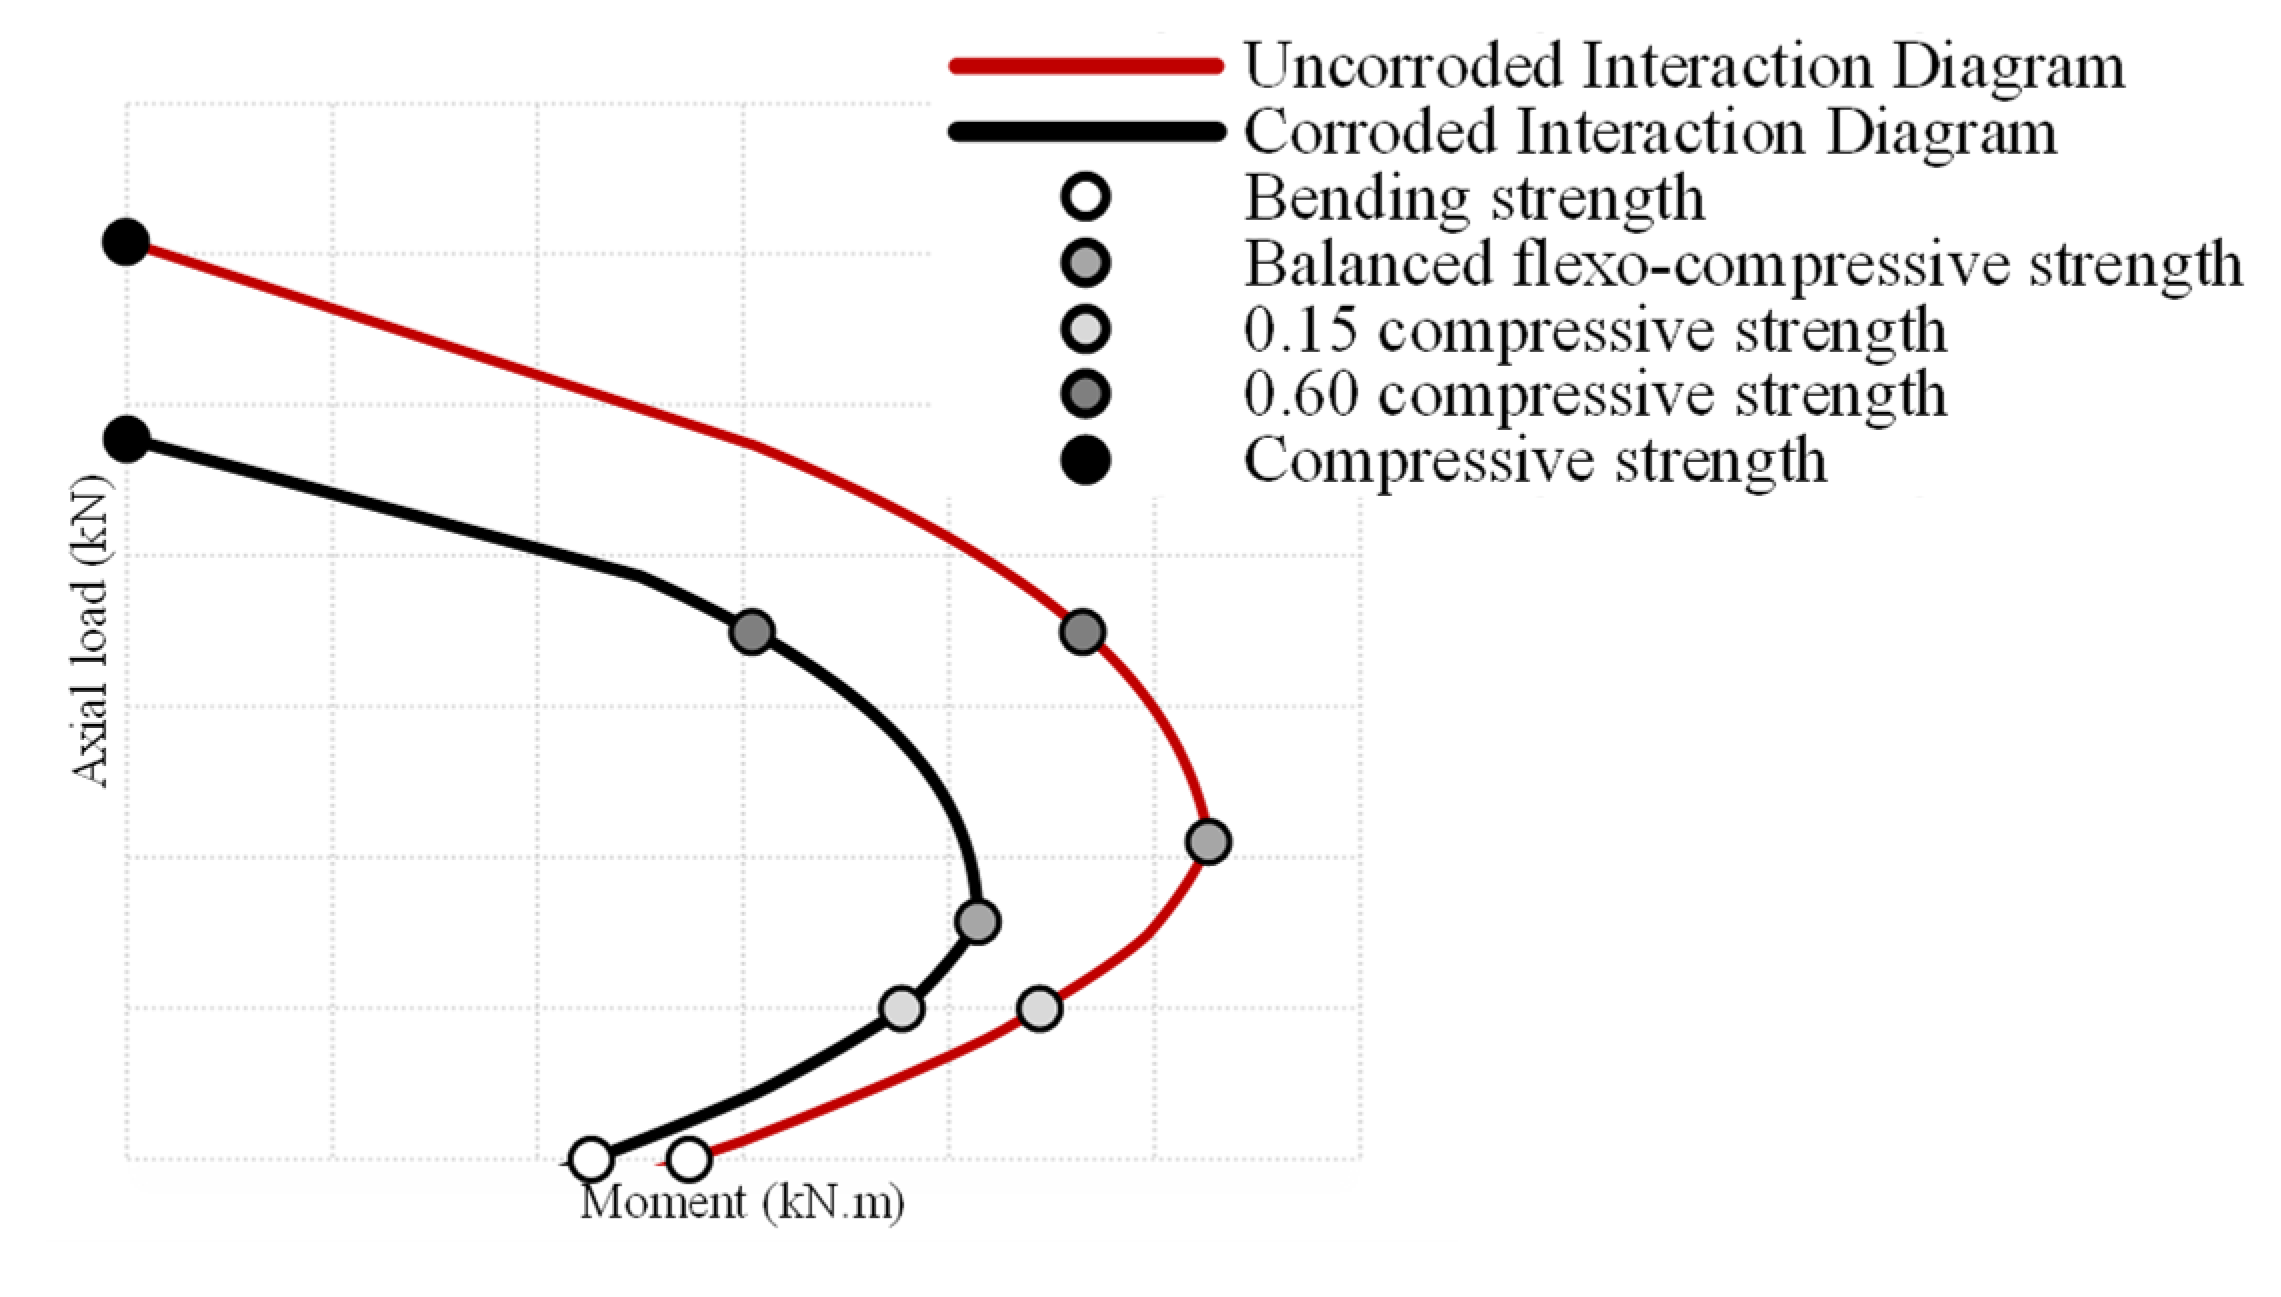
6. Corrosion Effects on Flexo-Compressive Strength
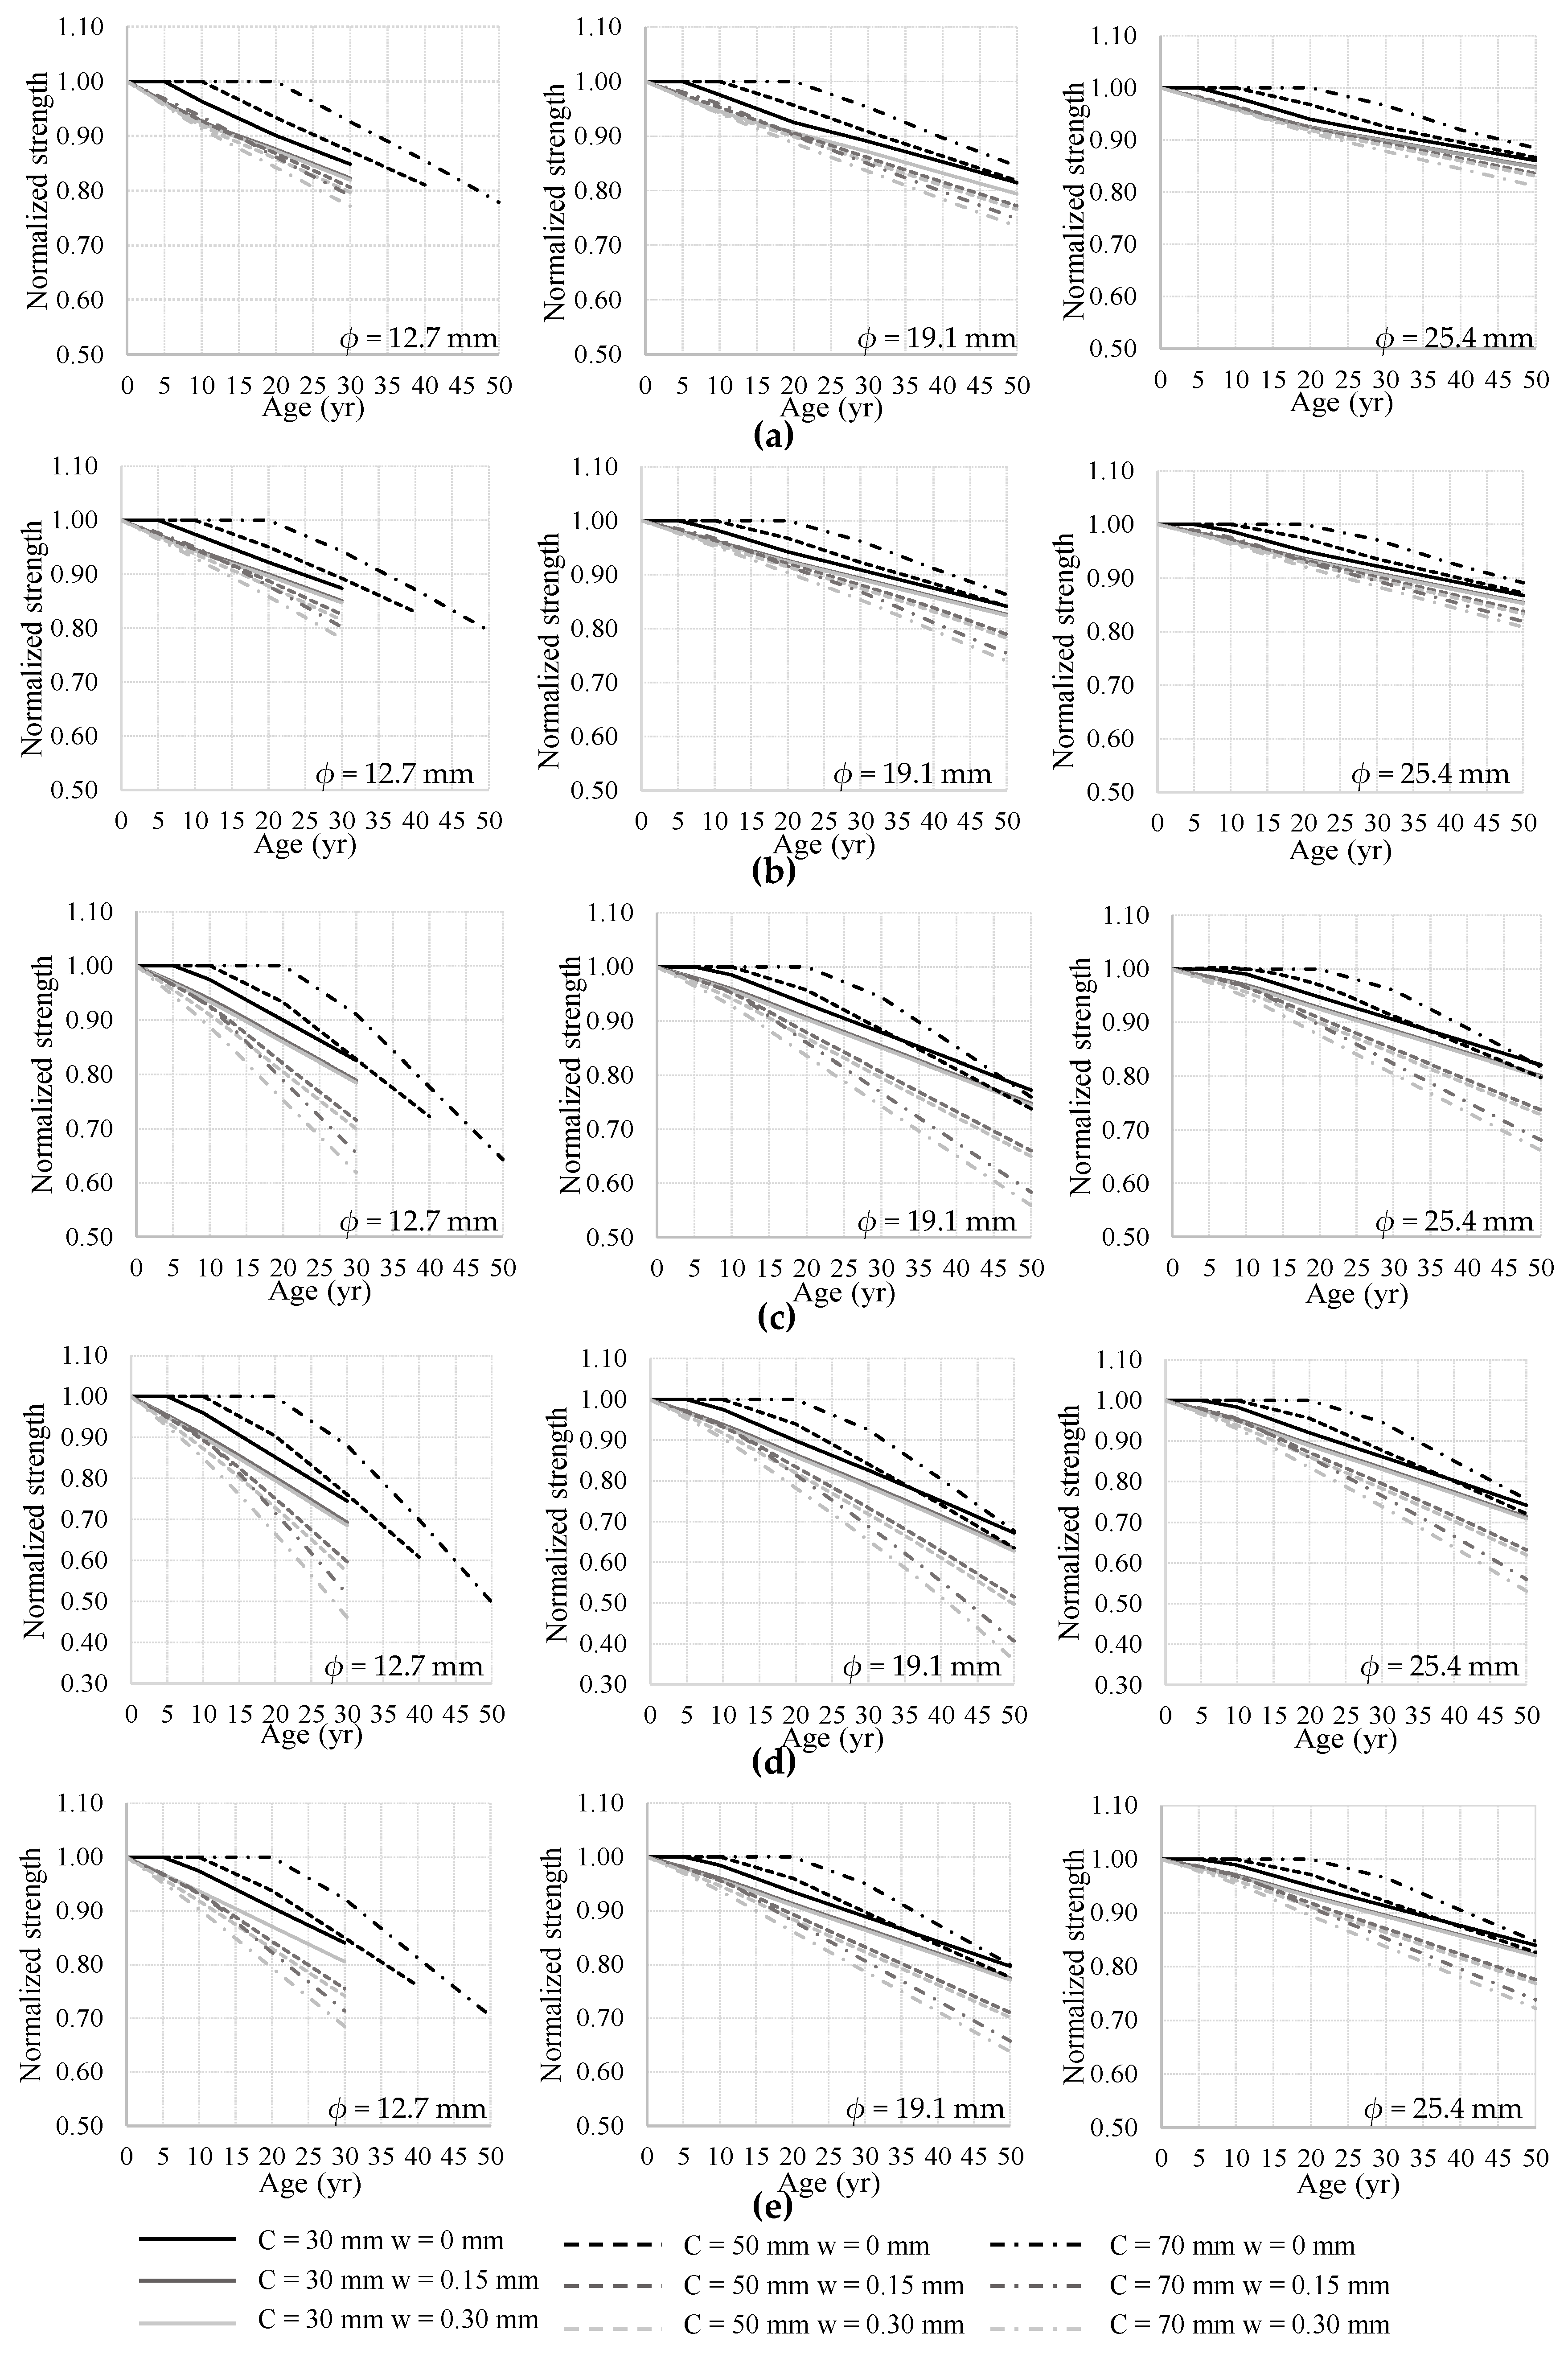
The strength degradation is analyzed within flexo-compression behavior: bending (B), flexo-compression with failure in tension (FCI), balanced flexo-compression (BFC), flexo-compression in compression (FCC), and compression (C,
Figure 13). To define the flexo-compressive strength in tension and compression, constant axial loads of 2000 (0.15 of compressive strength) and 7500 kN (0.60 of compressive strength) are considered. These axial loads produce that strengths were defined by the failure in tension or compression, respectively. The strength was not calculated when the corrosion level exceeds 20% which is the limit by the proposed methodology. The influences of structure age, concrete cover, and rebar diameter are taken into account. The strengths were normalized according to the element without corrosion.
In all the sections with the lowest cover width (30 mm), the corrosion level exceeds 20% at ages of 30 years (
Figure 14). In the sections with crack widths between 0.15 and 0.30 mm, the degradation strength shows a similar deterioration, since it has a similar corrosion level due to insignificant protection provided by cracked cover.
In cracked RC elements, the flexo-compressive strength decreases as soon as they are exposed to the environment, crack width and cover width (
w = 0.15–0.30 mm) have no significant effect on the strength deterioration (
Figure 15). This is because the deterioration of the reinforcement is activated as soon as the element is exposed (
Figure 14). In contrast, increasing the rebar diameter (
ϕ = 12.7–25.4 mm) reduces the strength deterioration up to 28%. This is a consequence of the reduction in the corrosion level up to 20% in larger rebar diameters.
In 25 years, the corrosion effects reduce the strength by up to 44 and 20% in cracked and uncracked sections, respectively. The crack width effect reduces the flexo-compressive strength up to 38% more, even though they are within the recommended limit to design (
Table 4). The deterioration effects can reduce up to 55% by incrementing of the rebar diameter or the cover width. Within flexo-compressive strength, when strength is defined by the compression, the decrement was worse (up to 1.46 times more). This is due to concrete cracking that is produced by the corrosion of reinforcing steel. On the other hand, the bending strength can decrease up to 12% by the effect of crack width. The increment of rebar diameter or the cover width can reduce up to 30% of the strength deterioration.
The crack widths recommended accelerate the deterioration of flexo-compressive strength. This is between 2 and 8% per year, depending on the rebar. The use of larger rebar diameters (ϕ from 12.7 to 25.4 mm) can reduce strength deterioration by up to 9% per year. In contrast, the cracked cover (w = 0.15 mm) showed an increase of less than 2% per year, despite increasing the cover width from 3 to 5 cm. This is due to the cracked cover showing a similar corrosion level for the same diameter, with no effect on the cover width. Ignoring the crack width effects can result in strength overestimation up to 44%.
7. Conclusions
In frame elements, the crack width (lesser than 0.30 mm) recommended for structural design can reduce their serviceability life by up to 62%. It was due to the initiation time depending on the concrete cover. Regardless of the width cover (3–7 cm), the initiation time was significantly reduced (up to 98%) because of the cracking effect.
In 25 years, the corrosion effects reduced the strength by up to 44 and 20% in cracked and uncracked elements, respectively. The maximum reduction in strength was within the flexo-compression in the compression domain (up to 1.46 times more), due to the concrete cracking that produced the corrosion. On the other hand, the residual strength was reduced up to 1.20 times more in cracked elements that were uncracked; even when the crack width was within the recommended range.
The crack widths recommended produced an accelerated deterioration in flexo-compressive strength by up to 8% per year. This deterioration presented insignificant changes in the cover width when the cover was cracked. The worst strength deterioration was reached in the section with the lower rebar diameter (12.7 mm).
Finally, the proposed methodology is a practical tool for calculating the residual strength of the frame element in the corrosion process. It considered the properties (cover width and concrete) of the column and its information relative to its current state (structure age and crack width) that influence the strength deterioration.
Author Contributions
Conceptualization, F.C. and D.B.; methodology, F.C. and D.B.; validation, S.M.-D.; formal analysis, A.C.; investigation, R.S.; data curation, A.V.; writing—original draft preparation, J.B.; writing—review and editing, S.M.-D.; visualization, R.S.; supervision, A.C. All authors have read and agreed to the published version of the manuscript.
Funding
This research received no external funding.
Data Availability Statement
Data are available from the authors.
Conflicts of Interest
The authors declare no conflict of interest.
References
- Sun, H.; Zou, H.; Li, X.; Memon, S.A.; Yuan, B.; Xing, F.; Zhang, X.; Ren, J. Combined Effects of Sulfate and Chloride Attack on Steel Reinforced Mortar under Drying–Immersion Cycles. Buildings 2022, 12, 1252. [Google Scholar] [CrossRef]
- Fuhaid, A.F.A.; Niaz, A. Carbonation and Corrosion Problems in Reinforced Concrete Structures. Buildings 2022, 12, 586. [Google Scholar] [CrossRef]
- Saetta, A.V.; Vitaliani, R.V. Experimental Investigation and Numerical Modeling of Carbonation Process in Reinforced Concrete Structures Part I: Theoretical Formulation. Cem. Concr. Res. 2004, 34, 571–579. [Google Scholar] [CrossRef]
- Firouzi, A.; Abdolhosseini, M.; Ayazian, R. Service Life Prediction of Corrosion-Affected Reinforced Concrete Columns Based on Time-Dependent Reliability Analysis. Eng. Fail. Anal. 2020, 117, 104944. [Google Scholar] [CrossRef]
- Zhang, X.; Wang, J.; Zhao, Y.; Tang, L.; Xing, F. Time-Dependent Probability Assessment for Chloride Induced Corrosion of RC Structures Using the Third-Moment Method. Constr. Build. Mater. 2015, 76, 232–244. [Google Scholar] [CrossRef]
- Balázs, G.L.; Bisch, P.; Borosnyõi, A.; Burdet, O.; Burns, C.; Ceroni, F.; Cervenka, V.; Chiorino, M.A.; Debernardi, P.; Eckfeldt, L.; et al. Design for SLS According to Fib Model Code 2010. Struct. Concr. 2013, 14, 99–123. [Google Scholar] [CrossRef]
- ACI 224R 224R-01; Control of Cracking in Concrete Structures. ACI, American Concrete Institute: Farmington Hills, MI, USA, 2001.
- UNE-EN 1992-1-1; Eurocode 2: Design of Concrete Structures—Part 1-1: General Rules and Rules for Buildings. UNE, Asociación Española de Normalización: Madrid, Spain, 2013.
- Torres, J.; Sánchez, J. Initiation Period of Corrosion by Chloride Ion in Cracked Concrete Structures. In Proceedings of the International RILEM Conference on Early-Age and Long-Term Cracking in RC Structures, Paris, France, 9 April 2021; Kanavaris, F., Benboudjema, F., Azenha, M., Eds.; Springer: Cham, Switzerland, 2021; pp. 115–126. [Google Scholar]
- van Orden, A.C.; Balasubramanian, R.; Carpio, J.J.; Cook, D.C.; Oh, S.J.; Reyes, J.; Townsend, H.E. Atmospheric Corrosion in Marine Environments along the Gulf of México; ASTM International: West Conshohocken, PA, USA, 2000. [Google Scholar]
- Bojórquez, J.; Ponce, S.; Ruiz, S.E.; Bojórquez, E.; Reyes-Salazar, A.; Barraza, M.; Chávez, R.; Valenzuela, F.; Leyva, H.; Baca, V. Structural Reliability of Reinforced Concrete Buildings under Earthquakes and Corrosion Effects. Eng. Struct. 2021, 237, 112161. [Google Scholar] [CrossRef]
- Crespi, P.; Zucca, M.; Valente, M. On the Collapse Evaluation of Existing RC Bridges Exposed to Corrosion under Horizontal Loads. Eng. Fail. Anal. 2020, 116, 104727. [Google Scholar] [CrossRef]
- Crespi, P.; Zucca, M.; Valente, M.; Longarini, N. Influence of Corrosion Effects on the Seismic Capacity of Existing RC Bridges. Eng. Fail. Anal. 2022, 140, 106546. [Google Scholar] [CrossRef]
- Hu, B.; Zhou, Y.; Xing, F.; Sui, L.; Luo, M. Experimental and Theoretical Investigation on the Hybrid CFRP-ECC Flexural Strengthening of RC Beams with Corroded Longitudinal Reinforcement. Eng. Struct. 2019, 200, 109717. [Google Scholar] [CrossRef]
- Zhou, Y.; Zheng, Y.; Sui, L.; Hu, B.; Huang, X. Study on the Flexural Performance of Hybrid-Reinforced Concrete Beams with a New Cathodic Protection System Subjected to Corrosion. Materials 2020, 13, 234. [Google Scholar] [CrossRef] [PubMed] [Green Version]
- Zhou, Y.; Gao, H.; Hu, Z.; Qiu, Y.; Guo, M.; Huang, X.; Hu, B. Ductile, Durable, and Reliable Alternative to FRP Bars for Reinforcing Seawater Sea-Sand Recycled Concrete Beams: Steel/FRP Composite Bars. Constr. Build. Mater. 2021, 269, 121264. [Google Scholar] [CrossRef]
- Zhou, Y.; Chen, X.; Wang, X.; Sui, L.; Huang, X.; Guo, M.; Hu, B. Seismic Performance of Large Rupture Strain FRP Retrofitted RC Columns with Corroded Steel Reinforcement. Eng. Struct. 2020, 216, 110744. [Google Scholar] [CrossRef]
- Shen, D.; Yang, Q.; Huang, C.; Cui, Z.; Zhang, J. Tests on Seismic Performance of Corroded Reinforced Concrete Shear Walls Repaired with Basalt Fiber-Reinforced Polymers. Constr. Build. Mater. 2019, 209, 508–521. [Google Scholar] [CrossRef]
- Shen, D.; Li, M.; Liu, C.; Kang, J.; Li, C.; Yang, J. Seismic Performance of Corroded Reinforced Concrete Beam-Column Joints Repaired with BFRP Sheets. Constr. Build. Mater. 2021, 307, 124731. [Google Scholar] [CrossRef]
- Lin, H.; Zhao, Y.; Yang, J.Q.; Feng, P.; Ozbolt, J.; Ye, H. Effects of the Corrosion of Main Bar and Stirrups on the Bond Behavior of Reinforcing Steel Bar. Constr. Build. Mater. 2019, 225, 13–28. [Google Scholar] [CrossRef]
- Moodi, Y.; Sohrabi, M.R.; Mousavi, S.R. Corrosion Effect of the Main Rebar and Stirrups on the Bond Strength of RC Beams. Structures 2021, 32, 1444–1454. [Google Scholar] [CrossRef]
- Wang, Q.; Xu, G.; Liang, G.L.; Wei, J. Research on Bending Resistance of Corroded RC Beams. Adv. Mat. Res. 2010, 163–167, 3292–3296. [Google Scholar] [CrossRef]
- Guo, X.; Wang, H.; Xie, K.; Shi, T.; Yu, D. Experimental and Numerical Study on the Influence of Corrosion Rate and Shear Span Ratio on Reinforced Concrete Beam. Adv. Mater. Sci. Eng. 2020, 2020, 4718960. [Google Scholar] [CrossRef]
- Yang, S.Y.; Song, X.B.; Jia, H.X.; Chen, X.; Liu, X. Experimental Research on Hysteretic Behaviors of Corroded Reinforced Concrete Columns with Different Maximum Amounts of Corrosion of Rebar. Constr. Build. Mater. 2016, 121, 319–327. [Google Scholar] [CrossRef]
- Yu, X.H.; Dai, K.Y.; Li, Y.S. Variability in Corrosion Damage Models and Its Effect on Seismic Collapse Fragility of Aging Reinforced Concrete Frames. Constr. Build. Mater. 2021, 295, 123654. [Google Scholar] [CrossRef]
- Carrera, J.; Carpio, F.; Salgado, R.; Márquez, S.; Barradas, J.; Carmona, A.; González, S.; Vargas, A. Influencia de La Corrosión Sobre El Índice de Vulnerabilidad Sísmica de Edificios Escolares de Concreto Reforzado. In Proceedings of the Meeting of the Mexican Section of the Electrochemical Society, Puebla, Mexico, 10–14 October 2022; Méndez, E., Cerna, J., Guerrero, C., Teutli, M., Cerro, M., Méndez, A., González, M., González, M., Eds.; Electrochemical Society: Puebla, Mexico, 2022; p. 307. [Google Scholar]
- Kashani, M.M.; Lowes, L.N.; Crewe, A.J.; Alexander, N.A. Finite Element Investigation of the Influence of Corrosion Pattern on Inelastic Buckling and Cyclic Response of Corroded Reinforcing Bars. Eng. Struct. 2014, 75, 113–125. [Google Scholar] [CrossRef]
- Lee, H.S.; Cho, Y.S. Evaluation of the Mechanical Properties of Steel Reinforcement Embedded in Concrete Specimen as a Function of the Degree of Reinforcement Corrosion. Int. J. Fract. 2009, 157, 81–88. [Google Scholar] [CrossRef]
- Shayanfar, M.A.; Barkhordari, M.A.; Ghanooni-Bagha, M. Effect of Longitudinal Rebar Corrosion on the Compressive Strength Reduction of Concrete in Reinforced Concrete Structure. Adv. Struct. Eng. 2016, 19, 897–907. [Google Scholar] [CrossRef]
- Xia, J.; Jin, W.-L.; Li, L.-Y. Performance of Corroded Reinforced Concrete Columns under the Action of Eccentric Loads. J. Mater. Civ. Eng. 2016, 28, 04015087. [Google Scholar] [CrossRef]
- Tapan, M.; Aboutaha, R.S. Effect of Steel Corrosion and Loss of Concrete Cover on Strength of Deteriorated RC Columns. Constr. Build. Mater. 2011, 25, 2596–2603. [Google Scholar] [CrossRef]
- Campione, G.; Cannella, F.; Minafò, G. A Simple Model for the Calculation of the Axial Load-Carrying Capacity of Corroded RC Columns. Mater. Struct./Mater. Constr. 2016, 49, 1935–1945. [Google Scholar] [CrossRef]
- Campione, G.; Cannella, F.; Cavaleri, L.; Ferrotto, M.F. Moment-Axial Force Domain of Corroded R.C. Columns. Mater. Struct./Mater. Constr. 2017, 50, 21. [Google Scholar] [CrossRef]
- Kashani, M.M.; Lowes, L.N.; Crewe, A.J.; Alexander, N.A. Phenomenological Hysteretic Model for Corroded Reinforcing Bars Including Inelastic Buckling and Low-Cycle Fatigue Degradation. Comput. Struct. 2015, 156, 58–71. [Google Scholar] [CrossRef] [Green Version]
- EHE-08; Instrucción de Hormigón Estructural. 4th ed. de Publicaciones, C.; Técnica, S.G.; De Fomento, M. (Eds.) Ministerio de Fomento, Gobierno de España: Madrid, Spain, 2010.
- NTC-DCEC; Normas Técnicas Complementarias Para Diseño y Construcción de Estructuras de Concreto. Gaceta del Gobierno de la Ciudad de México: Mexico City, Mexico, 2021.
- Wang, X.H.; Liang, F.Y. Performance of RC Columns with Partial Length Corrosion. Nucl. Eng. Des. 2008, 238, 3194–3202. [Google Scholar] [CrossRef]
| Publisher’s Note: MDPI stays neutral with regard to jurisdictional claims in published maps and institutional affiliations. |
© 2022 by the authors. Licensee MDPI, Basel, Switzerland. This article is an open access article distributed under the terms and conditions of the Creative Commons Attribution (CC BY) license (https://creativecommons.org/licenses/by/4.0/).


 ,
, 


