Article

Structural Design Optimization of Flat Slab Hospital Buildings Using Genetic Algorithms

Construction and Building Engineering Department, College of Engineering and Technology, Arab Academy for Science, Technology and Maritime Transport (AASTMT), B 2401 Smart Village, Giza 12577, Egypt
*
Author to whom correspondence should be addressed.
Buildings 2022, 12(12), 2195; https://doi.org/10.3390/buildings12122195
Submission received: 7 November 2022 / Revised: 6 December 2022 / Accepted: 9 December 2022 / Published: 12 December 2022
(This article belongs to the Special Issue Safety and Optimization of Building Structures)

Abstract

:
The construction costs of hospital buildings are relatively high due to the need to fulfill their complex functions and avoid mishaps. In this context, this study aims to minimize the total construction costs of hospitals while still satisfying the special architectural, practical, and structural requirements specified by design codes. To this end, 48 design alternatives with two floor systems (flat slabs with and without drop panels), three column spacings, and eight concrete grades were optimized using genetic algorithms provided by Palisade Evolver. The objective function included the materials and labor costs per square meter of the floor plan. The decision variables involved the concrete dimensions and steel bars of floors and columns. The hospital buildings were subjected to gravity, earthquake, and wind loads to thoroughly examine the realistic loading conditions. The design was performed in accordance with the Egyptian code for the design and construction of concrete structures and the Egyptian guidelines for hospitals and healthcare facilities. The results revealed that using low-strength concrete, and flat slabs without drop panels could achieve the best design. The slab thickness had a governing impact on the total cost of both floor systems.

Graphical Abstract

1. Introduction

Hospitals are the core asset for efficient and functioning healthcare systems that provide exemplary medical services and patient care [1,2]. Many studies have discussed and developed various methods to enhance the quality of healthcare buildings from different viewpoints. Generally, the construction of hospitals involves a high degree of complexity to fulfill the multiple configurations imposed by international standards [3,4]. The recent global pandemics such as COVID-19 exposed the unreadiness of healthcare organizations for critical events, switching their scope to increasing the number of facilities and hospitals to face future breakouts [5].
Some studies have analyzed the patients’ perspectives on the care service aspects, such as interpersonal and interaction skills [3,4], patient expectations, waiting time [3,5], medical care quality [6,7], and emotional support [8,9]. Because these studies overlooked the integration of care services and the facilities’ design, Zhao et al. [10] explored the opinions and perspectives of outpatients on the critical hospital design factors.
Recent studies have examined the quality of healthcare buildings from the energy demand and environmental impact perspectives [1,11,12,13]. Ma et al. investigated the effect of climate change on the energy demands of Australian hospitals constructed with the current design specifications. They used DesignBuilder to simulate the performance of single-story and multi-story hospitals in 10 different locations in Australia. Liu et al. [12] employed a set of data analysis methods to evaluate the monthly electricity data of an Australian benchmark hospital. The hospital’s energy consumption was obtained for 2030–2090 based on the forecasted future climate data using different scenarios. Mejía et al. [11] evaluated the thermal energy demand in modern Spanish hospitals, considering the envelope design in terms of external heat flow.
Few studies have employed effective optimization techniques to acquire specific objectives regarding the quality of hospitals. Andersen et al. [14] used Markov chain modeling and a local search heuristic to optimize patient admission and bed resource redistribution to achieve minimum overcrowding and enhance patient flow. Helm and Oyen [15] developed a mixed-integer programming Poisson-arrival-location model to optimize strategic planning and scheduling per staff capacity and hospital admission schedule.
Despite the efforts of these researchers to enhance the quality of hospitals, little attention has been paid to the optimization of hospitals from the structural perspective. Fortunately, the existing literature has sufficiently covered the structural optimization of other buildings, such as residential buildings [16,17] and office buildings [18,19]. Furthermore, parametric studies have been conducted for such buildings to predict the best configuration of span lengths and material grades that achieve structural safety and minimum cost [19,20,21]. However, the functions of the buildings in these studies were restricted to domestic usage. Furthermore, these buildings were subjected to gravity loads only, disregarding the realistic effects of lateral loads.
The current study aims to address the literature gap by minimizing the direct construction costs of hospitals, considering the crucial criteria regarding safety and serviceability for such buildings. The effects of lateral stresses resulting from earthquakes and wind were considered in the optimal sizing of the structural elements to overcome the limitations in the reported literature. The optimization was performed using genetic algorithms (GA) provided by Palisade Evolver. The control parameters of GA were tuned to specify the best combination of parameters in terms of cost and computational effort.
Reinforced concrete flat slab buildings were chosen for their availability, versatility, and ease of construction. Two alternative structural systems were considered for the construction of hospitals: flat slabs with drops (FSWD) and flat plates (FP). The effects of eight concrete compressive strengths (25–60 MPa) on the optimal results were investigated. The structural design was conducted per the Egyptian design code of practice (ECP 203-2020) [22] and the Egyptian code for calculating loads (ECL 201-2019) [23].
The economic allocation of rooms is paramount because it affects a hospital’s construction expenses. Thus, we studied the effects of three column spacing variants that fulfill the desired functions of hospitals based on the special architectural and practical requirements derived from the Egyptian guidelines for hospitals and healthcare facilities (EGH 360-2010) [24]. Eventually, guidelines were developed to help designers minimize the cost of hospital buildings.

2. Optimization Algorithm

Evolver, an add-in developed by Palisade for Microsoft Excel, was used to perform the cost optimization process. It uses an innovative genetic algorithm (GA) and an Opt-Quest engine to quickly solve any problem that can be modeled in Excel. During the optimization process, Evolver adjusts the decision variables predefined by the user, and the design that simultaneously achieves the objective and meets the tight constraints is sought.
GA mimics the Darwinian principles of natural selection by creating a medium where hundreds of possible solutions to a specific problem compete, and only the best survive. As in biological evolution, each individual can pass on their good genes through breeding and, eventually, better generations of individuals are developed.
Evolver has a ranking-based mechanism known as the steady-state approach that allows a single organism to be replaced instead of the whole generation. Hence, the least-fitted organism is excluded from the competition to reproduce new organisms. Evolver has control parameters that influence how GA converges on the optimal solution. These parameters are provided as options for the user to select their values from the Engine tab in the setting dialog box. The control parameters are defined as follows:
  • Initial seed
Initial seed is a field assigned to the algorithm’s random number generator. If this field is set to a fixed integer value, the same solution will be produced if the initial decision variables are the same; otherwise, random solutions could be obtained if the field value is set to Automatic.
2.
Population size
Population size refers to the number of complete sets of organisms to keep in memory at a specific time. Evolver allows the user to choose a population size between 2 and 32,767 members. Generally, the selection of the population size depends on the problem size. A larger population is recommended as the problem becomes more complex, resulting in more computational effort and time.
3.
Crossover rate
Crossover rate refers to the possibility that subsequent scenarios or organisms will have a combination of data from the previous generation of parent organisms. Evolver allows the user to choose a crossover rate between 0.01 and 1.
4.
Mutation rate
Mutation rate reflects the probability that the positions of some variables in the organism will be swapped. Evolver allows the user to choose a mutation rate between 0 and
5.
Operators
Operators represent exclusive selectable genetic operators available in Evolver. The operators include linear operators, Cauchy mutation, arithmetic crossover, heuristic crossover, and non-uniform mutation. If the user checks all the operators, Evolver selects the appropriate ones for optimization based on the complexity of the problem.
Previous studies have used Evolver’s GA to find the optimal cost for various problems in the construction sector [25,26,27]. These studies demonstrated the robustness of the algorithm. However, their presented solutions were based on trial-and-error attempts, disregarding the effects of the GA control parameters on the optimal solution. In the current study, the major GA control parameters (i.e., population size, crossover rate, and mutation rate) were fine-tuned, and the effects of each one on the computational effort and accuracy of results are discussed. Here, we applied the tuning methodology to a single-story residential building. The main input parameters of the design problem are presented in Table 1. The unit rates of materials were based on the monthly bulletin’s prices in April 2022. The initial seed was set to generate random decision variables each time Evolver ran. All GA operators were selected, and the progress-stopping condition when two criteria were reached together was: (i) number of trials = 5000 and (ii) change in the target value does not exceed 0.1%. Figure 1 summarizes the procedures of Evolver’s GA to obtain the optimal solution.
The optimization process was repeated 20 times for all of the control parameters, and each mean optimal cost was plotted against its corresponding parameter. Furthermore, the variance percentage was computed for each set of runs to determine how slight the standard deviation was compared to the mean cost.

3. Optimized Building

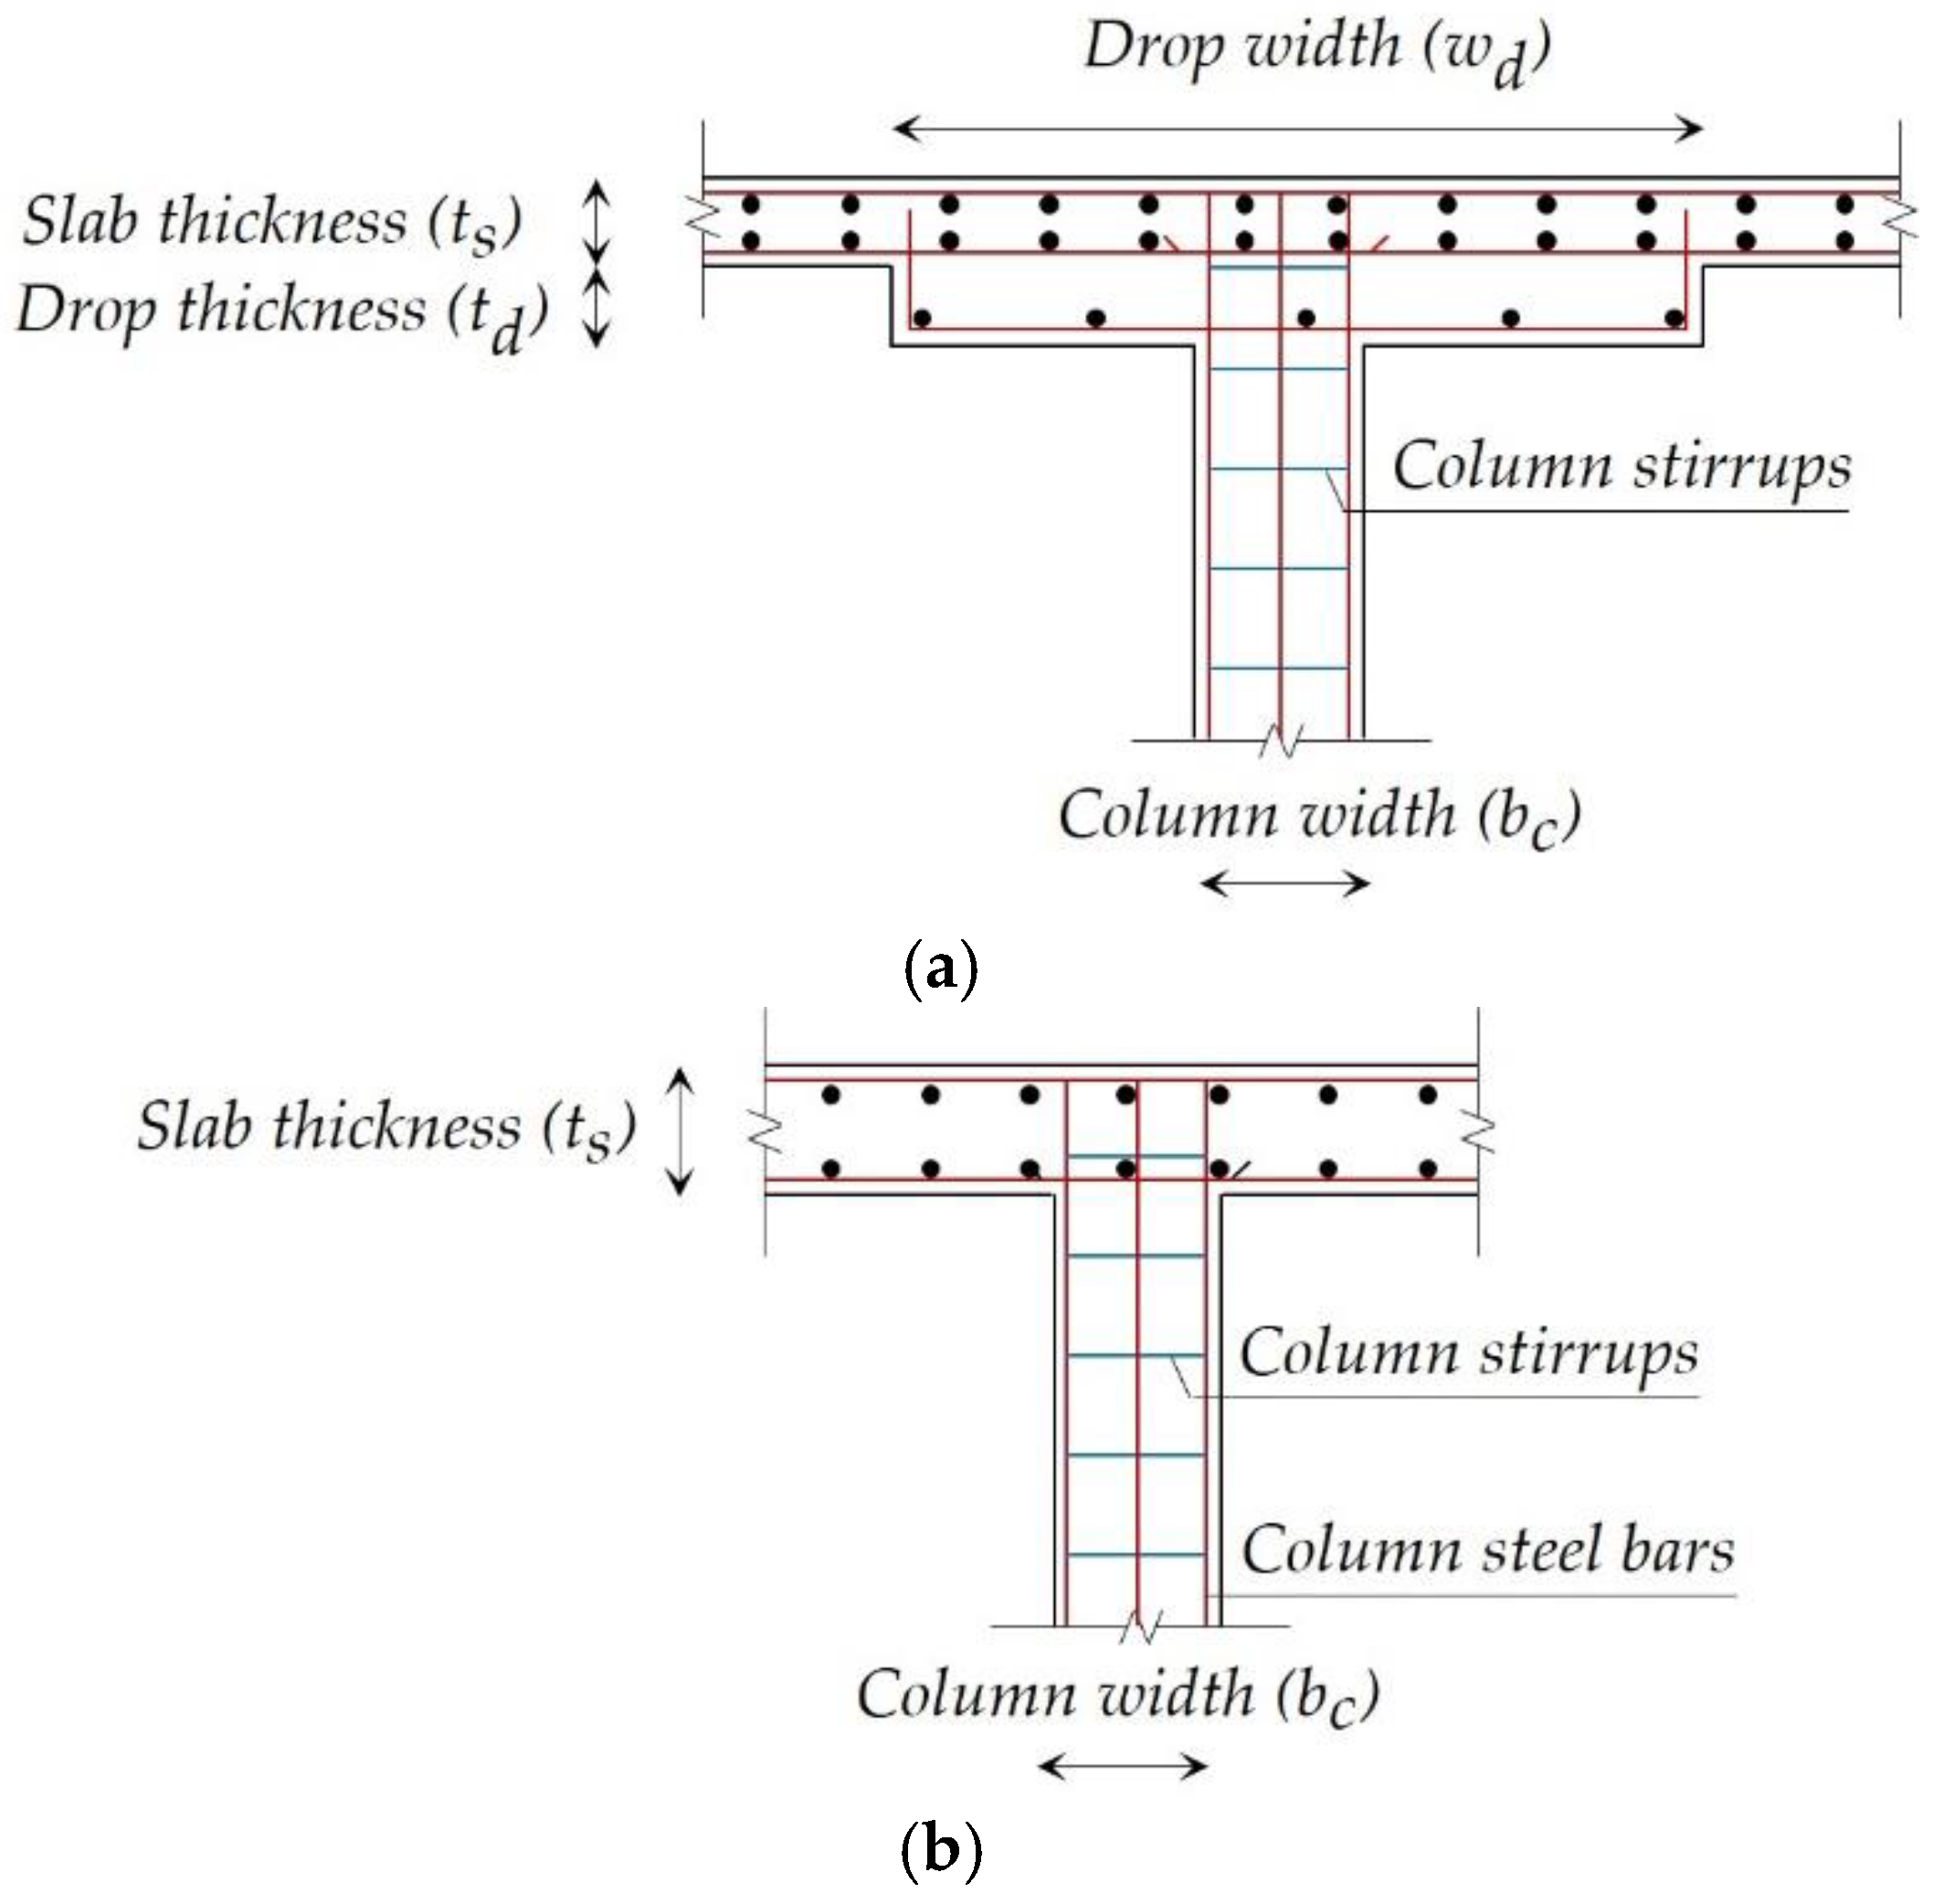
3.1. Geometrical Considerations

Generally, hospitals are separated into distinct divisions for various functions, such as patient care, social and administrative services, and waste management. There are also academic and research facilities alongside residential communities in some instances. These zones are geographically adjacent yet administratively distinct. Maintaining maximum adaptability and uninterrupted traffic flow across all divisions requires keeping horizontal and vertical distances between departments to a minimum. Based on the intended patient load, hospitals can be classified as either basic provision hospitals (with up to 240 beds), regular provision hospitals (with up to 520 beds), or main hospitals (with up to 800 beds) [28].
As part of the design process, a space allocation plan must be created based on the principles of modular coordination of divisions; this will serve as the foundation for the hospital’s layout and functional needs. The size of each division may be roughly estimated using the area guideline values provided by design experts [28]. These guideline values are only suggestions and may vary depending on the availability of specialized resources at a particular medical facility. For hospitals, the recommended modular arrangement is 1.2 m (i.e., all divisions should be multiples of 1.2 m) [28,29]. This modular dimension incorporates and matches all building elements, shortens the construction time, and eases the exchange of finishing elements. Column spacings of 7.2 m or 7.8 m are recommended to facilitate the incorporation of the numerous departments [28]. Smaller structural grids, such as 3.6 m × 7.2 m could be viable only if rooms with large areas, such as operating theatres (40 m2), are not present. However, this study considers the availability of large rooms in its practical considerations.
Table 2 summarizes the main geometrical constraints for the layouts of hospital buildings based on the regulations of the EGH 360-2010 [24]. The current study’s layout plan was based on the targeted hospital’s bed capacity (250 beds). Each bed requires a gross area of 80 m2. Accordingly, the total area needed for the hospital’s floors was 20,000 m2. To satisfy the total area requirement, we considered an eight-story hospital building with a square plan layout having a side length of 50.4 m. Hence, the total area of the floor layouts was 20,321 m2. The story height was 4.5 m to cover all the service and MEP installations.
The column spacing in each direction of the building should satisfy the recommended layout divisions and gross area requirements presented in Table 2, while still achieving the modular arrangement (1.2 m). Thus, three column spacing alternatives were introduced: (i) 7.2 m × 7.2 m, (ii) 7.2 m × 8.4 m, and (iii) 8.4 m × 8.4 m. These alternatives were chosen to meet the functional requirements of various divisions in public hospitals. Figure 2 illustrates the plan layout scheme for the considered hospital building and shows the possible functional divisions.

3.2. Design Procedures

Generally, to ease the routing of service installations, projected beams are not preferred. Thus, flat slab buildings were chosen due to the absence of beams, considering two systems: flat slabs with drops (FSWD) and flat plates (FP). The assigned loads on the floor slabs were calculated in compliance with the ECL 201-2019. The imposed floor covering and live loads for hospital buildings are 1.5 kPa and 4 kPa per square meter, respectively.
The design procedures of the flat slabs were conducted using the empirical direct design method provided by ECP 203-2020. The structural analysis and design calculations were performed using Microsoft Excel 365. First, a set of constraints imposed by ECP 203-2020 was checked for use of the direct design method.
-
The building must have a regular plan layout;
-
The minimum number of bays in each direction is three;
-
The ratio of the longer span to the shorter span shall not exceed 1.3;
-
The maximum difference between the spans in a particular direction shall not exceed 10%.
The chosen set of column spacings in the present study satisfies the geometrical requirements of the design code. According to the direct design method, the floors’ uniform loads (i.e., dead and live loads) are calculated, and the total statical moment in each direction is computed based on the assigned loads. Then, the total moment in each direction is distributed to the critical sections of the column and middle strips with defined proportions. The column strip width equals the drop panel width in the case of FSWD, and it is half the shorter span in the case of FP. The middle strip width is the difference between the span in the direction under consideration and the column strip. Eventually, the floor loads are transmitted to the columns using the area method. Figure 3 depicts the considered strips for each floor system.
The building was designed to resist the lateral stimulants resulting from wind and seismic loads per ECL 201-2019. In the present study, the geographical location of the building was assumed to be in Cairo, Egypt. First, the coefficient of wind pressure C e acting on the outer surface of the building is obtained, based on the geometrical properties of the building. The basic wind pressure q was calculated as per Equation (1).
q = 0.5 ρ v 2 C T C s
where ρ is the air density, v is the wind velocity in the building’s location, C T is the coefficient of topography, and C s is the structural factor.
The coefficient of wind exposure K was obtained at different heights based on the zone category imposed by ECL 201-2019. Subsequently, the exterior wind pressures and resultant wind forces were calculated as presented in Figure 4.
Hospital buildings are prone to being affected by seismic loads due to their relatively heavy medical equipment and large live loads. Thus, it is essential to ensure the safety and functionality of the building during seismic tremors. The simplified model response spectrum method provided by ECL 201-2019 was used to evaluate the effects of earthquakes.
The fundamental time period T 1 of the building is calculated using the following equation:
T 1 = C t H 3 / 4
where C t is a factor that depends on the structural system type and construction materials, and H is the total height of the building. The soil was classified as type C based on the seismic impact zone. The elastic response spectrum limits ( T b and T c ) and the specific value for the starting displacement of the spectrum were calculated based on the soil type. Subsequently, the elastic-design response spectrum was developed (Figure 5).
According to Figure 5, the design response spectrum S d T 1 is defined by Equation (3).
S d T 1 = a g γ 1 s 2.5 R T c T 1
where a g is the ground motion acceleration, γ 1 is a factor that depends on the importance category of the building, s is a factor that depends on the soil type, and R is the response modification factor. Here, a g was taken as 15% of the gravitational acceleration g (9.81 m/s2) based on Egypt’s earthquake zone.
The ultimate base shear force F b was calculated as per Equation (4):
F b = S d T 1 λ w / g
where λ is a correction factor and w is the total design weight of the building. The lateral forces are then distributed to each story based on the following equation:
F i = z i W i j = 1 n z j   W j F b
where F i is the force applied on the i-th story, z i and z j are the heights from the top of the foundations to the specified story, W i and   W j are the total weights of the specified stories, and n is the total number of stories. Figure 6 shows the distribution of earthquake loads in each story.
According to ECP 203-2020, the ultimate design load U of the elements subjected to wind and seismic loads must meet all of the load combinations presented in Equations (6)–(9):
U = max U 1 ,   U 2 ,   U 3
U 1 = 0.8 1.4 D + 1.6 L + 1.6 W
U 2 = 1.12 D + α L + S
U 3 = 1.4 D + 1.6 L
where U 1 , U 2 , and U 3 are the ultimate design loads corresponding to the wind, seismic, and gravity load combinations, respectively; D, L, W, and S are the dead, live, wind, and earthquake loads, respectively; α is the coefficient for live loads under seismic conditions. Table 3 summarizes the values of the parameters involved in the calculations of the lateral combinations for the current study.

3.3. Safety and Serviceability Criteria

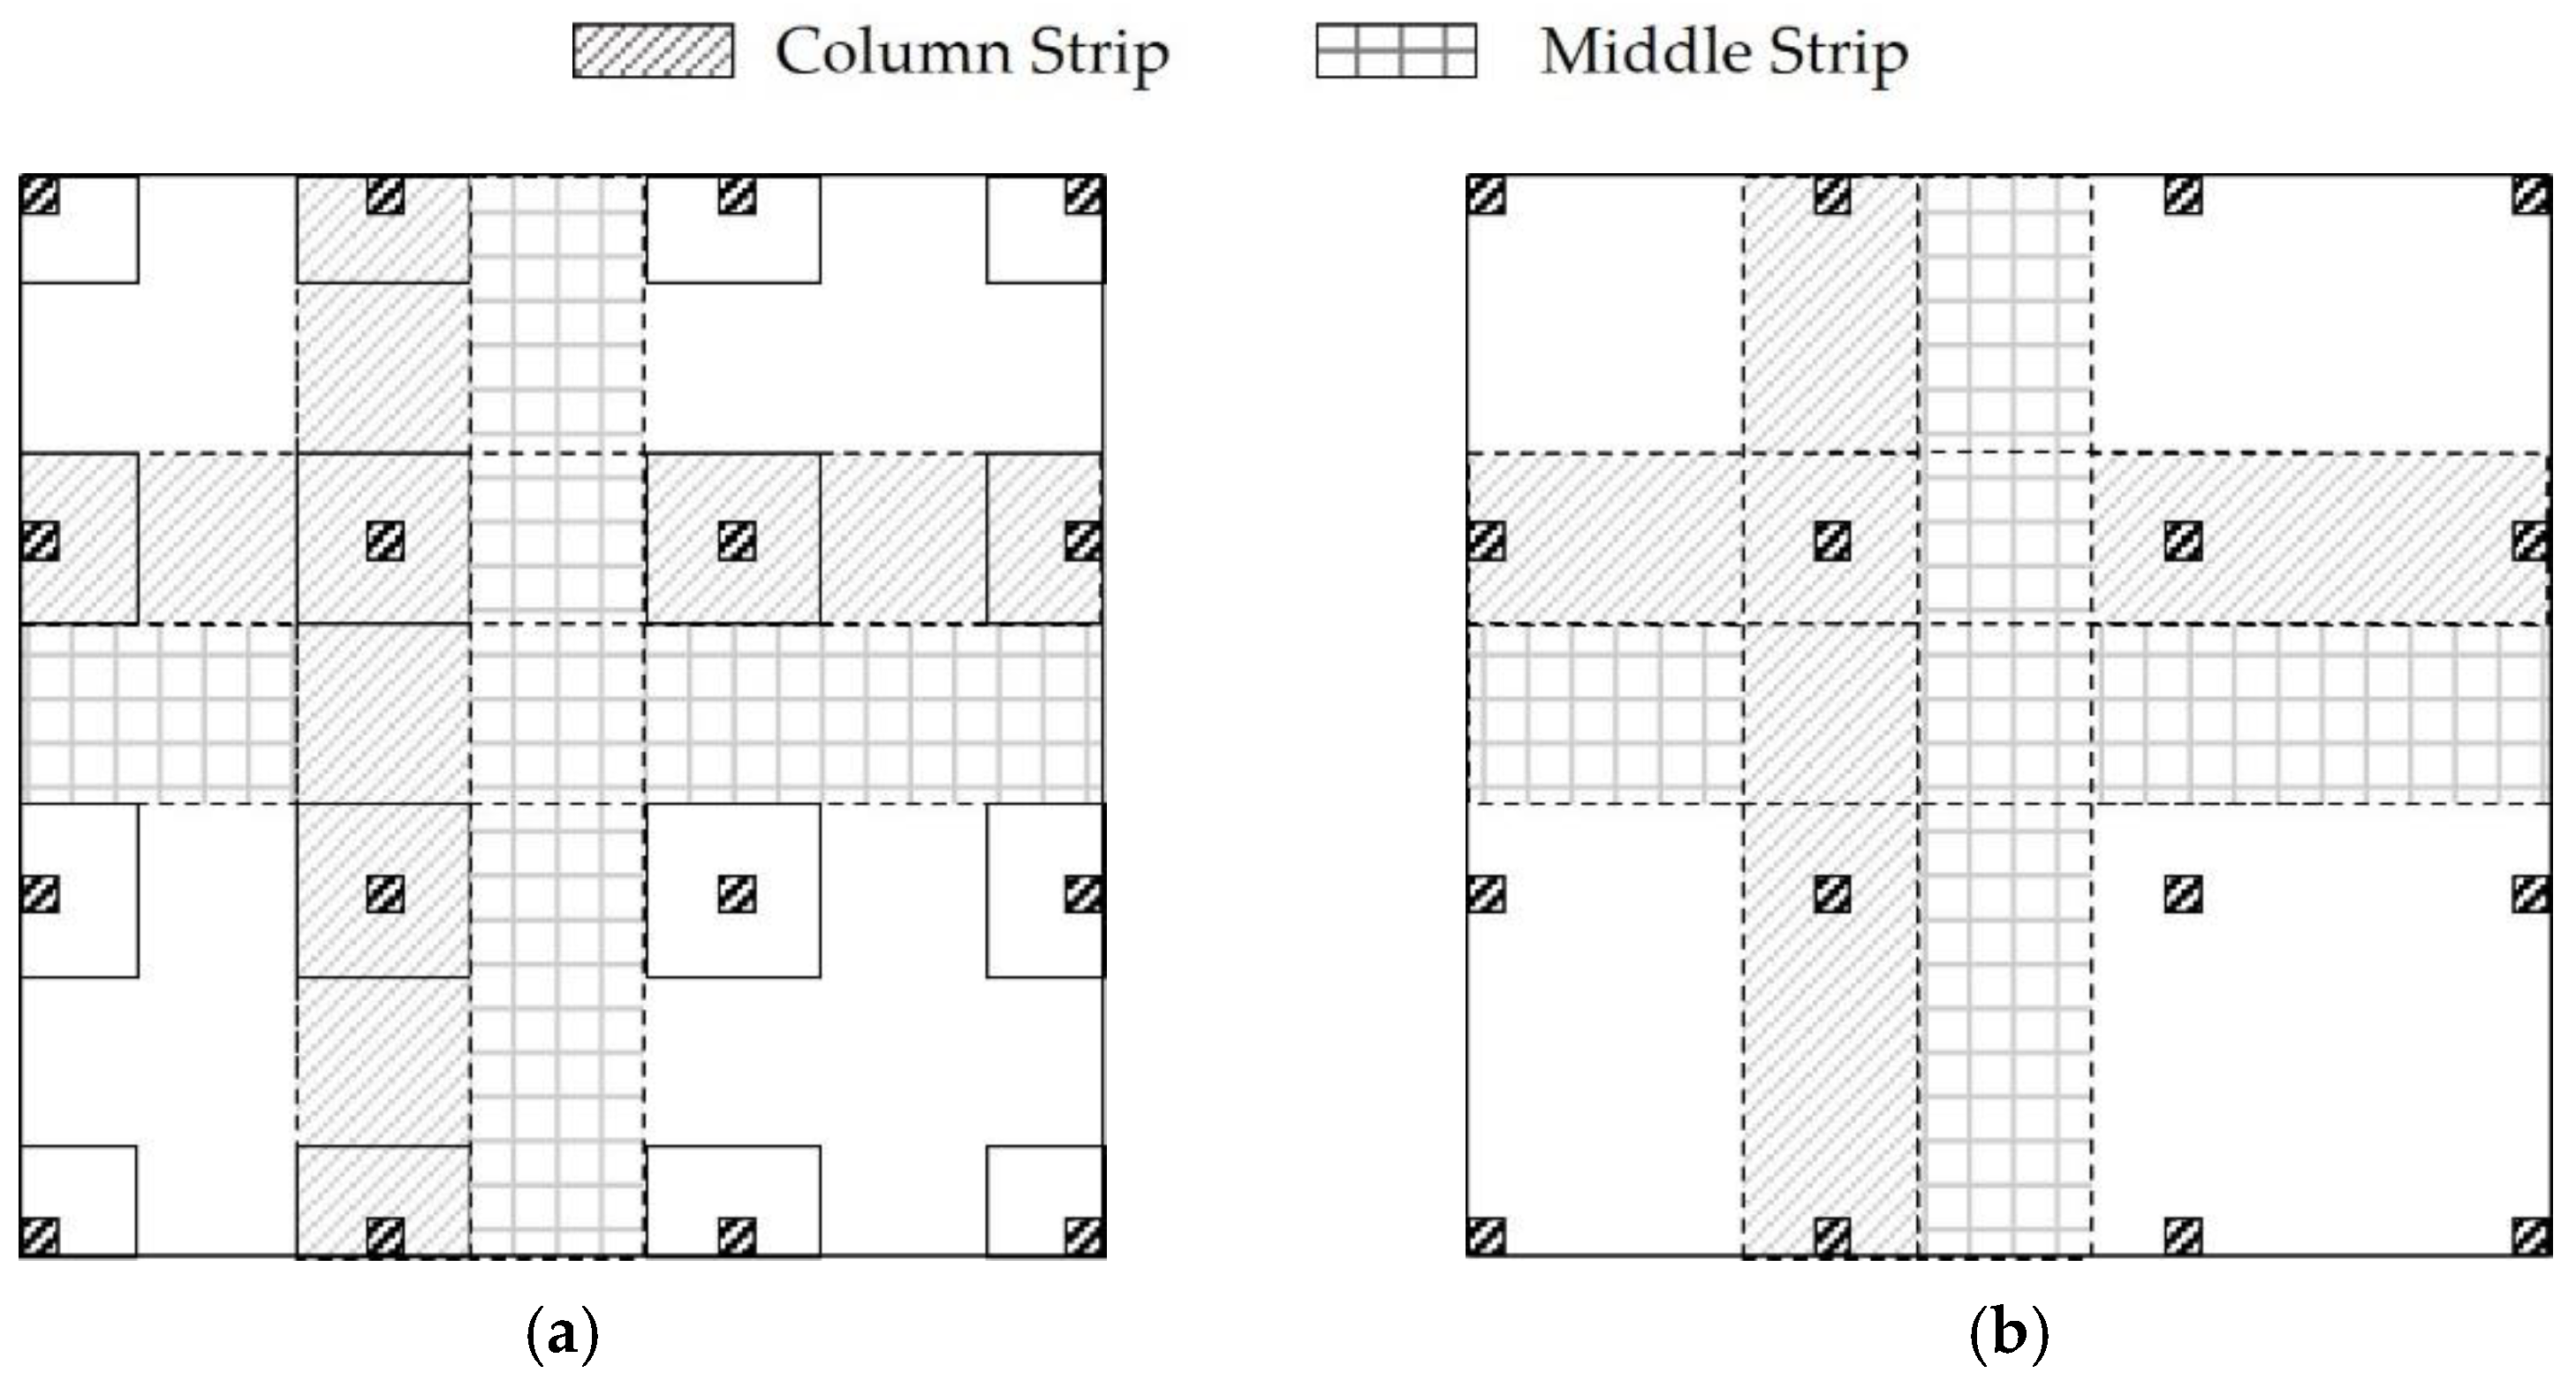
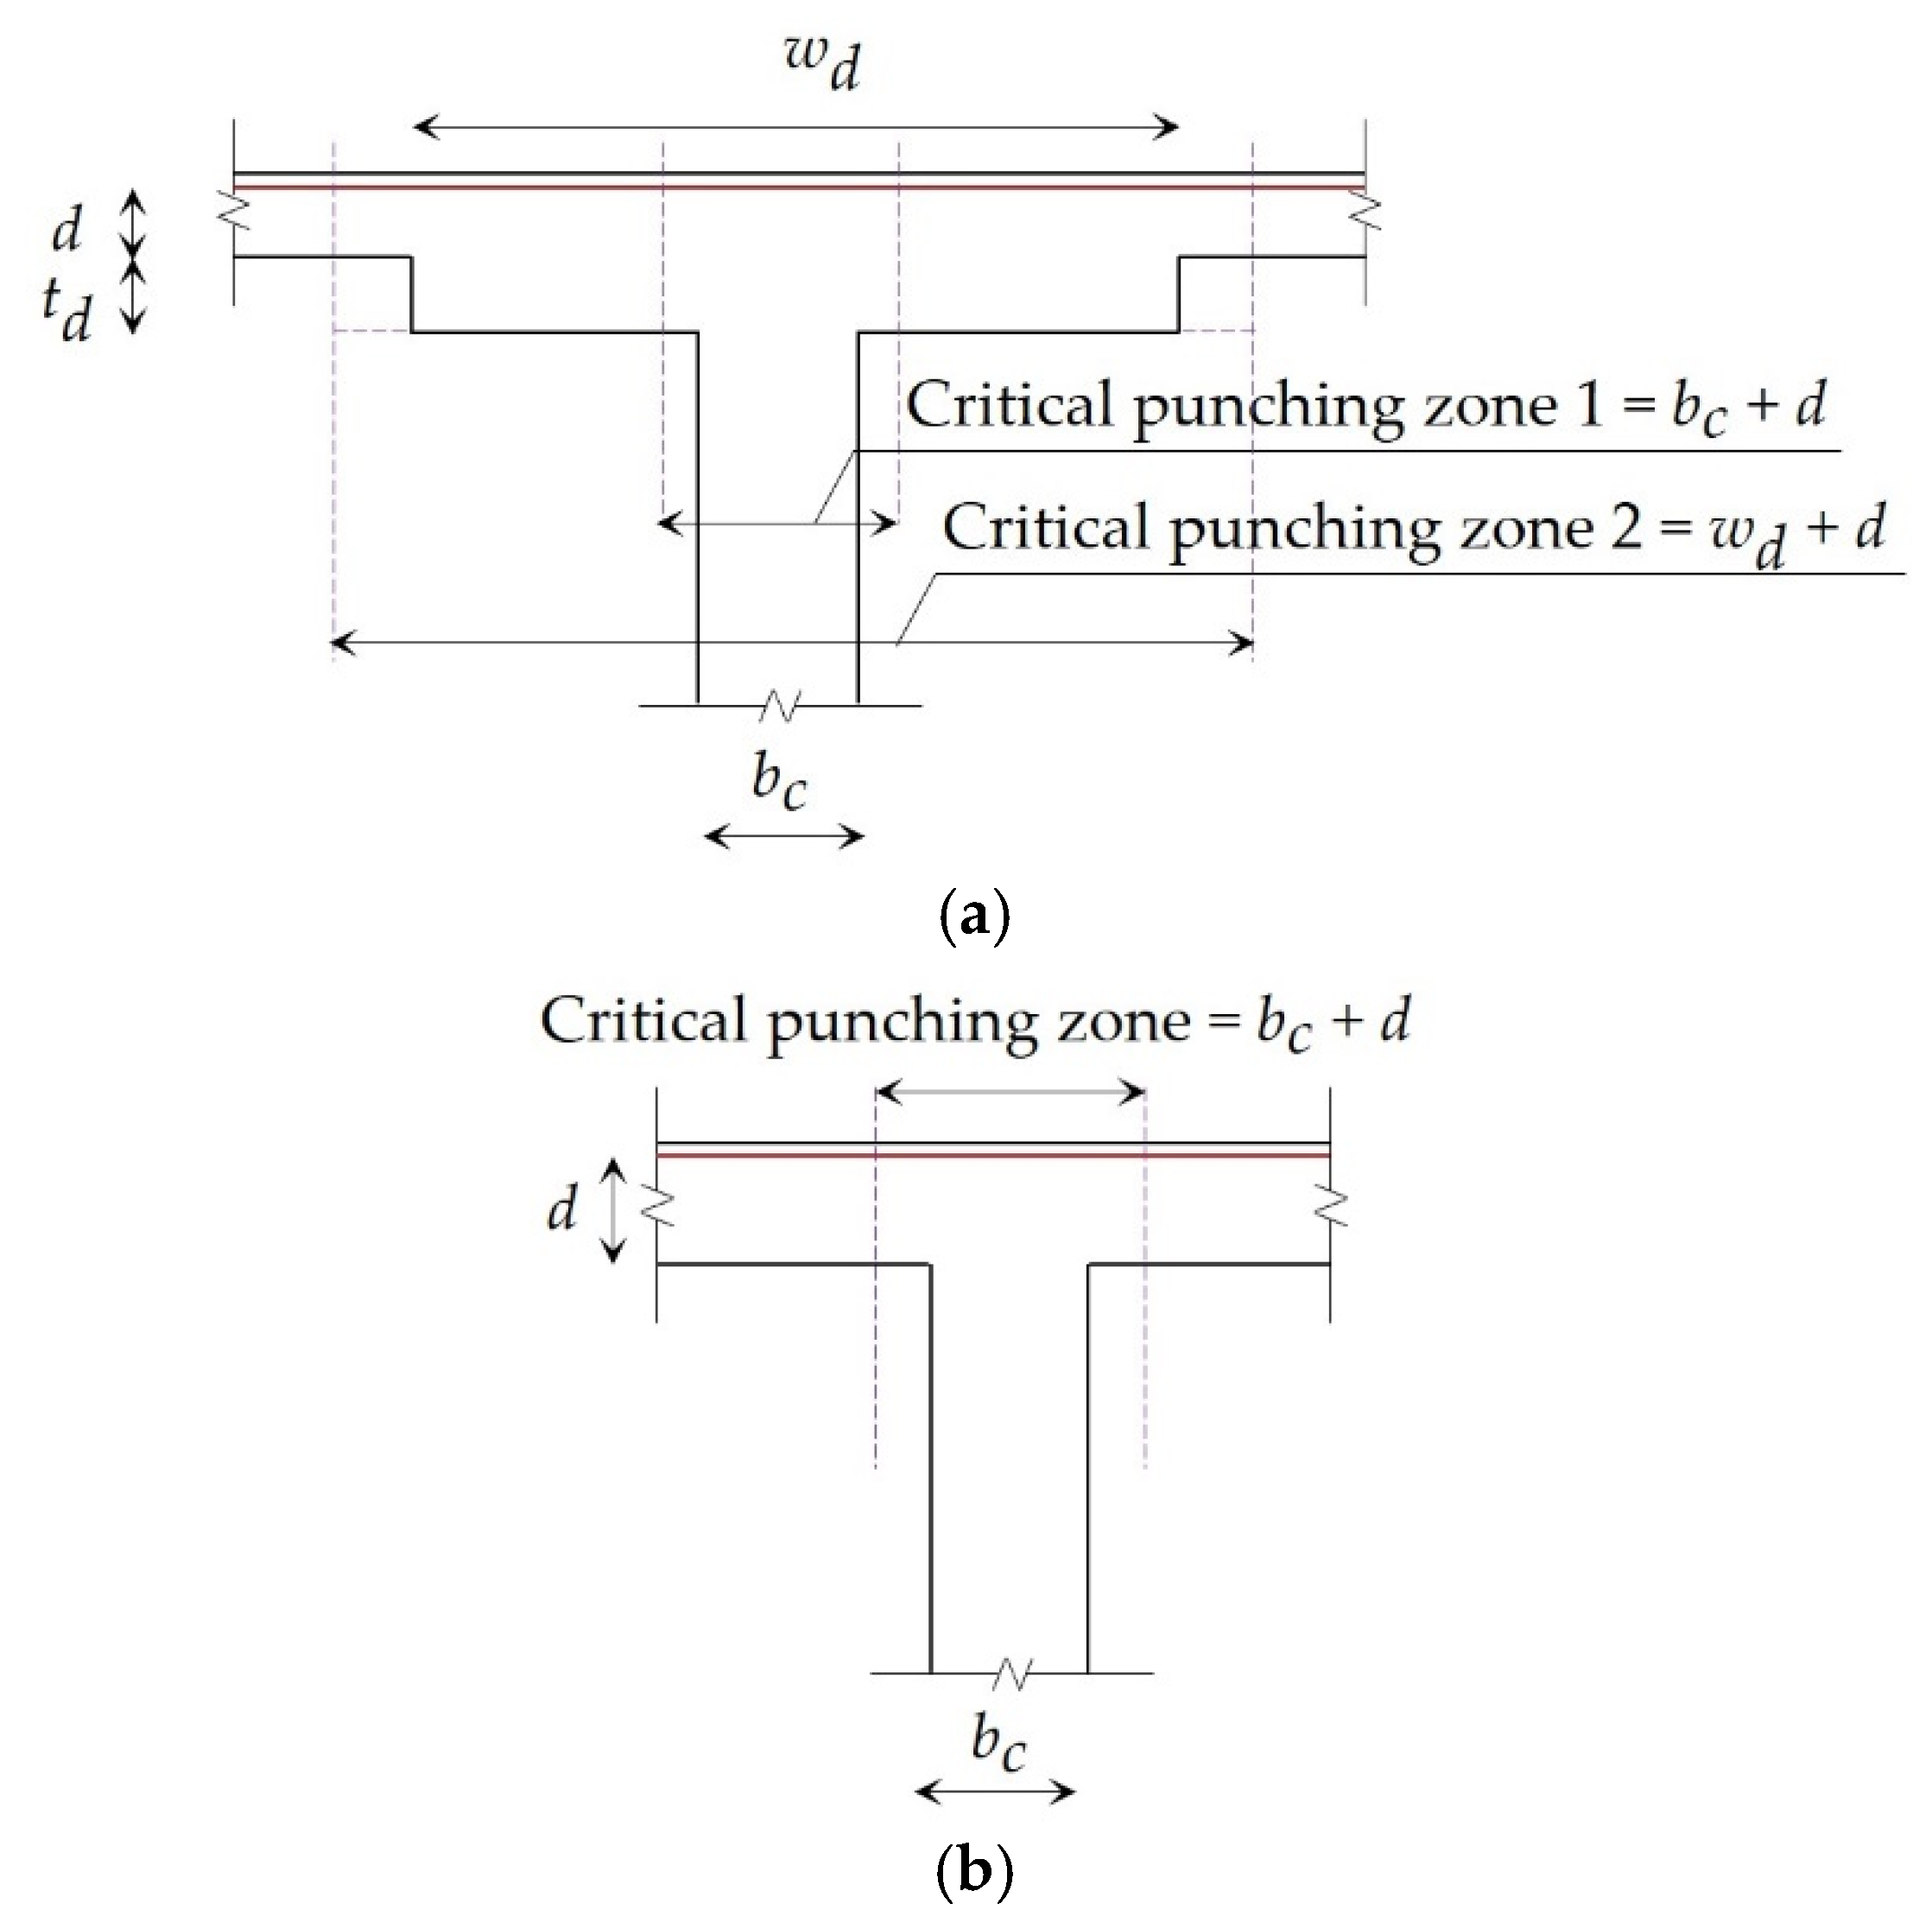
3.3.1. Punching Stresses

Punching shear strength is one of the crucial safety aspects that largely controls the flat slab thickness. ECP 203-2020 provides a simplified analysis method to calculate the punching shear stresses resulting from gravitational loads and moments that are transferred to columns due to torsion. For regular flat plates, the critical section for punching shear is located at a distance d/2 from the external column face, where d is the effective slab depth. If drop panels exist, two critical sections shall be investigated. Figure 7 depicts the critical punching shear zones for column–slab interactions.
The design punching shear stress q c at any column–slab connection is computed using Equation (10):
q c = Q β b o d
where Q is the ultimate design shear force, β is a magnification factor to account for the unbalanced moments transferred to columns, and b o is the critical punching perimeter. To ensure the safety of the slab against punching stresses, q c , for all columns, must not exceed the concrete’s nominal punching strength q c , u , as presented in Equation (11).
q c , u = Minimum   of   1.7   Mpa 0.316 α d b o + 0.2 f cu γ c 0.316 f cu γ c
where α is a coefficient based on the column location, f cu is the characteristic compressive strength of concrete, and γ c is the safety reduction factor of concrete.

3.3.2. Deflection

Reinforced concrete structural elements that are subjected to flexure must be designed to have adequate stiffness to limit deflections that adversely affect their strength and serviceability. Immediate deflections were computed using the theory of elasticity. As the applied gravitational loads exceed the tensile flexural capacity of concrete M cr , cracks develop at the midspan of the slabs. Accordingly, the moment of inertia decreases, resulting in a significant reduction in the slab’s stiffness. The effective moment of inertia I e of the flat slab was obtained using Equation (12) to consider the impact of cracks at different sections:
I e = M cr M a 3 I g + 1 - M cr M a 3 I cr
where M a is the applied bending moment and I g is the gross moment of inertia for the uncracked sections.
The immediate deflection was computed at the midspans of the uniformly-loaded slabs. The deflection increases in the long-term as it ages. According to ECP 203-2020, the long-term deflection Δ l must be checked as a serviceability requirement. Δ l was calculated by considering the effects of creep as follows:
Δ l = Δ dl + Δ ll + Δ c
where Δ dl , Δ ll , and Δ c are the deflections resulting from the dead loads, live loads, and creep, respectively. Here, Δ c is twice Δ dl , as recommended by ECP 203-2020.

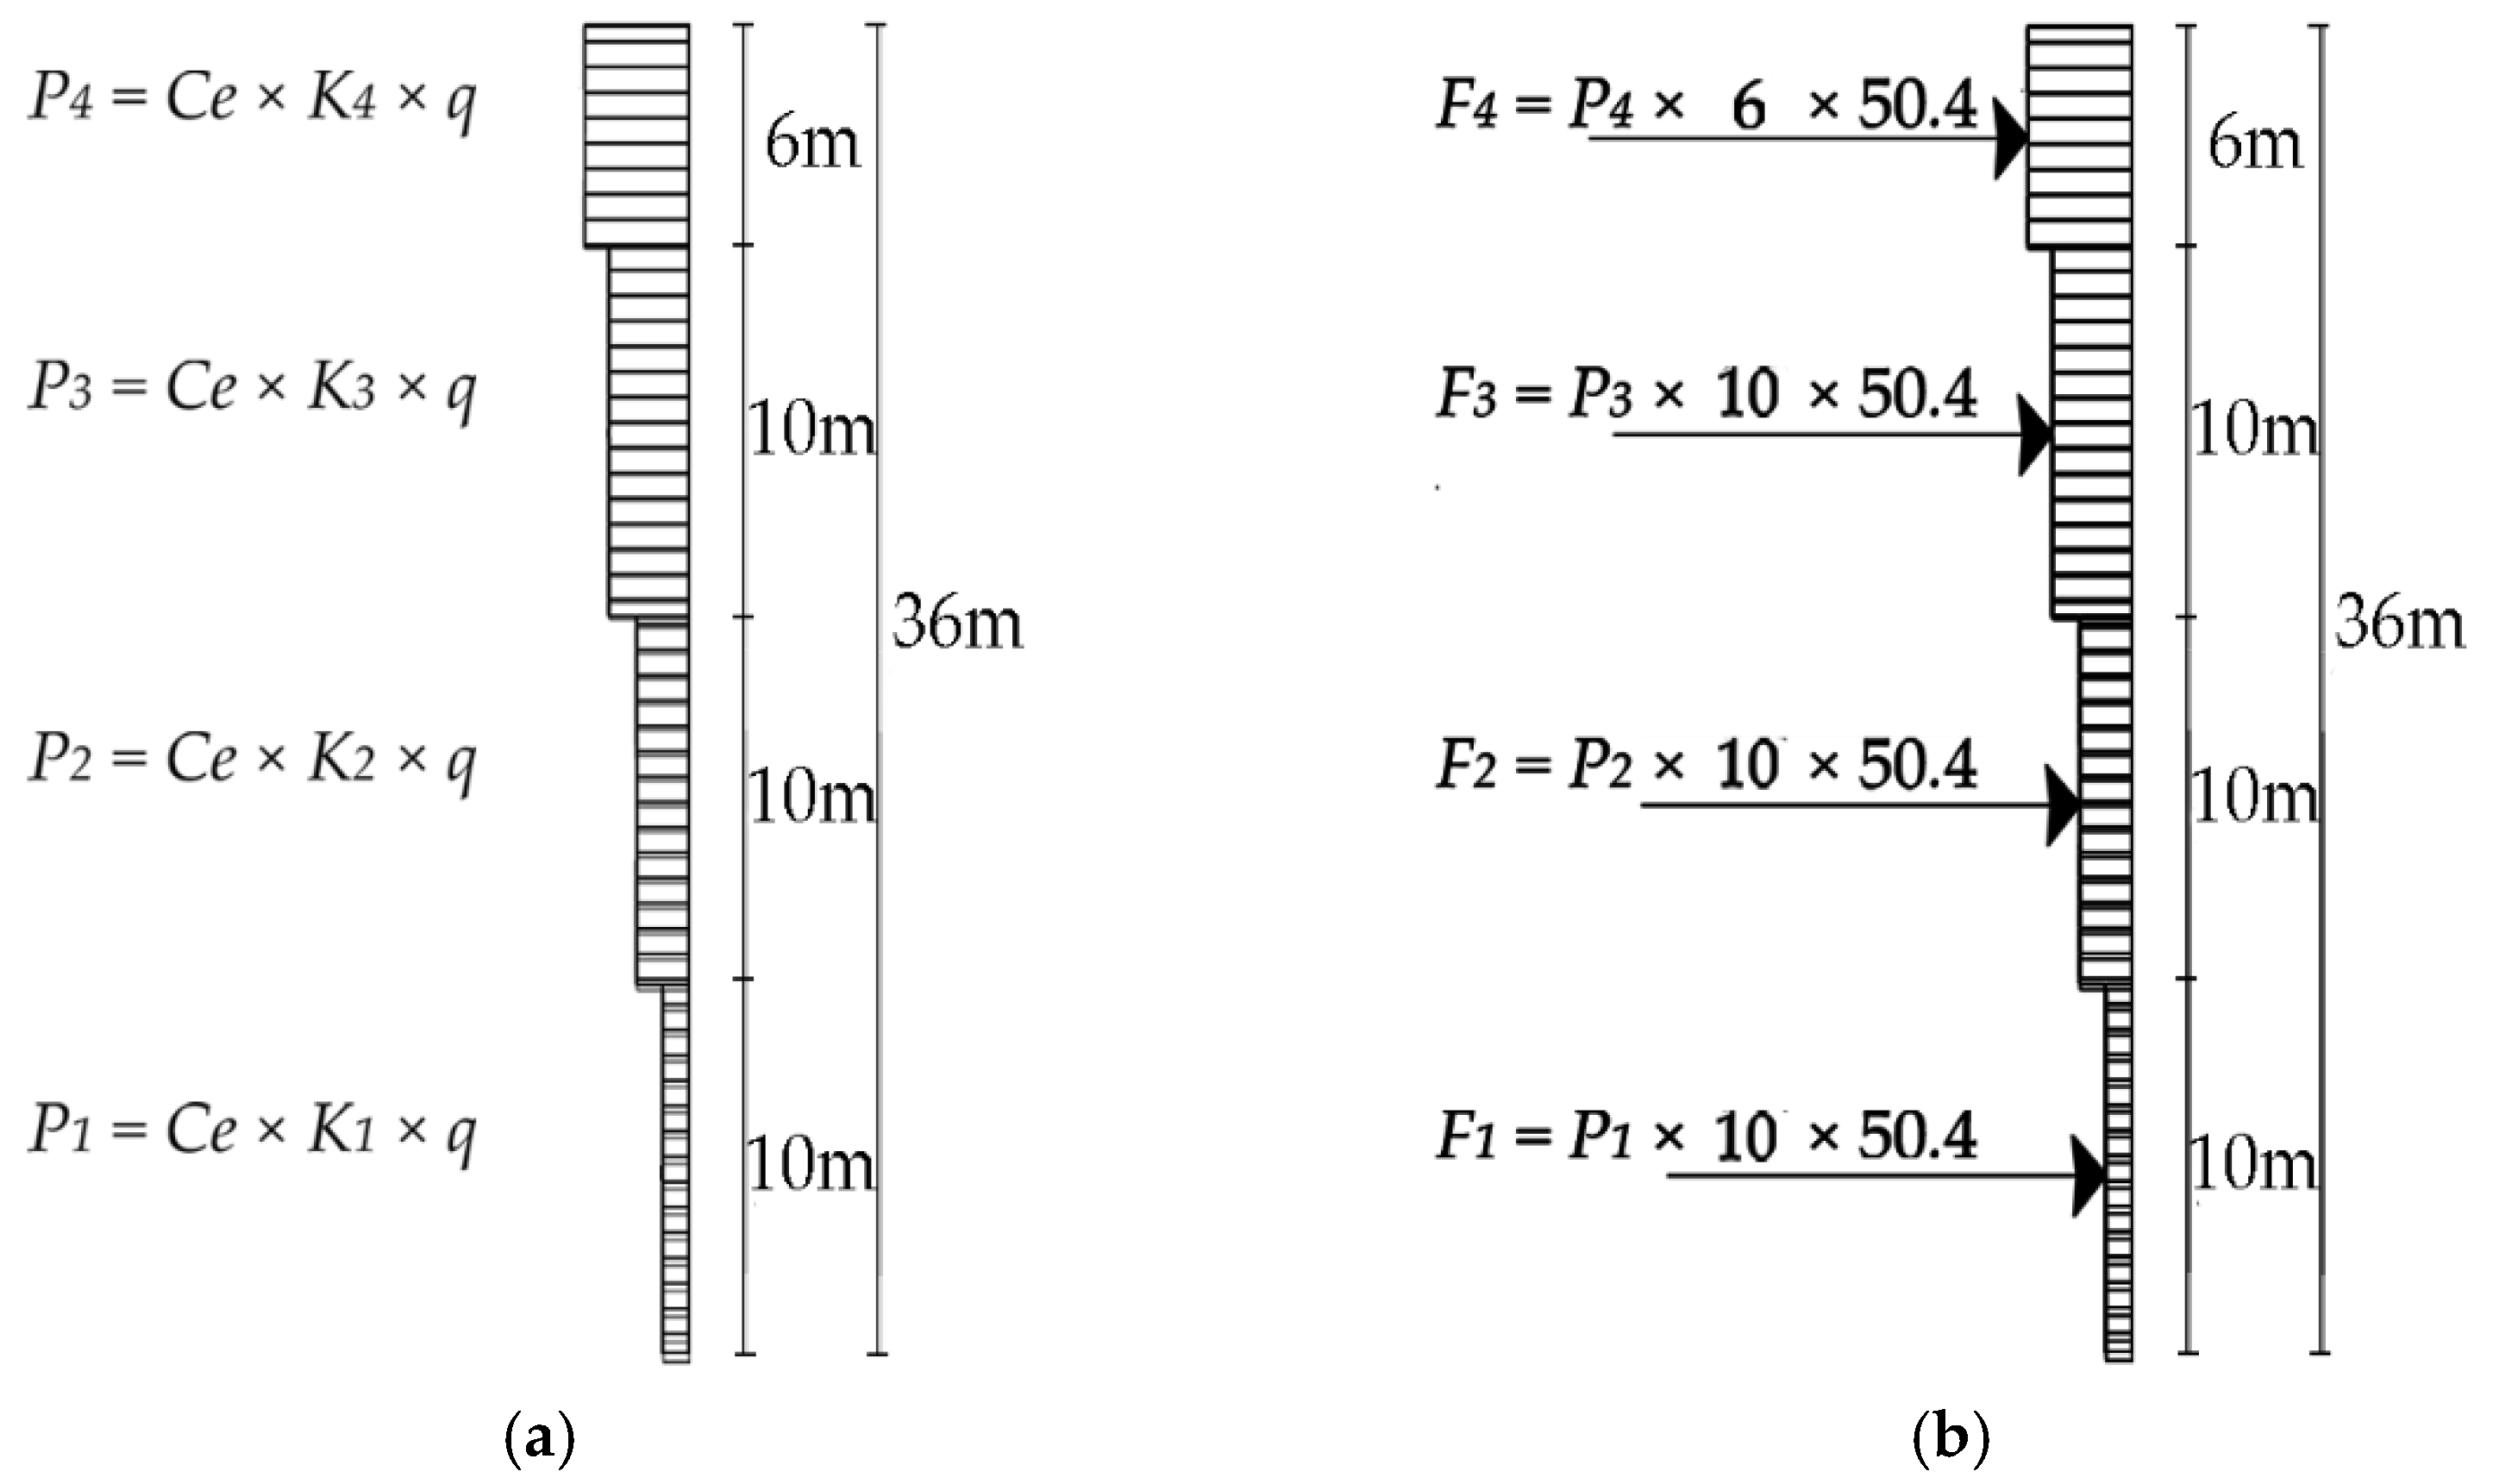
3.3.3. Stability Precautions

Lateral loads have a significant effect on high-rise and heavy structures. Therefore, the structure must be checked against overturning. The overturning moment M overturning is the sum product of the lateral forces and the corresponding perpendicular arms. A resisting moment M resisting is established by multiplying the total weight of the building by half the building’s side length. ECL 201-2019 imposes a stability criterion to check the safety factor against overturning FOS 1 as follows:
FOS 1 = M resisting M overturning     1.5  
Additionally, the safety factor against sliding FOS 2 must be checked in the case of seismic loads as follows:
FOS 2 = F resisting F sliding     1.5
where F resisting is the resisting force, and is 30% of the total building’s weight; F sliding is the resultant sliding force, the sum of all lateral seismic forces acting on each story.

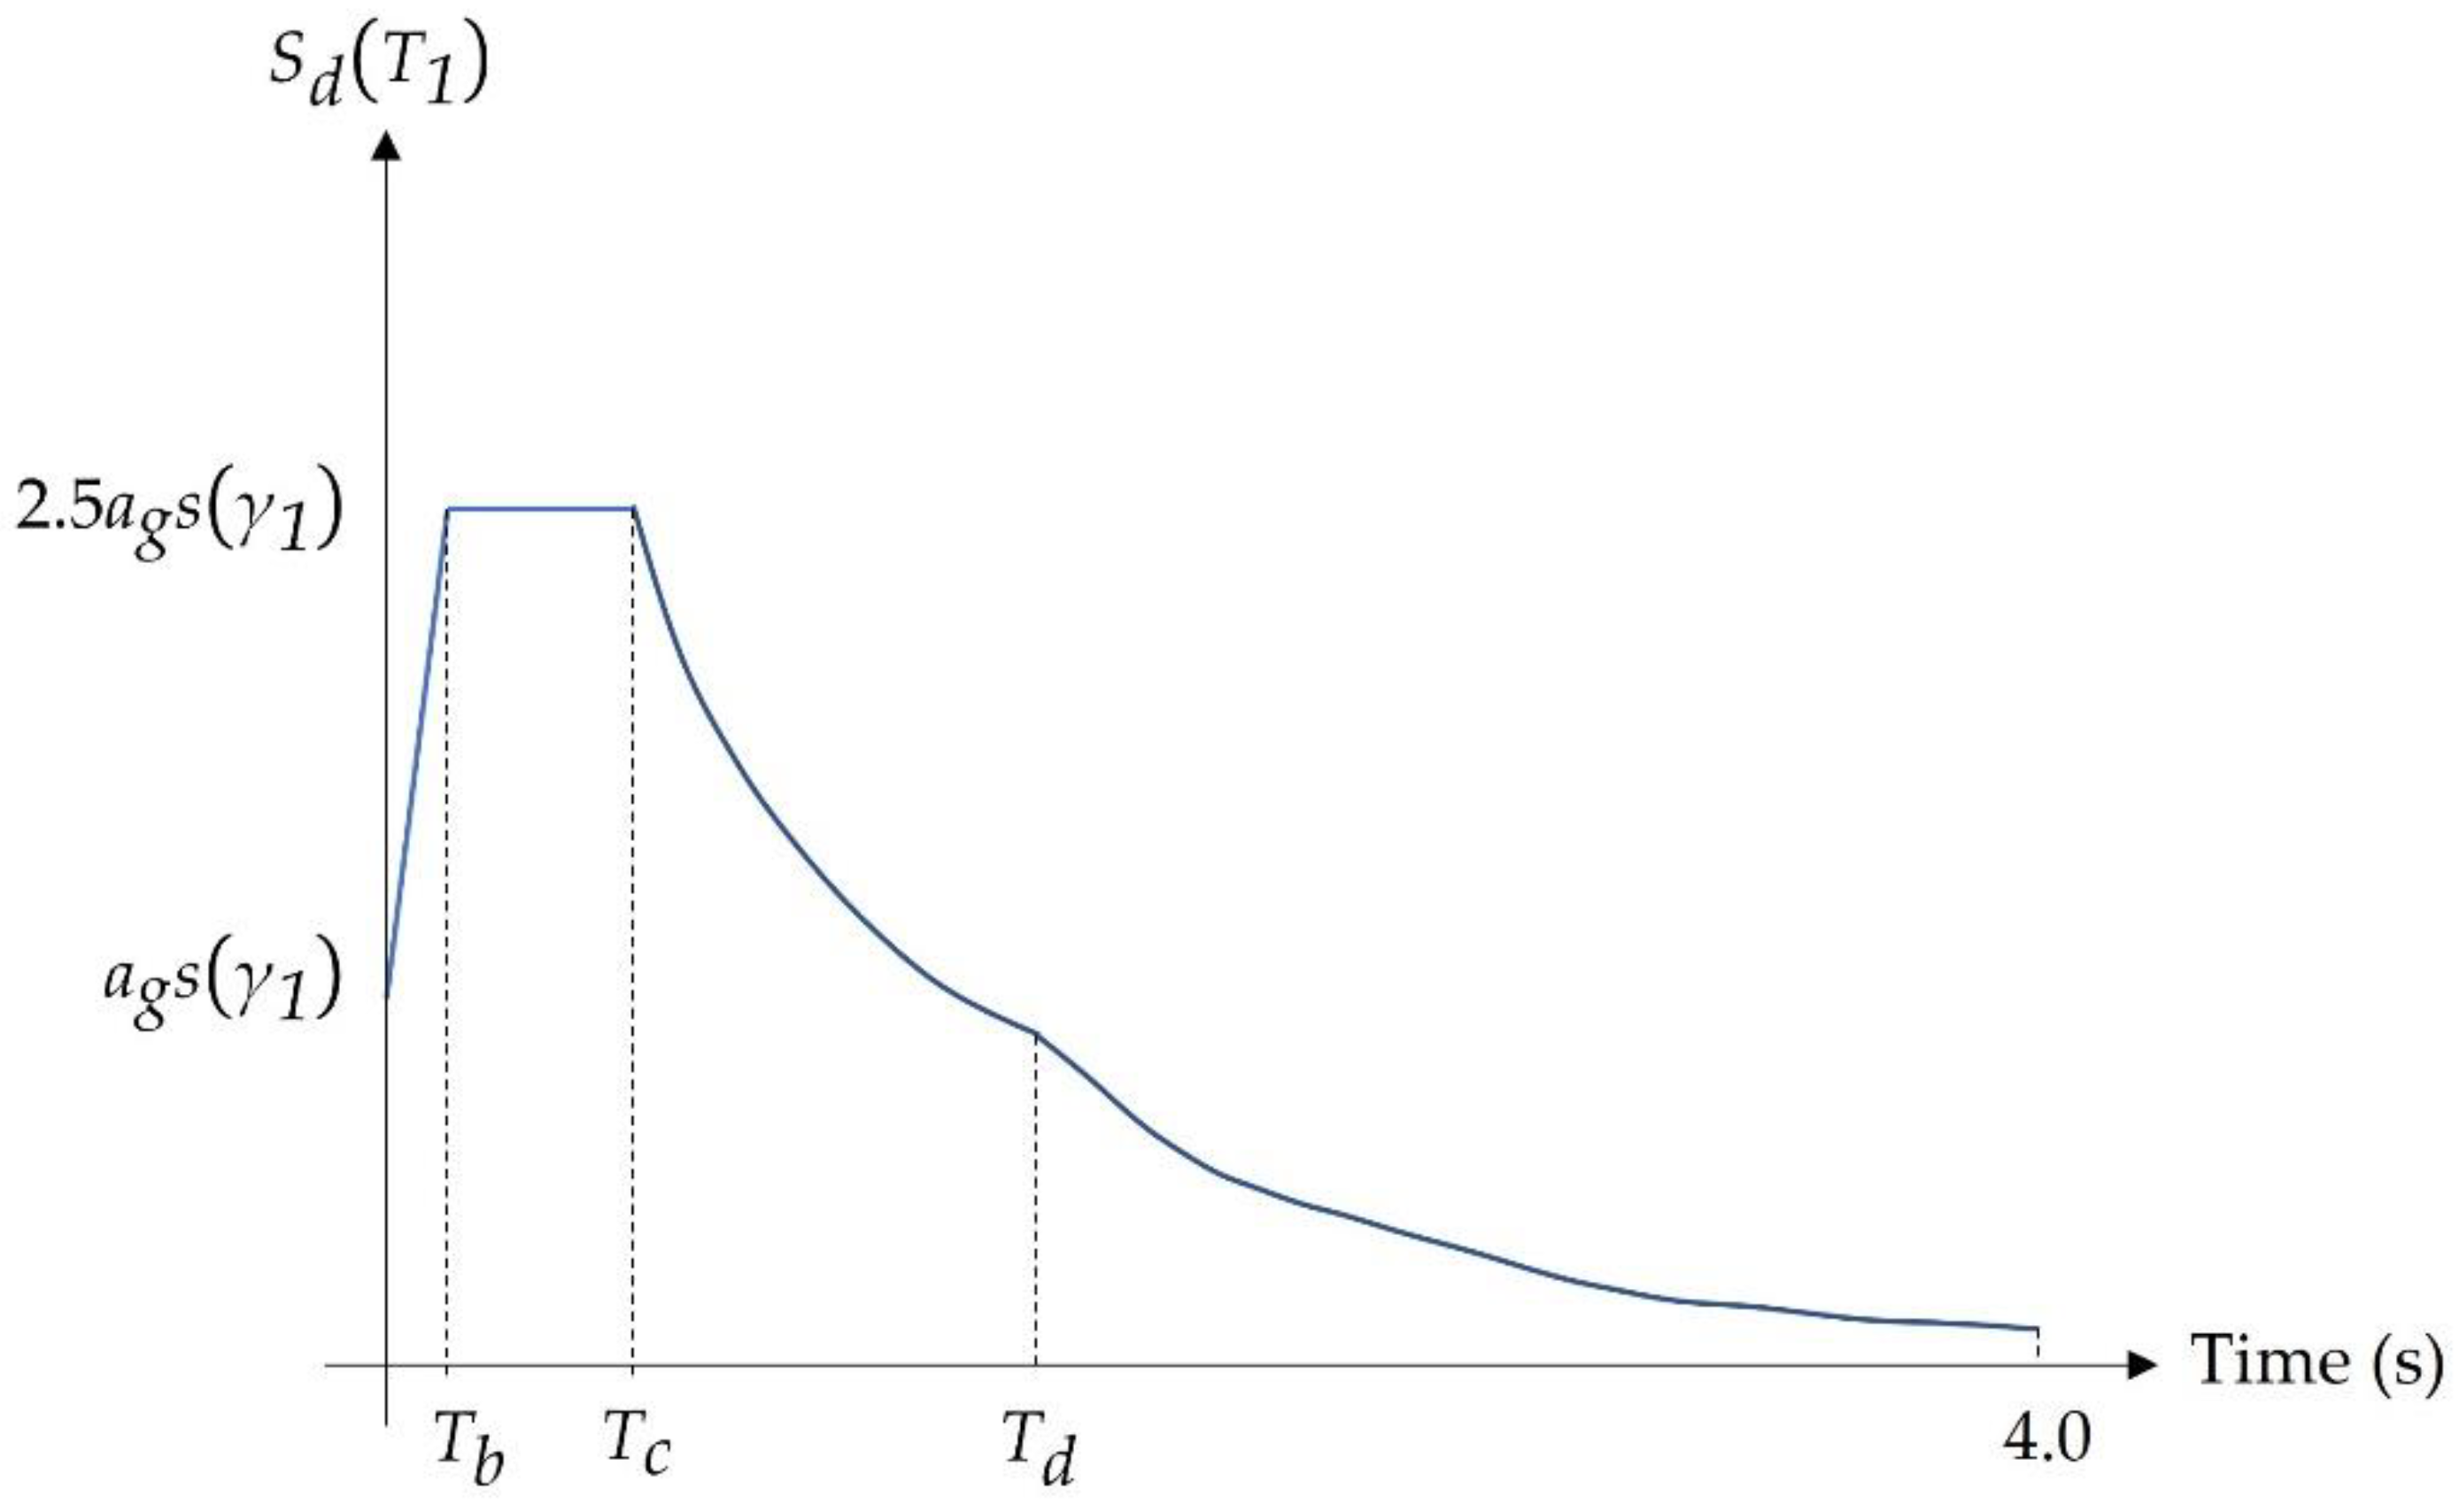
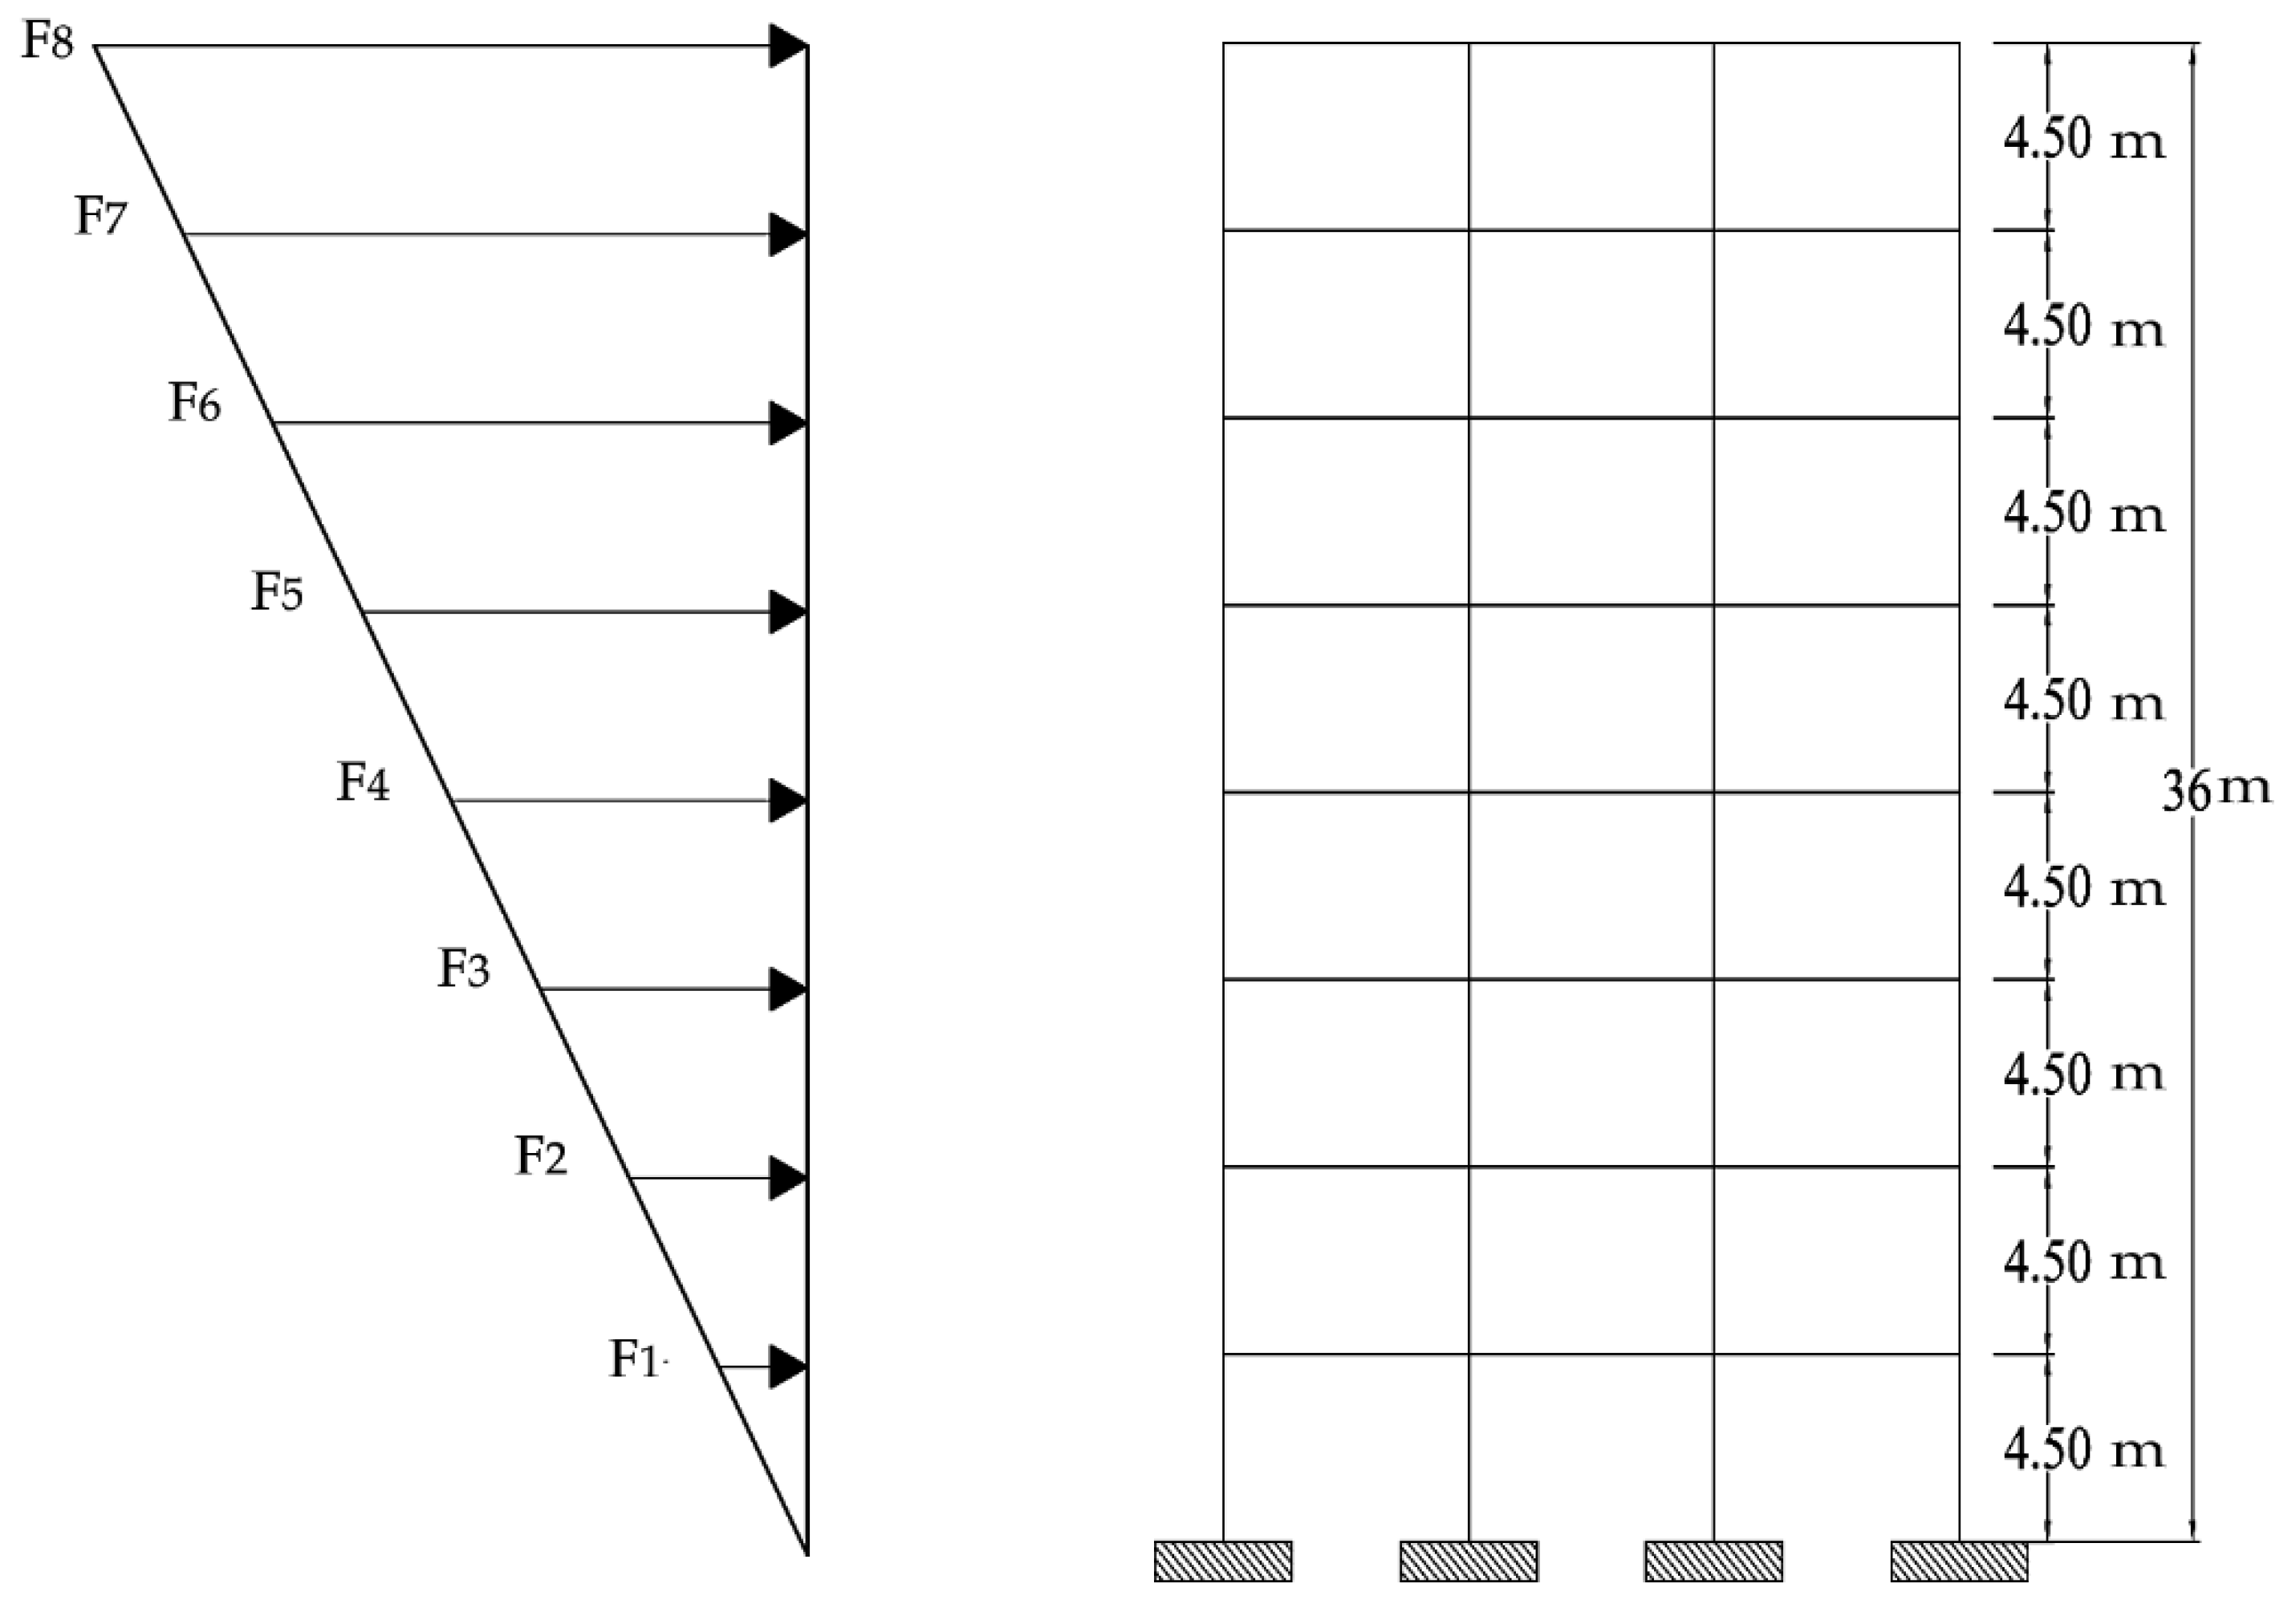
3.3.4. Maximum Drift

ECL 201-2019 accounts for the drift in response to earthquakes. First, the elastic displacement Δ i must be evaluated for each story, as per Equation (16):
Δ i = Q i 12 EI i H 3
where Q i is the shear load and EI c is the flexural rigidity of the columns in the story under consideration. Then, the equivalent static displacement d s , i for each story is obtained as follows:
d s , i = 0.7 Rd e , i
where d e , i is the sum of the elastic displacements for the story under consideration and the next story upwards. Finally, the relative story drift d rv is calculated as follows:
d rv , i = d r , i V
where d r , i is the difference between the equivalent story displacements for the story under consideration and the lower story, and V is a displacement reduction factor based on the importance category of the building. According to ECL 201-2019, the d rv of any story must not exceed 0.5% of the total story height.

4. Problem Formulation

The optimization problem for each system can be mathematically formulated as follows:
Minimize   f ( x ) = V c ( R c + R f ) + W s R s
subject to
g h x     0                         h = 1 ,   2 , , H
x i L     x i     x i U                                     i = 1 ,   2 , I
where f(x) is the objective function; V c and W s are the total concrete volume and steel weight for all the building components, respectively; x is the decision variables vector; R c , R f , and R s are the unit rates of concrete, formwork and labor, and steel, respectively; g h x is the h-th inequality constraint function; H is the number of constraints; x i L and x i U are the lower and upper bounds for the decision variable x i , respectively.
The unit rate of concrete R c is generally based on the mix proportions that achieve the desired compressive strength f cu . Because our target is to minimize the total cost, various values of f cu were considered, and the impact of each value on the building’s total cost was evaluated. Thus, we considered all the strength alternatives available in ECP 203-2020. Table 4 presents the considered values of f cu and their corresponding unit rates, captured from the ready-mix concrete plants in Cairo, Egypt. In the current study, R f is 31.25 USD for each cubic meter of concrete, obtained from multiple construction projects in Cairo, Egypt. R s is 945.31 USD/ton, obtained from the Egyptian monthly bulletin of material prices [30].
From a practical standpoint, the columns were grouped into corner columns, edge columns in the x-direction, edge columns in the y-direction, and intermediate columns. Square columns were assumed for ease of calculations. Therefore, the decision variables and design constraints regarding the columns were computed for each category of columns individually. Figure 8 depicts the decision variables for each floor system. Each variable’s lower and upper bounds were defined based on the provisions of ECP 203-2020.
The steel bar diameters were chosen from the commercial list available in Egypt: 12 mm, 16 mm, 18 mm, 22 mm, 25 mm, 28 mm, and 32 mm. The increments of the concrete dimensions were chosen based on common practice. The cover spacing for each structural element was set based on the durability and exposure provisions of ECP 203-2020. Table 5 presents the increments and cover spacings for different decision variables.
Design constraints were implemented in the optimization model to ensure the feasibility of the optimal solution. The constraints aimed to satisfy the ultimate and serviceability limit states specified in ECP 203-2020. Equations (22)–(25) show the constraints of the slabs at critical sections.
g 1 x = 1   -   Δ l L max / 250     0
g 2 x = 1     M s , u M s     0
g 3 x = 1     μ s , max μ s     0
g 4 x = 1   - μ s μ s , min     0
where L max is the longer span; M s , u is the flexural capacity of the slab; M s is the section’s design bending moment; μ s , max and μ s , min are the section’s maximum and minimum steel ratios, respectively; μ s is the actual reinforcement ratio of the section.
The constraint in Equation (26) accounts for the punching shear failure at each slab–column connection.
g 5 x = 1     q c , u q c     0
The design constraints for each column are expressed in Equations (27)–(31):
g 6 x = 1     P c , u P c     0
g 7 x = 1     M c , u M c     0
g 8 x = 1     μ c , max μ c     0
g 9 x = 1     μ c μ c , min     0
g 10 x = 1     V c V c , min     0
where P c , u is the axial load capacity of the column; P c is the column’s design axial load; M c , u is the flexural capacity of the column; M c is the column’s design bending moment; μ c , max and μ c , min are the column’s maximum and minimum steel ratios, respectively; μ c is the column’s actual steel ratio; V c is the volume of the column’s stirrups per meter; V c , min is the minimum permitter volume of stirrups per meter.
Equations (32)–(34) express the constraints regarding the lateral loads exerted on the building.
g 11 x = 1     FOS 1 1.5     0
g 12 x = 1     FOS 2 1.5     0
g 13 x = 1   - 0.005 H d rv     0

5. Results and Discussion

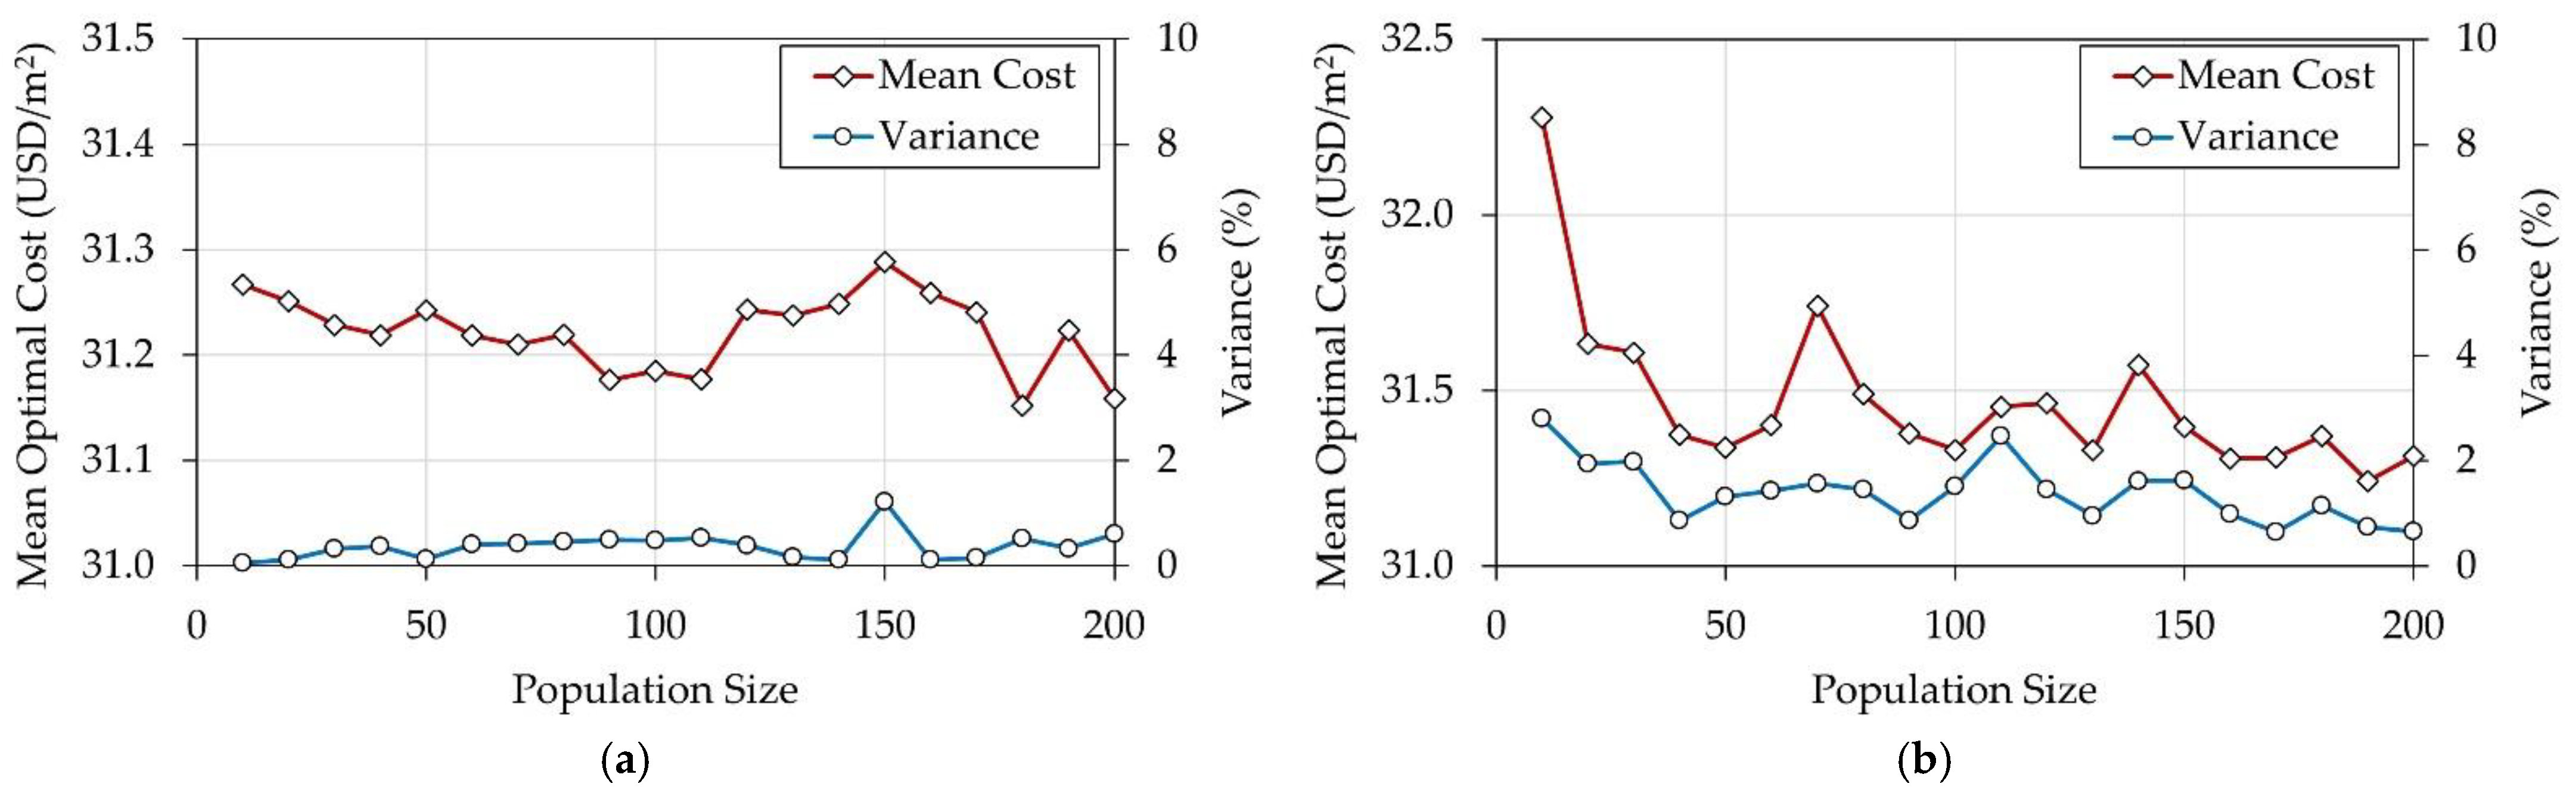
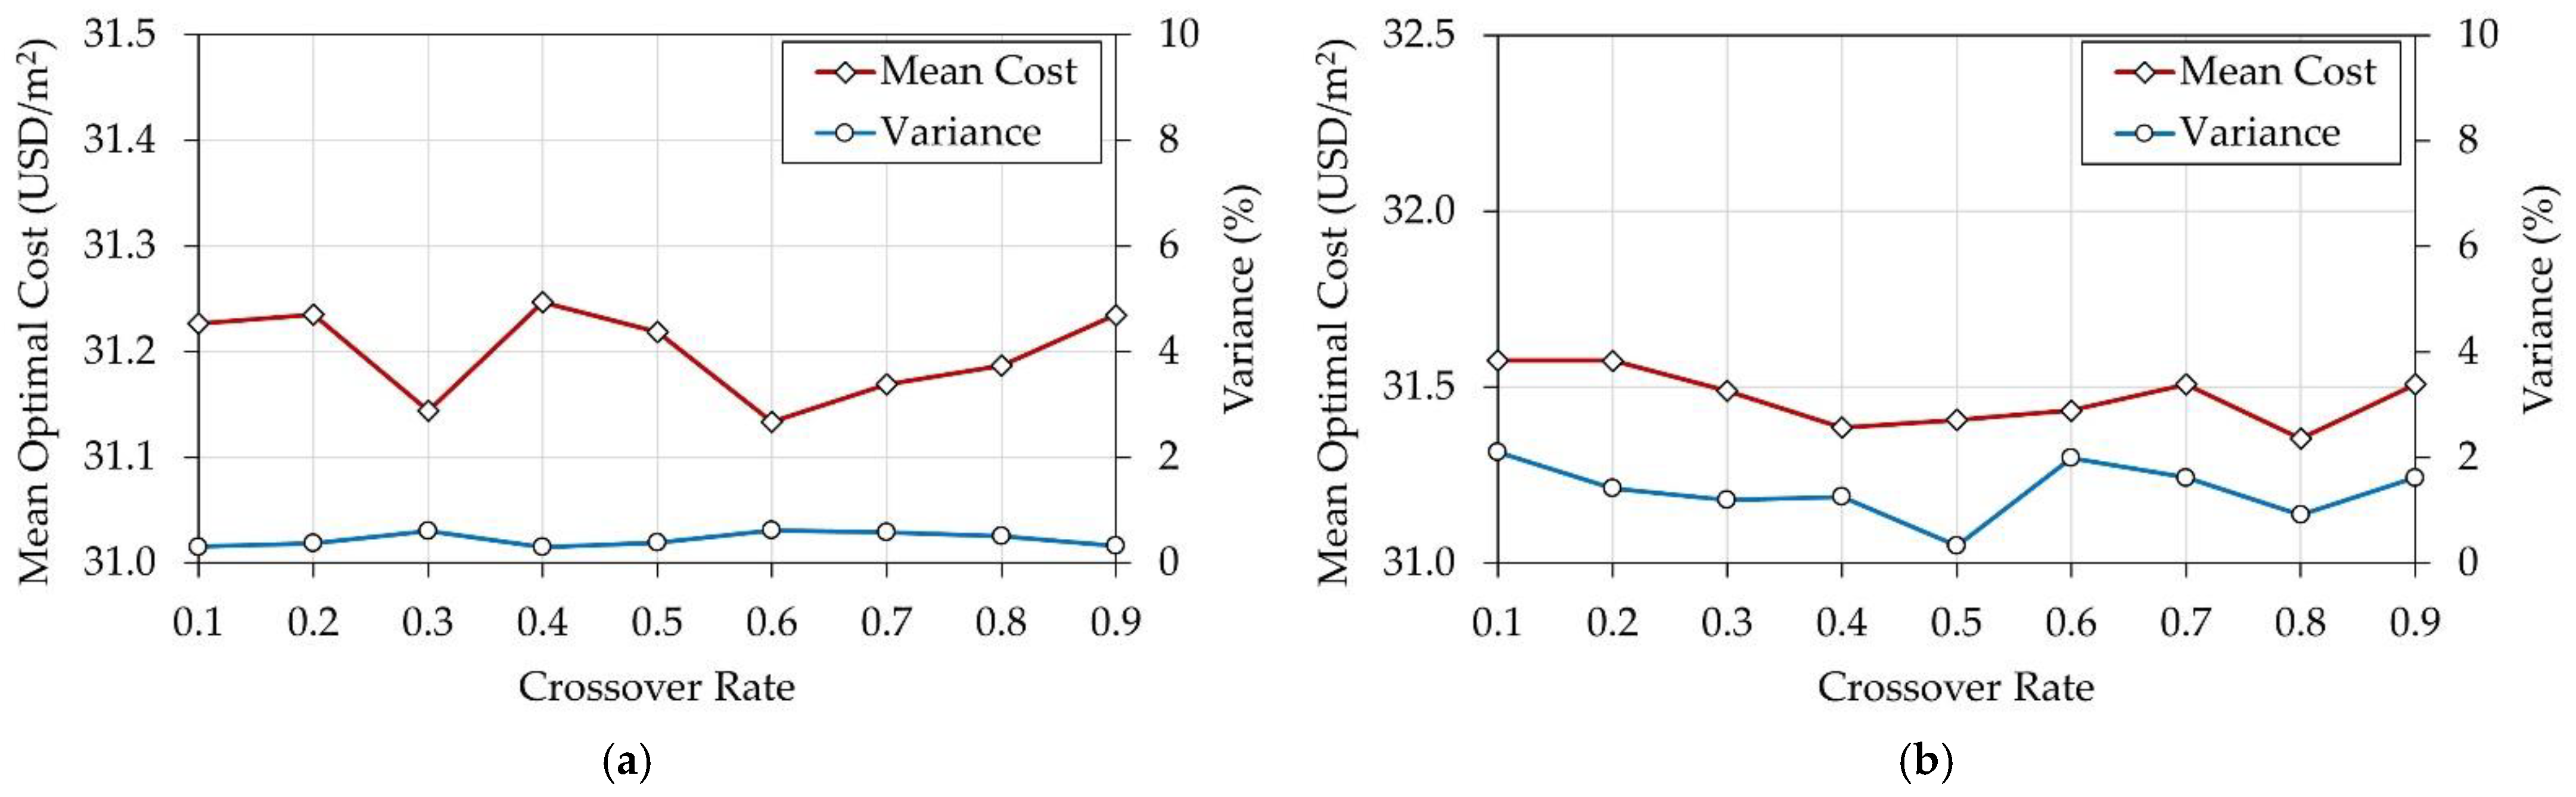
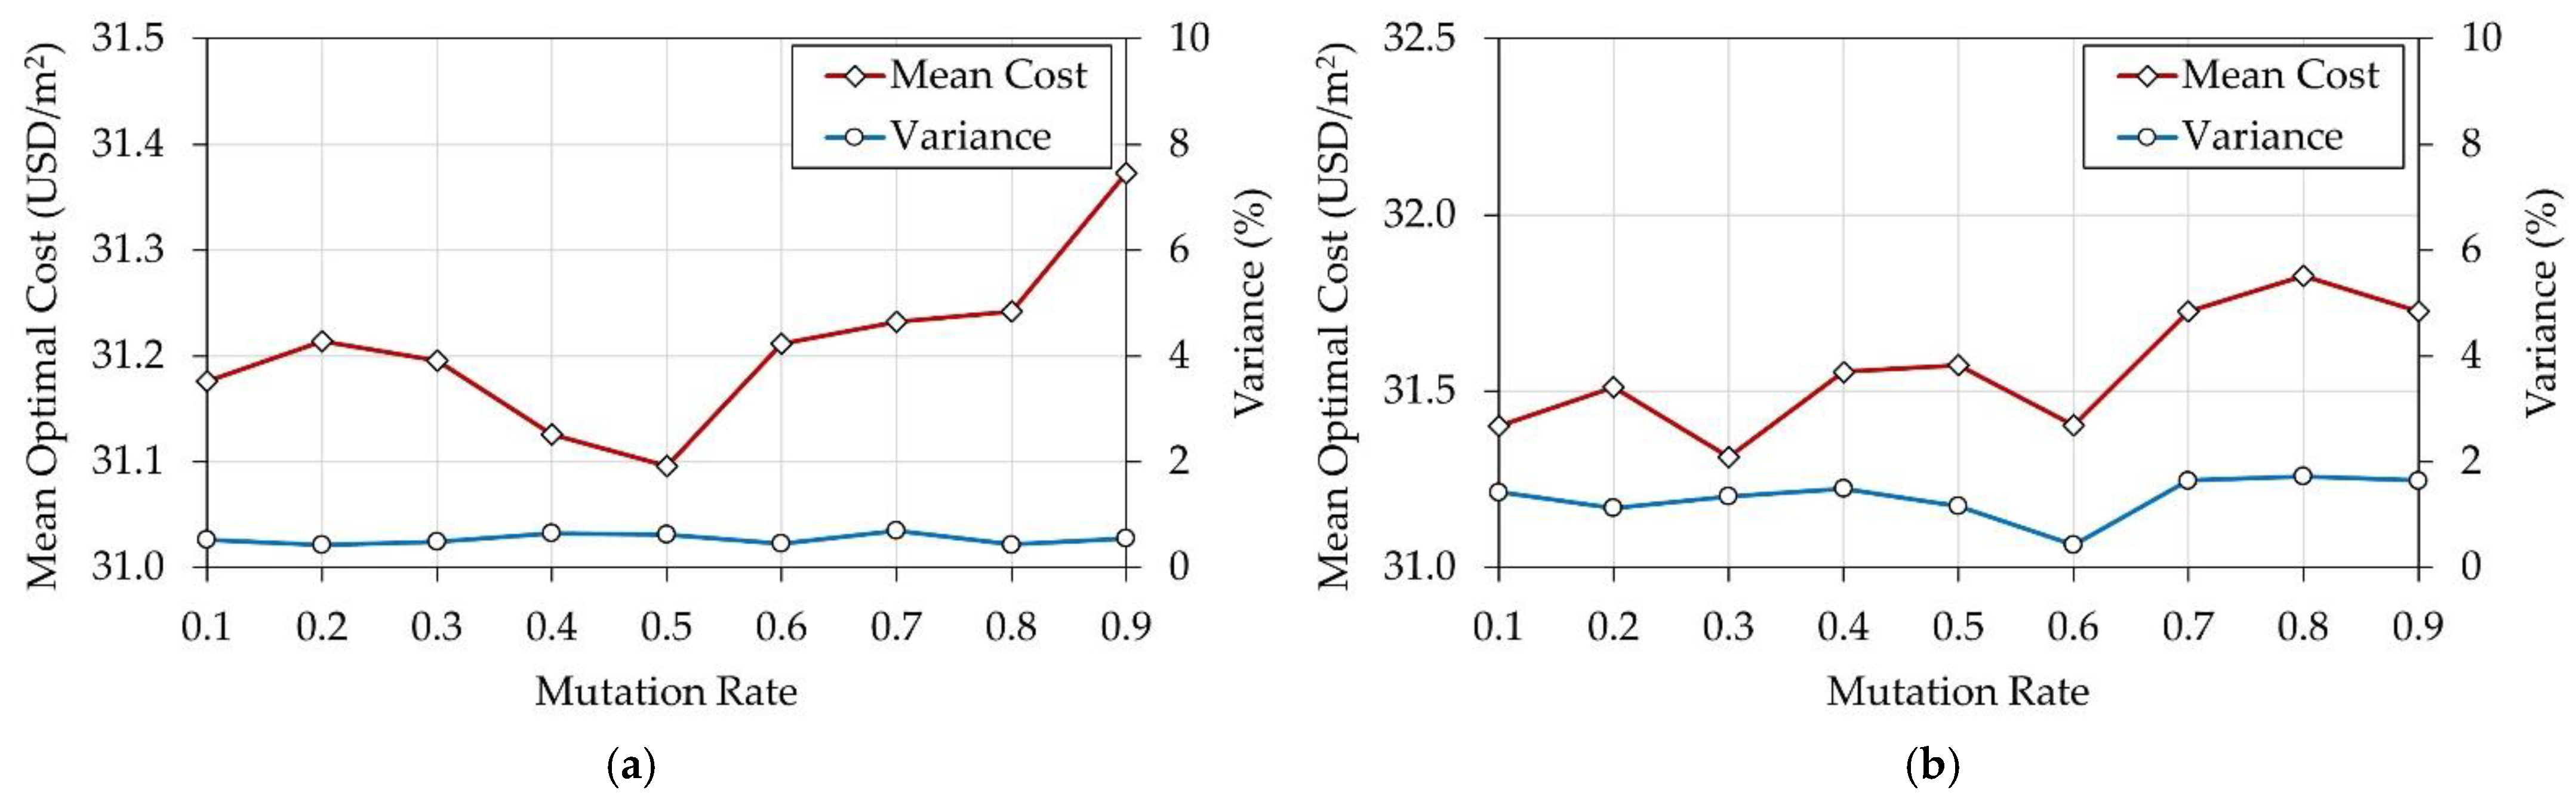
5.1. Effects of GA Control Parameters

Tuning was performed on twenty population values (10–200) with a step-up value of 10. During the optimization process, the default values of crossover rate (0.5) and mutation rate (0.1) were defined. Figure 9 shows the effects of the population size on the mean optimal cost. For both systems, a population size of 180 members almost succeeded in obtaining the minimal mean cost. The variances for all sets of runs with different population values were relatively low. This implies that the random seed could yield results with relatively low standard deviations.
Nine values were involved in tuning the crossover parameter (0.1–0.9) with a step-up value of 0.1. The default values for population size (200) and mutation rate (0.1) were kept constant during each run. Figure 10 illustrates the effects of the mutation rate on the mean optimal cost for each set of runs. For both systems, the difference between the mean costs was insignificant. Similar to the tuning of the population size, the variance was relatively small. Therefore, the default crossover rate value (0.5) could be maintained to achieve acceptable optimal results.
During the optimization process, the default values of the population size (200) and crossover rate (0.5) were defined, and nine values were considered (0.1–0.9), with a step-up value of 0.1 to tune the mutation rate parameter. Figure 11 displays the effects of the mutation rate on the mean optimal cost. The presented mutation–cost relationship shows that raising the mutation rate, to an extent, does not positively impact the mean optimal cost of the building regardless of the floor system. Both floor systems had a minor variance. Hence, a mutation rate of 0.1 could be adequate to shorten the algorithm’s computational effort while maintaining good optimal results.

5.2. Comparison between Design Alternatives

For each floor system, we optimized 24 design alternatives. These alternatives were established from three column spacing variants and eight concrete grades, and the optimal cost of each alternative was sought. The detailed summary of optimal design data for both floor systems is presented in Table A1 in the Appendix A. The following subsections present the observations of the optimal results.

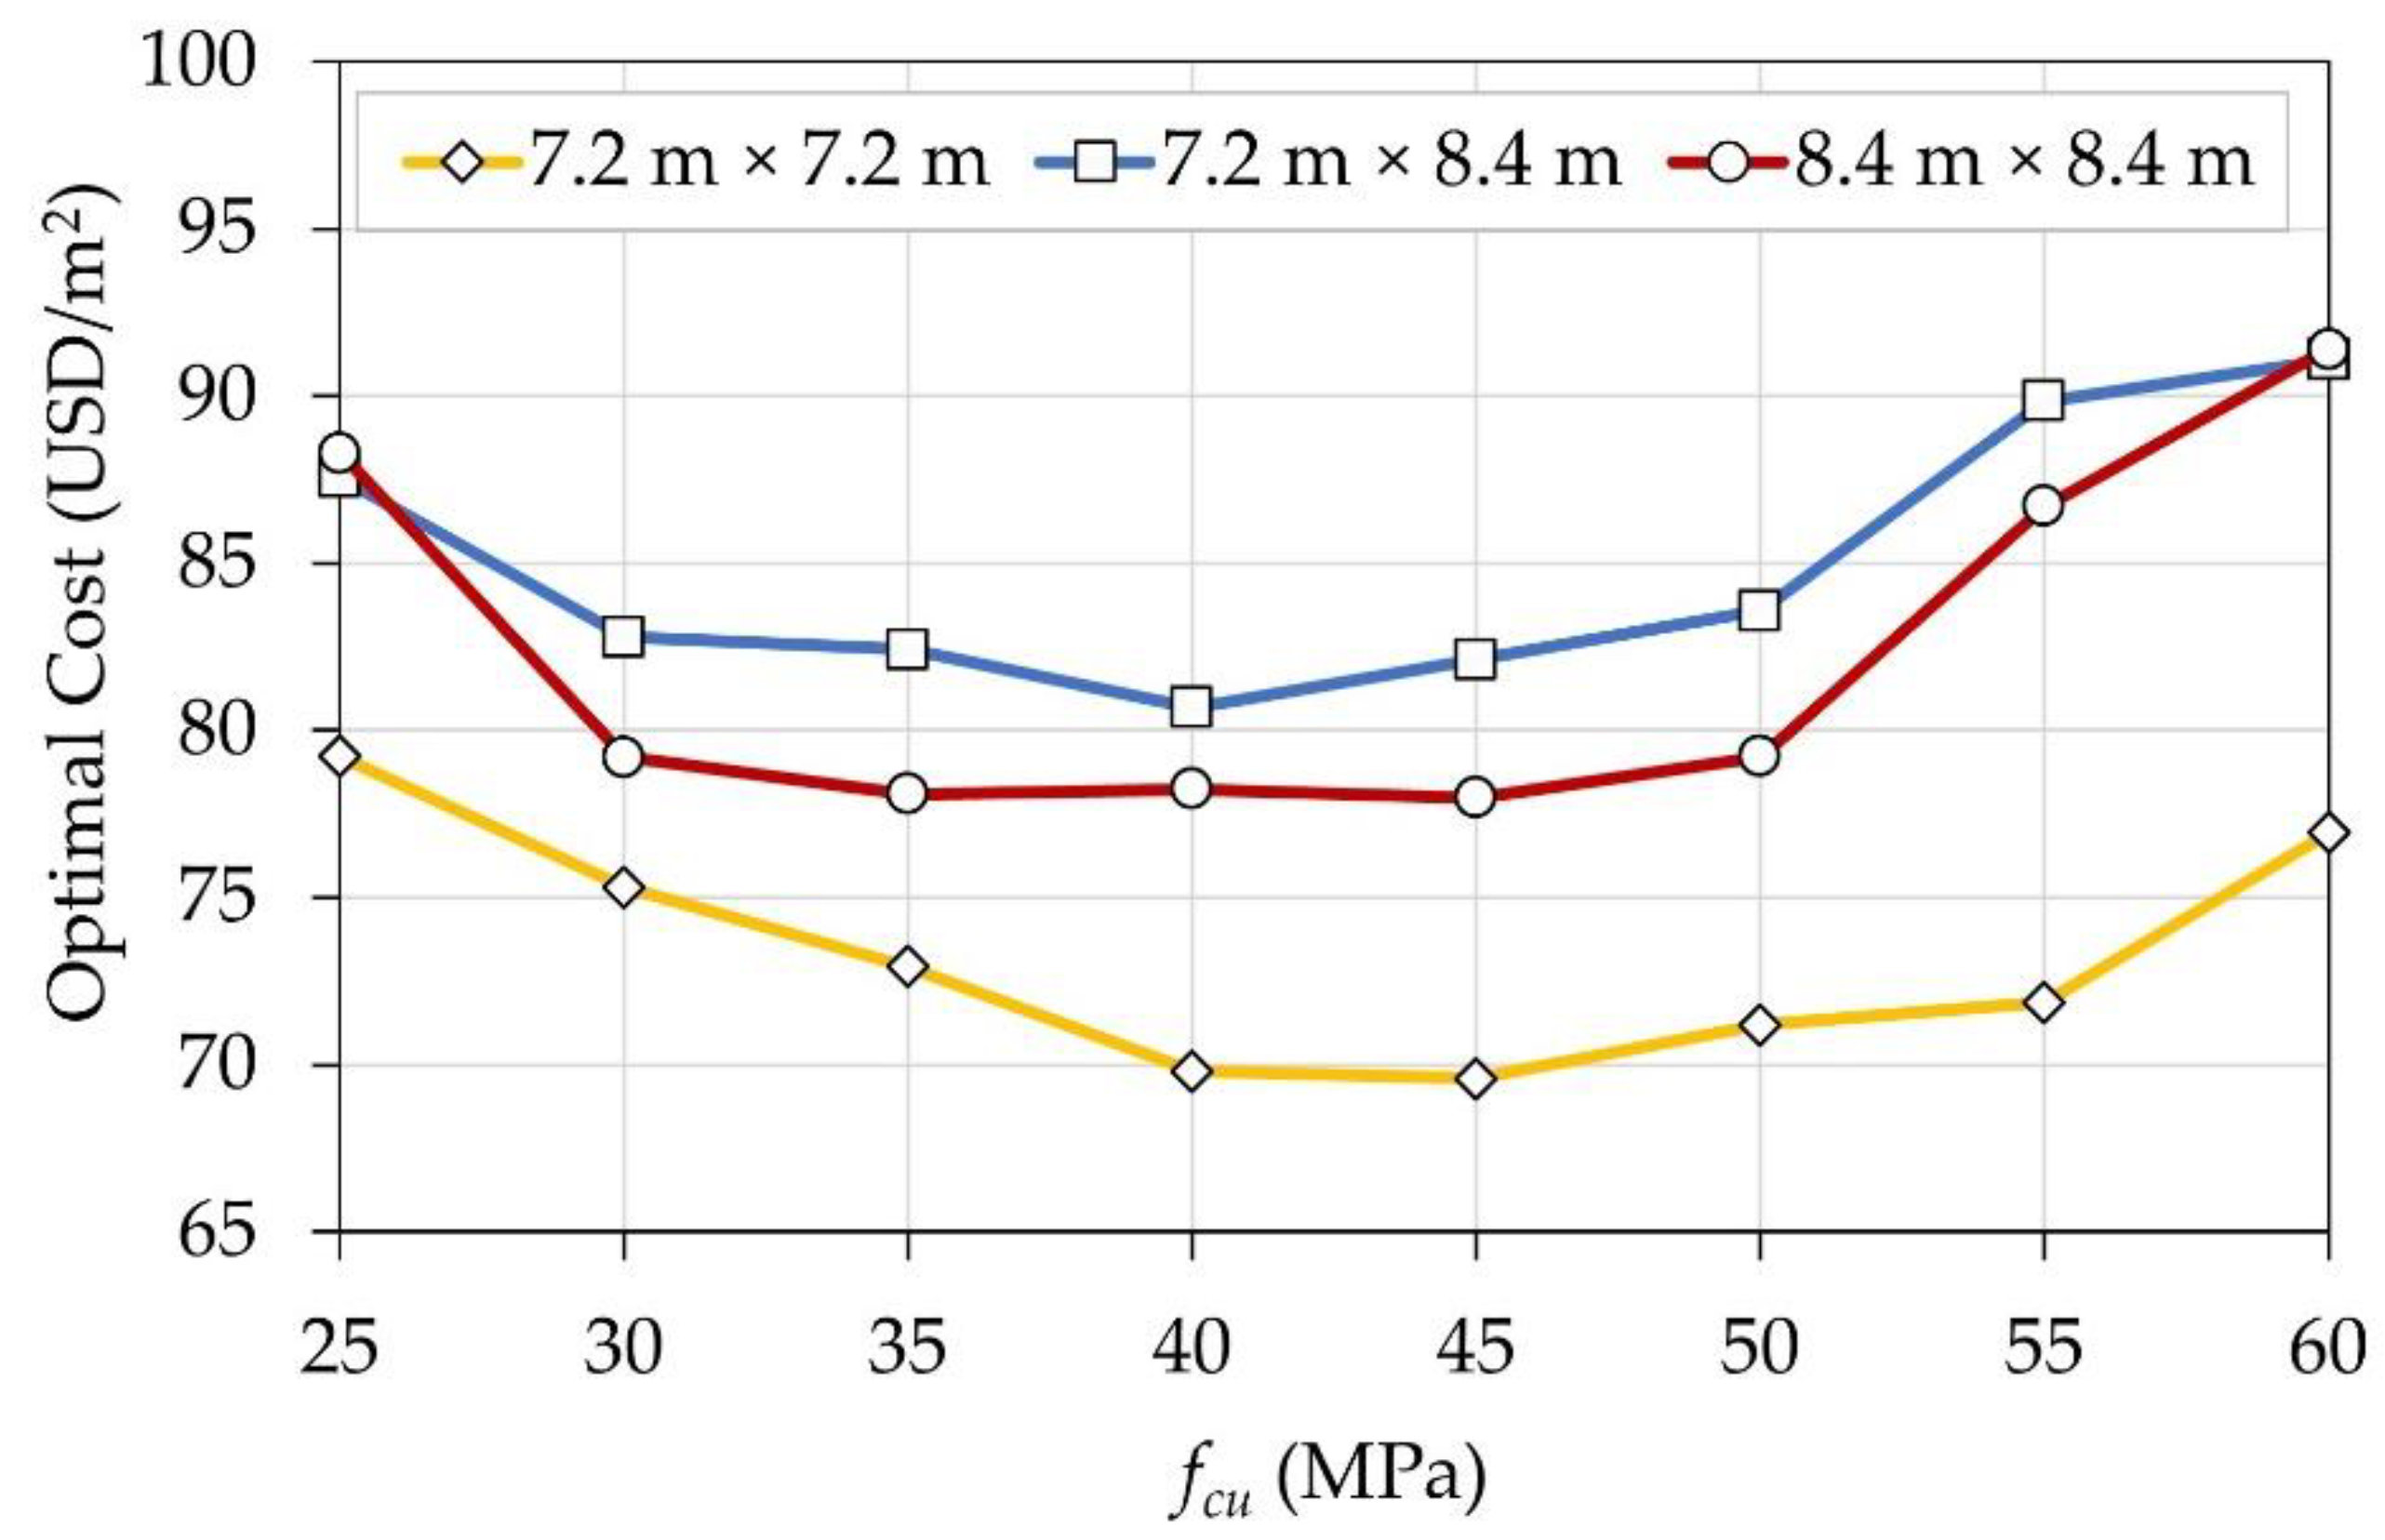
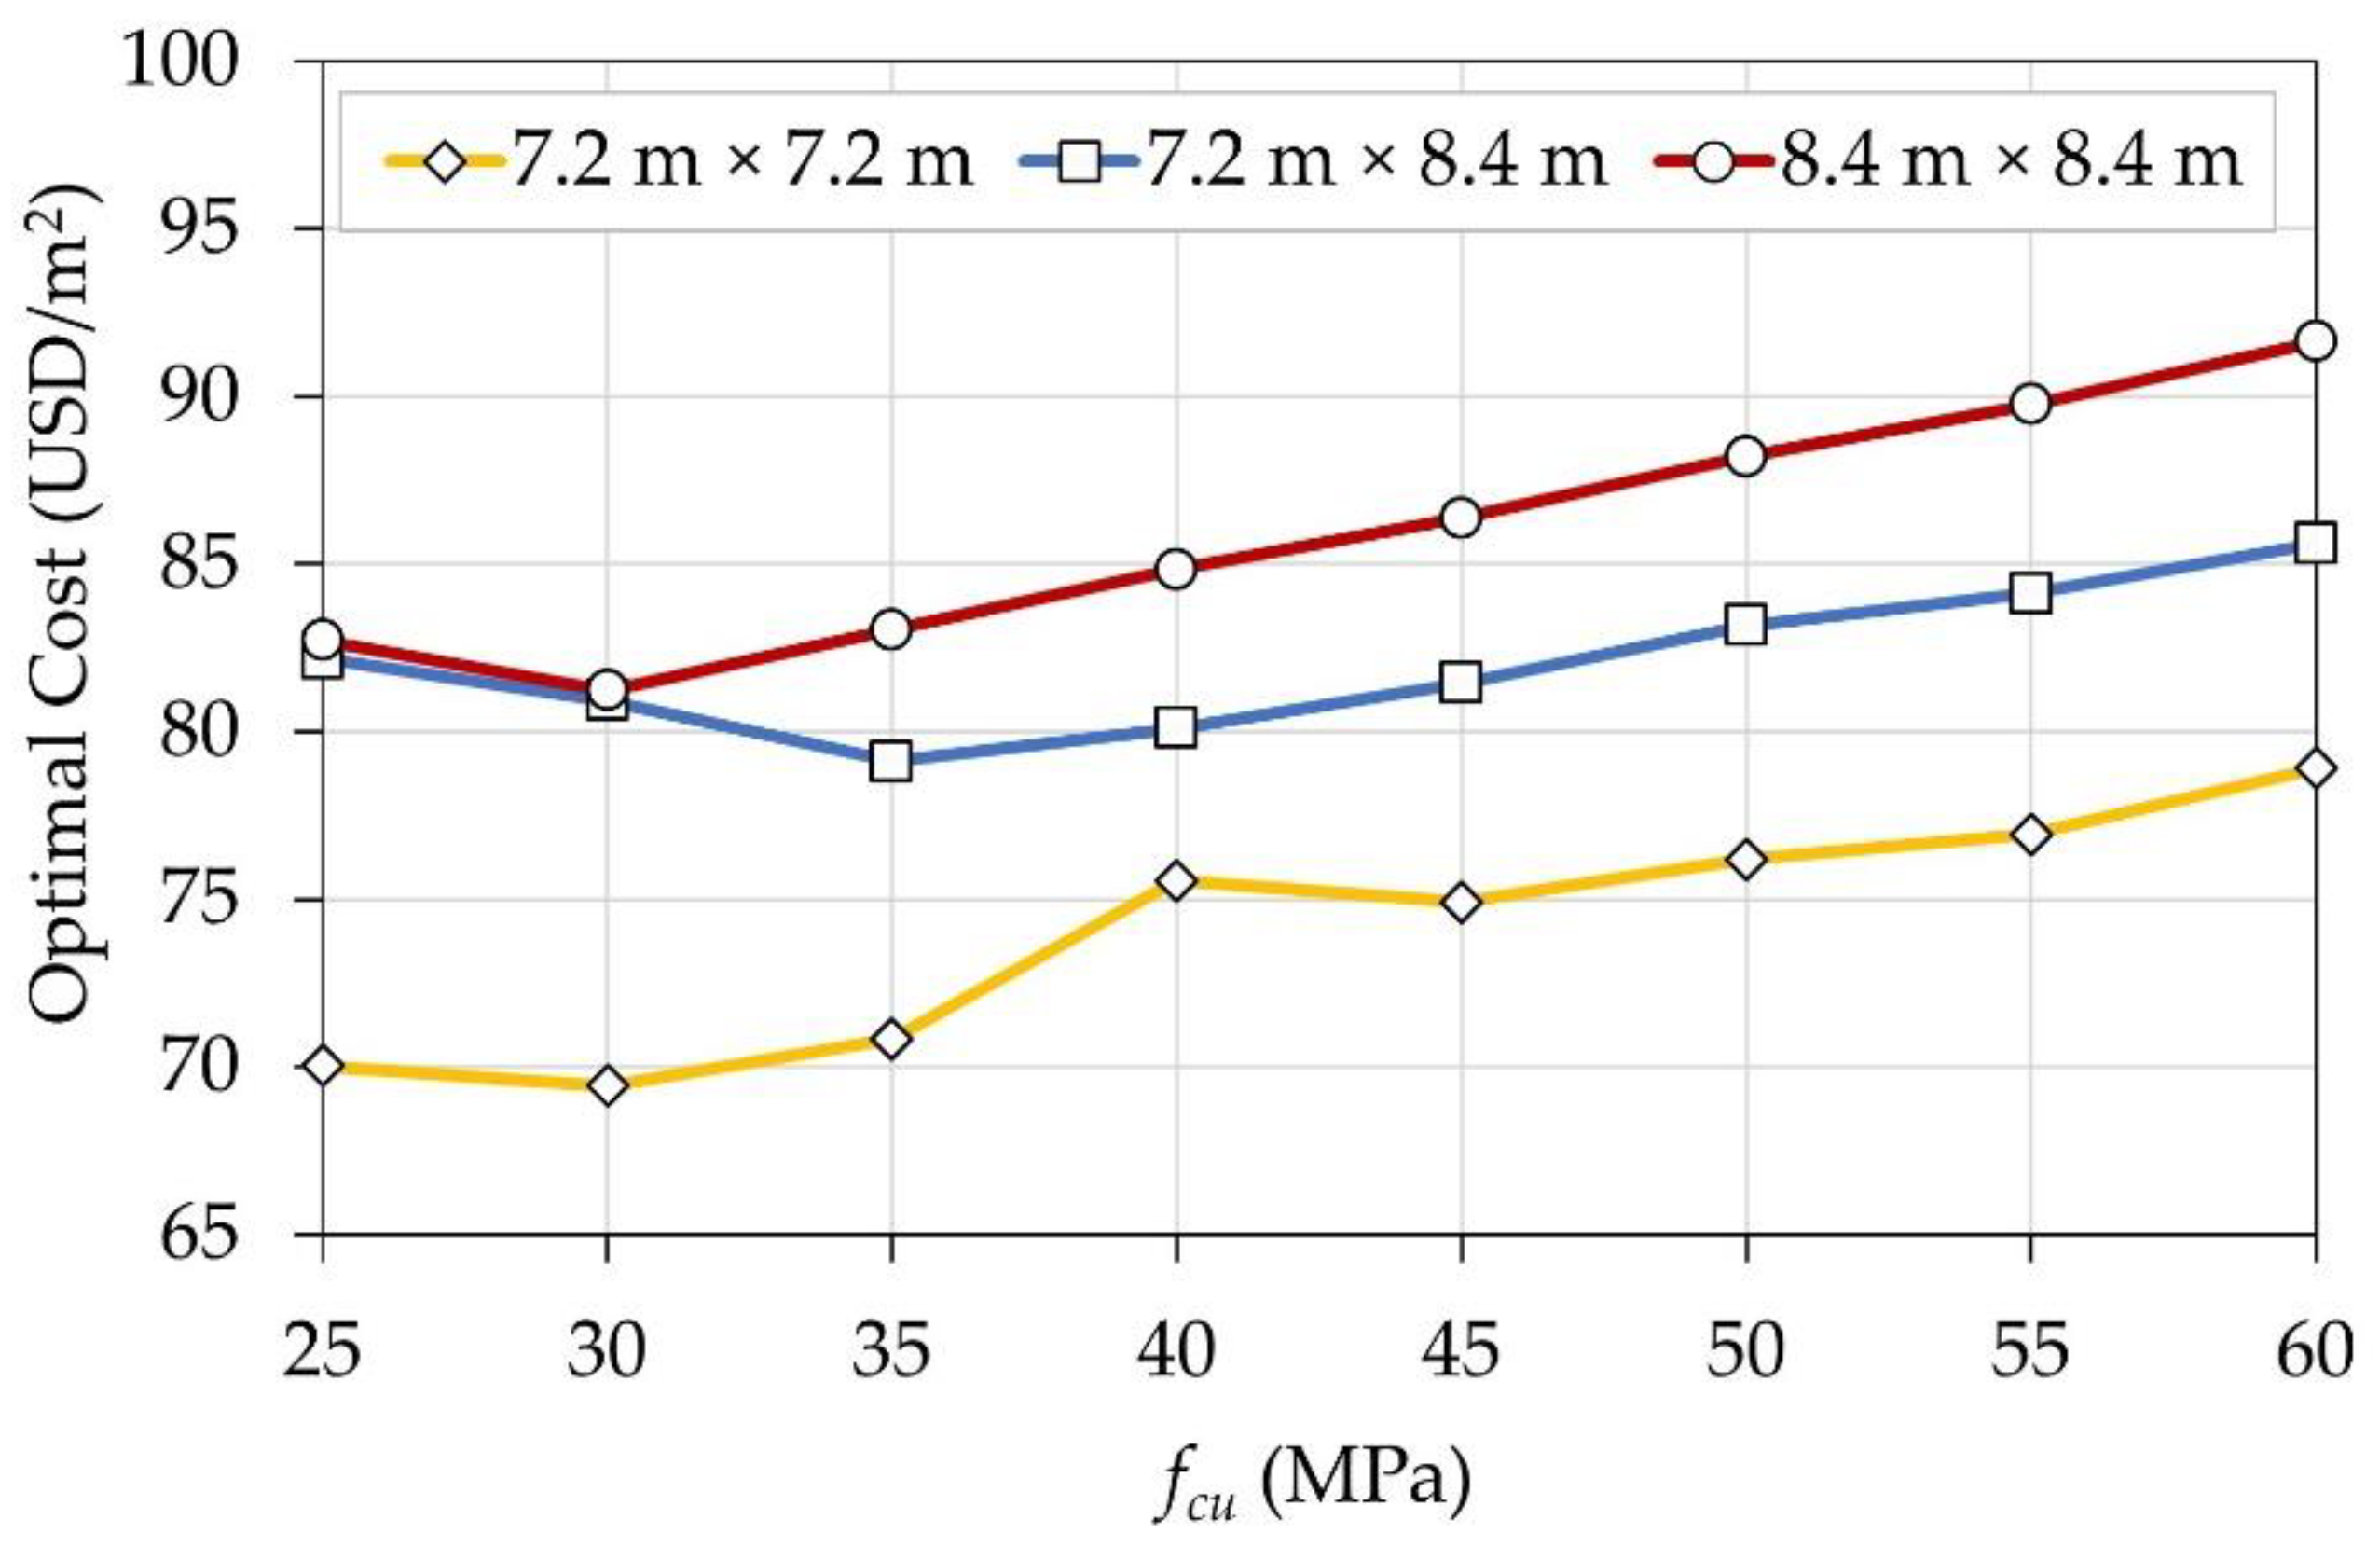
5.2.1. Effect of Compressive Strength

Figure 12 illustrates the optimal cost of the design alternatives for FSWD. The plan layout with dimensions of 7.2 m × 7.2 m acquired significant cost savings compared to the other layouts. Increasing f cu had a positive impact on the optimal design cost up to a certain limit (40–45 MPa). In this stage, increasing f cu managed to enhance the two-way shear resistance of the slab–column connections along with the drop panels, causing a significant reduction in the slab thickness. As f cu exceeded 50 MPa, the slab thickness could not decrease further to fulfill the flexure and deflection requirements. Accordingly, a significant cost increase was observed due to the high unit rates of concrete per cubic meter. Two recent studies [19,20] dealing with residential and office buildings also reported that the optimal cost decreased with increases in the compressive strength until a certain limit (40–45 MPa).
Figure 13 illustrates the optimal cost of various design alternatives for FP. Similar to FSWD, the 7.2 m × 7.2 m plan layout designs were the cheapest. Except for four design alternatives, increasing f cu affected the total cost of the building adversely. Although increasing f cu enhanced the two-way shear resistance of flat slabs to a certain extent, it was insufficient to reduce the slab thickness due to the absence of drop panels in most cases. Therefore, increasing the compressive strength increased the unit rates of concrete without significantly reducing the concrete dimensions. Here, the best design could be achieved using f cu = 30–35 MPa.

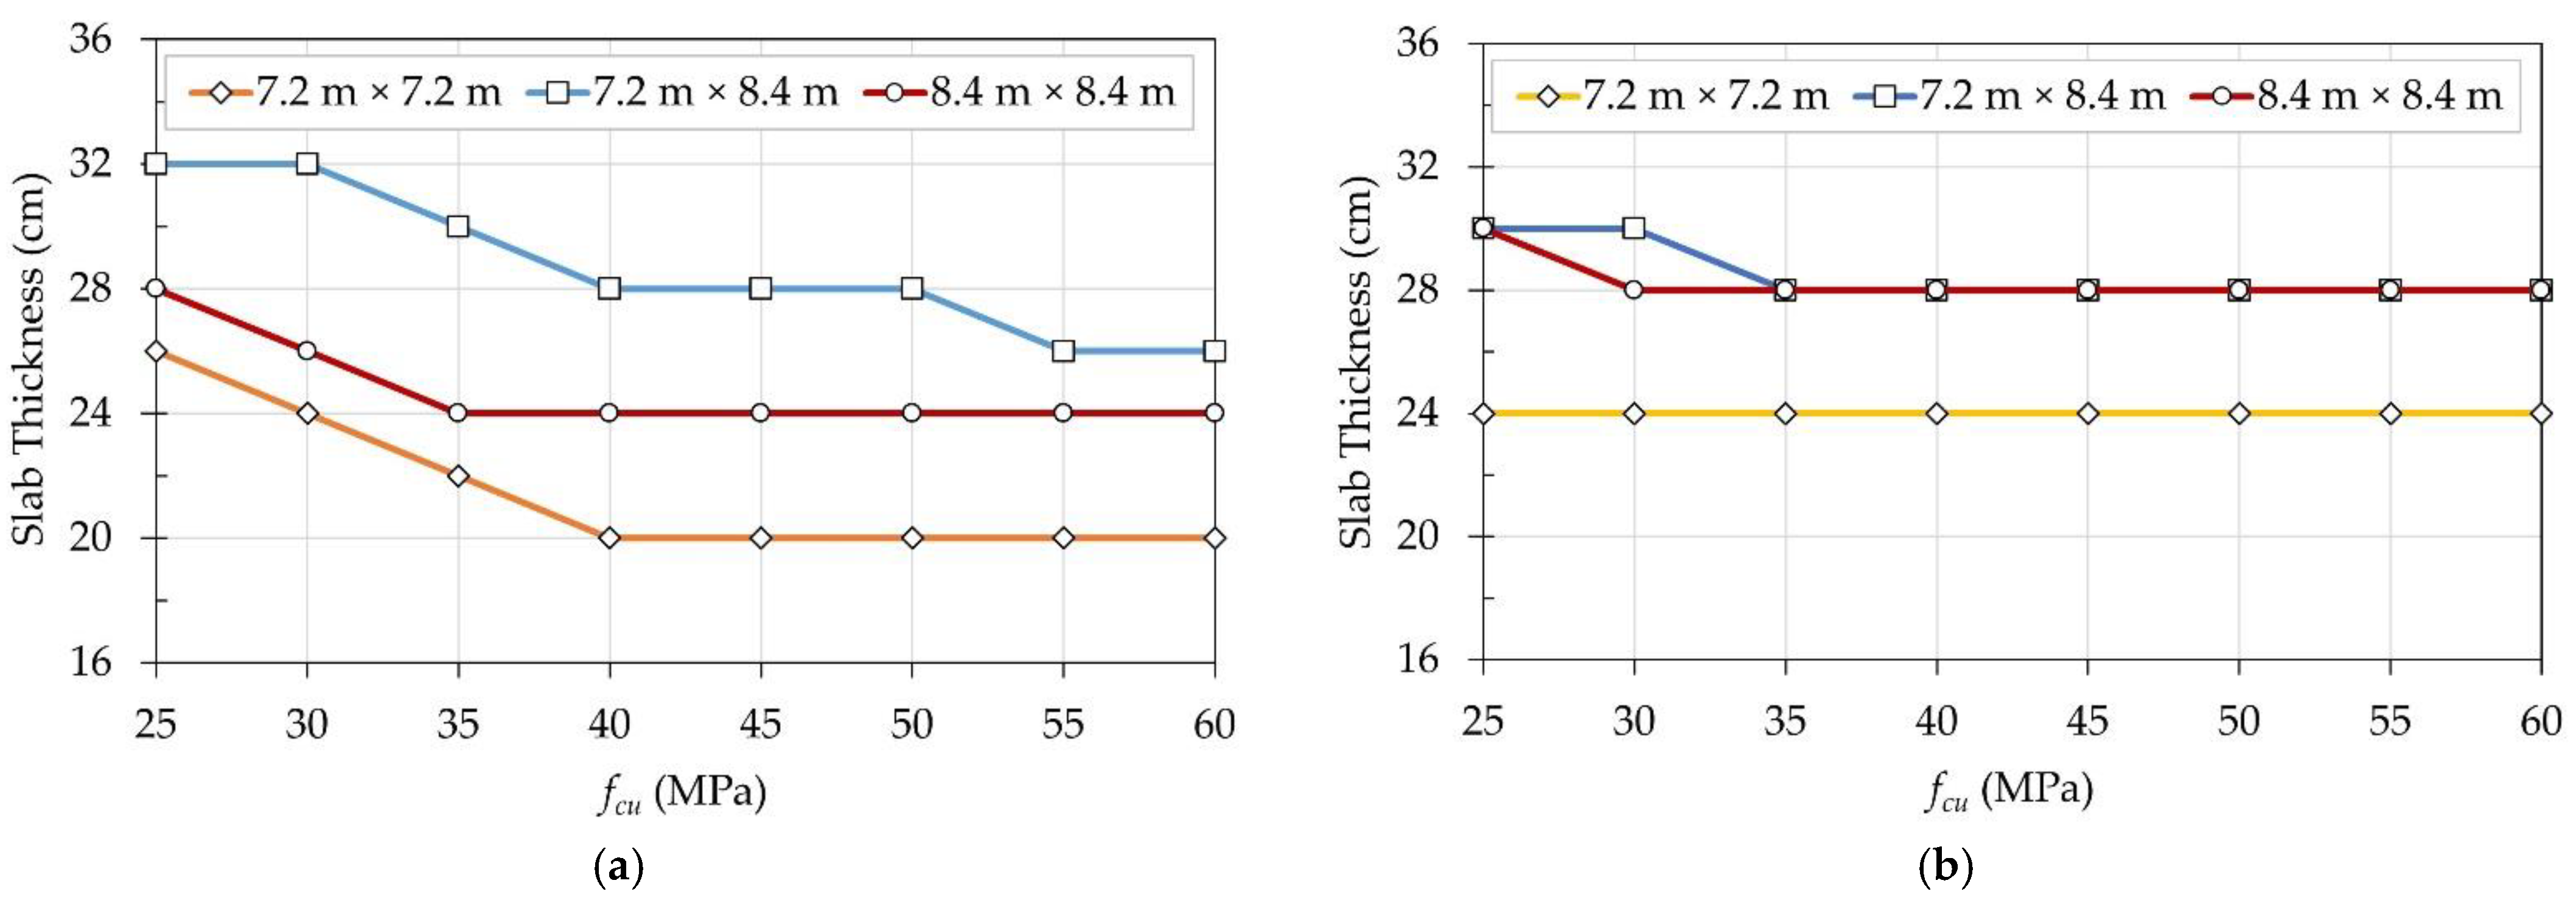
5.2.2. Effect of Slab Thickness

To further understand the impact of f cu on the total cost of the building, Figure 14 demonstrates the effect of increasing f cu on the slab thicknesses for different design alternatives. For FSWD, increasing f cu permitted a reduction in the slab thickness up to 40 MPa. On the contrary, for FP, the slab thicknesses were almost constant with increasing f cu . In line with a recent study [20], the overall cost of the building was dominantly affected by the slab thickness.

5.2.3. Optimal Parameters of the Best Design Alternatives

The design variables of the best design alternative for each floor system are presented in Table 6. The optimal slab thickness of the FSWD alternative was smaller than that of FP due to the utilization of a higher concrete grade and the presence of drop panels at the slab–column interaction zones. Nevertheless, the total cost of the FP building was only 0.22% cheaper than FSWD.
Figure 15 compares the construction costs of materials and labor for the best design alternatives. In line with the findings of Rady et al. [16] regarding residential buildings in Egypt, the results show that steel cost constitutes half the total optimal cost for both floor systems. The concrete cost of FP was 5.25% cheaper than that of FSWD despite the higher concrete volume. This cost reduction can be attributed to the smaller unit rate of the concrete grade (25 MPa).
Figure 16 compares the costs of structural elements for the best design alternatives. The columns of FSWD and FP constituted 36.5% and 39.6% of the total costs, respectively. Rady et al. [16] reported that the columns constituted only 10–18% of the total cost. However, they considered a four-story residential building subjected to gravity loads only. Moreover, they considered a story height of 3.3 m. Therefore, the number of floors, floor height, and loading conditions of the columns could significantly affect the costs of columns.

6. Conclusions

In this research, we developed a structural design optimization model to minimize the total costs of hospital buildings in terms of construction materials and labor. The model was constructed using Microsoft Excel spreadsheets and GA, available in Palisade Evolver, considering two floor systems: FSWD and FP. For each system, the decision variables included the structural elements’ concrete dimensions and steel bars. The provisions of ECP 203-2020 regarding the ultimate limit state and serviceability limit state were fulfilled to guarantee the structural safety of the buildings. Furthermore, the architectural and practical constraints of the plan layouts were considered to allocate the rooms efficiently.
We tuned the GA control parameters, and the effects of each parameter were discussed. The recommended values of population size, crossover rate, and mutation rate are 180, 0.5, and 0.1, respectively, to obtain optimal solutions in a reasonable computational time.
We analyzed the effects of three column spacings and eight concrete grades on the optimal cost for each floor system. The following points are concluded from our case study:
Hospitals with column spacings of 7.2 m × 7.2 m are the most economical, regardless of the floor system.
-
Slab thickness is the most significant variable in the optimal design of hospital buildings, regardless of the floor system;
-
Increasing fcu up to 45 MPa effectively reduces the building’s optimal cost only in the presence of drop panels. Otherwise, low concrete grades are preferred if no drop panels exist;
-
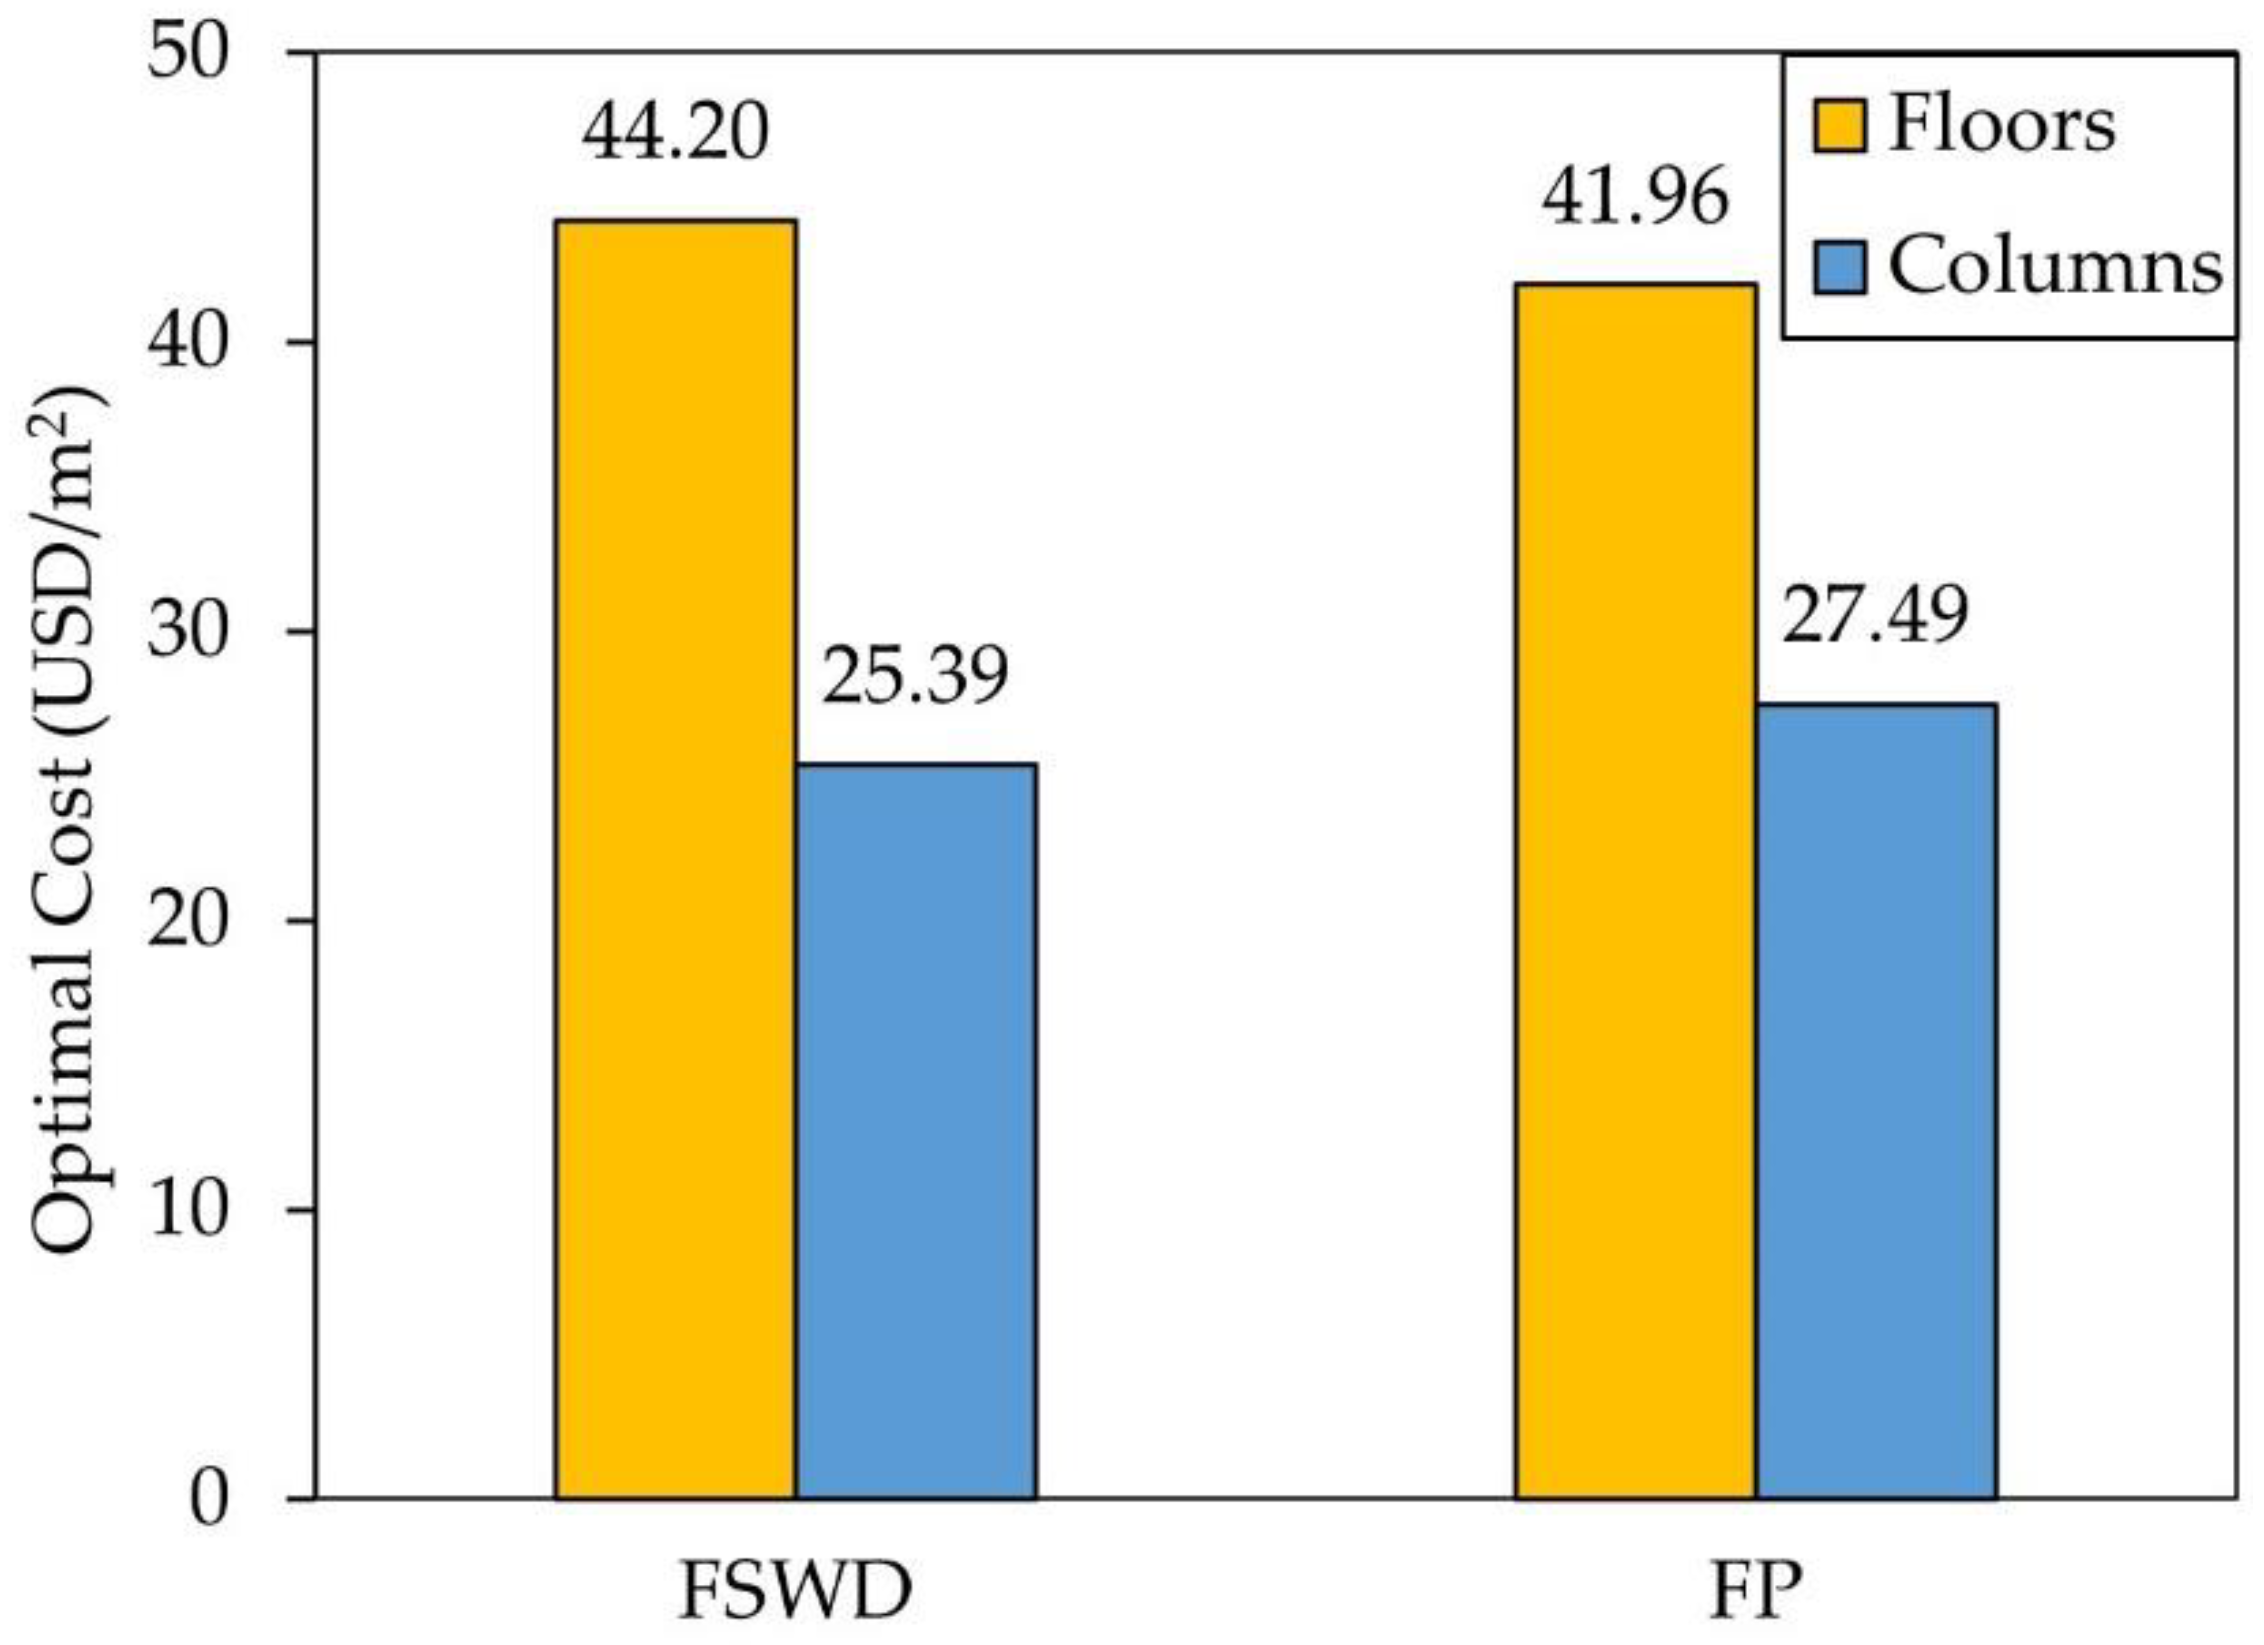
For both systems, the construction cost of columns constitutes about 40% of the total optimal cost due to the special criteria for hospital buildings compared to residential and office buildings;
-
For both systems, the steel reinforcement quantities dominantly affect the total optimal cost.
Using the study’s findings as a reference, architects and engineers could better determine the optimal configuration for hospital buildings. However, the direct costs of labor and construction materials were the only economic characteristics considered in this study. Moreover, this study did not consider the factors related to green energy and environmental issues. Thus, we recommend incorporating other key elements into the objective function in future research, such as energy consumption, carbon emissions, and maintenance during the building’s lifecycle. Furthermore, the concept of green buildings could be implemented in terms of structural materials and architectural configurations to acquire sustainable buildings.

Author Contributions

Conceptualization, A.A. and S.Y.M.; methodology, A.A., M.R. and S.Y.M.; software, A.A. and M.R.; investigation, A.A., M.R. and S.Y.M.; data curation, A.A. and M.R.; writing—original draft preparation, A.A., M.R. and S.Y.M.; writing—review and editing, A.A., M.R. and S.Y.M.; visualization, A.A. and M.R.; supervision, M.R., I.M.M. and S.Y.M.; project administration, M.R., I.M.M. and S.Y.M.; funding acquisition; A.A. All authors have read and agreed to the published version of the manuscript.

Funding

This research received no external funding.

Institutional Review Board Statement

Not applicable.

Informed Consent Statement

Not applicable.

Data Availability Statement

All data generated or used during the study are available from the corresponding author by request.

Conflicts of Interest

The authors declare no conflict of interest.

Appendix A

Table A1. Summary of optimal design parameters for all design alternatives.
Design AlternativeFloorIntermediate
Columns
Edge Columns
(x-Direction)
Edge Columns
(y-Direction)
Corner
Columns
Total Cost (USD/m2)
Floor
System
Column Spacings (m) f cu   ( MPa ) t s   ( m ) t d   ( m ) w d   ( m ) b c   ( m ) Steel Bars b c   ( m ) Steel Bars b c   ( m ) Steel Bars b c   ( m ) Steel Bars
FSWD7.2 × 7.2250.260.102.801.3028T251.3532T251.3532T250.6020T2579.22
FSWD7.2 × 8.4250.320.083.401.3532T251.5032T281.5032T280.7020T2887.57
FSWD8.4 × 8.4250.300.142.951.5032T281.5032T321.3532T280.6520T3288.31
FSWD7.2 × 7.2300.240.122.601.1528T221.3532T251.3532T250.6020T2575.32
FSWD7.2 × 8.4300.320.083.001.0024T221.5032T281.3532T320.7020T3282.80
FSWD8.4 × 8.4300.260.102.901.0024T251.4032T321.3532T320.6020T3279.21
FSWD7.2 × 7.2350.220.102.450.9524T221.4032T251.3532T250.6020T2872.94
FSWD7.2 × 8.4350.300.083.101.0024T221.3532T281.4032T320.6520T3282.44
FSWD8.4 × 8.4350.260.122.951.0024T221.3532T321.3532T320.6020T3278.10
FSWD7.2 × 7.2400.200.142.400.7520T181.3532T281.3532T280.6020T2869.82
FSWD7.2 × 8.4400.280.083.000.9024T221.5032T281.3532T320.6520T3280.69
FSWD8.4 × 8.4400.240.103.000.9024T221.3532T321.3532T320.6020T3278.25
FSWD7.2 × 7.2450.200.122.400.7520T181.2528T281.3532T280.6020T2869.60
FSWD7.2 × 8.4450.280.083.000.9024T221.5032T281.3532T320.6520T3282.13
FSWD8.4 × 8.4450.240.103.000.8524T181.4032T321.3532T320.6020T3277.99
FSWD7.2 × 7.2500.200.122.500.7020T161.3532T281.3532T280.6020T2871.21
FSWD7.2 × 8.4500.280.083.000.9024T221.5032T281.3532T320.6520T3283.58
FSWD8.4 × 8.4500.240.103.000.8524T181.4032T321.3532T320.6020T3279.22
FSWD7.2 × 7.2550.200.122.450.6520T161.3532T281.3532T280.6020T2871.87
FSWD7.2 × 8.4550.260.102.801.3532T251.4032T251.4532T280.6020T2889.85
FSWD8.4 × 8.4550.240.162.801.3532T251.4532T281.4532T280.7020T3286.71
FSWD7.2 × 7.2600.200.142.500.9024T221.3532T251.3532T250.6520T2876.94
FSWD7.2 × 8.4600.260.102.801.3532T251.3532T251.3532T280.8524T3291.09
FSWD8.4 × 8.4600.240.102.851.5032T281.4032T281.3532T280.7020T3291.41
FP7.2 × 7.2250.24--1.1028T221.3532T280.8524T250.7020T3270.04
FP7.2 × 8.4250.30--1.1028T281.1528T321.3532T320.6020T3282.18
FP8.4 × 8.4250.30--1.3532T251.5532T281.4532T280.8524T3282.72
FP7.2 × 7.2300.24--1.0024T221.3532T280.8020T280.8524T3269.45
FP7.2 × 8.4300.30--1.3532T251.3532T250.8524T251.3532T3280.93
FP8.4 × 8.4300.28--1.3532T251.5032T281.4032T280.8524T3281.24
FP7.2 × 7.2350.24--1.0524T221.3532T280.8020T280.7520T3270.85
FP7.2 × 8.4350.28--1.3532T251.3532T280.8020T280.8020T3279.13
FP8.4 × 8.4350.28--1.3532T251.5032T281.4532T280.8524T3283.03
FP7.2 × 7.2400.24--0.8524T251.3532T281.3532T280.6020T2875.56
FP7.2 × 8.4400.28--1.3532T251.3532T280.7020T250.9524T3280.11
FP8.4 × 8.4400.28--1.3532T251.5532T281.4532T280.8524T3284.84
FP7.2 × 7.2450.24--0.8524T221.3532T281.3532T280.6020T2874.93
FP7.2 × 8.4450.28--1.3532T251.3532T280.6520T251.0024T3281.46
FP8.4 × 8.4450.28--1.3532T251.5032T281.5032T280.8524T3286.39
FP7.2 × 7.2500.24--0.8524T221.3532T281.3532T280.6020T2876.19
FP7.2 × 8.4500.28--1.3532T251.3532T280.6020T251.1028T3283.18
FP8.4 × 8.4500.28--1.3532T251.5532T281.5032T280.8524T3288.22
FP7.2 × 7.2550.24--0.8020T251.3532T251.3532T251.1028T3276.94
FP7.2 × 8.4550.28--1.3532T251.3532T280.6020T221.1028T3284.13
FP8.4 × 8.4550.28--1.3532T251.5532T281.5032T280.8524T3289.76
FP7.2 × 7.2600.24--0.8020T251.3532T281.3532T280.6020T3278.91
FP7.2 × 8.4600.28--1.3532T251.3532T280.6020T221.1028T3285.60
FP8.4 × 8.4600.28--1.3532T251.5532T281.5532T280.8524T3291.64

References

  1. Gaspari, J.; Fabbri, K.; Gabrielli, L. A Study on Parametric Design Application to Hospital Retrofitting for Improving Energy Savings and Comfort Conditions. Buildings 2019, 9, 220. [Google Scholar] [CrossRef] [Green Version]
  2. Ismaeil, E.M.H.; Sobaih, A.E.E. Enhancing Healing Environment and Sustainable Finishing Materials in Healthcare Buildings. Buildings 2022, 12, 1676. [Google Scholar] [CrossRef]
  3. Gremigni, P.; Sommaruga, M.; Peltenburg, M. Validation of the Health Care Communication Questionnaire (HCCQ) to Measure Outpatients’ Experience of Communication with Hospital Staff. Patient Educ. Couns. 2008, 71, 57–64. [Google Scholar] [CrossRef] [PubMed]
  4. Laine, C.; Davidoff, F.; Lewis, C.E.; Nelson, E.C.; Nelson, E.; Kessler, R.C.; Delbanco, T.L. Important Elements of Outpatient Care: A Comparison of Patients’ and Physicians’ Opinions. Ann. Intern. Med. 1996, 125, 640–645. [Google Scholar] [CrossRef] [PubMed]
  5. Singh, H.; Haqq, E.D.; Mustapha, N. Patients’ Perception and Satisfaction with Health Care Professionals at Primary Care Facilities in Trinidad and Tobago. Bull. World Health Organ. 1999, 77, 356–360. [Google Scholar]
  6. Shyu, Y.-I.L.; Tang, W.-R.; Tsai, W.-C.; Liang, J.; Chen, M.-C. Emotional Support Levels Can Predict Physical Functioning and Health Related Quality of Life among Elderly Taiwanese with Hip Fractures. Osteoporos. Int. 2006, 17, 501–506. [Google Scholar] [CrossRef] [Green Version]
  7. Donabedian, A. Evaluating the Quality of Medical Care. Milbank Q. 2005, 83, 691–729. [Google Scholar] [CrossRef] [Green Version]
  8. Chandra, A.; Finlay, J.B.; Paul, D.P., 3rd. Overall Outpatient Satisfaction and Its Components: Perceived Changes at the Huntington VA Medical Center over Five Years. Hosp. Top. 2006, 84, 33–36. [Google Scholar] [CrossRef]
  9. Singer, S.; Götze, H.; Möbius, C.; Witzigmann, H.; Kortmann, R.-D.; Lehmann, A.; Höckel, M.; Schwarz, R.; Hauss, J. Quality of Care and Emotional Support from the Inpatient Cancer Patient’s Perspective. Langenbeck’s Arch. Surg. 2009, 394, 723–731. [Google Scholar] [CrossRef]
  10. Zhao, Y.; Mourshed, M. Patients’ Perspectives on the Design of Hospital Outpatient Areas. Buildings 2017, 7, 117. [Google Scholar] [CrossRef] [Green Version]
  11. Jiménez Mejía, K.; Barbero-Barrera, M.d.M.; Rodríguez Pérez, M. Evaluation of the Impact of the Envelope System on Thermal Energy Demand in Hospital Buildings. Buildings 2020, 10, 250. [Google Scholar] [CrossRef]
  12. Liu, A.; Ma, Y.; Miller, W.; Xia, B.; Zedan, S.; Bonney, B. Energy Analysis and Forecast of a Major Modern Hospital. Buildings 2022, 12, 1116. [Google Scholar] [CrossRef]
  13. Ma, Y.; Zedan, S.; Liu, A.; Miller, W. Impact of a Warming Climate on Hospital Energy Use and Decarbonization: An Australian Building Simulation Study. Buildings 2022, 12, 1275. [Google Scholar] [CrossRef]
  14. Andersen, A.R.; Nielsen, B.F.; Reinhardt, L.B. Optimization of Hospital Ward Resources with Patient Relocation Using Markov Chain Modeling. Eur. J. Oper. Res. 2017, 260, 1152–1163. [Google Scholar] [CrossRef] [Green Version]
  15. Helm, J.E.; Van Oyen, M.P. Design and Optimization Methods for Elective Hospital Admissions. Oper. Res. 2014, 62, 1265–1282. [Google Scholar] [CrossRef]
  16. Rady, M.; Mahfouz, S.Y.; Taher, S.E.-D.F. Optimal Design of Reinforced Concrete Materials in Construction. Materials 2022, 15, 2625. [Google Scholar] [CrossRef]
  17. Lee, D.; Kim, S.; Kim, S. Development of Hybrid Model for Estimating Construction Waste for Multifamily Residential Buildings Using Artificial Neural Networks and Ant Colony Optimization. Sustainability 2016, 8, 870. [Google Scholar] [CrossRef] [Green Version]
  18. Robati, M.; Mccarthy, T.J.; Kokogiannakis, G. Integrated Life Cycle Cost Method for Sustainable Structural Design by Focusing on a Benchmark Office Building in Australia. Energy Build. 2018, 166, 525–537. [Google Scholar] [CrossRef] [Green Version]
  19. Ženíšek, M.; Pešta, J.; Tipka, M.; Kočí, V.; Hájek, P. Optimization of RC Structures in Terms of Cost and Environmental Impact—Case Study. Sustainability 2020, 20, 8532. [Google Scholar] [CrossRef]
  20. Rady, M.; Mahfouz, S.Y. Effects of Concrete Grades and Column Spacings on the Optimal Design of Reinforced Concrete Buildings. Materials 2022, 15, 4290. [Google Scholar] [CrossRef]
  21. Sahab, M.G.; Ashour, A.F.; Toropov, V.V. Cost Optimisation of Reinforced Concrete Flat Slab Buildings. Eng. Struct. 2005, 27, 313–322. [Google Scholar] [CrossRef]
  22. The Ministry of Housing Utilities and Urban Communities. Egyptian Code for Design and Construction of Concrete Structures (ECP 203-2020), 4th ed.; Housing and Building National Research Center: Cairo, Egypt, 2020. [Google Scholar]
  23. The Ministry of Housing Utilities and Urban Communities. Egyptian Code for Calculating Loads and Forces in Structural Work and Masonry; Housing and Building National Research Center (HBRC): Cairo, Egypt, 2019. [Google Scholar]
  24. The Ministry of Housing Utilities and Urban Communities. Egyptian Guidelines for Hospitals and Healthcare Facilities (EGH 360-2010); Housing and Building National Research Center: Cairo, Egypt, 2010. [Google Scholar]
  25. Waheed, J.; Azam, R.; Riaz, M.R.; Shakeel, M.; Mohamed, A.; Ali, E. Metaheuristic-Based Practical Tool for Optimal Design of Reinforced Concrete Isolated Footings: Development and Application for Parametric Investigation. Buildings 2022, 12, 471. [Google Scholar] [CrossRef]
  26. Platt, B.S.; Mtenga, P.V. Parametric Optimization of Steel Floor System Cost Using Evolver. WIT Trans. Built Environ. 2007, 91, 119–128. [Google Scholar] [CrossRef] [Green Version]
  27. Farmakis, P.M.; Chassiakos, A.P. Genetic Algorithm Optimization for Dynamic Construction Site Layout Planning. Organ. Technol. Manag. Constr. Int. J. 2018, 10, 1655–1664. [Google Scholar] [CrossRef]
  28. Neufert, E.; Neufert, P. Architects’ Data; John Wiley & Sons: Hoboken, NJ, USA, 2012. [Google Scholar]
  29. Crosbie, M.; Callender, J. Time-Saver Standards for Architectural Design Data, 7th ed.; Watson, D., Ed.; McGraw Hill: New York, NY, USA, 1997. [Google Scholar]
  30. The Ministry of Housing Utilities and Urban Communities. The Monthly Bulletins of Average Retail Prices of Major Important Building Materials. Available online: http://www.mhuc.gov.eg/programs/index/2168 (accessed on 6 November 2022).
Figure 1. Flowchart of Evolver’s GA methodology.
Buildings 12 02195 g001
Figure 2. Hospital building’s plan layout scheme.
Buildings 12 02195 g002
Figure 3. Column and middle strips for flat slabs: (a) FSWD; (b) FP.
Buildings 12 02195 g003
Figure 4. Applied wind pressures and forces on the building: (a) pressure distribution; (b) force distribution.
Buildings 12 02195 g004
Figure 5. Elastic-design response spectrum.
Buildings 12 02195 g005
Figure 6. Lateral earthquake load distribution.
Buildings 12 02195 g006
Figure 7. Critical sections of punching shear: (a) FSWD; (b) FP.
Buildings 12 02195 g007
Figure 8. Decision variables: (a) flat slab with drops (FSWD); (b) flat plates (FP).
Buildings 12 02195 g008
Figure 9. Effects of population size on mean optimal cost: (a) FSWD; (b) FP.
Buildings 12 02195 g009
Figure 10. Effects of crossover rate on mean optimal cost: (a) FSWD; (b) FS.
Buildings 12 02195 g010
Figure 11. Effects of mutation rate on mean optimal cost: (a) FSWD; (b) FP.
Buildings 12 02195 g011
Figure 12. Comparison between FSWD design alternatives.
Buildings 12 02195 g012
Figure 13. Comparison between FP design alternatives.
Buildings 12 02195 g013
Figure 14. Effects of slab thickness on the optimal cost: (a) FSWD; (b) FP.
Buildings 12 02195 g014
Figure 15. Distribution of materials and labor costs for the best design alternatives.
Buildings 12 02195 g015
Figure 16. Distribution of structural elements costs for the best design alternatives.
Buildings 12 02195 g016
Table 1. Input parameters for the tuning design problem.
ParameterValue
Concrete unit weight25.0 kN/m3
Steel unit weight78.5 kN/m3
Concrete compressive strength25 MPa
High tensile steel strength420 MPa
Mild steel strength240 MPa
Floor covering load1.5 kPa
Live load2.0 kPa
Building side length in each direction30.0 m
Number of spans in each direction6
Story height3.0 m
Table 2. Geometrical constraints for hospital buildings.
ParameterValue
Minimum corridor width2.4 m
Minimum side length for regular rooms3.6 m
Minimum side length for special surgery rooms7.0 m
Bed’s gross area80 m2
Minimum area for general surgery rooms30 m2
Minimum area for special surgery rooms50 m2
Table 3. Lateral design parameters.
ParameterValue
ZoneC
Air   density   ( ρ )1.25 kg/m3
Wind speed (v)33 m/s
Coefficient   of   topography   ( C T )1
Structural   factor   ( C s )1
Correction   factor   ( λ )1
Gravitational acceleration (g)9.81 m/s2
Design   ground   acceleration   ( a g )1.47 m/s2
Importance   factor   ( γ 1 )1.4
Soil typeC
Soil type factor 1 (s)1.5
Soil   type   factor   2   ( T c )0.25
Response modification factor (R)5
Material   factor   ( C t )0.05
Fundamental period0.73 s
Live load (L)4 kPa
Live load seismic coefficient (α)0.5
Total building’s height (H)36 m
Table 4. Compressive strength f cu variants.
f cu   ( MPa ) Unit   Rate   R c   ( USD / m 3 )
2557.03
3060.56
3564.09
4067.67
4571.15
5074.67
5578.20
6081.73
Table 5. Increments and cover spacings for decision variables.
VariableIncrement (cm)Cover Spacing (cm)
Slab thickness22
Drop thickness22
Drop width55
Column width52.5
Table 6. Design parameters of the best design alternative for each floor system.
Design AlternativeFloorIntermediate
Columns
Edge Columns (x-Direction)Edge Columns (y-Direction)Corner
Columns
Total Cost (USD/m2)
Floor
System
Column Spacings (m) f cu   ( MPa ) t s
(m)
t d
(m)
w d   ( m ) b c
(m)
Steel Bars b c
(m)
Steel Bars b c
(m)
Steel Bars b c
(m)
Steel Bars
FSWD7.2 × 7.2450.200.122.400.7520T181.2528T281.3532T280.6020T2869.59
FP7.2 × 7.2300.24--1.0024T221.3532T280.8020T280.8524T3269.44
Publisher’s Note: MDPI stays neutral with regard to jurisdictional claims in published maps and institutional affiliations.

