Article

The Impact of Evaluated Daylight to the Total Light Ratio on the Comfort Level in Office Buildings

1
Institute for Renewable Energy, Eurac Research, Viale Druso 1, 39100 Bolzano, Italy
2
Department of Architectural Technology, Faculty of Architecture and Urbanism, University of Art, Tehran 1136813518, Iran
*
Author to whom correspondence should be addressed.
Buildings 2022, 12(12), 2161; https://doi.org/10.3390/buildings12122161
Submission received: 3 November 2022 / Revised: 4 December 2022 / Accepted: 5 December 2022 / Published: 7 December 2022
(This article belongs to the Topic Built Environment and Human Comfort)

Abstract

:
One of the main challenges in visual comfort assessment is controlling daylight in indoor spaces. The effect of daylight’s contribution to total light is one of the variables influencing how people perceive illumination in an indoor environment. This study investigates the optimal day-light-to-total light ratio that delivers the most satisfaction with the lighting environment. Therefore, a subjective survey of 509 questionnaires and field measurements in six office buildings in Tehran with a total of 257 rooms was conducted to assess lighting quality (daylight and artificial light). Furthermore, the effects of building characteristics and seasons on the acceptable range of daylight ratio are investigated. The results reveal that occupants prefer daylight to total light ratio ranging between 0.56 and 0.8. In contrast, occupants reported that a ratio less than 0.4 was unacceptable. It was also found that the optimum daylight-to-total light ratio is influenced by the season and the building characteristics.

1. Introduction

The relationship between occupants’ comfort and daylight as a natural and dynamic source of light is difficult to control. The availability of daylight in indoor spaces is influenced by location, weather conditions, windows and shading systems. However, because daylight raises room temperature, inappropriate daylight control can cause visual discomfort and glare for building occupants [1]. Visual performance is known to improve as illumination intensity increases; however, the light intensity does not necessarily have a favorable impact. It may, however, cause glare and visual discomfort. Different illuminance values and light properties are also known to influence cognitive performance [2]. In particular, the variations in daylight’s illuminance range have a remarkable effect on cognitive performance [3]. Therefore, in order to provide an environment that is visually comfortable and that has a good impact on occupants’ cognitive performance, it is crucial to control the contribution of daylight to the amount of lighting in the indoor environment.
Many researchers have focused on assessing green-certified building performance regarding IEQ and occupants’ satisfaction [4], and defining acceptable conditions for daylight and artificial light. In addition, in many standards, various metrics are used as physical measures to assess visual conditions in different building types and define acceptable thresholds [5]. Each metric provides a measure to predict and control the important lighting and visual comfort parameters in different ways and levels [6]. Generally, two kinds of static and dynamic metrics assess various aspects of daylight. Static metrics are mostly illuminance-based metrics such as Daylight Factor (DF) [7,8], which have been used for a long time in building recommendations and standards [9]. In BS8206-2 Lighting for buildings, the acceptable average daylight factor is at least 2% [10]. In most standards, the recommended illuminance level for office spaces on work planes is 500 lx. For instance, the Canadian Labor Code, NS-EN 12464–1:2011, Chartered Institution of Building Services Engineers (CIBSE), and Illuminating Engineering Society of North America (IESNA) suggest a minimum illuminance of 500 lx on the work plane in office environments [11,12,13]. However, in many standards, the suggested minimum illuminance is defined primarily in terms of economic considerations rather than technical criteria of comfort conditions [14,15].
Concerning the illuminance level, many studies have confirmed that occupants prefer much higher lighting levels in their office environment than what is typically suggested by recommendations and standards [16]. Another issue connected to environmental lighting is the importance of daylight on human well-being [17]. Both artificial and natural lighting impact subjective responses to lighting impressions and mood states [18]. For the human circadian timing system to function properly, it must be exposed to both darkness and daylight during the daytime. One benefit of natural light is that it requires less corneal illuminance than artificial light does. [19]. Some studies have introduced criteria for evaluating circadian lighting [20], such as the equivalent melanopic lux (EML) [21] and the Circadian Stimulus (CS) [22]. In addition, several studies focused on controlling artificial light to steady the light level in the working environment [21].
Previous studies indicate differences between the acceptable lighting levels for natural and artificial light. It was demonstrated that when artificial light is the lighting source, the inhabitants’ preferred illumination ranges from 100 to 800 lx [23,24,25]. Laurent et al. [26] showed that people prefer 300 lx in their office spaces when daylight is the only light source. Galasiu and Veitch [27] found that users preferred a low artificial light level when daylight was available in working areas. However, when illuminance by daylight was available below 100 lx, many people preferred adding 280 lx. There is a gap in earlier studies that considers the impact of daylight contribution in the combined usage of daylight and artificial light, even though several studies have been undertaken on the optimal lighting level using natural and artificial lighting sources individually. In other words, previous studies did not consider how occupants assess the lighting environment, and how they are influenced by the proportion of natural and artificial illumination in a space. The integration of daylight and artificial light is gaining more attention to reach a comfortable environment for occupants in indoor spaces.
To address this gap, a new metric for assessing the contribution of natural and artificial light in the indoor environment is necessary. Therefore, the current study conducts a survey combined with the onside measurement of physical lighting quantity as an evaluation method to define satisfying lighting conditions in the workplace. This is carried out in a real space following a long-standing interaction between the user and the building. This study attempted to determine how occupants evaluate the ratio of daylight to artificial light in their offices. The aim is to define the original metric to assess the optimum balance of natural to the total light ratio (DTR) which is the new metric for evaluating the lighting environment. In addition to daylight levels, this study examines additional factors that affect the lighting environment in indoor spaces, such as window characteristics [28,29,30,31,32] and the impact of seasons [33] on the defined acceptable daylight ratio range.

2. Materials and Methods

Two main methods to assess influential parameters for evaluating lighting in office spaces are a test room (or a controlled environment) and a field study. There are two advantages of controlling ambient conditions in test rooms and using high-quality measurement technology, which results in high accuracy for the measured values. However, the test room is not the “real” occupants’ office environment since they spend a few minutes or hours in this room. In addition, only a few volunteers can be interviewed simultaneously in test room studies, thereby limiting the sample size, while field studies consider real influential parameters. Psychosocial factors such as the presence of other colleagues in real working environments are retained. In this field study, the research method contains three main steps: First, case studies were identified, then necessary data were gathered from field measurements, and the occupants’ completed questionnaires. Second, the desired illumination was defined using statistical data analysis from field measurements and the correlation between variables and employee responses. Finally, the preferred daylight-to-total light ratio was presented.

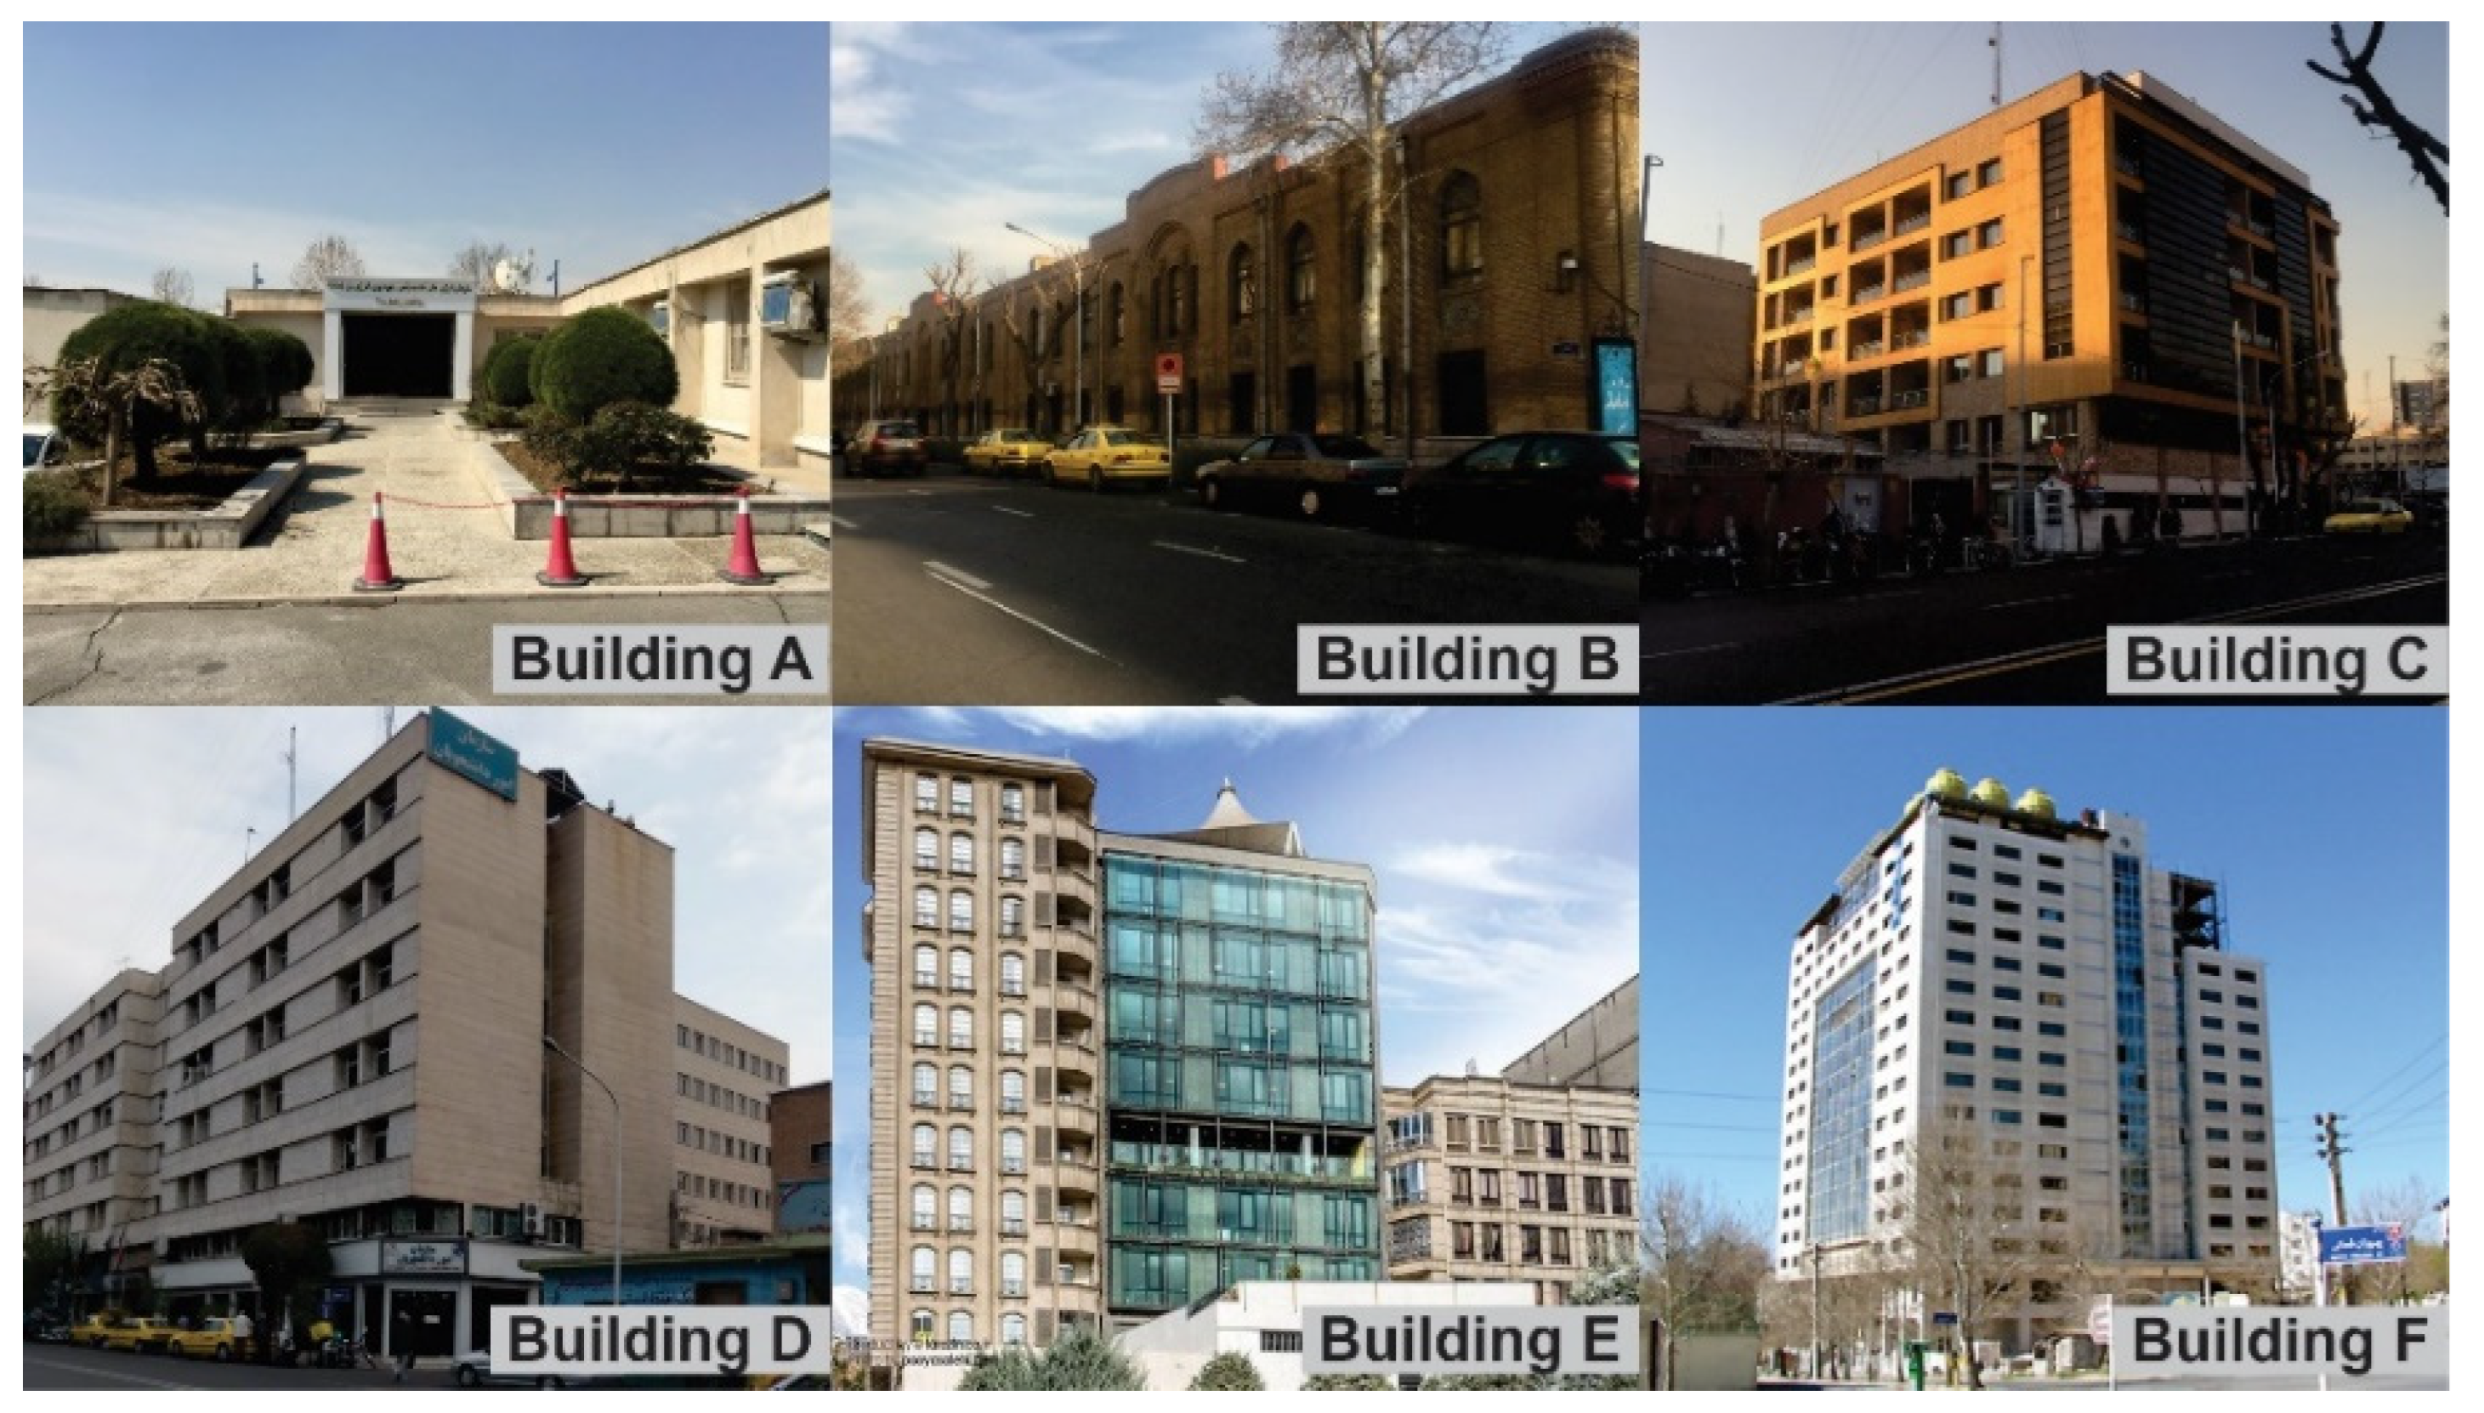
2.1. Buildings and Survey Population

This study was conducted in six office buildings in Tehran, Iran, with 109 rooms in winter and 148 rooms in summer (Figure 1). The buildings were selected to consider different spaces in building age (old and new ones), one-story and high-rise buildings, cubicles, and open-plan offices with various window orientations with an optional atrium/outside window. The selected rooms were occupied by one, two, or multiple people. The interior electric lighting in all buildings is linear fluorescent lamps (low-pressure mercury-vapor gas-discharge lamps), cool white with a color temperature between 4000 K and 5000 K, and a color rendering index (CRI) between 70 and 80. To control the effect of the reflection coefficient of the interior walls, the selected rooms had the same wall color. The general features of buildings are mentioned in Table 1. More detail about the case studies is mentioned in the previous publication [34].
According to Table 1, the case studies are not much different in both the window-to-wall ratio (WWR) and the window-to-floor ratio (WFR) except for building E, where these two parameters are much higher than the other case studies. The interior surfaces and reflections are similar (ceiling 0.75–0.8, wall 0.65–0.70, floor 0.6–0.65).
The survey involved 229 questionnaires filled in winter and 280 in summer (a total of 509 valid questionnaires). 44.1% of participants were male, and 55.9% were female. The occupants ranged in age from 22 to 68, with a mean of 38. Most participants have been working in their rooms for at least three months to ensure that they have adapted to the working environment. Additionally, most of them worked in their workplaces for over six hours per day. Before 11:30 a.m., 136 questions were completed, followed by 244 between 11:30 and 13:30, and 129 after 13:30.

2.2. Data Collection

Field measurements of physical parameters and data from completed questionnaires were used to collect two types of data. The researchers measured and calculated the space characteristics, outdoor obscurations such as a tree or other buildings, and light source characteristics in the first part of the questionnaire. Participants completed the second section, which included individual elements, as well as their assessment of the lighting environment.

2.3. Field Measurement

The surveys and field measurements were conducted during summer from 3 July to 23 July, from 9:00 a.m. to 5:00 p.m., and during winter, from 30 January to 25 February 2018, from 9:00 a.m. to 4:00 p.m. during working hours to consider the seasons’ influence. Illuminance at the desk level (0.80 m above the floor) was measured once with electric lighting and once without it. To measure the daylight level, the lights were turned off. The questionnaires were filled out once with electric lighting and once without it.
In each room, three illuminance meters LX-1128SD with resolution 1 lx and accuracy of ± (4% + 2dgt) have been used. These devices have three ranges of measurements: from 0 to 1999 lx, 1800–19,990 lx, and 18,000–99,900 lx. The first range was nominated for the measurement (the maximum illuminance was 1298 lx in building E in a south-facing office room). In each room, lux meters were located at the user’s desk level height of 0.80 m above the floor. The data were recorded every 10 s for 30 min while occupants were filling out the questionnaires. The lighting investigated in the statistical correlation is the average measured illumination during these 30 min. The illuminance measurement was done with and without artificial light using lamps with an on/off switch. Therefore, daylight, artificial light level, and total illumination were collected. These three illuminance meters were situated on the participants’ workstations, 1.5 m from the window, and 1 m from the wall in front of the window. However, the amount of illumination measured on the users’ desks while they filled out the questionnaire was the one used for data analysis. The devices used in this project were new and were purchased for this project. To ensure the correct functioning of the devices, we compared the numbers measured in the devices with each other and with the devices we already had and were sure of their calibration.

2.4. Questionnaire

A subjective survey can determine visual comfort in office spaces [35]. The vertical and horizontal illuminance evaluations have already been performed through individual questionnaires in past studies [36,37,38,39,40,41,42,43]. A longitudinal approach via a survey has been conducted to explain the relationship between employees, their working space, and their perceived lighting environments. The occupants’ responses to the questions were evaluated with measured physical parameters to assess the lighting of the buildings. The questionnaire was used to examine the participant’s sensation and satisfaction levels with the office environment [44]. The questionnaire was designed using previous studies having similar variables [36,40,45,46], which include two main parts (1) related to the participants’ general information, such as age and gender, and (2) related to the participants’ sensation and satisfaction with the lighting environment (Table A1), which are classified as follows:
  • Evaluating the satisfaction with the lighting environment
  • Evaluating the satisfaction with daylight amount in comparison with artificial light
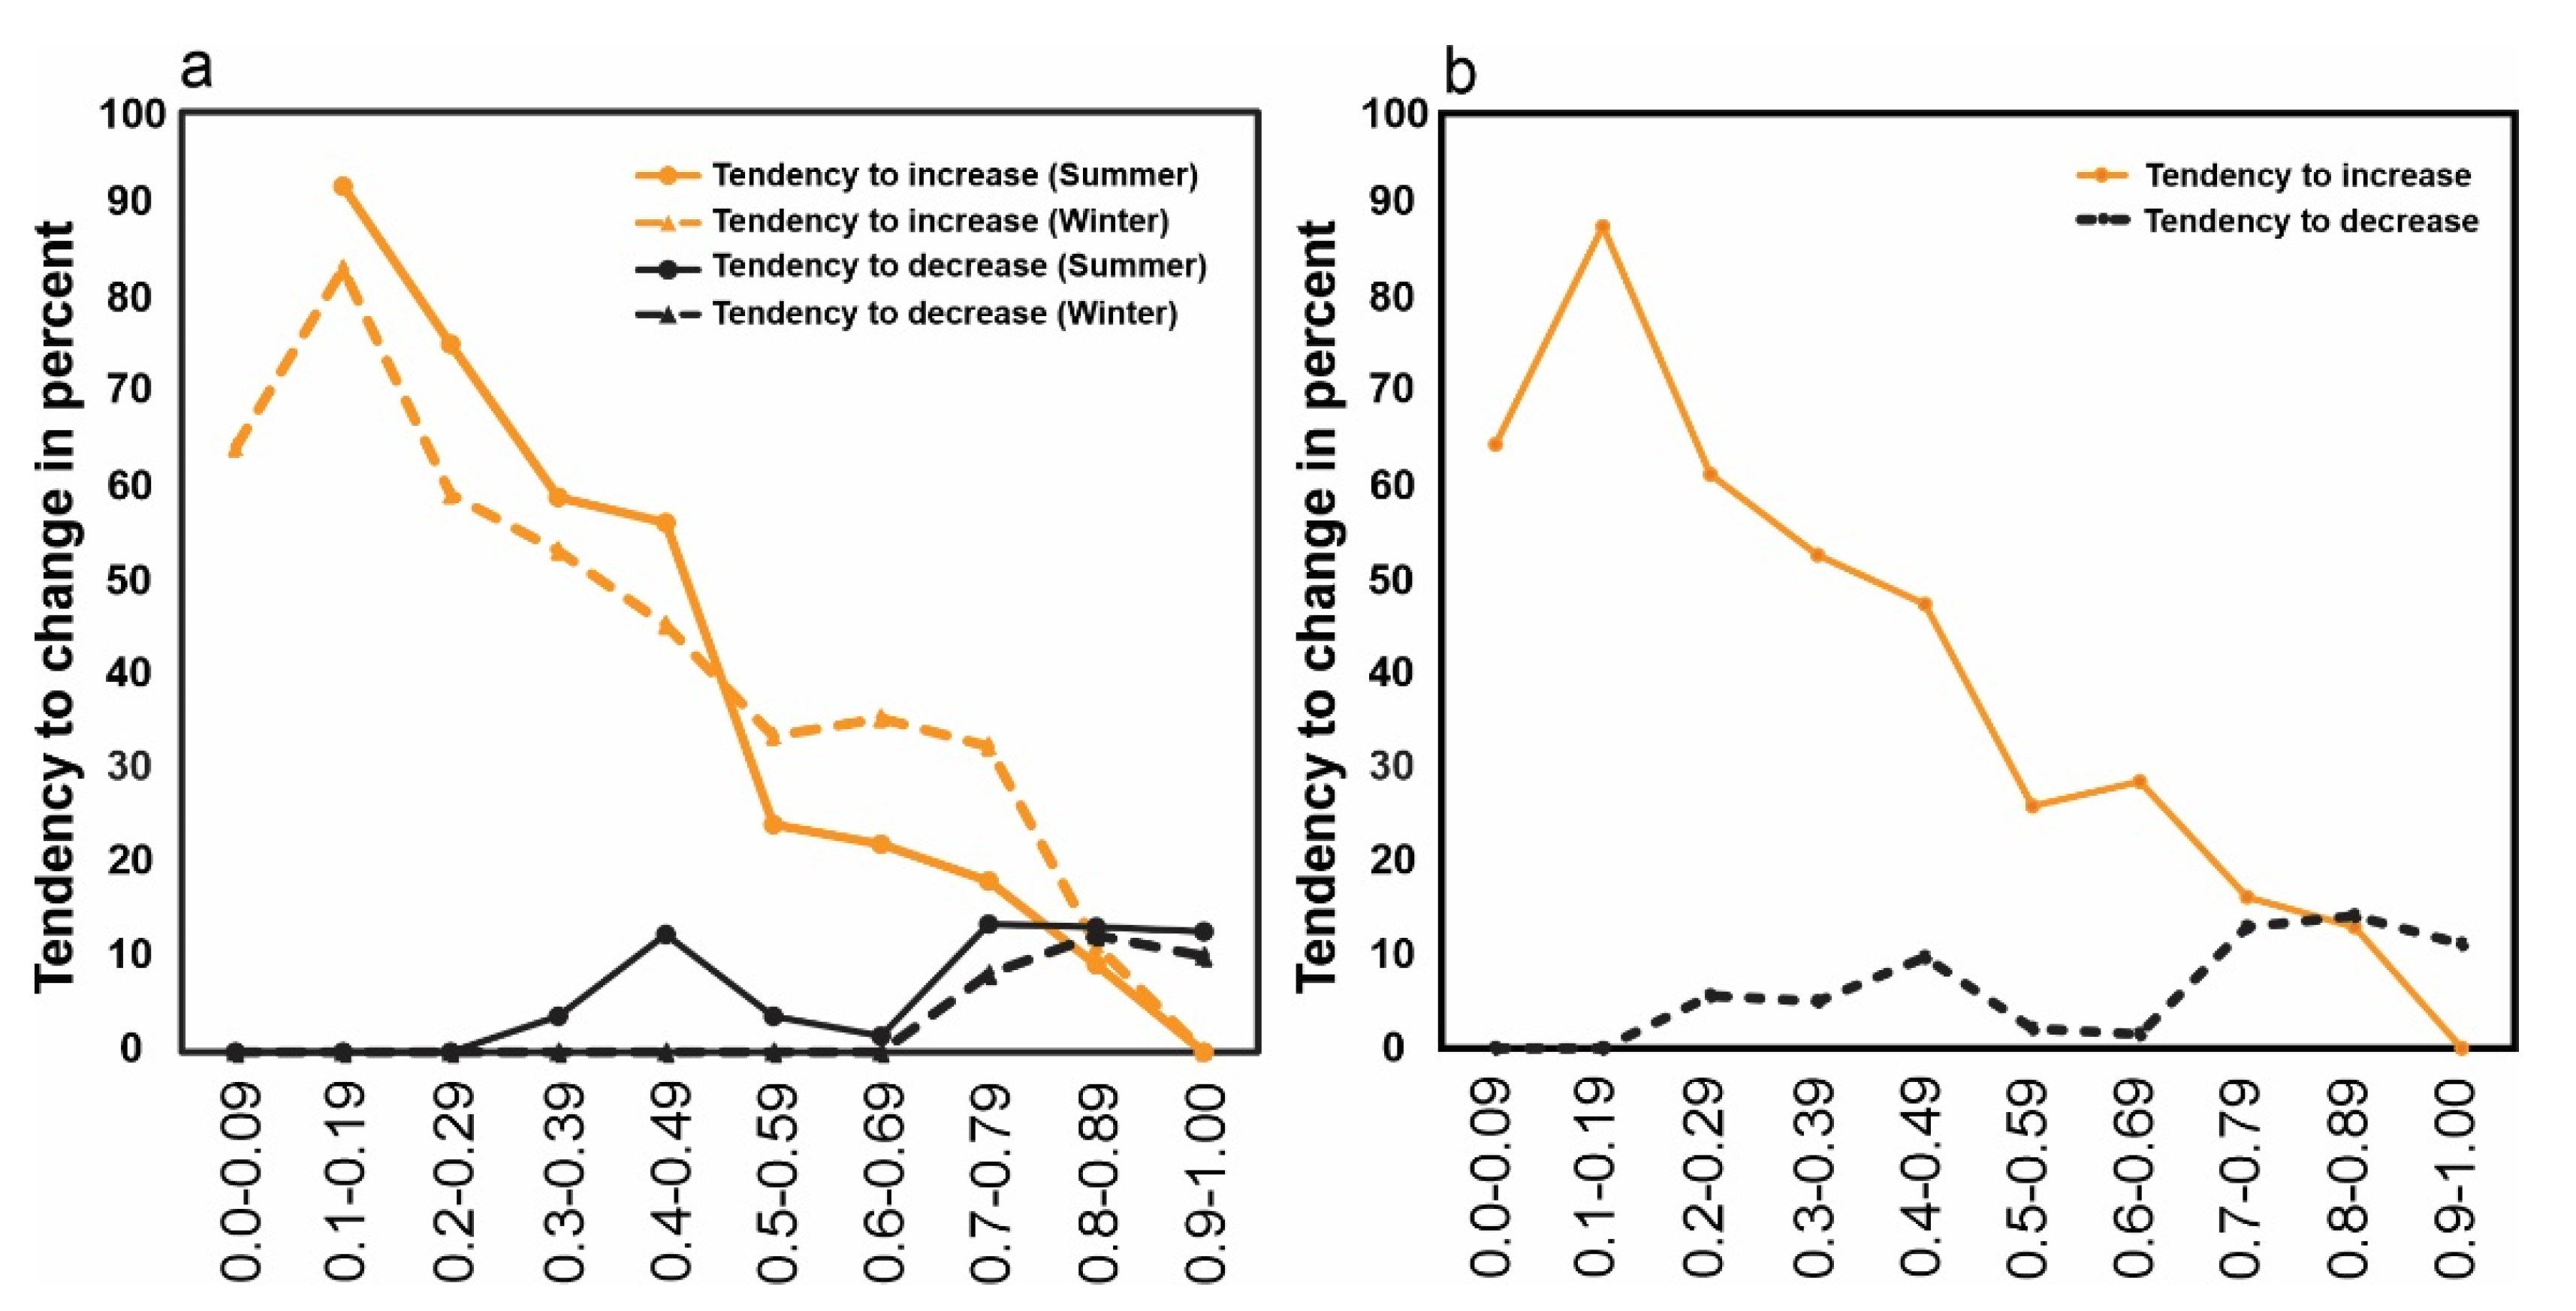
  • Tendency to change the quantity of light
A five-point Likert scale, one of the most used ranking scales in lighting research, is used to quantify occupants’ evaluation levels of environmental conditions. The paper-based questionnaires were written in Persian (the English translation of the questionnaire is presented in Appendix A). The questionnaire’s Likert scale values for very little, little, average, much, and too much have been assumed to be 1,2,3,4,5, respectively. The other collected data are related to the buildings and offices’ characteristics, such as type of building, floor level, and window orientation, which was gathered by the authors. To find the optimum DTR, each person filled out a questionnaire for the conditions with the combination of both daylight and artificial light at their positions, with just daylight or artificial light. Each participant answered questions for assessing the perceived lighting level, lighting satisfaction, and tendency to change the amount of light three times (daylight with lamps off, artificial light with completely covered windows, and a combination of daylight and artificial light). The primary data used in the analysis is based on questionnaire sections filled out under a combination of daylight and artificial light to determine the optimal DTR. The rest of the questions (with both natural and artificial light) were used to control the participants’ responses. Participants were chosen from different groups and assigned to different lighting exposures. For this study, we used a questionnaire stating that occupants did not experience glare.

2.5. Data Analysis

The measurement and survey data include different kinds of information on different scales (nominal, ordinal, interval, and ratio scale). For instance, the physical measures, such as illuminance, are interpreted as a continuous scale, and the answers to the questions with a Likert 5-point scale (from “very little” to “very much”) are taken as an ordinal scale. In contrast, individual characteristics such as gender are nominal. For the statistical analysis of collected data, various statistical tests in the IBM SPSS Statistics version 25.0 (SPSS Inc. Chicago, IL, USA) were used. The statistical data analysis includes two main sections; the first section investigates the correlation between illuminance level and the satisfaction level of occupants with the lighting environment. The second section compares lighting comfort levels in various environments to investigate visual comfort in different spaces.
The Spearman rank correlation coefficient is a non-parametric measure that assesses statistical dependence between two variables using a monotonic function to describe their relationship, usually applied to quantitative variables [47,48]. Spearman rho correlations are appropriate in the ordinal scale for defining a correlation among environmental parameters and subjective responses [49,50,51,52]. In the Spearman correlation, the association between the two variables is statistically significant when the p-value is less than 0.05 (typically ≤ 0.05). Comparisons of lighting comfort levels between office characteristics (cubicles/open office, one-sided/two-sided window) and different seasons (summer/winter) are based on t-tests. One-way ANOVA is used to compare lighting comfort levels in the studied building. In order to find the optimal DTR regarding building type and season, descriptive analysis is used.

3. Results

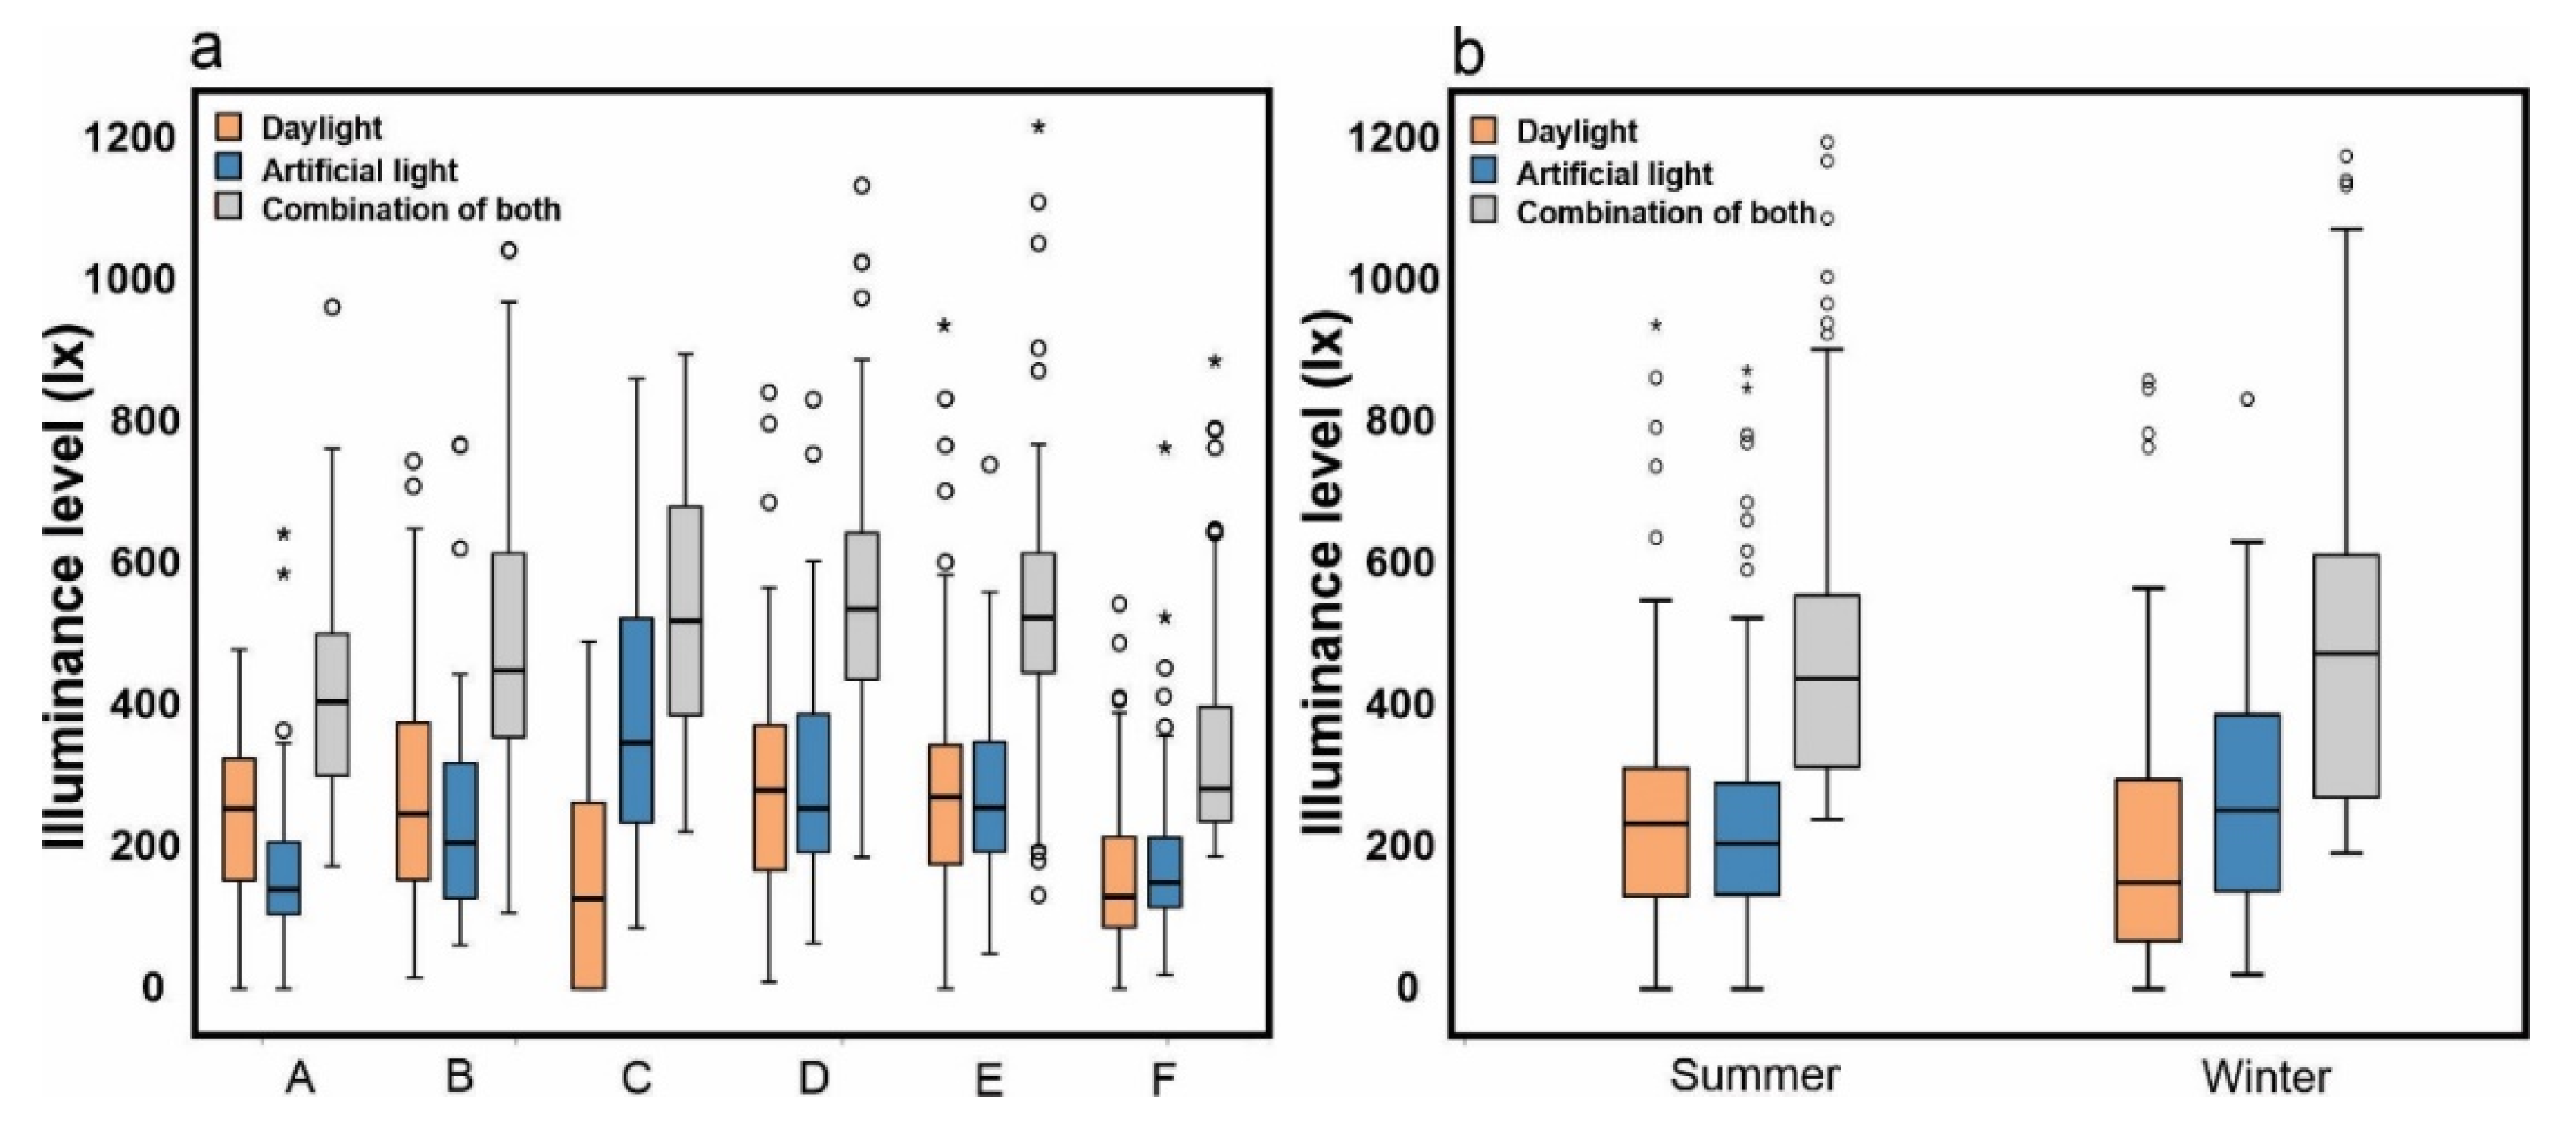
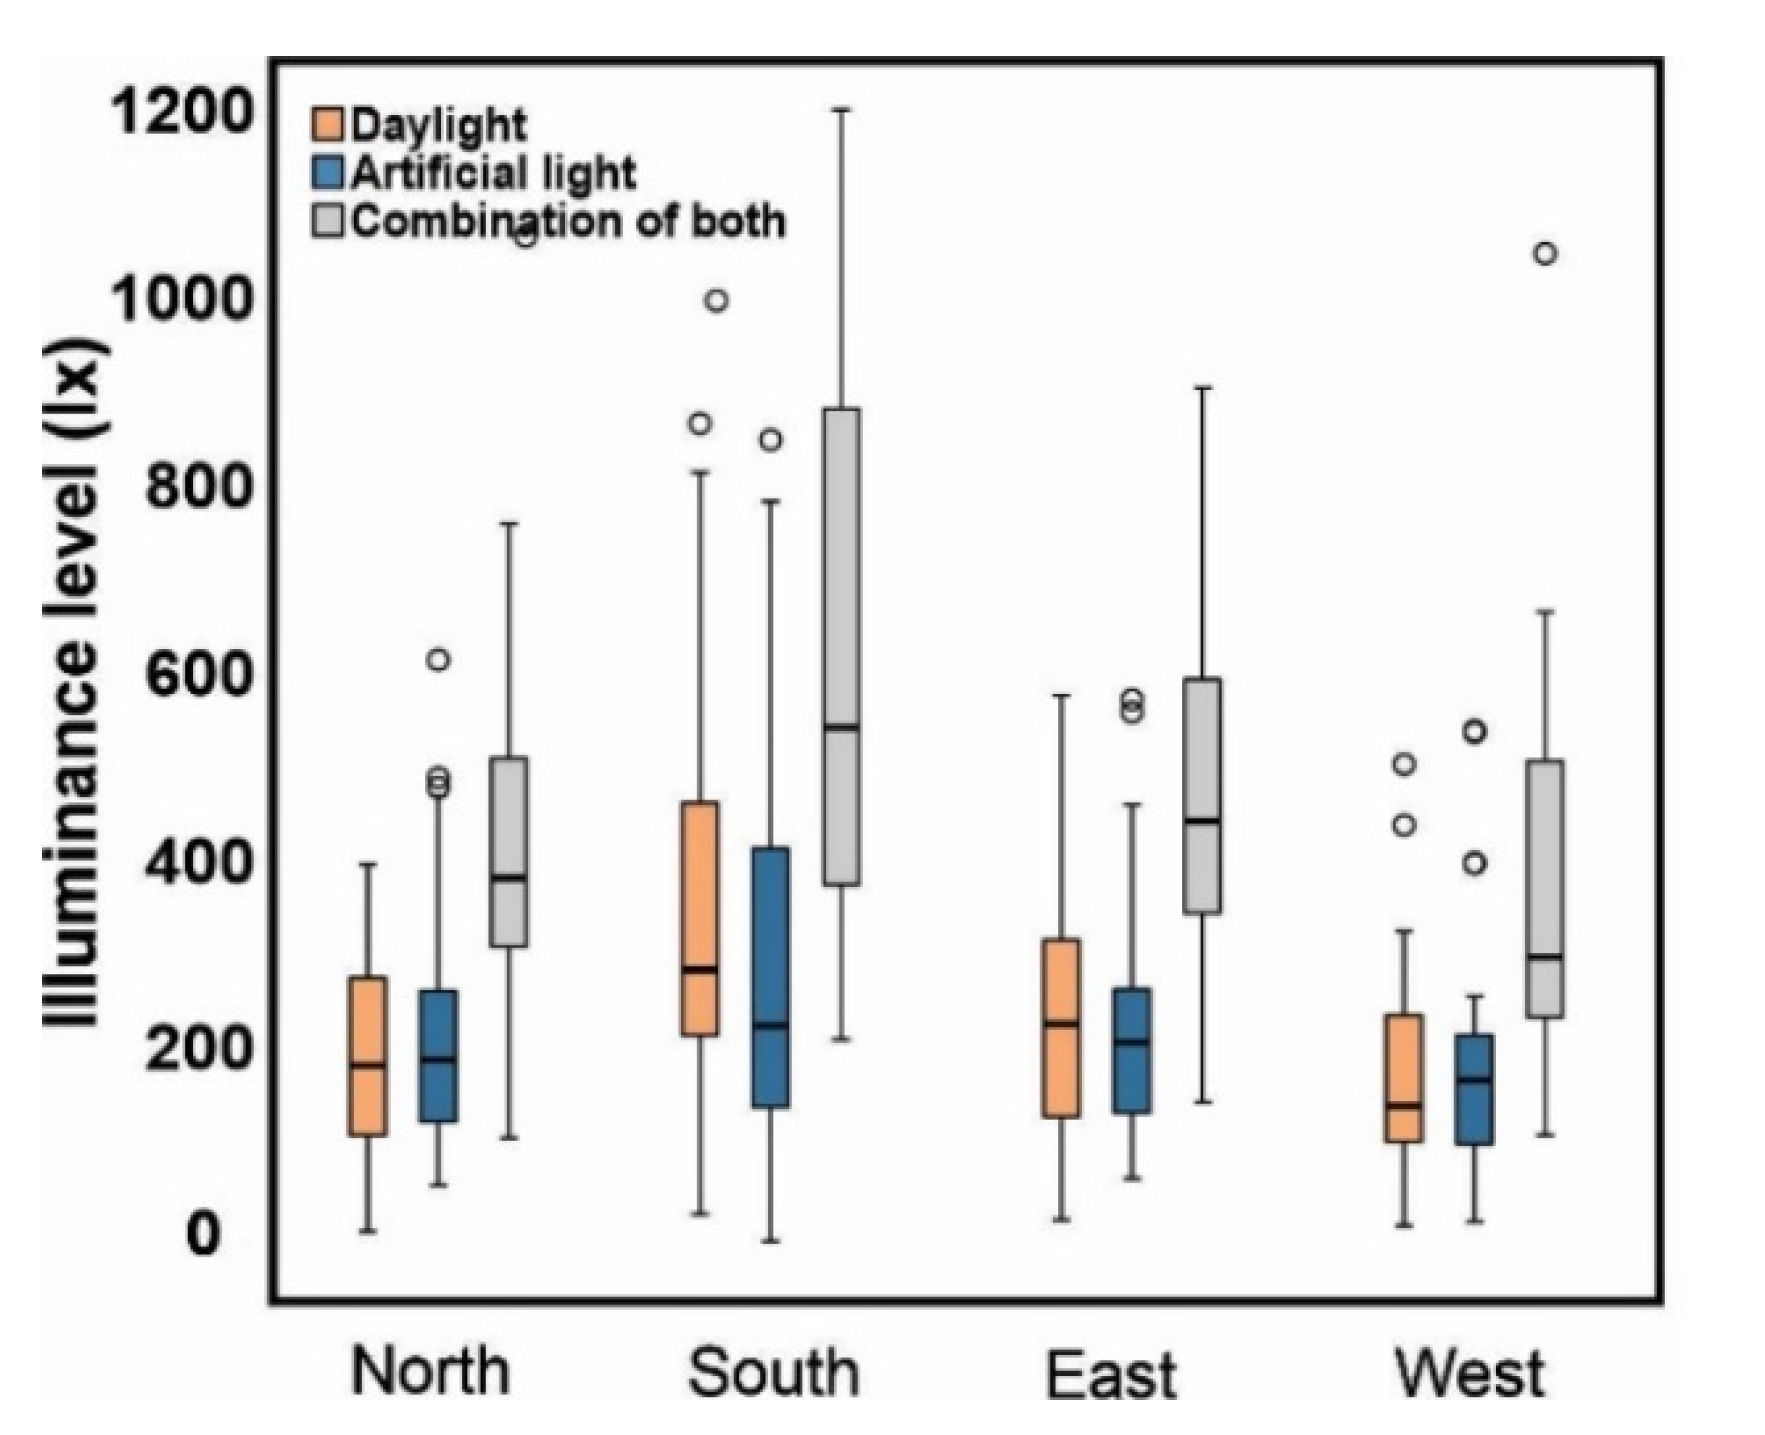
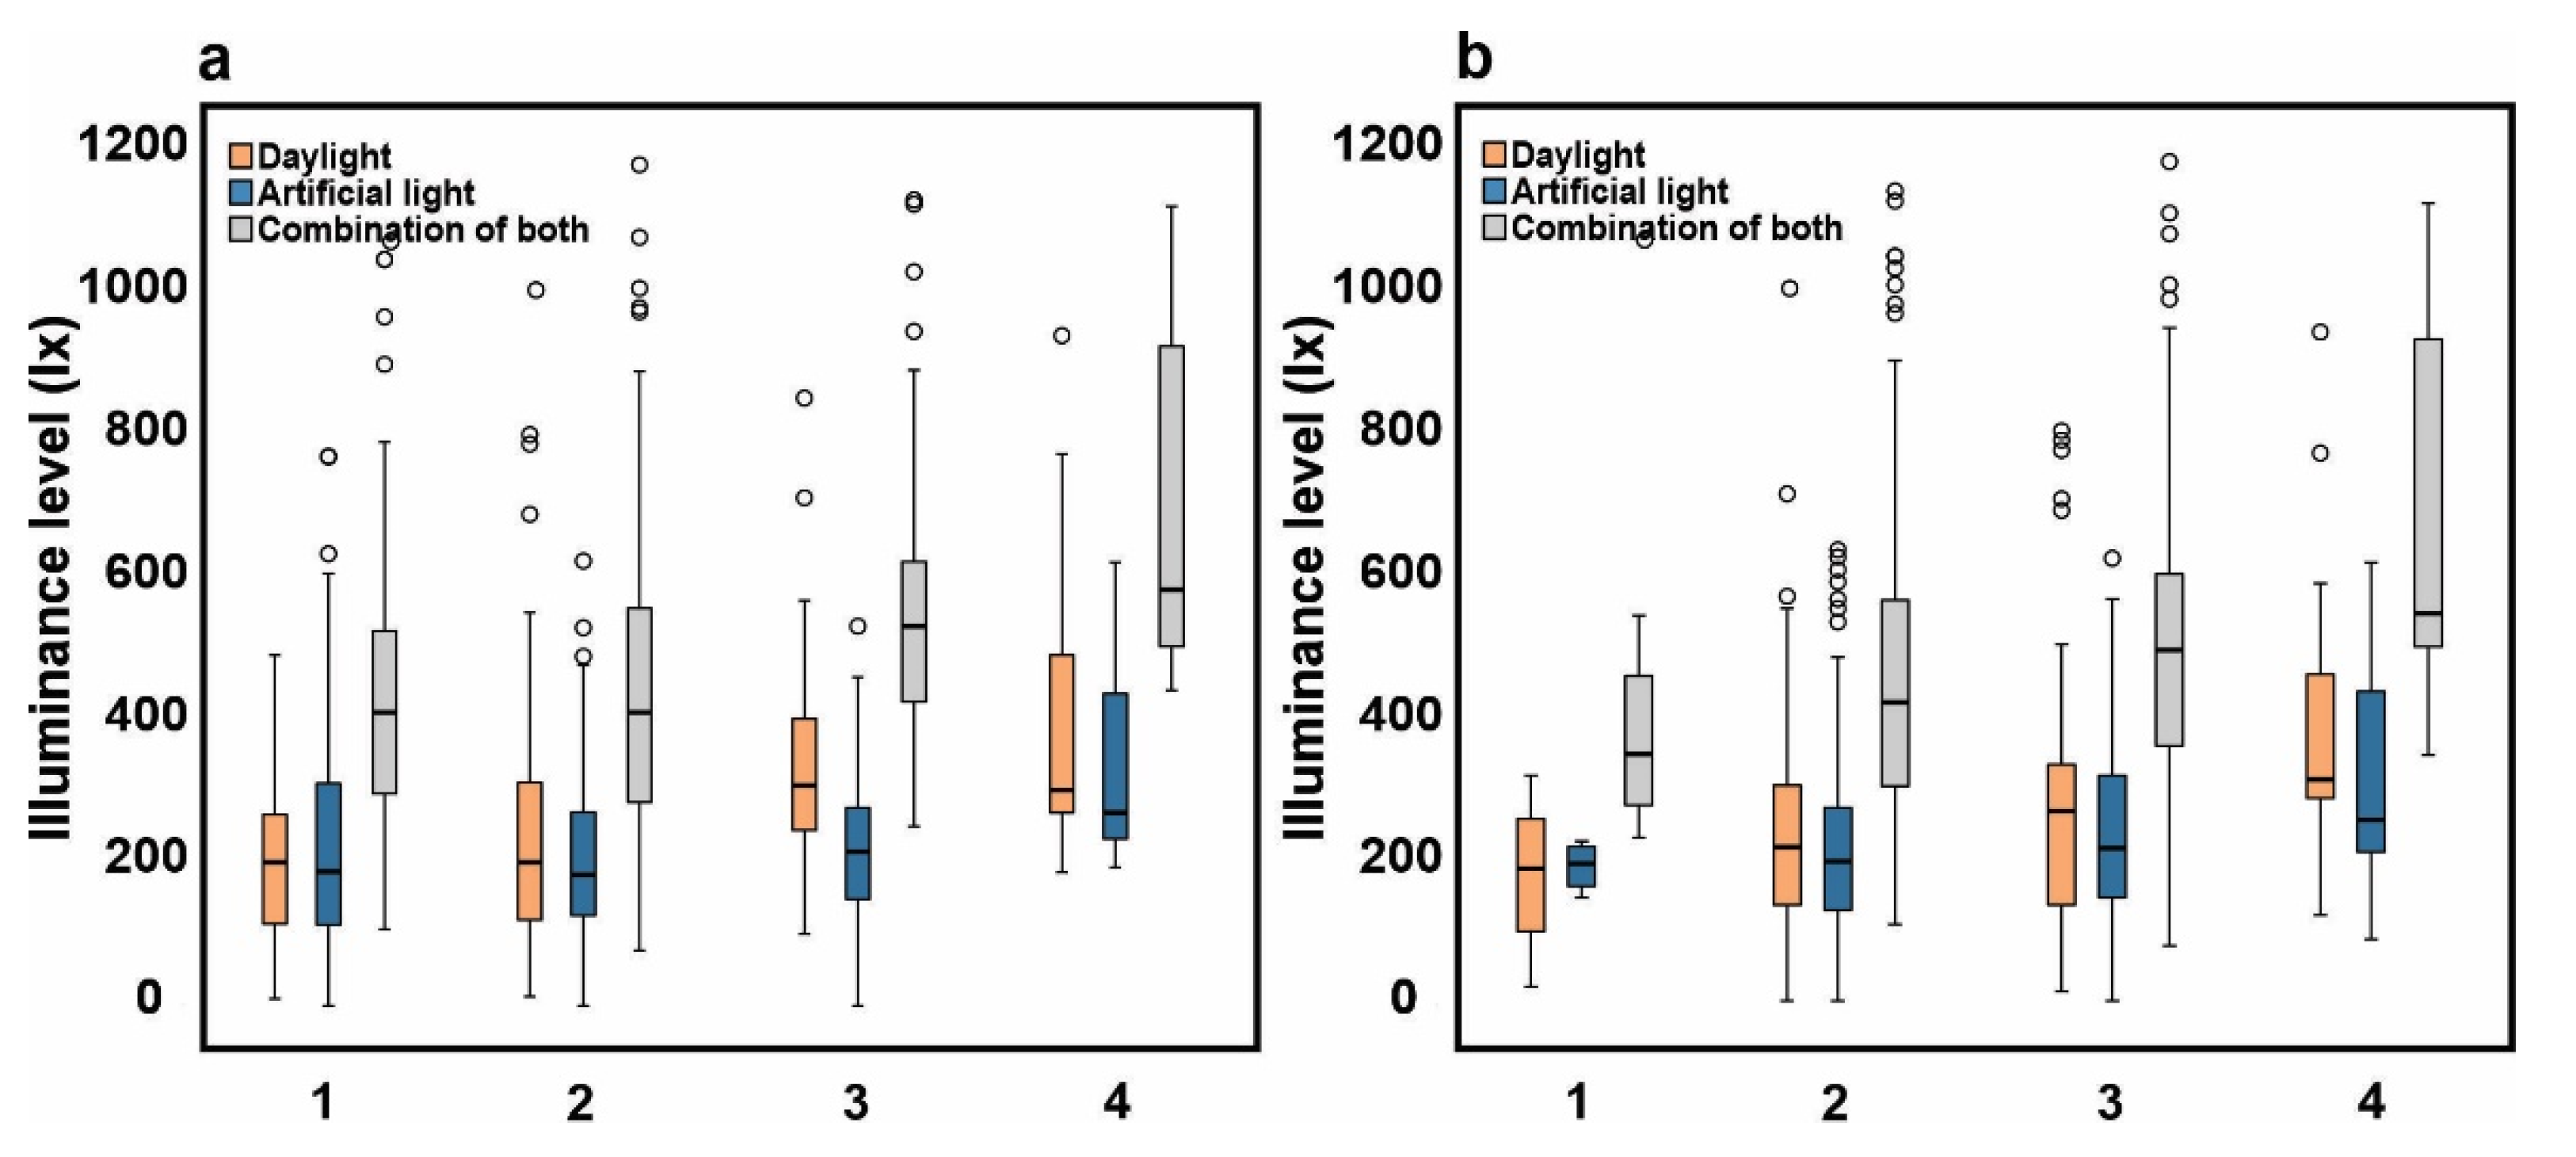
3.1. Indoor Lighting Condition

The highest measured illuminance was 1298 lx in summer and 1150 lx in winter. The minimum illuminance was 77 lx in summer and 35 lx in winter, while the mean illuminance levels were 472.64 lx in summer and 470.21 lx in winter.
Daylight, artificial light, and the combination of both in each building and season are presented in Figure 2. In buildings A and B, the daylight level was higher than that of the artificial one, while in building C, the artificial light was higher than daylight illumination. In buildings E and F, the daylight level was equal to the artificial light. The mean measured illuminance (when the combination of daylight and artificial light was used) in buildings was: 409 lx in building A, 491 lx in building B, 514 lx in building C, 556 lx in building D, 601 lx in building E, and 361lx in building F. It is worth mentioning that the measured light level in a few office spaces is inadequate (lower than 500 lx, which is suggested in most lighting standards). In some cases, the daylight or artificial light is below 200 lx, while the total light is higher than 200 lx. Measured daylight in summer was more elevated than artificial light; in winter, steady artificial light was higher than daylight.
Figure 3 shows measured daylight, artificial light, and the combination of both in each orientation. The daylight level in rooms oriented to the south was higher than that of other window orientations. The mean measured illuminance and mean measured daylight illuminance in different window orientations are, respectively, 599.58 lx and 335.38 lx in south window-oriented rooms, 403.65 lx and 191.9 lx in north window-oriented rooms, 450.89 lx and 226.24 lx in east window-oriented rooms, and 369.77 lx and 169.41 lx in west window-oriented rooms.
Figure 4 presents measured daylight, artificial light, and the combination of both based on WWR and WFR, categorized into four interval breaks (less than 25 percent, between 25 and 50 percent, between 50 and 75 percent, and higher than 75 percent). Figure 4 shows that the daylight level increases as the WWR and WFR increase. The mean measured illuminance and mean measured daylight level, respectively, were; 426.21 and 192.7 when WWR was below 25 percent, 436.35 and 223.72 when WWR was between 25 and 50 percent, 555.3 and 324.64 when WWR was between 50 and 75 percent, 687.9 and 395.53 when WWR was above 75 percent, 350.33 and 176 when WFR is below 25 percent, 452.31 and 230.28 when WFR is between 25 and 50 percent, 492.68 and 268.6 when WFR was between 50 and 75 percent, 687.45 and 388.25 when WFR was above 75 percent. It is worth mentioning that all shading systems were off during the daylight measurement and data collection, and it was on when the artificial light was measured.

3.2. Visual Preferences Ratings

To find the acceptable lighting condition, it is necessary to check if there is a significant correlation between subjective satisfaction with indoor lighting and illuminance levels investigated through the Spearman correlation [53,54]. As shown in Table 2, a statistically significant relationship (p < 0.05) occurs between occupants’ satisfaction with the illuminance level in each building, and when all of the building’s data were assessed together (total). There was a strong correlation between illuminance and satisfaction with lighting in building B and building A, and a weak connection was shown in building D.

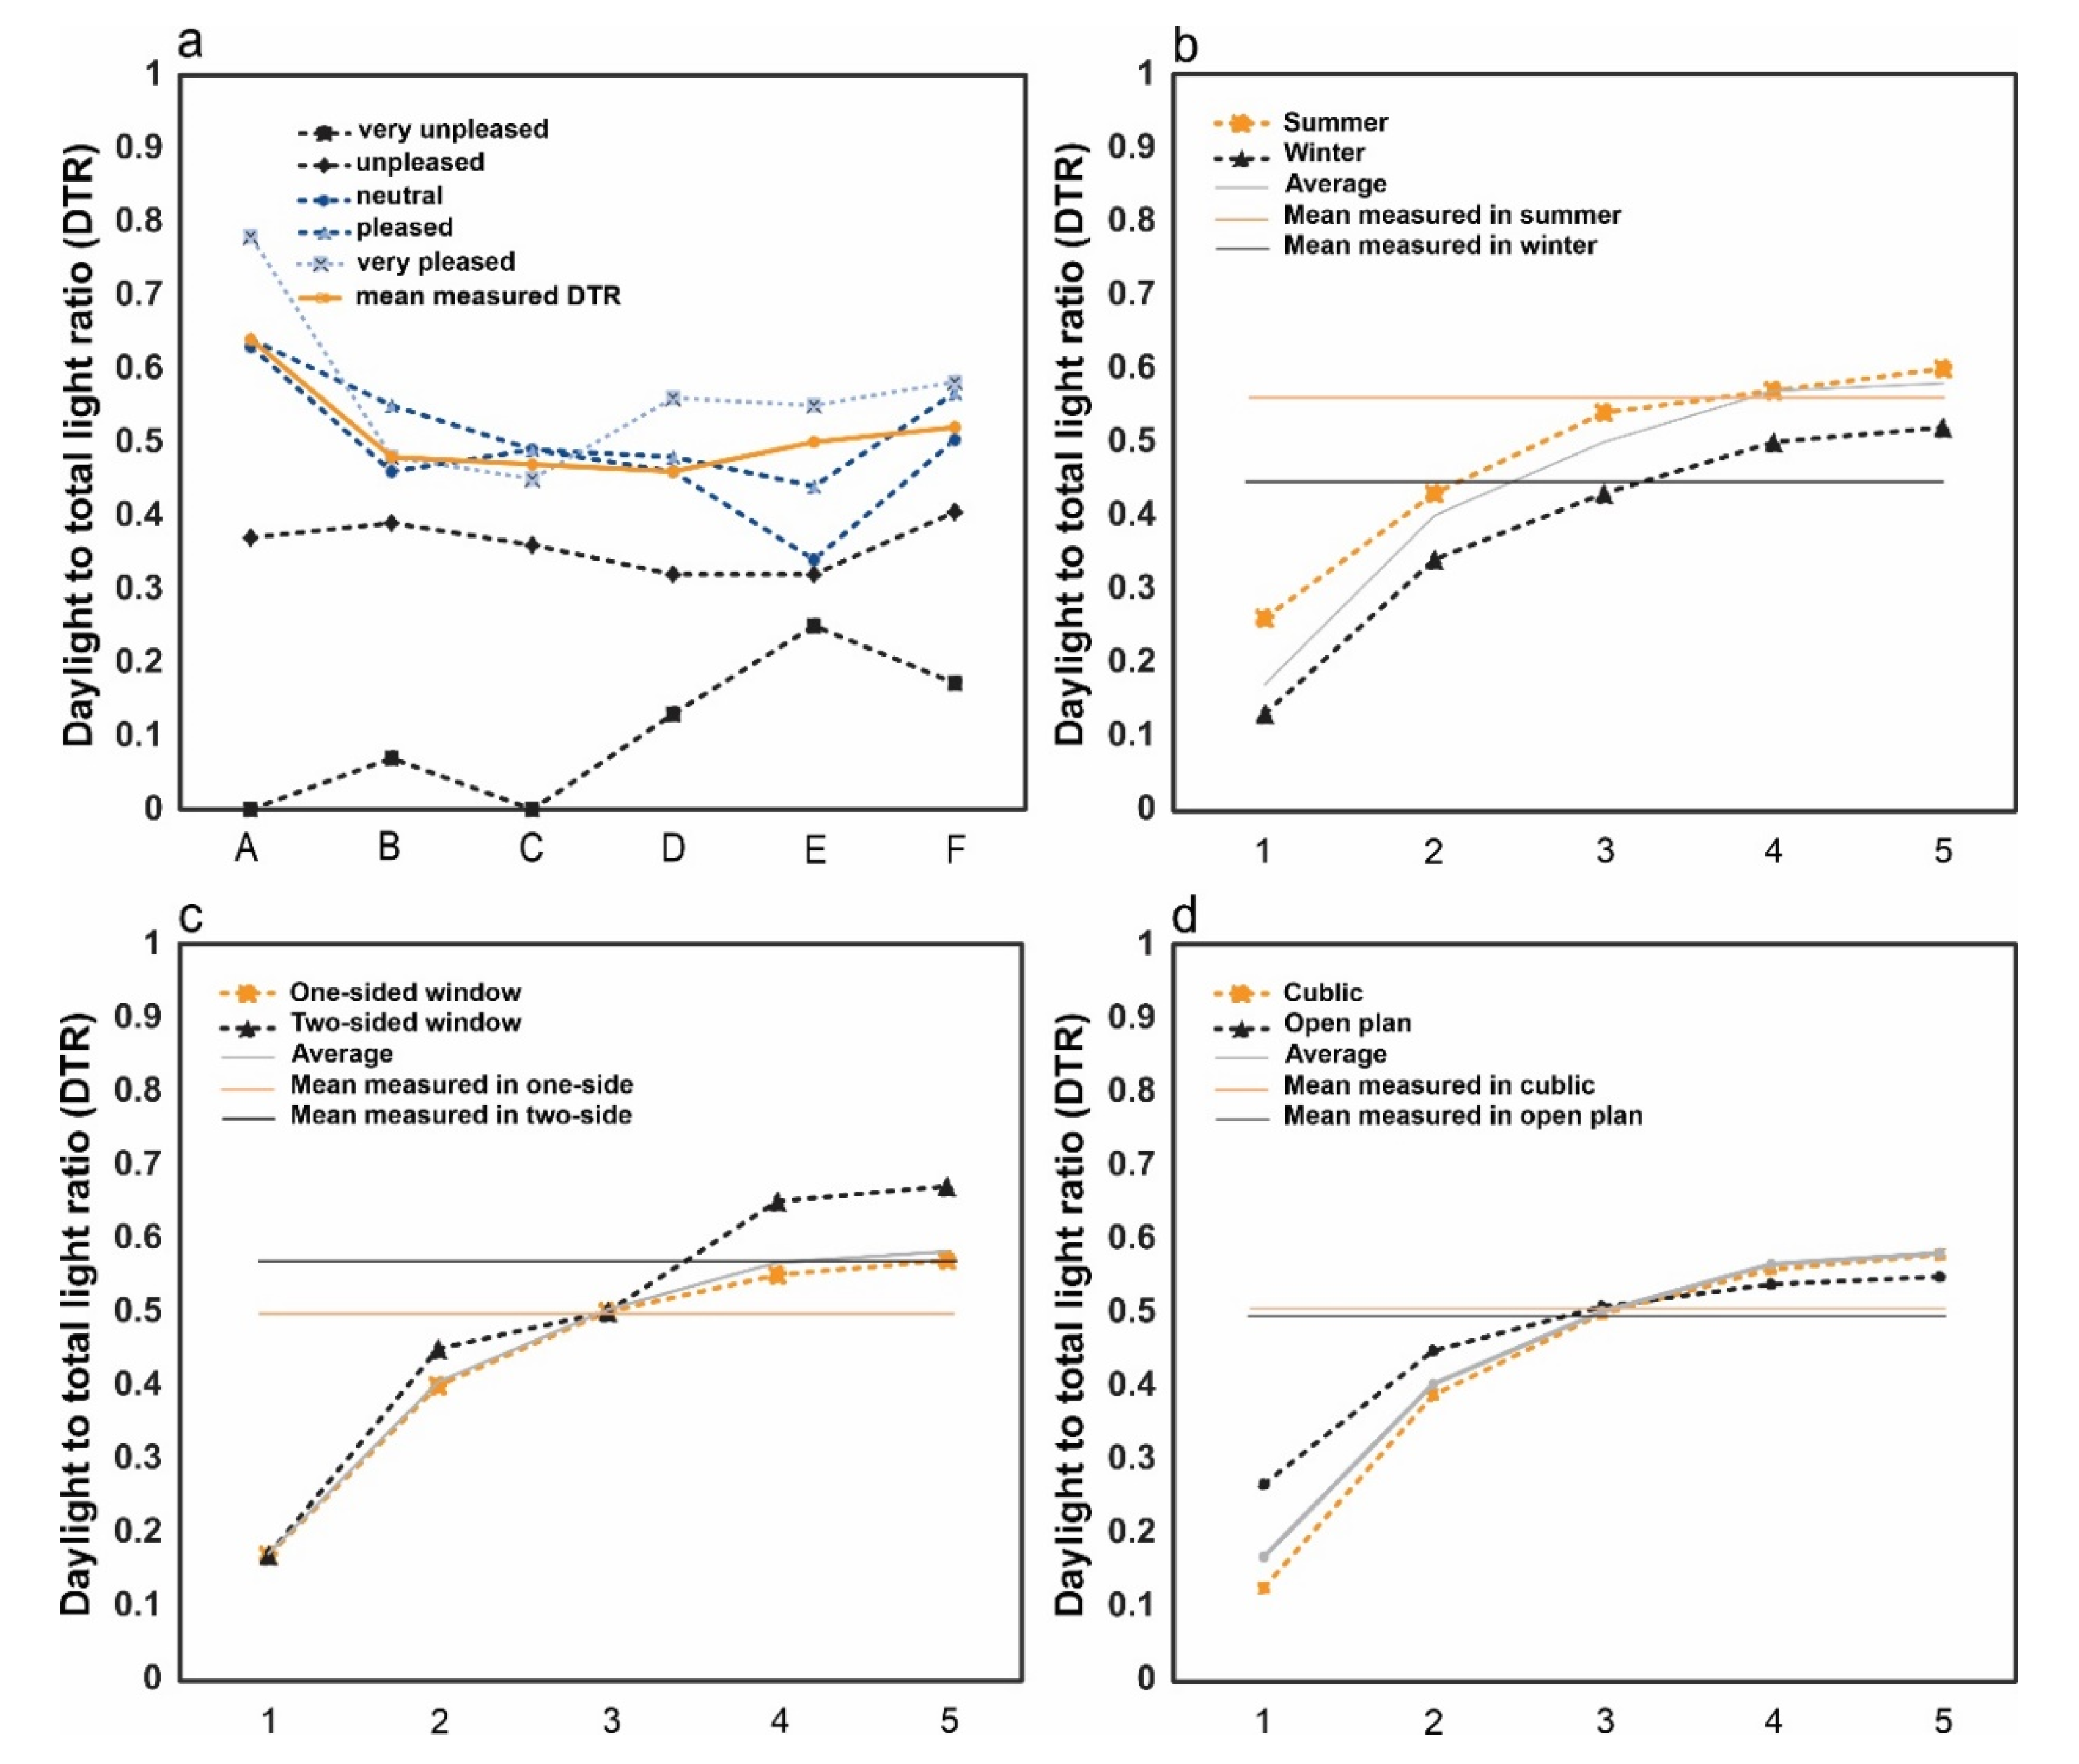
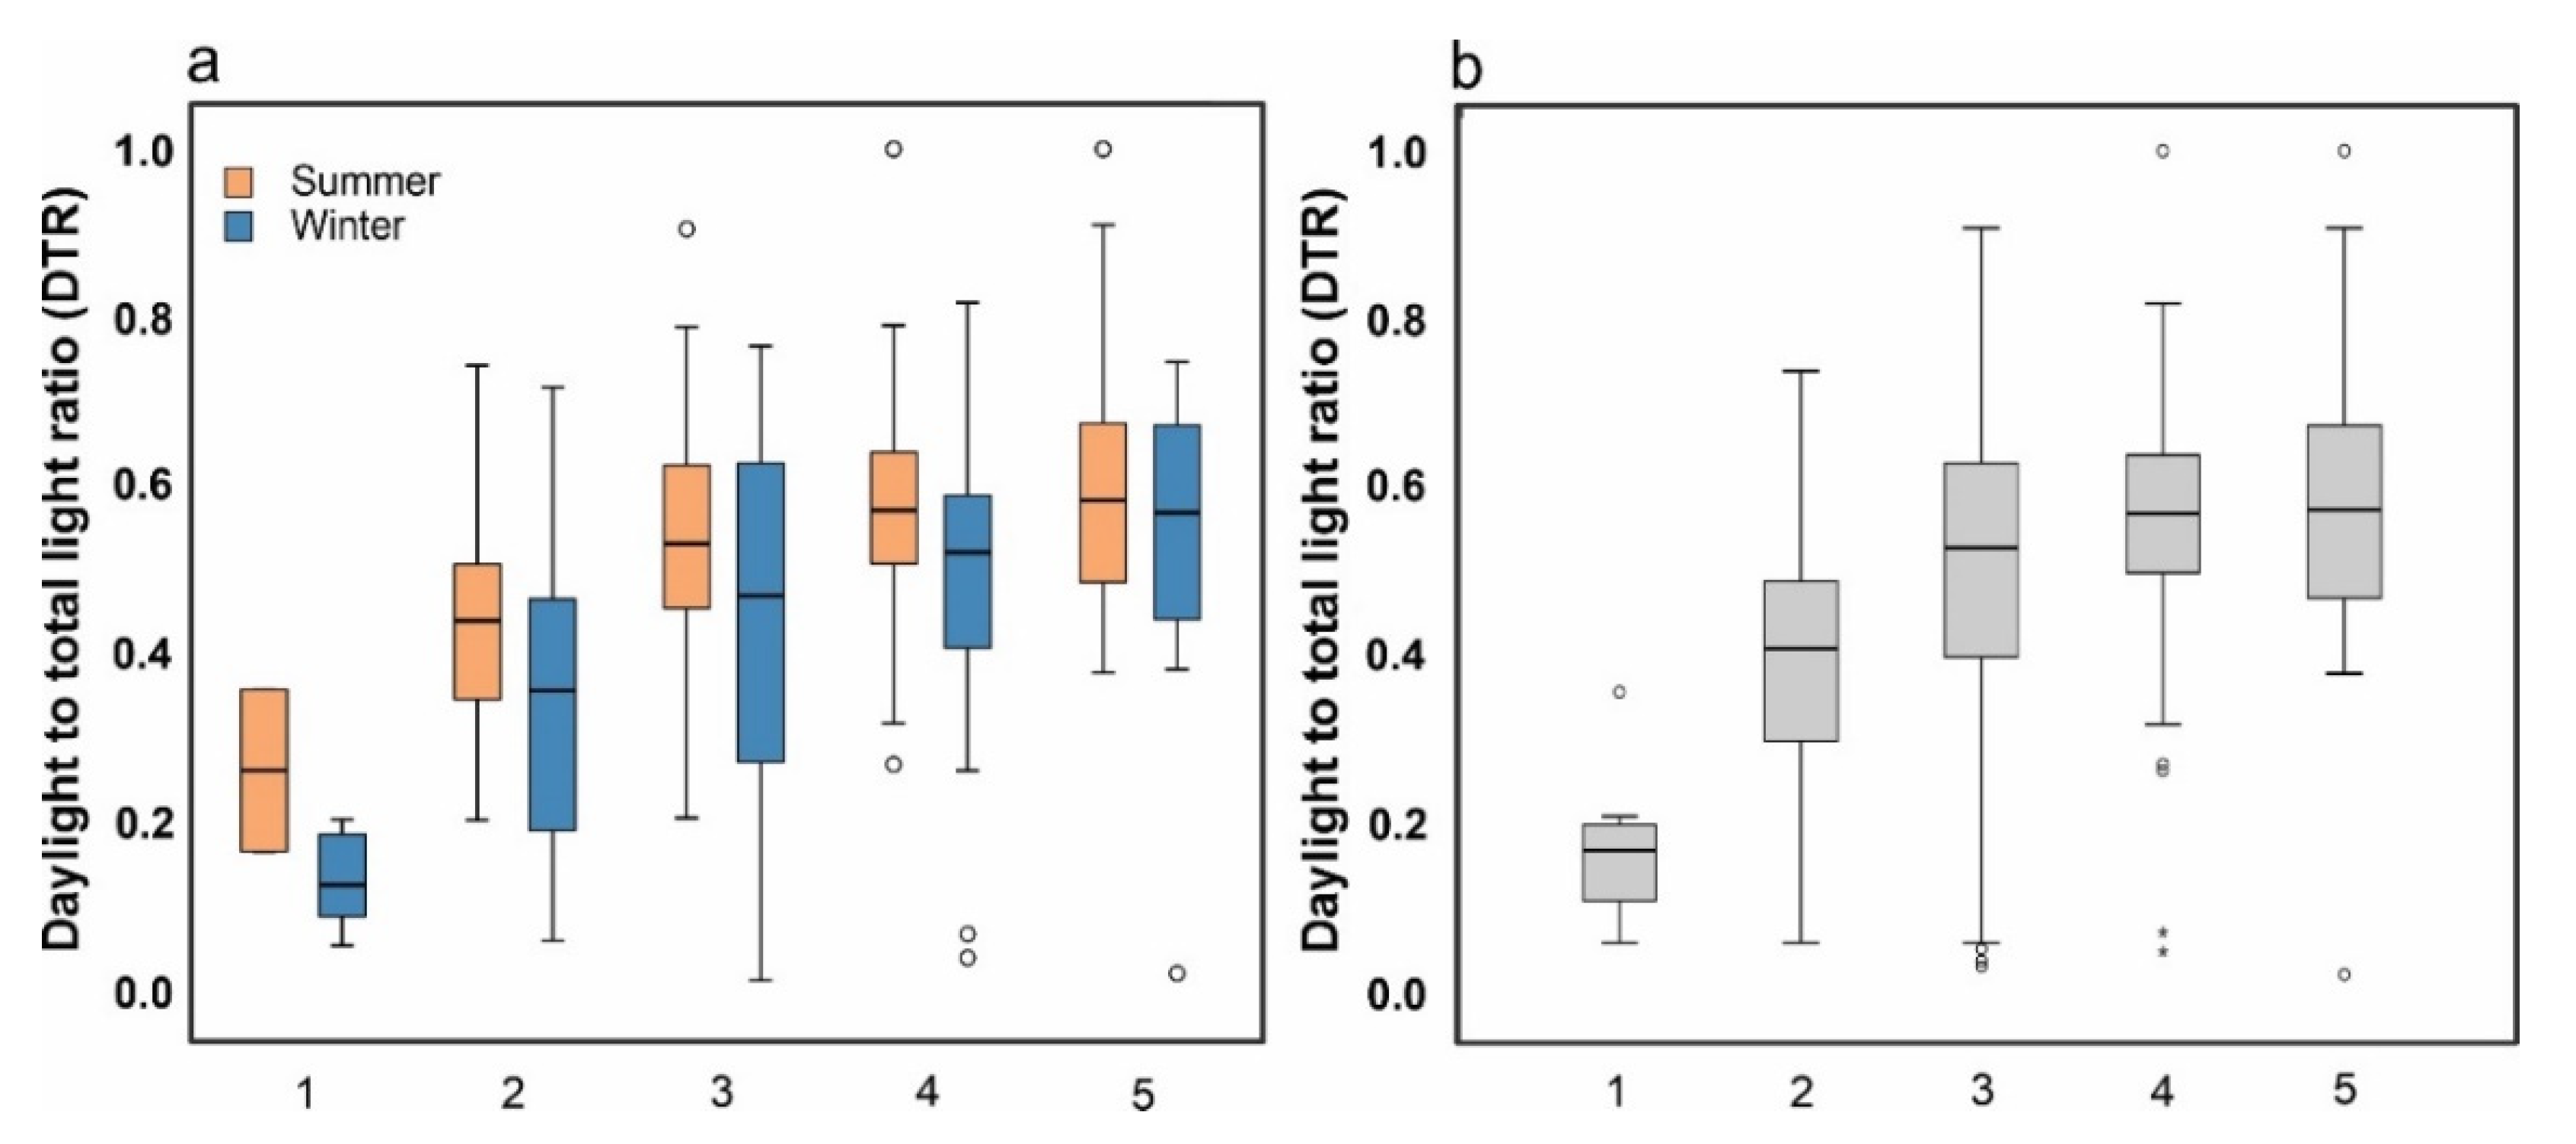
3.3. Daylight to Total Light Ratio

One of the influential factors in occupants’ perception of lighting is the light source’s type and quality. In studied office buildings, daylight and artificial light are used in most spaces. However, only natural light was used in a limited number of surveyed rooms. Artificial light was the only lighting source in a few spaces without an outside window or adjacent atrium. Therefore, there was a wide illuminance range of daylight and artificial light, and a combination of both in these office spaces.
Table 3 shows the correlation between natural and artificial, the room’s total illuminance, and the occupants’ satisfaction with illumination. Satisfaction with the lighting was mainly influenced by the illuminance level of daylight (Spearman correlation is 0.546) and total illuminance (Spearman correlation is 0.528). Although satisfaction with ambient lighting has a significant relationship with the illuminance of electric lighting (sig < 0.05), the correlation coefficient is low (Spearman correlation is 0.131). Therefore, the correlation between artificial light and occupants’ satisfaction is weak compared to other lighting sources. In other words, using only artificial light without the right combination of daylight in office spaces is not a good choice to satisfy occupants. Table 3 shows a significant correlation (p-value < 0.05) between the natural to total light ratio and satisfaction with lighting level, and the correlation coefficient is 0.452. Then, the DTR affects the occupants’ perception of the lighting.
Since daylight illumination significantly affects people’s satisfaction higher than artificial light, employees have just used daylight in some office spaces. DTR ratio defines the optimal ratio.
Table 4 shows the results of one-way ANOVA for building and t-test analysis for other environmental variables at each borderline satisfaction of, respectively, “unacceptable”, “neutral”, and “acceptable”. It is worth mentioning that the five scale questions were converted to the three scales (change “very pleased” and “pleased” to “accept”, and “very unpleased” and “unpleased” to “unacceptable”). The difference between groups of buildings and window types appears to be significant, just in an acceptable range, and in all satisfaction levels the difference between seasons is substantial. At the same time, there is no difference between office types in the preference of the DTR. Therefore, the building type, season, and window type affect the acceptable range for the DTR.
To define the minimum acceptable DTR regarding the building type, the mean, median, and standard deviation of the DTR in each satisfaction level are shown in Table 5. In the studied buildings, increasing the DTR will increase satisfaction with lighting. The DTR below 0.41 leads to dissatisfaction with lighting in the studied buildings. In building E, with an all-glass façade compared to the other buildings, the preferred DTR is lower (0.22). In the other five buildings, a DTR higher than 0.49 is preferred by the occupants. The main difference between building E and the other studied buildings is that the WWR is higher in building E. The WWR affects the available daylight and visual comfort, thus influencing the preferred DTR. People in this building prefer less DTR. Since this is a glass façade building, a high DTR may increase the possibility of glare sensation by sunlight. The other useful parameter is the season.
Table 6 shows DTR’s mean, median, and standard deviation in winter and summer. DTR in each satisfaction level in summer is higher than that of winter.
The comparison of the acceptable mean DTR in rooms with one-sided and two-sided windows, cubicles, and open-plan offices is shown in Table 7. The mean DTR in rooms with one-sided and two-sided windows is almost equal, while the acceptable mean DTR in rooms with two-sided windows is higher than one-sided. The acceptable mean DTR in the cubicle and open-plan offices is similar. Therefore, the room type does not influence the acceptable range of DTR.
As the building type, season, and window type affect the acceptable range for DTR (Table 4), the occupants’ satisfaction level with DTR should be analyzed regarding these factors. Figure 5 shows the impact of DTR on occupants’ satisfaction level with lighting separated by several factors. As shown in Figure 5a, in all buildings except buildings C and E, the mean preferred DTR is higher than the mean on-site measured DTR. In building C, the mean measured DTR is higher than the DTR level where people felt very pleased, but it is lower than the DTR level of pleasing condition. To compare the lighting satisfaction in different seasons, the occupants’ evaluation of illumination in different DTR separated by season is shown in Figure 5b. The mean measured DTR in office spaces in summer is 0.55, and in winter it is 0.42. The average satisfaction with lighting is near the mean measured DTR in both summer and winter. The DTR higher than the mean measured leads to lighting comfort, and less than the mean measured is not acceptable for occupants.
Generally, the measured and preferred DTR in summer is higher than in winter. The real minimum satisfied DTR in summer is 0.58, and in winter it is 0.50. This is because people become adapt to lighting in their environment during the season. The highest satisfaction level with light is when the DTR is higher than 0.62 in summer and 0.52 in winter.
As expected, the mean measured DTR is different in the one-sided and two-sided window offices (in the two-sided window offices, DTR is higher). This leads to the greater acceptable DTR in the two-sided window offices. According to Table 8, there is a statistical difference between the mean DTR in the cubicle and open-plan offices and summer and winter seasons, but there is no statistical difference between DTR in these six buildings (Table 8 and Table 9). Figure 5d shows no significant difference between the mean measured DTR in the cubicle and open-plan offices, as there is no difference between these offices in DTR in all satisfaction levels (Table 4).
The satisfaction level with lighting based on the DTR in summer and winter is shown in Figure 6a. When people are not satisfied with illumination, the DTR in summer is higher than in winter, while in pleasant lighting, the DTR in summer and winter is almost equal. This indicates that the effect of the season on the ideal DTR is negligible.
Figure 6b Shows the satisfaction level of occupants with lighting in the different DTR regardless of building type and season. Occupants’ satisfaction with lighting increases with the increase in DTR. The mean DTR in each satisfaction level is measured to determine the exact optimal range of satisfaction with DTR. The mean DTR, which provides comfortable conditions, is 0.56 and 0.58, as people are much and very much satisfied with lighting, respectively. In the mean DTR, around 0.5, occupants have average lighting satisfaction. Unpleasant and very unpleasant illumination occurs when the mean DTR is 0.4 and 0.17. It is worth mentioning that the total illuminance for the recommended DTR range is also in the acceptable range of 600–650 lx [48].
Two questions were asked of employees: if they preferred to increase or decrease the lighting level. To determine which DTR range people preferred, we categorized the tendency to increase or decrease illuminance into ten categories with 0.1 intervals. Figure 7 shows the percentage of people in each DTR range who tend to change the light (increase or decrease). The tendency to increase the lighting level in summer is higher than in winter when the DTR is below 0.5. In summer, decreasing lighting levels in all DTR is higher than in winter Figure, as shown in 7a. Figure 7b shows the tendency to increase the lighting level is higher than the tendency to decrease when the DTR is below 0.78. Occupants prefer to reduce the lighting level when the DTR is significantly higher than 0.8. This shows that people prefer to decrease the lighting level when daylight increases. Therefore, the daylight to total ratio should not be higher than 0.8.

4. Discussion

The presented results clearly emphasize the importance of daylight illuminance compared with the other lighting sources or a combination of daylight and artificial light. People use a variety of daylight and artificial light in most office spaces. One of the challenges here is to provide a good combination of daylight and electric light in the workplace. Previous studies have focused separately on illuminance, luminance, color temperature, etc. [55,56,57,58] for daylight or artificial light. Therefore, the question is, what is the optimum balance of illuminance between the two lighting sources?
This study investigated the occupants’ evaluation of visual comfort in various office spaces during winter and summer through the survey and field measurements. Physical parameter measurements consisted of daylight and artificial illuminance on work planes in 275 rooms in six buildings in Tehran. The occupants’ satisfaction with DTR when the illuminance is in acceptable levels (between 600–650 lx) in these spaces leads to a visually comfortable condition for most occupants [34]. People’s preferences for lighting levels are not the same in different countries and cities. This variation among acceptable ranges could depend on climate and culture. This variation among acceptable ranges may depend on the function of buildings and architecture [53], climate, and culture [17,59]. For example, the task illumination in Michigan should be above 650 lx [41]. However, in the Netherlands, an average of 800 lx at the desk level is more acceptable for office employees [16]. A lighting level between 300 to 600 lx at the desk is preferred in France [60]. In Italy, a study showed that 74% of occupants were confirmed to have neutral visual sensations with a maximum of 413 lx [61]. Still, other factors besides climate and culture could have played a role. According to previous studies, it is essential to consider integrating natural and artificial light sources. What is emphasized in this article is the combination of natural and electric lighting. Bellia et al. showed that daylight-entering characteristics are similar in summer and winter [33]. However, as the daylight level during summer and winter are different, there is a difference between the mean DTR in each satisfaction level in summer and winter.

5. Conclusions

The present study was designed to determine the effect of daylight to total light ratio on the occupants’ evaluation of lighting. It was decided that the method adopted for analysis was by field measurement, and the human evaluation of indoor environments was through a questionnaire. In summary, these results show that the combination ratio of daylight and artificial light is essential in the occupants’ perception of the environment. There is an optimal range for the DTR in which most occupants are satisfied with the lighting in their offices. This study has also shown that the optimization of the daylight ratio to artificial light affects the occupants’ perception of the lighting. The highest satisfaction with lighting is in the range of 0.57 to 0.8 daylight-to-total light ratio. DTR greater than 0.5 is also acceptable for users. Thus, at least 50 percent of environmental lighting sources should be from daylight.
Some variables, such as building type, window design, and season affect DTR acceptance, while there is no difference in occupants’ satisfaction with the DTR in various office types (cubicles/open offices). Acceptable DTR in the summertime is higher than that in winter. This happens because the mean measured DTR in the summertime is higher. In offices with windows on two sides, acceptable DTR is higher than in one-sided window rooms. The measured DTR in open-plan and cubicle spaces is similar, but to provide visual comfort conditions the DTR should be slightly higher in the cubicle than in the open-plan office.
When the DTR is below 0.5, in the summertime the tendency to increase the lighting level is higher than in winter, while in winter, when the DTR is higher than 0.5, occupants prefer more lighting level incrementation than in the summertime. When the DTR is higher than 0.9, people do not want to increase the lighting levels. In office spaces with the DTR below 0.7 in winter, occupants do not want to decrease the lighting levels. Therefore, the total tendency to decrease the lighting levels in the summertime is higher than in winter.

6. Limitations of Study

There are some critical limitations in this study worth mentioning:
  • The six case studies have different characteristics (such as various orientations, WWR, WFR, interior layout, etc.). However, in data analysis, these parameters are considered equivalent. The results can be analyzed considering different spatial environments.
  • The results could be case-specific because this study was conducted in six buildings. Further studies could help generalize the findings and conclusions of the present study.
  • For this study, we used a questionnaire in which the occupants stated that they did not experience glare. Therefore, the study can be developed by considering luminance to determine an acceptable DTR when the occupants experience glare.
  • The same office rooms were chosen for the winter and summer seasons. However, the number of rooms changed between winter and summer, since some participants were absent and were therefore unable to finish the questionnaire in some rooms.

Author Contributions

Conceptualization, M.F.; methodology, M.F. and R.F.; investigation, M.F.; resources, M.F.; data curation, MF.; writing—original draft preparation, M.F. and R.F.; writing—review and editing, M.F., R.F. and R.L.; visualization, M.F.; project administration, M.F. All authors have read and agreed to the published version of the manuscript.

Funding

This research received no external funding.

Institutional Review Board Statement

Not applicable.

Informed Consent Statement

Not applicable.

Data Availability Statement

Not applicable.

Acknowledgments

The author(s) thank(s) the Department of Innovation, Research and University of the Autonomous Province of Bozen/Bolzano for covering the Open Access publication costs.

Conflicts of Interest

The authors declare no conflict of interest.

Appendix A. Questionnaire

Table A1. Summary of the survey questionnaire.
Section A-Demographics
Right hand/left handsexageOverallGeneral
information
Other
activities
Both of themWith computerPaper-basedKind of workAbout the work
<4 h4–6 h7–8 h>8 hWorking hours
For how long you have been working in this room (in a month)?
Do you sometimes have a severe headache?Visual problems
Do you have light sensitivity?
Do you use glasses?
Section B-Lighting perception
Please rate your satisfaction with the room lighting:Satisfaction of lighting
very pleasantpleasantneither pleasant nor pleasantunpleasantvery
unpleasant
Please rate your satisfaction with lighting when working with a computer:
very pleasantpleasantneither pleasant nor pleasantunpleasantvery
unpleasant
Please rate your satisfaction with lighting when writing/reading a paper:
very pleasantpleasantneither pleasant nor pleasantunpleasantvery
unpleasant
Please rate your satisfaction with daylight in compare with artificial light:DTR
acceptableneutralunacceptable
What is your desire to increase the amount of light?The
tendency to change the amount of light
too muchmuchAveragelittlevery little
What is your desire to reduce the amount of light?
too muchmuchAveragelittlevery little

References

  1. Wang, T.-H.; Huang, Y.; Park, J. Development of Daylight Glare Analysis Method Using an Integrated Parametric Modelling Approach: A Comparative Study of Glare Evaluation Standards. Buildings 2022, 12, 1810. [Google Scholar] [CrossRef]
  2. Rodriguez, R.; Yamín Garretón, J.; Pattini, A. Glare and cognitive performance in screen work in the presence of sunlight. Light. Res. Technol. 2016, 48, 221–238. [Google Scholar] [CrossRef]
  3. Leccese, F.; Salvadori, G.; Öner, M.; Kazanasmaz, T. Exploring the impact of external shading system on cognitive task performance, alertness and visual comfort in a daylit workplace environment. Indoor Built Environ. 2020, 29, 942–955. [Google Scholar] [CrossRef]
  4. Esfandiari, M.; Mohamed Zaid, S.; Ismail, M.A.; Reza Hafezi, M.; Asadi, I.; Mohammadi, S.; Vaisi, S.; Aflaki, A. Occupants’ Satisfaction toward Indoor Environment Quality of Platinum Green-Certified Office Buildings in Tropical Climate. Energies 2021, 14, 2264. [Google Scholar] [CrossRef]
  5. Tregenza, P.; Mardaljevic, J. Daylighting buildings: Standards and the needs of the designer. Light. Res. Technol. 2018, 50, 63–79. [Google Scholar] [CrossRef] [Green Version]
  6. Galatioto, A.; Beccali, M. Aspects and issues of daylighting assessment: A review study. Renew. Sustain. Energy Rev. 2016, 66, 852–860. [Google Scholar] [CrossRef]
  7. Andersen, M.; Kleindienst, S.; Yi, L.; Lee, J.; Bodart, M.; Cutler, B. An intuitive daylighting performance analysis and optimization approach. Build. Res. Inf. 2008, 36, 593–607. [Google Scholar] [CrossRef]
  8. Carlucci, S.; Causone, F.; De Rosa, F.; Pagliano, L. A review of indices for assessing visual comfort with a view to their use in optimization processes to support building integrated design. Renew. Sustain. Energy Rev. 2015, 47, 1016–1033. [Google Scholar] [CrossRef] [Green Version]
  9. Aries, M.B.C. Human Lighting Demands: Healthy Lighting in an Office Environment; Technische Universiteit Eindhoven, Faculteit Bouwkunde: Eindhoven, The Netherlands, 2005; ISBN 978-90-386-1686-5. [Google Scholar]
  10. Light and Lighting—Lighting of Work Places. Part 1, Indoor Work Places; BSI: London, UK, 2011; ISBN 978-0-580-68495-1. Available online: https://webstore.ansi.org/preview-pages/BSI/preview_30385601.pdf (accessed on 2 January 2022).
  11. Reinhart, C.; Fitz, A. Findings from a survey on the current use of daylight simulations in building design. Energy Build. 2006, 38, 824–835. [Google Scholar] [CrossRef] [Green Version]
  12. Grynning, S.; Time, B.; Matusiak, B. Solar shading control strategies in cold climates—Heating, cooling demand and daylight availability in office spaces. Sol. Energy 2014, 107, 182–194. [Google Scholar] [CrossRef]
  13. CIBSE. Daylighting and Window Design; Lighting Guide/CIBSE; Chartered Institution of Building Services Engineers, Ed.; CIBSE: London, UK, 1999; ISBN 978-0-900953-98-9. [Google Scholar]
  14. DiLaura, D.L.; Harrold, R.M.; Houser, K.W.; Mistrick, R.G.; Steffy, G.R. A Procedure for Determining Target Illuminances. LEUKOS 2011, 7, 145–158. [Google Scholar] [CrossRef]
  15. Mardaljevic, J.; Christoffersen, J. ‘Climate connectivity’ in the daylight factor basis of building standards. Build. Environ. 2017, 113, 200–209. [Google Scholar] [CrossRef] [Green Version]
  16. Boubekri, M. Daylighting, Architecture, and Health: Building Design Strategies, 1st ed.; Elsevier Architectural Press: Amsterdam, The Netherlands; Boston, MA, USA, 2008; ISBN 978-0-7506-6724-1. [Google Scholar]
  17. Boyce, P.R. Human Factors in Lighting; CRC Press Taylor & Francis Group: Abingdon, UK, 2014. [Google Scholar]
  18. Kong, Z.; Liu, Q.; Li, X.; Hou, K.; Xing, Q. Indoor lighting effects on subjective impressions and mood states: A critical review. Build. Environ. 2022, 224, 109591. [Google Scholar] [CrossRef]
  19. Yao, Q.; Cai, W.; Li, M.; Hu, Z.; Xue, P.; Dai, Q. Efficient circadian daylighting: A proposed equation, experimental validation, and the consequent importance of room surface reflectance. Energy Build. 2020, 210, 109784. [Google Scholar] [CrossRef]
  20. Acosta, I.; Campano, M.Á.; Leslie, R.; Radetsky, L. Daylighting design for healthy environments: Analysis of educational spaces for optimal circadian stimulus. Sol. Energy 2019, 193, 584–596. [Google Scholar] [CrossRef]
  21. Lucas, R.J.; Peirson, S.N.; Berson, D.M.; Brown, T.M.; Cooper, H.M.; Czeisler, C.A.; Figueiro, M.G.; Gamlin, P.D.; Lockley, S.W.; O’Hagan, J.B.; et al. Measuring and using light in the melanopsin age. Trends Neurosci. 2014, 37, 1–9. [Google Scholar] [CrossRef]
  22. Rea, M.; Figueiro, M. Light as a circadian stimulus for architectural lighting. Light. Res. Technol. 2018, 50, 497–510. [Google Scholar] [CrossRef]
  23. Newsham, G.; Veitch, J. Lighting quality recommendations for VDT offices: A new method of derivation. Light. Res. Technol. 2001, 33, 97–113. [Google Scholar] [CrossRef]
  24. Boyce, P.R.; Veitch, J.A.; Newsham, G.R.; Jones, C.C.; Heerwagen, J.; Myer, M.; Hunter, C.M. Occupant use of switching and dimming controls in offices. Light. Res. Technol. 2006, 38, 358–376. [Google Scholar] [CrossRef] [Green Version]
  25. Veitch, J.A.; Newsham, G.R. Preferred luminous conditions in open-plan offices: Research and practice recommendations. Light. Res. Technol. 2000, 32, 199–212. [Google Scholar] [CrossRef]
  26. Laurentin, C.; Bermtto, V.; Fontoynont, M. Effect of thermal conditions and light source type on visual comfort appraisal. Light. Res. Technol. 2000, 32, 223–233. [Google Scholar] [CrossRef]
  27. Galasiu, A.D.; Veitch, J.A. Occupant preferences and satisfaction with the luminous environment and control systems in daylit offices: A literature review. Energy Build. 2006, 38, 728–742. [Google Scholar] [CrossRef] [Green Version]
  28. Potočnik, J.; Košir, M.; Dovjak, M. Colour preference in relation to personal determinants and implications for indoor circadian luminous environment. Indoor Built Environ. 2022, 31, 121–138. [Google Scholar] [CrossRef]
  29. Ghasemi, M.; Kandar, M.Z.; Noroozi, M. Investigating the effect of well geometry on the daylight performance in the adjoining spaces of vertical top-lit atrium buildings. Indoor Built Environ. 2016, 25, 934–948. [Google Scholar] [CrossRef]
  30. Abboushi, B.; Elzeyadi, I.; Van Den Wymelenberg, K.; Taylor, R.; Sereno, M.; Jacobsen, G. Assessing the Visual Comfort, Visual Interest of Sunlight Patterns, and View Quality under Different Window Conditions in an Open-Plan Office. LEUKOS 2021, 17, 321–337. [Google Scholar] [CrossRef]
  31. Fakhari, M.; Vahabi, V.; Fayaz, R. A study on the factors simultaneously affecting visual comfort in classrooms: A structural equation modeling approach. Energy Build. 2021, 249, 111232. [Google Scholar] [CrossRef]
  32. Al-Sabahi, M.H.; Ismail, M.A.; Alashwal, A.M.; Al-Obaidi, K.M. Triangulation Method to Assess Indoor Environmental Conditions and Occupant Comfort and Productivity towards Low Energy Buildings in Malaysia. Buildings 2022, 12, 1788. [Google Scholar] [CrossRef]
  33. Bellia, L.; Pedace, A.; Barbato, G. Winter and summer analysis of daylight characteristics in offices. Build. Environ. 2014, 81, 150–161. [Google Scholar] [CrossRef]
  34. Fakhari, M.; Fayaz, R.; Asadi, S. Lighting preferences in office spaces concerning the indoor thermal environment. Front. Archit. Res. 2021, 10, 639–651. [Google Scholar] [CrossRef]
  35. Yun, G.Y.; Kong, H.J.; Kim, H.; Kim, J.T. A field survey of visual comfort and lighting energy consumption in open plan offices. Energy Build. 2012, 46, 146–151. [Google Scholar] [CrossRef]
  36. Day, J.; Theodorson, J.; Van Den Wymelenberg, K. Understanding Controls, Behaviors and Satisfaction in the Daylit Perimeter Office: A Daylight Design Case Study. J. Inter. Des. 2012, 37, 17–34. [Google Scholar] [CrossRef]
  37. Dahlan, N.D.; Jones, P.J.; Alexander, D.K.; Salleh, E.; Alias, J. Daylight Ratio, Luminance, and Visual Comfort Assessments in Typical Malaysian Hostels. Indoor Built Environ. 2009, 18, 319–335. [Google Scholar] [CrossRef]
  38. Wienold, J.; Christoffersen, J. Evaluation methods and development of a new glare prediction model for daylight environments with the use of CCD cameras. Energy Build. 2006, 38, 743–757. [Google Scholar] [CrossRef]
  39. Maki, Y.; Shukuya, M. Visual and thermal comfort and its relations to exergy consumption in a classroom with daylighting. IJEX 2012, 11, 481. [Google Scholar] [CrossRef]
  40. Iwata, T.; Hatao, A.; Shukuya, M.; Kimura, K.-i. Visual comfort in the daylit luminous environment: Structural model for evaluation. Light. Res. Technol. 1994, 26, 91–97. [Google Scholar] [CrossRef]
  41. Kim, S.-Y.; Kim, J.-J. Influence of light fluctuation on occupant visual perception. Build. Environ. 2007, 42, 2888–2899. [Google Scholar] [CrossRef]
  42. Linhart, F.; Scartezzini, J.-L. Minimizing lighting power density in office rooms equipped with Anidolic Daylighting Systems. Sol. Energy 2010, 84, 587–595. [Google Scholar] [CrossRef]
  43. Axarli, K.; Meresi, A. 211: Objective and Subjective Criteria Regarding the Effect of Sunlight and Daylight in Classrooms. In Proceedings of the PLEA 2008—25th Conference on Passive and Low Energy Architecture, Dublin, Ireland, 22–24 October 2008. [Google Scholar]
  44. Chraibi, S.; Lashina, T.; Shrubsole, P.; Aries, M.; van Loenen, E.; Rosemann, A. Satisfying light conditions: A field study on perception of consensus light in Dutch open office environments. Build. Environ. 2016, 105, 116–127. [Google Scholar] [CrossRef] [Green Version]
  45. Chellappa, S.L.; Steiner, R.; Oelhafen, P.; Cajochen, C. Sex differences in light sensitivity impact on brightness perception, vigilant attention and sleep in humans. Sci. Rep. 2017, 7, 14215. [Google Scholar] [CrossRef] [Green Version]
  46. Mui, K.W.; Wong, L.T. Acceptable Illumination Levels for Office Occupants. Archit. Sci. Rev. 2006, 49, 116–119. [Google Scholar] [CrossRef]
  47. Field, A. Discovering Statistics Using IBM SPSS; SAGE Publications Ltd.: New York, NY, USA, 2013. [Google Scholar]
  48. Xue, P.; Mak, C.M.; Cheung, H.D. The effects of daylighting and human behavior on luminous comfort in residential buildings: A questionnaire survey. Build. Environ. 2014, 81, 51–59. [Google Scholar] [CrossRef]
  49. Krüger, E.L.; Tamura, C.; Trento, T.W. Identifying relationships between daylight variables and human preferences in a climate chamber. Sci. Total Environ. 2018, 642, 1292–1302. [Google Scholar] [CrossRef] [PubMed]
  50. Zhang, D.; Ortiz, M.A.; Bluyssen, P.M. Clustering of Dutch school children based on their preferences and needs of the IEQ in classrooms. Build. Environ. 2019, 147, 258–266. [Google Scholar] [CrossRef]
  51. Andargie, M.S.; Azar, E. An applied framework to evaluate the impact of indoor office environmental factors on occupants’ comfort and working conditions. Sustain. Cities Soc. 2019, 46, 101447. [Google Scholar] [CrossRef]
  52. Chinazzo, G.; Wienold, J.; Andersen, M. Influence of indoor temperature and daylight illuminance on visual perception. Light. Res. Technol. 2020, 52, 350–370. [Google Scholar] [CrossRef]
  53. Bluyssen, P.M.; Zhang, D.; Kurvers, S.; Overtoom, M.; Ortiz-Sanchez, M. Self-reported health and comfort of school children in 54 classrooms of 21 Dutch school buildings. Build. Environ. 2018, 138, 106–123. [Google Scholar] [CrossRef]
  54. Dianat, I.; Sedghi, A.; Bagherzade, J.; Jafarabadi, M.A.; Stedmon, A.W. Objective and subjective assessments of lighting in a hospital setting: Implications for health, safety and performance. Ergonomics 2013, 56, 1535–1545. [Google Scholar] [CrossRef]
  55. Suk, J.Y. Luminance and vertical eye illuminance thresholds for occupants’ visual comfort in daylit office environments. Build. Environ. 2019, 148, 107–115. [Google Scholar] [CrossRef]
  56. Despenic, M.; Chraibi, S.; Lashina, T.; Rosemann, A. Lighting preference profiles of users in an open office environment. Build. Environ. 2017, 116, 89–107. [Google Scholar] [CrossRef]
  57. Michael, A.; Heracleous, C. Assessment of natural lighting performance and visual comfort of educational architecture in Southern Europe: The case of typical educational school premises in Cyprus. Energy Build. 2017, 140, 443–457. [Google Scholar] [CrossRef]
  58. Wei, M.; Houser, K.W.; Orland, B.; Lang, D.H.; Ram, N.; Sliwinski, M.J.; Bose, M. Field study of office worker responses to fluorescent lighting of different CCT and lumen output. J. Environ. Psychol. 2014, 39, 62–76. [Google Scholar] [CrossRef]
  59. Nicol, F.; Wilson, M.; Chiancarella, C. Using field measurements of desktop illuminance in European offices to investigate its dependence on outdoor conditions and its effect on occupant satisfaction, and the use of lights and blinds. Energy Build. 2006, 38, 802–813. [Google Scholar] [CrossRef]
  60. Escuyer, S.; Fontoynont, M. Lighting controls: A field study of office workers’ reactions. Light. Res. Technol. 2001, 33, 77–94. [Google Scholar] [CrossRef]
  61. Lucia Castaldo, V.; Pigliautile, I.; Rosso, F.; Laura Pisello, A.; Cotana, F. Investigation of the impact of subjective and physical parameters on the indoor comfort of occupants: A case study in central Italy. Energy Procedia 2017, 126, 131–138. [Google Scholar] [CrossRef]
Figure 1. Studied buildings. (A) Power Research Center (B) Administrative office of the University of Art (C) The municipality building (D) Student Affairs Organization Building (E) Kayson INC. (F) The Ministry of Science, Research and Technology.
Buildings 12 02161 g001
Figure 2. On-site measured illuminance in the studied buildings. Separated by building (a) separated by season (b). Extreme outliers are marked with an asterisk and circles.
Buildings 12 02161 g002
Figure 3. On-site measured illuminance in the studied buildings separated by window orientation. Extreme outliers are marked with an asterisk and circles.
Buildings 12 02161 g003
Figure 4. On-site measured illuminance in the studied buildings. Separated by WWR (a) separated by WFR (b) Note: For graph (a), 1 = WWR < 25%, 2 = 25% < WWR ≤ 50%, 3 = 50% < WWR ≤ 75%, 4 = 75% ≤ WWR. For graph (b), 1 = WFR < 25%, 2 = 25% < WFR ≤ 50%, 3 = 50% < WFR ≤ 75%, 4 = 75% ≤ WFR.
Buildings 12 02161 g004
Figure 5. DTR satisfaction. Separated by building (a), separated by season (b), separated by window type (c), separated by office type (d). Note: For graph 1–5, 1 = very unpleasant, 2 = unpleasant, 3 = neutral, 4 = pleasant, 5 = very pleasant.
Buildings 12 02161 g005
Figure 6. DTR satisfaction. Separated by season (a) in general (b). Note: For graph 1–5, 1 = very unpleasant, 2 = unpleasant, 3 = neutral, 4 = pleasant, 5 = very pleasant. Extreme outliers are marked with an asterisk and circles.
Buildings 12 02161 g006
Figure 7. The tendency to change the lighting level on categorized measured DTR. Separated by season (a) in general (b). Extreme outliers are marked with an asterisk and circles.
Buildings 12 02161 g007
Table 1. Buildings’ specification.
BuildingWindow OrientationWWRWFRNumber of QuestionnairesNumber of Rooms
WinterSummerWinterSummer
Building ANorth, south, east, and west23%17%24422127
Building BNorth, south, east, and west30%22%42262718
Building CNorth, south, east, and west30%22%1420109
Building DNorth, south, east, and west29%16%29322125
Building ENorth and south 73%26%4665917
Building FNorth, south, east, and west35%17%74952150
Table 2. Spearman coefficient between lighting satisfaction and lighting level.
Lighting SatisfactionTotalBuilding ABuilding BBuilding CBuilding DBuilding EBuilding F
Spearman Correlation
p-value
0.528
0.000
0.601
0.000
0.661
0.000
0.507
0.020
0.466
0.000
0.474
0.000
0.479
0.000
Table 3. Spearman coefficient between lighting satisfaction and lighting level in different conditions.
Lighting SatisfactionTotal IlluminanceDaylight IlluminanceArtificial IlluminanceDTR
Spearman Correlation
p-value
0.528
0.000
0.546
0.000
0.131
0.003
0.452
0.000
Table 4. One-way ANOVA and t-test results of variables and DTR values.
Satisfaction Levelp-Value
Buildings (six buildings)Unacceptable0.562
Neutral0.120
Acceptable0.007
Season (winter/summer)Unacceptable0.009
Neutral0.000
Acceptable0.034
Window (one-sided/two-sided)Unacceptable0.839
Neutral0.998
Acceptable0.003
Office type (cubicles/open office)Unacceptable0.40
Neutral0.86
Acceptable0.053
Table 5. Satisfaction level of DTR in the studied buildings.
BuildingSatisfaction LevelMeanMedianStd.
Deviation
BuildingSatisfaction LevelMeanMedianStd.
Deviation
Building AUnacceptable0.370.320.1Building DUnacceptable0.290.240.22
Neutral0.630.630.2Neutral0.460.510.21
Acceptable0.670.650.22Acceptable0.510.560.15
Building BUnacceptable0.290.230.2Building EUnacceptable0.220.200.22
Neutral0.460.420.22Neutral0.250.260.26
Acceptable0.530.570.20Acceptable0.390.530.25
Building CUnacceptable0.360.370.07Building FUnacceptable0.410.450.14
Neutral0.470.370.19Neutral0.530.540.11
Acceptable0.490.490.06Acceptable0.570.590.10
Table 6. Satisfaction level of DTR in summer and winter.
Satisfaction LevelMeanMedianStd.
Deviation
Satisfaction LevelMeanMedianStd.
Deviation
SummerUnacceptable0.420.430.12WinterUnacceptable0.290.220.20
Neutral0.540.530.12Neutral0.430.470.22
Acceptable0.580.570.14Acceptable0.500.540.21
Table 7. Satisfaction level of DTR in the studied offices.
WindowSatisfaction LevelMeanMedianStd.
Deviation
Office
Type
Satisfaction LevelMeanMedianStd.
Deviation
One-sidedUnacceptable0.370.390.17CubiclesUnacceptable0.360.370.17
Neutral0.500.530.18Neutral0.500.530.18
Acceptable0.550.570.14Acceptable0.570.570.16
Two-sidedUnacceptable0.380.370.22Open planUnacceptable0.410.400.16
Neutral0.500.530.15Neutral0.510.550.09
Acceptable0.640.550.21Acceptable0.540.530.08
Table 8. t-test for DTR.
FdftSig
Season20.26750914.1470.000
One side/Two side Window14.5265094.3760.000
Cublic/Open Plan3.5725090.4600.059
Table 9. ANOVA analysis for DTR.
Sum of SquaresdfMean SquareFSig.
Building type337.792567.55810.4310.000
Publisher’s Note: MDPI stays neutral with regard to jurisdictional claims in published maps and institutional affiliations.

