1. Introduction
1.1. Research Background
The adaptive thermal comfort model is specified in many international and national standards, such as ASHRA Standard 55 [
1], EN15251 [
2], and Chinese Standard GB/T 50785-2012 [
3], and it is one of the common methods for studying indoor energy consumption and indoor thermal comfort. These standards are mainly applicable to thermal comfort research in office environments. If the existing thermal comfort standards are directly applied to residential buildings, the accuracy of the results will be difficult to confirm. Therefore, the indoor thermal environment and indoor thermal comfort in residential buildings need to be further studied. In recent years, China’s urban and rural areas have developed rapidly, and the indoor thermal resolution of Chinese vernacular dwellings is generally poor. Therefore, this paper reports research on the indoor thermal environment of Chinese vernacular dwellings and the thermal comfort of residents.
In 2018, the Chinese central government defined the route and strategic goals for rural revitalization in the “Opinions on Implementing Rural Revitalization Strategy”, which marked the new era for Chinese rural development [
4]. With the rapid development of rural revitalization in recent years, the rural economy has grown significantly and people’s living standards have also been greatly improved [
5]. Rural development and residential construction have entered a new development period [
6]. According to the data released by the National Bureau of Statistics, about 39% of the population in China still lives in rural areas [
7], and their living environment and quality are drawing increasing attention in recent years [
8]. Under this development background, most of the newly built dwellings overemphasize the unity of layout and form, ignoring the relationship with the regional environment. The lack of research on the low-carbon design of regional dwellings has not only resulted in the gradual loss of the regional cultural characteristics of dwellings, but also caused a contradiction between the functional layout of dwellings and the residents’ usage habits. The abuse of modern building materials caused low-quality residential buildings, poor indoor and outdoor thermal comfort, and many other issues [
9]. Following these problems, high energy consumption and high carbon emissions become the main problems of newly built residential buildings [
10,
11], which cause huge negative impacts on the environment [
12].
In addition, the proportion of the elderly population in China had already accounted for 18.7% of the total population in 2021, an increase of 5.44% since 2011. With the acceleration of the aging process and the transfer of young labor from rural to urban areas brought by China’s rapid urbanization process, the proportion of elderly people living in rural areas will continue increase in the future [
13]. Owing to physical and health conditions [
14], the elderly spend about 80% of their time indoors [
15], and have higher requirements for indoor thermal comfort [
13].
Therefore, under the rapid development of rural areas, the questions of how to meet the physical and psychological needs of users, how to optimize the spatial functions of vernacular dwellings, how to effectively improve indoor and outdoor thermal comfort, and how to improve the living quality, have become an important practical and academic issue in the whole Chinese rural revitalization.
This paper innovatively compares the indoor thermal environment, the standard comfort range of GB/T 50785-2012, and the actual thermal comfort range of residents, which will allow us to view the current situation of the indoor thermal environment more intuitively, so as to improve the indoor thermal environment in a more targeted manner. When improving the indoor thermal environment, taking the actual thermal comfort range of residents as the optimization target can reduce unnecessary energy consumption and help residents save costs.
1.2. Regional Issue
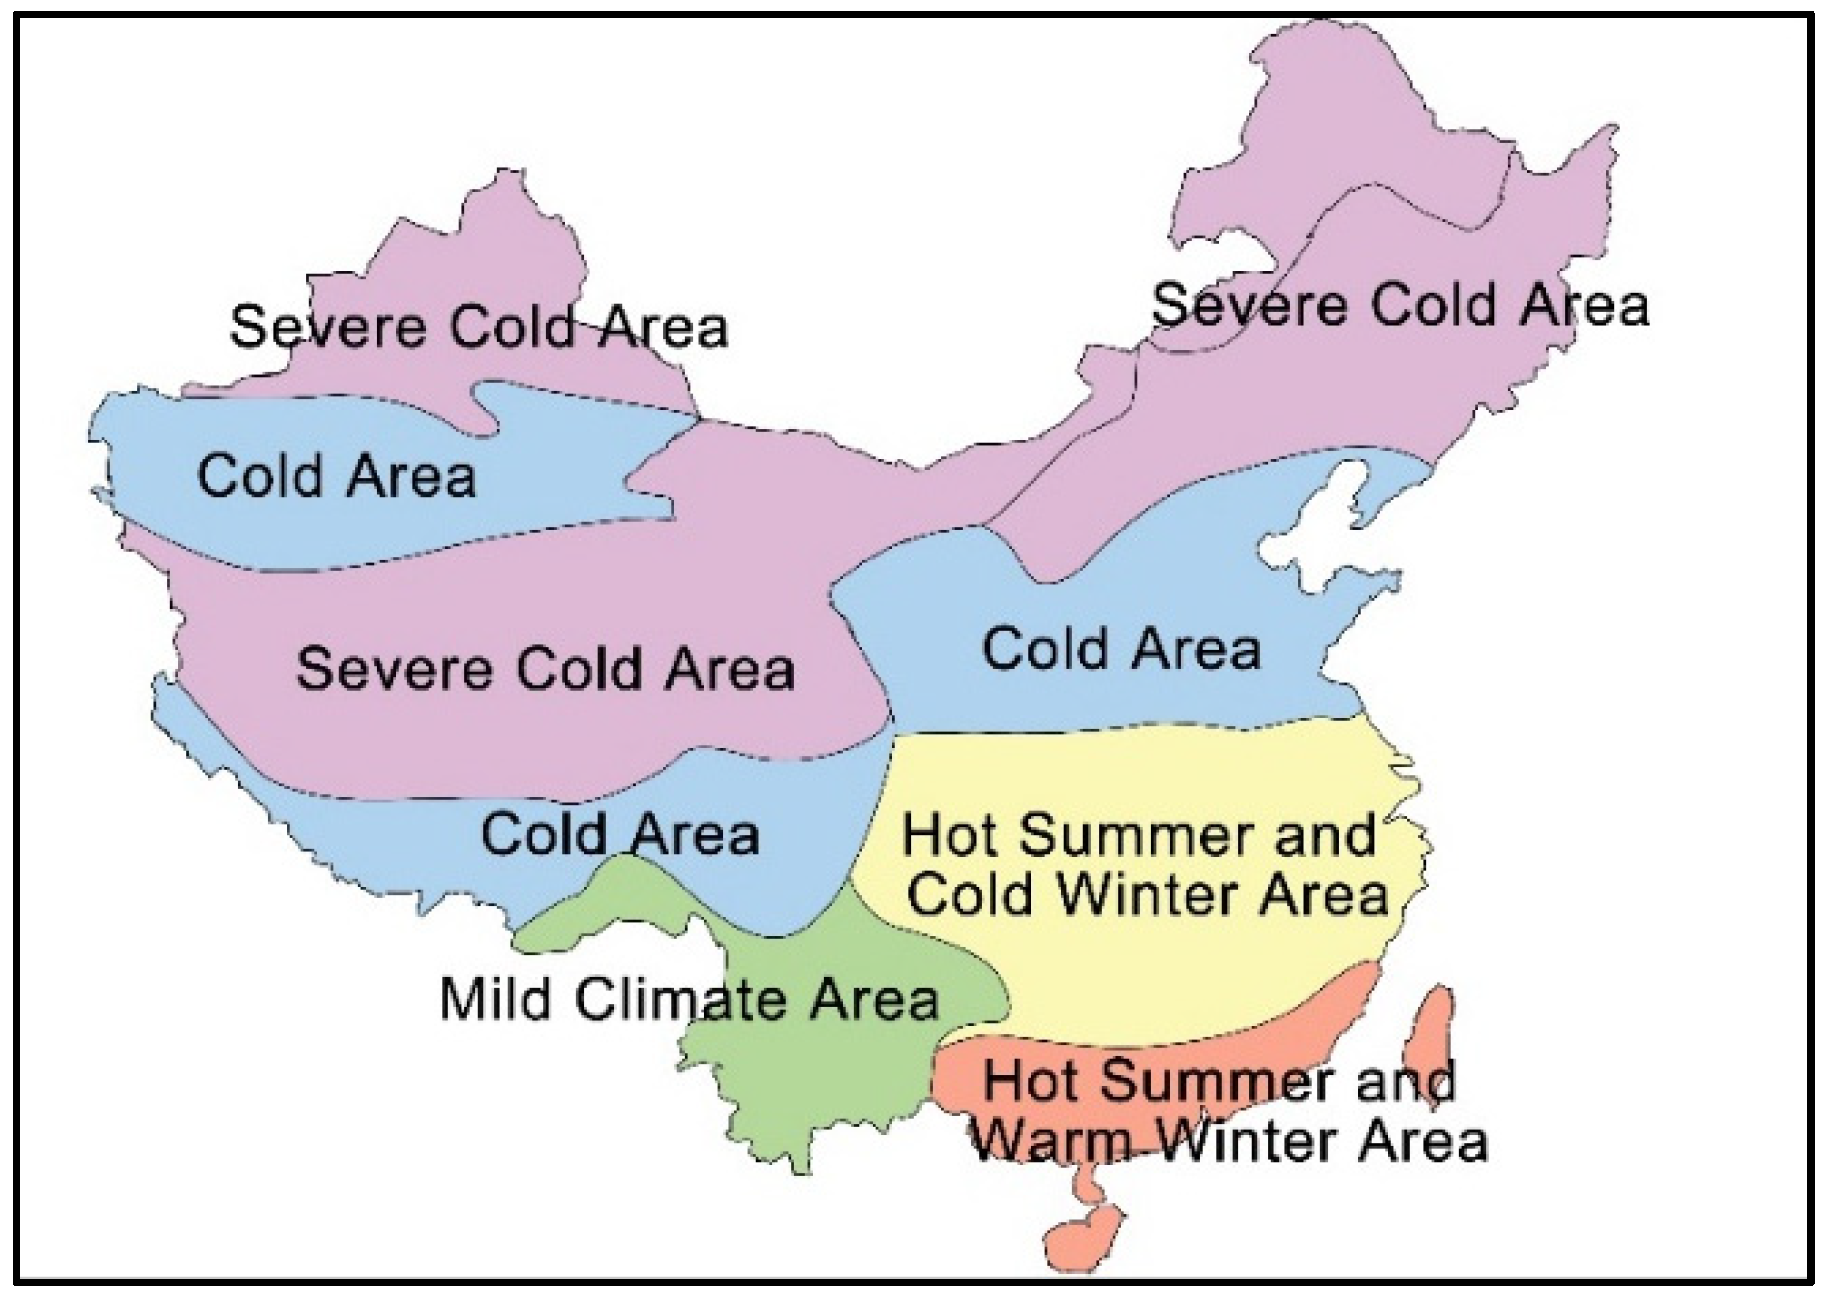
China has a vast territory with five climatic regions, of which the severe cold regions and cold regions are mainly distributed in northern China (
Figure 1) [
16]. In the cold regions of China, only Shandong Province is entirely within the cold climate region, and other provinces also have parts in other climate regions. The climate of Shandong Province is relatively suitable in summer and cold in winter [
17]. Shandong is the largest agricultural province in China and has the second largest rural population. It has a vast rural area, but the rural economy is relatively underdeveloped and the income of farmers is low. According to the data released by the National Bureau of Statistics in 2021, the per capita disposable income of rural residents in Shandong Province is CNY 20,800, and 16 cities are less than CNY 30,000 [
7]. The economic situation directly affects the indoor thermal environment of vernacular dwellings and the life quality of residents. Residents with poor economic conditions tend to reduce the investment in construction costs when building houses, such as using cheap but poor-performance materials, reducing the building area, etc., which in turn affects the functional layout and indoor comfort, generates more energy consumption, and increases usage costs. Therefore, improving the thermal environment of vernacular dwellings in Shandong has a great social value and demonstrates significance for rural areas in cold regions of China.
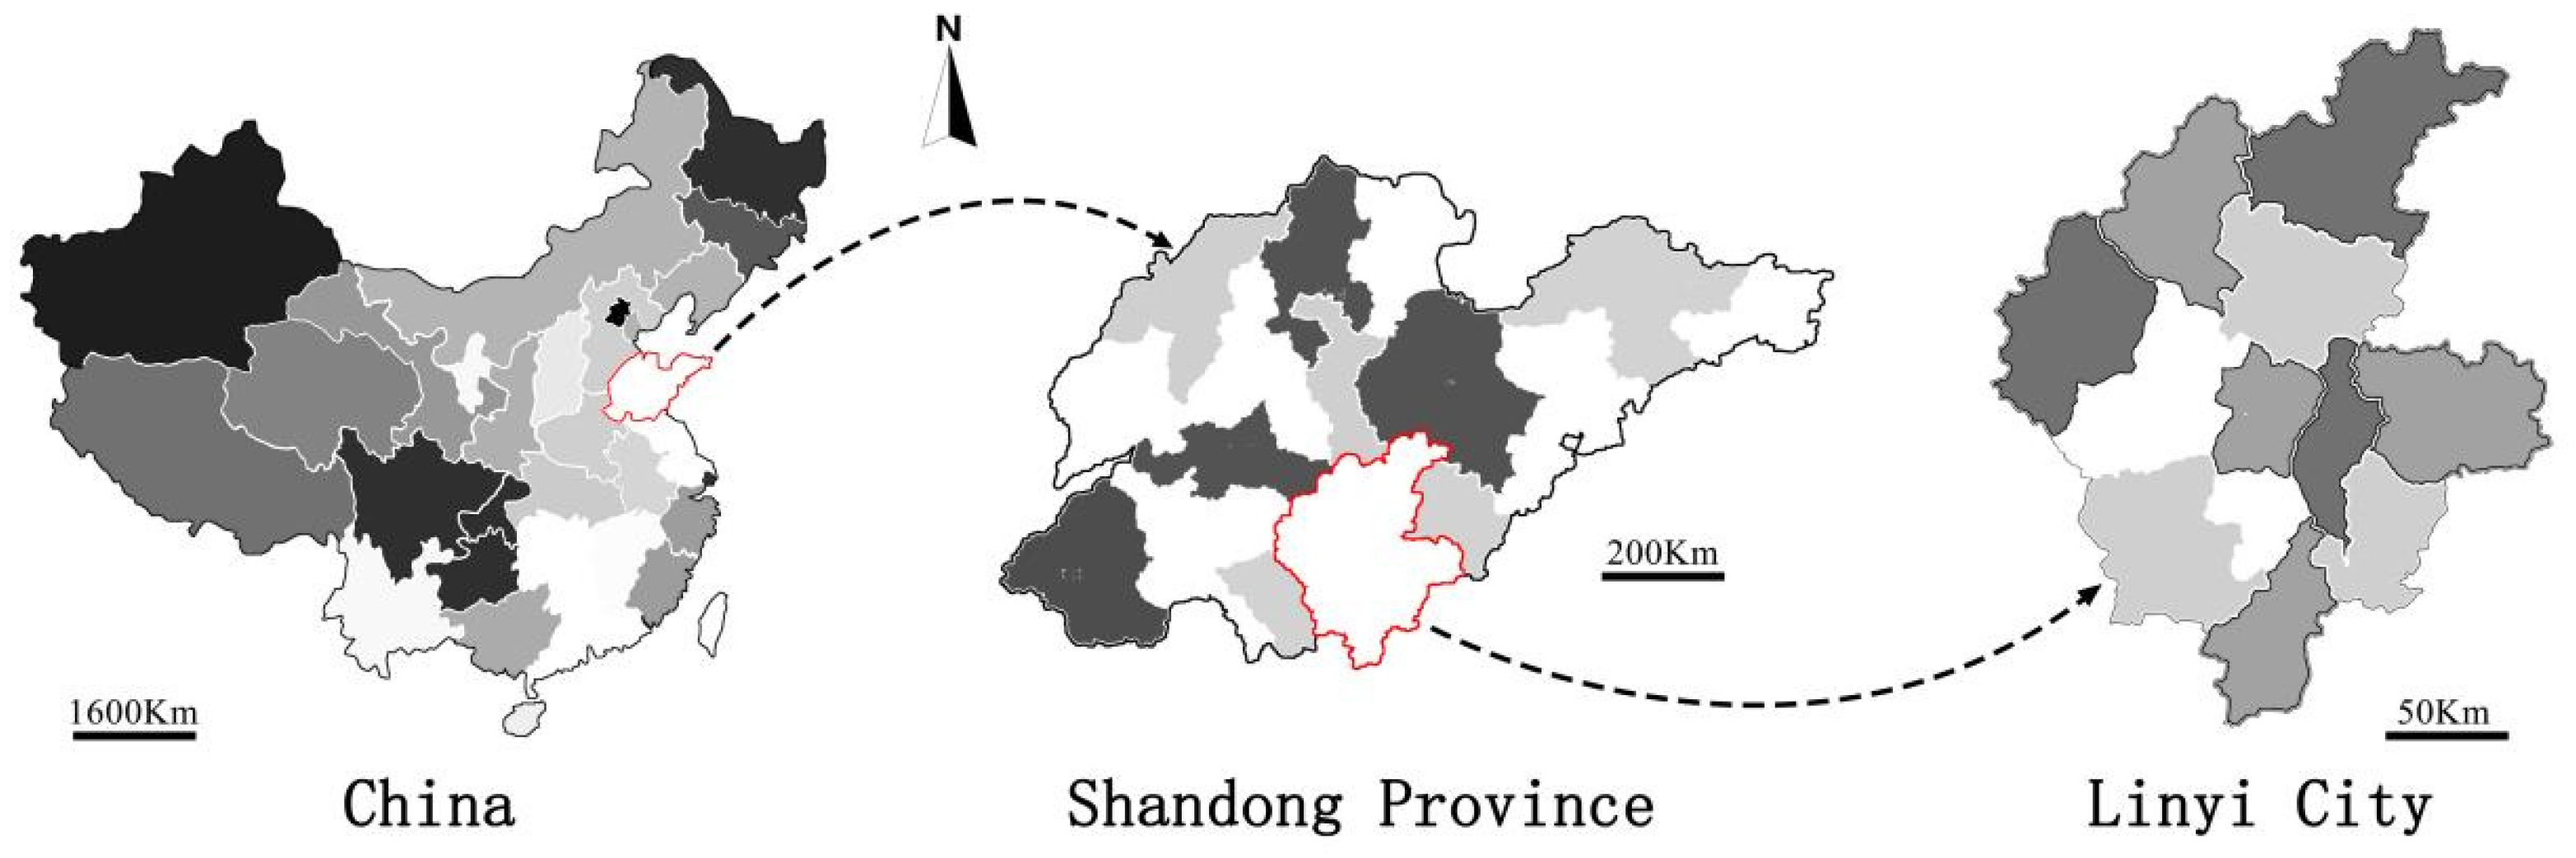
Rural revitalization in Shandong Province is currently being actively carried out, and Linyi city is the key implementation area (
Figure 2). Linyi is the largest and most populous city in Shandong Province, and the rural development there is relatively regressive. Linyi’s economic development is also relatively regressive, and the per capita disposable income of Linyi ranks third from the bottom in Shandong in 2021 [
7], which results in a large outflow of young people and an increasing proportion of the elderly. Summarizing, Linyi’s rural areas are vast and the rural economy is underdeveloped. The government departments are actively carrying out various rural revitalization projects in Linyi’s rural areas. Therefore, this paper takes Linyi’s vernacular dwellings as the research object, which has very important research significance.
2. Literature Review
2.1. Analysis of the Factors Influencing the Indoor Thermal Environment in Vernacular Dwellings
The indoor thermal environment of vernacular dwellings is mainly influenced by the design phase, including the spatial layout of the dwellings and thermal insulation performance of the building envelope [
18,
19], which are constrained by limited economic conditions [
20]. Some studies point out that the high initial cost is the main factor affecting the indoor thermal environment of vernacular dwellings [
21]. The construction cost determines the use of construction materials, which affects the indoor thermal environment directly [
22,
23]. Heat losses depend entirely on the physical conditions of the constructive elements (walls, roof, and glass) [
24], and heat losses from the exterior envelope system account for 60–80% of the total building heat losses [
25,
26]. It has been shown that the decrement factor “f” (which refers to the ratio of the average daily amplitude of the indoor temperature to the average daily amplitude of the outdoor temperature) shows a strong linear correlation with the parameter Q (i.e., the heat capacity of the building envelope per unit of internal volume), indicating that the material composition of the envelope has a significant impact on the indoor thermal environment [
27]. Fang et al. conducted a simulation validation for rural vernacular dwellings in hot-summer and cold-winter regions of China and found that external wall insulation can save up to 23.5% of air conditioning energy during the summer test period [
28]. Surapog et al. concluded that insulation can improve the thermal performance of walls based on the results of an experimental and simulation study on the comparative energy and economic performance of walls used in enclosed air-conditioned spaces [
29]. However, the walls of vernacular dwellings in Chinese rural areas are generally not equipped with thermal insulation layers, and the building envelope has poor thermal insulation performance, which results in a relatively poor and unstable indoor thermal environment [
30,
31].
In addition, the spatial layout also directly affects the indoor thermal environment. Many scholars have analyzed the influence of spatial layout on indoor thermal environment in different geographical environments by means of software simulations, and they found that the indoor thermal environment of vernacular dwellings can be significantly improved by reasonable spatial-scale design and reasonable spatial layout. Ensieh Ghorbani Nia studied Iranian dwellings, analyzed the layout, opening design, envelope design, and other aspects of dwellings, and finally put forward a series of suggestions for the renovation of dwellings [
32]. Sha Chang et al. conducted a study on rural vernacular dwellings in Turpan, Xinjiang, China, and found that semi-outdoor spaces can improve thermal comfort in hot summer and form a complementary effect with indoor spaces [
33]. Duan Xiaofeng studied the village layout and dwelling spatial layout; the results clarified the role of the courtyard in the indoor thermal environment [
34]. In addition, Duan Xiaofeng pointed out that a suitable courtyard area can ensure sufficient indoor light in winter, and the layout of rural houses is now too scattered, which makes people often shuttle between indoors and outdoors, causing instability of the indoor thermal environment. Lee verified and simulated the relationship between window characteristics, indoor thermal environment, and energy consumption, finding that the optimal window characteristics changed with climate change, and provided the optimal window type, size, and direction, which presented a theoretical basis for window optimization [
35]. Liu Dan studied rural energy-saving houses in Northwest China and found that indoor air temperature in winter decreases with the increase in open space; the indoor thermal environment of sloped roof houses is better than that of flat roof houses, and the indoor thermal environment of houses with additional sunrooms has obvious advantages over the original houses [
36]. He Wenfang conducted a study on raw earth dwellings in the Chinese Qinling region and found that the means of controlling room scale has more obvious effects on thermal comfort [
37]. Low floor height can increase the average daily effective temperature by about 2 °C, and with the increase in depth, the average daily effective temperature of the room slowly decreases, especially when the outdoor temperature is high, and the effect of small depth to increase the indoor temperature is more obvious.
Summarizing, the indoor thermal environment of unheated vernacular dwellings is mainly influenced by the thermal insulation performance of the envelope structure, the spatial layout, and the spatial form. For the consideration of construction cost, residents seldom give attention to the thermal insulation performance of the walls, which not only makes the indoor thermal environment poorer, but also causes more energy consumption and increases the usage cost instead. The spatial layout and spatial form of Linyi vernacular dwellings mainly copy the traditional dwellings form of other northern Chinese rural areas without considering the actual thermal environment. Thus, the spatial layout and spatial form can be optimized based on the analysis of local indoor thermal environment, space usage status, and residents’ thermal requirements.
2.2. Analysis of the Factors Influencing the Space Usage of Vernacular Dwellings
People possess adaptability to the environment [
38] and can adjust their thermal comfort through a series of adaptive behaviors [
39,
40], such as changing the activity state, adding or removing clothing, etc. Relevant studies have pointed out that the residents’ clothing thermal resistance, metabolic rate, expectations, and ability to acclimatize all affect thermal comfort [
41,
42,
43]. Thus, residents choose appropriate space usage according to their actual living conditions [
44], while spatial layout, indoor thermal environment, and economic conditions have greater impact on residents’ space usage [
45]. In rural areas, the functional layout is usually designed according to specific activities, often influenced by traditional vernacular dwellings, so the layout of the vernacular dwelling in the same region is roughly the same. When the thermal environment is difficult to meet thermal comfort, residents tend to change their current used space [
20]. For example, Huang et al. found that indoor and outdoor spaces have complementary effects on satisfying residents’ thermal comfort in Chinese rural areas [
46], and the courtyard plays an important role in daily life. The indoor thermal environment is relatively poorer and more unstable in rural areas compared to urban areas [
40,
47,
48], but rural residents tend to show stronger adaptability to the environment than urban residents [
13,
49,
50]. In other words, compared with urban residents who prefer to use auxiliary equipment for thermal comfort adjustment, rural residents adjust their thermal comfort through adaptive behaviors. Costa et al. found that the thermal acceptability of vernacular dwellings in Alentejo, Portugal, in summer is generally higher than the regular dwellings and thermal comfort standards, and the methods detailed under EN 16798 and REH (Regulation of Energy Performance of Residential Buildings) are deemed unfit to evaluate thermal comfort in vernacular dwellings, especially in summer [
40]. It has been pointed out that the diversity of building spaces creates different thermal environment conditions and stimulates different thermal adaptation behaviors [
33,
51,
52]. Low-income residents tend to show stronger environmental adaptability and more flexible space usage [
53]; there is more functional compound space and they usually accomplish as many activities as possible in one space for minimizing energy expenditure cost [
54]. Hao et al. found that the living pattern in rural areas is more closely associated with climate than in urban areas, which are more diversified and more complex in space use (e.g., cooking, dining, and daily living all take place in the same space), and sometimes the dwellings also have certain productive functions [
55].
It can be seen that space usage in vernacular dwellings is not simply according to the functional layout design, but also takes indoor thermal environment and energy expenditure into consideration [
56,
57,
58]. Therefore, there are often contradictions between functional layout and usage in vernacular dwellings [
59,
60], and future studies should be conducted in-depth to determine the unreasonable space usage, thus to improve thermal comfort and further reduce energy consumption.
Most of the previous studies only integrated the physical parameters of the indoor thermal environment with the space usage [
61,
62,
63], but seldom combined the subjective and actual thermal environment from the perspective of residents; thus, the conclusions of these studies often deviated from the actual thermal environment requirements of the users. This paper innovatively combines these three elements of indoor thermal environment: residential space usage status, subjective actual thermal environment satisfaction, and sensation. This research investigates the temperature comfort range of residents by measuring the indoor thermal environment in each room of vernacular dwellings and by thermal satisfaction and sensation voting, so as to find the root causes for the contradiction between residential space usage and the functional layout of vernacular dwellings in rural areas of Linyi.
3. Materials and Methods
3.1. Description of Dwellings
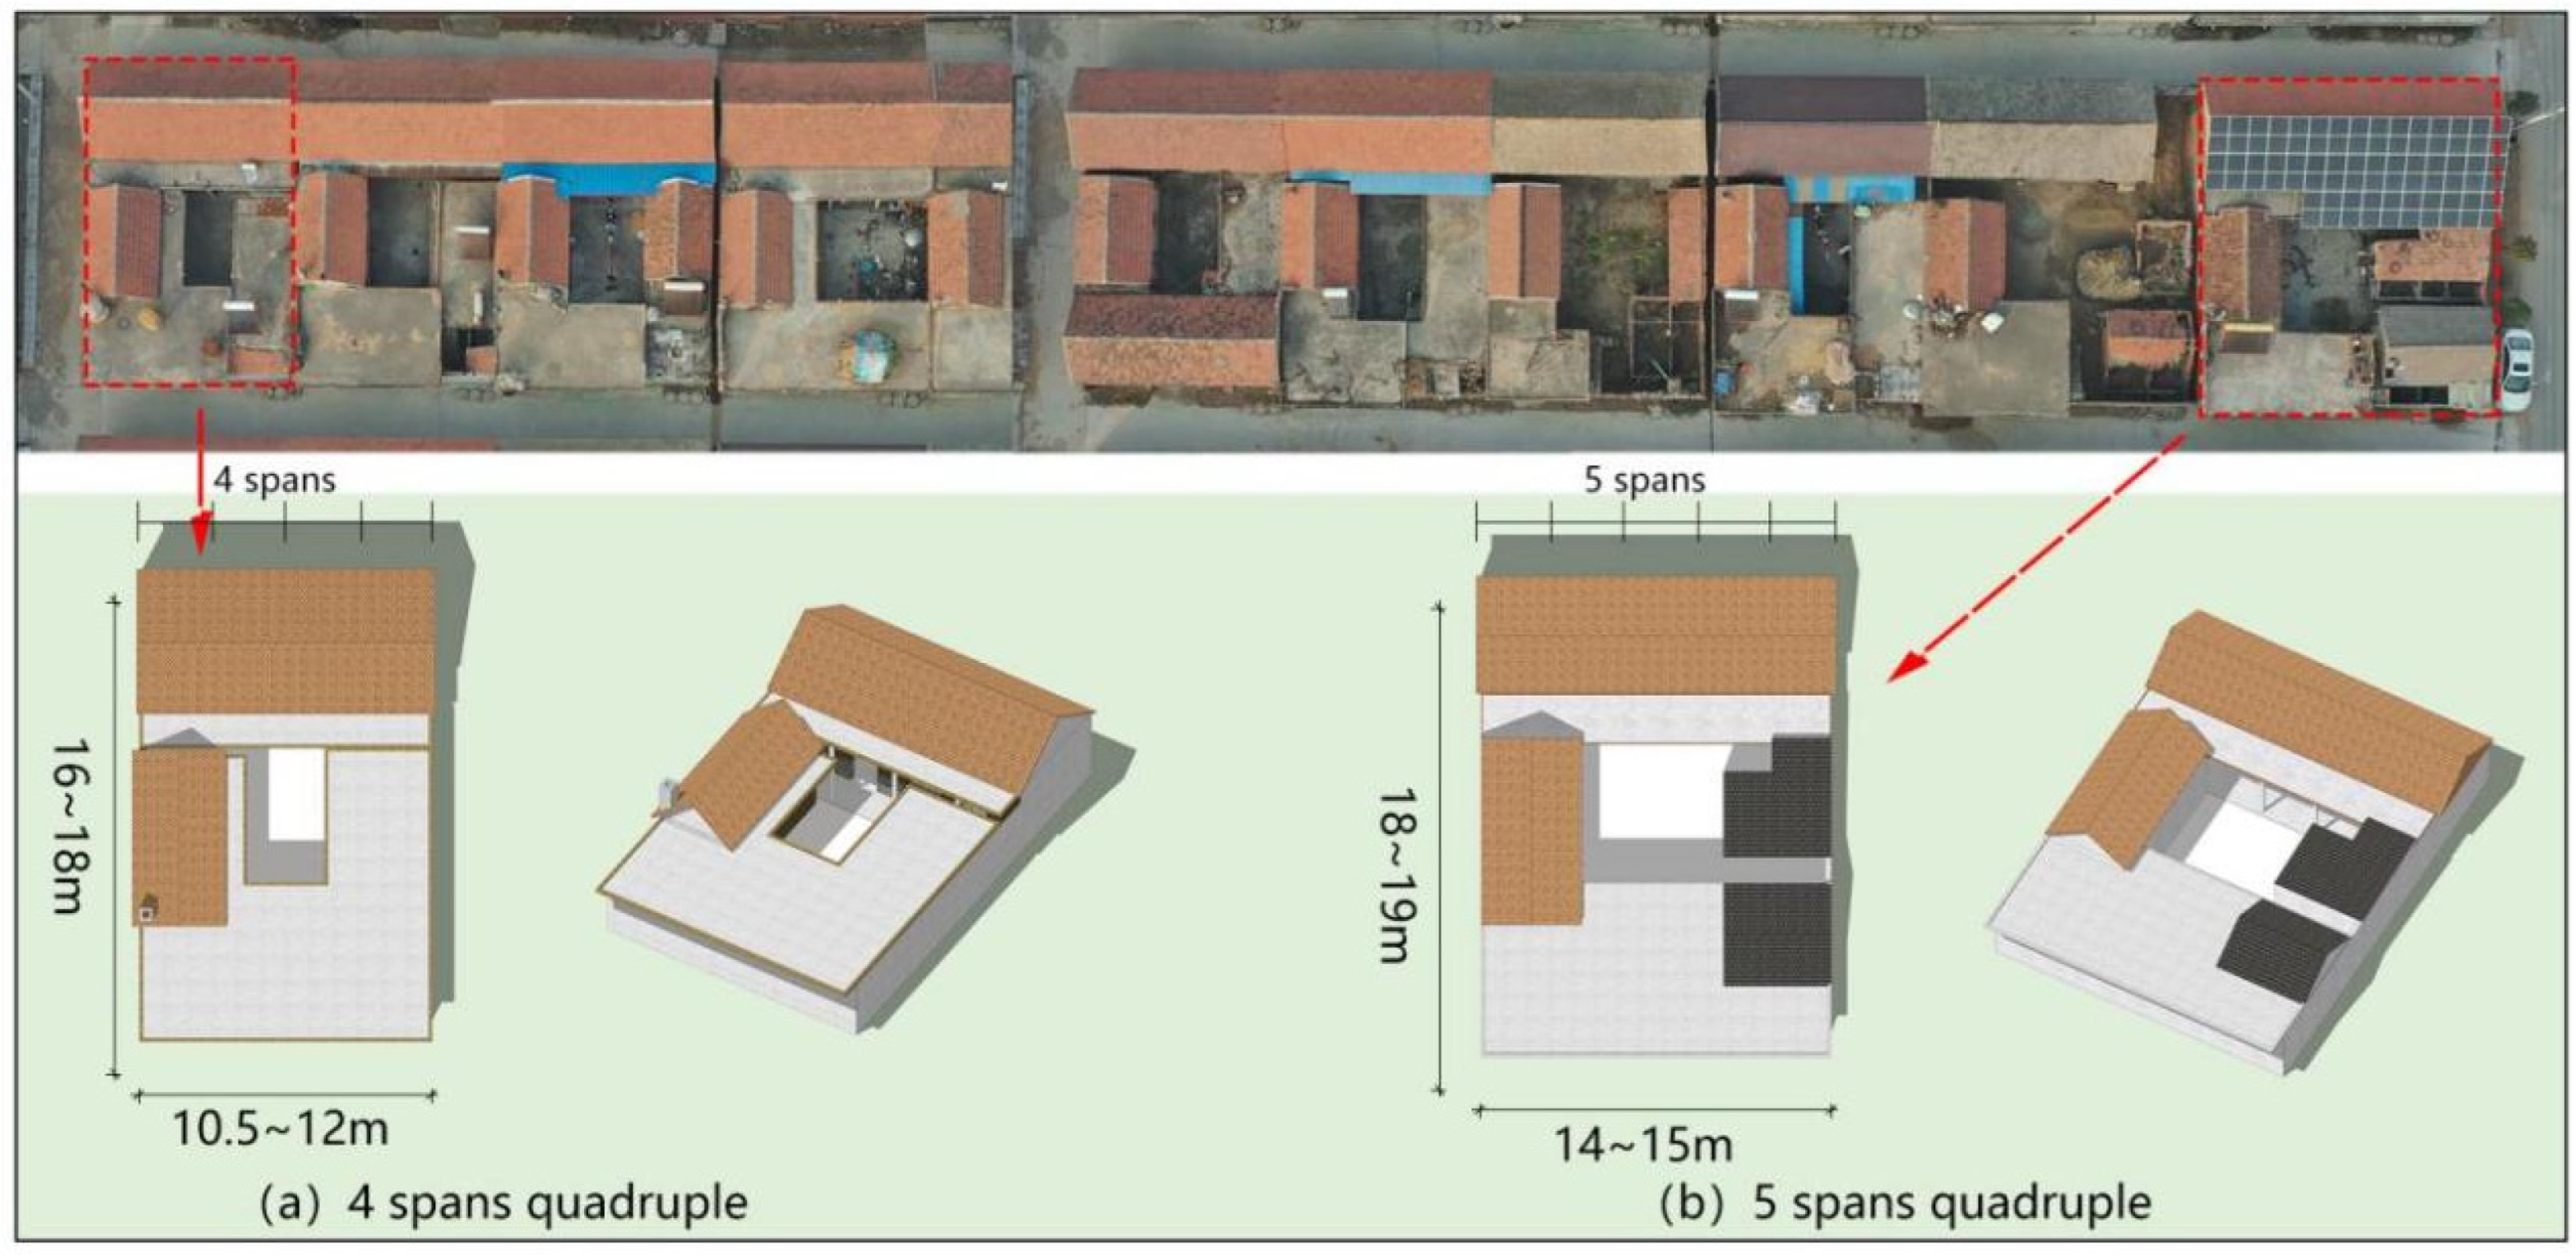
This study investigated four rural counties and districts of Linyi, and found that the vernacular dwellings in Linyi are arranged in courtyards, in the form of dwellings with a 4-section courtyard, 3-section courtyard, and 2-section courtyard. Among them, the dwellings with a 4-section courtyard are the most popular type. According to the length and width ratio, rural residential homesteads can be divided into either rectangular or square types; the horizontal width is four and five spans, respectively, and the area is about 190~200 and 220~240 m
2 (
Figure 3). The roof form of the dwellings mostly adopts a combination of sloping and flat roof.
Owing to the relatively regressive economic conditions in this rural area, walls are usually not equipped with heat insulation layers. Cooling and heating are only equipped in the main-use space and the main heating fuel in winter is coal and firewood. In order to study the current indoor thermal environment and space usage of vernacular dwellings in Linyi, and to ensure the consistency of the climate conditions at the measurement time, five typical vernacular dwellings in Laopo town of Junan county in Linyi were selected for specific study in this research (
Table 1)
3.2. Methods
This study was conducted by in-depth questionnaire interviews and systematic measurements. The questionnaires were used to investigate the space usage, living patterns, and the thermal sensations of the residents. At the same time, the indoor and outdoor thermal environments of the selected dwellings were measured and analyzed to obtain an objective and accurate understanding of the indoor thermal environment and the current space usage status.
3.2.1. Questionnaire Research
The residents’ living habits are gradually developed during long-term evolution. By understanding the space usage characteristics, the existing problems of vernacular dwellings and the characteristics of the indoor thermal environment in each space can be determined. Through the analysis of residents’ space usage habits, their space usage demand can be summarized, and the thermal environment optimization for the main-use space can be proposed, thus reducing energy consumption and improving energy efficiency.
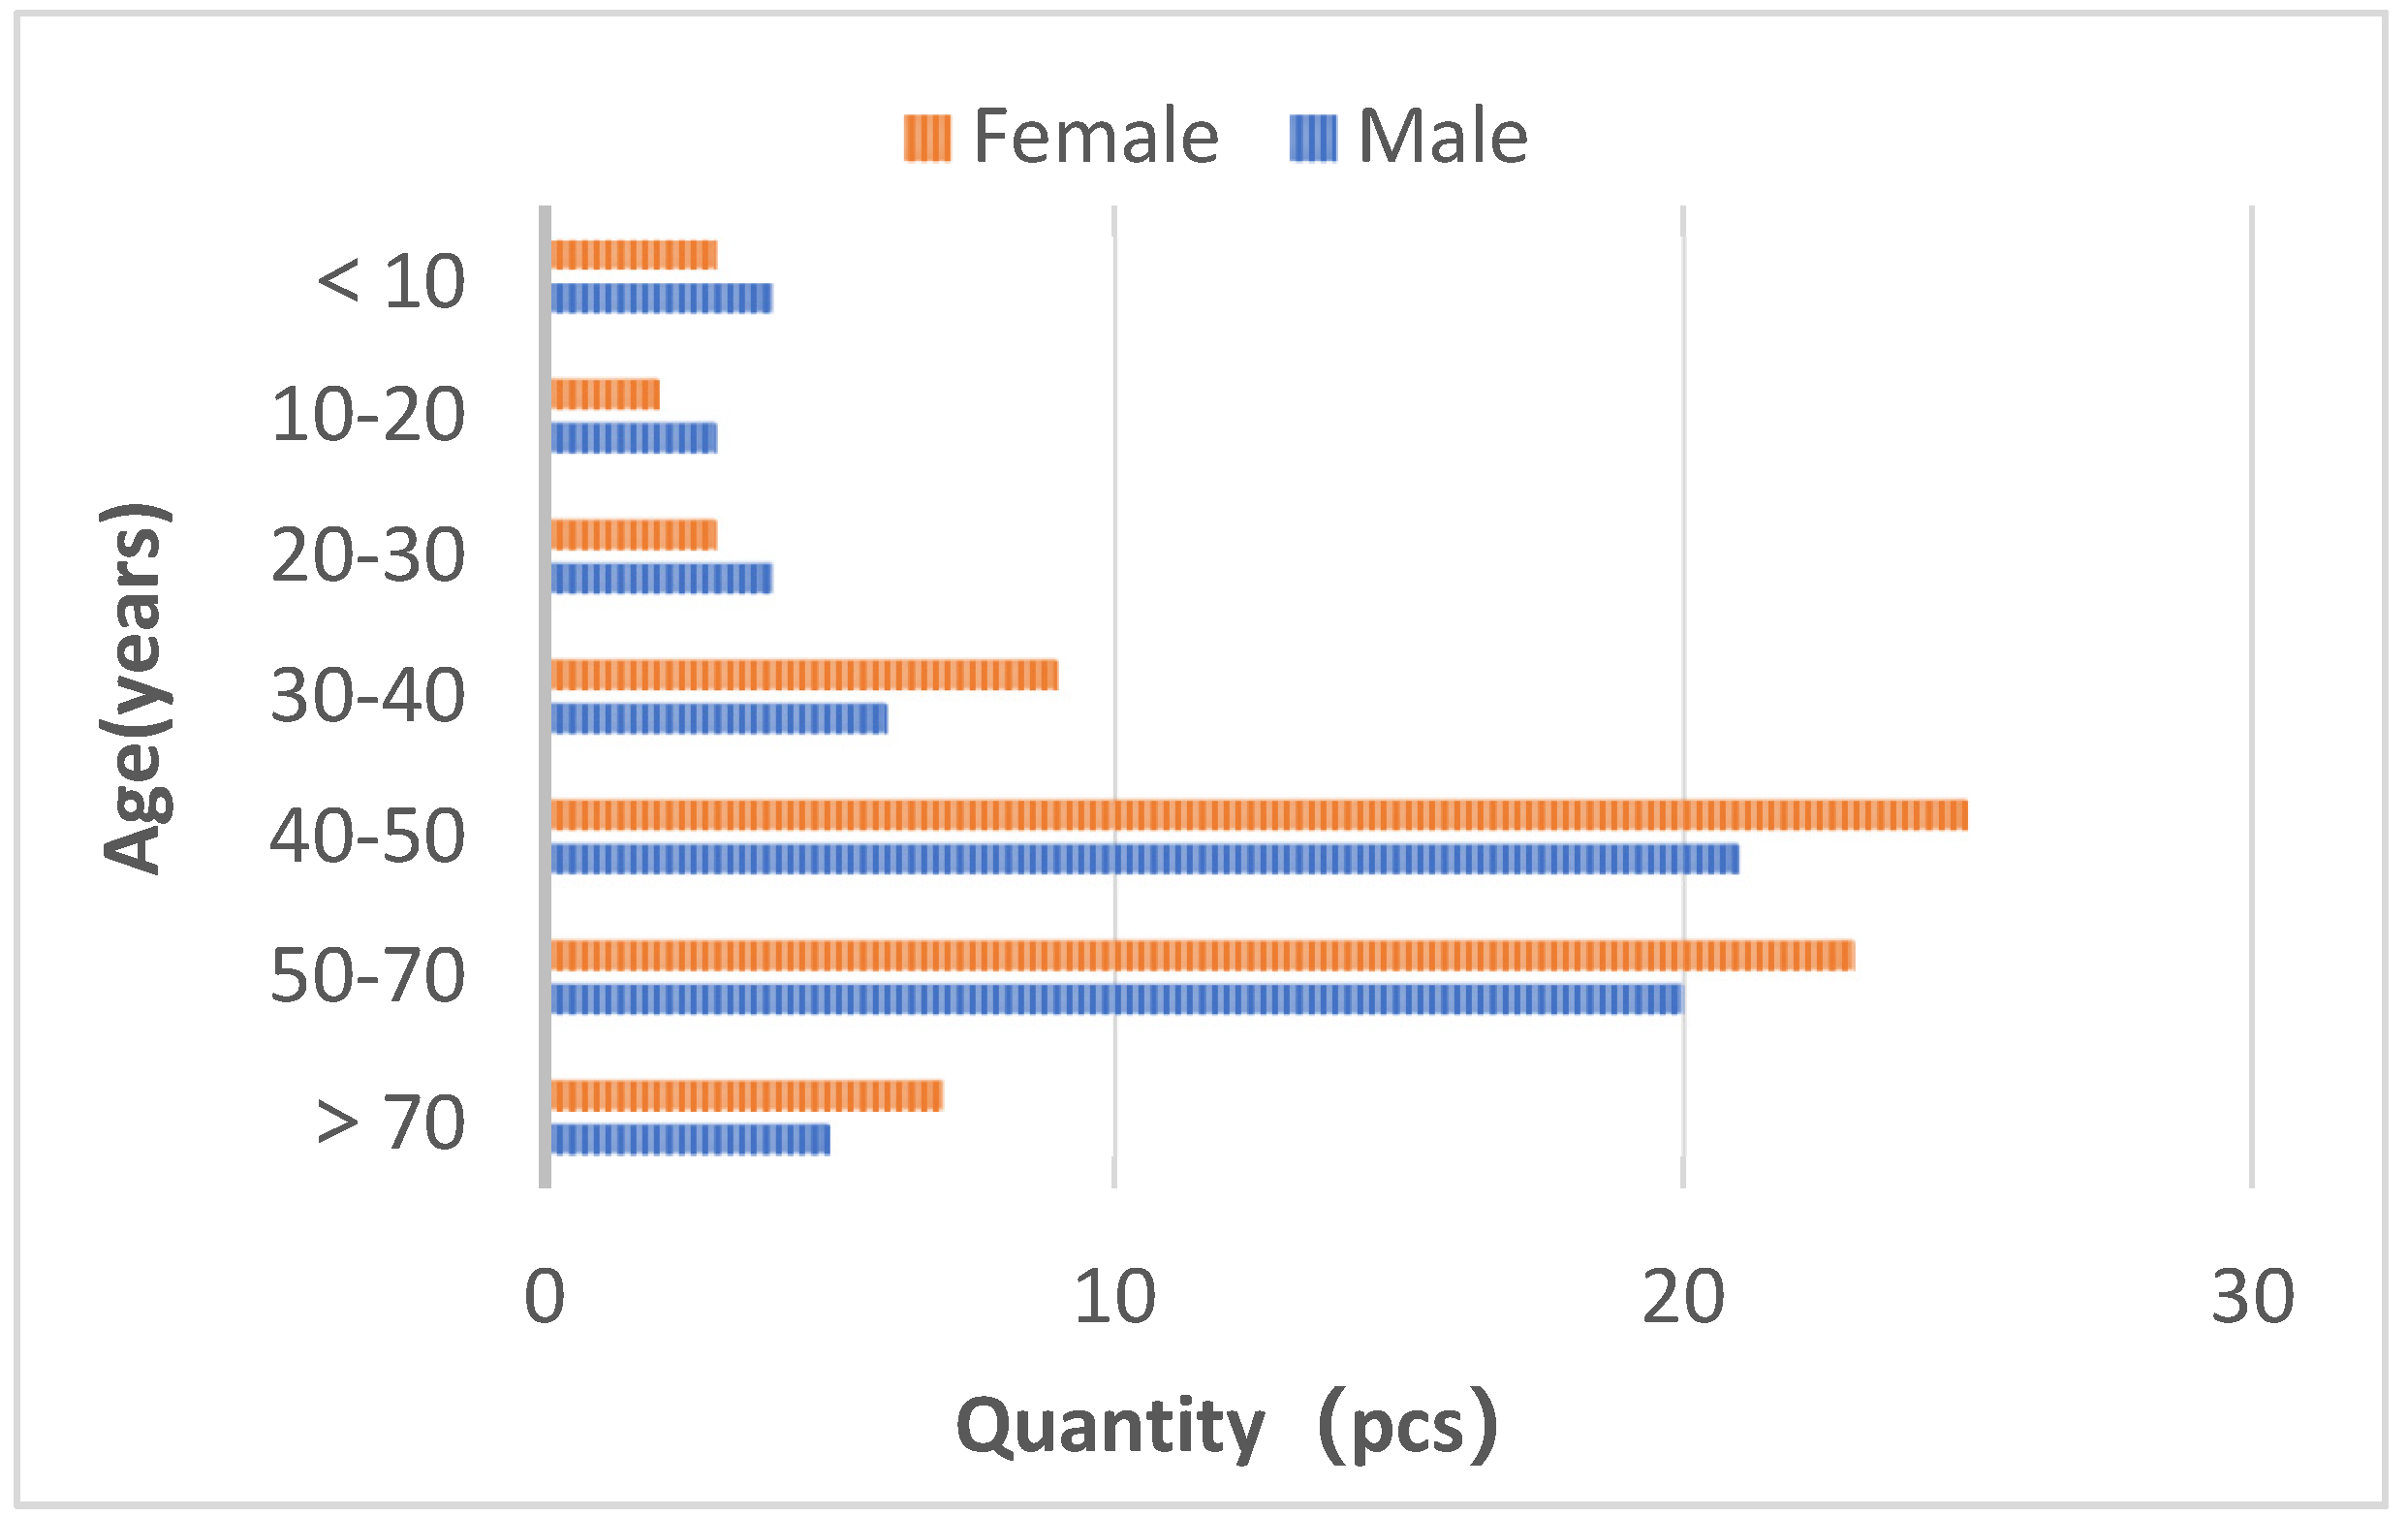
In the field research, a random questionnaire survey was conducted on 135 households (60%) in Caotaxiang village, Laopo town, Junan county, Linyi city. A total of 135 questionnaires were collected. In the sample, 46.7% are males and 53.3% are females; the proportion of 40–50 years old is high, accounting for 34.3% of the total number of respondents, 25.3% of the respondents are under 40 years old, 31.6% of the respondents are 50–70 years old, 8.8% of the respondents are over 70 years old. The specific information is shown in (
Table 2) and (
Figure 4).
In order to investigate residents’ space usage patterns, the questionnaire was designed to record residents’ work and rest time and activity places; thus, the frequency of room usage in the vernacular dwellings could be calculated. Combined with the field-measured data, a thermal satisfaction investigation (
Table 3) and a thermal sensation vote (
Table 4) were included in the questionnaire to analyze the current indoor thermal environment of vernacular dwellings. The thermal comfort range of the residents could be analyzed by using their thermal satisfaction and sensation vote. When conducting the thermal sensation vote, the indoor temperature and relative humidity at that time were recorded by a black sphere thermometer, by which a scatterplot figure of indoor temperature and thermal sensation could be established. In addition, heating and cooling methods, the exact methods used in different rooms, and the time when used, were also investigated through interviews.
3.2.2. Measurement of Environmental Parameter Data
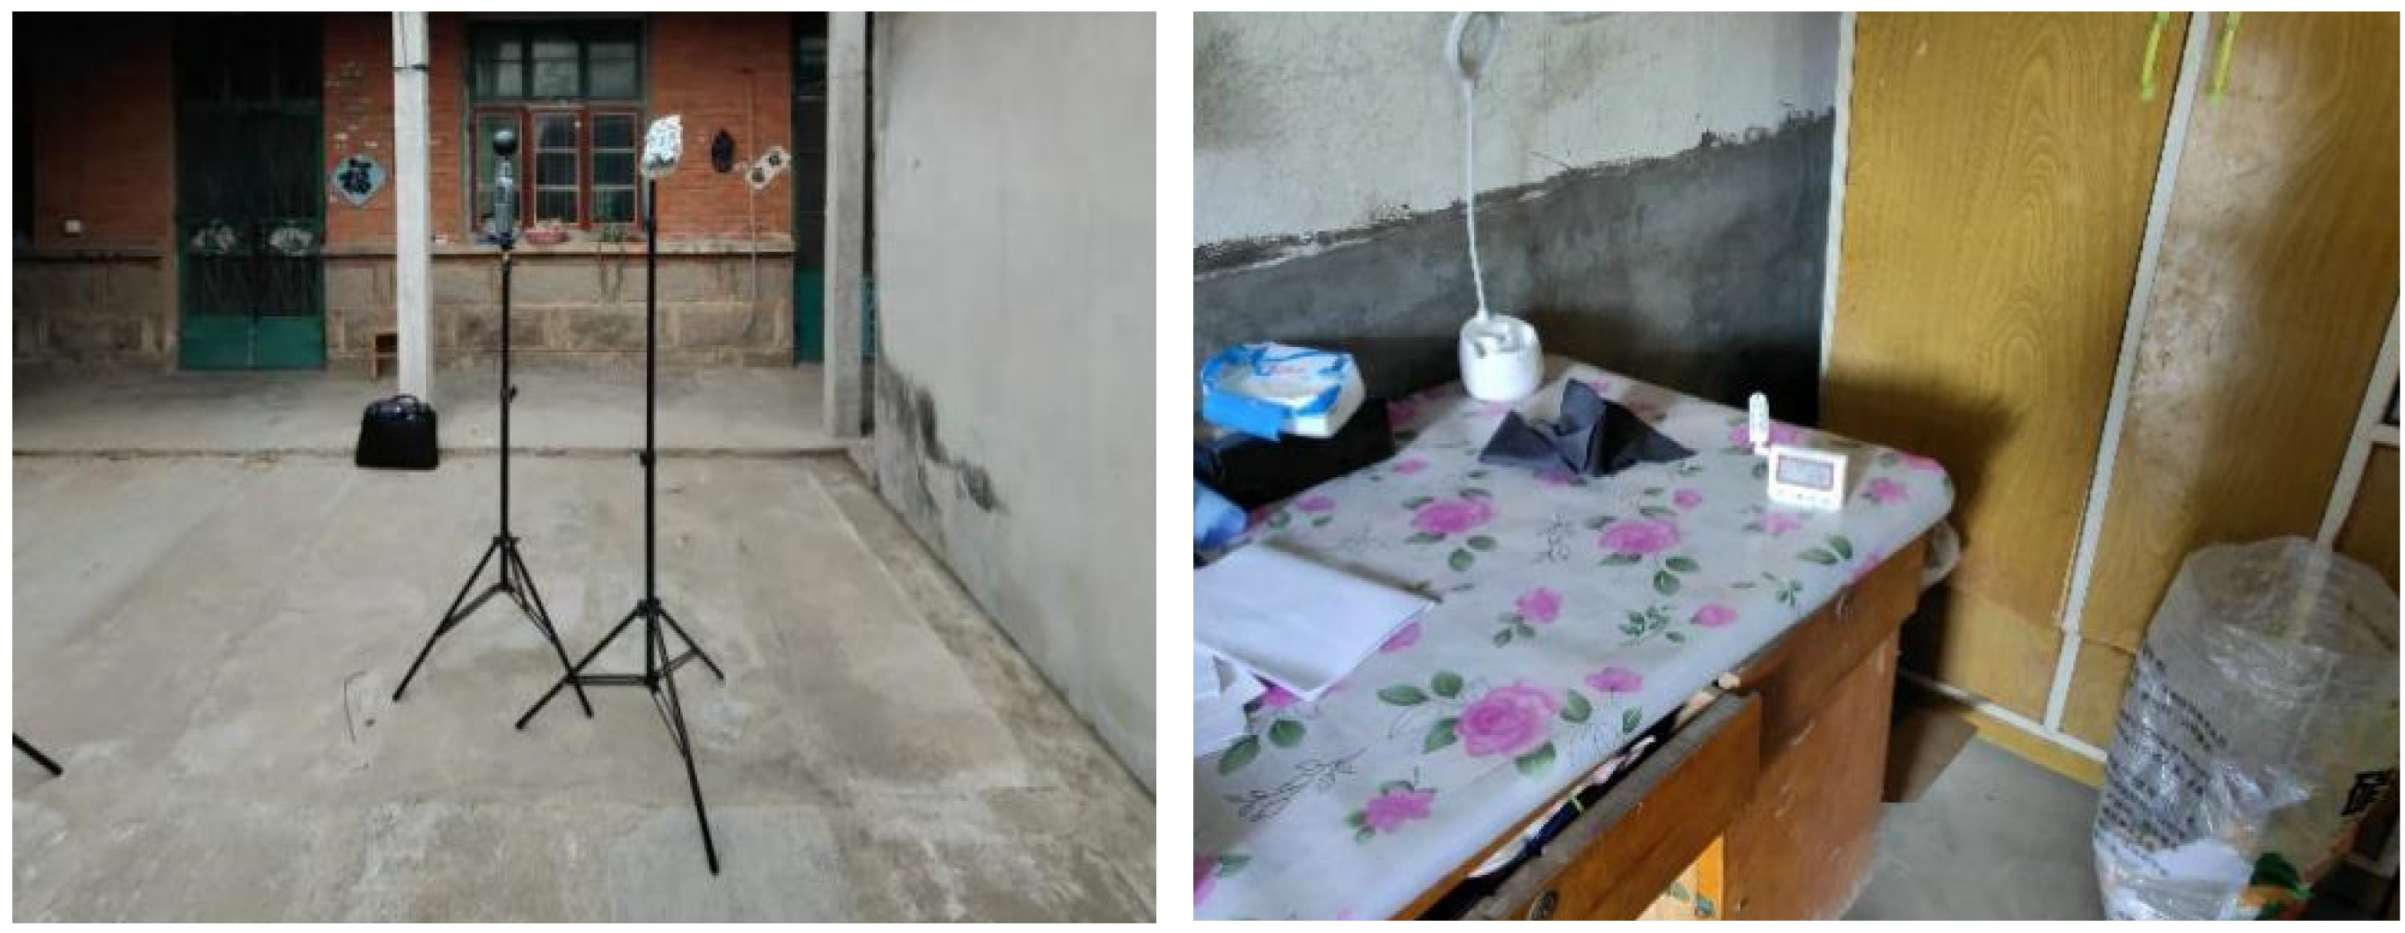
The data measurement included the type and size of the vernacular dwellings, the temperature, and humidity of main rooms and the outdoor courtyard. The measurements were conducted in August 2021 in summer, December and January 2022 in winter, and the measurement sites are Laopo town, Junan county. Test instruments are shown in
Table 5, including the TR-72nw thermometer and AZ87786 black ball thermometer. Instruments were placed at a height of 1.2 m (
Figure 5). Data storage mode was set for continuous recording, and the data recording time interval was 20 min. The sensors of the outdoor instruments were properly shielded with tin foil to avoid the influence of solar radiation. Combined with the thermal sensation vote in the questionnaire, the measured data could be used to analyze the current situation and characteristics of the indoor thermal environment, and comprehensively analyze the indoor thermal comfort of vernacular dwellings in Linyi.
4. Results and Analysis
4.1. Analysis of Current Residential Space Usage Status
4.1.1. Analysis of Spatial Composition
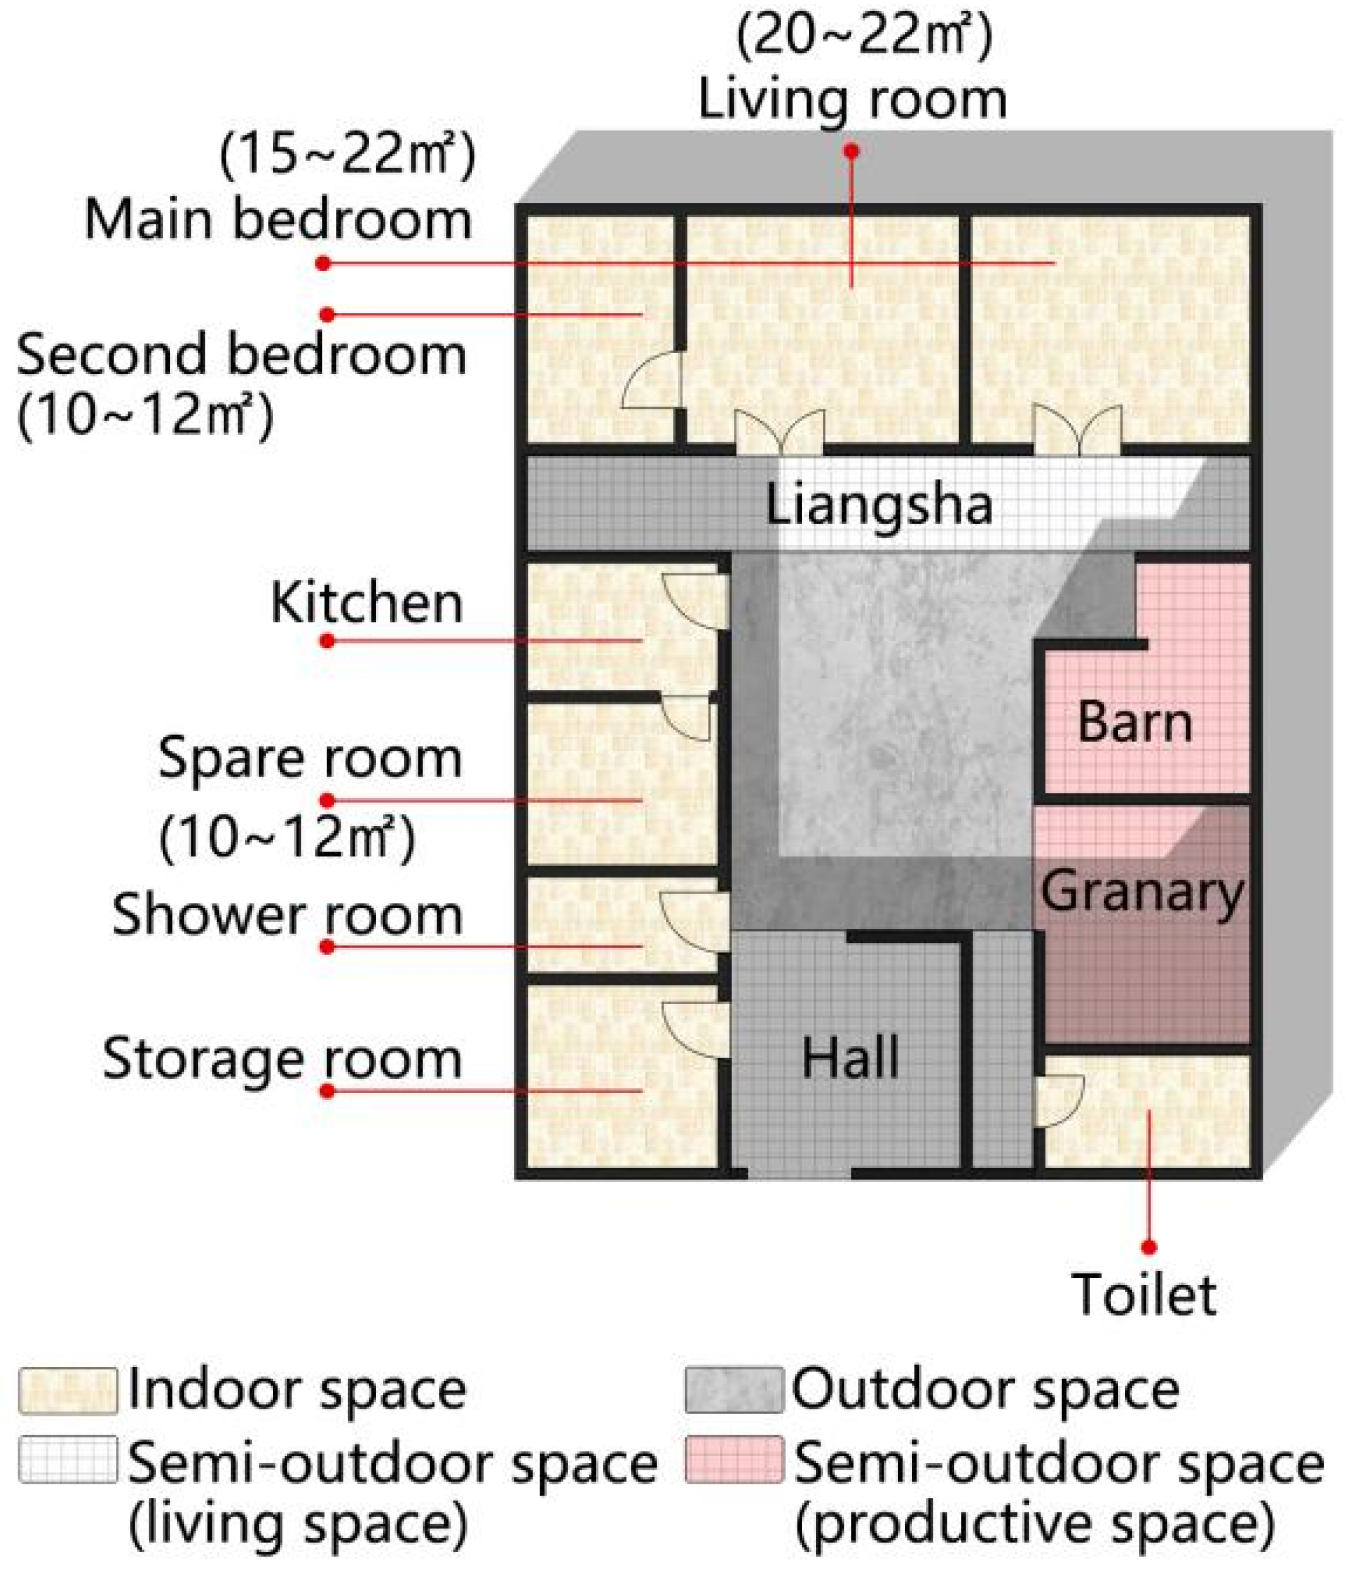
Rural residential space in Linyi can be divided into indoor space, outdoor space, and semi-outdoor space (
Table 6). The indoor space can be further divided into main-use space and auxiliary space. The outdoor space refers to the outdoor courtyard space, and semi-outdoor space can be further divided into living space and productive space.
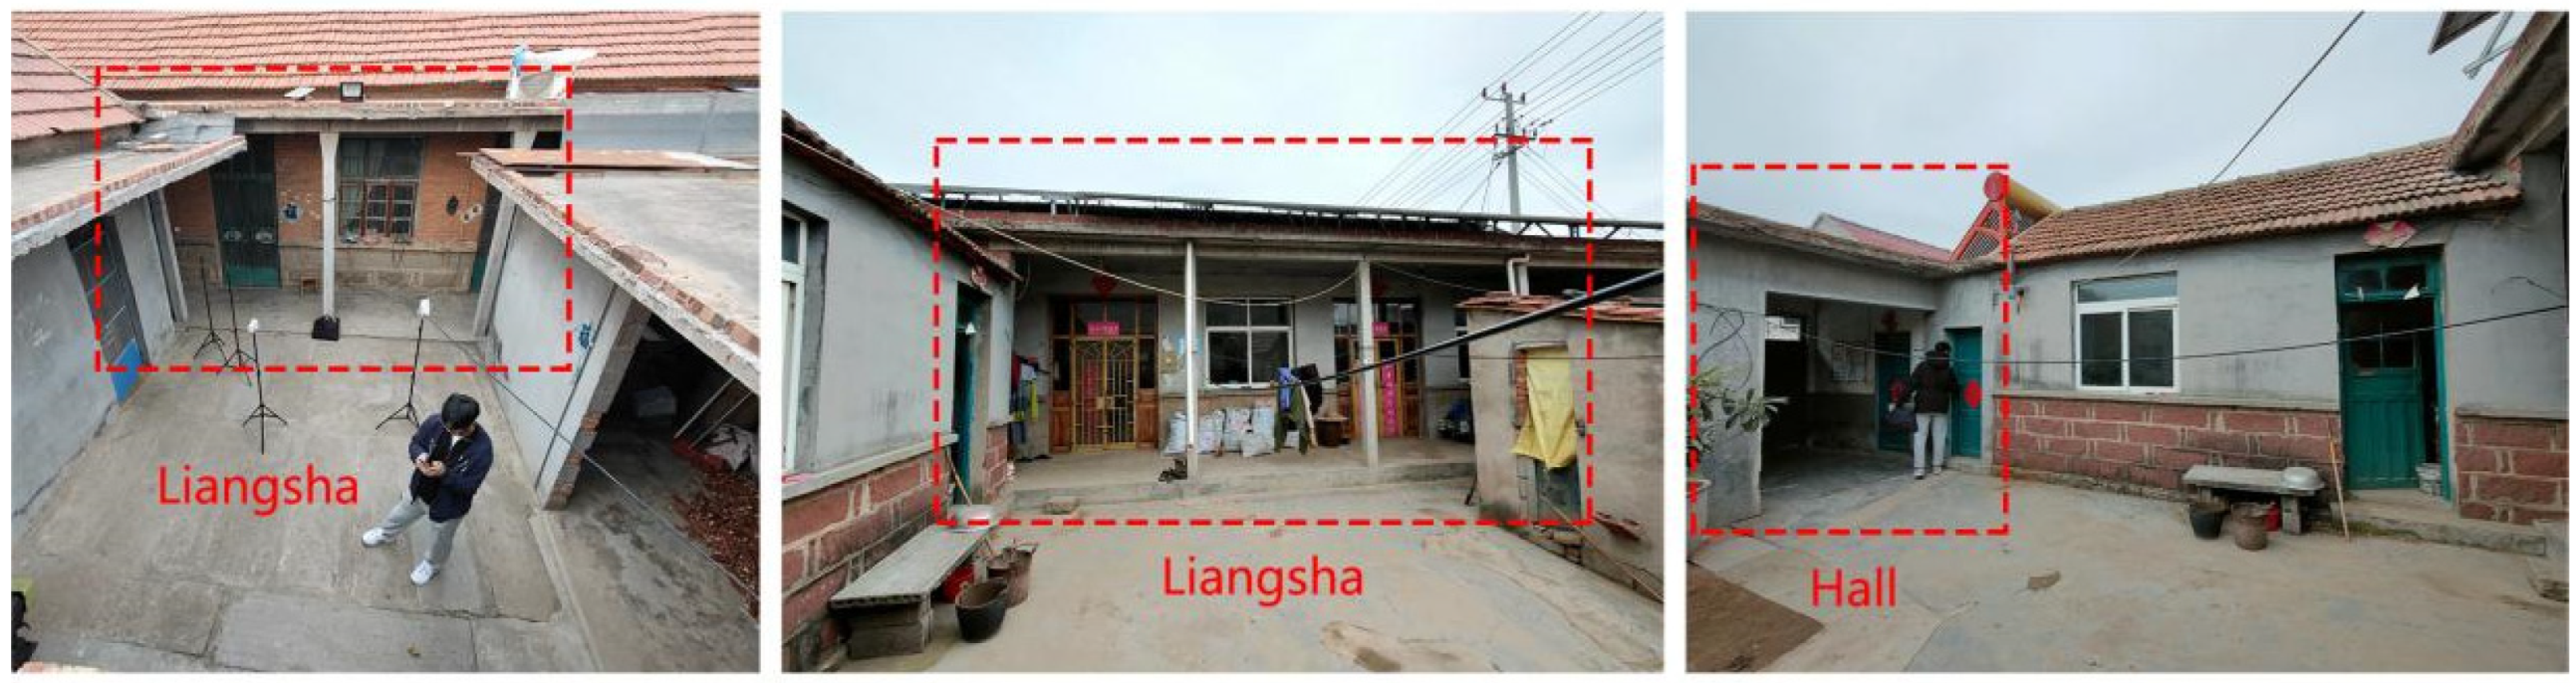
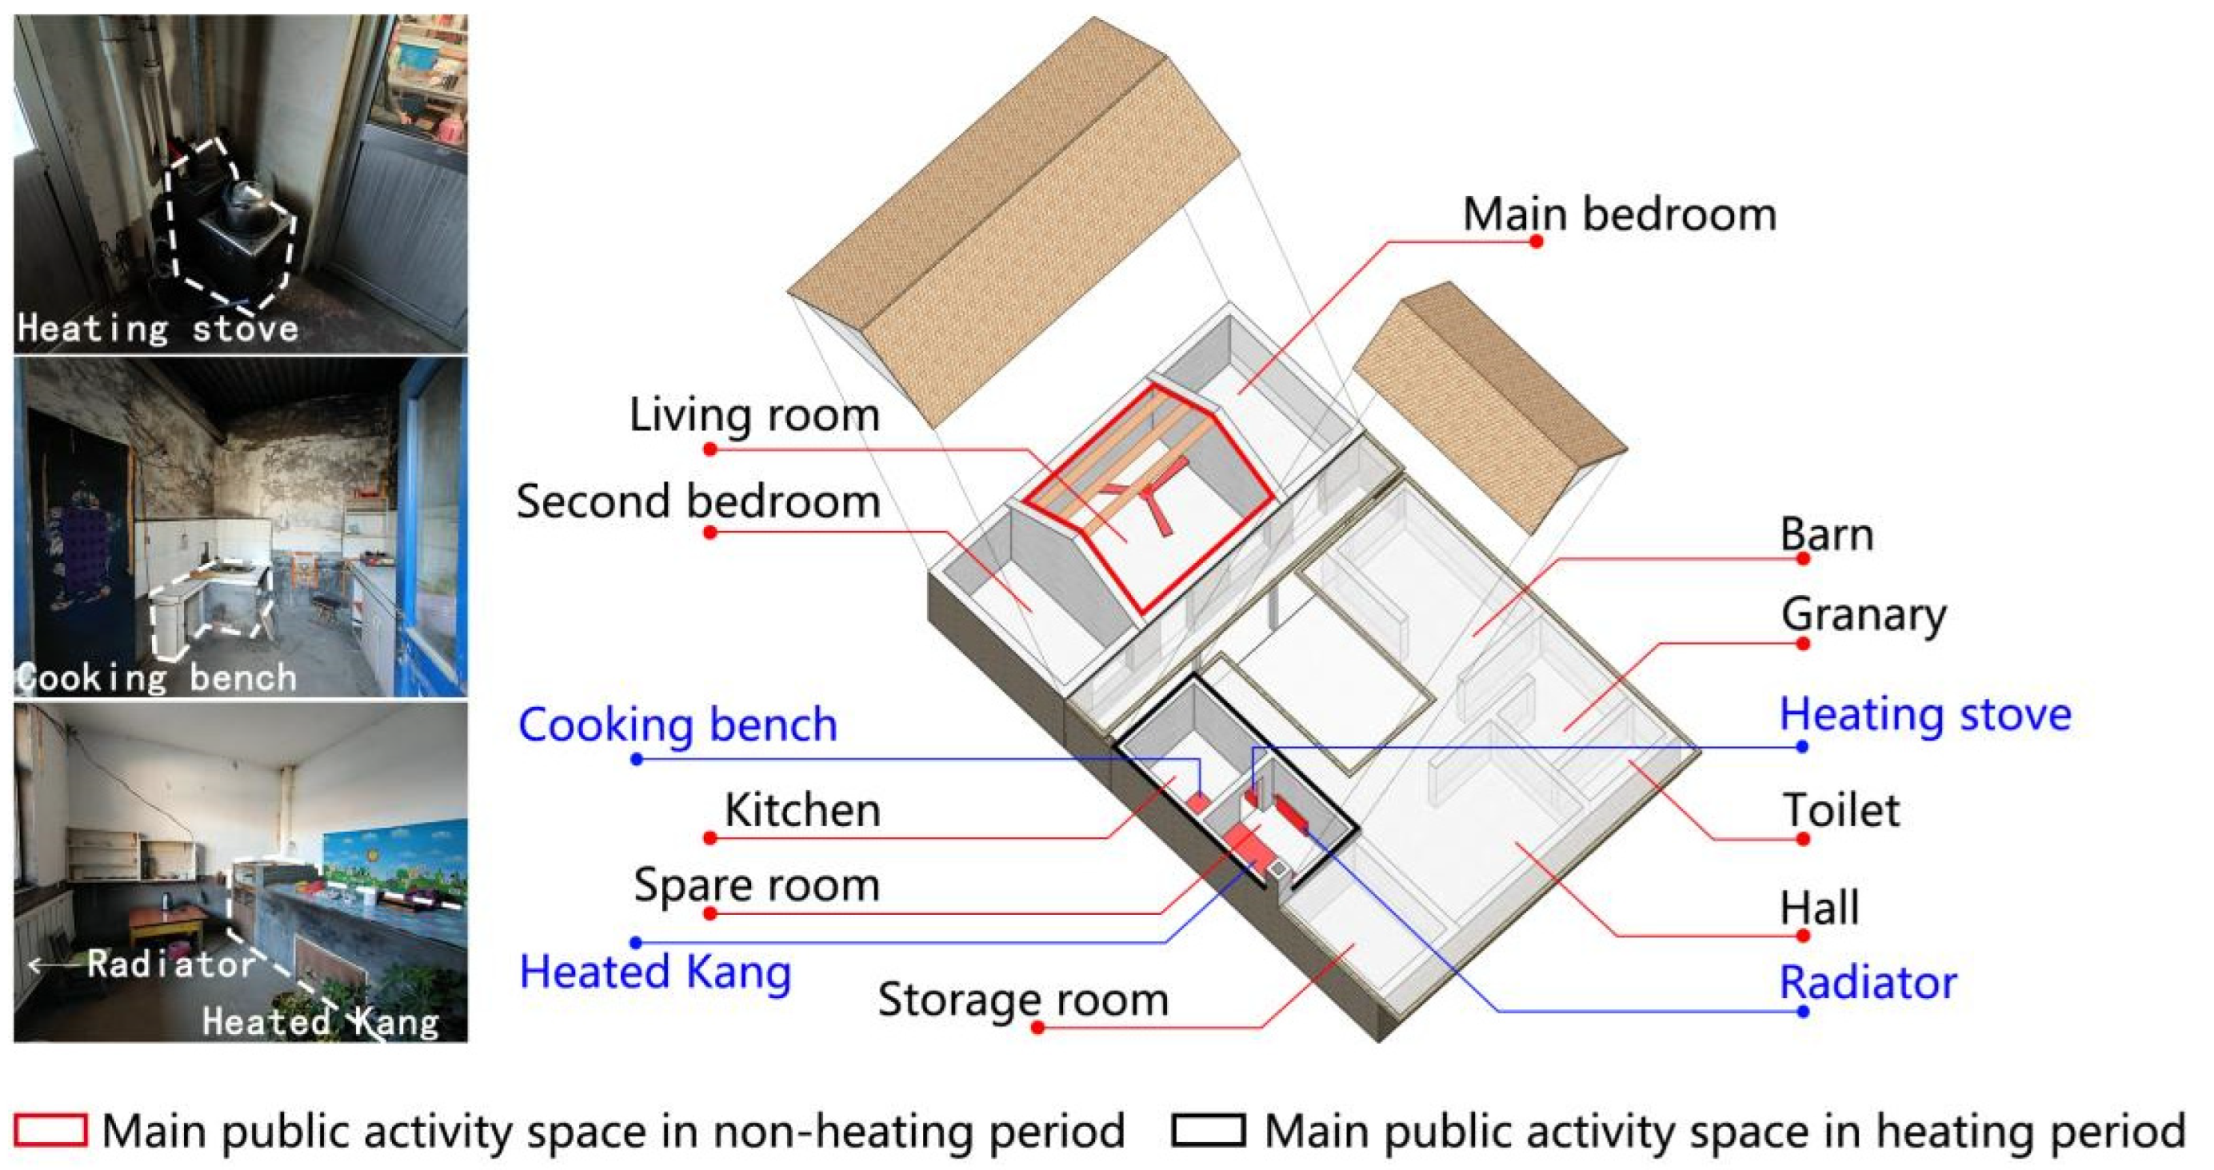
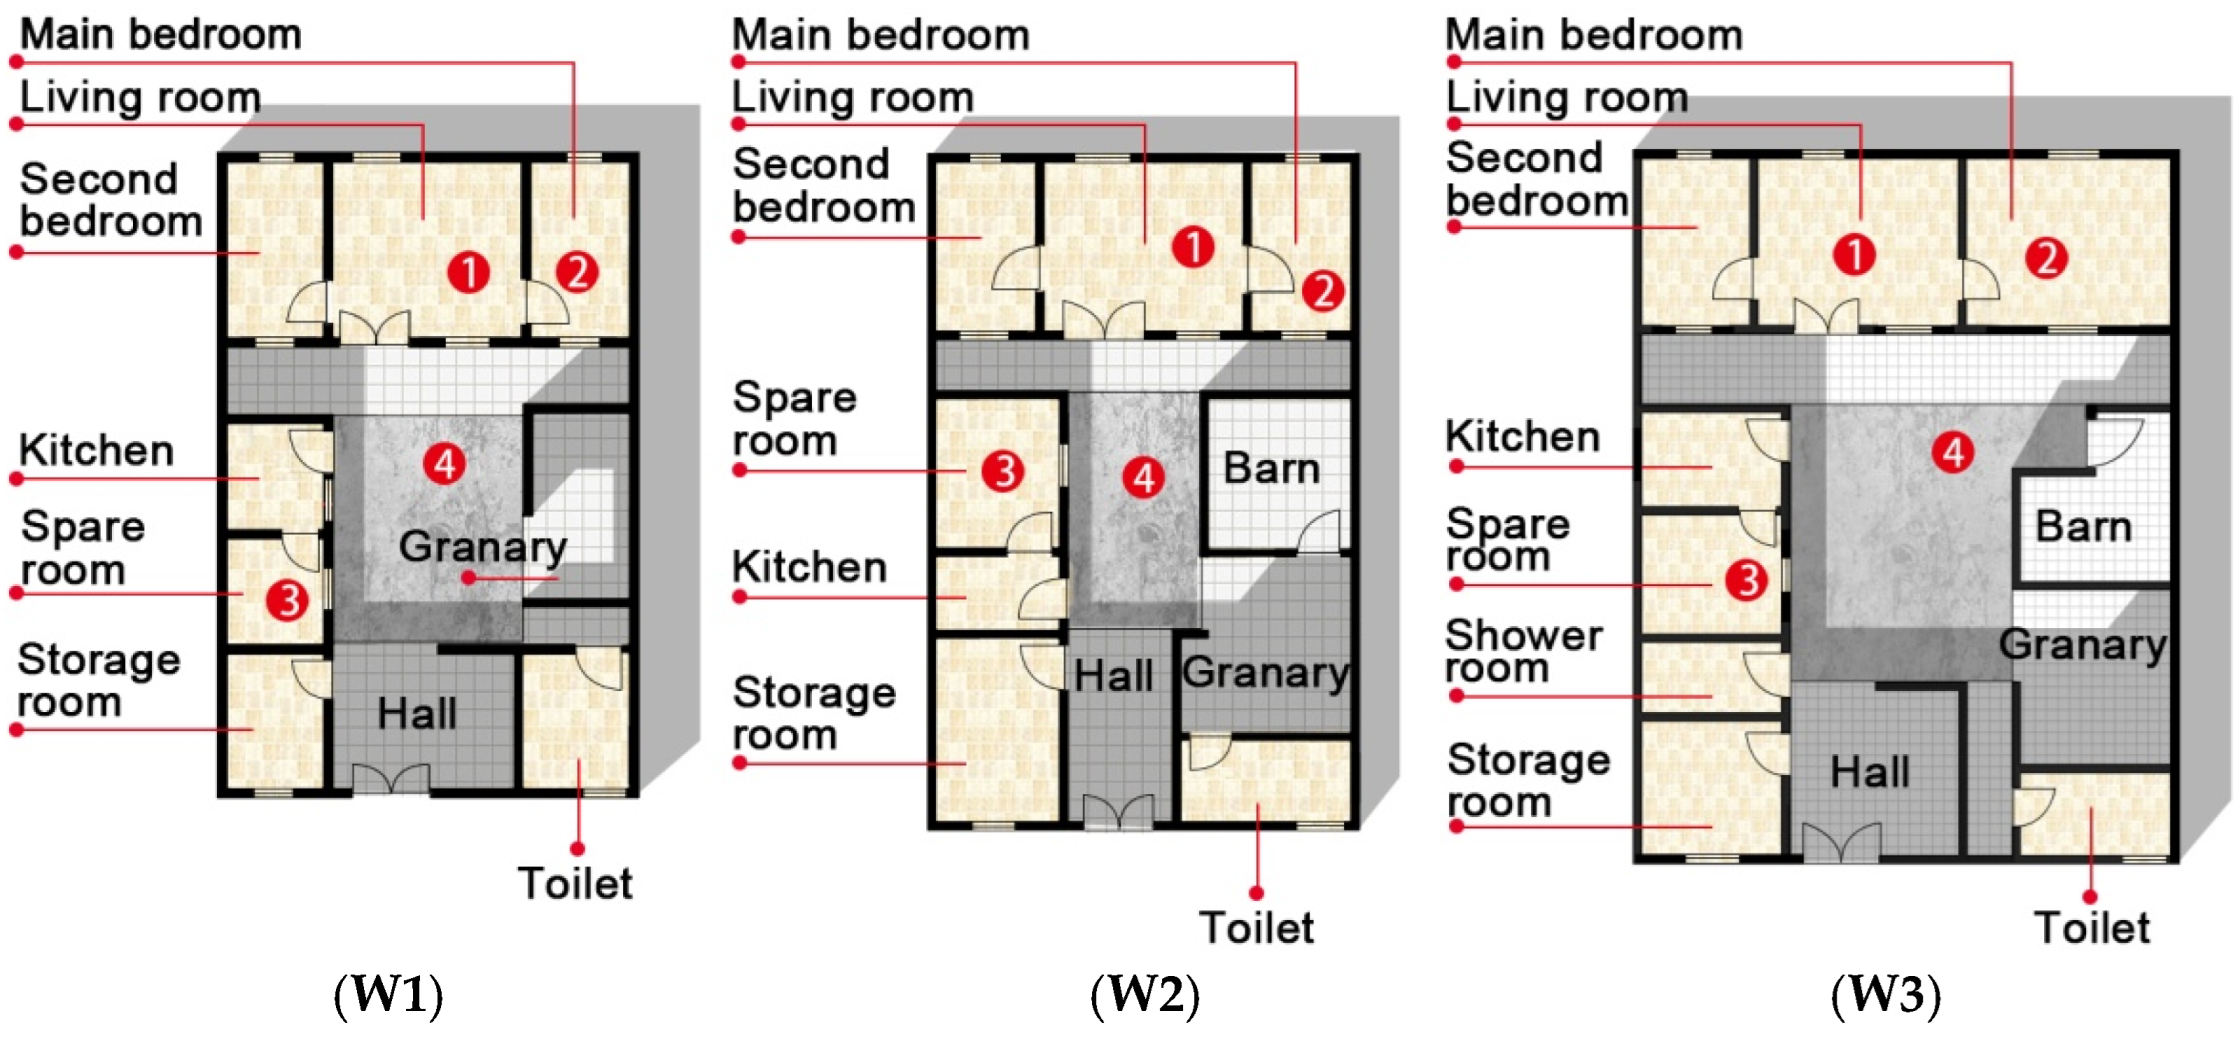
Figure 6 and
Figure 7 show the spatial layout in a typical vernacular dwelling in Linyi. The entrance is usually located in the south section of the courtyard, and there is a semi-outdoor entrance hall. The living room is in the middle of the north side section, and there are usually two bedrooms on each side, the main bedroom on the east side and the second bedroom on the west side. The kitchen, spare room, shower room (in some houses there is no separate shower room), and storage room are usually located in the west section of the courtyard. In the east section of the courtyard, there is a barn, granary, and toilet. In our research areas, just a few families do not have the east and west rooms in the courtyard due to small family size and economic reasons; the vernacular dwellings are usually designed as 3-section courtyard or 2-section courtyard.
4.1.2. Analysis of Heating and Cooling Methods
In this study, the main heating and cooling methods for vernacular dwellings in Linyi were researched through investigation (
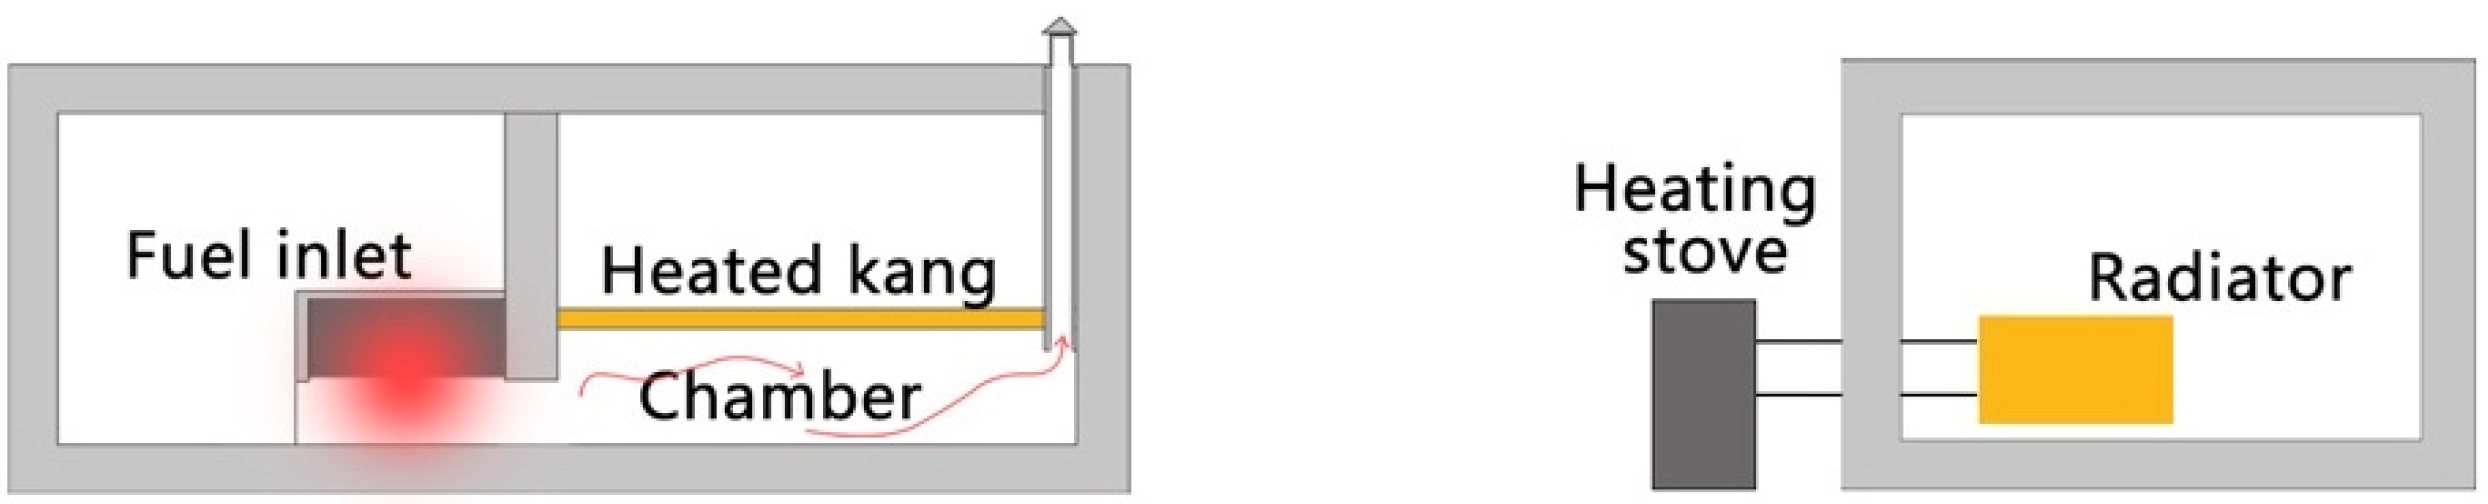
Figure 8). Owing to the different functions of each space in the dwellings, the cooling and heating equipment are generally distributed in different rooms. Cooling equipment is usually installed only in the living room, and heating equipment is installed only in the spare room, which can greatly reduce energy consumption. In summer, fans are used as major cooling equipment, and an air conditioner is rarely used. In winter, a heated kang, radiator, and air conditioner are used as the main heating equipment. Since both use coal as the main fuel, the heated kang and radiator are often used at the same time in the traditional dwellings. The heated kang is often connected to the kitchen and heated by the exhaust pipe of the cooking bench, and the radiator is heated by the stove (
Figure 9 and
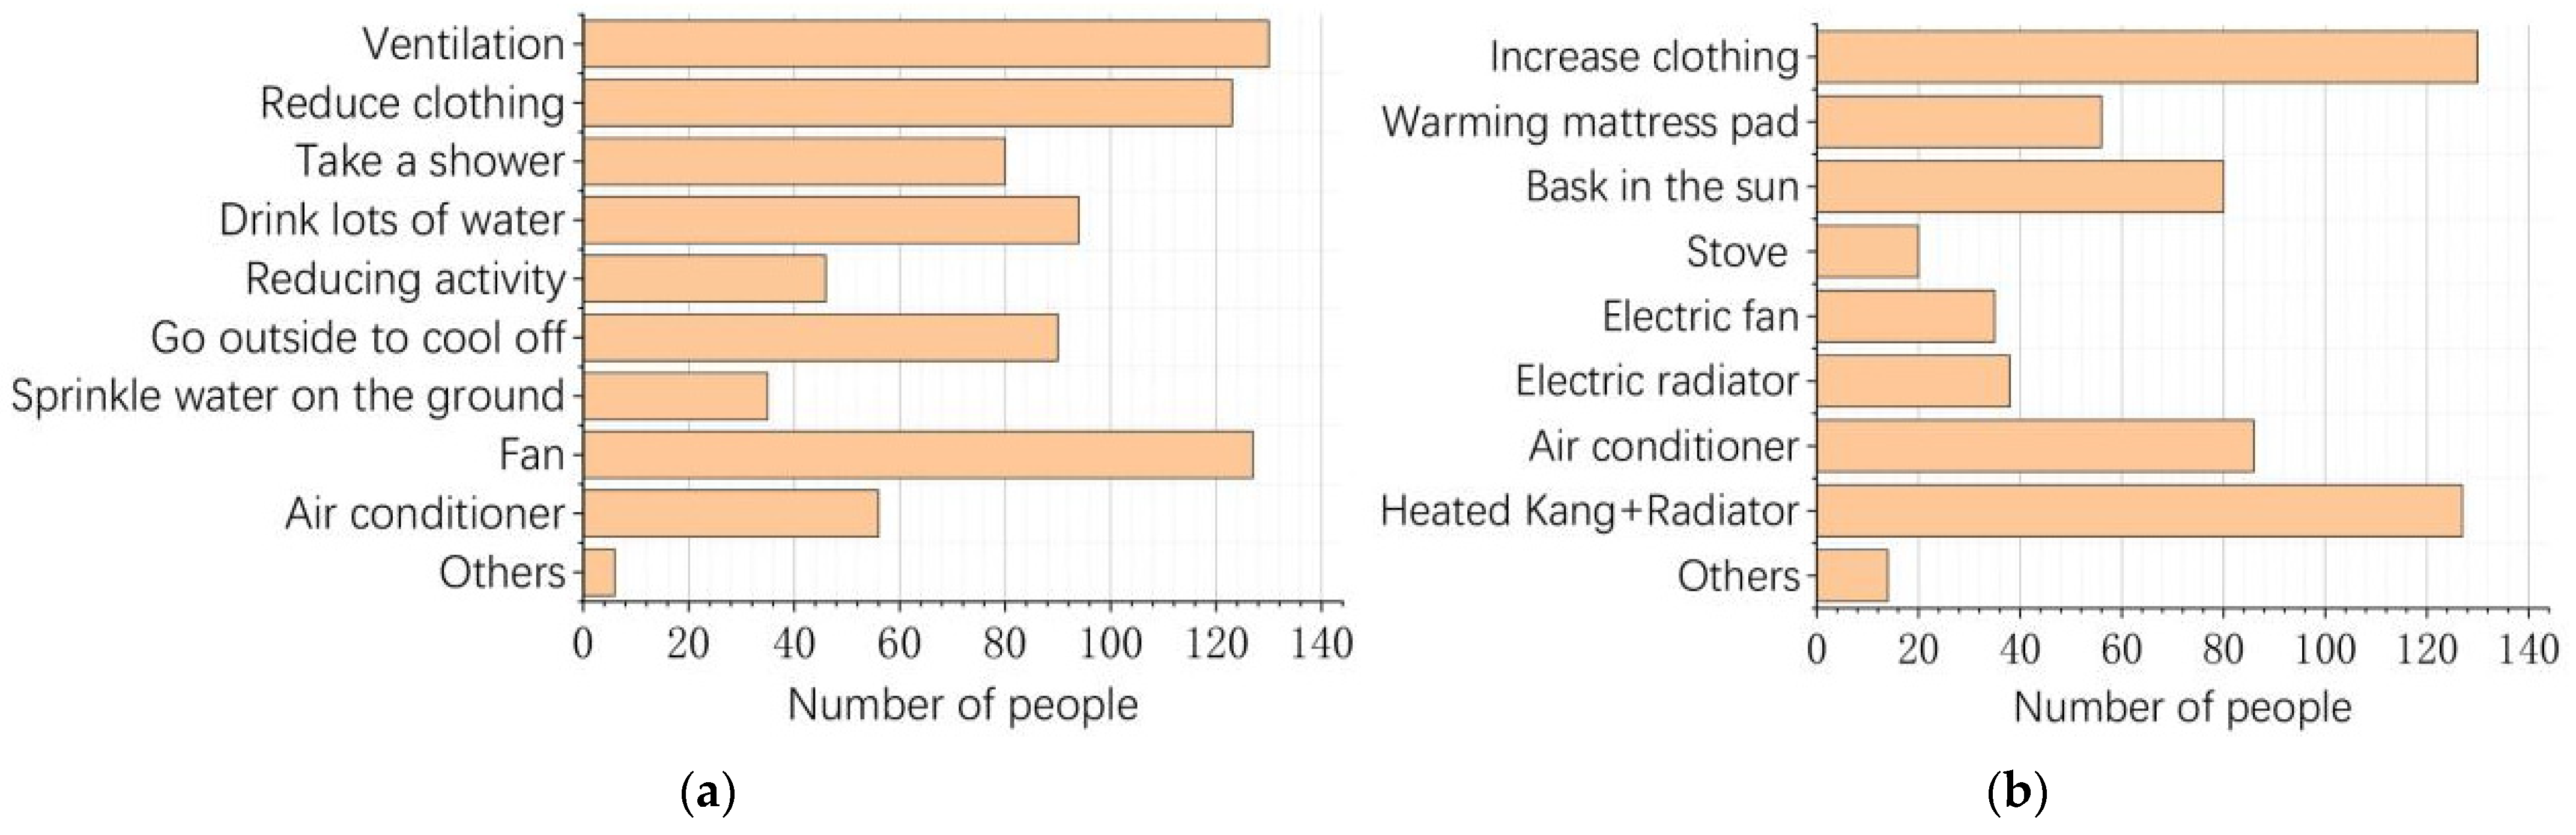
Figure 10). In addition, residents regulate their thermal comfort through autonomous behaviors, such as drinking water, reducing clothing, sprinkling water on the ground, and cooling off outside in summer, and by increasing clothing and sunbathing in winter.
4.1.3. Analysis of Space Usage Habits and Frequency
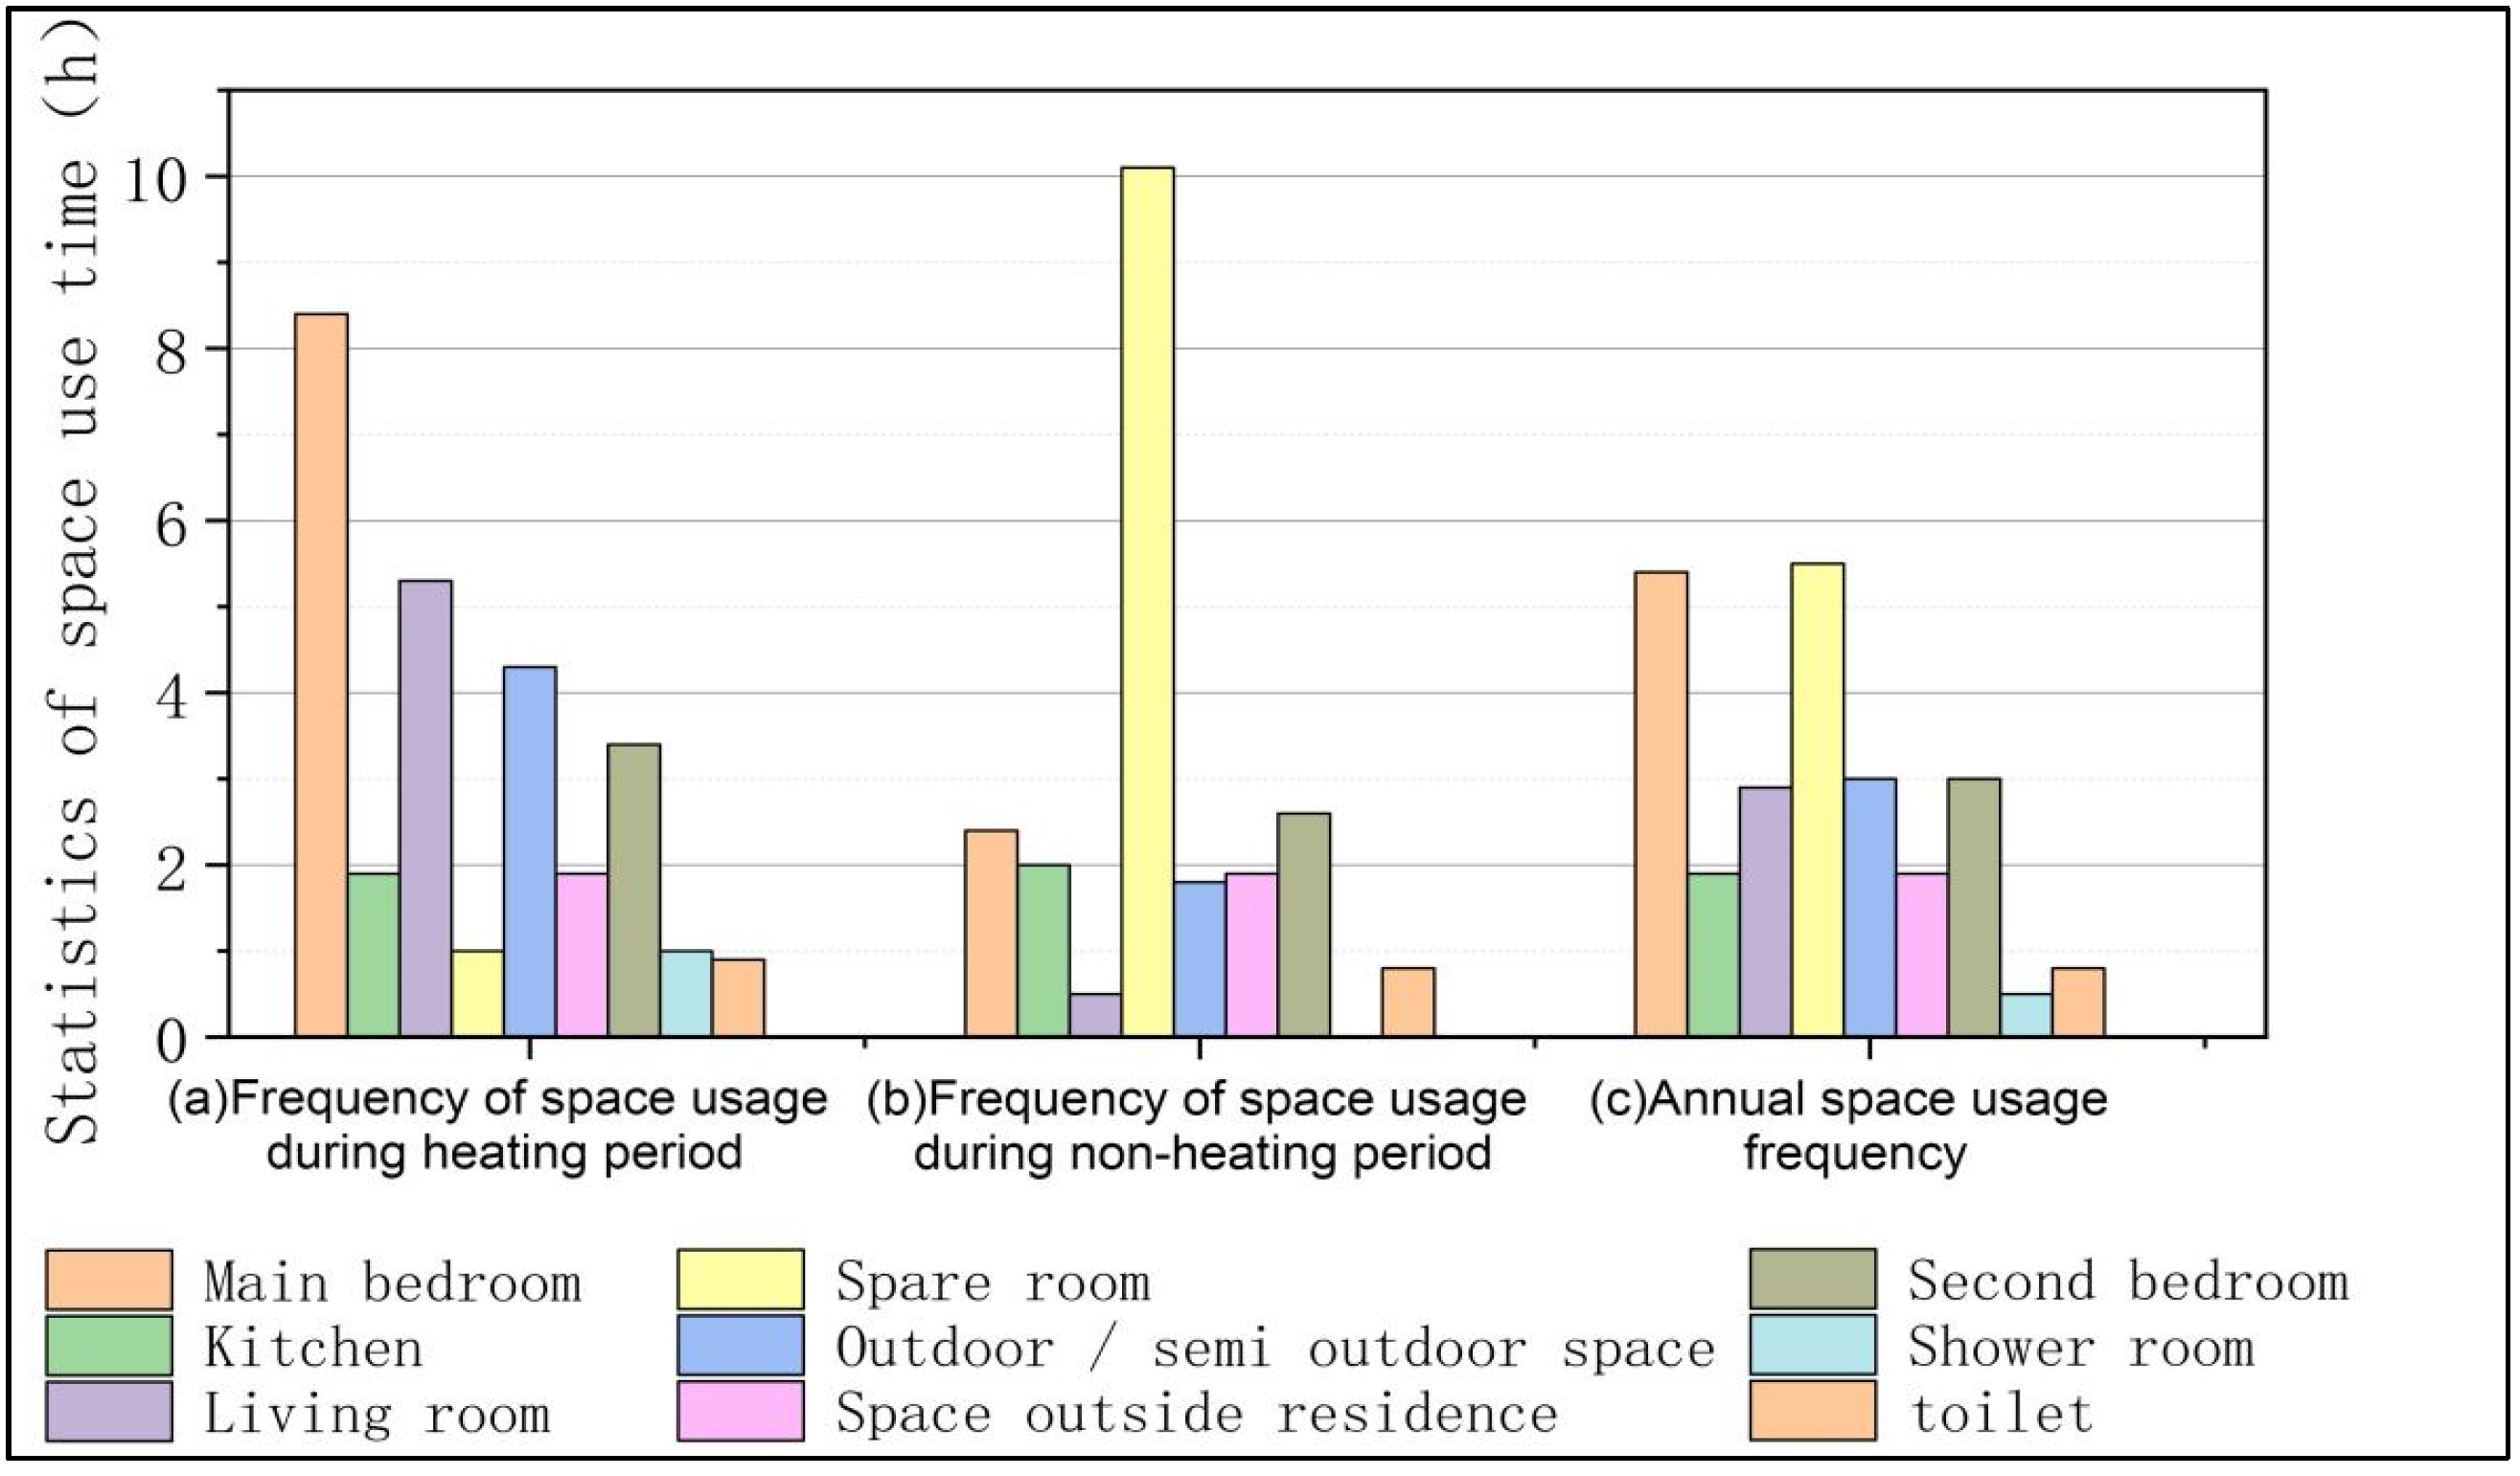
According to the interviews with local construction artisans and villagers, the current layout patterns in vernacular dwellings are mainly influenced by traditional architectural culture. In traditional Chinese architectural culture, the east is superior and the west is inferior, so the bedroom on the east side of the north section in the courtyard is designed as the main bedroom, with better lighting and a larger area, and is usually used by the elders. On the western side is the second bedroom, which is used by the younger generation, with poorer lighting and a smaller area. Each section of vernacular dwellings is scattered around the courtyard and interconnected by the courtyard. Based on this scattered layout, residents gradually form two alternating space usage patterns in heating and non-heating periods. The local heating period is from November to April, and the non-heating period is from May to October. This study analyzes the space usage frequency of different rooms throughout the year, and the results are shown in (
Figure 11).
From a year-round perspective, the most frequently used rooms are the main bedroom and spare room, accounting for 22.5% and 23% of the total usage time throughout the year, followed by the living room and second bedroom, with 12.1% and 12.5%, respectively. Except for the second bedroom, kitchen, shower room and toilet, the use frequency of the other spaces varies greatly with the seasons, including the living room, spare room, and main bedroom. During the non-heating period, residents’ sleeping space and public activity space are separated, which are the main bedroom/second bedroom and living room, respectively. During the heating period, the space usage changes, and the sleeping space and the public activity space overlap. The spare room becomes the main resting space and public activity space. Because the main bedroom has no heating equipment, the elders, who are more sensitive to cold, usually move to the spare room with a heated kang and radiator, where the heating condition is relatively good, and then the main bedroom is left vacant. This is mainly due to the lack of thermal insulation in the envelope during the design and construction, which leads to a poor thermal environment. Considering the family’s economic situation, in order to save the cost of heating, residents usually choose to live in small spare rooms with relatively poor sunlight at the cost of reducing living quality and sacrificing the main building-use space, so as to obtain relatively acceptable indoor space and thermal comfort environment.
Except for the relatively mild weather in spring and autumn, the outdoor courtyard space is not used frequently due to the lack of shade in summer and the cold outdoor environment in winter. As a semi-outdoor space, the hall is not reasonably designed; it is usually hot in summer because of poor air circulation and extremely cold in winter because of sunlight shortage, and it is now mostly unused or stacked with miscellaneous items. In addition, it is also found that the semi-outdoor space for production function in vernacular dwellings occupies too large an area and most of it is vacant. Therefore, the area for production space should be reduced appropriately, thus providing better lighting conditions for the main-use rooms in the north section.
4.2. Measurement Analysis of the Thermal Environment in Vernacular Dwellings
When conducting data measurement, the instruments were arranged in the main-use spaces, including the living room, bedroom, and spare room, and the outdoor instruments were arranged in the courtyard (
Figure 12 and
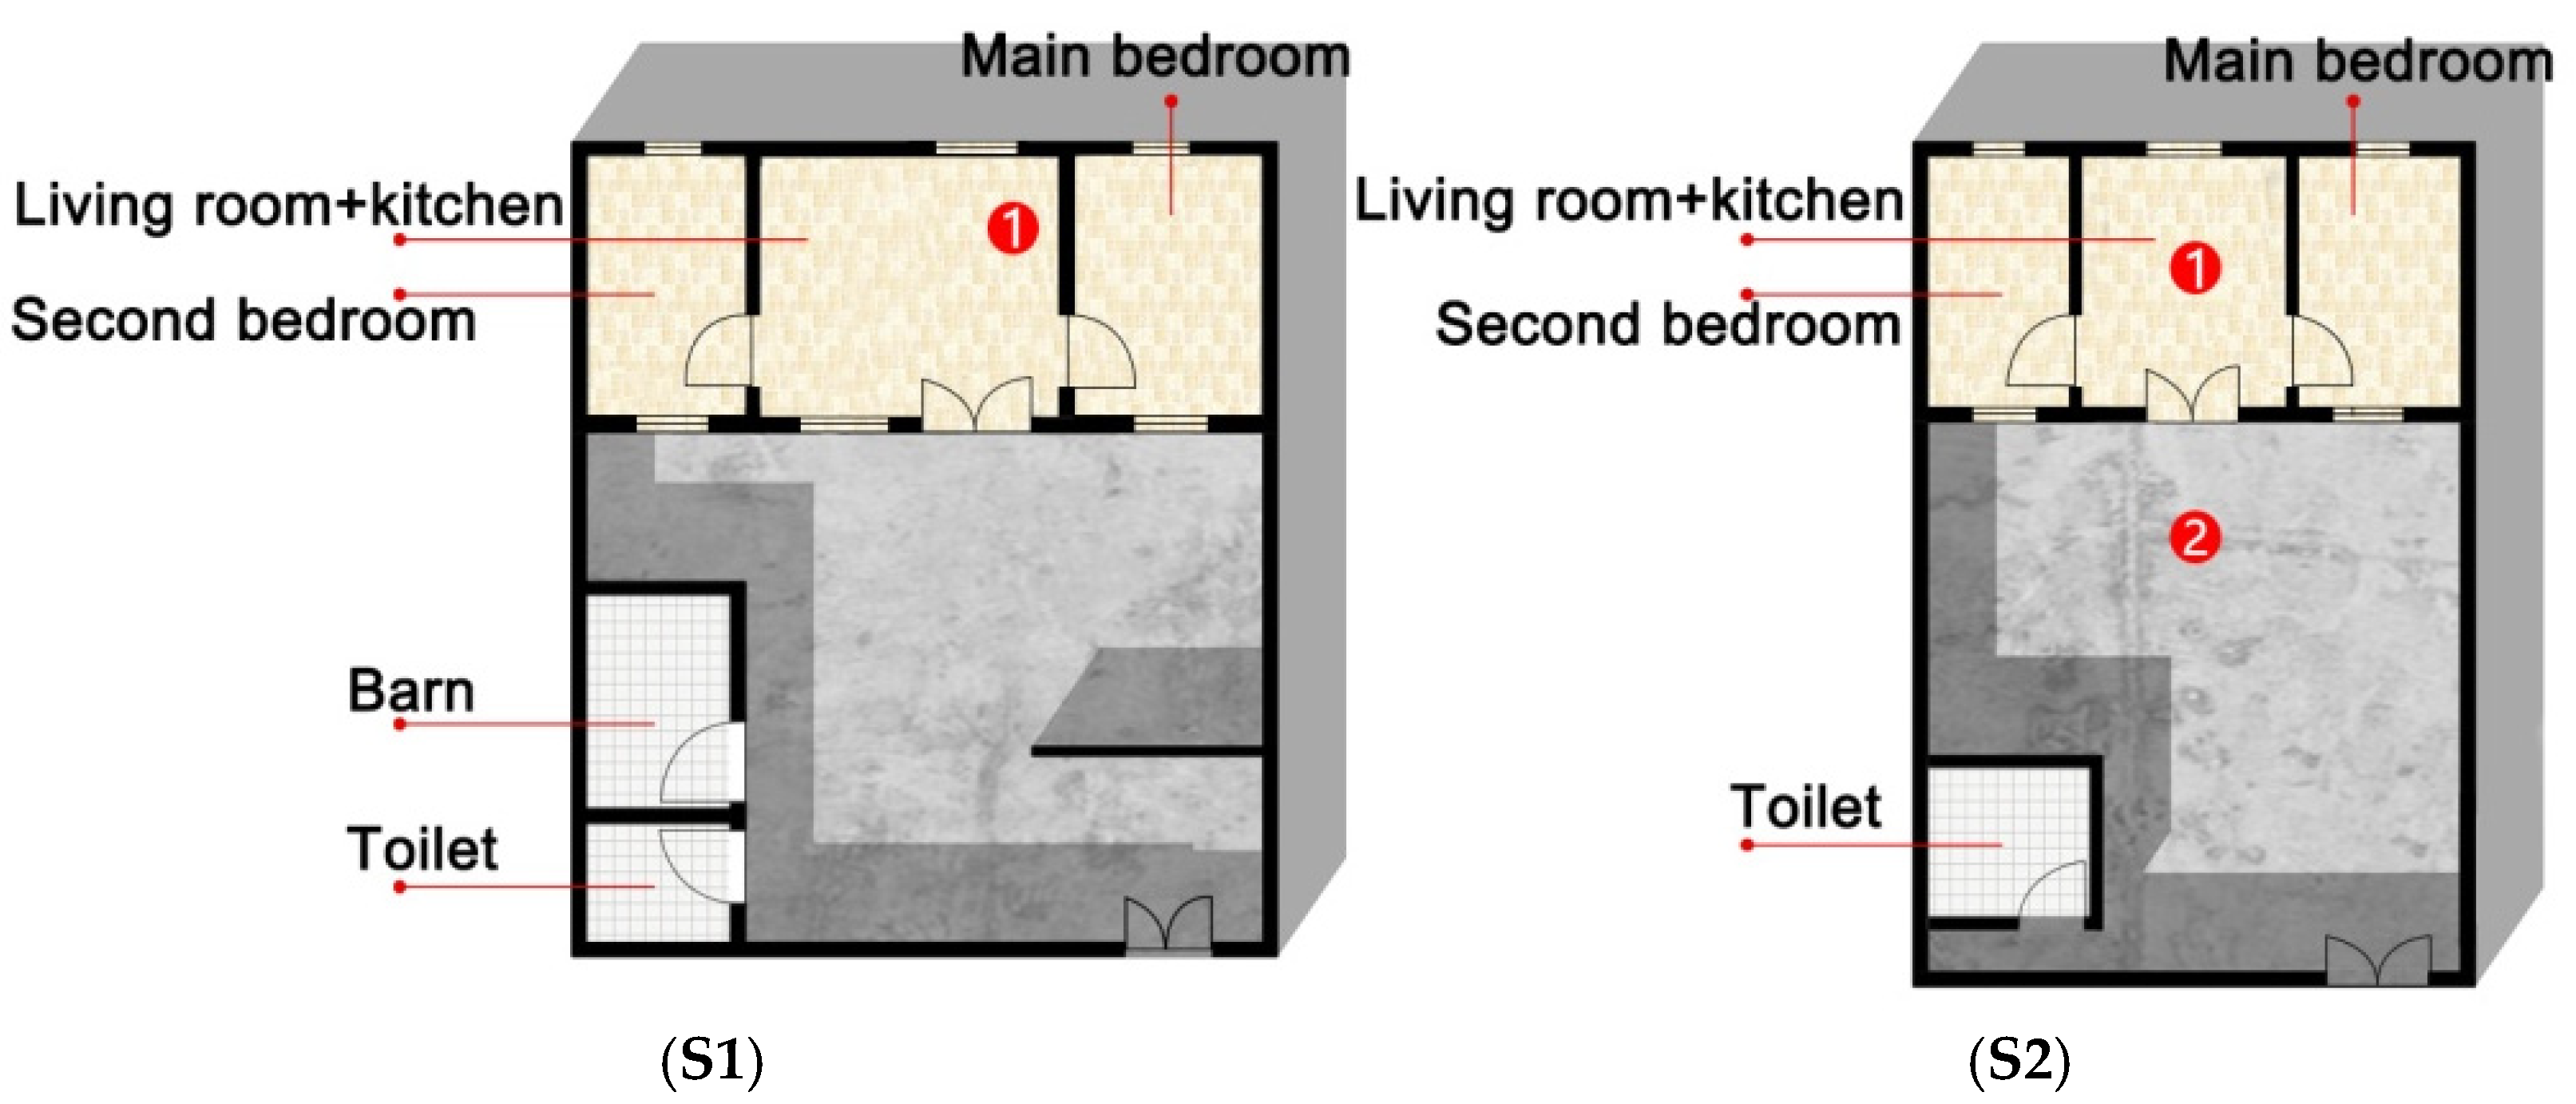
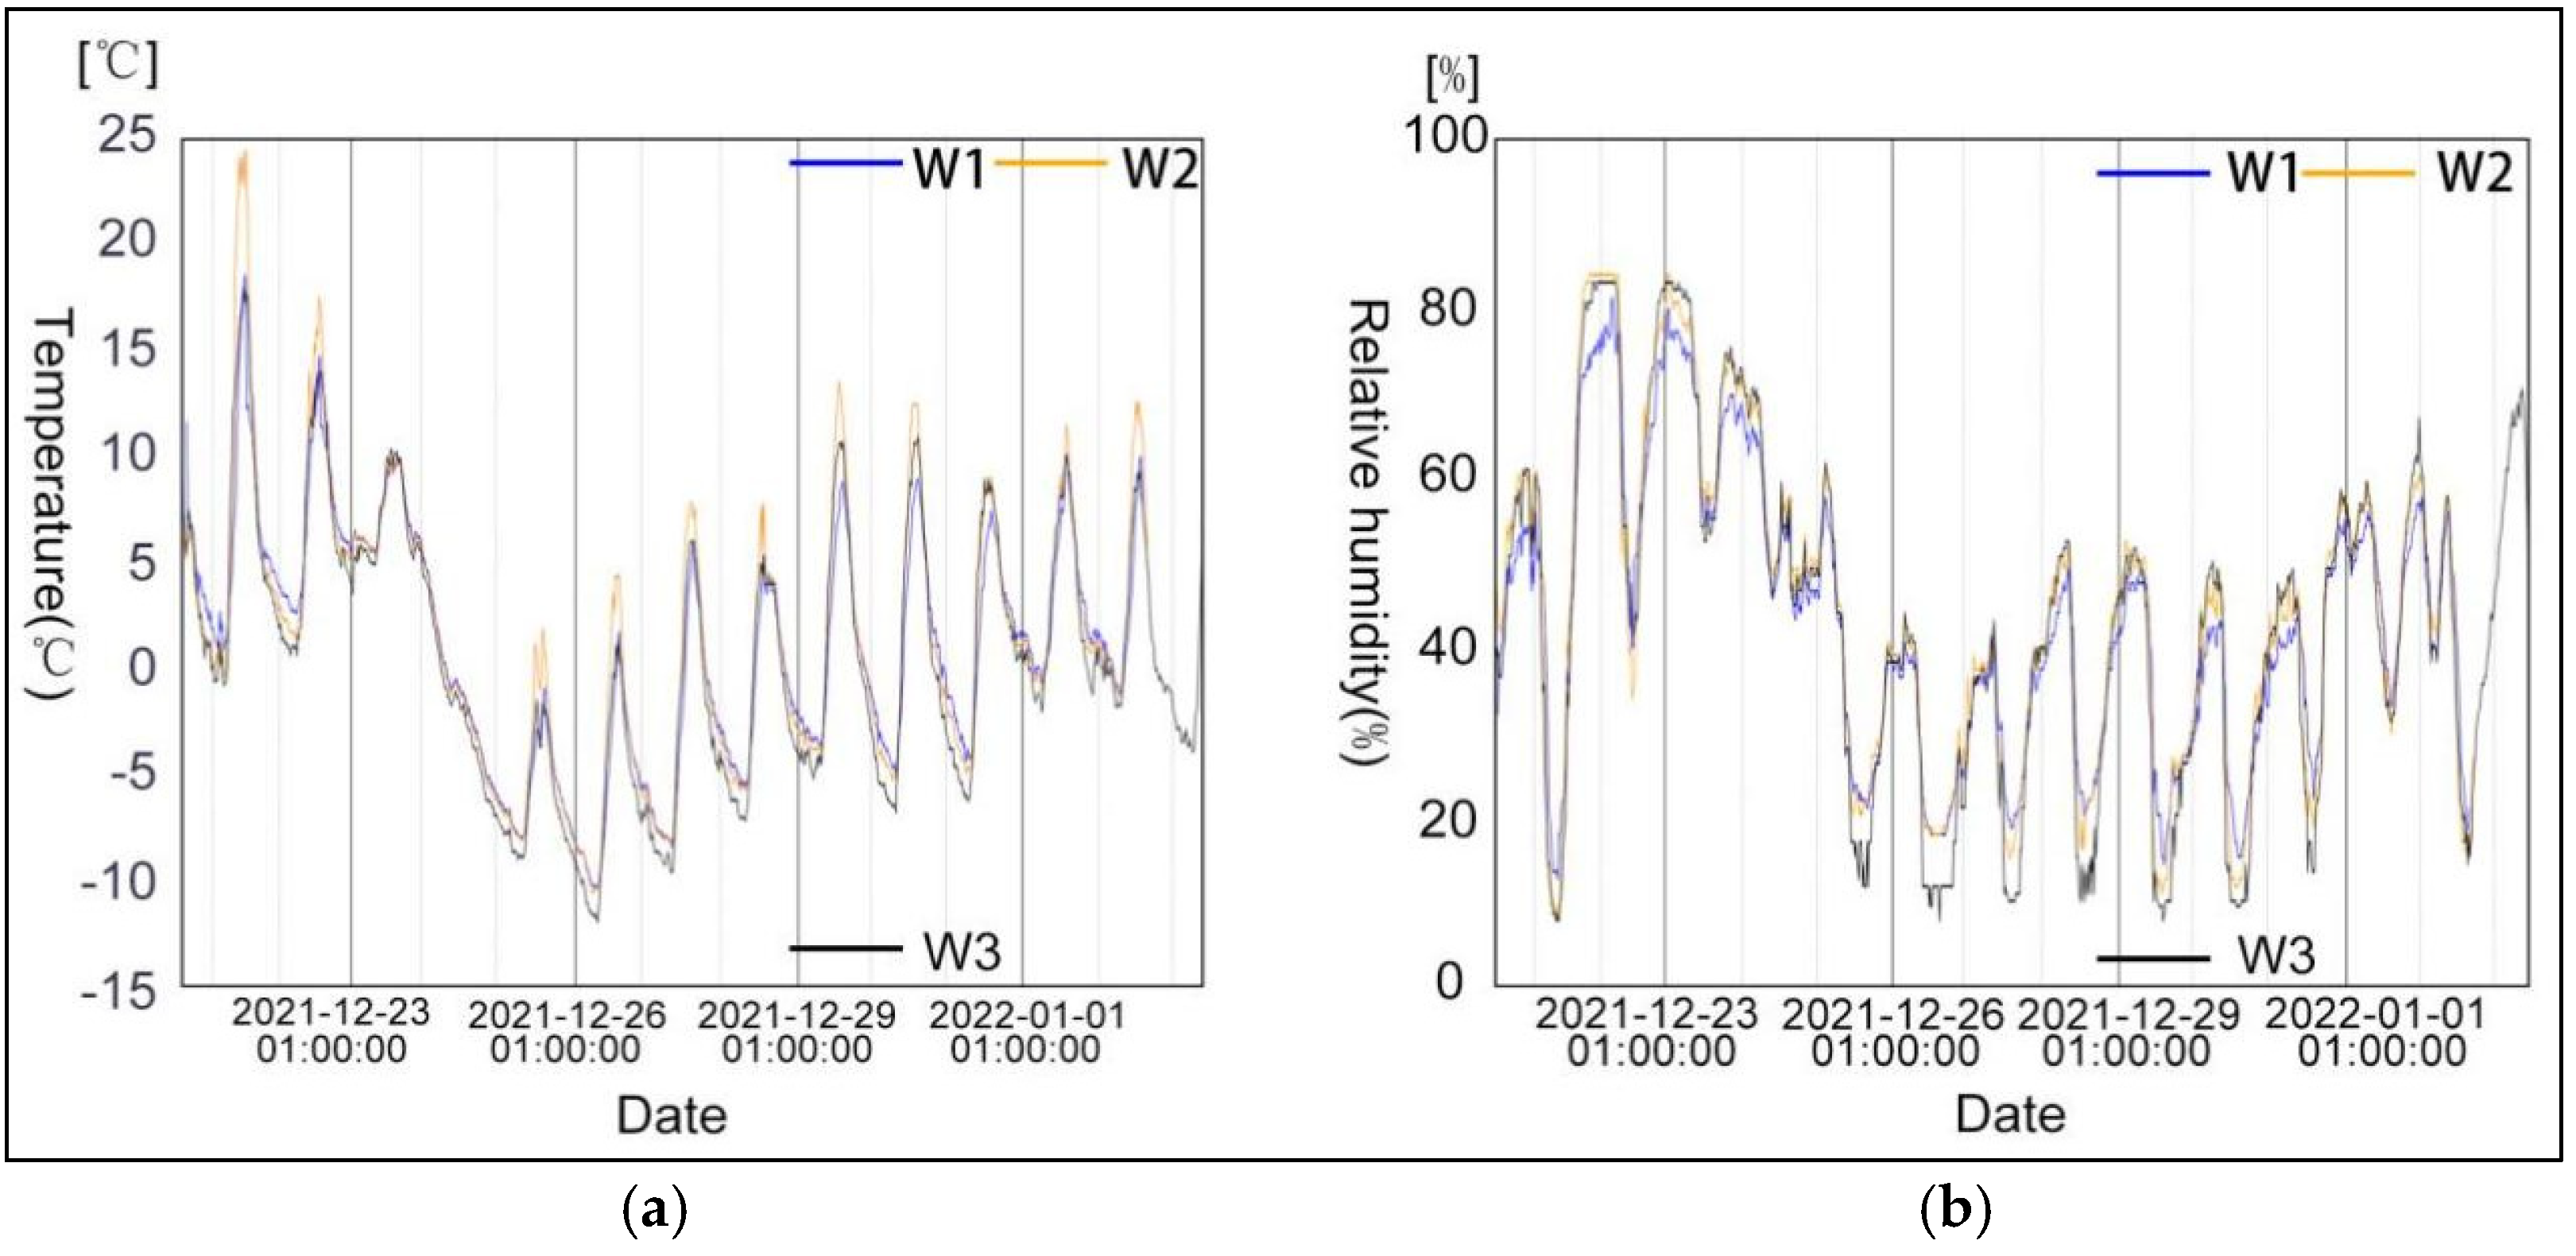
Figure 13). The dwellings selected in summer are two typical dwellings, square type (S1) and rectangular type (S2), and both have ceiling fans as cooling equipment in the living room. Among the three typical dwellings selected in winter, W1 and W2 are rectangular types, and W3 is a square type. W1 is unoccupied as a comparison object of the indoor thermal environment without human influence, so there is no heating equipment. W2 and W3 are equipped with heating equipment only in the spare room according to the local reality, and the other rooms are not heated. The spare room in W2 is heated by an air conditioner and in W3 the spare room is heated by a combination of traditional heating methods: kang and radiator.
4.2.1. Analysis of Outdoor Thermal Environment Measurement
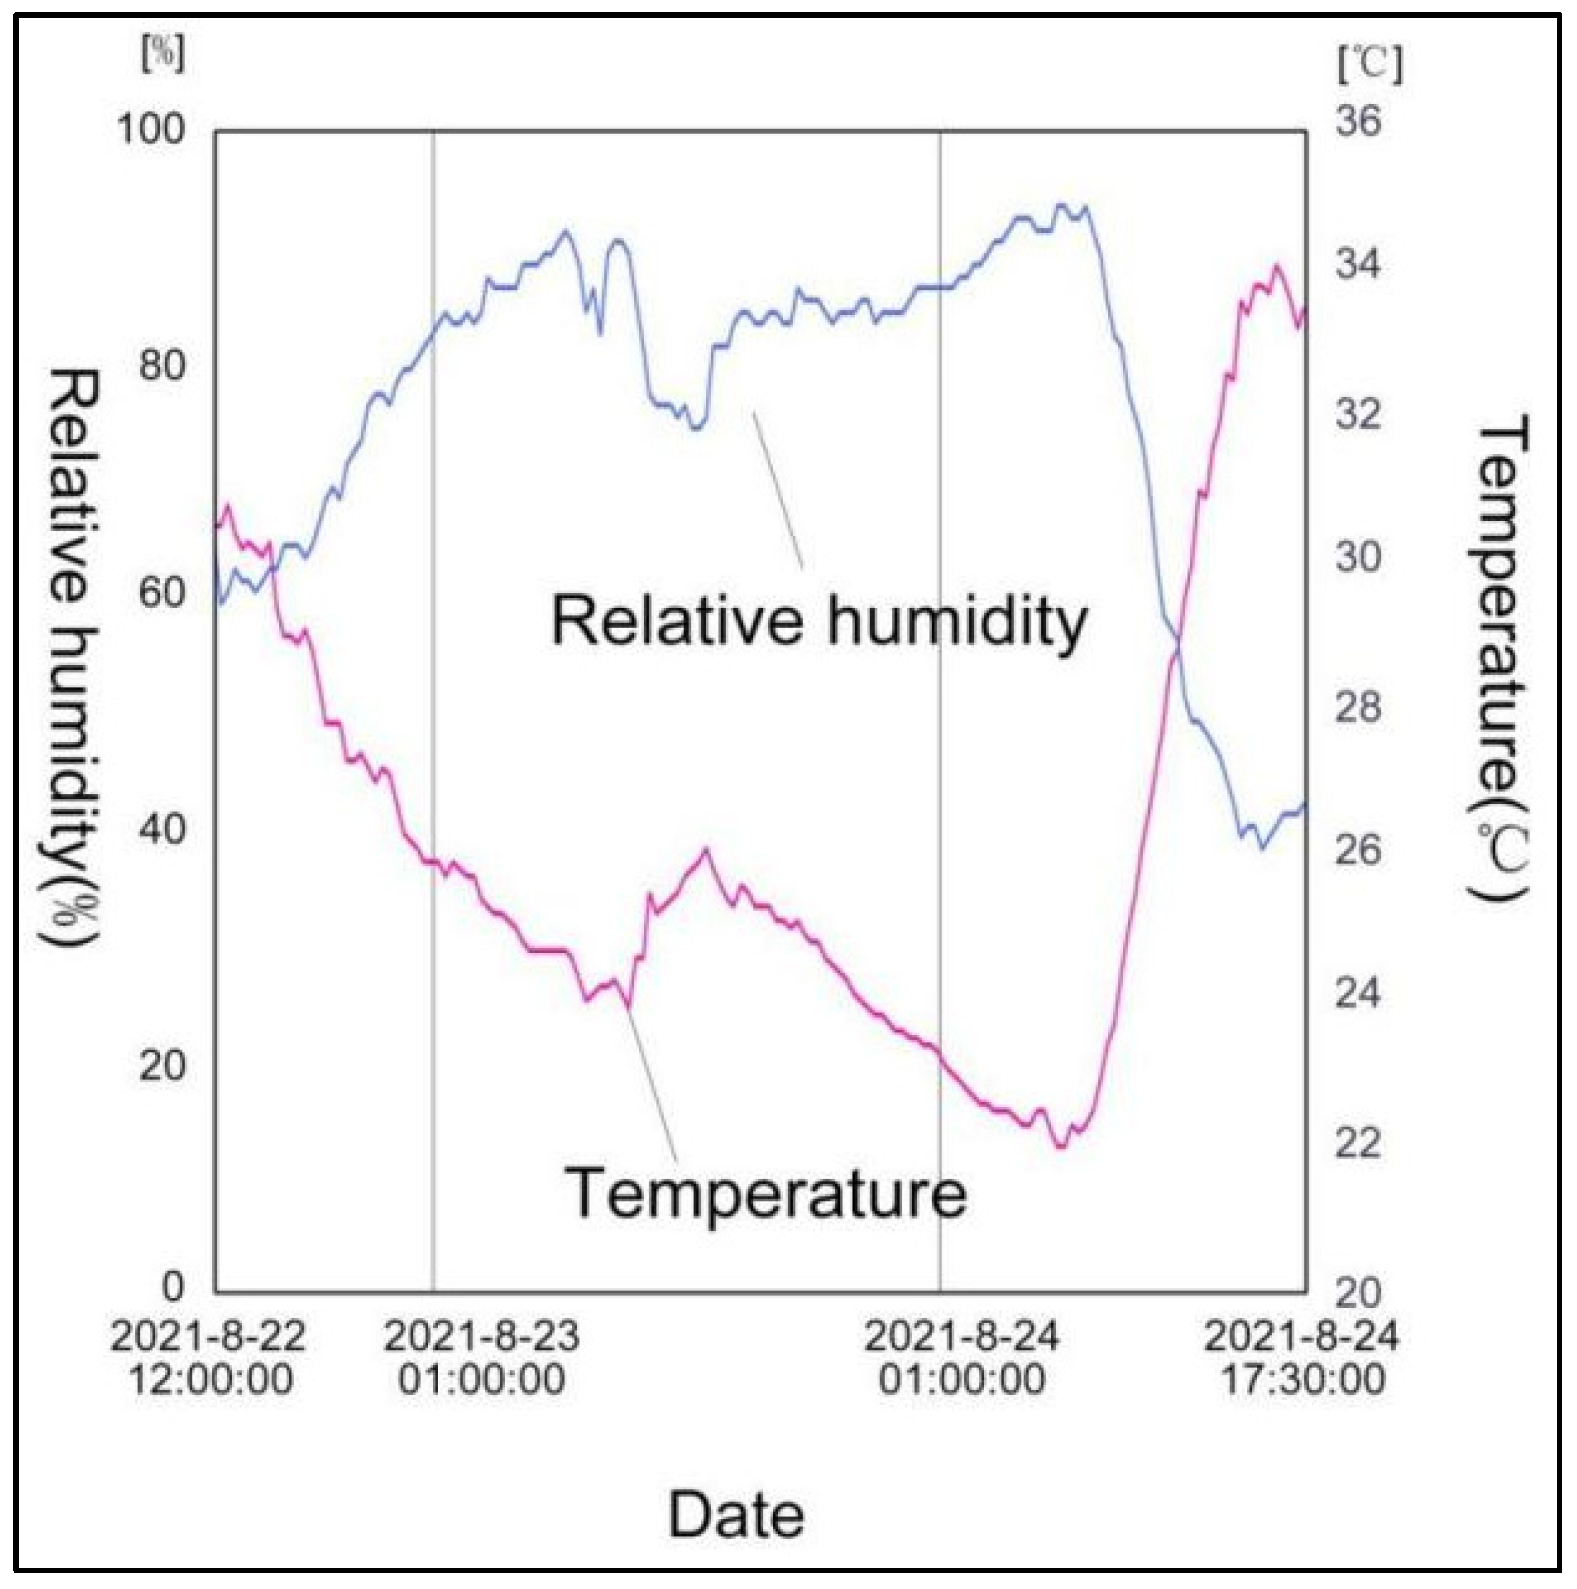
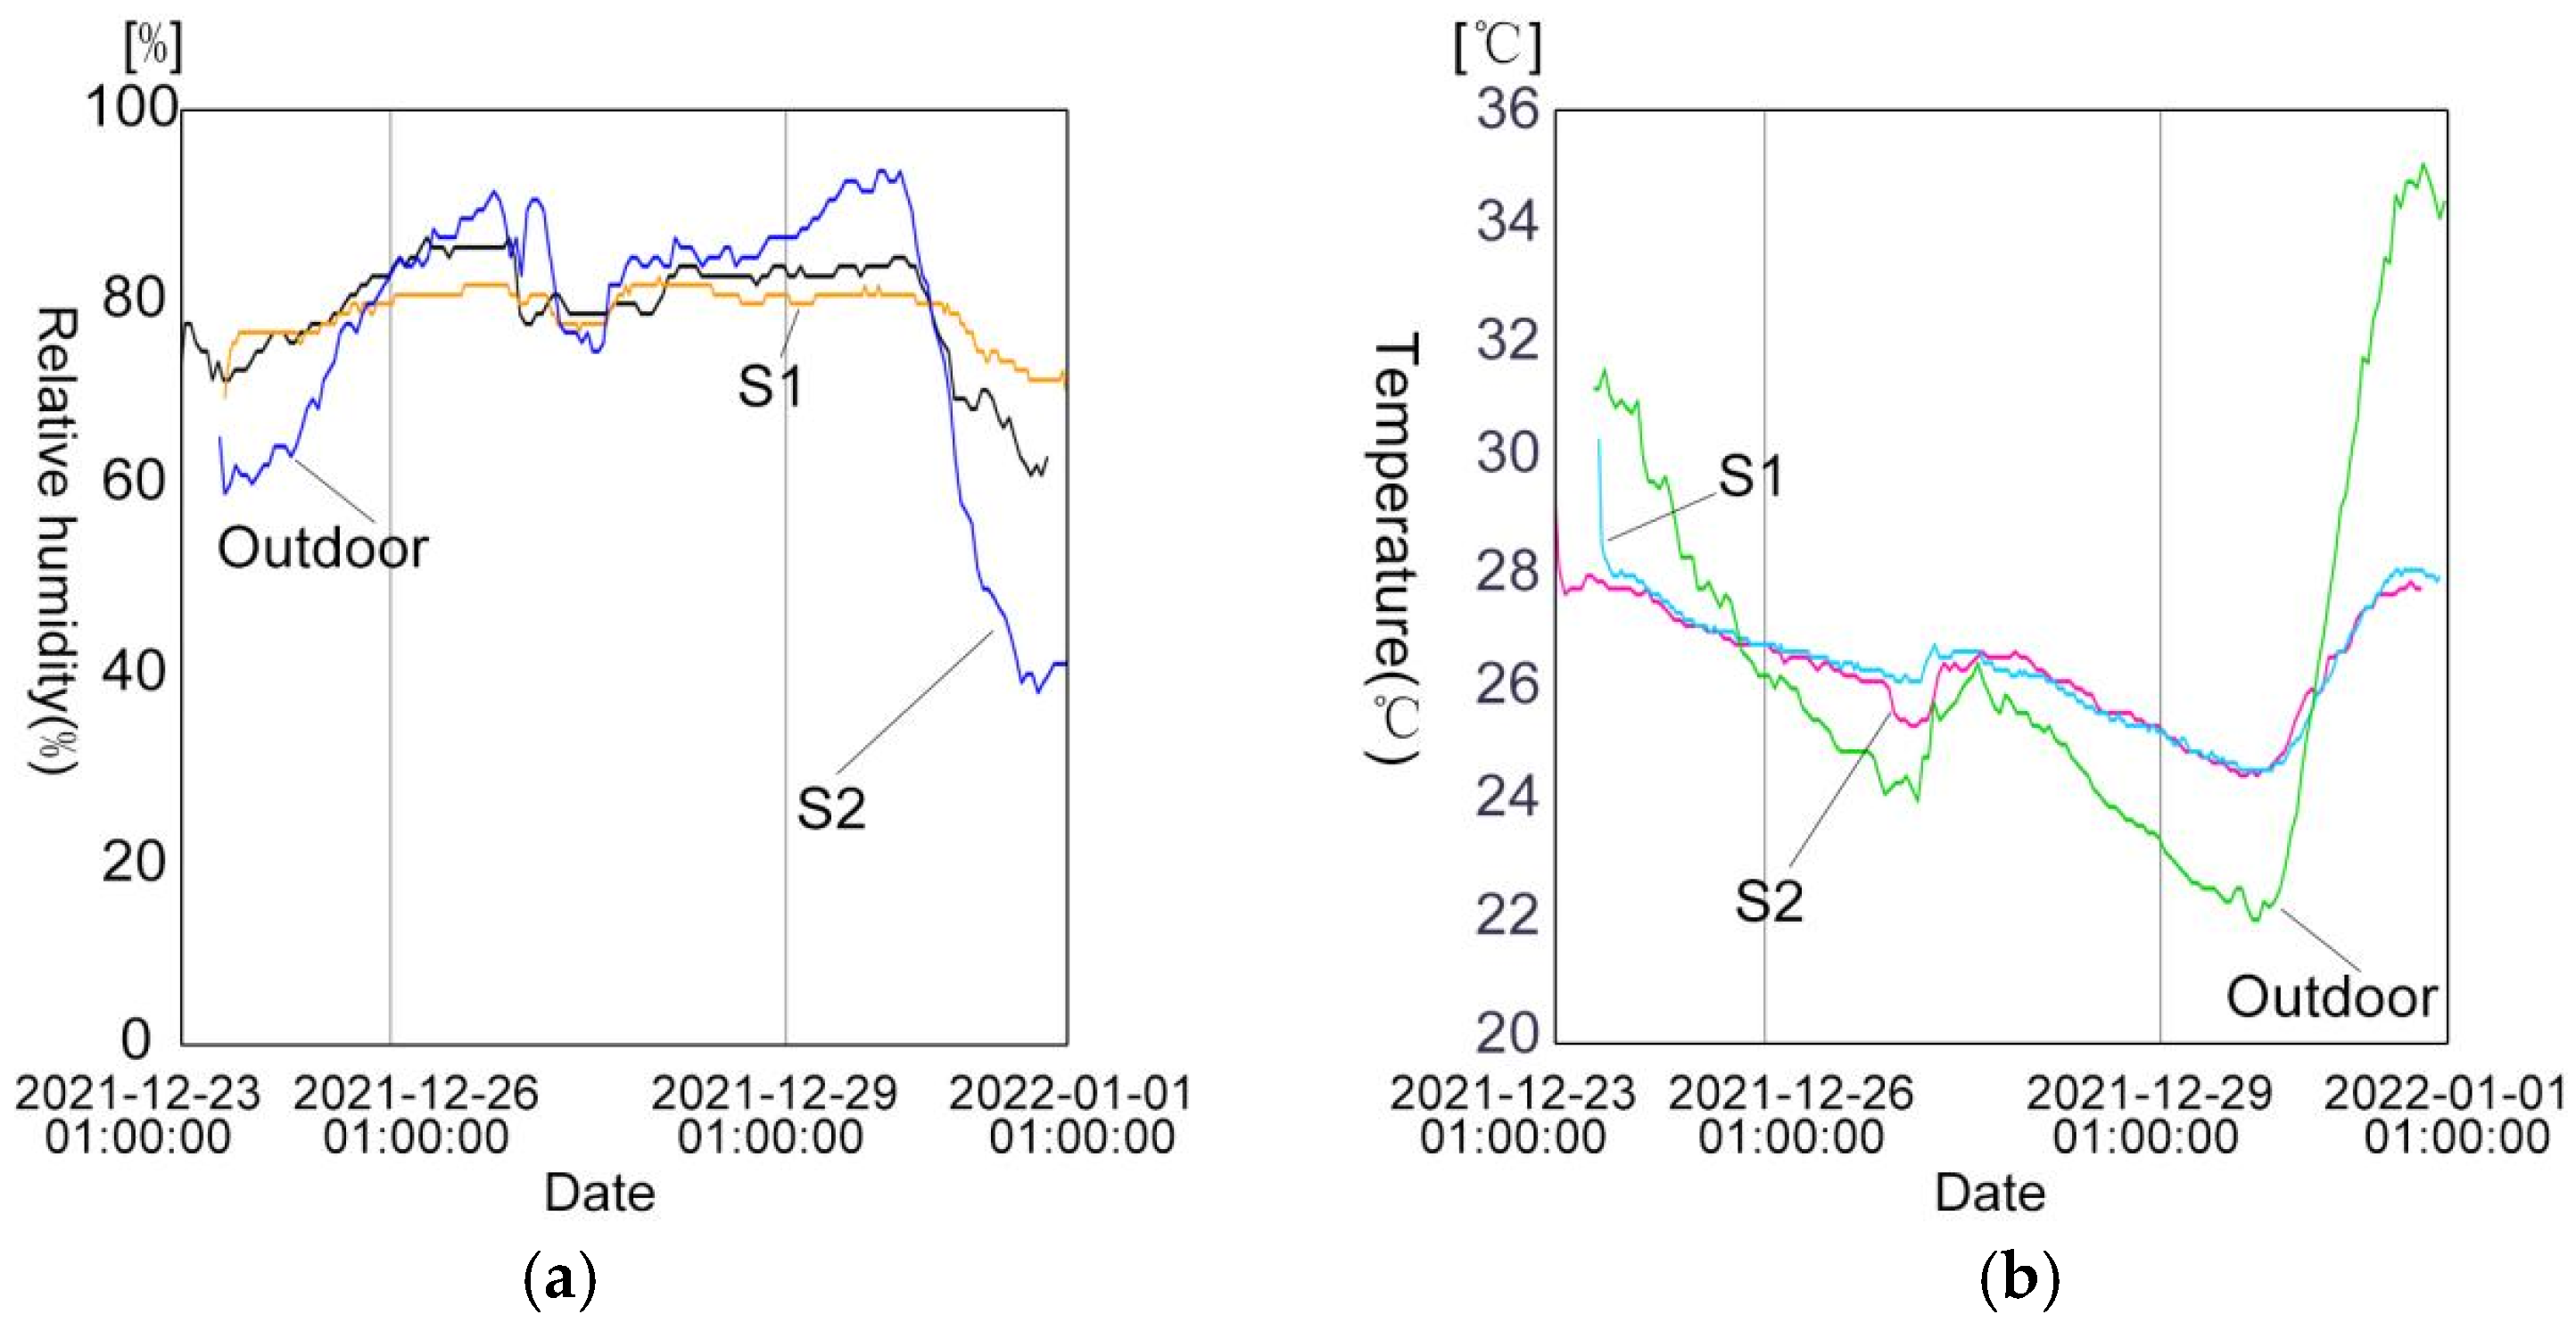
The outdoor environment parameters in summer are shown in
Figure 14. During the investigation, the average outdoor temperature was 26.2 °C, the minimum temperature was 22 °C, the maximum temperature was 34.1 °C, the average outdoor RH was 76%, the maximum RH was 93%, and the minimum RH was 38%. It can be seen that the outdoor temperature in Linyi is relatively comfortable and the outdoor RH is relatively high in summer. The outdoor environment parameters in winter are shown in
Figure 15. During the investigation, the average temperature was 1.2 °C, the maximum temperature was 20.3 °C, the minimum temperature was −10.8 °C, the average RH was 52.2%, the maximum RH was 98.7%, and the minimum RH was 12%. It can be seen that the outdoors in Linyi is extremely cold in winter, but the humidity is relatively suitable.
4.2.2. Comparative Analysis of Indoor and Outdoor Temperature Difference
The decentralized layout of vernacular dwellings requires that people need to access the indoors and outdoors and various rooms frequently. Xiong et al. studied the influence of temperature differences on human health [
64]. The results show that the human body is very sensitive to an environment with large temperature fluctuation, which will cause uncomfortable reflection and even affect health [
54]. Therefore, this study analyzed the temperature differences between individual rooms in vernacular dwellings during both summer and winter to assess the impact on human health.
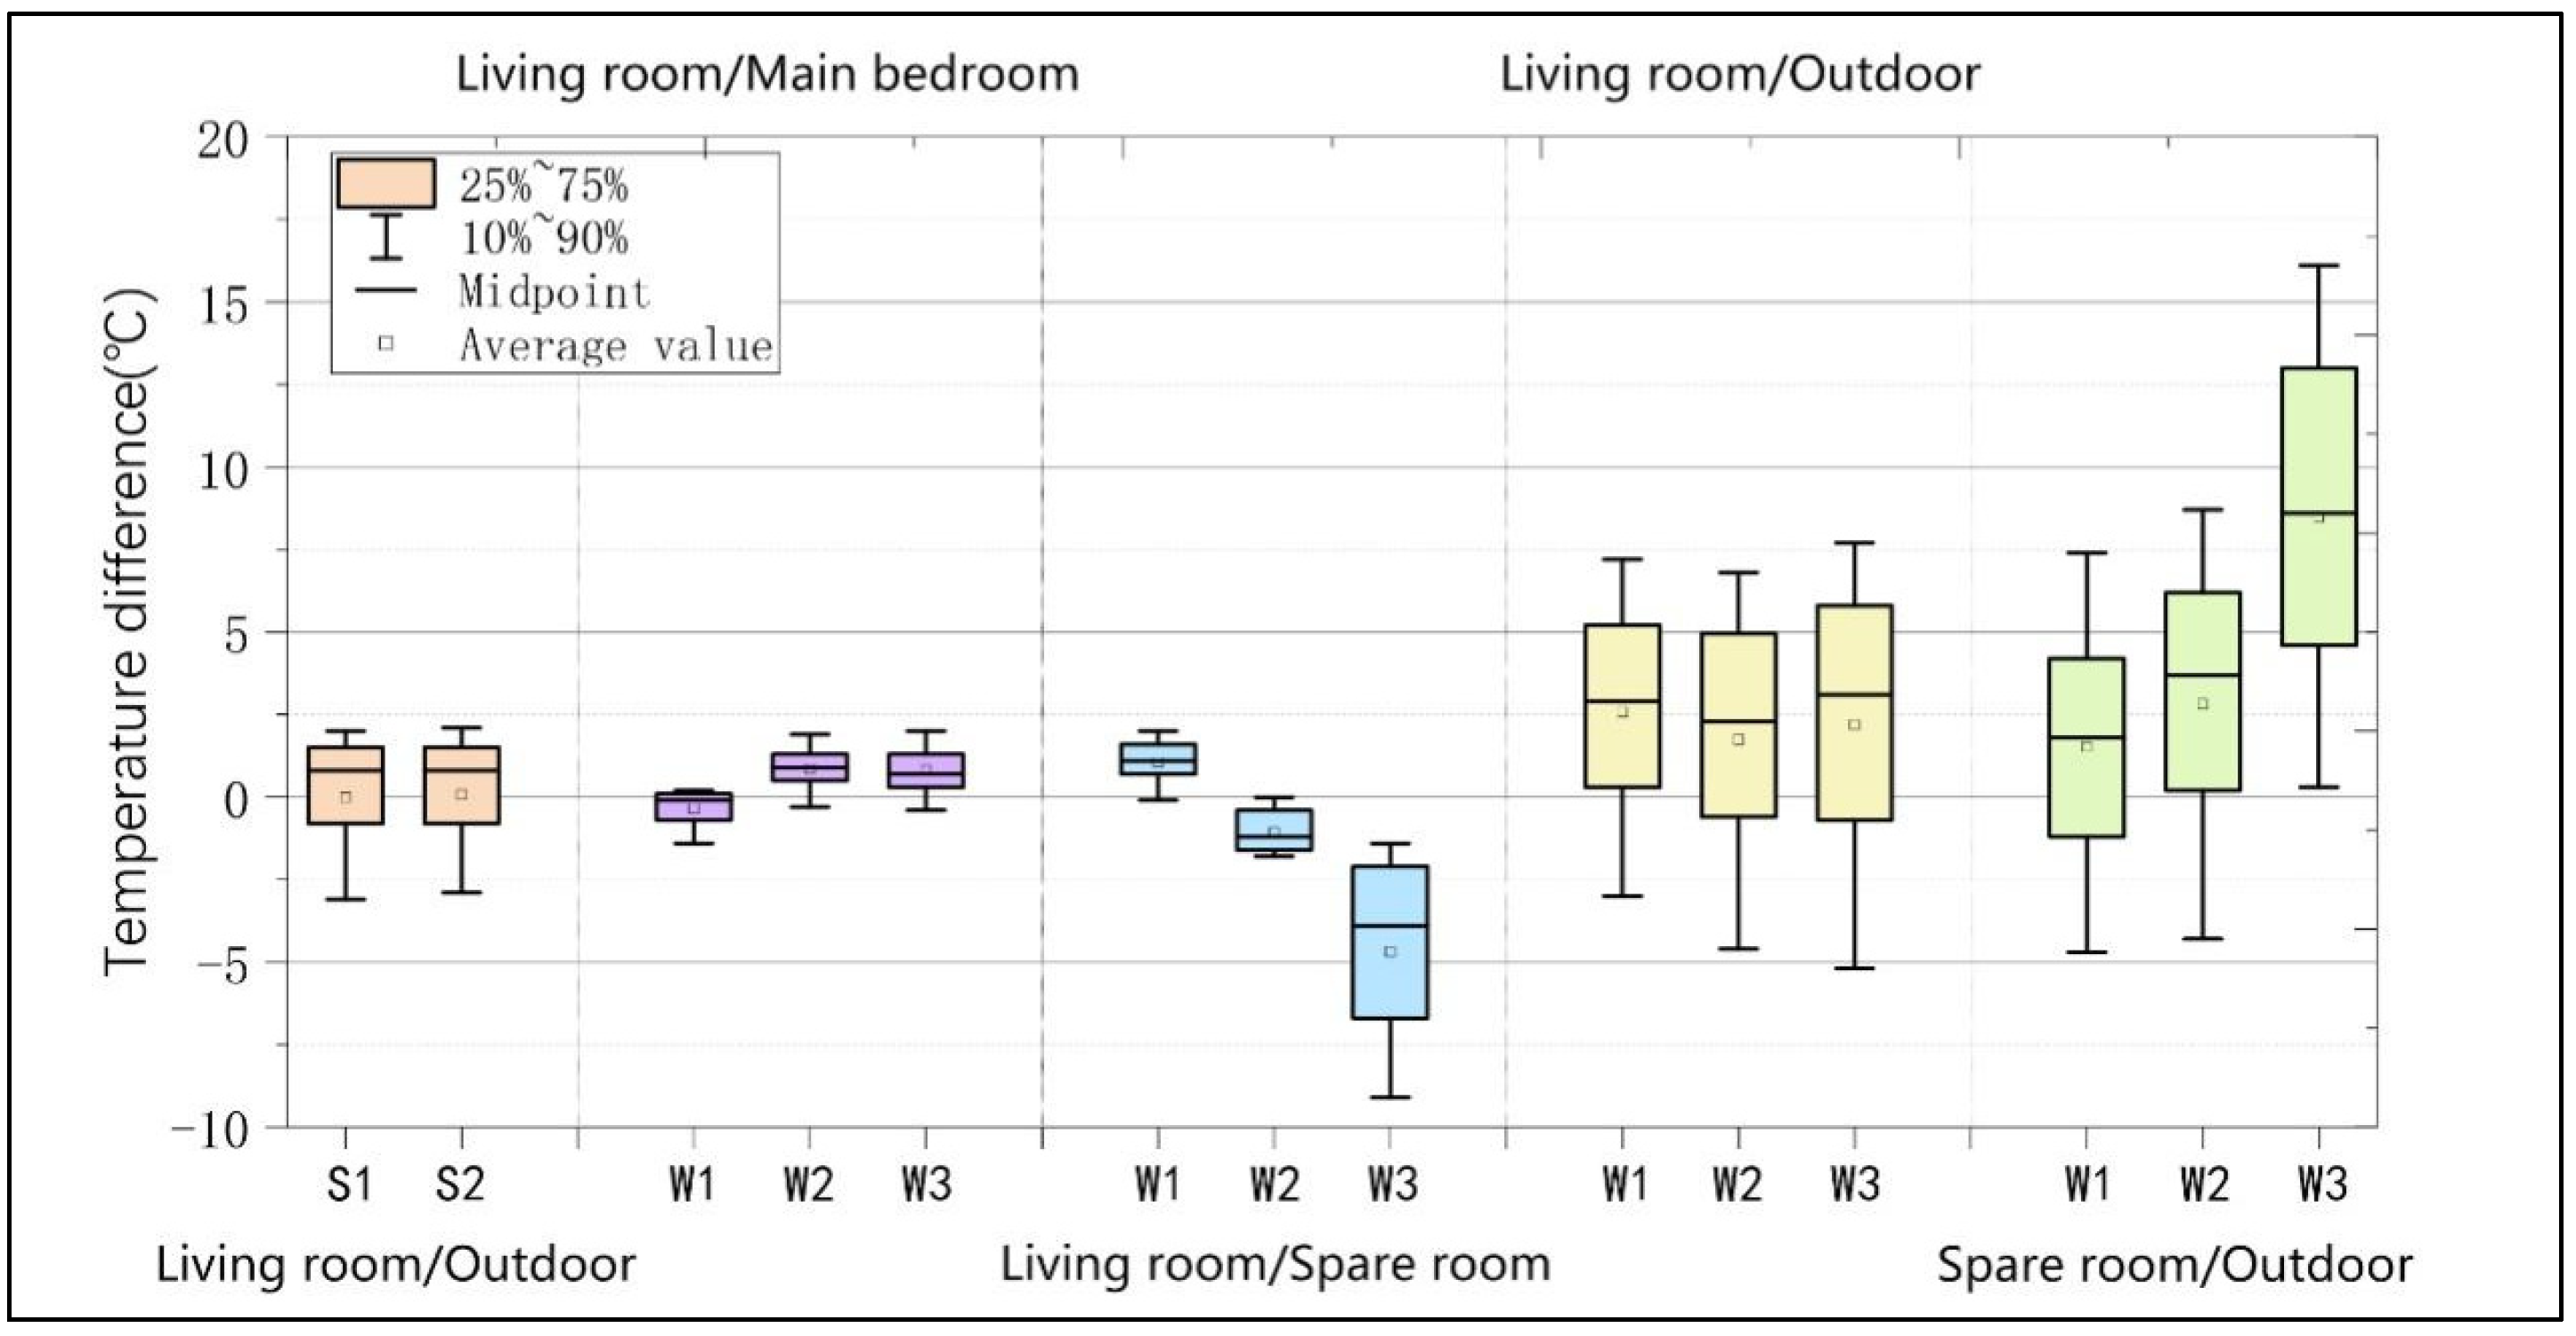
Figure 16 shows that the temperature difference between indoors and outdoors is very small in summer; the average temperature difference is about 0 °C and fluctuates between 0~3 °C most of the time. The reason is that the local outdoor temperature is relatively suitable in summer, and residents open windows all day; thus, the indoor and outdoor temperatures are very close to each other. In winter, the temperature difference between non-heated rooms (living room/main bedroom) is relatively small, between 0~1 °C. While the temperature difference between heated and non-heated rooms is large, the temperature difference is different for rooms with different heating methods. Owing to the intermittent use of air conditioners, the average temperature difference between the spare room in W2 and the non-heated room (living room) is about 2 °C; the temperature difference fluctuates in the range 0~5 °C. The average temperature difference is about 5 °C between the rooms heated by a traditional heated kang and radiator; in the non-heated rooms, the temperature fluctuates in the range 1.5~9.5 °C, which means that the local traditional heating methods have good heating effects.
In addition, the average temperature difference is 1.3 °C between non-heated rooms (living room) and the outside, and the temperature fluctuates in the range 0~7.1 °C. The average temperature difference is 2.9 °C between the spare room heated by an air conditioner in W2 and the outside, and the temperature fluctuates in the range 0~13.5 °C. The average temperature difference is 8.9 °C between the spare room heated by traditional heating methods in W3 and the outside, and the temperature fluctuates in the range 0~21 °C. Therefore, considering the effects on thermal comfort of the temperature difference between indoors and outdoors, the space layout arrangement should be centralized, so that residents can reach each room within indoor rooms, thus avoiding the influence of temperature difference on human health.
4.2.3. Analysis of Indoor Temperature and Relative Humidity Distribution
In summer, the indoor thermal environment data in the two dwellings are extremely close, with an average indoor temperature of 26 °C and an average RH of 78% and 79%, respectively (
Table 7 and
Figure 17). Ninety-eight percent of the indoor temperature data in summer meet the GB/T 18883-2002 standard (22~28 °C), and 73% of the relative humidity data meet the GB/T 18883-2002 standard (40~80%).
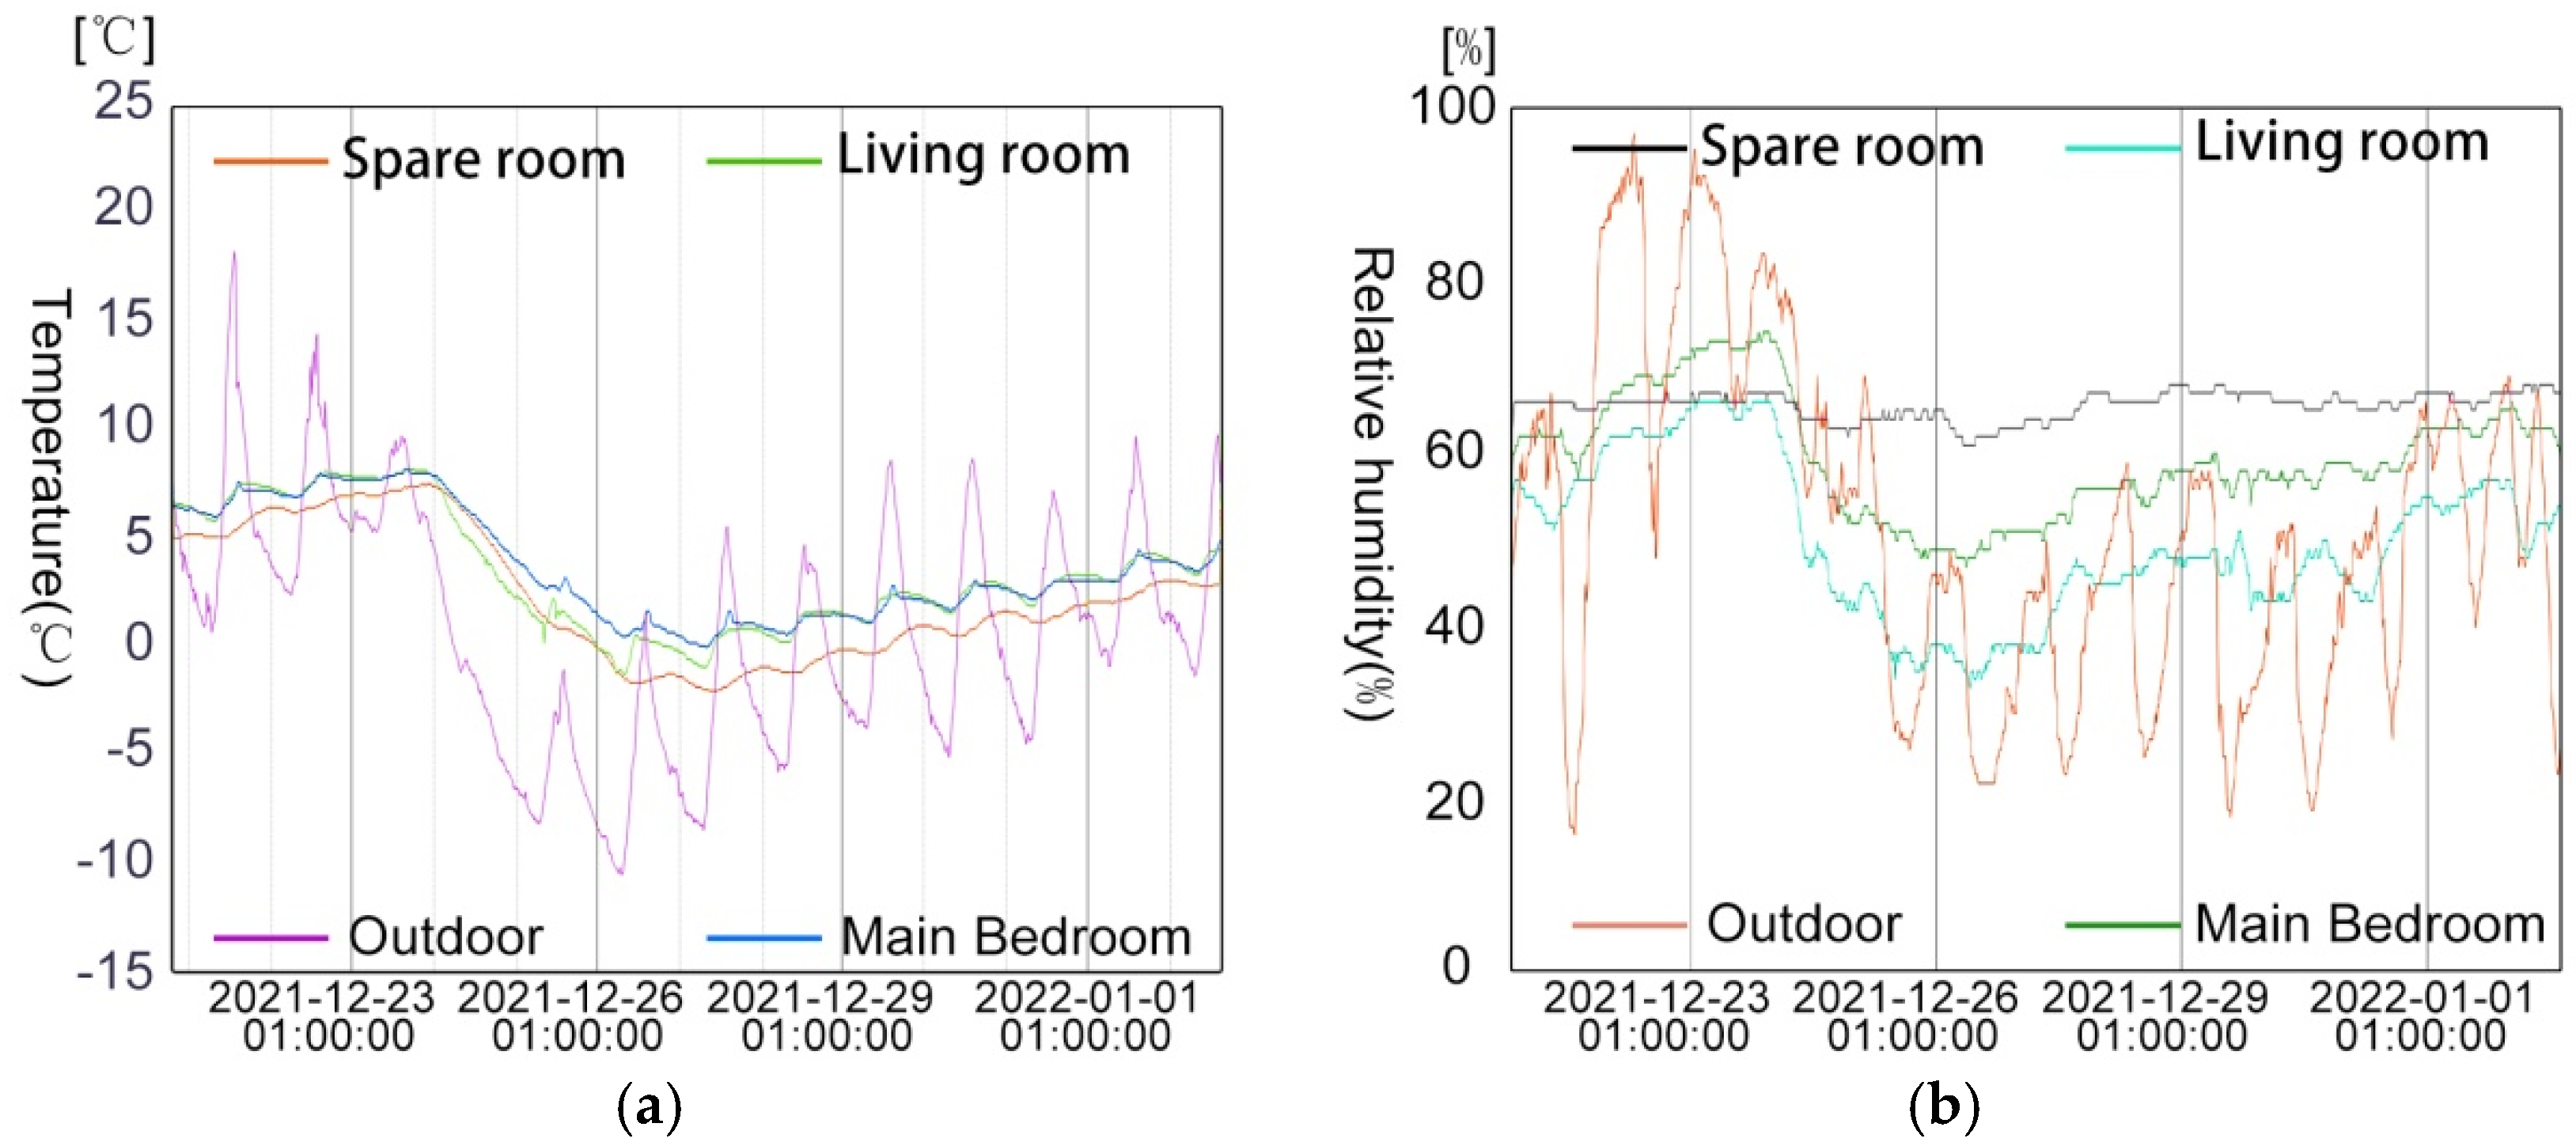
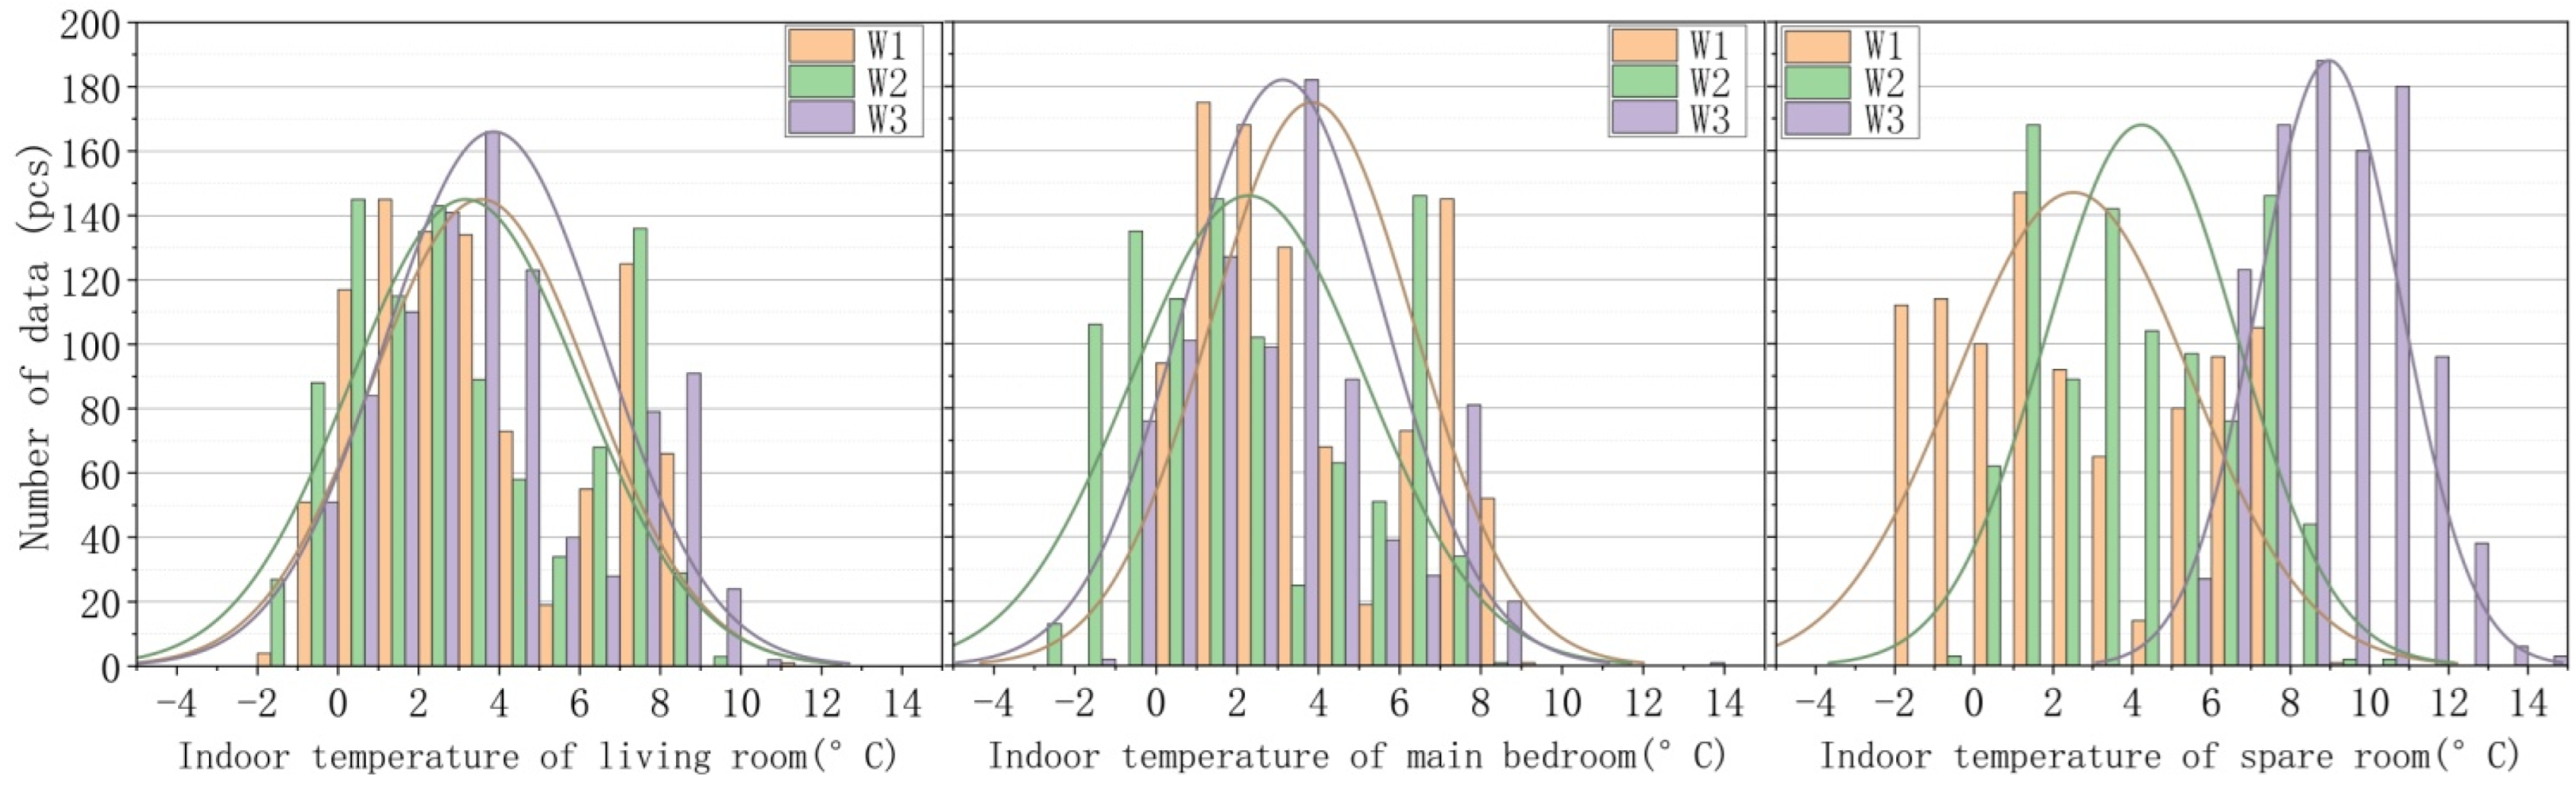
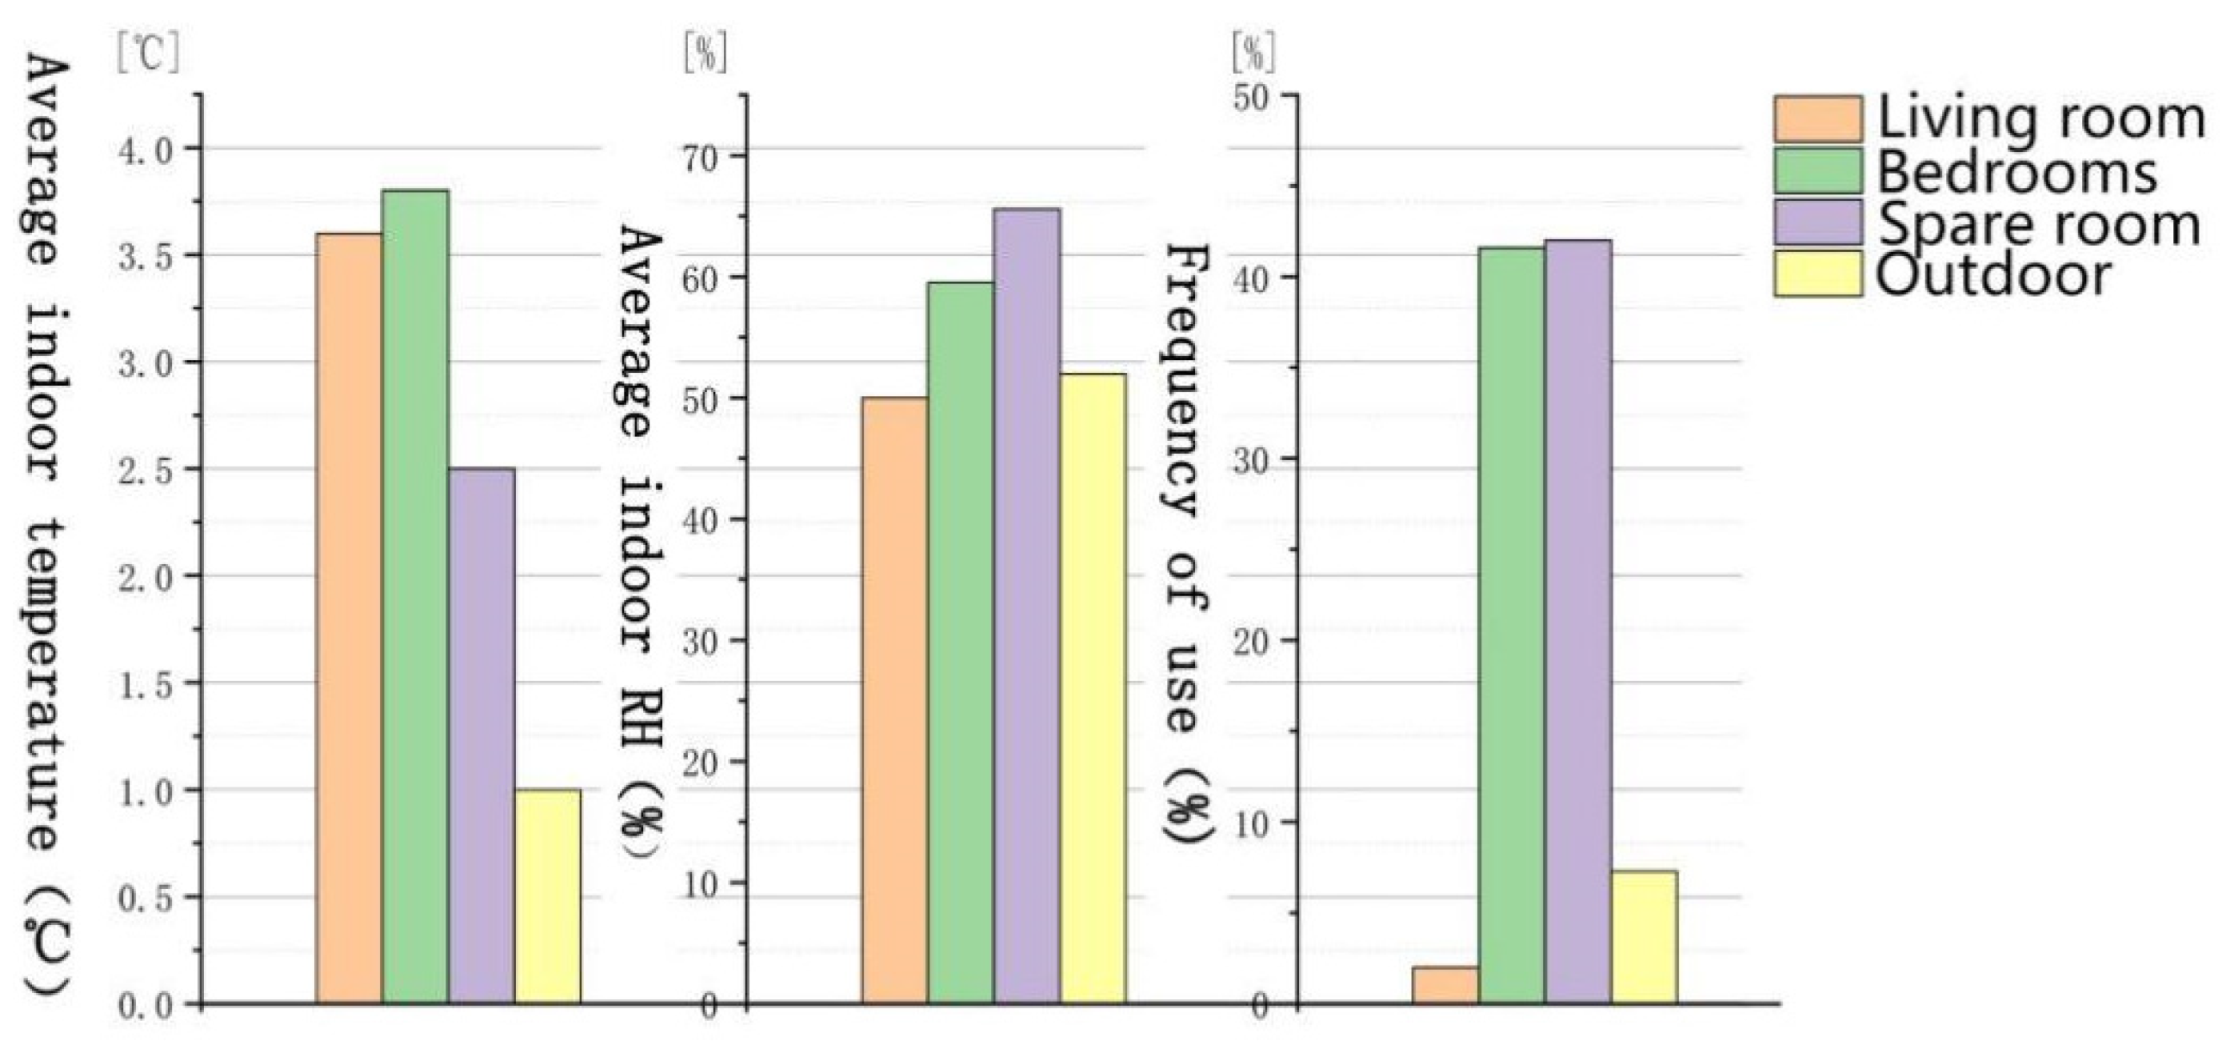
In winter, the indoor temperatures of W1 are shown in
Table 8. The distribution of the indoor environment in the main rooms (
Figure 18), of which the living room and main bedroom are similar during the measurement time, with average temperatures of 3.6 and 3.8 °C, respectively, both higher than the average 2.5 °C in the spare room. Meanwhile, the indoor relative humidity in the spare room is higher than in the living room and main bedroom, with an average RH of 65.6% in the spare room, 59.5% in the main bedroom, and 50% in the living room, and the relative humidity of the spare room is the most stable. This is mainly because the spare room is less affected by solar radiation. All the temperature data of all rooms do not meet the GB/T 18883-2002 standard. In terms of relative humidity, 17.2% of the data in the living room do not meet the GB/T 18883-2002 standard, 40% of the data in the main bedroom do not meet the GB/T 18883-2002 standard, and all the data in the spare room do not meet the GB/T 18883-2002 standard.
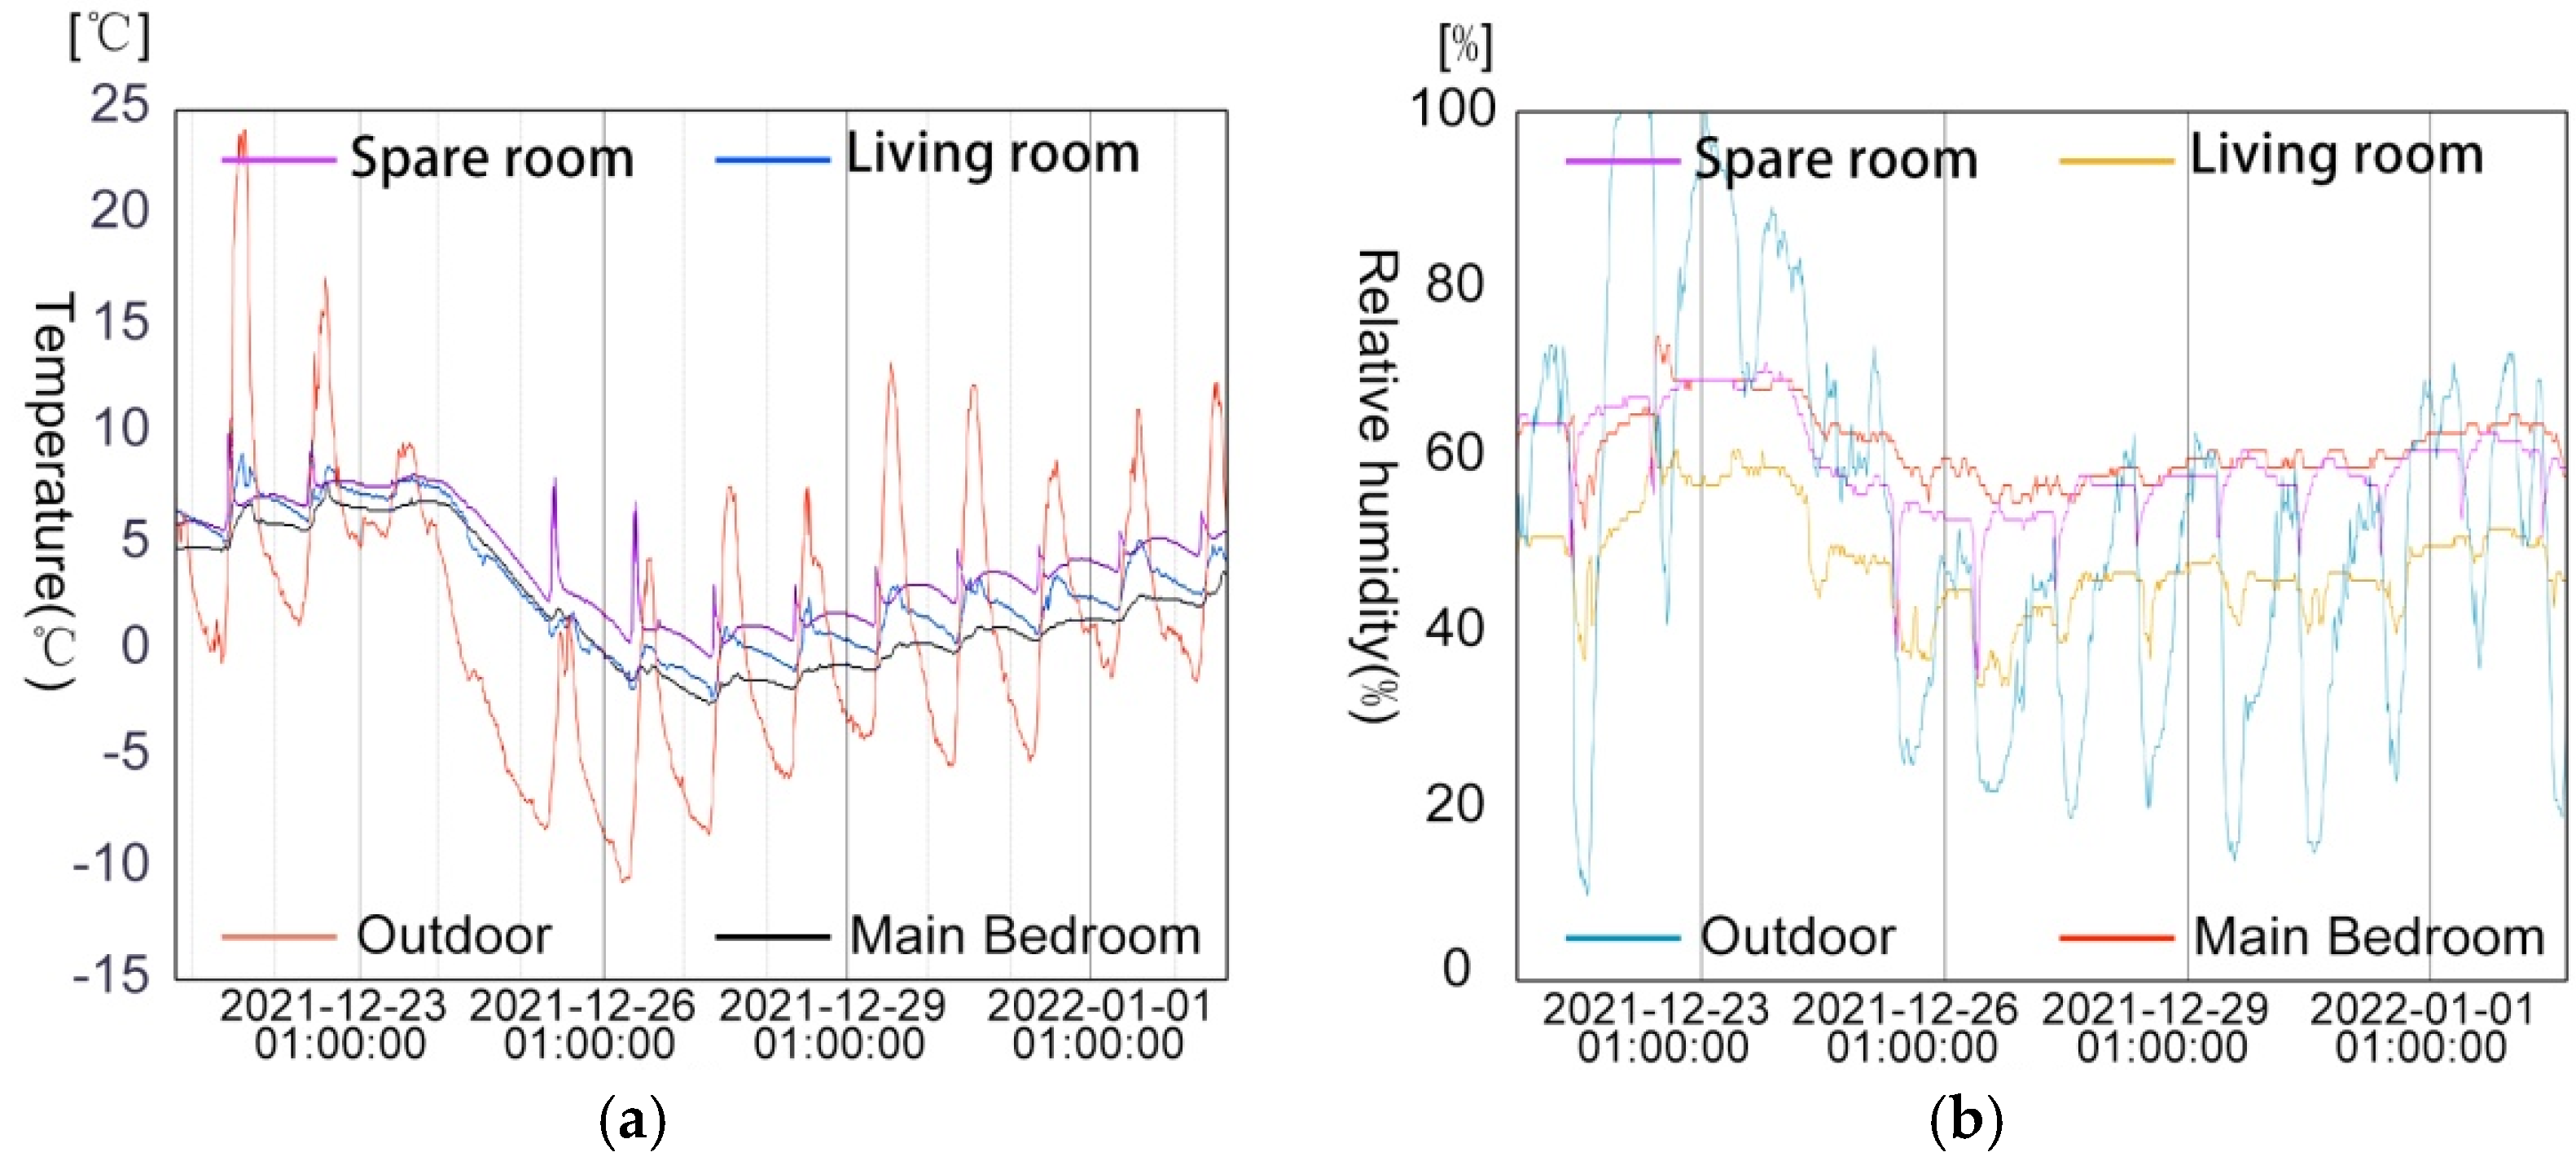
The indoor temperatures of W2 (
Table 9 and
Figure 19) show the average temperature of the spare room is the highest at 4.2 °C in W2 followed by the living room and main bedroom at 3.2 and 2.3 °C, and all temperature data do not meet the GB/T 18883-2002 standard. Residents usually turn on the air conditioner in the spare room when they wake up in the morning and before they go to bed at night, and the indoor temperature rises by 2.6~6.5 °C within 20~30 min, and after turning off the air conditioner, the temperature drops by 1.9~5.9 °C in 2~2.5 h, which indicates that the thermal performance of the wall is poor. Most of the dwellings in rural areas of China adopt brick and concrete structures without insulation layers, which leads to the poor thermal performance of walls and causes high energy consumption. Thus, the self-built dwellings should give more attention to the thermal performance of walls. The average RH of the living room is the lowest at 48%, and only 1.3% of the data do not meet the GB/T 18883-2002 standard. The spare room and main bedroom are very close to the average RH at 60% and 62%, respectively, with 39% and 54.6% of the data not meeting the GB/T 18883-2002 standard. The main reason is that the solar radiation in the living room is more sufficient and less affected by human use.
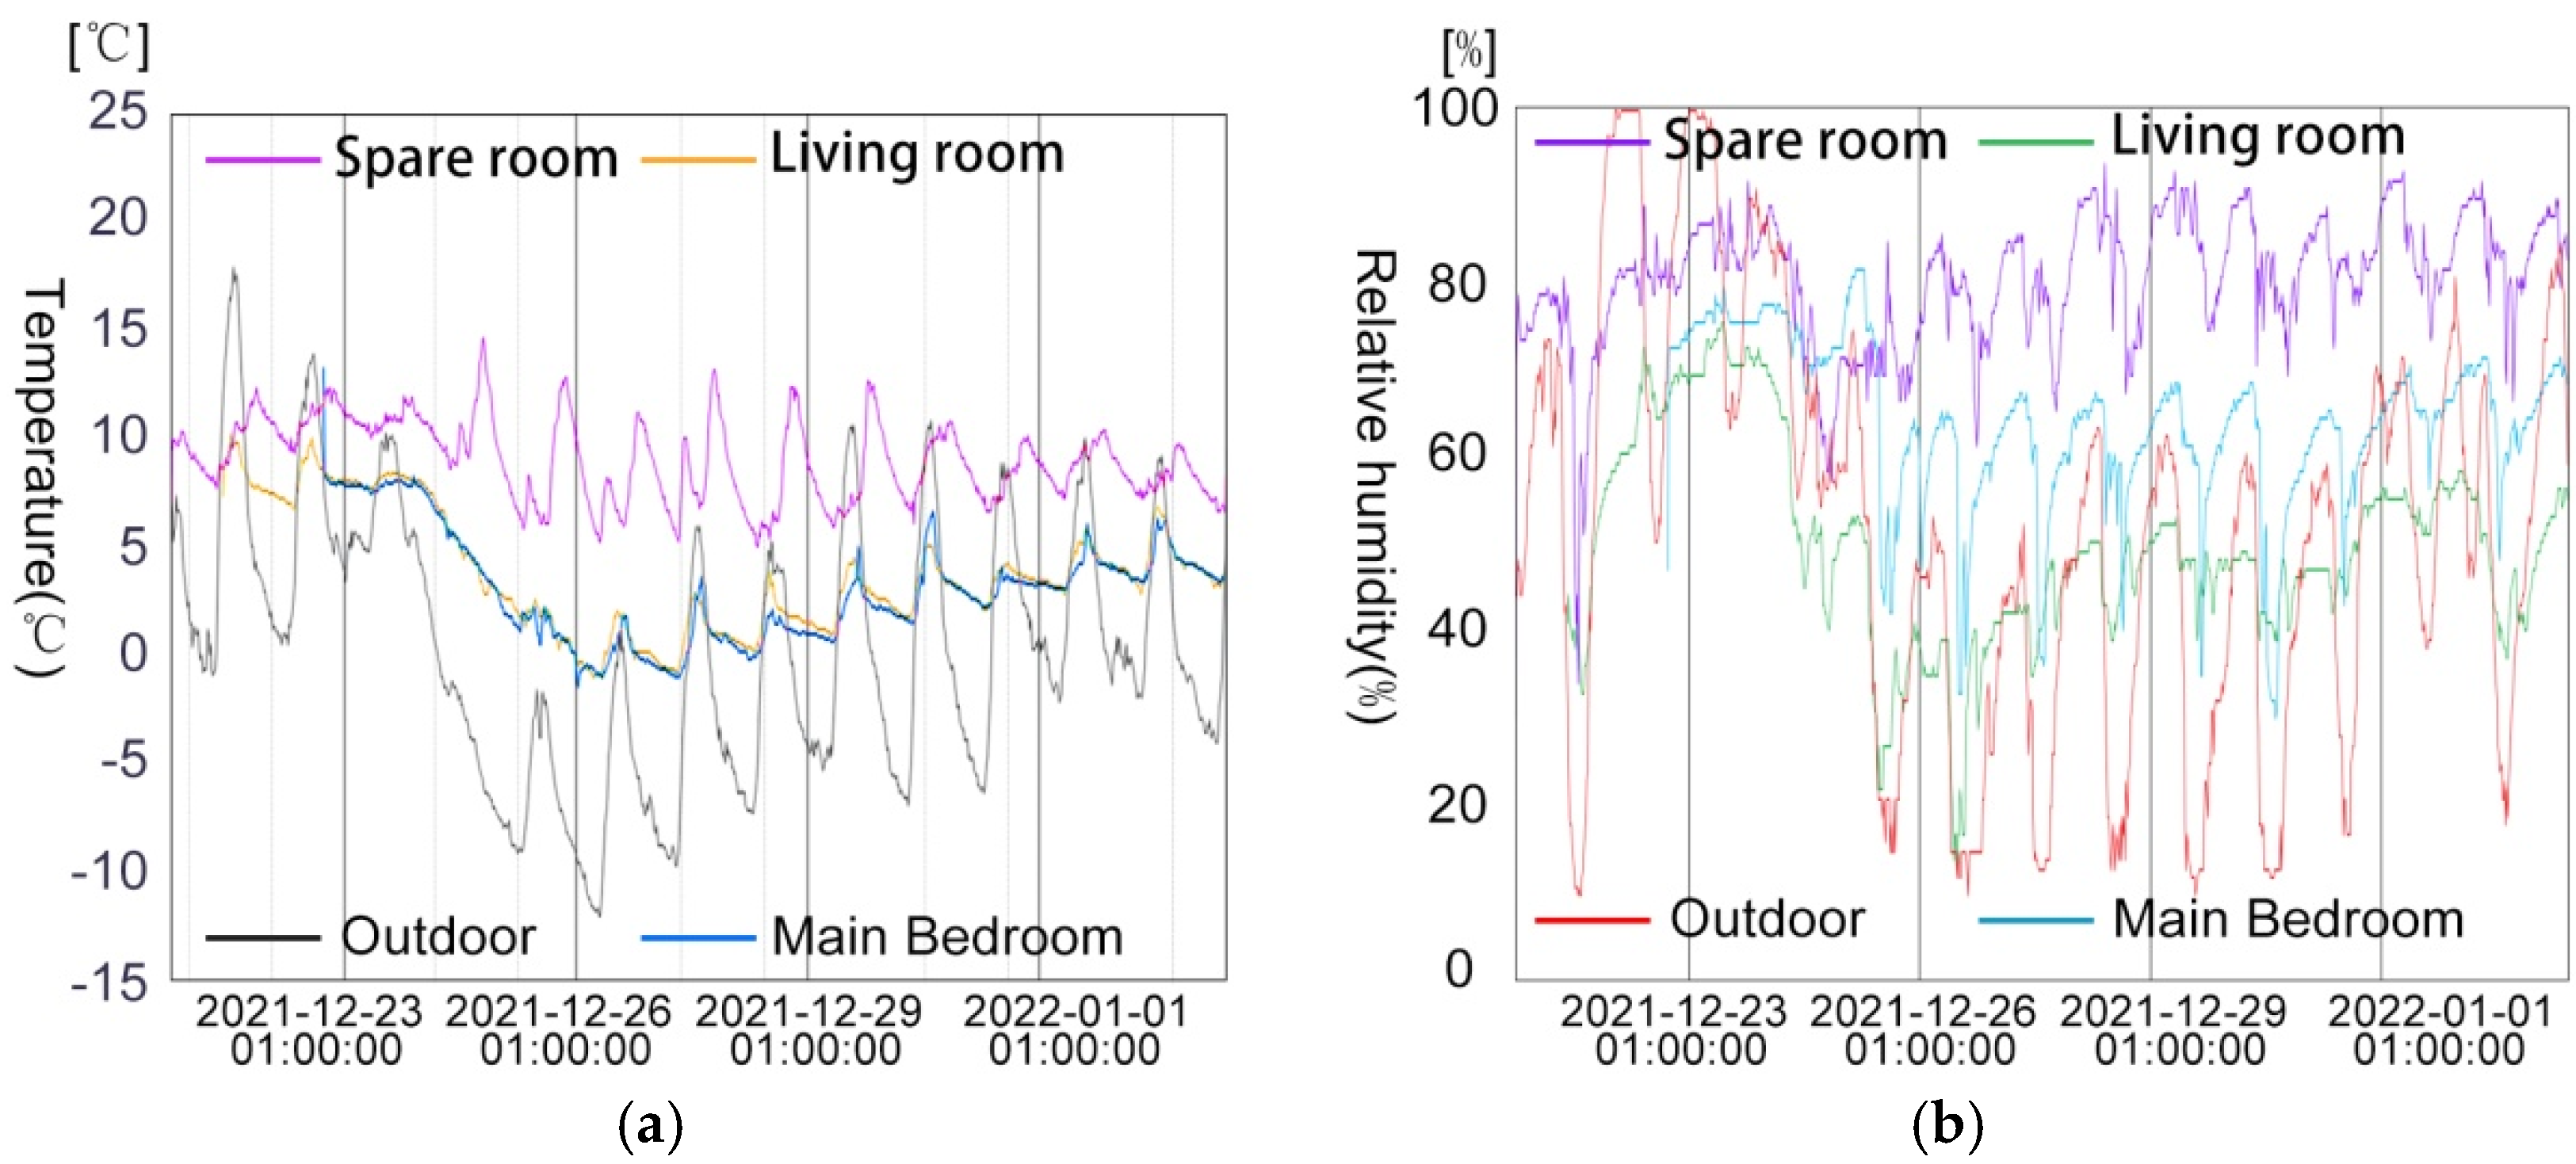
In W3, two elderly people over 70 years old live all day in the spare room.
Table 10 shows the indoor temperature and
Figure 20 shows that the average temperature is the highest at 9 °C among all the rooms, while the average temperature in the living room and the main bedroom is lower at 3.9 and 3.1 °C, respectively. The temperature data for all the rooms do not meet the GB/T 18883-2002 standard. As the living activities throughout the day are all carried out in the spare room, the average RH is the highest at 79.6%, and 98.2% of the data do not meet the GB/T 18883-2002 standard. The average RH in the living room and main bedrooms are 49.6% and 64%, respectively, with 19.2% and 71.4% of the data not meeting the GB/T 18883-2002 standard, which indicates that even under relatively good local heating conditions, the indoor thermal environment is still lower than the thermal comfort standard.
A total of 8354 sets of indoor temperature and humidity data were measured during the winter and the distribution of all data was analyzed; the results are shown in
Figure 21 and
Figure 22.
Figure 21 shows that the indoor temperature ranges from −2 to 8 °C in the non-heating condition, the indoor thermal environment of the local vernacular dwellings in winter is very poor and far below the normal comfort range for humans. In the case of intermittent use of air conditioners, the indoor temperature ranges only between 0 to 8 °C. Additionally, in the case of using a kang and radiator for heating, the indoor temperature ranges from 6 to 13 °C, and the average temperature can be increased by 6.5 °C, which indicates that the local heating methods have significant effects on increasing the indoor temperature.
In winter, the relative humidity varies greatly within different rooms (
Figure 22); 89.4% of the data in the living room and 50.4% in the main bedroom meet the GB/T 18883-2002 standard, while the relative humidity in the spare room is commonly high and almost all the data do not meet the GB/T 18883-2002 standard. Owing to the shortage of solar radiation, rooms in the unoccupied dwelling W1 have higher relative humidity indoors; the average RH in the spare room is higher 10–15% than that in the living room and main bedroom. In the case of occupied W3, the humidity is far above the standard humidity range because residents perform many water-related activities. The average RH in the spare room is 25–30% higher than that in the living room and main bedroom. The average indoor RH of the spare room in W2 is 14% and 39.6% lower than that in the spare rooms in W1 and W3, respectively, due to the use of air conditioners, which means that the utility of air conditioners has positive effects on dehumidification.
4.3. Analysis of Residents’ Thermal Satisfaction and Sensation
4.3.1. Analysis of Residents’ Thermal Satisfaction
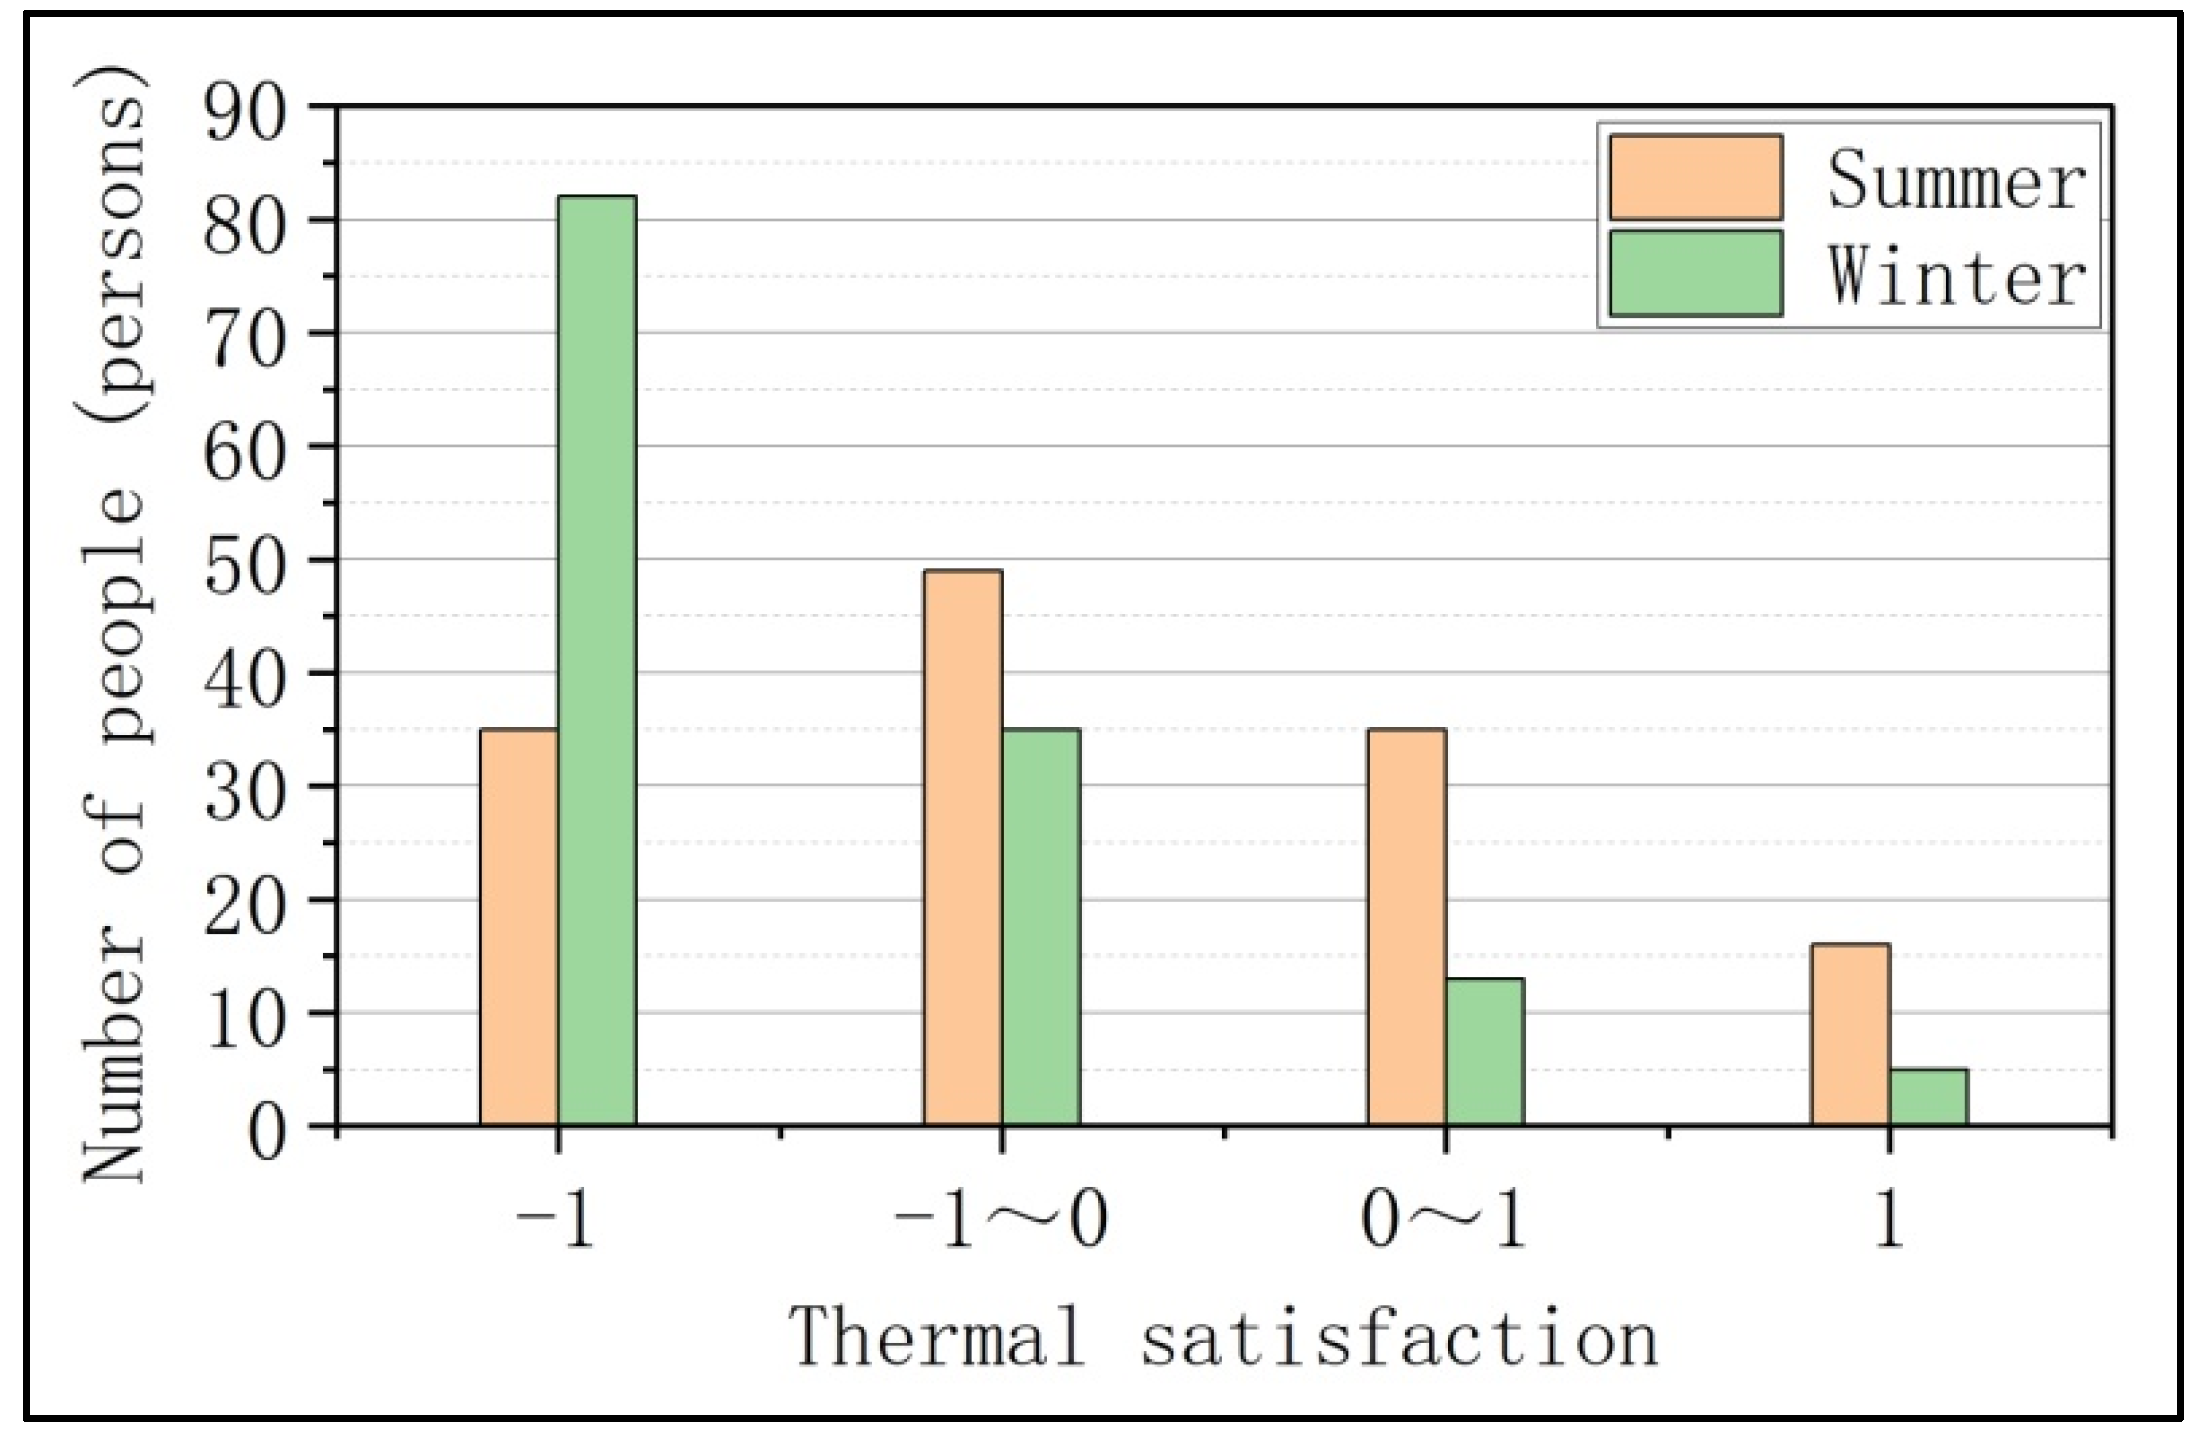
These measurement data show that the indoor thermal environment in Linyi is poor, especially in winter, and a verification survey was conducted by analyzing the residents’ satisfaction with the current indoor thermal environment in winter and summer. The result (
Figure 23) shows that residents are more dissatisfied with winter than summer. The percentage of dissatisfied “−1” for the summer indoor thermal environment is only 25.9%; however, the percentage of satisfied “1” for the summer indoor thermal environment is only 11.9%, which indicates that the indoor thermal environment in summer also needs to be improved. The percentage of dissatisfied “−1” for the winter indoor thermal environment is at 60.7%, and only 4% of the residents are satisfied “1”, which also reflects that the indoor thermal environment in winter is much poorer and cannot meet the thermal comfort requirements for local residents.
4.3.2. Analysis of Indoor Thermal Sensation
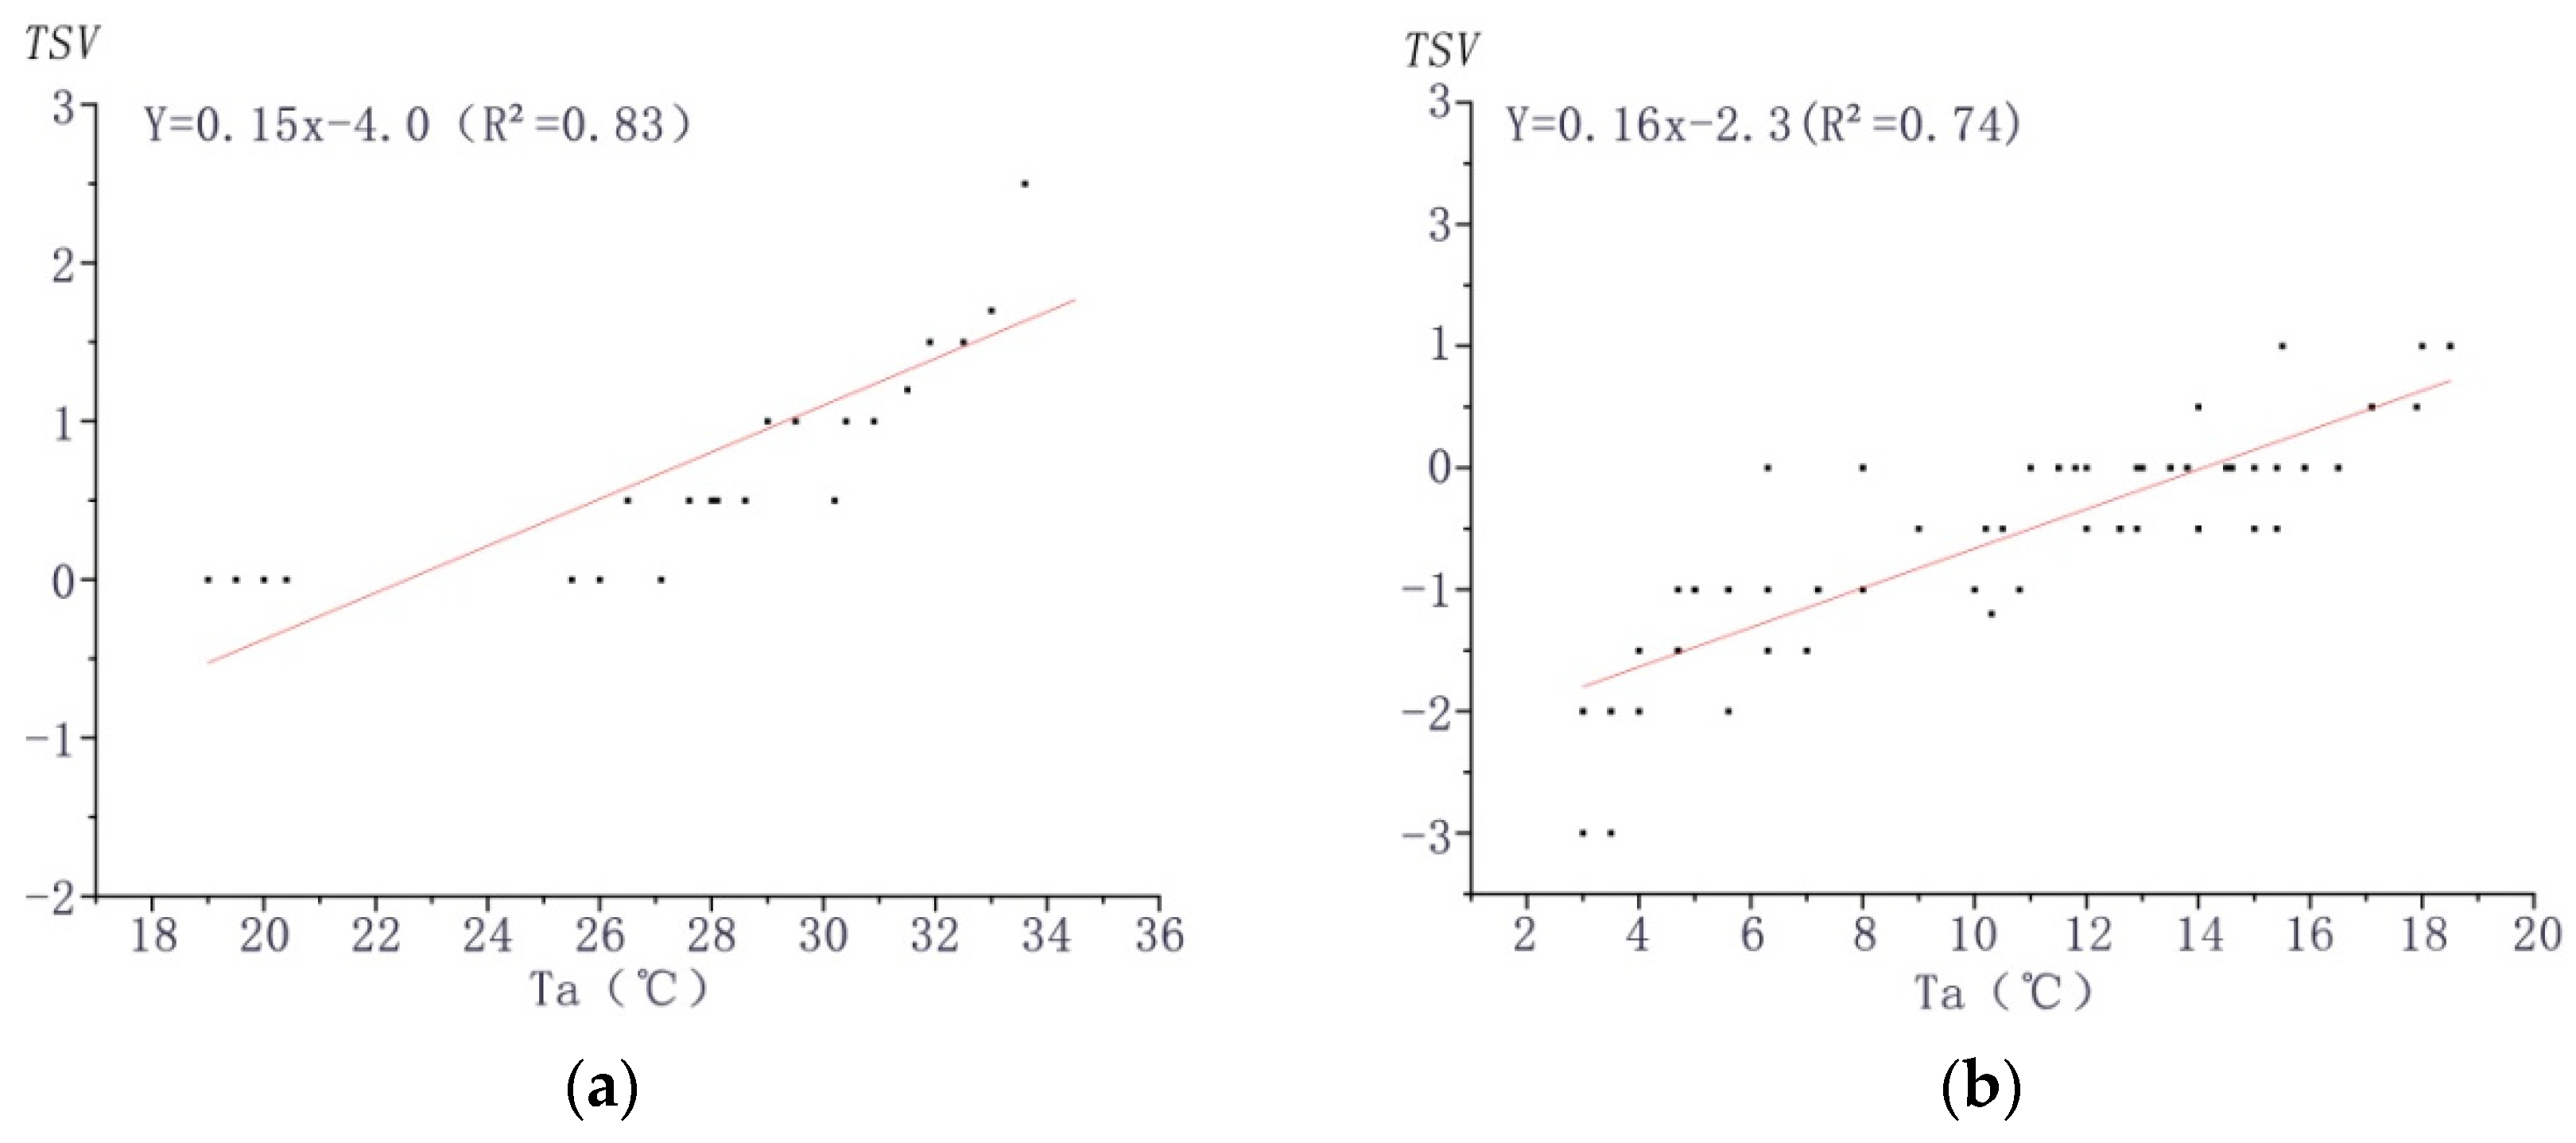
To better understand the thermal environment from the perspective of users, this research further conducted a thermal sensation vote, which is commonly used in thermal comfort studies [
65]. Residents were asked to make subjective evaluations of the indoor thermal environment at different temperatures through thermal sensation votes. Residents’ thermal environment requirements refer to the comfort temperature and humidity range, which can be calculated by establishing a scatterplot of thermal sensation and indoor temperature. The specific questionnaire settings are shown in
Table 4 and the results are shown in
Figure 24, which gives the linear regression plots of TSV in summer and winter. The TSV values are mainly between 0 and 2 in summer and between −2 and 1 in winter, with few people choosing −3 or 3, which indicates that residents possess adaptability to the thermal environment.
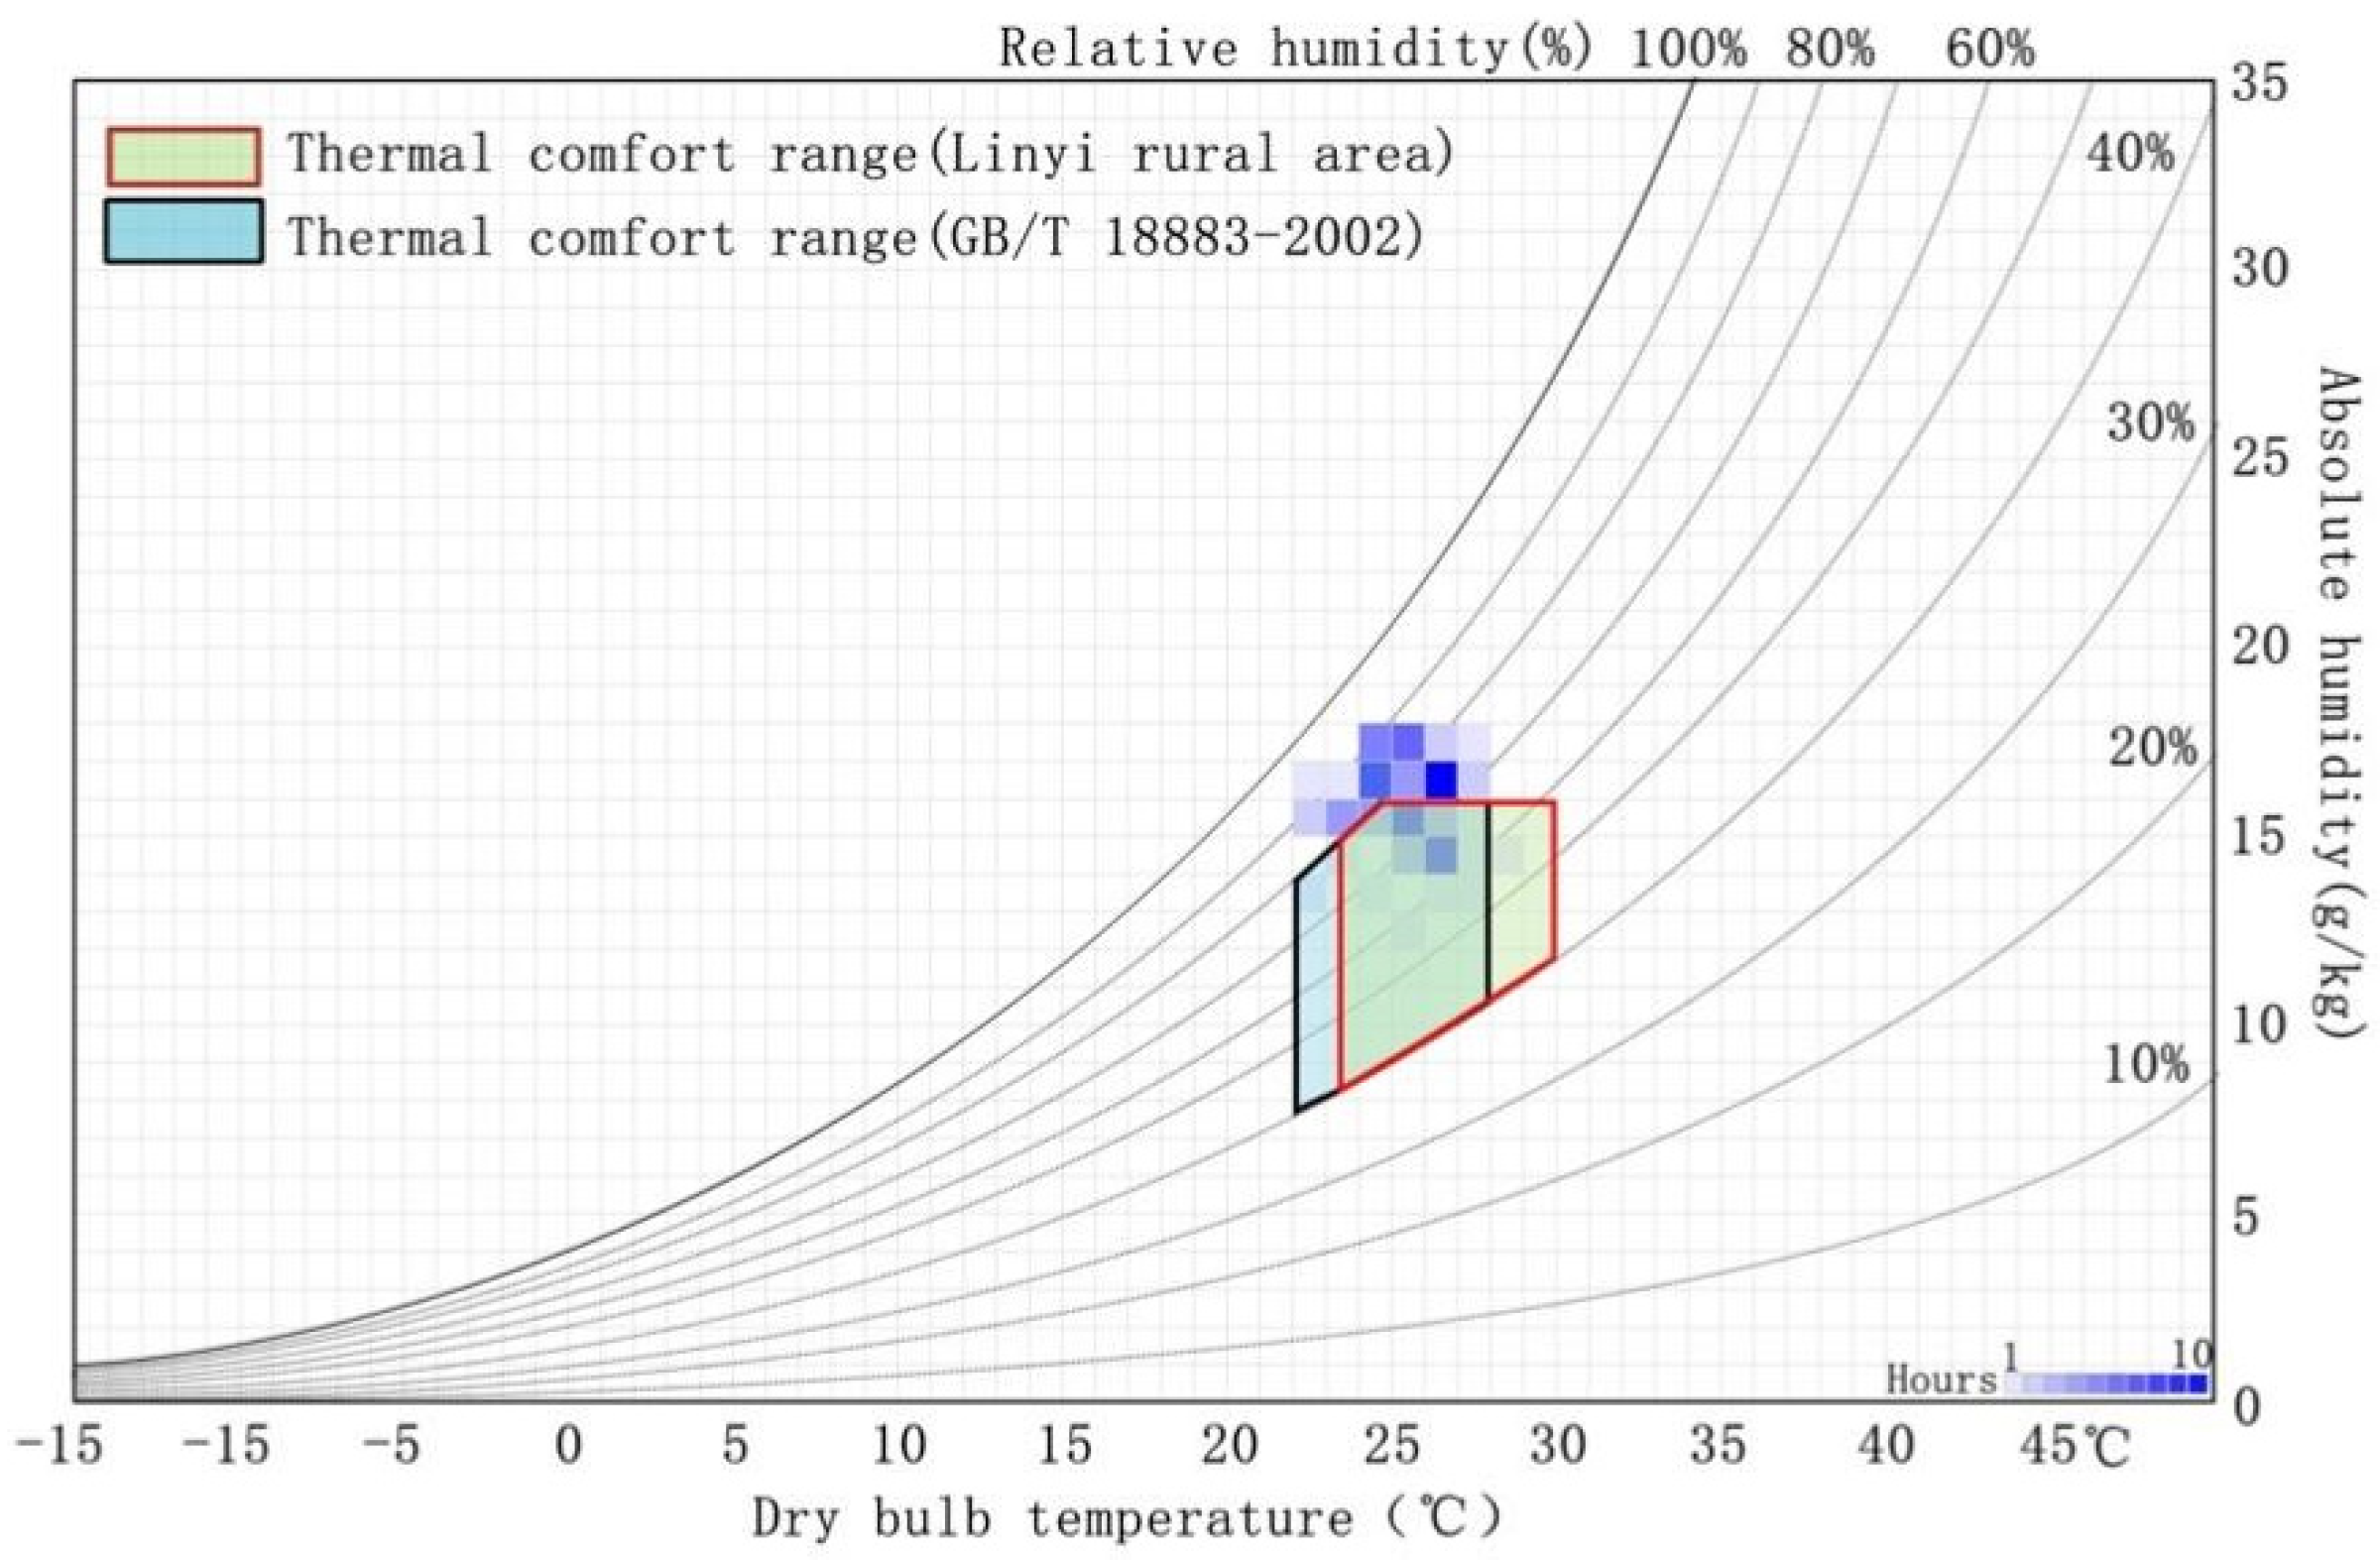
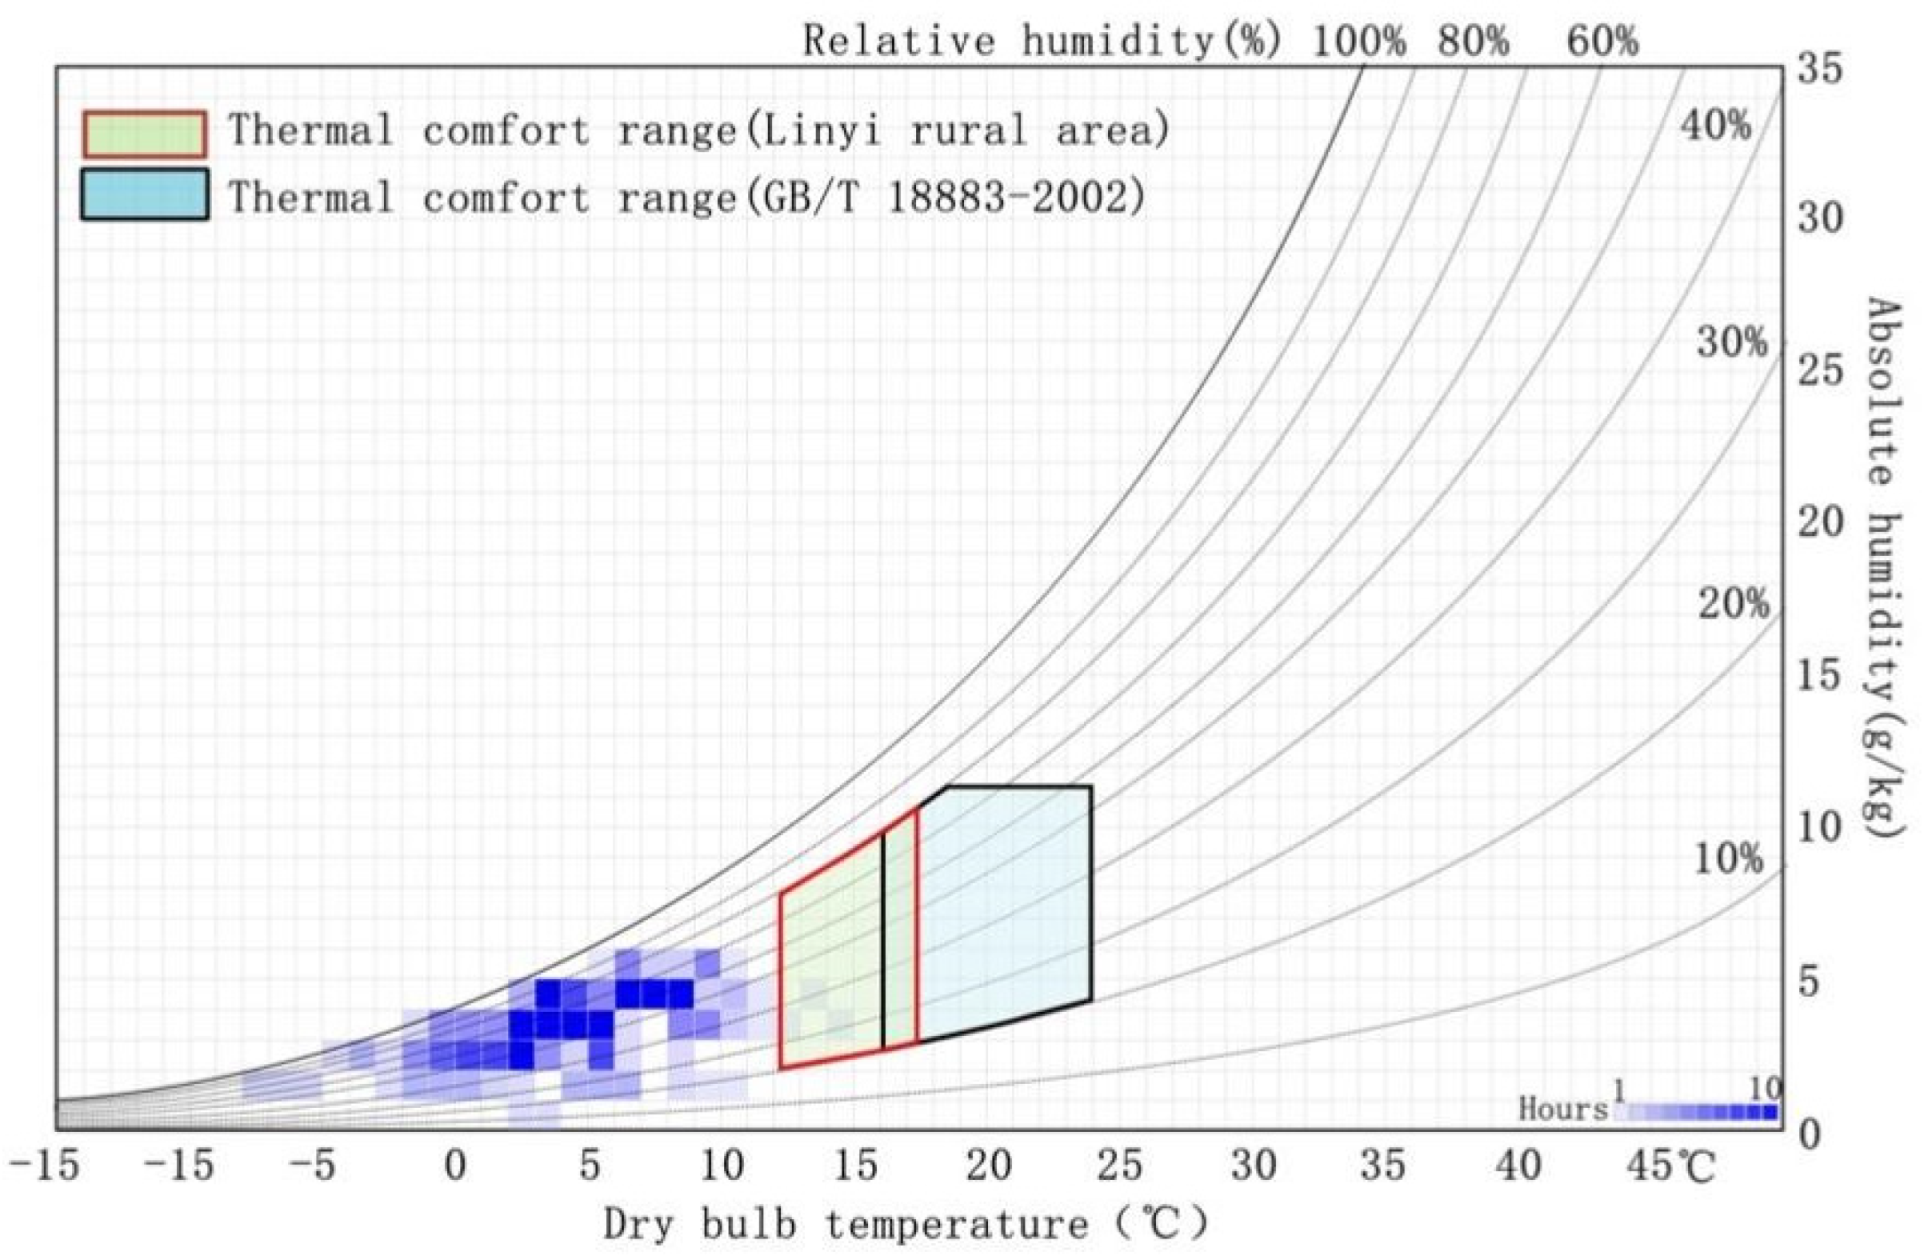
Calculated results show that the neutral thermal temperature of the indoor space is 26.7 °C in summer and 14.4 °C in winter. According to ASHRAE standard 55-2017 [
1], when the value of TSV is between −0.5 and 0.5, 90% of the subjects will feel comfortable. The corresponding temperature range is 23.3~30 °C (
Figure 25) in summer and 11.25~17.5 °C (
Figure 26) in winter. Comparing this comfort zone with the standard comfort zone of GB/T 18883-2002, it indicates that the comfort zone ranges calculated by TSV in both summer and winter show a shift, and both shift in the direction of a harsher environment. This means that residents develop adaptability to the thermal environment, and they adapt to higher temperatures than the standard comfort zone in summer and lower temperatures in winter.
The blue squares in
Figure 25 and
Figure 26 show the distribution of measured data, which indicates that the discomfort of thermal sensation in summer is mainly caused by high humidity while the temperature is suitable. However, owing to the low temperature in winter, most of the data are still out of the comfort range, even though residents have better adaptability to the cold climate in winter.
This analysis shows that residents are highly adaptable to local summer temperatures and only need to dehumidify to meet their thermal comfort during a certain time in summer. However, the indoor thermal environment in winter is very harsh, and even though the residents show high adaptability to the winter climate, they still cannot adapt to the cold winter climate. Traditional local heating methods have visible effects on improving the indoor thermal environment, but the poor insulation of the walls makes the temperature still low.
5. Discussion
In this study, the thermoneutral temperature of residents in summer is 26.7 °C and that in winter is 14.4 °C. The thermoneutral temperature in winter is similar to the research results in cold climate regions of China such as Qingdao, Shanxi, Qinghai, and Gansu [
66,
67], indicating that the winter analysis result is basically accurate. There are few studies on the thermoneutral temperature of summer residents in cold climate regions. Some studies have investigated the summer thermoneutral temperature in rural areas in southern China with hot and humid climates, such as Chongqing (26.9 °C) and Guangdong (24.0 °C) [
18,
43]. Research on the thermoneutral temperature of rural residents in cold regions in summer deserves further study. It should be noted that due to issues such as the age of the test subjects, living environment, and field test environment, these may be the reasons for the differences in the results.
To achieve improvement of the local adaptability and indoor thermal environment of rural vernacular dwellings in Chinese cold regions, previous quantitative research mainly focuses on the measurement of the indoor thermal environment and analysis of residents’ space usage habits [
46,
68,
69], while there is a shortage of research concerning the residents’ subjective satisfaction and requirements. Therefore, the currently available research cannot address residents’ real thermal requirements.
In this research, the measurement of indoor thermal environment, spatial usage, and the investigation of residents’ thermal satisfaction and requirements were combined. The results were then summarized, providing different indoor thermal environments in different types of vernacular dwellings; the main problems in residents’ spatial usage were determined. Based on the investigation in rural areas of Linyi, Shandong, China, the local residential space usage situation, cooling and heating methods, indoor and outdoor thermal environment, and residents’ thermal satisfaction and indoor thermal environment requirements were analyzed.
Through these analyses, (1) the space usage characteristics between heating time and non-heating time were summarized. The results show that there are large contradictions between the indoor thermal environment and residents’ space usage/living habits during the heating time (
Figure 27). For example, local residents still choose the spare room as the main-use space instead of the living room and main bedroom with sufficient lighting in winter. The reason is that the spare room is equipped with a heated kang and has a smaller area, so the heating effect is better and more economical. Residents’ space-use habit is in conflict with the functional layout and the thermal environment of the room itself. Therefore, it is of great significance to adjust appropriately the space function and heating equipment of local dwellings. (2) Local indoor thermal environments in different rooms were analyzed. (3) Residents’ thermal comfort ranges were summarized based on the site measurement, thermal satisfaction, and requirements investigation. The results show that residents develop adaptability to the thermal environment; they can adapt to higher temperatures than the standard comfort zone in summer and lower temperatures in winter. (4) Main problems for the indoor thermal environment and residents’ space usage habits are summarized.
This study analyzes the indoor thermal environment of the main-use space in vernacular dwellings, which can provide a reference and data base and for future vernacular dwelling reconstruction in the rural areas of Linyi. However, owing to some unavoidable reasons, this study also has several shortcomings and limitations. The main limitation of this research is the data collection. In this paper, the main research methods are field measurement and in-depth interviews; deviations exist in field measurements for different equipment choices, variable weather, and different instrument operations. For the in-depth interview, some of the respondents doubted the purpose of the investigation and were reluctant to reveal their true thoughts. In addition, the optimization strategies proposed in this paper were not verified by actual projects. Therefore, future studies for improving the rural thermal environment in the Chinese cold regions should combine the analysis results in this paper and perform simulation research on these optimization strategies. It would be best if these future research results could be realized in the actual vernacular dwelling construction.
6. Conclusions
The indoor thermal comfort of vernacular dwellings in the Chinese cold regions is poor, especially in winter, which seriously affects residents’ life and health. Before the technical optimization of vernacular dwellings, the layout design of vernacular dwellings should be first improved, which is the basis for green building. This study measured and analyzed the indoor thermal environment of the main-used space in vernacular dwellings both in winter and summer. Based on the measurement data, residents’ living habits, thermal comfort satisfaction, and sensation were also investigated. The following conclusions can be drawn:
(1) Local vernacular dwellings can be divided into “square” and “rectangular” according to the shape of the dwelling base, and most of the dwellings in Linyi are quadrangle dwellings. The spatial layout of the dwellings in Linyi is the same as traditional vernacular dwellings in northern Chinese rural areas, and the space for human use is mainly concentrated on the north and west sides of the courtyard.
(2) In Linyi, the summer climate is suitable, while the winter climate is very harsh, and the indoor temperature is very low in local vernacular dwellings. According to our measurement data, the indoor and outdoor temperatures are very close to each other in summer, with an average value of about 26 °C. The average outdoor temperature in winter is 1.2 °C, and the indoor temperature is between 0 and 5 °C. Therefore, the first task to improve the thermal environment of vernacular dwellings in Linyi is to increase the indoor temperature in winter, and to dehumidify during selected times in winter and summer.
(3) The temperature difference between indoors and outdoors in winter is large, which can reach 20 °C when heating equipment is used. The temperature difference between the heated room and the non-heated room ranges from 0 to 15 °C. In addition, due to poor thermal performance, the daily temperature difference in the same room ranges from 2.6 to 6.5 °C, which has negative effects on human health.
(4) Residents possess adaptability to local thermal environment, with the thermal comfort temperature ranging from 23.3 to 30 °C in summer and 11.25 to 17.5 °C in winter. Even though residents show stronger adaptability to the cold climate in winter, the measurement temperature data shows that there is still a great gap between the real thermal environment and residents’ thermal comfort requirements.
(5) There are contradictions between the residents’ space usage, functional layout, and the current indoor thermal environment in the vernacular dwellings in Linyi. During the heating period, for economic considerations, residents move from the living room and the main bedroom, which are more spacious and have better lighting conditions, and settle in the spare room, mainly because of its heated kang and radiator.
According to the field investigation, this research found that the architectural style and layout of local vernacular dwellings are almost the same, which is fundamentally influenced by traditional vernacular dwellings in northern Chinese rural areas. In addition, with the continuous development of new Chinese rural construction in recent years, the architectural style has overemphasized the uniformity of village appearance, which leads to the monotonous and rigid forms of dwellings, and the functional layout design has gradually deviated from the actual spatial use. The local space usage habits are mainly formed by residents’ economic considerations instead of actual living requirements. Therefore, there is a general contradiction between the actual space usage and the functional design in vernacular dwellings.
The basic measure for residents to save energy expenditure is adjusting their space usage for different reasons. However, only considering economic savings and ignoring the thermal insulation of enclosure structures, which will inevitably result in more energy consumption and space waste, and also increase economic expenditure. Therefore, before improving the thermal insulation of enclosure structures, the actual space usage needs reasonable adjustment according to the analysis of the thermal environment and residents’ thermal comfort requirements, which can be the most economic and feasible strategy for improving local thermal comfort, and providing more practical meaning for the residents.
Author Contributions
Conceptualization, T.Z., Y.D., and W.G.; data curation, T.Z., Y.D., and Y.D.; formal analysis, T.Z. and Y.D.; investigation, Y.D., T.Z., and Z.J.; methodology, T.Z., Y.D., and W.G.; supervision, X.Y., H.F., and W.G.; writing—original draft, T.Z. and Y.D.; writing—review and editing, Q.H., T.Z., Y.D., X.Y., Y.D., and W.G. All authors have read and agreed to the published version of the manuscript.
Funding
This research received no external funding.
Data Availability Statement
The data presented in this study are available on request from the authors.
Conflicts of Interest
The authors declare no conflict of interest.
References
- ANSI/ASHRAE Standard 55-2017; Thermal Environmental Conditions for Human Occupancy. Refrigerating and Air-Conditioning Engineers, ASHRAE: Peachtree Corners, GA, USA, 2017.
- CEN. EN 15251; Indoor Environmental Parameters for Design and Assessment of Energy Performance of Buildings-Addressing Indoor Air Quality, Thermal Environment, Lighting and Acoustics. E.C.F. Standardization: Brussels, Belgium, 2007.
- GB/T 50785-2012; Evaluation Standard for Indoor Thermal Environment in Civil Buildings [In Chinese]. P.R.C. Ministry of Housing and Rural-Urban Development, China Architecture & Building Press: Beijing, China, 2012.
- State Council of the People’s Republic of China. The Central Committee of the Communist Party of China and the State Council issued the Rural Revitalization Strategic Plan (2018~2022). China Survey Design 2018, 10, 8–9. [Google Scholar]
- Yang, X.; Jiang, Y.; Yang, M.; Shan, M. Energy and environment in Chinese rural housing: Current status and future perspective. Front. Energy Power Eng. China 2010, 4, 35–46. [Google Scholar] [CrossRef]
- Zhu, X.; Yun, X.; Meng, W.; Xu, H.; Du, W.; Shen, G.; Cheng, H.; Ma, J.; Tao, S. Stacked Use and Transition Trends of Rural Household Energy in Mainland China. Environ. Sci. Technol. 2019, 53, 521–529. [Google Scholar] [CrossRef]
- National Bureau of Statistics of China. China Statistical Yearbook 2021; China Statistics Press: Beijing, China, 2021. [Google Scholar]
- Song, Y.; Sun, Y.; Luo, S.; Tian, Z.; Hou, J.; Kim, J.; Parkinson, T.; de Dear, R. Residential adaptive comfort in a humid continental climate—Tianjin China. Energy Build. 2018, 170, 115–121. [Google Scholar] [CrossRef]
- Chen, Y.; Shen, H.; Smith, K.R.; Guan, D.; Chen, Y.; Shen, G.; Liu, J.; Cheng, H.; Zeng, E.Y.; Tao, S. Estimating household air pollution exposures and health impacts from space heating in rural China. Environ. Int. 2018, 119, 117–124. [Google Scholar] [CrossRef] [Green Version]
- Evans, M.; Yu, S.; Song, B.; Deng, Q.; Liu, J.; Delgado, A. Building energy efficiency in rural China. Energy Policy 2014, 64, 243–251. [Google Scholar] [CrossRef]
- Kerimray, A.; Rojas-Solórzano, L.; Amouei Torkmahalleh, M.; Hopke, P.K.; Ó Gallachóir, B.P. Coal use for residential heating: Patterns, health implications and lessons learned. Energy Sustain. Dev. 2017, 40, 19–30. [Google Scholar] [CrossRef]
- Bonjour, S.; Adair-Rohani, H.; Wolf, J.; Bruce, N.G.; Mehta, S.; Prüss-Ustün, A.; Lahiff, M.; Rehfuess, E.A.; Mishra, V.; Smith, K.R. Solid fuel use for household cooking: Country and regional estimates for 1980–2010. Environ. Health Perspect. 2013, 121, 784–790. [Google Scholar] [CrossRef] [Green Version]
- Zhang, H.; Chen, Y.; Rui, J.; Yoshino, H.; Zhang, J.; Chen, X.; Liu, J. Effects of thermal environment on elderly in urban and rural houses during heating season in a severe cold region of China. Energy Build. 2019, 198, 61–74. [Google Scholar] [CrossRef]
- Klepeis, N.E.; Nelson, W.C.; Ott, W.R.; Robinson, J.P.; Tsang, A.M.; Switzer, P.; Behar, J.V.; Hern, S.C.; Engelmann, W.H. The National Human Activity Pattern Survey (NHAPS): A resource for assessing exposure to environmental pollutants. J. Expo. Sci. Environ. Epidemiol. 2001, 11, 231–252. [Google Scholar] [CrossRef] [Green Version]
- Almeida-Silva, M.; Wolterbeek, H.T.; Almeida, S.M. Elderly exposure to indoor air pollutants. Atmos. Environ. 2014, 85, 54–63. [Google Scholar] [CrossRef]
- GB 50176-2016; Code for Thermal Design of Civil Building. Ministry of Housing and Urban-Rural Development of China: Beijing, China, 2016.
- Yan, H.; Yang, L.; Zheng, W.; Li, D. Influence of outdoor temperature on the indoor environment and thermal adaptation in Chinese residential buildings during the heating season. Energy Build. 2016, 116, 133–140. [Google Scholar] [CrossRef]
- Zhang, Z.; Zhang, Y.; Jin, L. Thermal comfort in interior and semi-open spaces of rural folk houses in hot-humid areas. Build. Environ. 2018, 128, 336–347. [Google Scholar] [CrossRef]
- Yang, W.; Xu, J.; Lu, Z.; Yan, J.; Li, F. A systematic review of indoor thermal environment of the vernacular dwelling climate responsiveness. J. Build. Eng. 2022, 53, 104514. [Google Scholar] [CrossRef]
- Xu, C.; Li, S.; Zhang, X.; Shao, S. Thermal comfort and thermal adaptive behaviours in traditional dwellings: A case study in Nanjing, China. Build. Environ. 2018, 142, 153–170. [Google Scholar] [CrossRef]
- Zheng, G.; Bu, W. Review of Heating Methods for Rural Houses in China. Energies 2018, 11, 3402. [Google Scholar] [CrossRef] [Green Version]
- Ozel, M. Determination of optimum insulation thickness based on cooling transmission load for building walls in a hot climate. Energy Convers. Manag. 2013, 66, 106–114. [Google Scholar] [CrossRef]
- Jelle, B.P. Traditional, state-of-the-art and future thermal building insulation materials and solutions—Properties, requirements and possibilities. Energy Build. 2011, 43, 2549–2563. [Google Scholar] [CrossRef] [Green Version]
- Caro, R.; Sendra, J.J. Are the dwellings of historic Mediterranean cities cold in winter? A field assessment on their indoor environment and energy performance. Energy Build. 2021, 230, 110567. [Google Scholar] [CrossRef]
- Meng, X.; Yan, B.; Gao, Y.; Wang, J.; Zhang, W.; Long, E. Factors affecting the in situ measurement accuracy of the wall heat transfer coefficient using the heat flow meter method. Energy Build. 2015, 86, 754–765. [Google Scholar] [CrossRef]
- Long, E.S.; Zhang, Z.X.; Ma, X.F. Are the energy conservation rates (RVRs) approximate in different cities for the same building with the same outer-wall thermal insulation measures? Build. Environ. 2005, 40, 537–544. [Google Scholar] [CrossRef]
- Murtyas, S.; Hagishima, A.; Kusumaningdyah, N.H. On-site measurement and evaluations of indoor thermal environment in low-cost dwellings of urban Kampung district. Build. Environ. 2020, 184, 107239. [Google Scholar] [CrossRef]
- Fang, Z.; Li, N.; Li, B.; Luo, G.; Huang, Y. The effect of building envelope insulation on cooling energy consumption in summer. Energy Build. 2014, 77, 197–205. [Google Scholar] [CrossRef]
- Chirarattananon, S.; Hien, V.D.; Tummu, P. Thermal performance and cost effectiveness of wall insulation under Thai climate. Energy Build. 2012, 45, 82–90. [Google Scholar] [CrossRef]
- Hou, J.; Zhang, T.; Liu, Z.; Hou, C.; Fukuda, H. A study on influencing factors of optimum insulation thickness of exterior walls for rural traditional dwellings in northeast of Sichuan hills, China. Case Stud. Constr. Mater. 2022, 16, e01033. [Google Scholar] [CrossRef]
- Shao, N.; Ma, L.; Zhang, J. Study on the rural residence heating temperature based on the residents behavior pattern in South Liaoning province. Energy Build. 2018, 174, 179–189. [Google Scholar] [CrossRef]
- Ensieh, G.N. Architectural structure and environmental performance of sustainable Lahijan vernacular settlements, North of Iran. City Identity 2014, 7, 39–50. [Google Scholar]
- Chang, S.; He, W.; Yan, H.; Yang, L.; Song, C. Influences of vernacular building spaces on human thermal comfort in China’s arid climate areas. Energy Build. 2021, 244, 110978. [Google Scholar] [CrossRef]
- Duan, X. Studies on Energy Efficiency Design and Technology of Rural Residence in Baoji Region. Master’s Thesis, Xi’an University of Architecture and Technology, Xi’an, China, 2009. [Google Scholar]
- Lee, J.W.; Jung, H.J.; Park, J.Y.; Lee, J.B.; Yoon, Y. Optimization of building window system in Asian regions by analyzing solar heat gain and daylighting elements. Renew. Energy 2013, 50, 522–531. [Google Scholar] [CrossRef]
- Liu, D. The Research on The Spatial Form of Energy-Saving Rural Housing in Northwest China. Master’s Thesis, Xi’an University of Architecture and Technology, Xi’an, China, 2010. [Google Scholar]
- He, W.; Yang, L.; Liu, J.; Hu, R.; Shi, H. Climate Adaptability Development of Qinling Mountains Traditional Dwellings. Archit. J. 2009, S2, 24–26. [Google Scholar]
- Iseki, K.; Isoda, N.; Yanase, T.; Hanaoka, T. A Survey of Residential Thermal Environments (Part 2) Effect of Thermal Conditions on the Residents. J. Home Econ. Jpn. 1988, 39, 879–884. [Google Scholar] [CrossRef]
- Kato, T.; Yamagishi, A.; Yamashita, Y. Difference between winter and summer of the indoor thermal environment and residents’ thinking of detached houses in Nagano City. J. Archit. Plan. (Trans. AIJ) 1996, 61, 23–31. [Google Scholar] [CrossRef] [Green Version]
- Costa-Carrapiço, I.; González, J.N.; Raslan, R.; Sánchez-Guevara, C.; Redondas Marrero, M.D. Understanding thermal comfort in vernacular dwellings in Alentejo, Portugal: A mixed-methods adaptive comfort approach. Build. Environ. 2022, 217, 109084. [Google Scholar] [CrossRef]
- Humphreys, M.A.; Fergus Nicol, J. The validity of ISO-PMV for predicting comfort votes in every-day thermal environments. Energy Build. 2002, 34, 667–684. [Google Scholar] [CrossRef]
- Taleghani, M.; Tenpierik, M.; Kurvers, S.; van den Dobbelsteen, A. A review into thermal comfort in buildings. Renew. Sustain. Energy Rev. 2013, 26, 201–215. [Google Scholar] [CrossRef]
- Du, X.; Bokel, R.; van den Dobbelsteen, A. Building microclimate and summer thermal comfort in free-running buildings with diverse spaces: A Chinese vernacular house case. Build. Environ. 2014, 82, 215–227. [Google Scholar] [CrossRef]
- Heidari, S.; Sharples, S. A comparative analysis of short-term and long-term thermal comfort surveys in Iran. Energy Build. 2002, 34, 607–614. [Google Scholar] [CrossRef]
- Guo, S.; Yan, D.; Peng, C.; Cui, Y.; Zhou, X.; Hu, S. Investigation and analyses of residential heating in the HSCW climate zone of China: Status quo and key features. Build. Environ. 2015, 94, 532–542. [Google Scholar] [CrossRef]
- Huang, Z.; Liu, Y.; Pan, C.; Wang, Y.; Yu, H.; He, W. Energy-saving effects of yard spaces considering spatiotemporal activity patterns of rural Chinese farm households. J. Clean. Prod. 2022, 355, 131843. [Google Scholar] [CrossRef]
- Chandel, S.S.; Sharma, V.; Marwah, B.M. Review of energy efficient features in vernacular architecture for improving indoor thermal comfort conditions. Renew. Sustain. Energy Rev. 2016, 65, 459–477. [Google Scholar] [CrossRef]
- Nguyen, A.T.; Truong, N.S.H.; Rockwood, D.; Tran Le, A.D. Studies on sustainable features of vernacular architecture in different regions across the world: A comprehensive synthesis and evaluation. Front. Archit. Res. 2019, 8, 535–548. [Google Scholar] [CrossRef]
- Cao, B.; Zhu, Y.; Ouyang, Q.; Zhou, X.; Huang, L. Field study of human thermal comfort and thermal adaptability during the summer and winter in Beijing. Energy Build. 2011, 43, 1051–1056. [Google Scholar] [CrossRef]
- Yang, L.; Yang, Q.; Yan, H.; Liu, J. Field study on thermal comfort of rural houses in winter in a the Guanzhong region, Shaanxi Province. J. Xi’an Univ. Arch. Tech. Nat. Sci. Ed. 2011, 43, 551–556. [Google Scholar]
- Humphreys, M.A.; Rijal, H.B.; Nicol, J.F. Updating the adaptive relation between climate and comfort indoors; new insights and an extended database. Build. Environ. 2013, 63, 40–55. [Google Scholar] [CrossRef]
- Gou, S.; Li, Z.; Zhao, Q.; Nik, V.M.; Scartezzini, J.-L. Climate responsive strategies of traditional dwellings located in an ancient village in hot summer and cold winter region of China. Build. Environ. 2015, 86, 151–165. [Google Scholar] [CrossRef]
- Indraganti, M.; Rao, K.D. Effect of age, gender, economic group and tenure on thermal comfort: A field study in residential buildings in hot and dry climate with seasonal variations. Energy Build. 2010, 42, 273–281. [Google Scholar] [CrossRef]
- Xiong, Y.; Liu, J.; Kim, J. Understanding differences in thermal comfort between urban and rural residents in hot summer and cold winter climate. Build. Environ. 2019, 165, 106393. [Google Scholar] [CrossRef]
- Hao, S. Research on the Climate Responsive Characteristics of Vernacular Architecture, a Case Study of Southeastern Chongqing. Ph.D. Thesis, Tsinghua University, Beijing, China, 2016. [Google Scholar]
- Kaihoul, A.; Sriti, L.; Amraoui, K.; Di Turi, S.; Ruggiero, F. The effect of climate-responsive design on thermal and energy performance: A simulation based study in the hot-dry Algerian South region. J. Build. Eng. 2021, 43, 103023. [Google Scholar] [CrossRef]
- Gautam, B.; Rijal, H.B.; Imagawa, H.; Kayo, G.; Shukuya, M. Investigation on adaptive thermal comfort considering the thermal history of local and migrant peoples living in sub-tropical climate of Nepal. Build. Environ. 2020, 185, 107237. [Google Scholar] [CrossRef]
- Singh, M.K.; Mahapatra, S.; Atreya, S.K. Adaptive thermal comfort model for different climatic zones of North-East India. Appl. Energy 2011, 88, 2420–2428. [Google Scholar] [CrossRef]
- Khalid, W.; Zaki, S.A.; Rijal, H.B.; Yakub, F. Investigation of comfort temperature and thermal adaptation for patients and visitors in Malaysian hospitals. Energy Build. 2019, 183, 484–499. [Google Scholar] [CrossRef]
- Elangovan, R.; Thakur, G.; Zeleke, B. Thermal adaptation and sustainable housing in cold climates. In Encyclopedia of Renewable and Sustainable Materials; Elsevier: Amsterdam, The Netherlands, 2020; pp. 244–258. [Google Scholar]
- Liu, W.; Zheng, Y.; Deng, Q.; Yang, L. Human thermal adaptive behaviour in naturally ventilated offices for different outdoor air temperatures: A case study in Changsha China. Build. Environ. 2012, 50, 76–89. [Google Scholar] [CrossRef]
- Yao, R.; Liu, J.; Li, B. Occupants’ adaptive responses and perception of thermal environment in naturally conditioned university classrooms. Appl. Energy 2010, 87, 1015–1022. [Google Scholar] [CrossRef]
- Cheng, B.; Fu, Y.; Khoshbakht, M.; Duan, L.; Zhang, J.; Rashidian, S. Characteristics of Thermal Comfort Conditions in Cold Rural Areas of China: A Case study of Stone Dwellings in a Tibetan Village. Buildings 2018, 8, 49. [Google Scholar] [CrossRef]
- Xiong, J.; Lian, Z.; Zhang, H.; Yoshino, H. Correlation between health discomforts and temperature steps in winter of China. Build. Environ. 2017, 114, 387–396. [Google Scholar] [CrossRef]
- Oseland, N.A. A comparison of the predicted and reported thermal sensation vote in homes during winter and summer. Energy Build. 1994, 21, 45–54. [Google Scholar] [CrossRef]
- Wang, D.; Jiang, J.; Liu, Y.; Wang, Y.; Xu, Y.; Liu, J. Student responses to classroom thermal environments in rural primary and secondary schools in winter. Build. Environ. 2017, 115, 104–117. [Google Scholar] [CrossRef]
- Wang, H.; Shi, C.; Li, W.; Wang, L.; Wang, J.; Wang, G.; Hu, S. Field investigation on thermal environment and comfort of people in a coastal village of Qingdao (China) during winter. Build. Environ. 2021, 191, 107585. [Google Scholar] [CrossRef]
- García-Erce, J.A.; Lorente-Aznar, T.; Rivilla-Marugán, L. Influence of gender, age and residence altitude on haemoglobin levels and the prevalence of anaemia. Med. Clin. 2019, 153, 424–429. [Google Scholar] [CrossRef]
- Yang, L.; Fu, R.; He, W.; He, Q.; Liu, Y. Adaptive thermal comfort and climate responsive building design strategies in dry–hot and dry–cold areas: Case study in Turpan, China. Energy Build. 2020, 209, 109678. [Google Scholar] [CrossRef]
Figure 1.
Architectural climate zoning map of China.
Figure 1.
Architectural climate zoning map of China.
Figure 2.
Location of Linyi.
Figure 2.
Location of Linyi.
Figure 3.
Rural residential plan and aerial photos in Linyi.
Figure 3.
Rural residential plan and aerial photos in Linyi.
Figure 4.
Gender and age distribution of interviewees.
Figure 4.
Gender and age distribution of interviewees.
Figure 5.
Field measurement.
Figure 5.
Field measurement.
Figure 6.
Typical layout of vernacular dwellings in Linyi.
Figure 6.
Typical layout of vernacular dwellings in Linyi.
Figure 7.
Site photos of vernacular dwelling.
Figure 7.
Site photos of vernacular dwelling.
Figure 8.
Heating and cooling methods: (a) cooling methods; (b) heating methods.
Figure 8.
Heating and cooling methods: (a) cooling methods; (b) heating methods.
Figure 9.
Traditional cooling and heating system arrangement.
Figure 9.
Traditional cooling and heating system arrangement.
Figure 10.
Schematic diagram of a traditional heating system section.
Figure 10.
Schematic diagram of a traditional heating system section.
Figure 11.
Frequency of space use.
Figure 11.
Frequency of space use.
Figure 12.
Arrangement of the instruments during summer.
Figure 12.
Arrangement of the instruments during summer.
Figure 13.
Arrangement of the instruments during winter.
Figure 13.
Arrangement of the instruments during winter.
Figure 14.
Outdoor environmental parameters in summer.
Figure 14.
Outdoor environmental parameters in summer.
Figure 15.
Outdoor environmental parameters in winter: (a) air temperature; (b) relative humidity.
Figure 15.
Outdoor environmental parameters in winter: (a) air temperature; (b) relative humidity.
Figure 16.
Temperature difference among different rooms.
Figure 16.
Temperature difference among different rooms.
Figure 17.
Distribution of indoor environmental parameters in summer: (a) air temperature; (b) relative humidity.
Figure 17.
Distribution of indoor environmental parameters in summer: (a) air temperature; (b) relative humidity.
Figure 18.
Distribution of indoor environmental parameters for W1: (a) air temperature; (b) relative humidity.
Figure 18.
Distribution of indoor environmental parameters for W1: (a) air temperature; (b) relative humidity.
Figure 19.
Distribution of indoor environmental parameters for W2: (a) air temperature; (b) relative humidity.
Figure 19.
Distribution of indoor environmental parameters for W2: (a) air temperature; (b) relative humidity.
Figure 20.
Distribution of indoor environmental parameters of W3: (a) air temperature; (b) relative humidity.
Figure 20.
Distribution of indoor environmental parameters of W3: (a) air temperature; (b) relative humidity.
Figure 21.
Distribution of indoor temperature data in winter.
Figure 21.
Distribution of indoor temperature data in winter.
Figure 22.
Distribution of indoor relative humidity data in winter.
Figure 22.
Distribution of indoor relative humidity data in winter.
Figure 23.
Satisfaction degree of the indoor thermal environment.
Figure 23.
Satisfaction degree of the indoor thermal environment.
Figure 24.
Distribution of TSV: (a) summer; (b) winter.
Figure 24.
Distribution of TSV: (a) summer; (b) winter.
Figure 25.
Comparison of thermal comfort zone in summer.
Figure 25.
Comparison of thermal comfort zone in summer.
Figure 26.
Comparison of thermal comfort zone in winter.
Figure 26.
Comparison of thermal comfort zone in winter.
Figure 27.
Room-usage frequency and indoor thermal environment.
Figure 27.
Room-usage frequency and indoor thermal environment.
Table 1.
Information of the vernacular dwellings.
Table 2.
Information of the questionnaire respondents.
Table 2.
Information of the questionnaire respondents.
| Gender | Number of Samples | Age |
|---|
| Average Value | Standard Deviation |
|---|
| Male | 63 | 49.5 | 20.2 |
| Female | 72 | 46.3 | 17.3 |
| Total | 135 | 47.7 | 19.4 |
Table 3.
Thermal satisfaction voting questionnaire.
Table 3.
Thermal satisfaction voting questionnaire.
| −1 | −1~0 | 0~1 | 1 |
|---|
| Dissatisfied | Slightly dissatisfied | Just satisfied | Satisfied |
Table 4.
Thermal sensation voting questionnaire.
Table 4.
Thermal sensation voting questionnaire.
| +3 | +2 | +1 | 0 | −1 | −2 | −3 |
|---|
| Hot | Warm | Slightly warm | Neutral | Slightly cool | Cool | Cold |
Table 5.
Information concerning the measurement instruments.
Table 5.
Information concerning the measurement instruments.
| TR-72nw | AZ87786 |
|---|
| Air temperature | Air temperature |
| Air relative humidity | Air Relative humidity |
| Black globe temperature |
![Buildings 12 02139 i006]() | ![Buildings 12 02139 i007]() |
Table 6.
Space classification of vernacular dwellings in Linyi.
Table 6.
Space classification of vernacular dwellings in Linyi.
| Indoor space | Main space | Living room, Main bedroom, Second bedroom |
| Auxiliary space | Spare room, Kitchen, Shower room, Storage room, Toilet |
| Outdoor and semi-outdoor spaces | Outdoor space | Courtyard space |
| Semi-outdoor space | Living space | Liangsha 1, Hall |
| Productive space | Granary, Barn |
Table 7.
Statistics of indoor environmental parameters in summer.
Table 7.
Statistics of indoor environmental parameters in summer.
| | Average | Max | Min |
|---|
| Temperature | 26 °C | 29.4 °C | 24.4 °C |
| RH | 78.5% | 84% | 65% |
Table 8.
Statistics of indoor environmental parameters for W1.
Table 8.
Statistics of indoor environmental parameters for W1.
| | Average | Max | Min |
|---|
| Temperature | 3.3 °C | 11.6 °C | −1.9 °C |
| RH | 58.3% | 74% | 33% |
Table 9.
Statistics of indoor environmental parameters for W2.
Table 9.
Statistics of indoor environmental parameters for W2.
| | Average | Max | Min |
|---|
| Temperature | 3.2 °C | 10.8 °C | −2.3 °C |
| RH | 56.4% | 74% | 34% |
Table 10.
Statistics of indoor environmental parameters for W3.
Table 10.
Statistics of indoor environmental parameters for W3.
| | Average | Max | Min |
|---|
| Temperature | 5.5 °C | 14.5 °C | −1.4 °C |
| RH | 64.6% | 93% | 13% |
| Publisher’s Note: MDPI stays neutral with regard to jurisdictional claims in published maps and institutional affiliations. |
© 2022 by the authors. Licensee MDPI, Basel, Switzerland. This article is an open access article distributed under the terms and conditions of the Creative Commons Attribution (CC BY) license (https://creativecommons.org/licenses/by/4.0/).

 ,
, 


