


Grid-Connected Solar Photovoltaic (PV) System for Covered Linkways

1
SIPM Consultants Pte Ltd., 168 Jalan Bukit Merah, Singapore 150168, Singapore
2
School of Built Environment, University of New South Wales, Sydney, NSW 2052, Australia
*
Author to whom correspondence should be addressed.
Buildings 2022, 12(12), 2131; https://doi.org/10.3390/buildings12122131
Submission received: 13 October 2022
/
Revised: 25 November 2022
/
Accepted: 28 November 2022
/
Published: 5 December 2022
(This article belongs to the Topic Sustainable Built Environment)
Abstract
:Solar photovoltaic (PV) technology is a current trend worldwide, offering many environmental benefits. With the flagship SolarNova Programme in Singapore, solar PV has gained its momentum. However, it remains important to explore new avenues to introduce solar PV in the urban settings. The housing development board (HDB) green towns promote sustainable living. Therefore, introducing solar PV is essential. This research study aims to propose and conduct an economic evaluation on solar PV for the HDB’s covered linkways. HDB covered linkways connect buildings within the green towns. Hence, installing solar PV systems in covered linkways facilitates to self-produce required energy and export extra electricity to the grid. This research study used PVWatts calculator to calculate the power generation. A thin film solar PV is used for the study with fixed array type and azimuth is 180°. Four solar PV systems, namely (1) 4 kW, (2) 5 kW, (3)10 kW, and (4) 20 kW, were evaluated in this research study. The initial cost ranges from S$7000 to S$38,000 for the four types. For 4 kW and 5 kW systems, the payback period is 6.22 years. The highest payback period is for a 20-kW system, which is 7.4 years. The 10-kW system generates a significant portion of the electricity requirements, and the payback period is 6.04 years. This research contributes to the solar PV domain by proposing a novel grid-connected solar PV system for covered linkways while identifying the most cost-effective solution.
1. Introduction
Solar power generation is a useful substitute to non-renewable power generation. Singapore has the annual irradiance level of 1580 kWh/m2 [1], underlining the potential of solar energy generation as an alternative to non-renewable energy generation. The grid-connected installed capacity of the solar photovoltaic (PV) systems in Singapore grew significantly from 10.1 MWp in 2012 to 384.1 MWp as at end of first quarter of 2020 [2]. In 2020 Solar had an average growth rate of about 140 Mega-Watt, Alternating Current (MWac) per year to reach 1.5 GWp by 2025 [3]. At the conclusion of the first quarter of 2020, Singapore had a total of 4116 solar PV installations [2]. Despite the increase in solar PV installations, natural gas is still the main power producer, accounting for 95.6% of total electricity generation in Singapore [2].
Solar energy is one of the most abundant natural sources that can be tapped for energy needs. To achieve a more sustainable future, the Singapore government has an initiative to install solar panels on the rooftops of buildings developed by the Housing and Development Board (HDB) in 2008. To maximize the solar generation, the HDB and Economic Development Board (EDB) launched the SolarNova Programme to accelerate the deployment of solar panels [4]. HDB buildings play one of the main roles in harvesting solar energy within Singapore. A great potential exists to integrate both roof and façade PV in existing HDB buildings. The dependency on natural gas cannot be effectively reduced by relying exclusively on rooftop PV systems [5]. Approximately 1 million flats scattered throughout 24 towns in Singapore’s existing HDB buildings accommodate 80% of the population [6]. Through the HDB green town initiative, the HDB is aiming to converting its towns into more livable and environmentally sustainable by the year 2030 [7]. The 10-year plan intends to expand pilot projects and test novel solutions in order to reduce energy consumption, recycle rainwater, and cool HDB towns. HDB towns include linkways to provide external circulation for pedestrians. The Land Transport Authority (LTA) initiated covered linkways in 2000 to improve pedestrians’ experience by providing network of covered walkways connecting transportation hubs and amenities [8]. To harmonize with LTA’s covered linkway requirements, the HDB modified the covered linkway designs for the public housing complexes. Covered linkways have horizontal roofs, providing the potential of integrating solar PV panel for electricity generation. Owing to the fact that covered linkways must follow the design principles given in the ‘Singapore walking and design guide’ [8], this research conducted an economic analysis on the potential of using PV panels to HDB’s covered linkways. The remainder of the paper is structured as follows. A literature review that discusses solar panel technology, environmental benefits, and a brief introduction to PV markets worldwide is presented in Section 2. Section 3 elaborates the solar PV in covered linkways in Singapore. Section 4 and Section 5 elaborate the methodology and calculations probing into power generation and cost calculations followed by a sensitivity analysis. Section 6 is the discussion and Section 7 draws the conclusions and future research directions.
2. Literature Review on Solar Photovoltaics Technology
Using renewable resources for energy generation is no longer a luxury. Technological advancements also support the use of renewable sources for energy generation. As energy can be harnessed directly from the sun, solar energy is one of the promising renewable resources that use to produce electricity [9]. There are two methods that use solar energy in electricity generation, namely (1) solar PV and (2) concentrated solar power (CSP). CSP typically produces electricity for large-scale power plants by using mirrors to concentrate sun rays [9]. Solar PV systems are usually installed in rooftops of homes and commercial buildings and converts solar radiation from the sun into electricity [10]. Solar PV systems are more flexible than CSP as they can be combined with commercial scale, rooftop, building facades, or arranged in a smaller configuration. The significant advantage of solar PV system is absorbing abundant and free energy from the sun. Thus, it is one of the promising renewable energy technologies to achieve sustainable building design [11].
In general, PV systems are either off-grid applications or on-grid/grid-connected applications. Economic incentives from respective countries and the rapid technological advances permit the use of grid connected solar PV plants in a simple, efficient, and profitable manner [12]. In a grid connected system, an inverter is used to connect and synchronize a PV array to the grid, converting the direct current (DC) electricity to the grid’s alternating current (AC) electricity at the grid voltage level. Hence, there is no need for additional energy storage. For such a grid connected system, the grid serves as the storage medium, supplying energy to the grid as long as there is sufficient sunshine [13]. Grid-connected PV systems can be mounted on the building façade and rooftops of buildings [14], as well as shades of parking lots or shelters [15]. These systems facilitate the reduction of energy costs and generate profit by exporting excessive energy to the grid. However, there are several disadvantages of being grid-connected such as higher upfront cost and inability to store electricity [16].
Off-grid is also known as standalone solar PV systems. The standalone solar PV system can function without relying on the grid. Therefore, a storage battery is needed [17]. PV and batteries should be properly sized during the initial design of a grid connected solar PV system with battery storage to achieve efficiency [18]. Additional energy generated during times with no or low load charges the battery, but it could easily be damaged by improper charging control that results in overcharging [19]. According to Huang et al. [19], this will decrease the electrical supply’s service time and storage energy capacity. Off-grid systems, being completely independent from the grid, provide the opportunity to store energy and great support in terms of expandability as per the energy requirement. However, there are additional costs for purchasing, maintaining and replacing batteries [20].
Solar PV systems can be mounted on facades or rooftops in buildings, with the former being the more popular option [21]. Solar PV panel mounting is one of the potential applications for the roof. Vacuum-based PV thermal collectors can also be utilized to efficiently produce both electrical and thermal energy at the same time. Meanwhile, PV thermal collectors with a vacuum layer can minimize heat loss through the PV collector’s surface [22]. Furthermore, solar PV systems are being used with other energy sources, such as wind turbines and fuel cells. Artificial ecosystem optimization is used in these configurations to improve performance and, as a result, to optimize the whole system’s cost and accuracy [23]. Additionally, solar PV systems can be connected with other energy sources, such as thermal, hydro, and wind systems, in transmission networks. As a result, it is possible to optimize the power flow while taking solar radiation and wind speed uncertainty into account [24]. Accordingly, installing solar PV in buildings enables them to produce the electricity they need.
2.1. Non-Quantifiable Environmental Benefits
Solar PV not only provides financial benefits, it also generates significant environmental benefits as well. According to Walters et al. [25] solar PV is influenced by complex technical, economic, and social factors. It also promotes the use of clean energy by reducing the use of traditional fossil fuel energy, which has growing negative environmental influences, such as air pollution and global warming [26]. With its high modularity, no additional resource requirement, and low maintenance, solar PV systems are gaining popularity at present [13]. Singapore is a tropical urban city/country where the burning of natural gas accounts for 95% of electricity generation to meet its energy demand [5]. The characteristics of tropical regions, including year-around high humidity and temperature, enable the use of solar energy [11], and it also reduce the use of non-renewable resources in electricity generation. Therefore, Singapore is an ideal place for solar PV. The environmental, economic, and social facets of urban sustainability might be significantly improved by producing clean energy at the point of consumption. It could also lessen transmission losses [27].
Due to several worldwide challenges, such as global warming, with policies to reduce carbon emissions and increased environmental awareness during the last decade, there has been a strong rising trend in renewable energy investments, particularly in solar energy [28,29]. Solar energy sits well with the environmental requirements and declining trend in cost is also a significant benefit. Solar energy is one of the commonly used renewable energy sources worldwide due to its environmental benefits [30]. Overall, there are many significant benefits that are applicable to PV technology in Singapore. However, there are challenges associated with the transitions and implementation process owing to the technical, social and economic aspects [31]. The build quality of solar PV systems is crucial for enduring higher performance [32]. From an economic perspective, solar PV implementation in Singapore is influenced by the balance between the price for electricity and upfront cost of solar power [5]. Further, in Singapore, the application of solar PV systems is affected by weather conditions, such as cloud cover and urban shading issues [33].
2.2. PV Market Worldwide
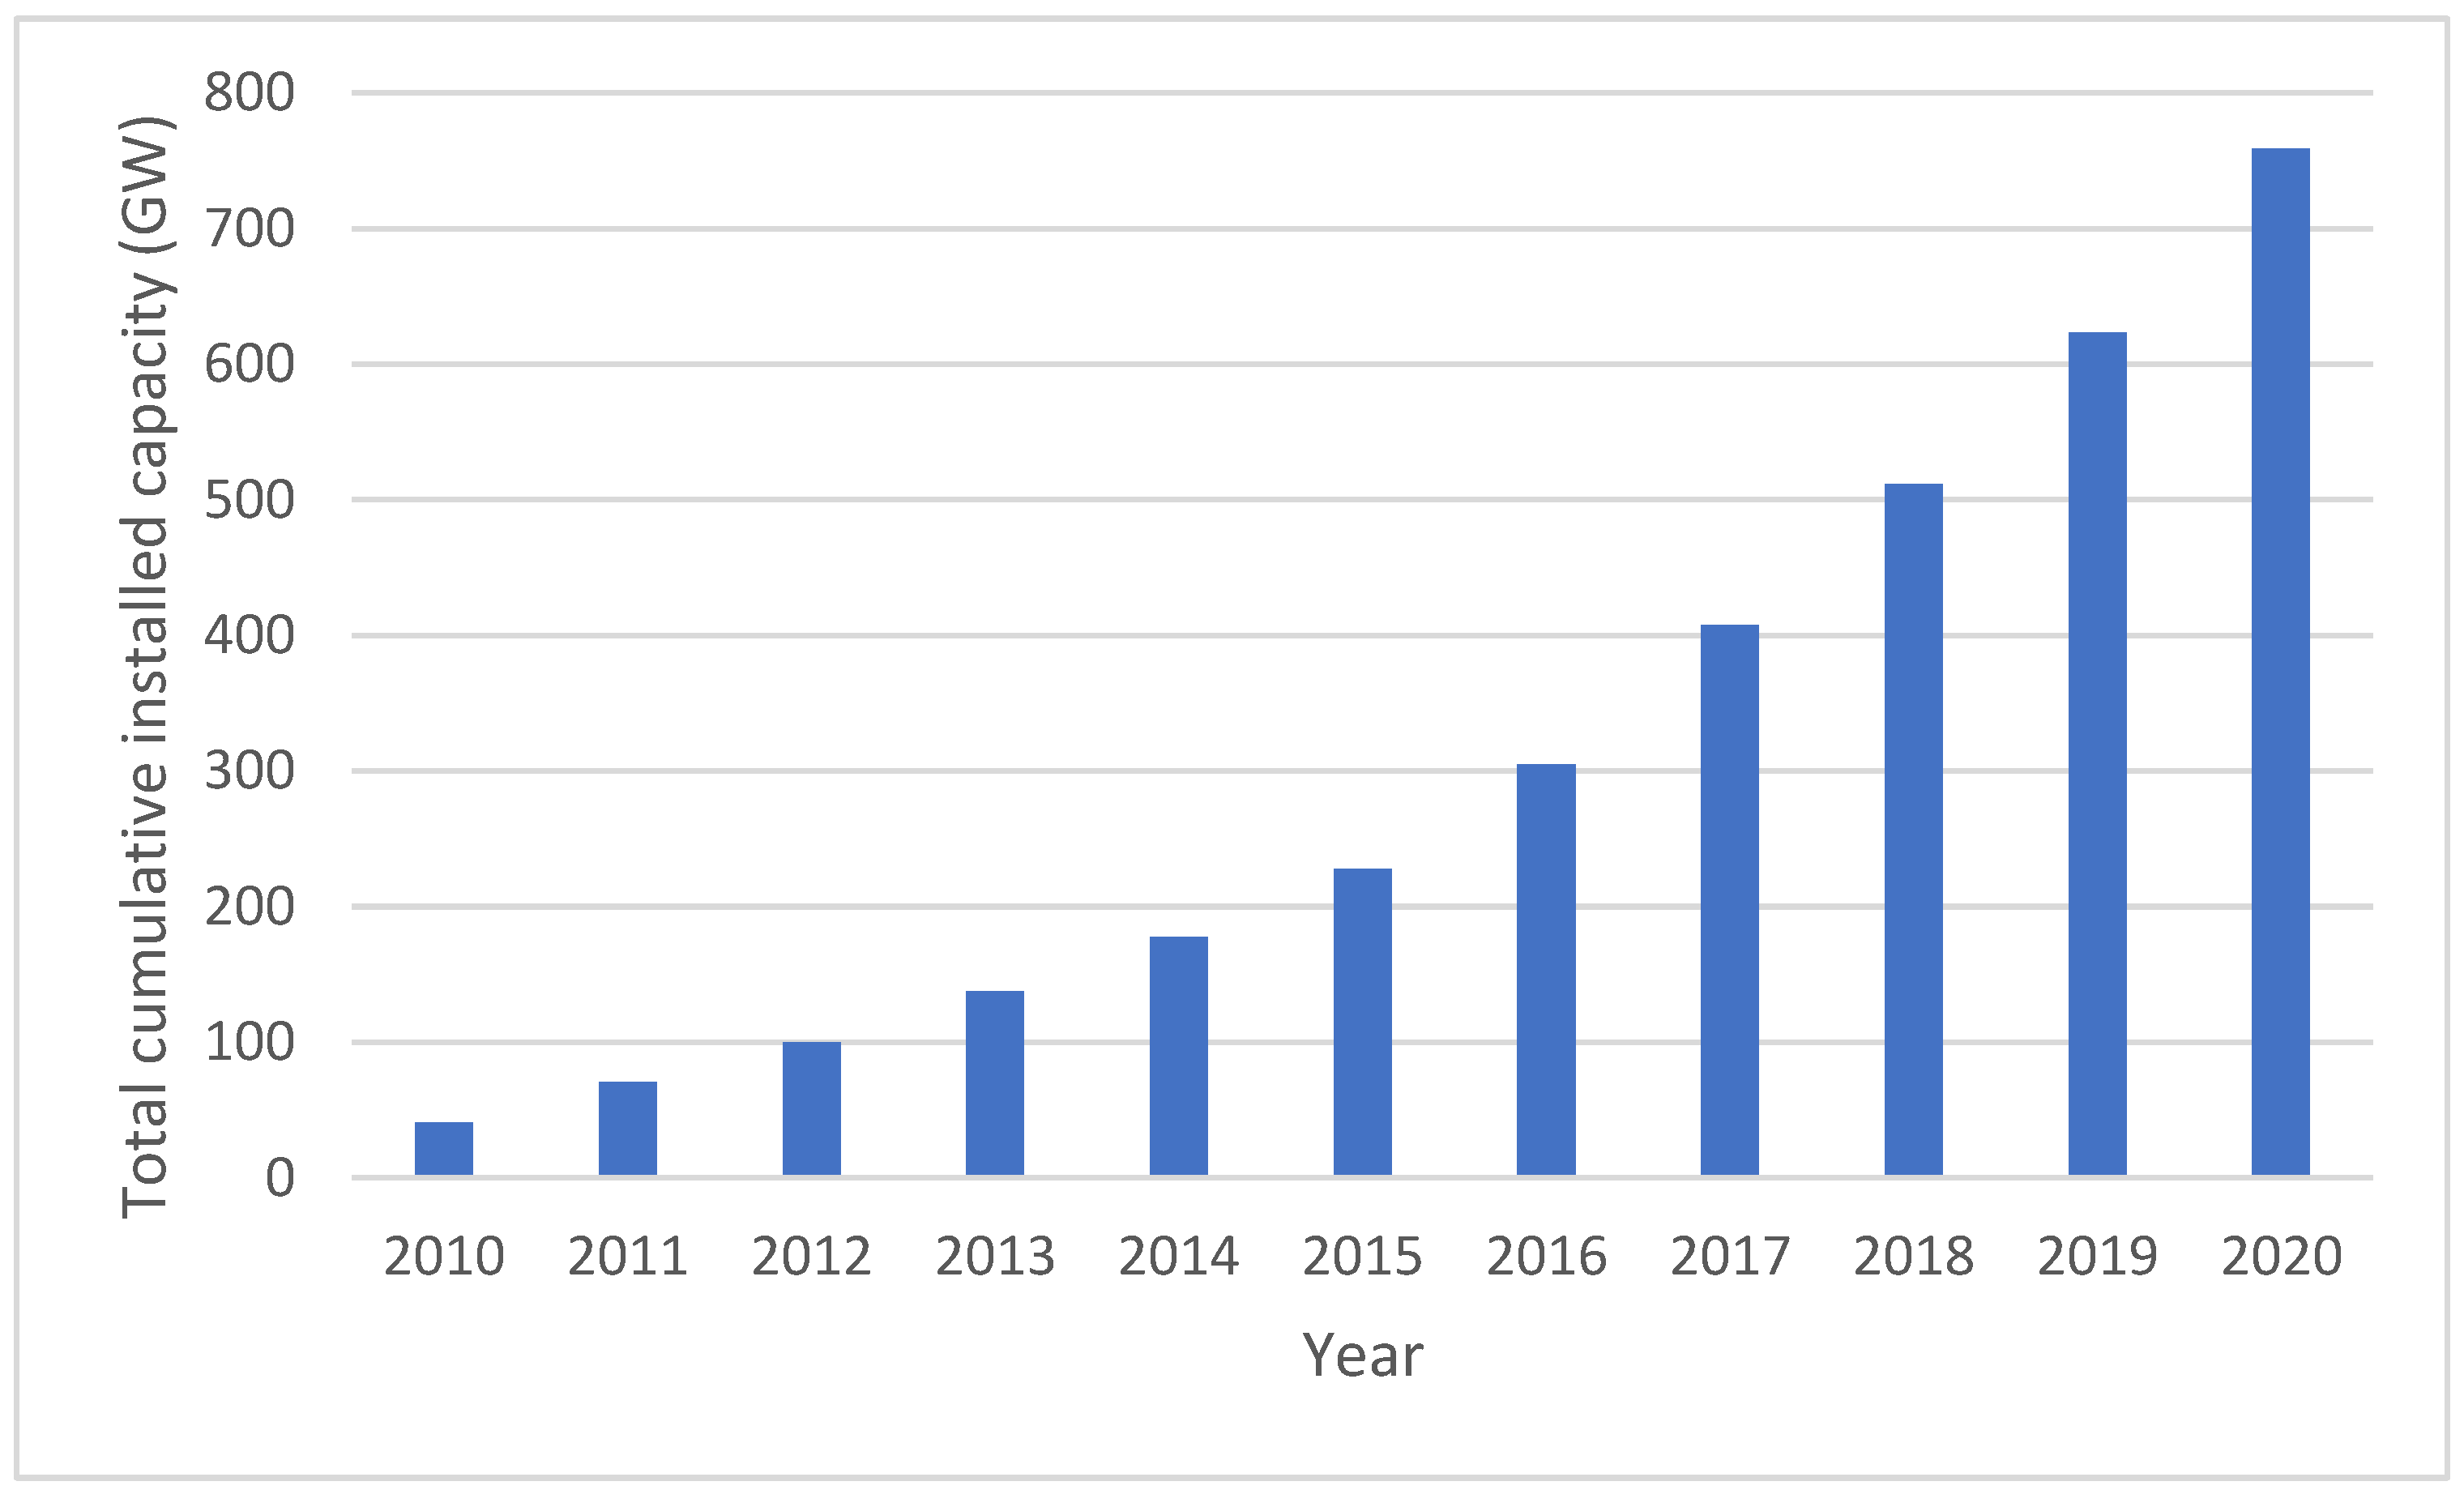
The use of solar PV has improved significantly over time in many countries [34]. Figure 1 reports the evolution of cumulative PV installations. According to Figure 1 there is an exponential growth in PV installation within the last decade. There are front runners in PV installations. According to International Energy Agency [35], China continues to lead with a cumulative capacity of 253. GW, followed by the European Union (151.2 GW), the USA (93.2 GW), Japan (71.4 GW) and India (47.4 GW). In 2020, Australia reached 20.2 GW cumulative installations, Vietnam 16.4 GW and Korea 15.9 GW and in the European Union, Germany leads with 53.9 GW, followed by Italy (21.7 GW), Spain (12.7 GW), France (10.9 GW), and the Netherlands (10.2 GW) [35].
China is the global leader in PV installation and Asia dominates the PV market [35]. Although major Asian markets, e.g., Japan, China, Taiwan, Korea, and Malaysia, are already established, steady development in other markets, such as Singapore, Thailand, Indonesia, and the Philippines, has been inconsistent or slow over the years [35].
Although China is the market leader in PV installations, Australia records the highest PV installations per capita with 644 W per capita within several years [36]. Australia offers rebates and government subsidies for PV installations [26,36]. According to the International renewable energy agency [9], Singapore has installed 329.3 MW capacity PV panels. Meanwhile, the capacity of grid connected solar PV systems is increasing in Singapore which has risen to 350 MWp from 10.1 MWp during 2012–2020 [16].
To achieve a more sustainable future, the Singapore government has initiated a programme to install solar panels on HDB rooftops in 2008. The SolarNova Programme is one of the major initiatives introduced to accelerate the deployment of solar panels [4]. Apart from the rooftop PV panels, setting up floating solar panels is another way to enhance the solar power capacity in Singapore. Tengeh Reservoir in Tuas has 1 hectare containing 10 different solar testbed photovoltaic systems [37]. Along with ground-mounted and rooftop PV, floating solar PV is now regarded as the third pillar of the solar industry [38]. Floating PV presents several benefits, especially for nations such as Singapore that have water bodies but limited land space [38].
The use of solar PV in covered linkways enables them to generate their own electricity and lessen the need for grid power. In addition, it supports a built environment that is sustainable. However, it is important to perform an economic evaluation prior to initiating such a project because the economic benefits may change with the rising tariff rates. Therefore, the novelties of this research can be summarized in three points.
- Identify the applicability of installing solar PV systems on covered linkways.
- An economical evaluation of different solar PV systems for covered linkways.
- Explore the impact of gross cost savings, net cost savings, and payback period with the fluctuation of tariff rates.
Based on these novelties, the contributions of this study can be summarized as follows:
- Promote solar power in covered linkways to reduce the use of non-renewable energy sources in public infrastructure.
- Determine the most economically feasible solar PV option for covered linkways.
- Demonstrate the impact of tariff rate changes on expected cost savings in different solar PV systems.
3. Solar PV in Covered Linkways in Singapore
The adoption of grid-connected solar PV system on covered linkways is a practical method in Singapore. Covered linkways are shelters that cover footpaths to protect pedestrians from the radiant heat and rainwater while people travel one place to another. Covered linkways have are classified into three types as follows [8].
- (1)
- Standard covered linkways: used when there is high pedestrian traffic, such as linkways connecting to mass transport hubs.
- (2)
- HDB’s covered linkways: used in public housing estates and expected to blend in with the environment and attain aesthetic harmony between precincts.
- (3)
- High covered linkways: positioned across minor roads and vehicular accesses to connect low covered linkways on both sides to offer weather protection for cyclists and pedestrians.
This study focuses on implementing a grid-connected solar PV system to HDB’s covered linkways in housing precincts. The implementation of such a solar PV system offers several benefits. First, grid-connected systems support for self-production of electricity need in a building as well as export extra energy to the grid, especially under tropical conditions [39]. Second, grid-connected systems can be implemented on vertical surfaces (e.g., rooftops) and horizontal surfaces such as facades, where solar irradiation is higher in former than latter [5]. Therefore, the installation of solar PV systems in covered linkways in HDB buildings in Singapore offers a great opportunity to produce electricity and reduce the reliance on natural gas for power generation. Third, the installation of solar PV systems in covered linkways could help to promote a sustainable built environment by reducing the dependency on fossil fuels, reducing carbon emissions [16]. Moreover, these grid-connected solar PV systems can be either building integrated photovoltaic (BIPV) or building applied photovoltaic (BAPV) [40]. In this study, it is proposed to adopt BAPV technology for covered linkways. Although the BIPV approach has several benefits such as aesthetically pleasantness, durability, and ability to integrate to the building structure, BAPV provides the opportunity to install at certain tilt angles and module orientations based on local weather conditions [41,42]. In addition, BIPV systems have some drawbacks including uncertainty in cost-effectiveness, deficiencies in building standards (e.g., fire safety standards), and lower solar irradiation [16]. Kumar et al. [41] found that BAPV systems perform better than BIPV systems for tropical conditions while offering enhanced annual energy production, improved performance ratio, and reduced loss.
The material used in the roof panels of the covered linkway is light-weight honeycomb aluminum. For the simplicity of maintenance, columns are painted with anti-stick paint. There are two design principles for HDB’s covered linkways as follows [8];
- (1)
- Shallow roof profile and neutral color: Allow the buildings and surrounding landscape to take center stage. The use of a shallow roof profile and neutral color (i.e., light grey/mid grey/off-white) is recommended.
- (2)
- Columns on one side and lightweight roofing and structures: For a more porous walking experience, columns are to be on only one side of the covered linkways, and lightweight roofing and structures are to be used.
LED lighting is fixed to the covered linkways, and the lights and lighting fittings are enclosed inside the roof rafters to minimize any damage. Covered linkways have a minimum average illuminance (at floor level) of 10 lux and illuminance uniformity of 0.25 [8].
A significant influence on the ability to supply energy is caused by total or partial shading situations [43]. There are basically two types of shading which are occasional shading and recurring shading. Occasional shading is caused by leaves, bird droppings and other dirt, while recurring shading can be caused by parts of the building such as unusual roof structures, trees, etc. [44]. As the HDB’s covered linkways are around or near the HDB buildings, there is greenery such as trees surrounding the building. Therefore, HDB’s covered linkways will encounter shading issues. To minimize the effect of shading, designing the solar PV system with optimum arrangement of modules, the shade effect can be mitigated by physically positioning the modules in a more appropriate arrangement [44]. In addition, system losses in solar PV systems are caused by a variety of factors, such as shade, soiling, wiring, and connections. The total loss is determined not as a sum of individual losses, but by multiplying the reduction due to each loss Li (%), as shown in the equation below [45].
Singapore is a tropical country located closer to the equator and has abundant solar radiation throughout the year. The solar resource is at a typical peak level during daytime, especially at noon, with a high share of diffuse radiation (approximately 55%) and high level of variability due to the regularly shifting cloud cover [46]. The average annual solar irradiance of Singapore is 1580 kWh/m2/year [47]. Recent technological advancements in the field of PV canopies provide significant opportunities to exploit open spaces, such as car parks, highways, or even the space between building blocks [46], such as covered linkways. The built-up area of Singapore is approximately 8% of the total land area, of which 25% is HDB blocks (approximately 14 km2). Introducing solar PV to the covered linkways connecting HDB buildings blocks is therefore worthy of investigation. The overall power output of each solar PV system was determined using the National Renewable Energy Laboratory’s PVWatts online calculator. This tool estimates the monthly and annual power production of a solar PV system by taking into account variables, such as PV system size, module type, array type, system losses, and tilt and azimuth angles [45].
Solar PV System on HDB’s Covered Linkways in Tropical Climate
Solar cells are the critical components of a PV system, and the economic benefits of PV are dependent on their efficiency in harvesting solar energy. Solar cells in any number and combination can be connected in series or parallel [48]. PV cells are built of light-sensitive semiconductor materials that use photons to dislodge electrons to drive an electric current. There are two broad categories of technology used for PV cells which are crystalline silicon or thin film [49]. Crystalline silicon PV cells can be classified according to two subcategories, namely poly-crystalline and mono-crystalline. Thin film PV cells include four types, namely (1) Copper Indium Gallium Selenide (CIGS), (2) Cadmium Telluride (CdTe) (3) Amorphous Silicon (a-Si), and (4) Tandem (a-Si/microcrystalline). The basic raw material for crystalline cells is ultra-pure silicon, namely silicon wafers that are typically 150–200 microns thick. Thin film is made by placing layers of semiconductor material 0.3–2 μm thick onto glass or stainless-steel substrates. Because the semiconductor layers are so thin, raw material costs are substantially lower than capital equipment and processing expenses [49].
Table 1 reports the module efficiencies of various PV modules. A thin-film amorphous silicon PV array offers relatively low efficiency and requires close to twice the space of a crystalline silicon PV array (refer Table 1).
However, given the tropical climate in Singapore, solar PV performance is another important factor to take into consideration. It also is known as the temperature coefficient of power. As cell temperature rises, PV cell performance decreases [49]. Table 2 reports the temperature coefficients of various PV cell technologies.
As reported in Table 2, thin-film technologies have a lower negative temperature coefficient compared to crystalline technologies. Solar cell temperatures can reach 60 °C in a tropical region such as Singapore, where the average daytime temperature is above 28 °C. Thin film CIGS can be used in the PV system for HDB’s covered linkways. Table 3 reports the PV system information for the proposed solar PV in HDB’s covered linkways.
4. Calculations of Solar Power Generation
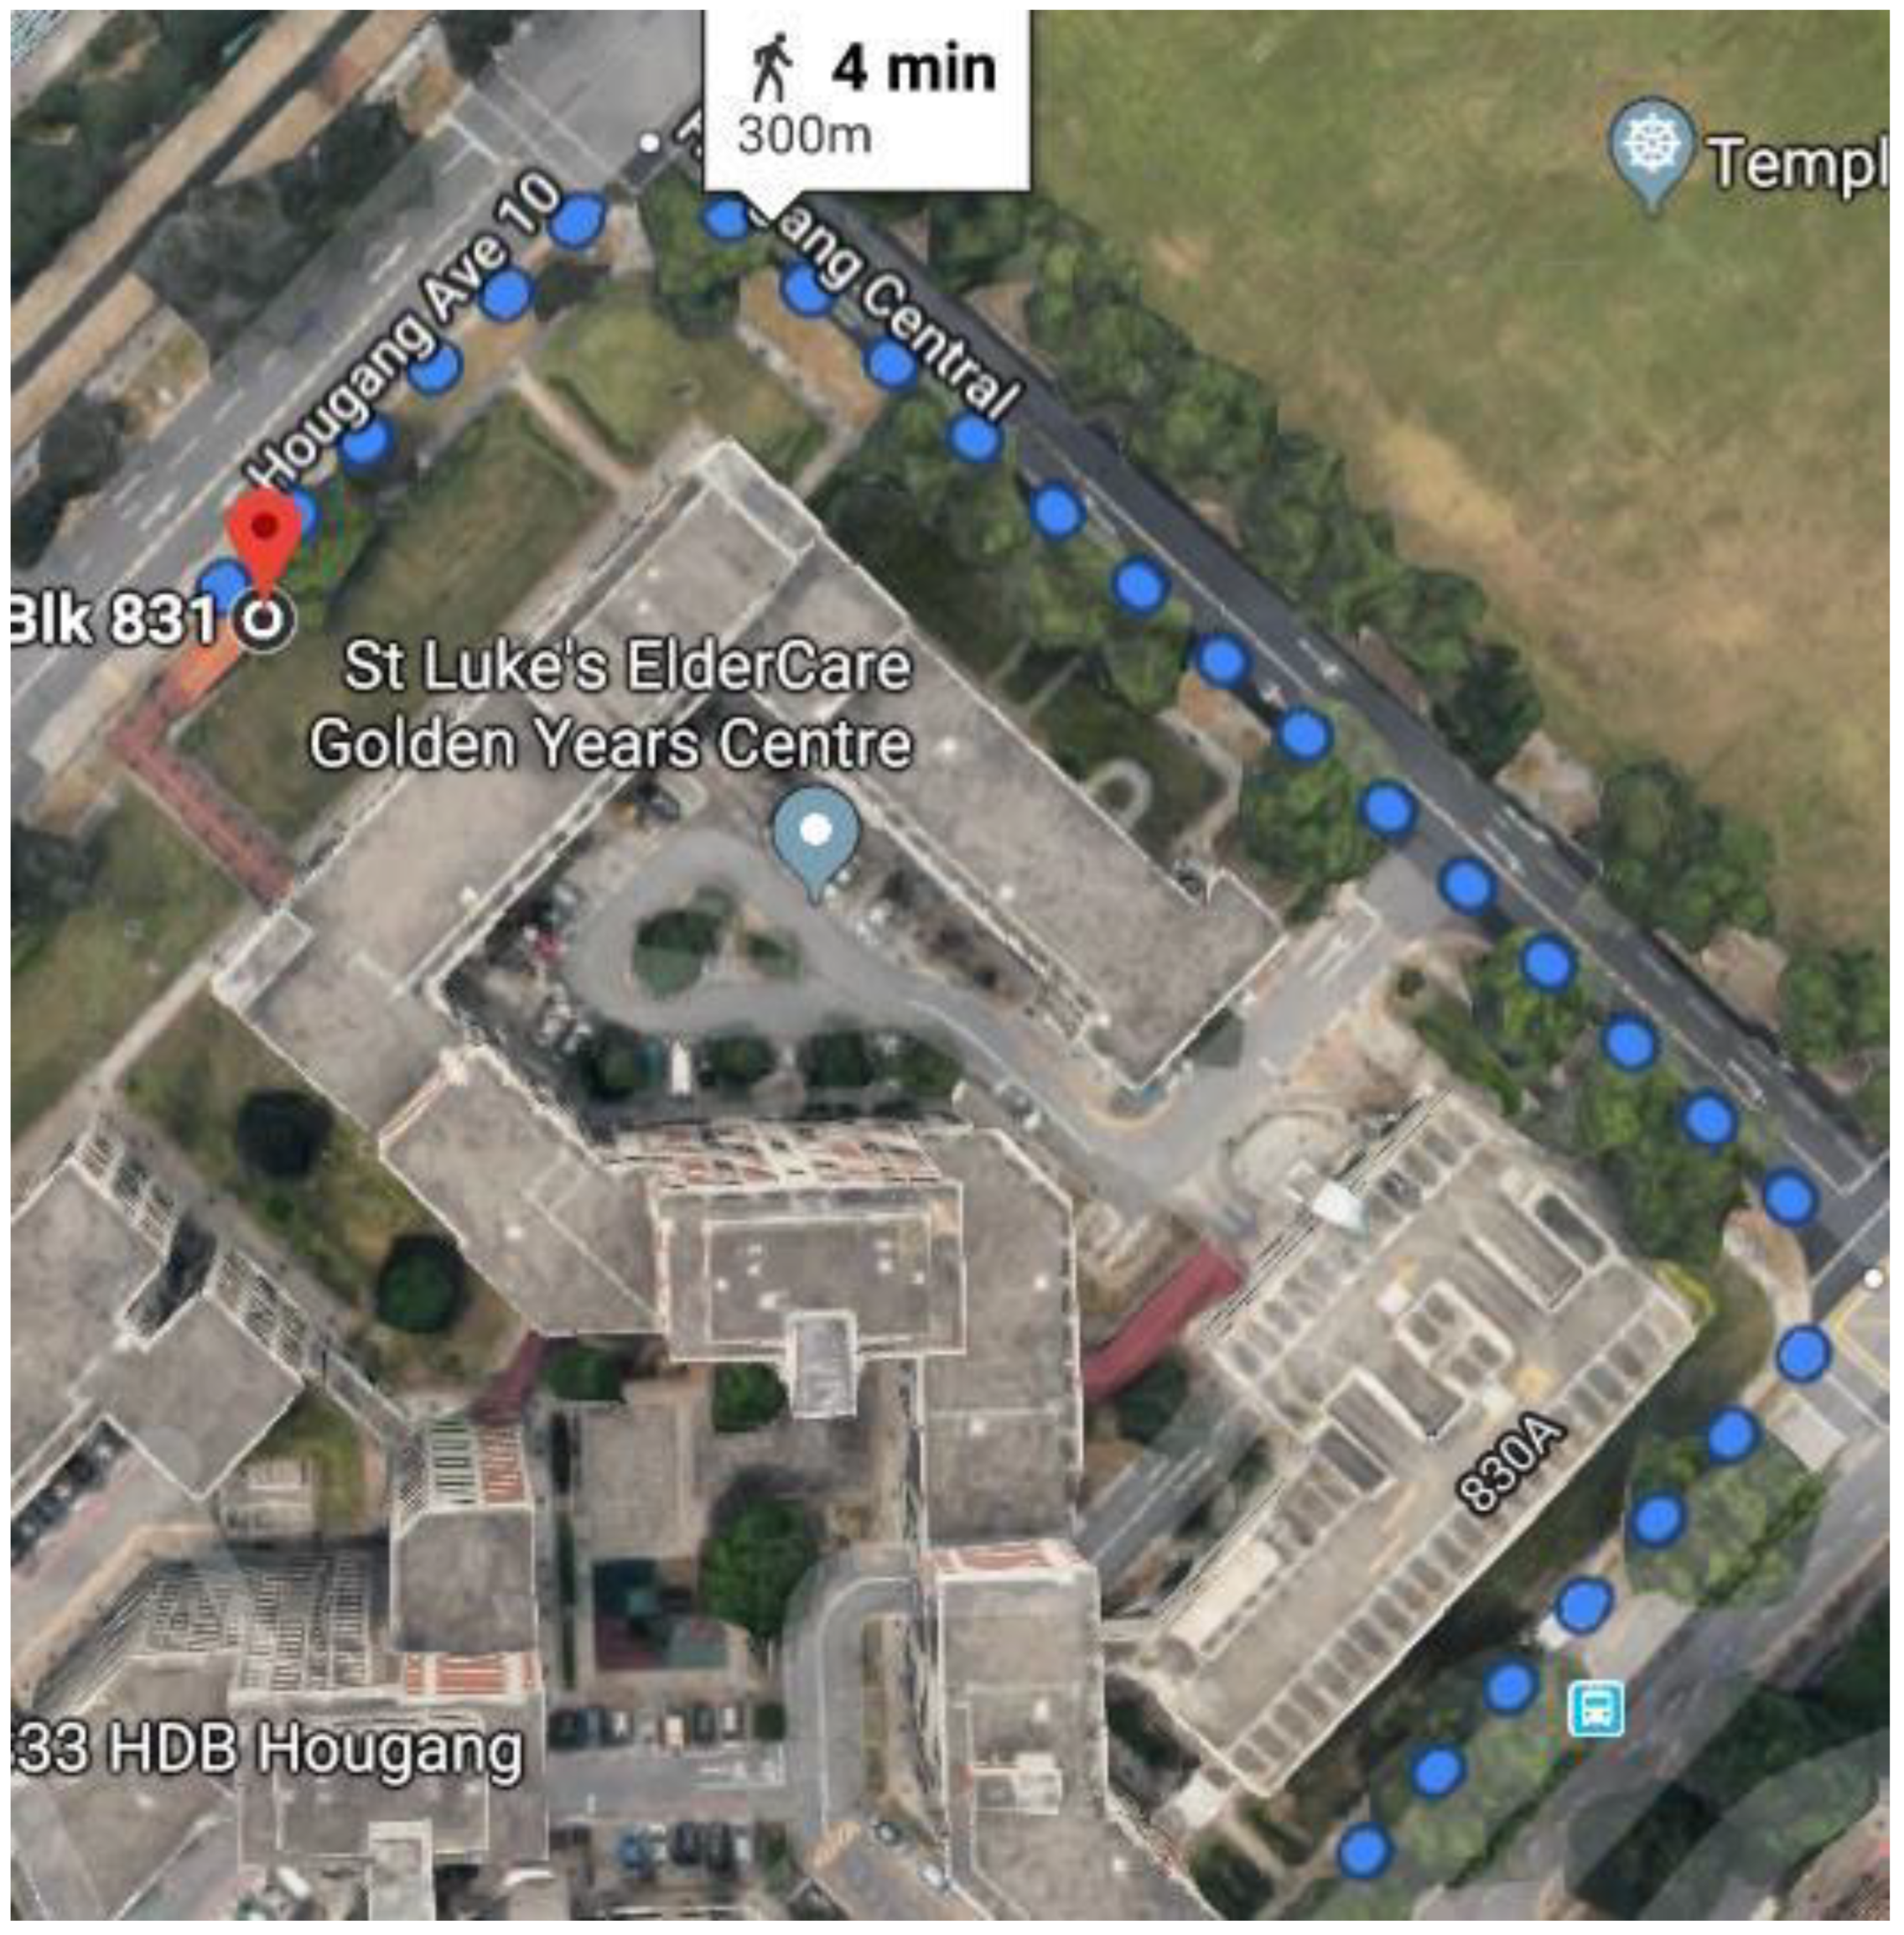
To calculate the cost of installing PV panels into HBD’s covered linkways, researchers identified a covered link way located at Block 830A, 830A Hougang Central to Block 831. Figure 2 illustrates the HDB’s covered linkway in blue.
To determine the length of the specific HDB’s covered linkway, researchers used Google Maps. The length of the covered linkway used for this research study is approximately 300 m. As the specific HDB’s covered linkway is generally surrounded by trees, there are three locations to install the grid-connected solar PV system on the covered linkway, which offer minimum shading effect from the trees. Figure 3 provides images of the HDB’s covered linkways in these three locations.
Electricity tariffs are regulated by the Energy Market Authority (EMA) and revised quarterly to reflect the actual cost of electricity. Consumers in Singapore can purchase electricity through SP Group, a market support services company regulated by the EMA. The electricity tariff rate is $0.2544/kWh [54].
To calculate the power output by the PV system, this research adopted the PVWatts online calculator provided by the National Renewable Energy Laboratory [45]. This online calculator is adopted by many research studies to calculate the power output [55]. To calculate the PV output, initially, it is essential to estimate the system losses. The parameters in the system losses percentage are estimated based on the location by an online calculator. The location is from Block 830A to 831, Hougang Central, Singapore. The figures used to calculate the system loss are given in Table 4. Based on the calculations, estimated systems losses are approximately 14.08%.
The width of the covered linkway is 3 m as given in the design guide [8]. This research considered a linkway of 300 m length. The approximate area is 900m2 (i.e., 3 × 300 = 900 m2). The maximum allowable power budget for covered linkways in Singapore is 4 W/m2 [49]. Therefore, the minimum system size is 3.6 kW (i.e., 900 m2 × 0.004 kW/m2).
This research study calculated data for four system sizes, namely (1) 4 kW system, (2) 5 kW system (3) 10 kW system, and (4) 20 kW system.
5. Cost Implications from Solar PV in Covered Linkways
The cost of a solar PV system depends on many factors, including system configuration, equipment options, labor cost, and financing cost [49]. The installation cost for 4kW solar system is approximately S$7000–8000. However, this cost depends on the solar PV provider. The initial cost of 5 kW, 10 kW, and 20 kW solar PV panels are S$10,000, S$19,500, and S$38,000 respectively [56]. Solar PV installations have low operating expenses, but the annual maintenance cost after the warranty term might range from 0.5% to 1% of the initial cost [49]. Warranty period is another aspect in solar PV installation. According to the Energy Market Authority and Building Construction Authority [49], most manufacturers warrant at least 90% of the minimum rated output for 10 years, and 80% of the minimum rated output for 20–25 years.
Usually, the covered linkway lighting will be on from 6.30 pm to 6.30 am, and thus the total working hours are 12 h in total daily. The required power generation to light up the linkway is 3.6 kW. Therefore, daily power generation requirement is 43.2 kWh (i.e., 3.6 kWh × 12 h = 43.2 kWh). The yearly required electricity generation is 15,768 kWh (i.e., 43.2 kWh × 365 days = 15,768 kWh). The electricity tariff rate is $0.2544/kWh [54].
If there is an excess electricity generated by the solar PV systems, consumers may sell the excess generated. According to the Energy Market Authority [57], there are three options to sell back the excess energy, namely (1) register with SP Services (SPS) under the Simplified Credit Treatment (SCT) or Enhanced Central Intermediary Scheme (ECIS), (2) directly register with the Energy Market Company as a Market Participant, or (3) appoint another Market Participant (not applicable to residential consumers). In this research the solar system size is less than 1 mW, as a result Enhanced Central Intermediary Scheme (ECIS) scheme is used to sell the excess electricity generation [57]. Under the ECIS scheme, consumers can sell any surplus energy to the market will be paid at the prevailing half-hourly wholesale energy prices. The lowest half hourly wholesale energy prices vary from 6.87 cents/kWh–16.18 cents/kWh [58]. An average of 11.525 cents/kWh is considered for the calculations. Table 6 reports a detailed analysis on the different solar PV systems.
Sensitivity Analysis
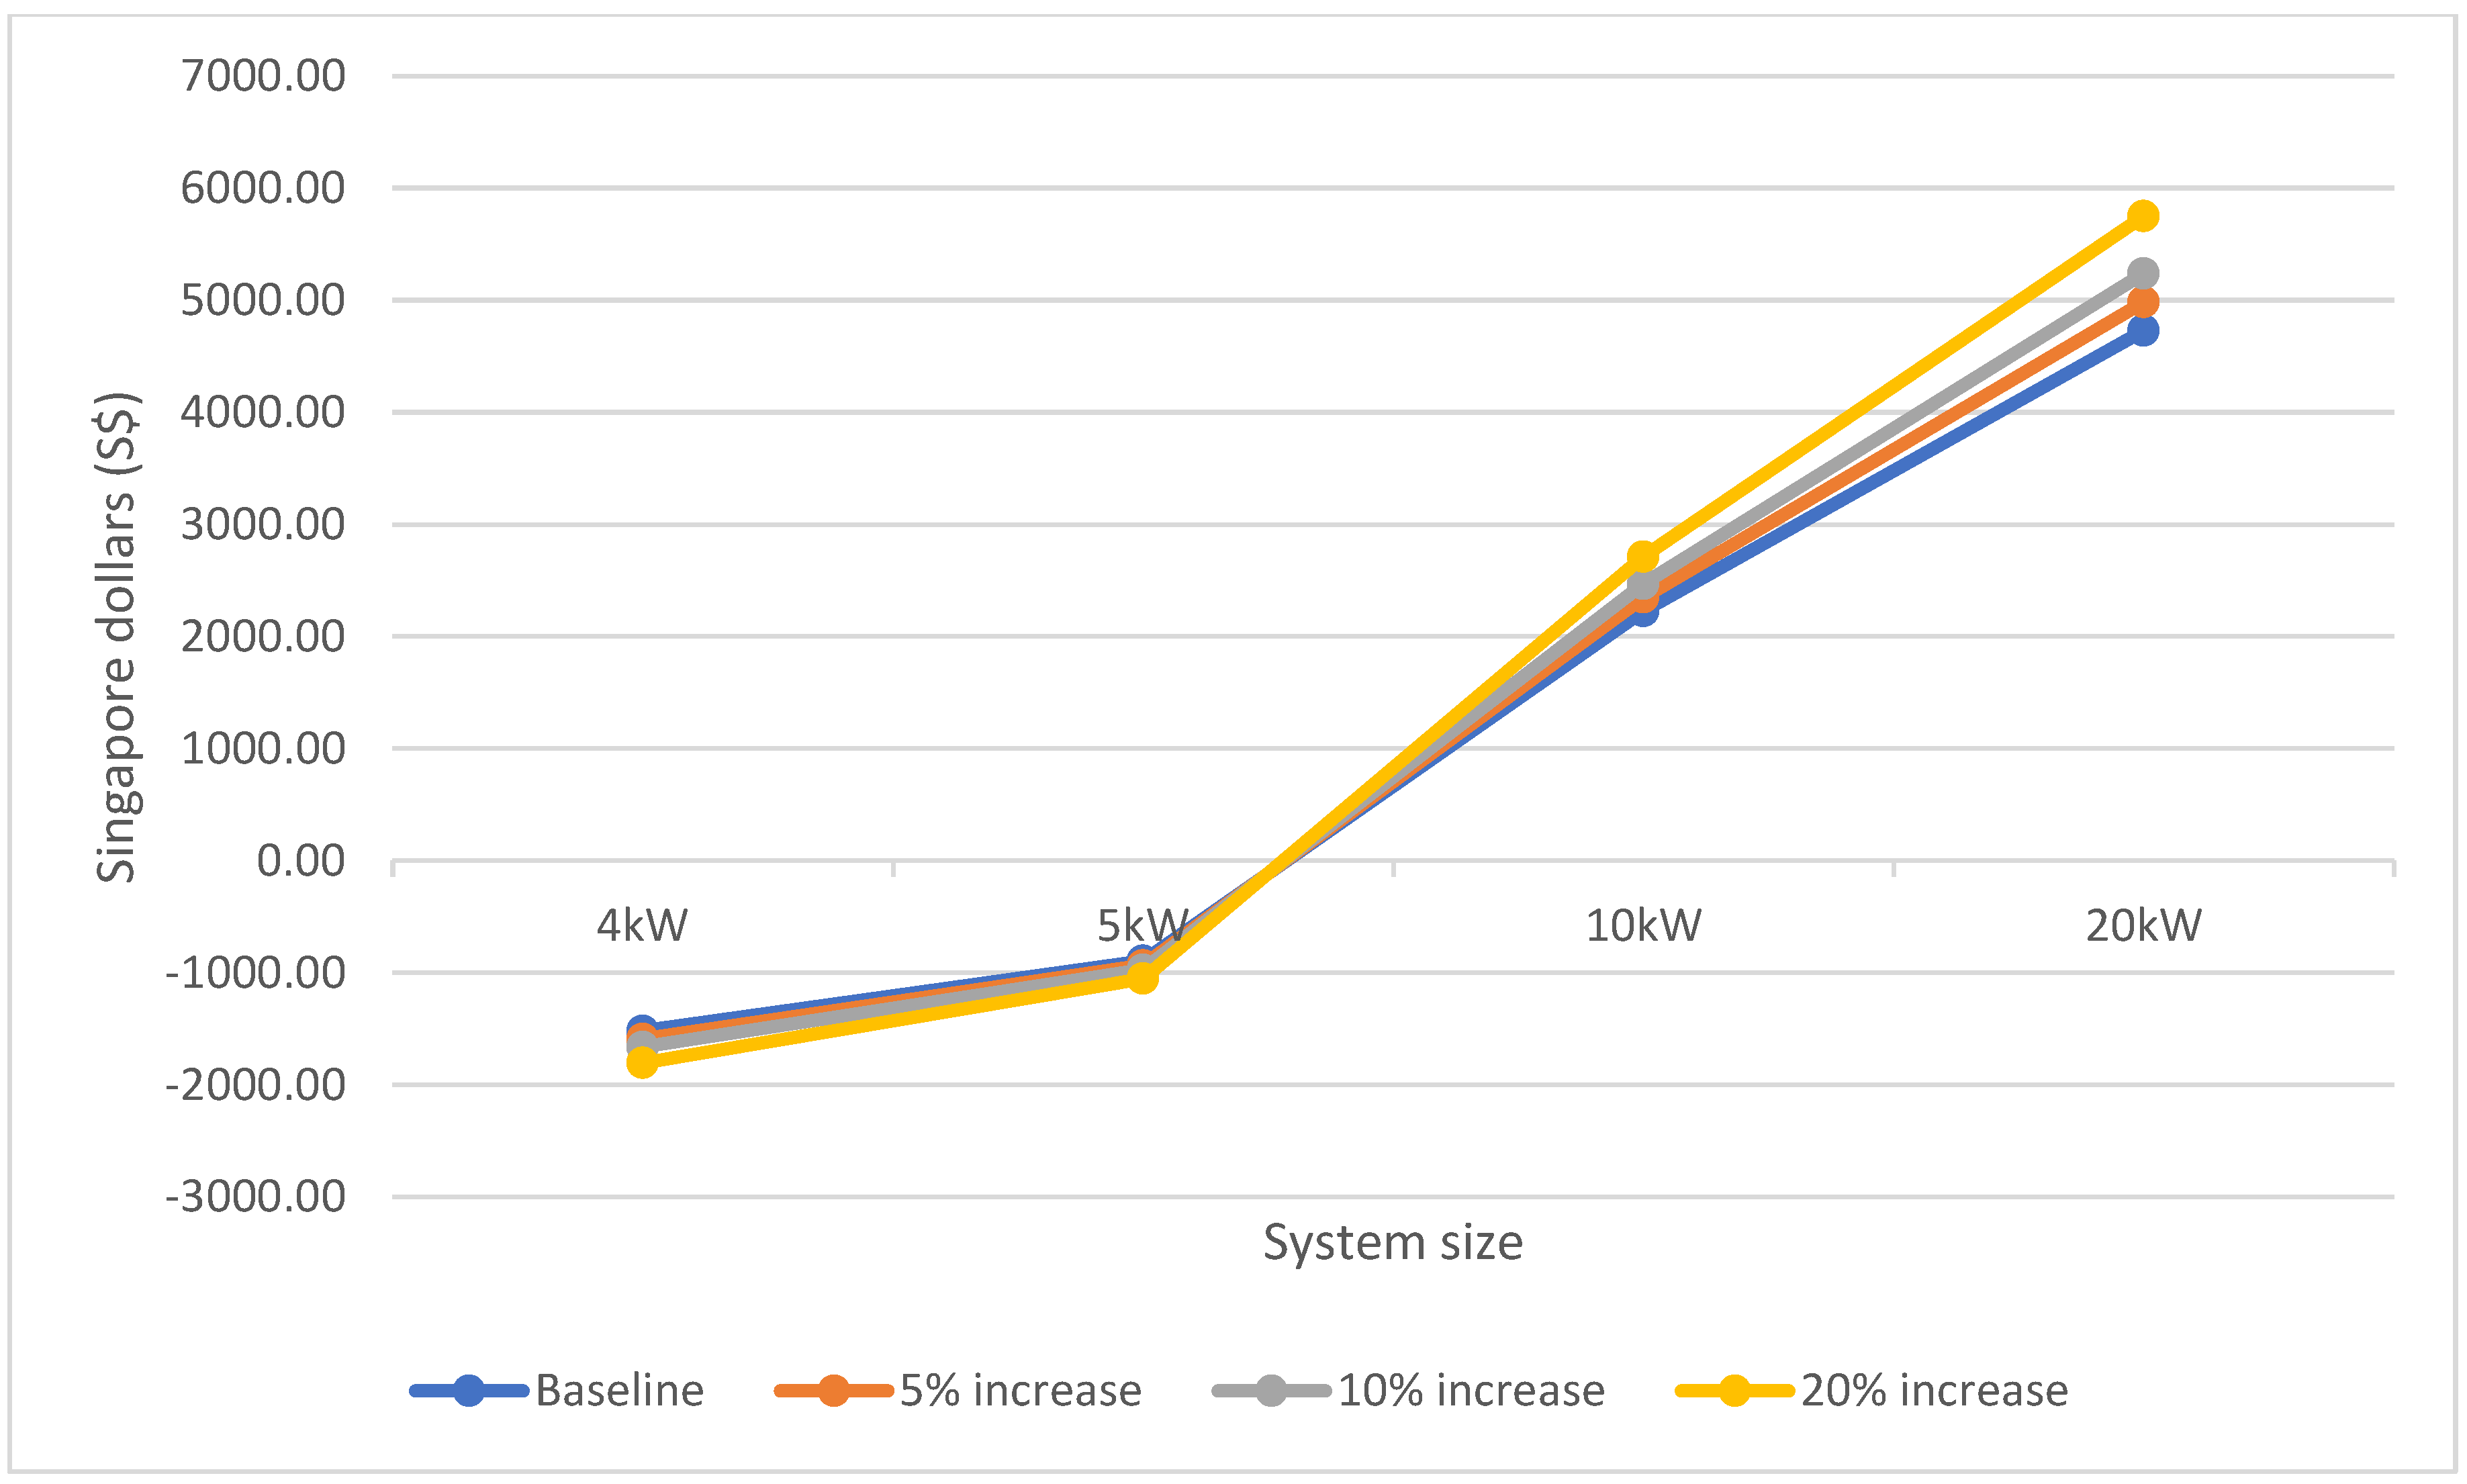
When calculating the costs, the electricity tariffs are assumed to be constant. However, there is an increase in electricity tariffs overtime worldwide and Singapore is not an exception. Sensitivity analysis is carried out regarding the changes in electricity tariffs. Figure 4, Figure 5 and Figure 6 reports the changes to cost savings, net savings, and payback period to an increase of 5%, 10%, and 20% electricity tariffs respectively.
According to Figure 4, the cost savings from solar PV increases when the electricity tariff increases. When the system size of the solar PV is higher, such as the 10 kW and 20 kW panels in this study, the cost savings are higher compared to the solar PVs with lower system sizes. The reason for this is the higher power generation capacity. As a result, solar PVs which can generate the required electricity are more beneficial when the electricity prices increase. If the solar PV can completely replace the electricity from the grid, such as the 20 kW solar PV in this study, it will provide significant savings.
Net savings considered the actual savings after purchasing the additional electricity required. This also includes the maintenance cost of the system as well. Therefore, this figure gives an effective picture on the actual expenses and savings from each of the systems. Systems with smaller system capacities, such as 4 kW and 5 kW, rely heavily on the grid. A significant portion of required electricity is taken from the grid. As a result, in a phase where the electricity prices are to escalate, lower capacity systems must pay more for the grid connected power (refer Figure 5). A system, e.g., 10 kW capacity, generates a higher portion of power required while getting a lower portion of power from the grid. As a result, when the prices escalate, still the savings are greater than the price paid for the grid connected power. A higher capacity system such as the 20 kW system in this study has massive savings when the energy prices escalate. This system caters for the whole energy requirement of the linkway and sell back the excess energy.
According to Figure 5, a system that offers the full capacity such as 20 kW derives significant cost savings when the electricity tariffs are escalating. When selecting a suitable system for covered linkways, it is important to consider a system at least generates a significant portion of the required electricity. Otherwise, when the electricity tariff escalates, there will be less or no net savings from the solar PV system.
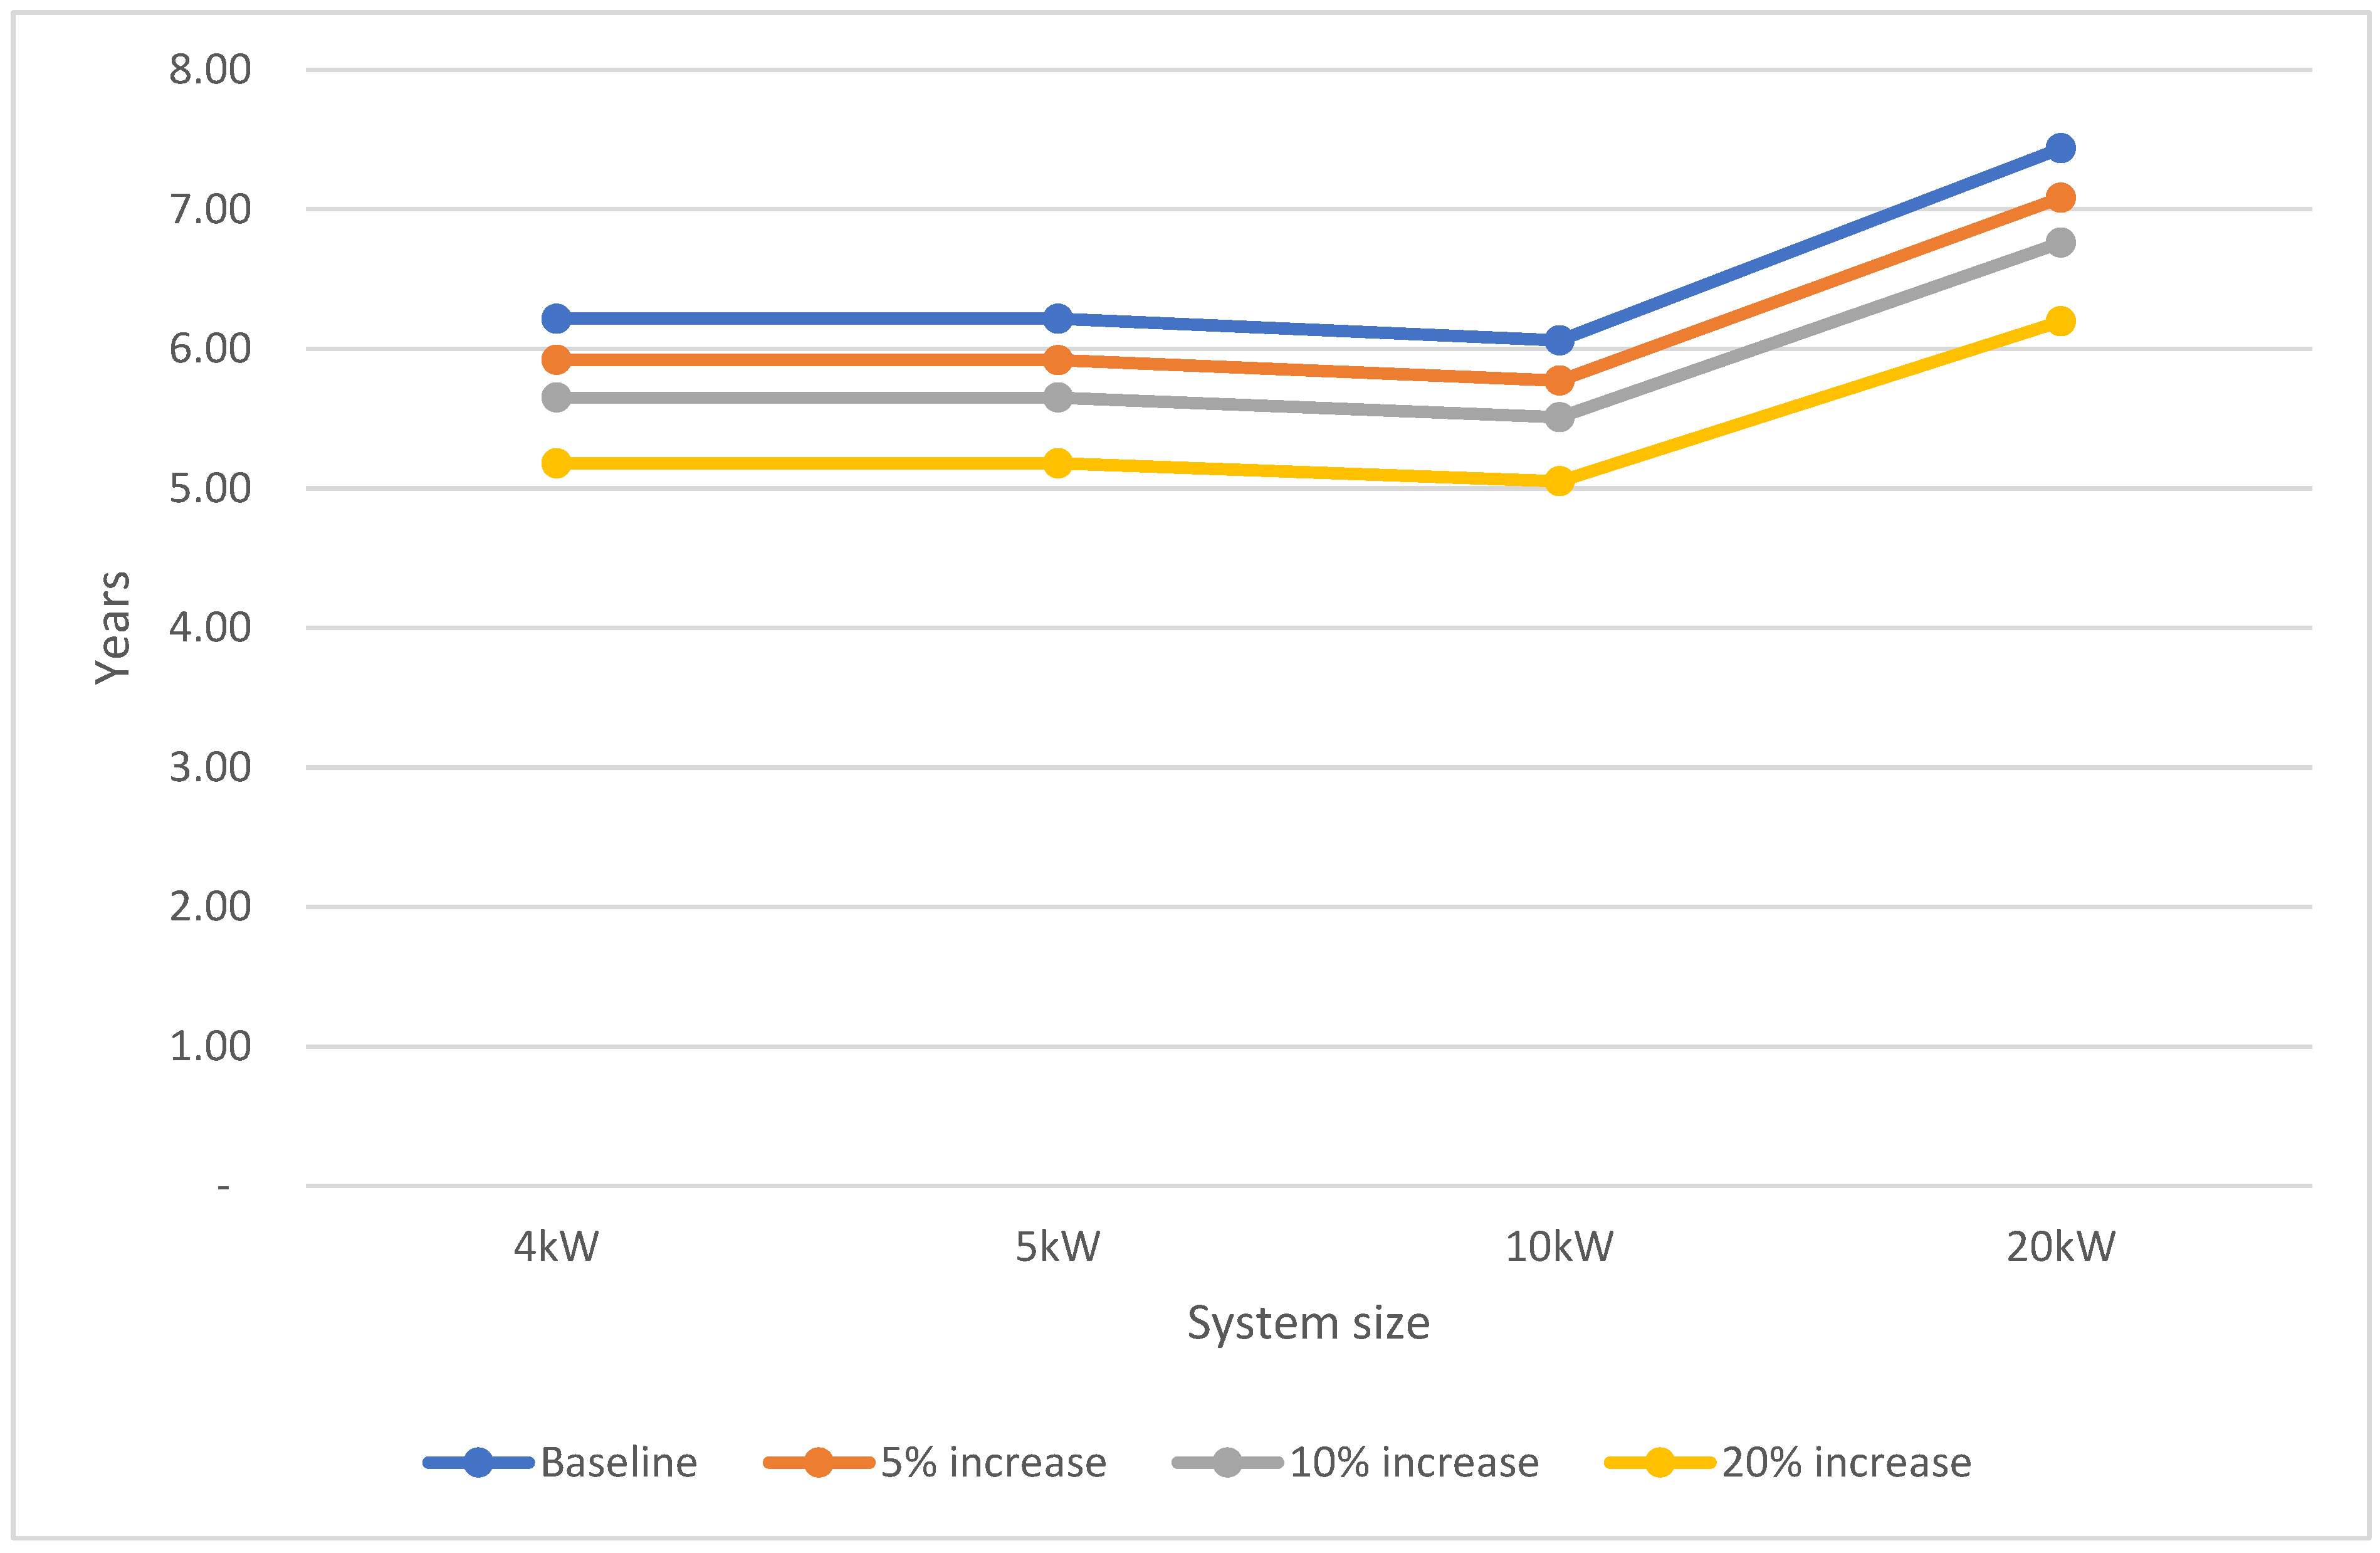
Payback period is an important measure used to evaluate investment options. In this research, there are four system sizes and when the system size increases the initial installation cost increases. Figure 6 reports the changes in payback period to the changes in electricity tariffs. According to Figure 6, the 10 kW system has the lowest payback period. When the electricity tariffs increase, the payback period decreases due to the increase in savings. The 20 kW system has the highest payback period irrespective of the increase in electricity tariffs. The main reason for the higher payback periods for 20 kW is that substantial savings compared to other lower capacity systems do not outweigh the significantly higher initial cost. When choosing an effective system capacity for covered linkways, it is important to consider the payback time as well. Using a higher system capacity will not be suitable always due to the higher initial cost and longer payback periods.
6. Discussion
Introducing solar PV to HDB’s covered linkways is a novel approach. Mondal et al. [27] mentioned that using solar PV in walkways is well knit to suit the needs of smart cities and essential for compact and dense urban environments. This research considers four sizes of systems for calculations. If the system capacity is high, the power generation is also high. With the larger system sizes, the initial cost and the installation costs also increases (refer Table 6). Although solar PV system are viable renewable energy source, higher initial investment is a barrier in many countries [59] and Singapore is not an exception. However, the cost of PV system continues to fall due to technology and manufacturing improvements [59]. Conversely, higher system sizes have higher cost savings. Tam et al. [26] also suggest that if the system size is higher, it generates higher savings compared to lower system sizes in Solar PV. This aligns with the research findings, with 20 kW being the system generating the highest savings. A low-cost grid connected solar PV could be a cheaper solution [60]. If the initial cost of larger system sizes decreases, as suggested by Blakers et al. [59], it will be more beneficial and cost effective to install PV panels in HDB’s linkways.
Usually, the lower system sizes (i.e., 4 kW and 5 kW systems) have a payback period of approximately 6.2 years (refer Table 6). When the two higher system sizes are compared, the 10 kW system has a payback period of 6.02, which is less than the payback period of both 4 kw and 5 kW systems (refer Table 6). The reason for this is that the 10 kW system generates higher energy to cover a larger portion of the required electricity. It is important to install the right system size to generate cost savings as well as a lower payback period. Ali et al. [61] conducted a study to introduce solar PV to rural areas in Bangladesh. In this research study, Ali et al. [61] identified that the payback period for various systems changes and does not always decrease when the system size decreases. For example, 40 kW, 50 kW, and 65 kW system sizes have payback periods of 4.03 years, 3.65 years, and 3.75 years respectively [61]. Montoya et al. [62] in their research study identify the importance of optimal sizing of PV sources and even proposed a method to calculate the optimal sizing.
According to Coria et al. [63], investment decisions on solar PV are significantly influenced by technology costs, national financial conditions, and tariffs. As per the sensitivity analysis, it is evident that cost savings tend to increase as the size of solar PV increases, although the tariff rate increases. For example, it was identified that a solar PV system with a 20 kW capacity provides higher financial benefits owing to the greater electricity generation. However, the initial cost of such systems is still an issue. Conversely, payback period of solar PV systems with higher system capacity (i.e., 20 kW) tends higher compared to systems with lower capacities (e.g., 4 kW and 5 kW). Therefore, the initial cost of solar PV systems should be carefully evaluated when designing a system for covered linkways in order to obtain maximum financial benefits. Furthermore, in Singapore, there are initiatives, such as the SolaNova programme, to support solar power generation and there is electricity buy back schemes. For example, a 20 kW system generates excess energy that can be sold to the grid (refer Table 6). There are several schemes available for the consumers to sell the energy based on the energy generating capacity. In Australia, there are various schemes similar to Singapore, such as the gross-feed-in-tariff scheme, a net-feed in-tariff scheme, and a buy-back scheme [26]. In 2011, Malaysia started the feed-in-tariff before introducing net energy metering (NEM) in 2017, and recently, another initiative known as NEM 3.0 was introduced to support and incentivize solar PV use in the country [64]. Janamala [55] conducted similar research to evaluate the performance and the cost-effectiveness of a solar PV tree for supplying the energy demand of a flood lighting system at a basketball court in India. This provided economic savings, and an average CO2 emission reduction of 0.414 metric tons. Similarly, introducing grid connected solar PV to HDB linkways not only generates cost savings, but significant environmental benefits as well. The integration of solar energy systems is an emerging trend worldwide and is an important method of mitigating the impact on GHG emissions as well [65]. These incentives policies on solar PV share positive effects on the reduction of toxic gasses mainly CO2, and reducing the pressure on the distribution network in the grid and increasing the national and regional independence of electricity [64]. Further, the proposed solar PV system uses thin film CIGS, which has a clear advantage in terms of carbon footprint compared to other PV technologies, such as crystalline silicon. Therefore, introducing solar PV in HDB linkways also derive the same benefits in Singapore.
In summary, this study proposed viable solar PV systems for HDB linkways in Singapore. Several key findings were discovered from this study.
- The cost savings from solar PV systems are higher as the capacity of the system increases. However, the initial cost of the system is still a prevailing problem. Between 2009 and 2021, the prices of crystalline silicon modules have dropped by between 88% and 95% [66]. Consequently, there is a chance for higher economic gains in the future by implementing solar PV systems in constructed environments.
- The availability of solar power buying schemes helps deliver excessive electricity generated by the solar PV system. The establishment of modern schemes further enhances the viability of applying solar technology to generate power requirements while covering its initial costs by delivering excessive electricity to the grid.
- The proposed solar PV system enables a sustainable built environment in addition to the economic benefits identified in this study. The use of solar PV reduces the dependency on non-renewable energy sources and thereby provides a pathway to clean energy generation.
7. Conclusions
This research proposed a grid-connected solar PV system to HDB linkways in Singapore along with a cost–benefit analysis to identify the most economically viable option. Accordingly, four system sizes were analyzed, namely 4 kW, 5 kW, 10 kW, and 20 kW. The solar panels were thin filmed and proposed to be installed in three locations in a covered linkway to minimize shading. The initial cost changes from S$8000 to 38,000. Except for the 20 kW system capacity solar PV, other solar PVs (i.e., 4 kW, 5 kW and 10 kW) could not supply for the whole electricity demand yearly. However, 10 kW capacity generates 12,647 kWh per annum which covers the annual yearly electricity requirement, 15,768 kWh. The payback period for each of these systems are 6.22 years for both 4 kW and 5 kW systems, 6.06 years for the 10 kW system, and 7.44 years for the 20 kW system. With the increase in the electricity tariff, higher power generation solar PVs are more cost effective. However, it is important to decide the optimal size for the PV system. In addition to the economic benefits, the adoption of solar PV systems in HDB linkways helps to reduce CO2 emissions. This allows the built environment to be more sustainable owing to the use of renewable energy sources and solar PV materials with lower carbon footprint.
This research presents an extensive analysis on the economic aspects of introducing solar PV to HDB linkways. These data and findings can be used by PV installation professionals, academics, and policy makers to introduce and support the installation of solar PV to covered linkways. Solar PV not only generates cost savings, but also environmental benefits, such as GHG emission reductions. Future research should be carried out to quantify these environmental benefits and provide a detailed study on the solar PV to the HDB linkways. Further, this study can be extended by carrying out additional economic analysis, such as calculating the net present value, internal rate of return, and profitability index. Moreover, the sensitivity analysis could be extended to investigate the influence of several factors together. In addition, this research did not consider the impact of the atmosphere’s temperature on the efficiency of solar PV systems and electricity generation. Therefore, this study could be extended to determine how the power output varies with the atmosphere’s temperature.
Author Contributions
Conceptualization, W.Y.K. and C.I.; methodology, W.Y.K., C.I. and S.C.V.; formal analysis, W.Y.K., C.I. and S.C.V.; investigation, W.Y.K., C.I. and S.C.V.; writing—original draft preparation, W.Y.K. and C.I.; writing—review and editing, C.I. and S.C.V.; supervision, C.I.; funding acquisition, C.I. All authors have read and agreed to the published version of the manuscript.
Funding
The APC was funded by University of New South Wales (UNSW)—Scientia Scheme.
Institutional Review Board Statement
Not Applicable.
Informed Consent Statement
Not Applicable.
Data Availability Statement
All data used during the study appear in the submitted article including appendices.
Conflicts of Interest
The authors declare no conflict of interest.
Abbreviations
| AdER | Additional electricity requirement (kWh) |
| AnER | Annual electricity requirement (kWh) |
| AEG | Annual electricity generation (kWh) |
| EESG | Excess electricity sold back to the grid (kWh) |
| ACGRID ELEC. | Additional cost of electricity from the grid ($) |
| ET | Electricity tariff ($) |
| CSNEEG | Cost savings if there is no excess electricity generated ($) |
| CSEEG | Cost savings if there is excess electricity generated |
| AVGHHWEP | Average half hourly wholesale energy price ($) |
| NS | Net savings ($)—Actual financial benefit obtained via solar PV utilization |
| CS | Cost savings ($)—Gross financial benefit obtained via solar PV utilization |
| MC | Maintenance cost ($)—Expenditure incurred due to periodic and reactive maintenance activities |
| PBP | Payback period (years)—The amount of time required to recover the cost of the initial investment in a solar PV system |
| IC | Initial cost ($)—The expenditure associated with purchasing and installing of a solar PV system |
| DPBP | Discounted payback period (years)—Number of years required to have equal accumulated discounted cost savings to initial cost |
| Y | The period preceding the period in which the cumulative cash flow turns positive |
| Abs(n) | Cumulative cash flow in year before recovery |
| P | Discounted cash flow in year after recovery |
References
- Energy Market Authority (EMA). Singapore Energy Market Outlook (2016). 2016. Available online: https://www.ema.gov.sg/cmsmedia/Singapore%20Electricity%20Market%20Outlook%20Final.pdf (accessed on 20 March 2022).
- Energy Market Authority (EMA). Energy Statistics 2020. 2021. Available online: https://www.ema.gov.sg/singapore-energy-statistics/ (accessed on 10 February 2022).
- Energy Market Authority (EMA). Sinagapore Energy Markey Outlook (SEMO). Sinagapore2020. 2020. Available online: https://www.ema.gov.sg/cmsmedia/PPD/Singapore-Electricity-Market-Outlook-2020.pdf (accessed on 5 December 2021).
- Housing and Development Board. (2021, 03 January). SolarNova. Available online: https://www.hdb.gov.sg/about-us/our-role/smart-and-sustainable-living/solarnova-page (accessed on 21 January 2022).
- Kosorić, V.; Lau, S.-K.; Tablada, A.; Lau, S.S.-Y. General Model of Photovoltaic (PV) Integration into Existing Public High-Rise Residential Buildings in Singapore—Challenges and Benefits. Renew. Sustain. Energy Rev. 2018, 91, 70–89. [Google Scholar] [CrossRef]
- Housing and Development Board (HDB). Key Statistics—HDB Annual Report 2019/2020. 2020. Available online: https://services2.hdb.gov.sg/ebook/AR2020-keystats/html5/index.html?&locale=ENG&pn=1 (accessed on 17 November 2021).
- Housing and Development Board (HDB). Steering a Vision. 2021. Available online: https://www.hdb.gov.sg/cs/infoweb/-/media/HDBContent/Images/CCG/Dwellings_2021_FebMar.pdf (accessed on 16 February 2022).
- Land Transport Authority (LTA) and Urban Redevelopment Authority (URA). Singapore Walking and Cycling Design Guide. 2018. Available online: https://www.ura.gov.sg/Corporate/Guidelines/-/media/BD725DB201DB496A93569C8072DD9FD0.ashx (accessed on 9 June 2022).
- International Renewable Energy Agency. (2 January 2020). Solar Energy. Available online: https://www.irena.org/solar (accessed on 2 April 2022).
- Wong, P.S.P.; Cronin, L. Drivers and Anticipated Outcomes of Solar Photovoltaic Projects—The Construction Practitioners’ Perspectives. IOP Conf. Ser. Mater. Sci. Eng. 2019, 471, 112006. [Google Scholar] [CrossRef]
- Saber, E.M.; Lee, S.E.; Manthapuri, S.; Yi, W.; Deb, C. PV (photovoltaics) performance evaluation and simulation-based energy yield prediction for tropical buildings. Energy 2014, 71, 588–595. [Google Scholar] [CrossRef]
- De Lima, L.C.; Ferreira, L.D.A.; Morais, F.H.B.D.L. Performance analysis of a grid connected photovoltaic system in northeastern Brazil. Energy Sustain. Dev. 2017, 37, 79–85. [Google Scholar] [CrossRef]
- Mondal, A.H.; Islam, A.S. Potential and viability of grid-connected solar PV system in Bangladesh. Renew. Energy 2011, 36, 1869–1874. [Google Scholar] [CrossRef]
- Akpolat, A.N.; Dursun, E.; Kuzucuoğlu, A.E.; Yang, Y.; Blaabjerg, F.; Baba, A.F. Performance Analysis of a Grid-Connected Rooftop Solar Photovoltaic System. Electronics 2019, 8, 905. [Google Scholar] [CrossRef] [Green Version]
- Omran, W. Grid-Connected Photovoltaic Systems. Ph.D. Thesis, Electrical and Computer Engineering, University of Waterloo, Waterloo, ON, Canada, 2010. [Google Scholar]
- Lau, S.-K.; Kosorić, V.; Bieri, M.; Nobre, A. Identification of Factors Influencing Development of Photovoltaic (PV) Implementation in Singapore. Sustainability 2021, 13, 2630. [Google Scholar] [CrossRef]
- Ghenai, C.; Bettayeb, M. Modelling and performance analysis of a stand-alone hybrid solar PV/Fuel Cell/Diesel Generator power system for university building. Energy 2019, 171, 180–189. [Google Scholar] [CrossRef]
- Hassan, A.; Al-Abdeli, Y.M.; Masek, M.; Bass, O. Optimal sizing and energy scheduling of grid-supplemented solar PV systems with battery storage: Sensitivity of reliability and financial constraints. Energy 2022, 238, 121780. [Google Scholar] [CrossRef]
- Huang, B.-J.; Hsu, P.; Wu, M.; Ho, P. System dynamic model and charging control of lead-acid battery for stand-alone solar PV system. Sol. Energy 2010, 84, 822–830. [Google Scholar] [CrossRef]
- Kizilcec, V.; Parikh, P. Solar Home Systems: A comprehensive literature review for Sub-Saharan Africa. Energy Sustain. Dev. 2020, 58, 78–89. [Google Scholar] [CrossRef]
- Ghaleb, B.; Asif, M. Application of solar PV in commercial buildings: Utilizability of rooftops. Energy Build. 2021, 257, 111774. [Google Scholar] [CrossRef]
- Radwan, A.; Katsura, T.; Memon, S.; Abo-Zahhad, E.M.; Serageldin, A.A.; Nagano, K. Analysis of a vacuum-based photovoltaic thermal collector. Energy Rep. 2020, 6, 236–242. [Google Scholar] [CrossRef]
- Sultan, H.M.; Menesy, A.S.; Kamel, S.; Korashy, A.; Almohaimeed, S.; Abdel-Akher, M. An improved artificial ecosystem optimization algorithm for optimal configuration of a hybrid PV/WT/FC energy system. Alex. Eng. J. 2021, 60, 1001–1025. [Google Scholar] [CrossRef]
- Pham, L.H.; Dinh, B.H.; Nguyen, T.T. Optimal power flow for an integrated wind-solar-hydro-thermal power system considering uncertainty of wind speed and solar radiation. Neural Comput. Appl. 2022, 34, 10655–10689. [Google Scholar] [CrossRef]
- Walters, J.P.; Kaminsky, J.; Huepe, C. Factors Influencing Household Solar Adoption in Santiago, Chile. J. Constr. Eng. Manag. 2018, 144, 05018004. [Google Scholar] [CrossRef] [Green Version]
- Tam, V.W.; Le, K.N.; Zeng, S.; Wang, X.; Illankoon, I.C.S. Regenerative practice of using photovoltaic solar systems for residential dwellings: An empirical study in Australia. Renew. Sustain. Energy Rev. 2017, 75, 1–10. [Google Scholar] [CrossRef]
- Mondal, S.; Sanyal, A.; Brahmachari, S.; Bhattacharjee, B.; Mujumdar, P.D.; Raviteja, J.; Goswami, A.K.; Nag, D. Utilization of Constrained Urban Spaces for Distributed Energy Generation—Development of Solar Paved Pedestrian Walkway. Energy Procedia 2017, 130, 114–121. [Google Scholar] [CrossRef]
- Duman, A.C.; Güler, Ö. Techno-economic analysis of off-grid photovoltaic LED road lighting systems: A case study for northern, central and southern regions of Turkey. Build. Environ. 2019, 156, 89–98. [Google Scholar] [CrossRef]
- Das, N.; Pal, N.; Pradip, S.K. Economic cost analysis of LED over HPS flood lights for an efficient exterior lighting design using solar PV. Build. Environ. 2015, 89, 380–392. [Google Scholar] [CrossRef]
- Nanayakkara, N.W.K.V.V.; Perera, B.A.K.S.; Illankoon, I.M.C.S. On-site renewable energy for industrial buildings in Sri Lanka: A life-cycle cost analysis. Intell. Build. Int. 2021, 14, 499–516. [Google Scholar] [CrossRef]
- Poon, K.; Kämpf, J.; Tay, S.; Wong, N.; Reindl, T. Parametric study of URBAN morphology on building solar energy potential in Singapore context. Urban Clim. 2020, 33, 100624. [Google Scholar] [CrossRef]
- Kosorić, V.; Lau, S.-K.; Tablada, A.; Bieri, M.; Nobre, A.M. A Holistic Strategy for Successful Photovoltaic (PV) Implementation into Singapore’s Built Environment. Sustainability 2021, 13, 6452. [Google Scholar] [CrossRef]
- N.C.C. Secretariat. Singapore’s Approach to Alternative Energy. 8 May 2022. Available online: https://www.nccs.gov.sg/singapores-climate-action/singapore-approach-to-alternative-energy/ (accessed on 7 July 2022).
- Ascencio-Vásquez, J.; Brecl, K.; Topič, M. Methodology of Köppen-Geiger-Photovoltaic climate classification and implications to worldwide mapping of PV system performance. Sol. Energy 2019, 191, 672–685. [Google Scholar] [CrossRef]
- International Energy Agency. Snapshot of Global PV Markets. In Photovoltaic Power Systems Programme; Report IEA-PVPS T1-39:2021; IEA-PVPS: Brussels, Belgium, 2021; Available online: https://iea-pvps.org/wp-content/uploads/2021/04/IEA_PVPS_Snapshot_2021-V3.pdf (accessed on 2 April 2022).
- International Energy Agency. Trends in Photovoltaic Applications. IEA-PVPS T1-38:2020. 2020. Available online: https://iea-pvps.org/wp-content/uploads/2020/11/IEA_PVPS_Trends_Report_2020-1.pdf (accessed on 6 June 2022).
- ASEAN-German Energy Programme (AGEP). World’s Largest Floating Solar Photovoltaic Cell Test-Bed Launched in Singapore. 3 January 2020. Available online: https://agep.aseanenergy.org/worlds-largest-floating-solar-photovoltaic-cell-test-bed-launched-in-singapore/ (accessed on 11 January 2022).
- Solar Energy Research Institute of Singapore (SERIES). Annual Report 2019. 2019. Available online: https://www.seris.nus.edu.sg/doc/publications/Annual-Reports/SERIS_AR2019.pdf (accessed on 27 April 2022).
- Laib, I.; Hamidat, A.; Haddadi, M.; Ramzan, N.; Olabi, A.G. Study and simulation of the energy performances of a grid-connected PV system supplying a residential house in north of Algeria. Energy 2018, 152, 445–454. [Google Scholar] [CrossRef] [Green Version]
- Peng, C.; Huang, Y.; Wu, Z. Building-integrated photovoltaics (BIPV) in architectural design in China. Energy Build. 2011, 43, 3592–3598. [Google Scholar] [CrossRef]
- Kumar, N.M.; Sudhakar, K.; Samykano, M. Performance comparison of BAPV and BIPV systems with c-Si, CIS and CdTe photovoltaic technologies under tropical weather conditions. Case Stud. Therm. Eng. 2019, 13, 100374. [Google Scholar] [CrossRef]
- Zomer, C.D.; Costa, M.R.; Nobre, A.; Rüther, R. Performance compromises of building-integrated and building-applied photovoltaics (BIPV and BAPV) in Brazilian airports. Energy Build. 2013, 66, 607–615. [Google Scholar] [CrossRef]
- Mahammed, I.H.; Arab, A.H.; Berrah, S.; Bakelli, Y.; Khennene, M.; Oudjana, S.H.; Fezzani, A.; Zaghba, L. Outdoor study of partial shading effects on different PV modules technologies. Energy Procedia 2017, 141, 81–85. [Google Scholar] [CrossRef]
- Falk, A.; Durschner, C.; Remmers, K.-H. Photovoltaics for Professionals: Solar Electric Systems Marketing, Design and Installation; Routledge: London, UK, 2013. [Google Scholar]
- US Deprtment of Energy. PVWatts Calculator. 3 January 2020. Available online: https://pvwatts.nrel.gov/ (accessed on 8 February 2022).
- Luther, J.; Reindl, T. Solar Photovoltaic (PV) Roadmap for Singapore (A Summary); Solar Energy Research Institute of Singapore (SERIS): Singapore, 2013. Available online: https://www.nccs.gov.sg/docs/default-source/default-document-library/solar-photovoltaic-roadmap-for-singapore-a-summary.pdf (accessed on 7 October 2022).
- Energy Market Authority. Solar Photovoltaic system. 3 January 2020. Available online: https://www.ema.gov.sg/Solar_Photovoltaic_Systems.aspx (accessed on 16 March 2022).
- Sick, F.; Erge, T. Photovoltaics in Buildings: A Design Handbook for Architects and Engineers; Routledge: London, UK, 2014. [Google Scholar]
- Energy Market Authority and Builidng Construction Authority. Handbook for Solar Photovoltic (PV) Systems. 2014. Available online: https://www.ema.gov.sg/cmsmedia/Renewable_Energy/Solar_Photovoltiac_Systems/Handbook_for_Solar_PV.pdf (accessed on 4 February 2022).
- Alexander, D. Photovoltaic Systems. YourHome. 3 November 2020. Available online: https://www.yourhome.gov.au/energy/photovoltaic-systems (accessed on 18 April 2022).
- Chen, Y.; Altermatt, P.P.; Chen, D.; Zhang, X.; Xu, G.; Yang, Y.; Wang, Y.; Feng, Z.; Shen, H.; Verlinden, P.J. From Laboratory to Production: Learning Models of Efficiency and Manufacturing Cost of Industrial Crystalline Silicon and Thin-Film Photovoltaic Technologies. IEEE J. Photovolt. 2018, 8, 1531–1538. [Google Scholar] [CrossRef]
- Ong, K.H.; Agileswari, R.; Maniscalco, B.; Arnou, P.; Kumar, C.C.; Bowers, J.W.; Marsadek, M. Review on Substrate and Molybdenum Back Contact in CIGS Thin Film Solar Cell. Int. J. Photoenergy 2018, 2018, 9106269. [Google Scholar] [CrossRef] [Green Version]
- Adeeb, J.; Farhan, A.; Al-Salaymeh, A. Temperature Effect on Performance of Different Solar Cell Technologies. J. Ecol. Eng. 2019, 20, 249–254. [Google Scholar] [CrossRef]
- Energy Market Authority. Electricity Tariffs. 3 January 2021. Available online: https://www.ema.gov.sg/Residential_Electricity_Tariffs.aspx (accessed on 9 May 2022).
- Janamala, V. Solar PV Tree: Shade-Free Design and Cost Analysis Considering Indian Scenario. Walailak J. Sci. Technol. 2021, 18, 8995–8999. [Google Scholar] [CrossRef]
- Eigen Energy. Typical Solar System Cost. 6 January 2018. Available online: https://residential.eigen.sg/solar-panel-system-installation-cost (accessed on 21 March 2022).
- Energy Market Authority. Guide to Solar PV. 5 January 2021. Available online: https://www.ema.gov.sg/Guide_to_Solar_PV.aspx (accessed on 18 February 2022).
- The Open Electricity Market. Wholesale Electricity Price. 6 January 2022. Available online: https://www.openelectricitymarket.sg/business/purchase-options/wholesale-electricity-price (accessed on 23 March 2022).
- Blakers, A.; Stocks, M.; Lu, B.; Cheng, C. The low cost of balancing solar PV and wind. In Proceedings of the 2021 IEEE 48th Photovoltaic Specialists Conference (PVSC), Winterthur, Switzerland, 20–25 June 2021; pp. 617–620. [Google Scholar]
- Khan, M.R.; Alam, I. A Solar PV-Based Inverter-Less Grid-Integrated Cooking Solution for Low-Cost Clean Cooking. Energies 2020, 13, 5507. [Google Scholar] [CrossRef]
- Ali, M.Y.; Hassan, M.; Rahman, M.A.; Kafy, A.A.; Ara, I.; Javed, A.; Rahman, M.R. Life cycle energy and cost analysis of small scale biogas plant and solar PV system in rural areas of Bangladesh. Energy Procedia 2019, 160, 277–284. [Google Scholar] [CrossRef]
- Montoya, O.D.; Grisales-Noreña, L.F.; Alvarado-Barrios, L.; Arias-Londoño, A.; Álvarez-Arroyo, C. Efficient Reduction in the Annual Investment Costs in AC Distribution Networks via Optimal Integration of Solar PV Sources Using the Newton Metaheuristic Algorithm. Appl. Sci. 2021, 11, 11525. [Google Scholar] [CrossRef]
- Coria, G.; Penizzotto, F.; Pringles, R. Economic Analysis of Rooftop Solar PV Systems in Argentina. IEEE Lat. Am. Trans. 2020, 18, 32–42. [Google Scholar] [CrossRef]
- Husain, A.A.F.; Phesal, M.H.A.; Ab Kadir, M.Z.A.; Amirulddin, U.A.U.; Junaidi, A.H.J. A Decade of Transitioning Malaysia toward a High-Solar PV Energy Penetration Nation. Sustainability 2021, 13, 9959. [Google Scholar] [CrossRef]
- Awad, H.; Gül, M.; Al-Hussein, M. Long-term performance and GHG emission offset analysis of small-scale grid-tied residential solar PV systems in northerly latitudes. Adv. Build. Energy Res. 2020, 15, 733–754. [Google Scholar] [CrossRef]
- International Renewable Energy Agency. Renewable Power Generation Costs in 2021; International Renewable Energy Agency: Abu Dhabi, United Arab Emirates, 2021. [Google Scholar]
Figure 1.
Evolution of cumulative PV installations. Adapted from International Energy Agency [35].
Figure 1.
Evolution of cumulative PV installations. Adapted from International Energy Agency [35].

Figure 2.
Location of the HDB’s covered linkway.

Figure 3.
Locations HBD’s covered linkway to install solar PV systems.

Figure 4.
Changes to cost savings to the changes in electricity tariffs.

Figure 5.
Changes to net savings to the changes in electricity tariffs.

Figure 6.
Changes to payback period to the changes in electricity tariffs.


Table 1.
Conversion efficiencies of various PV module technologies.
| Technology | Module Efficiency |
|---|---|
| Mono-crystalline Silicon | 15–20% |
| Polycrystalline Silicon | 13–17% |
| Copper Indium Gallium Selenide (CIGS) | 15.7–16.4% |
| Cadmium Telluride (CdTe) | 17.9–18.6% |
| Amorphous Silicon (a-Si) | 12.3% |
Table 2.
Temperature coefficient of various PV cell technologies.
| Technology | Temperature Coefficient [%/°C] |
|---|---|
| Crystalline Silicon | −0.109 to −0.124 |
| Thin-film solar cells (e.g., Copper Indium Gallium Selenide (CIGS), Cadmium Telluride (CdTe) and Amorphous Silicon (a-Si)) | −0.0984 |
Source: Adeeb et al. [53].
Table 3.
PV system information.
| System Information | |
|---|---|
| Module Type | Thin-Film—CIGS |
| Array Type | Fixed |
| Tilt (degree) | 20°—Default value for fixed array |
| Azimuth (degree) | 180°—the default value for locations in the northern hemisphere (applicable for Singapore) |
| Inverter | Micro-inverter |
Table 4.
System loss calculation.
| Parameter | Percentage Value | Reason |
|---|---|---|
| Soiling | 2 | Soiling is affected by both location and weather. Losses caused by dirt and other foreign matter on the PV module’s surface that prevent solar radiation from reaching the cells. Soiling losses are significant in high-traffic, high-pollution locations with intermittent rain. |
| Shading | 3 | Reduced incident solar radiation generated by shadows caused by nearby objects such as buildings or trees, or by self-shading for modules placed in rows when modules in one row cause shadows on those in an adjacent row. |
| Snow | 0 | Snow covering the array reduces the system’s annual output. |
| Mismatch | 2 | Electrical losses induced by minor changes in manufacturing flaws between modules in the array, resulting in somewhat varying current-voltage characteristics. The default value of is 2%. |
| Wiring | 2 | Resistive losses in the direct current and alternating current wires that connect modules, inverters, and other system components. The default value is 2%. |
| Connections | 0.5 | Resistive losses in electrical connectors in the system. The default value is 0.5%. |
| Light induced degradation | 1.5 | The effect of light-induced photovoltaic cell deterioration on the array’s power during the first few months of operation. The default value is 1.5%. |
| Name plate rating | 1 | The nameplate rating loss accounts for the accuracy of the manufacturer’s nameplate rating. |
| Age | 0 | Weathering of photovoltaic modules influences the array’s performance over time. The default value is zero. |
| Availability | 3 | System output reduction caused by scheduled and unscheduled system shutdowns for maintenance, grid disruptions, and other operational issues. The default value is 3%. |
Adapted from US Department of Energy [45].
Table 5.
Yearly electricity generation.
| Month | Solar Radiation (kWh /m2/Day) | AC Energy (kWh) | |||
|---|---|---|---|---|---|
| 4 kW System Size | 5 kW System Size | 10 kW System Size | 20 kW System Size | ||
| January | 4.77 | 470 | 587 | 1174 | 2348 |
| February | 5.10 | 452 | 565 | 1129 | 2258 |
| March | 4.67 | 453 | 567 | 1133 | 2266 |
| April | 4.58 | 430 | 538 | 1076 | 2151 |
| May | 4.14 | 403 | 504 | 1008 | 2016 |
| June | 3.89 | 366 | 457 | 915 | 1829 |
| July | 4.04 | 393 | 491 | 983 | 1966 |
| August | 4.12 | 404 | 505 | 1009 | 2019 |
| September | 4.36 | 411 | 514 | 1028 | 2055 |
| October | 4.49 | 438 | 548 | 1095 | 2191 |
| November | 4.35 | 413 | 516 | 1032 | 2063 |
| December | 4.33 | 426 | 532 | 1065 | 2129 |
| Annual | 4.40 | 5059 | 6324 | 12,647 | 25,291 |
Table 6.
Analysis on solar PV systems.
| System Size | ||||
|---|---|---|---|---|
| 4 kW | 5 kW | 10 kW | 20 kW | |
| Initial cost S$ * | 8000.00 | 10,000.00 | 19,500.00 | 38,000.00 |
| Approximate area | 28 m2 | 30 m2 | 60 m2 | 120 m2 |
| Yearly maintenance cost S$ (1% of initial cost) | 80 | 100 | 195 | 380 |
| Annual electricity generation (kWh)-Refer Table 5 | 5059 | 6324 | 12,647 | 25,291 |
| Annual electricity requirement (kWh) | 15,768 | 15,768 | 15,768 | 15,768 |
| 1 Additional electricity requirement (kWh) | 10,709 | 9444 | 3121 | N/A |
| 2 Excess electricity sold back to the grid (kWh) | N/A | N/A | N/A | 9523 |
| 3 Additional cost of electricity from the grid (S$) | 2724.37 | 2402.55 | 793.98 | N/A |
| 4 Cost savings (S$) | 1287.01 | 1608.83 | 3217.40 | 5108.90 |
| 5 Net savings | (1517.36) | (893.73) | 2228.41 | 6054.03 |
| 6 Payback period (years) | 6.22 | 6.22 | 6.06 | 7.44 |
| 7 Discounted payback period (years) | 7 | 7 | 7 | 9 |
* 1S$ = 0.74 USD. The formulas used to calculate the figures reported in Table 6 are as follows: 1 AdER = AnER − AEG; 2 EESG = AEG − AnER; 3 ACGRID ELEC. = AdER × ET; 4 CSNEEG = AEG × ET; 4 CSEEG = (AEG × ET) + (EESG × AVGHHWEP); 5 NS = CS − MC − ACGRID ELEC; 6 PBP = IC/CS; 7 DPBP = Y + Abs(n)/P; The discount rate is taken as 2.5%.
Publisher’s Note: MDPI stays neutral with regard to jurisdictional claims in published maps and institutional affiliations. |
© 2022 by the authors. Licensee MDPI, Basel, Switzerland. This article is an open access article distributed under the terms and conditions of the Creative Commons Attribution (CC BY) license (https://creativecommons.org/licenses/by/4.0/).
Share and Cite
MDPI and ACS Style
Kuang, W.Y.; Illankoon, C.; Vithanage, S.C. Grid-Connected Solar Photovoltaic (PV) System for Covered Linkways. Buildings 2022, 12, 2131. https://doi.org/10.3390/buildings12122131
AMA Style
Kuang WY, Illankoon C, Vithanage SC. Grid-Connected Solar Photovoltaic (PV) System for Covered Linkways. Buildings. 2022; 12(12):2131. https://doi.org/10.3390/buildings12122131
Chicago/Turabian StyleKuang, Wendy Yiwen, Chethana Illankoon, and Sadith Chinthaka Vithanage. 2022. "Grid-Connected Solar Photovoltaic (PV) System for Covered Linkways" Buildings 12, no. 12: 2131. https://doi.org/10.3390/buildings12122131
Note that from the first issue of 2016, this journal uses article numbers instead of page numbers. See further details here.