
Experimental Study on Characteristics of Pile-Soil Interaction in Screw Piles

Abstract
:1. Introduction
2. Materials and Methods
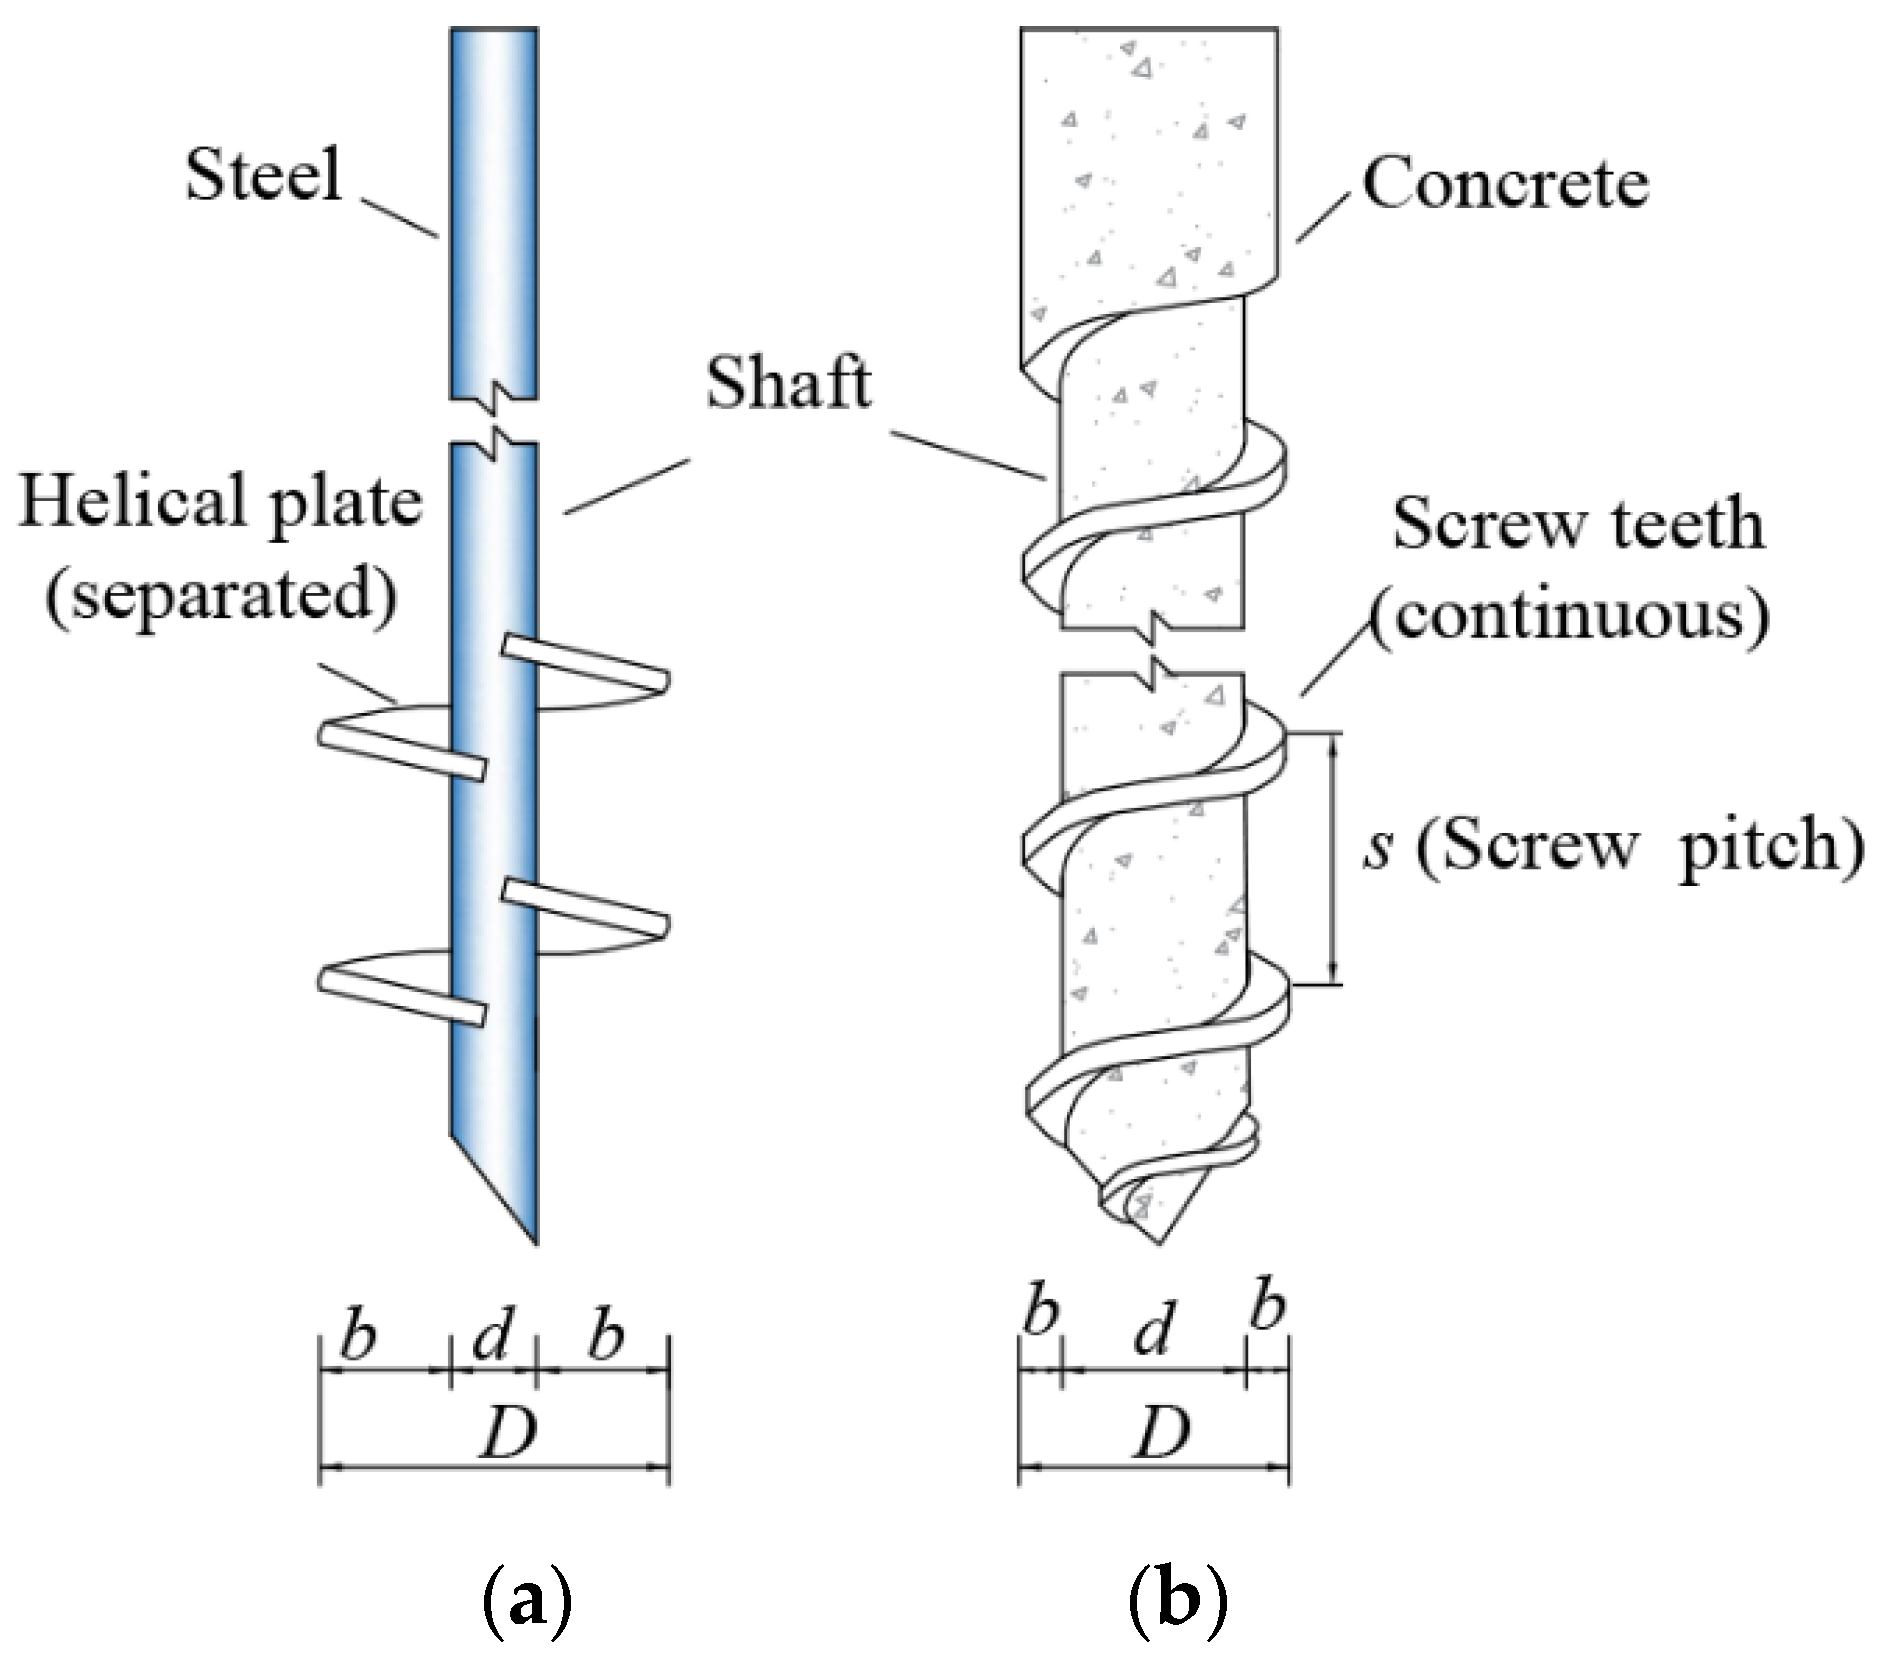
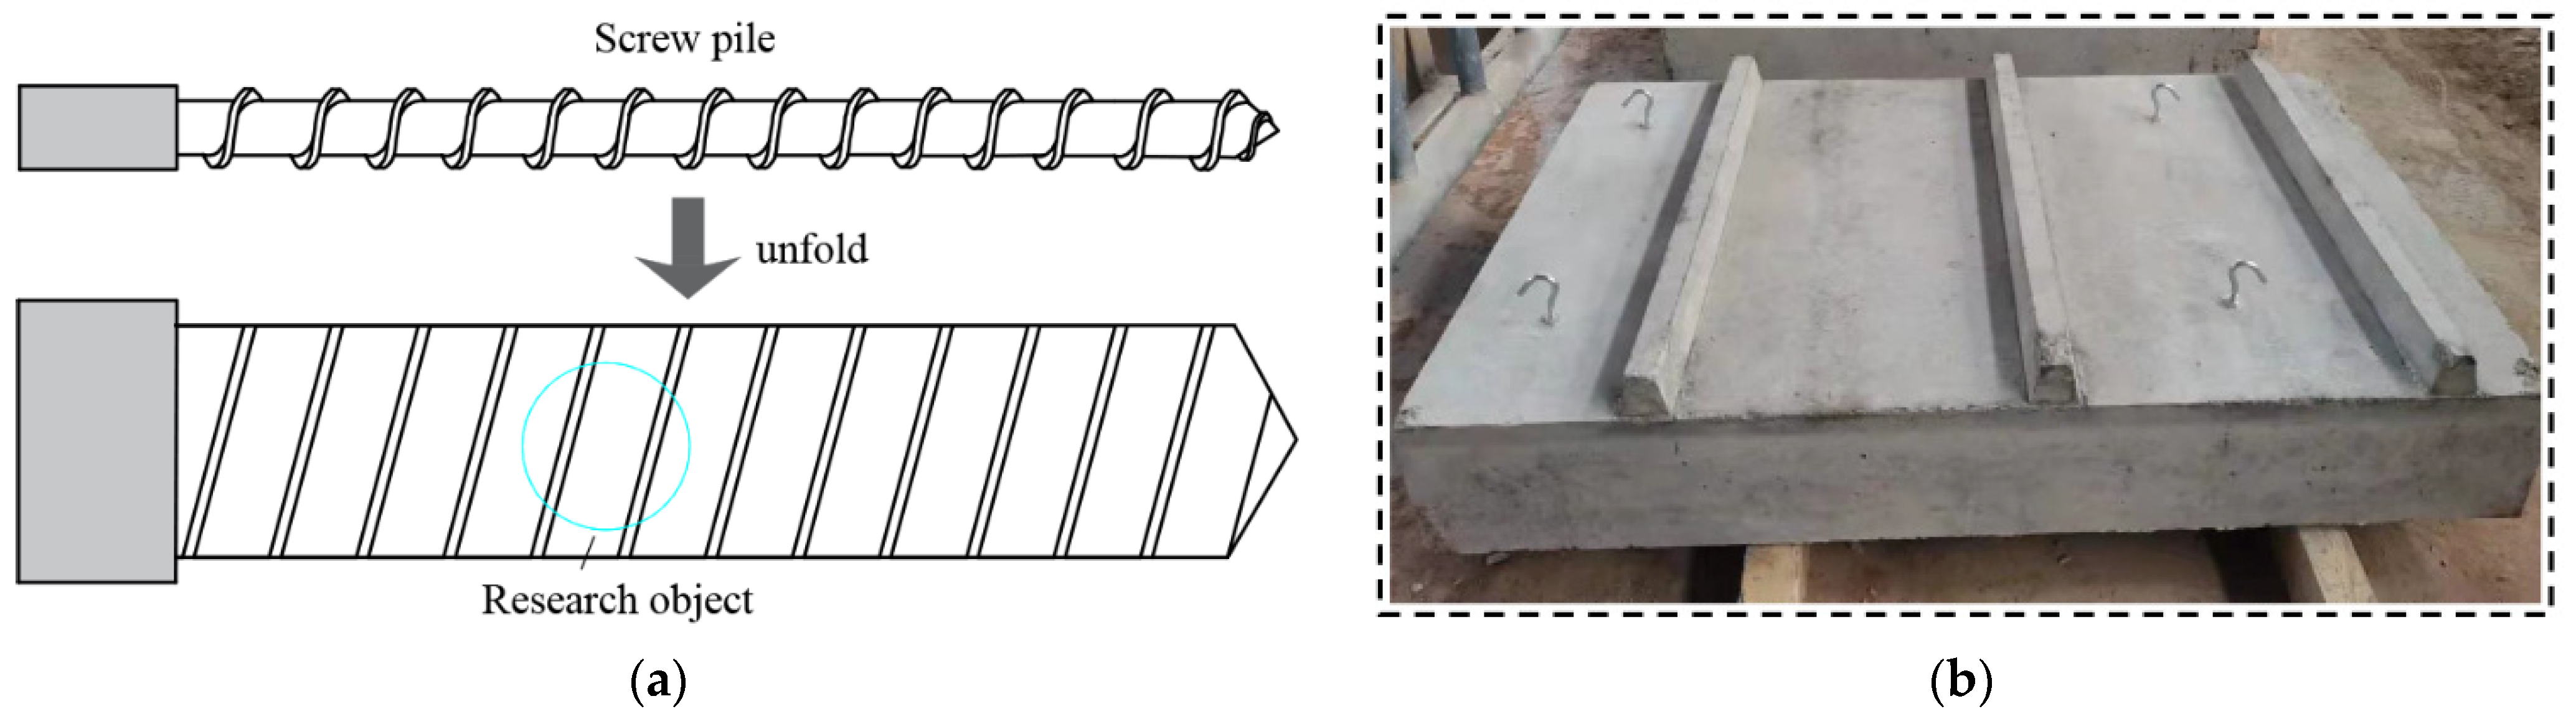
2.1. Model Test Object and Similarity Ratio
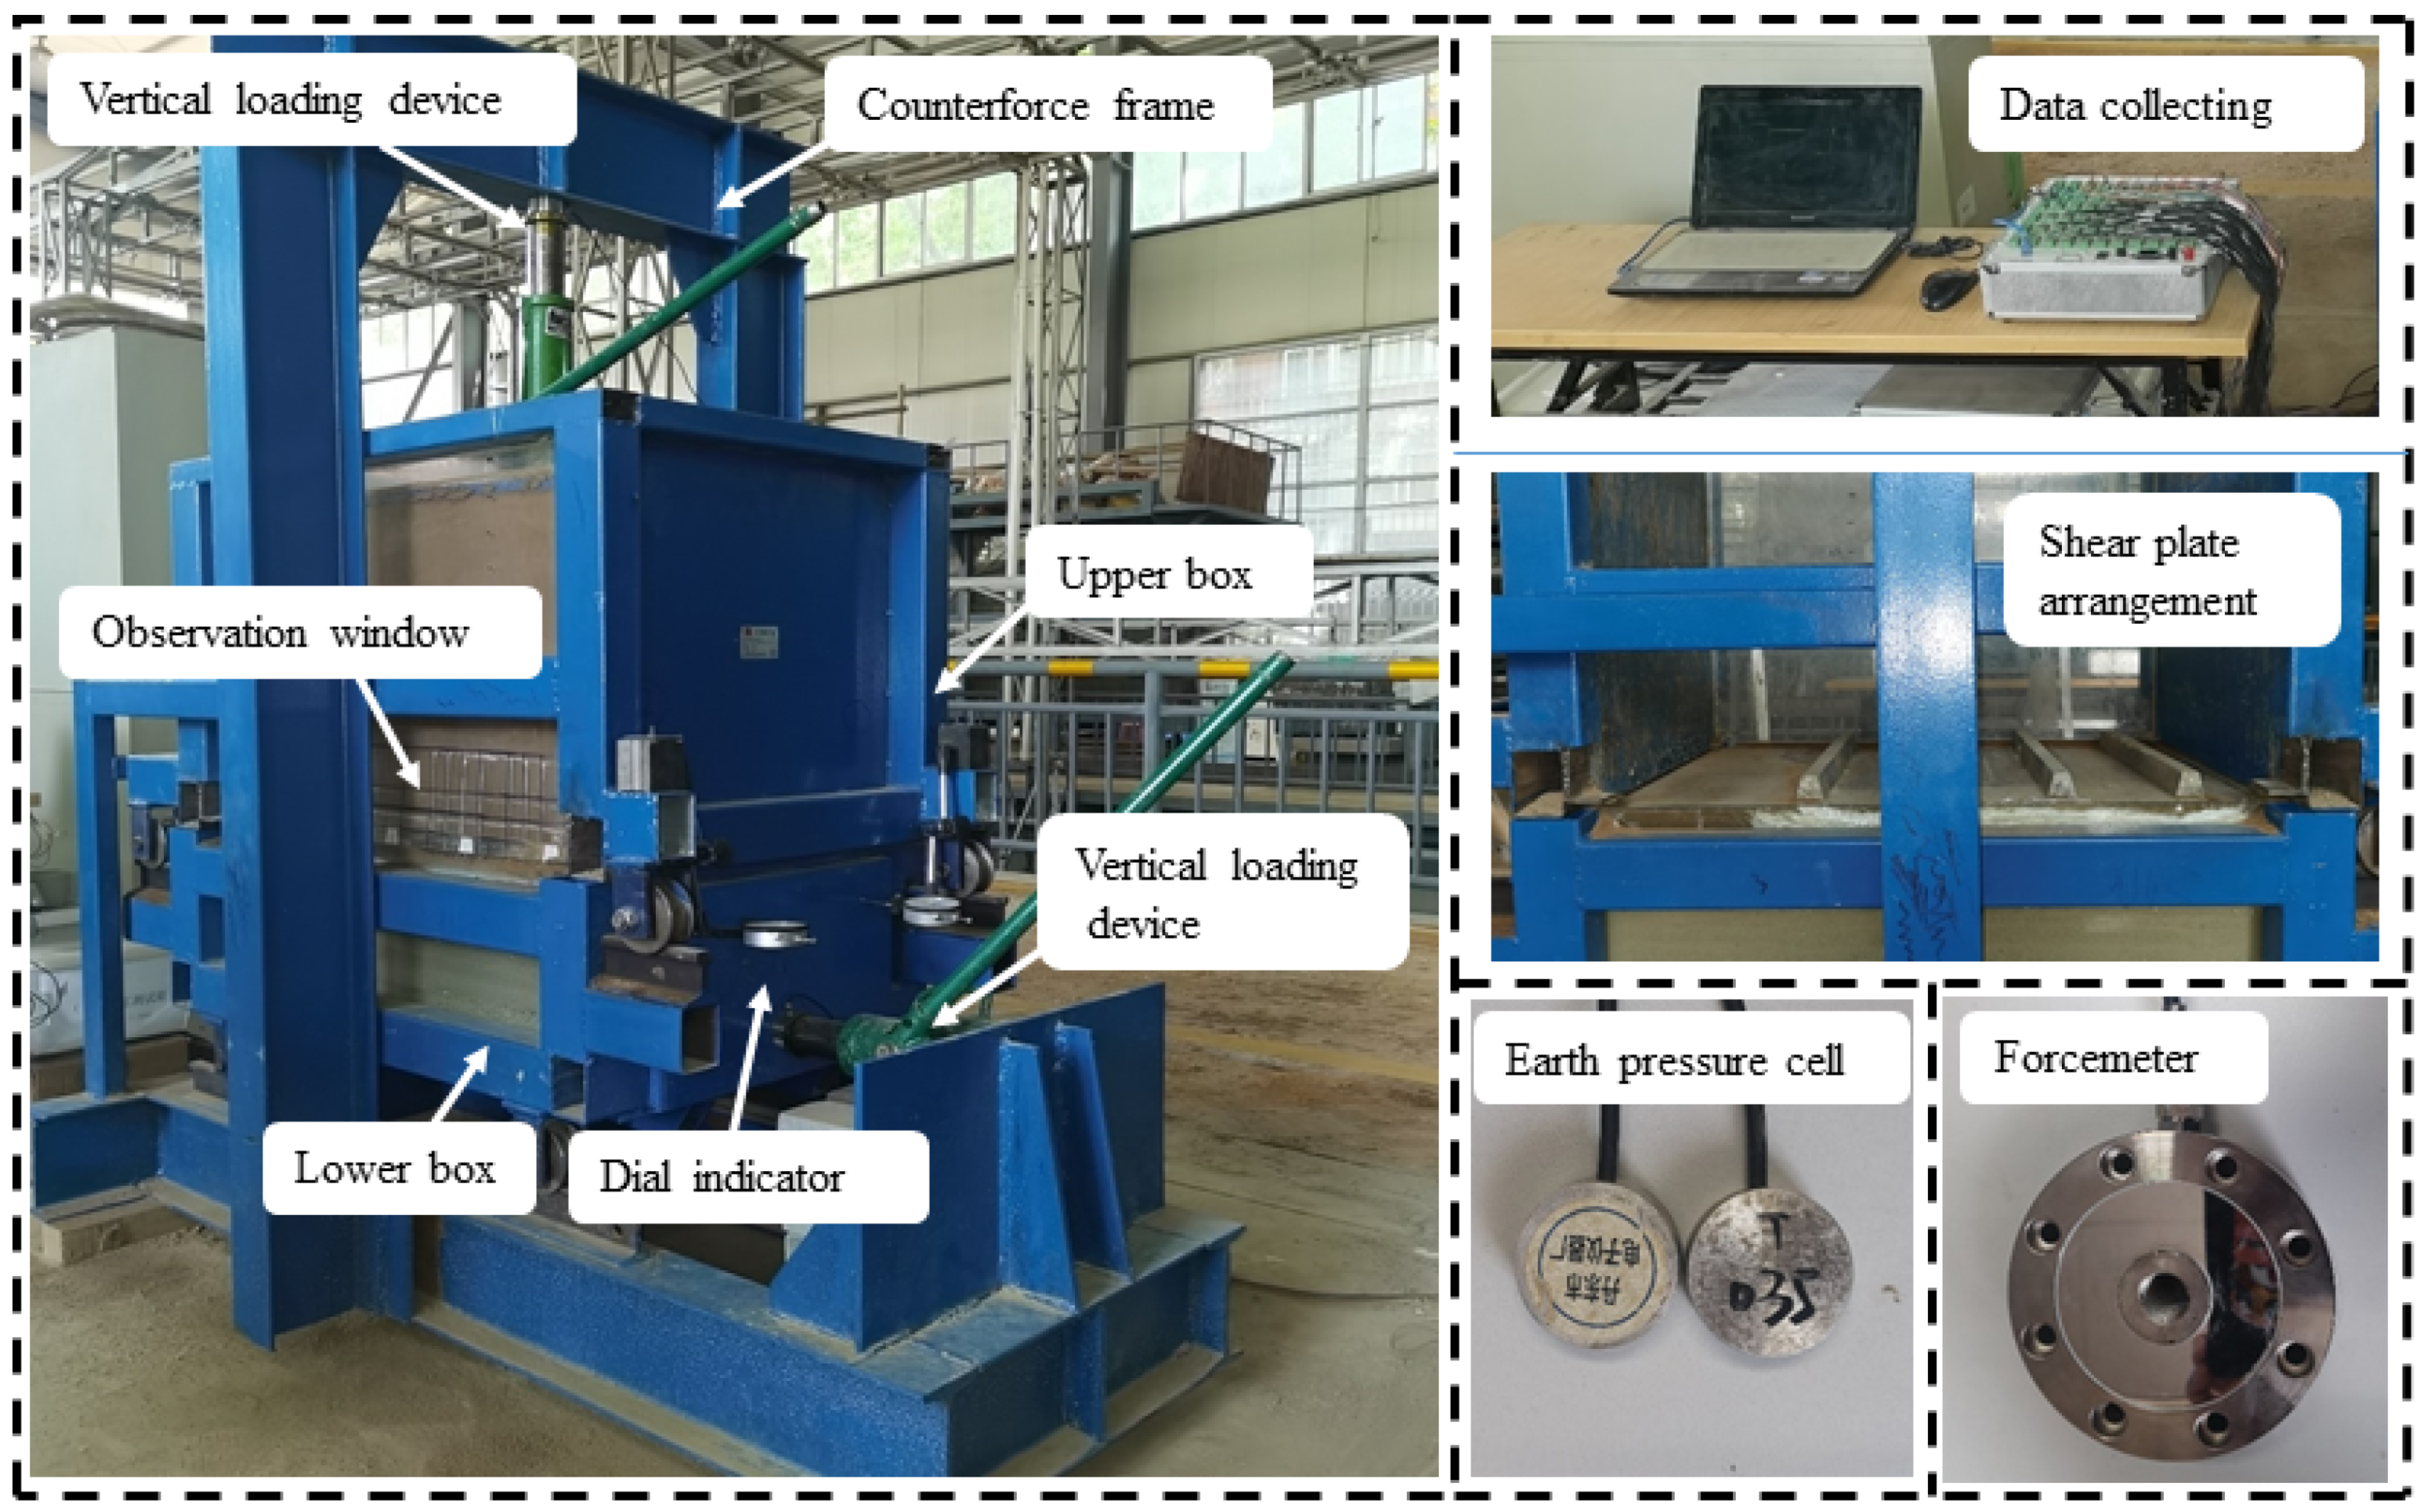
2.2. Test Apparatus and Material
2.3. Loading Procedure
3. Results
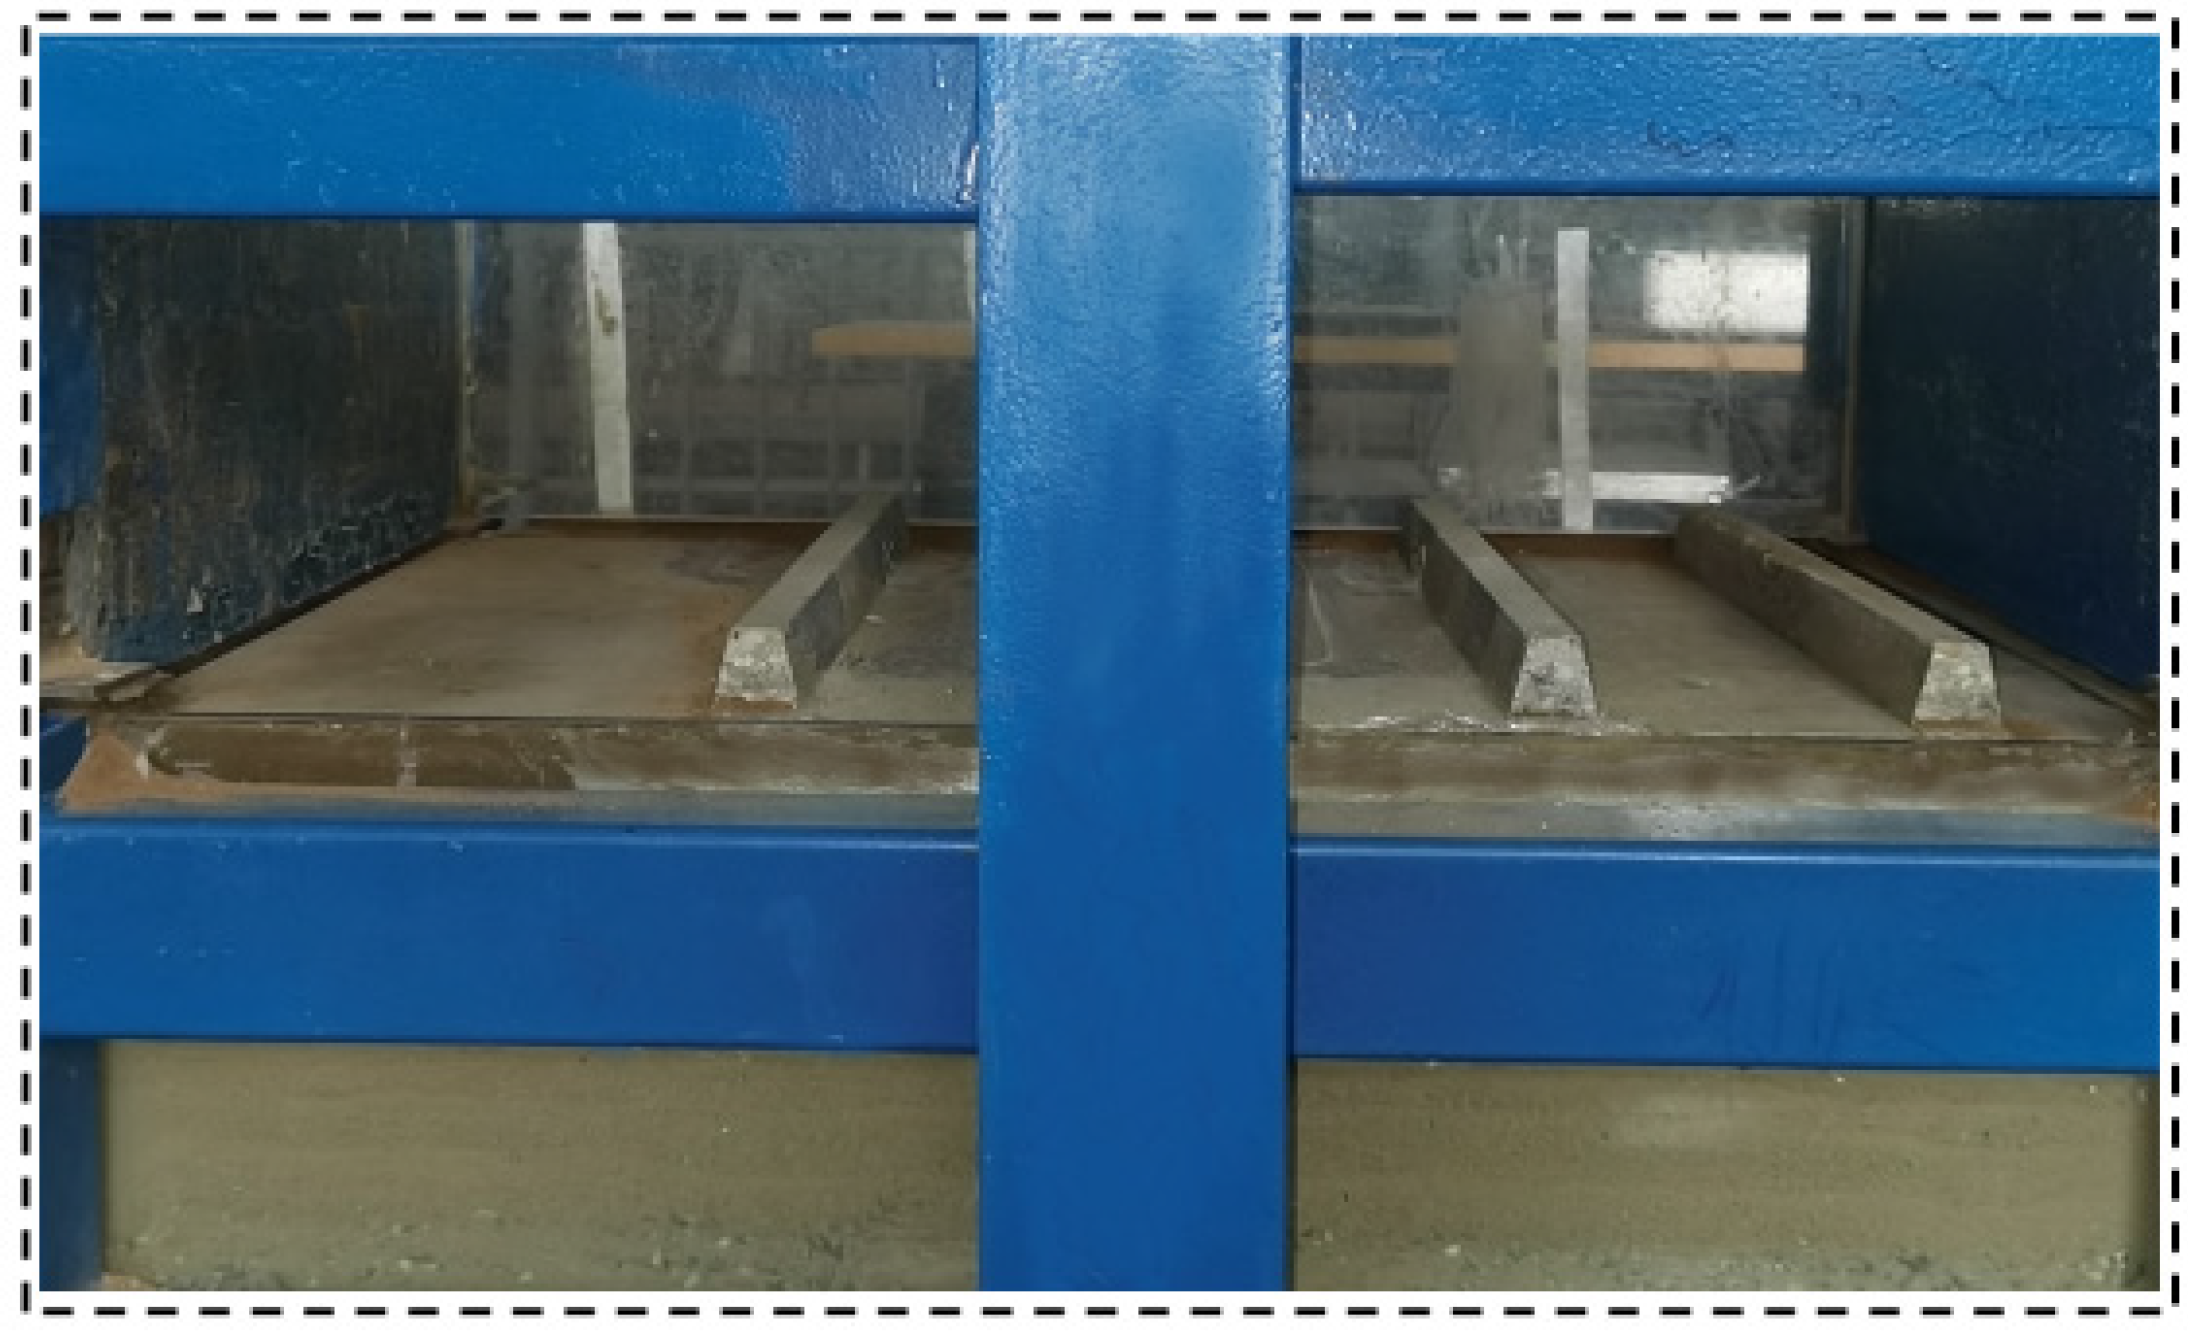
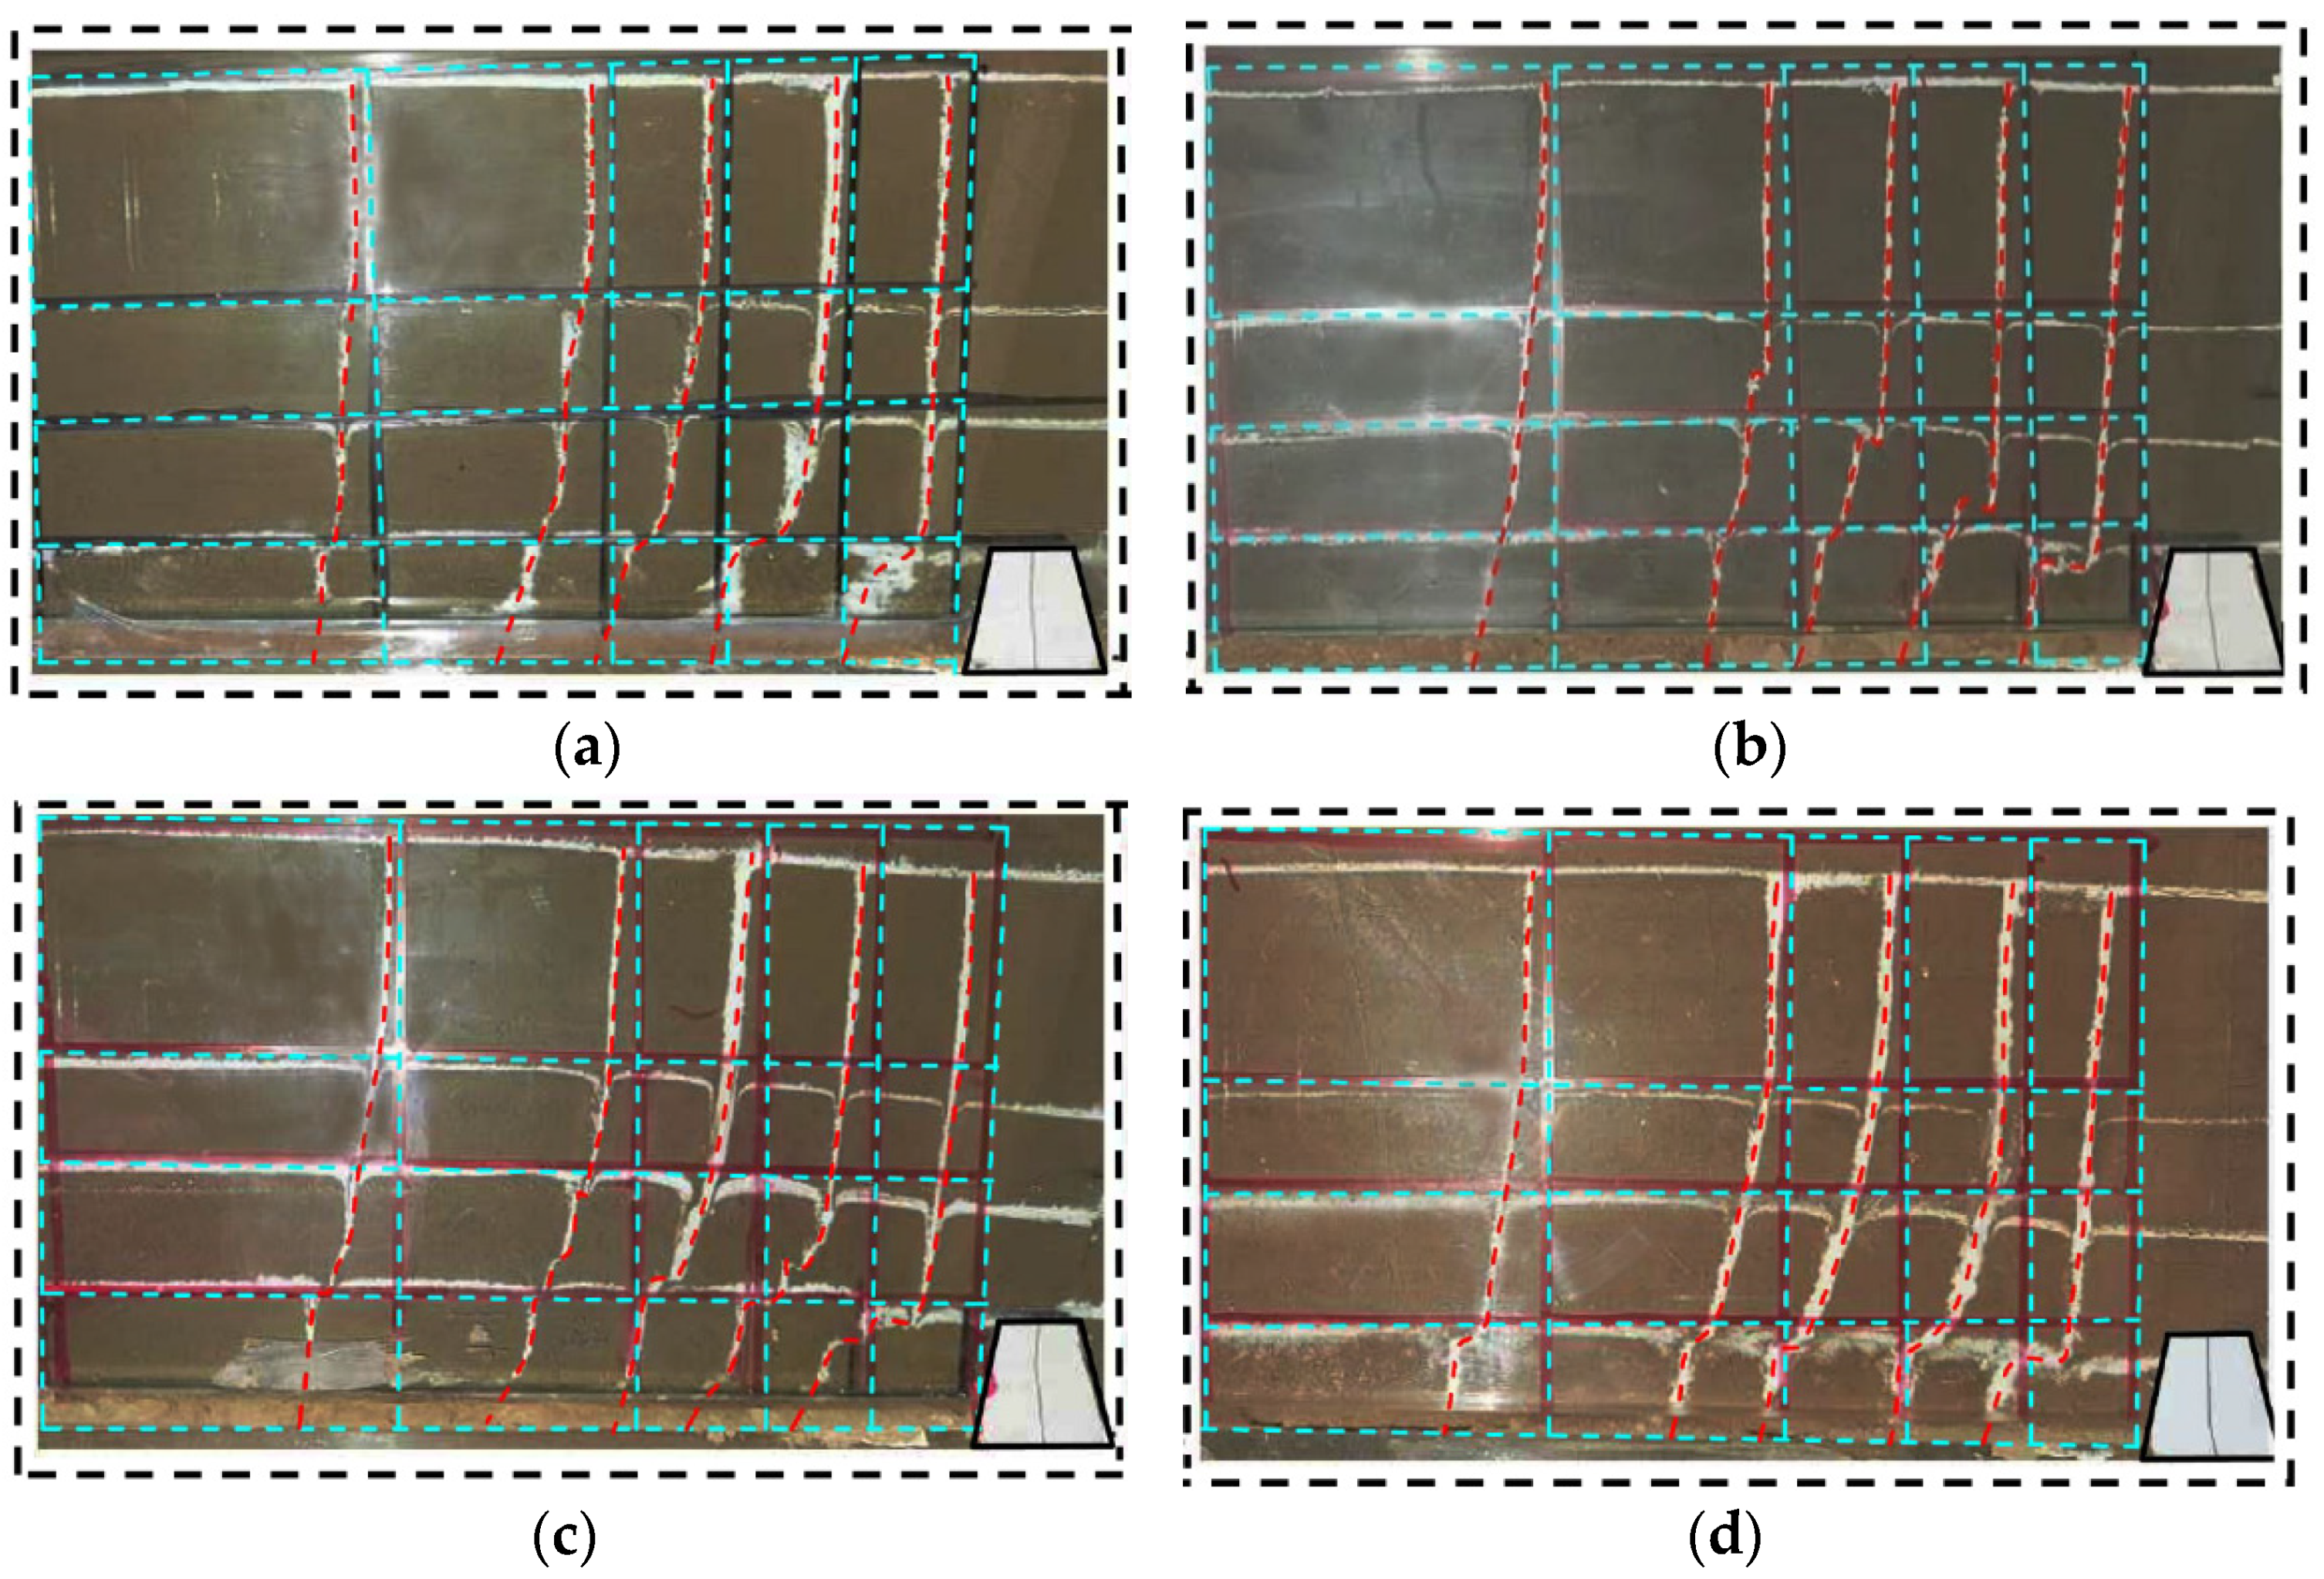
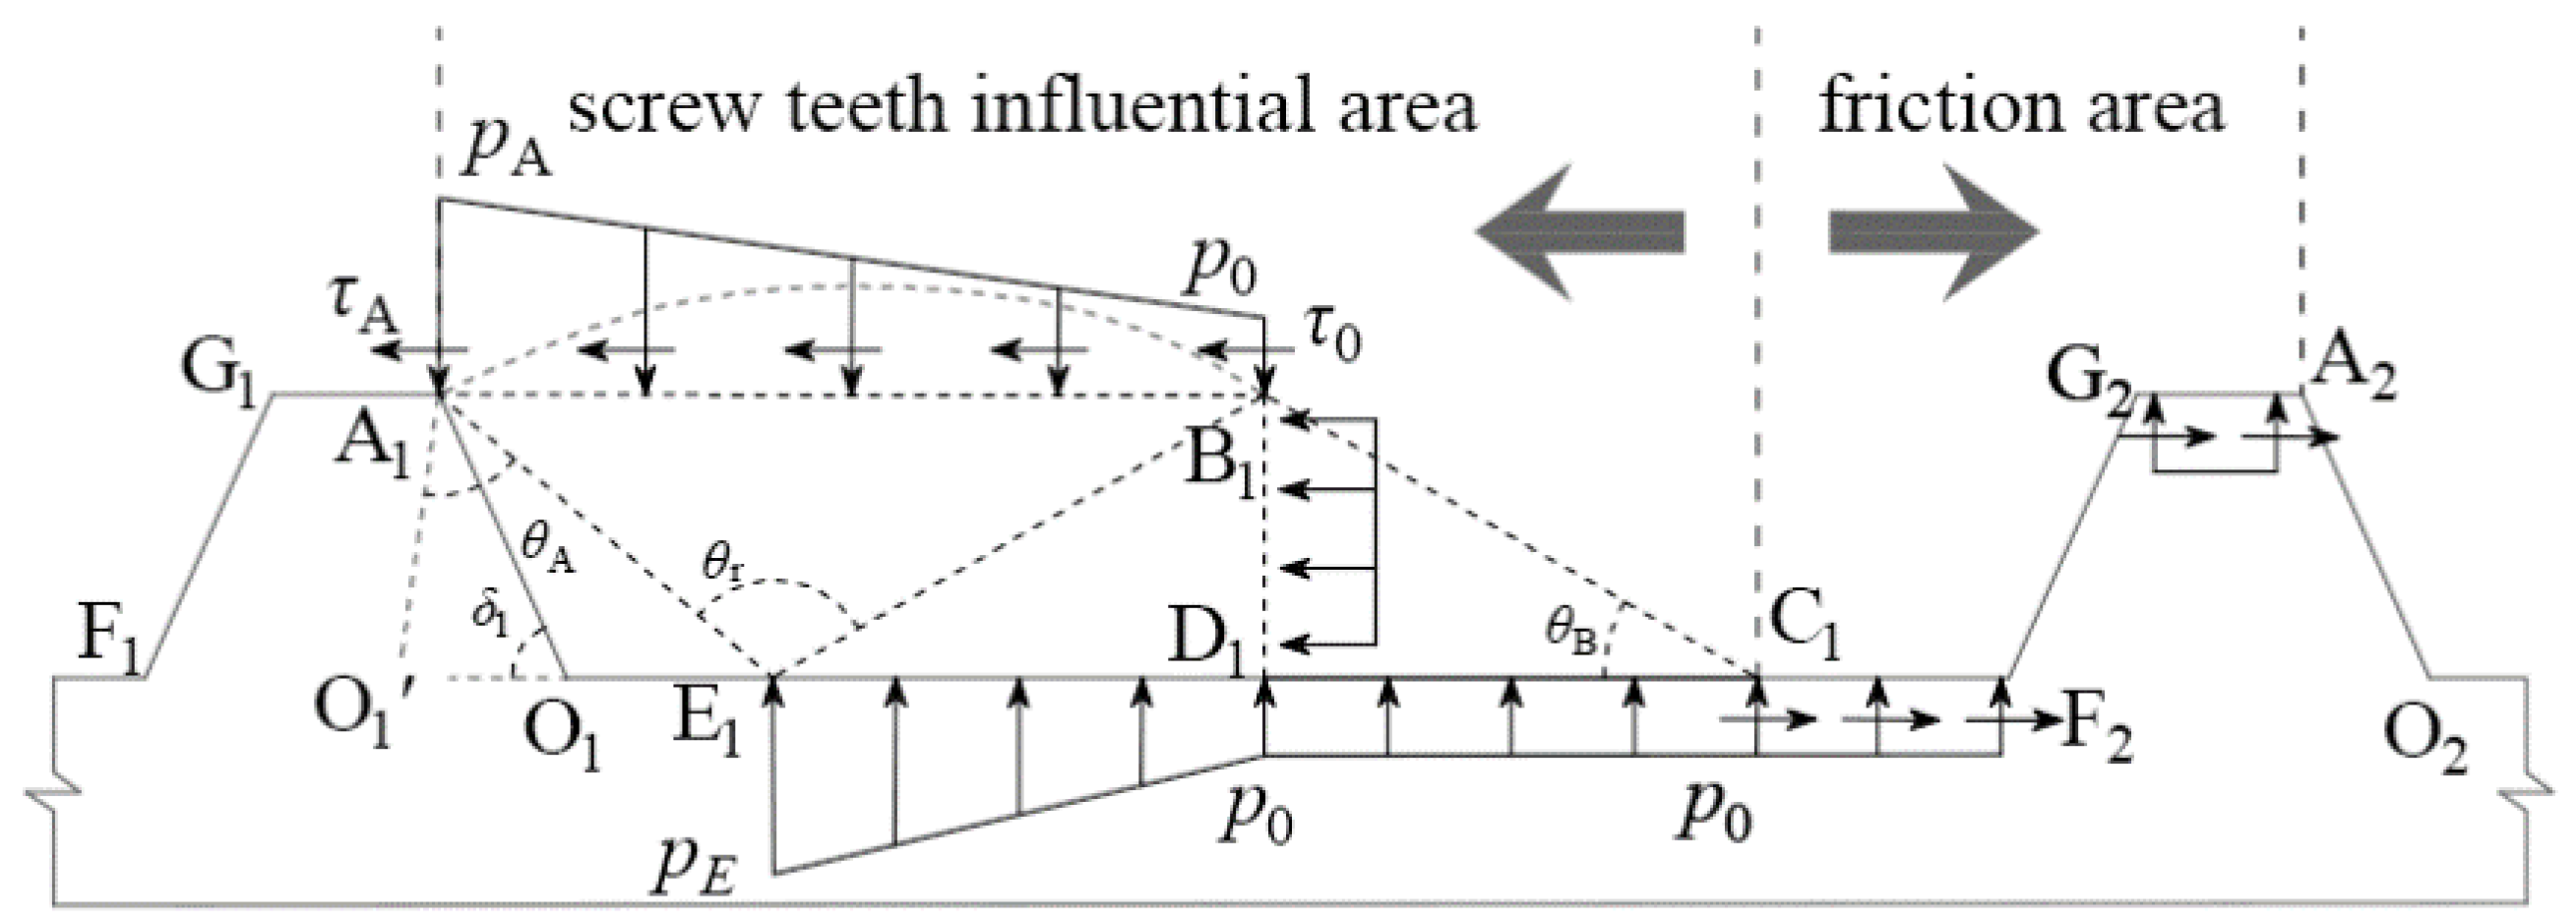
3.1. Macroscopic Shear Characteristics
3.2. Mechanical Characteristics of Screw Teeth
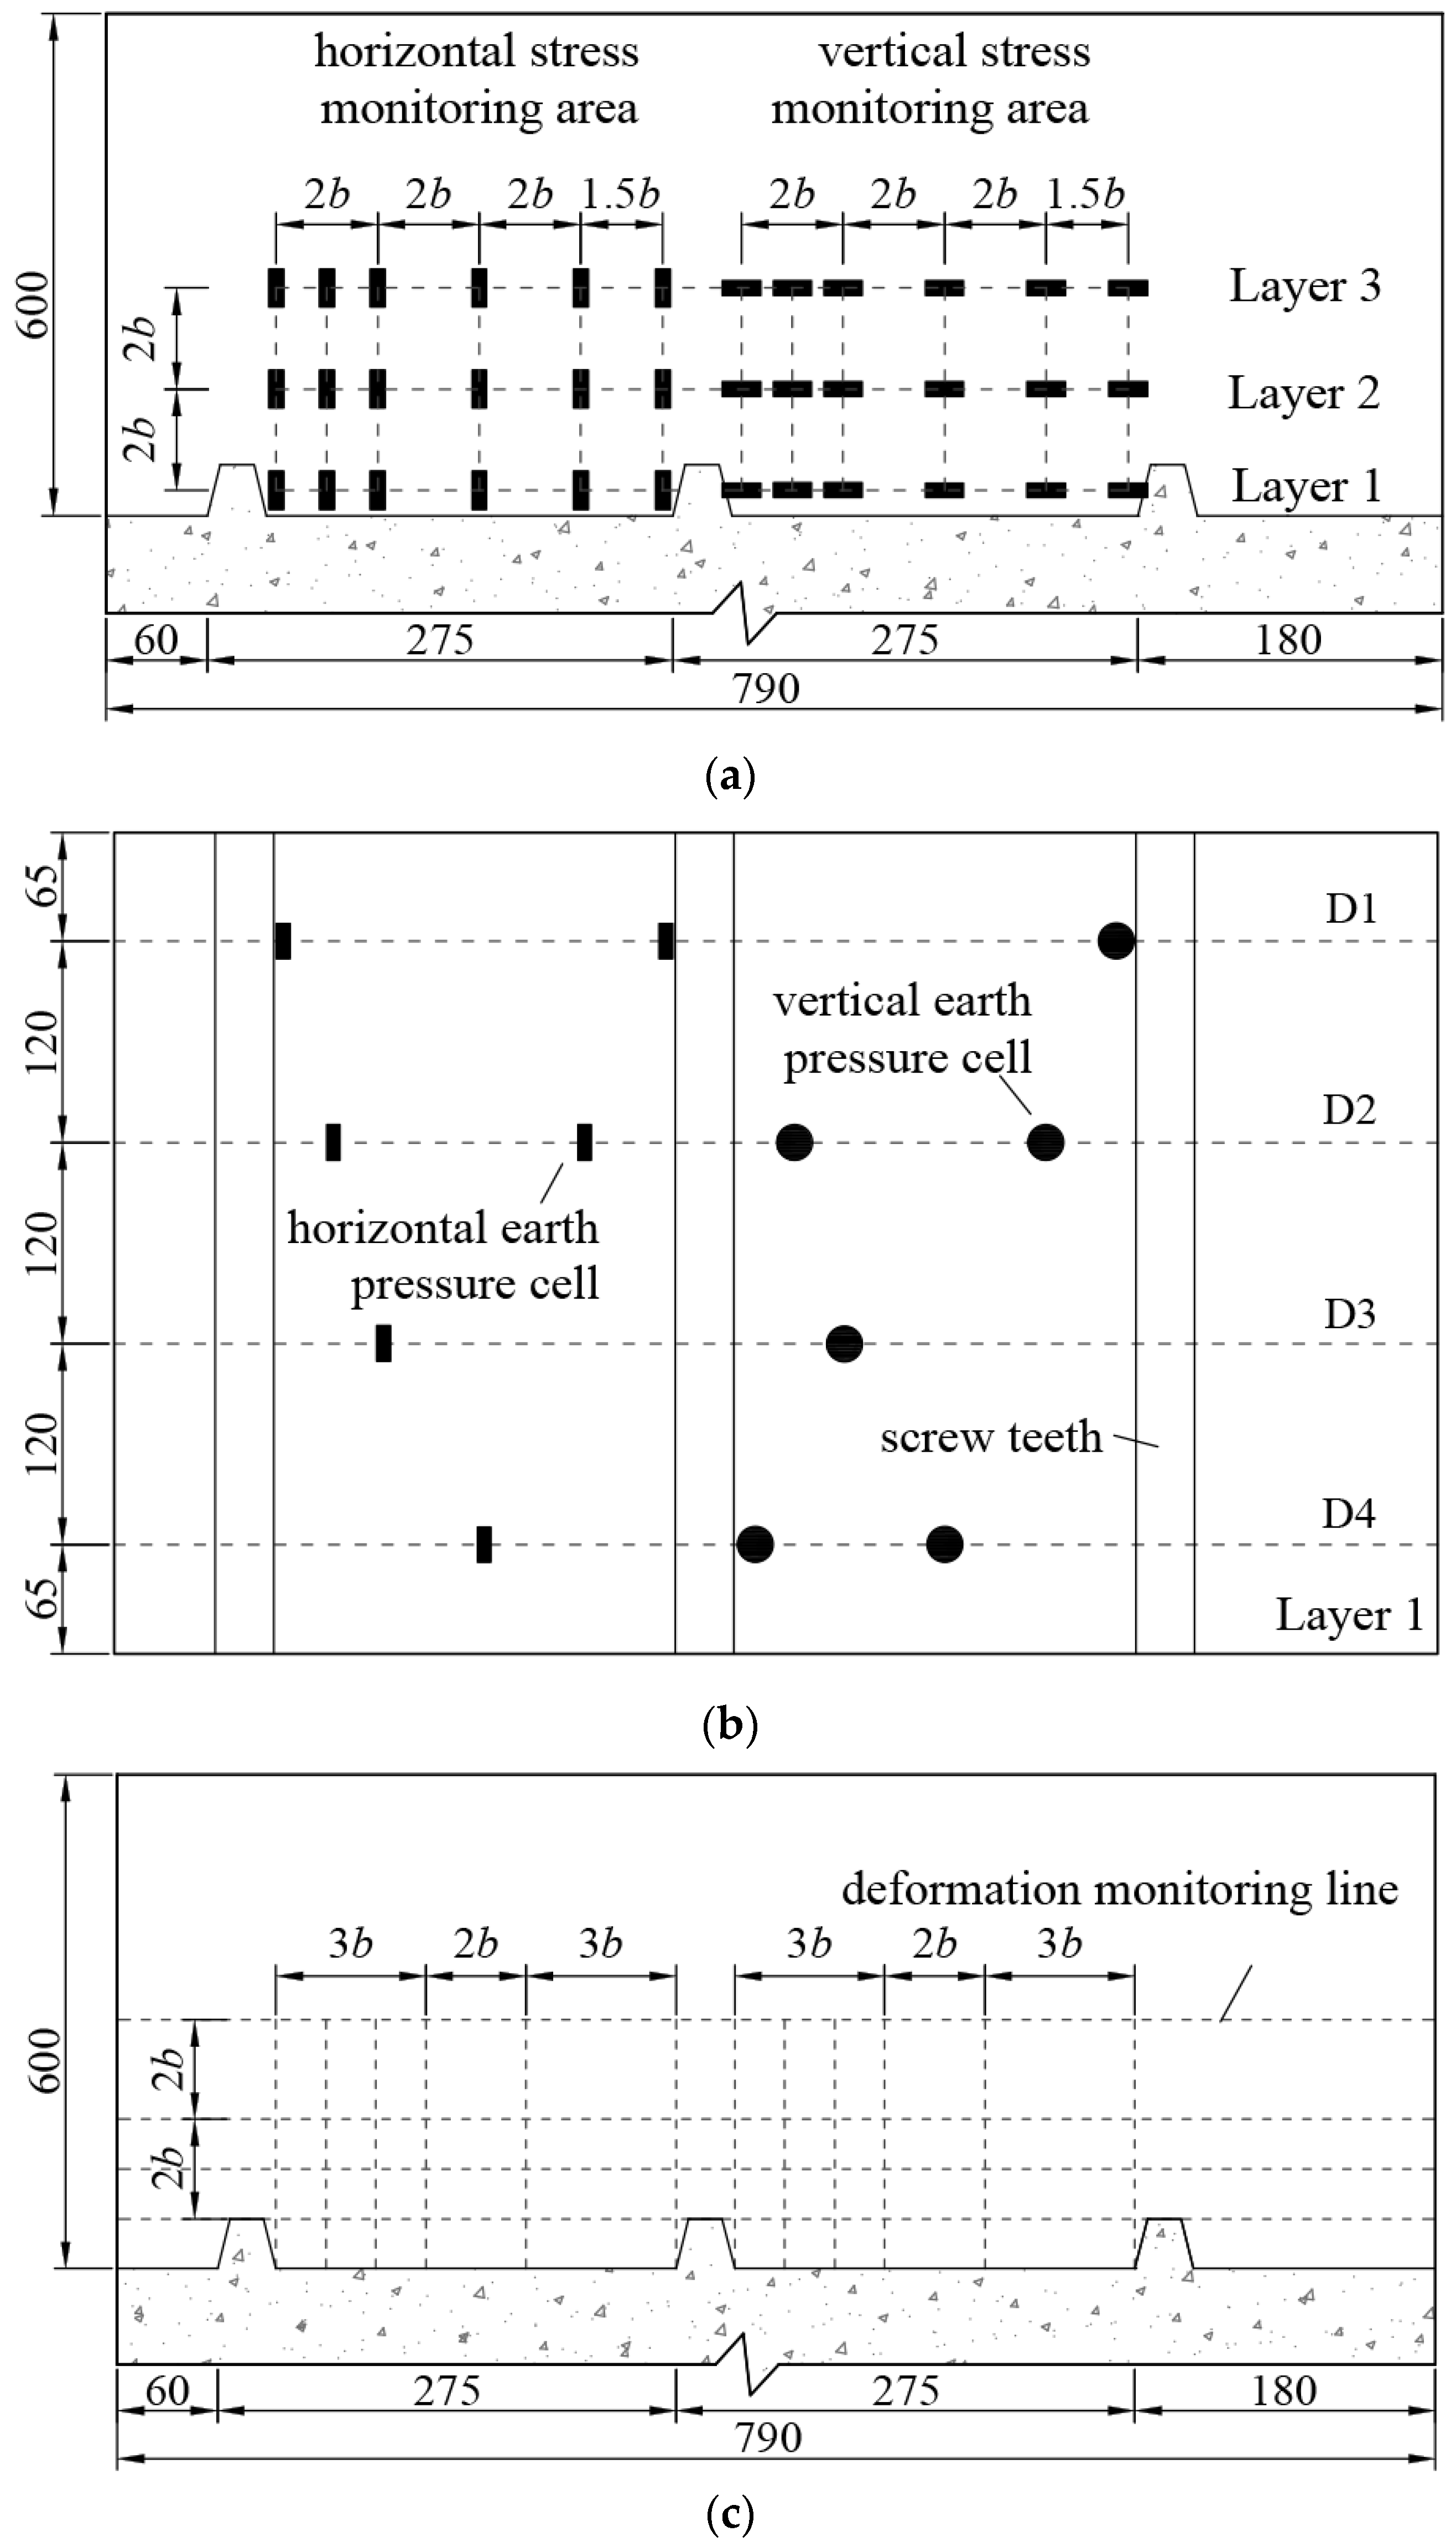
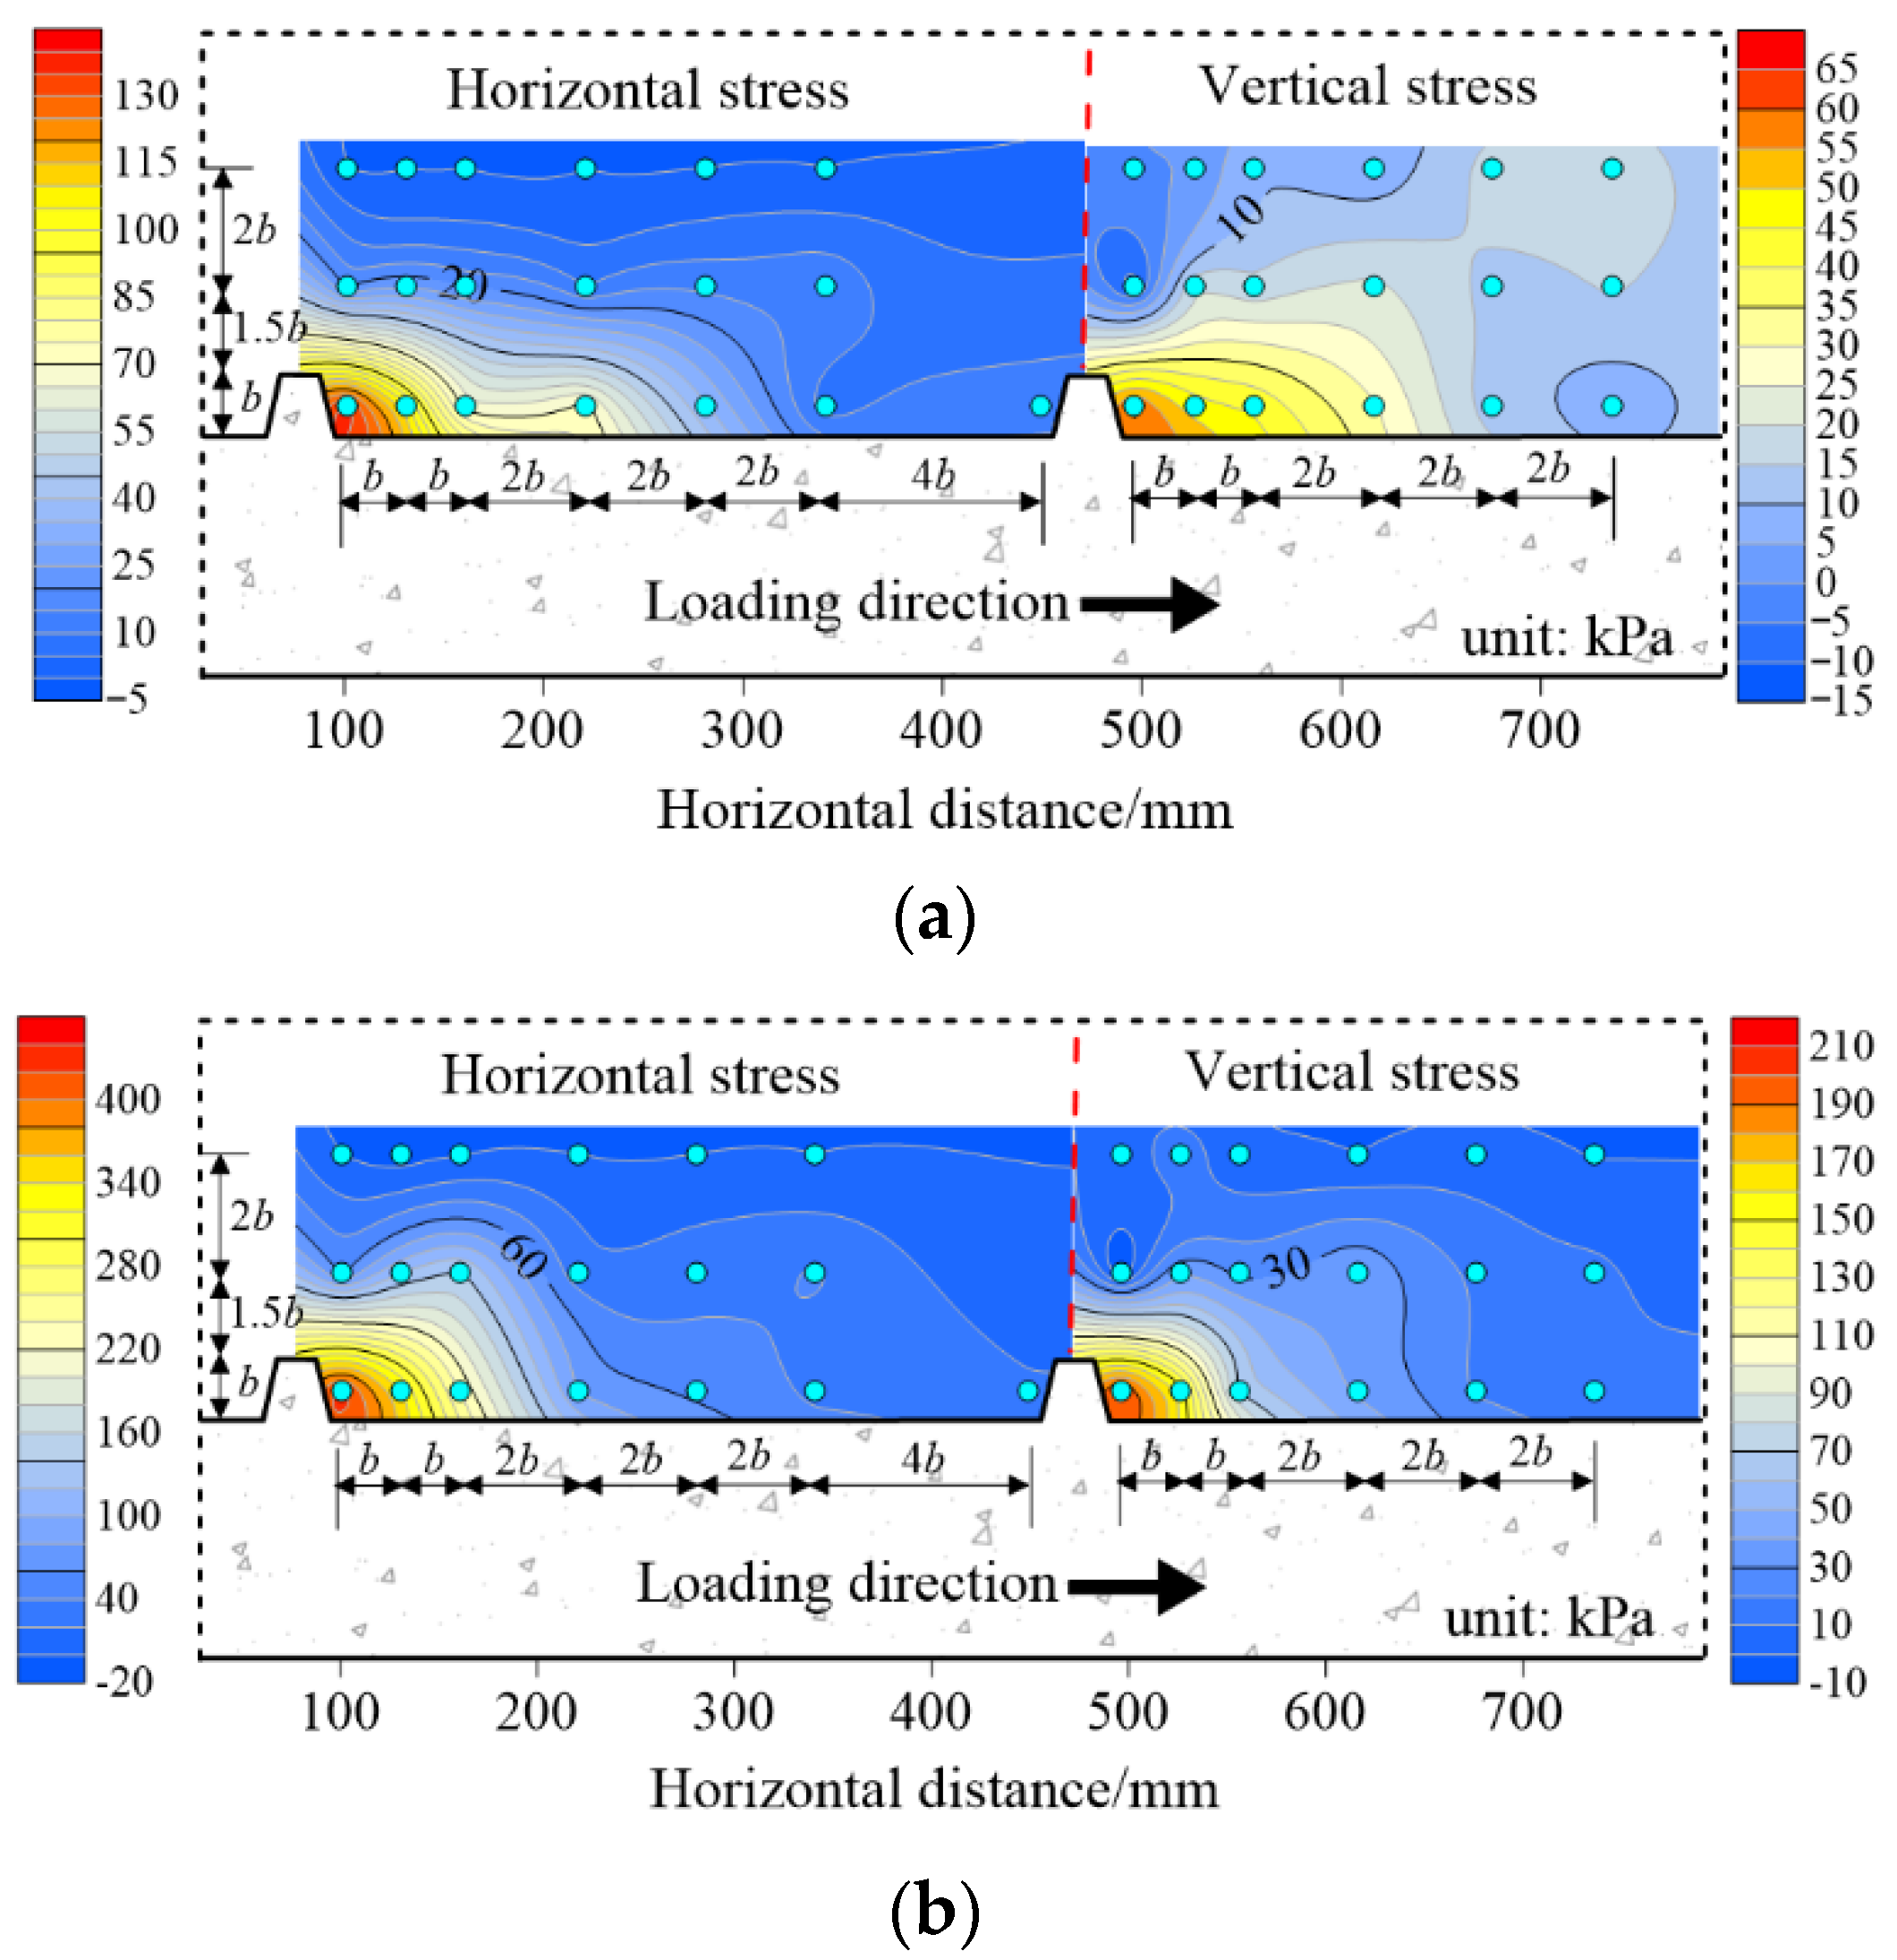
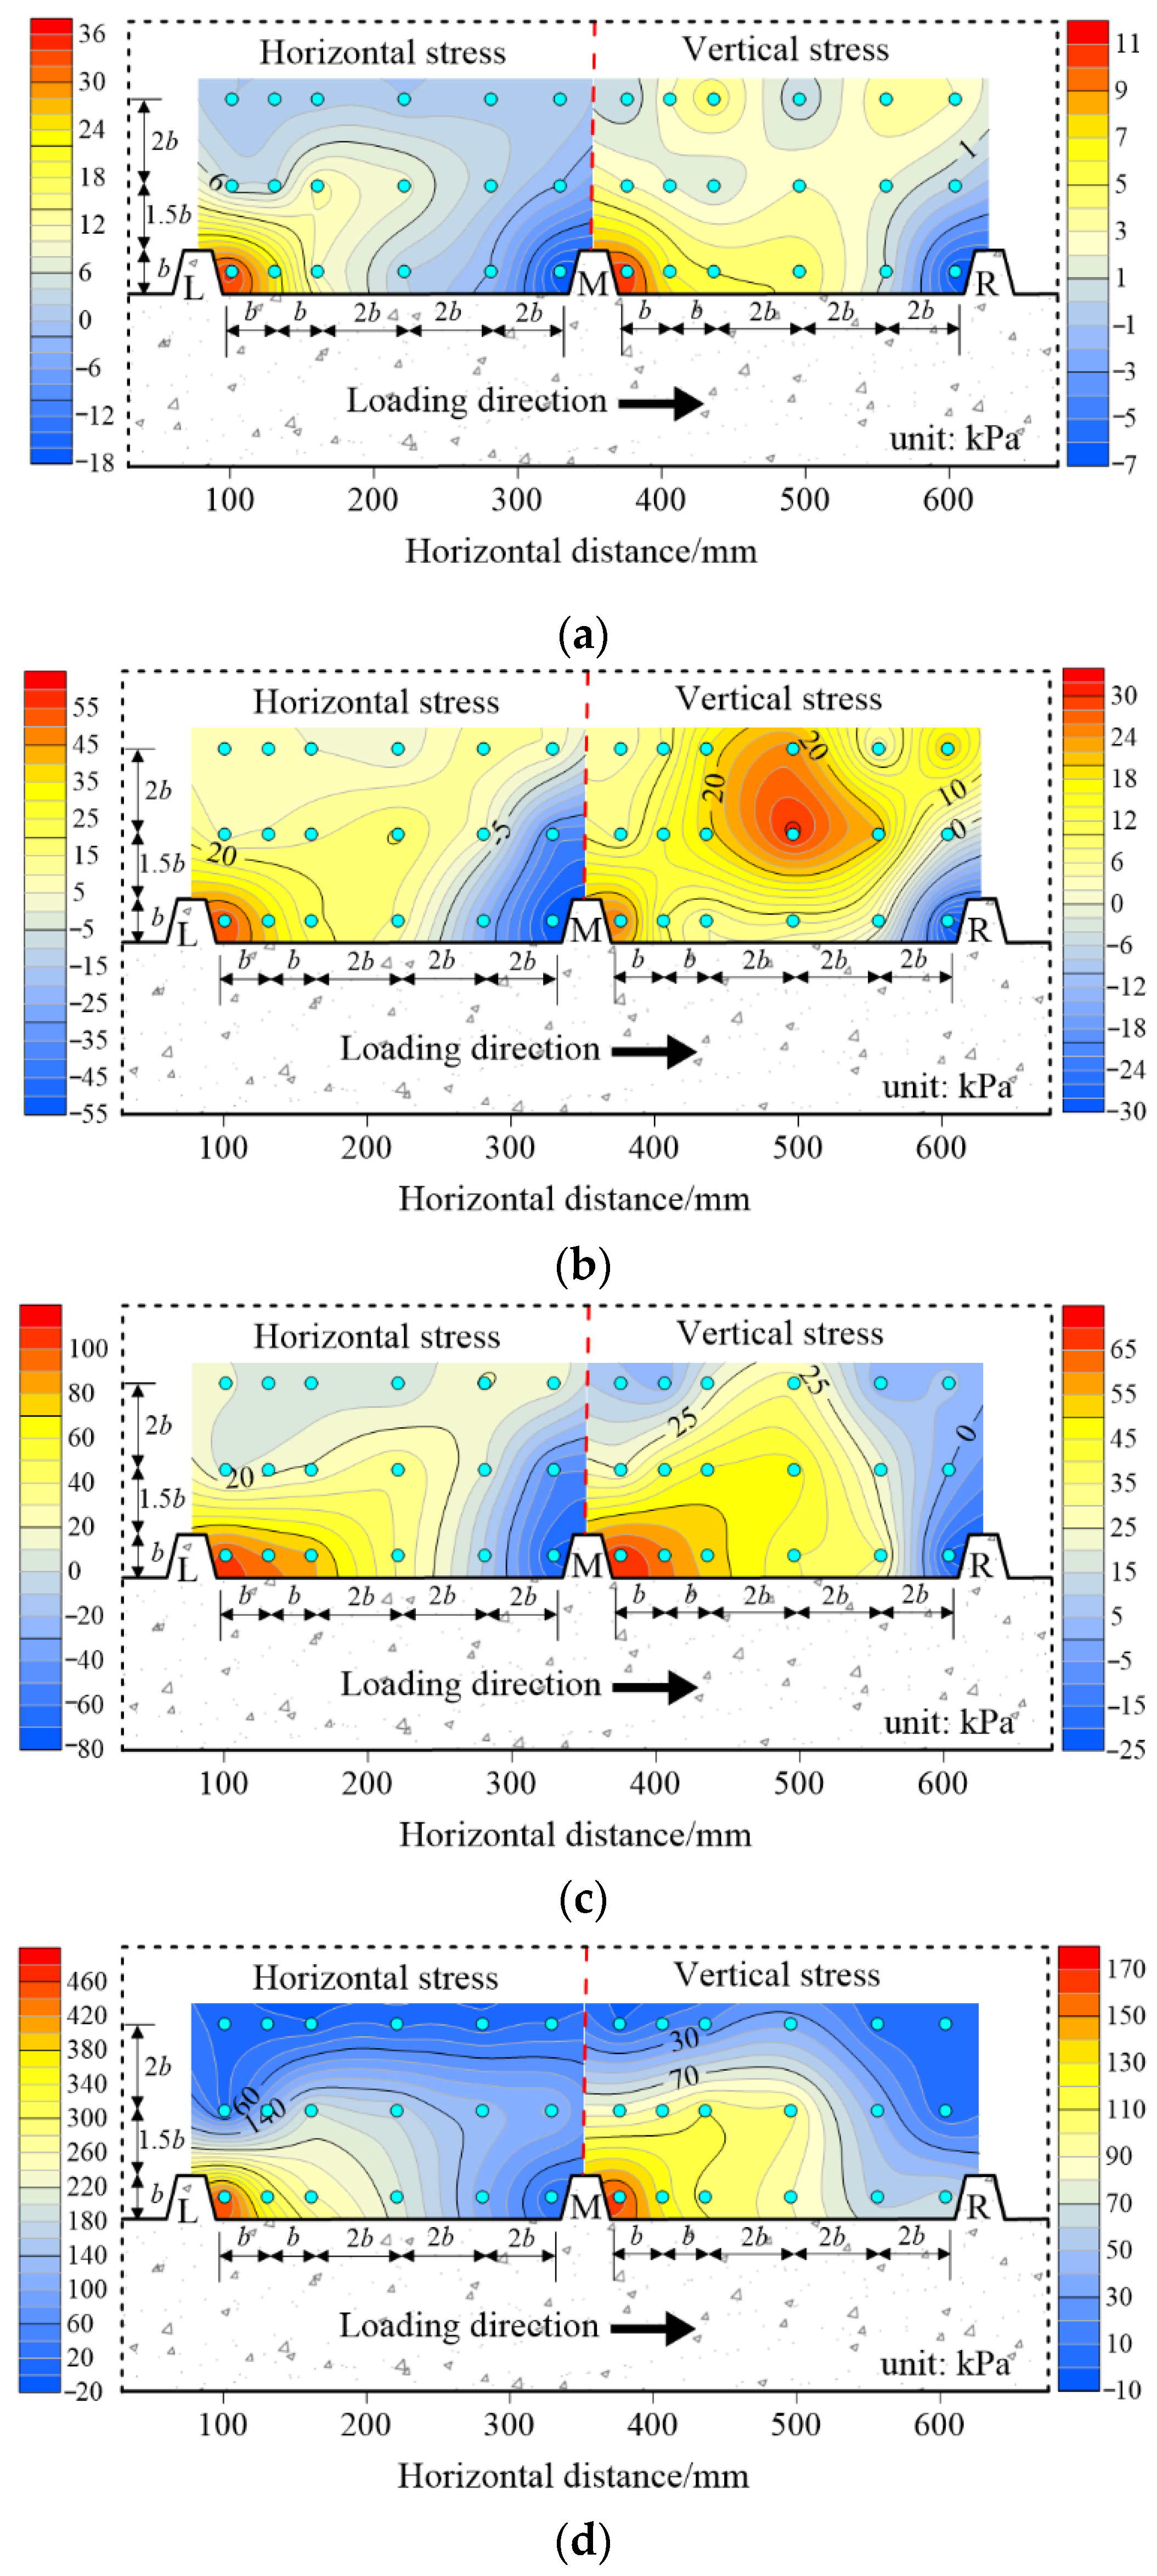
3.2.1. Soil Stress
3.2.2. Soil Deformation
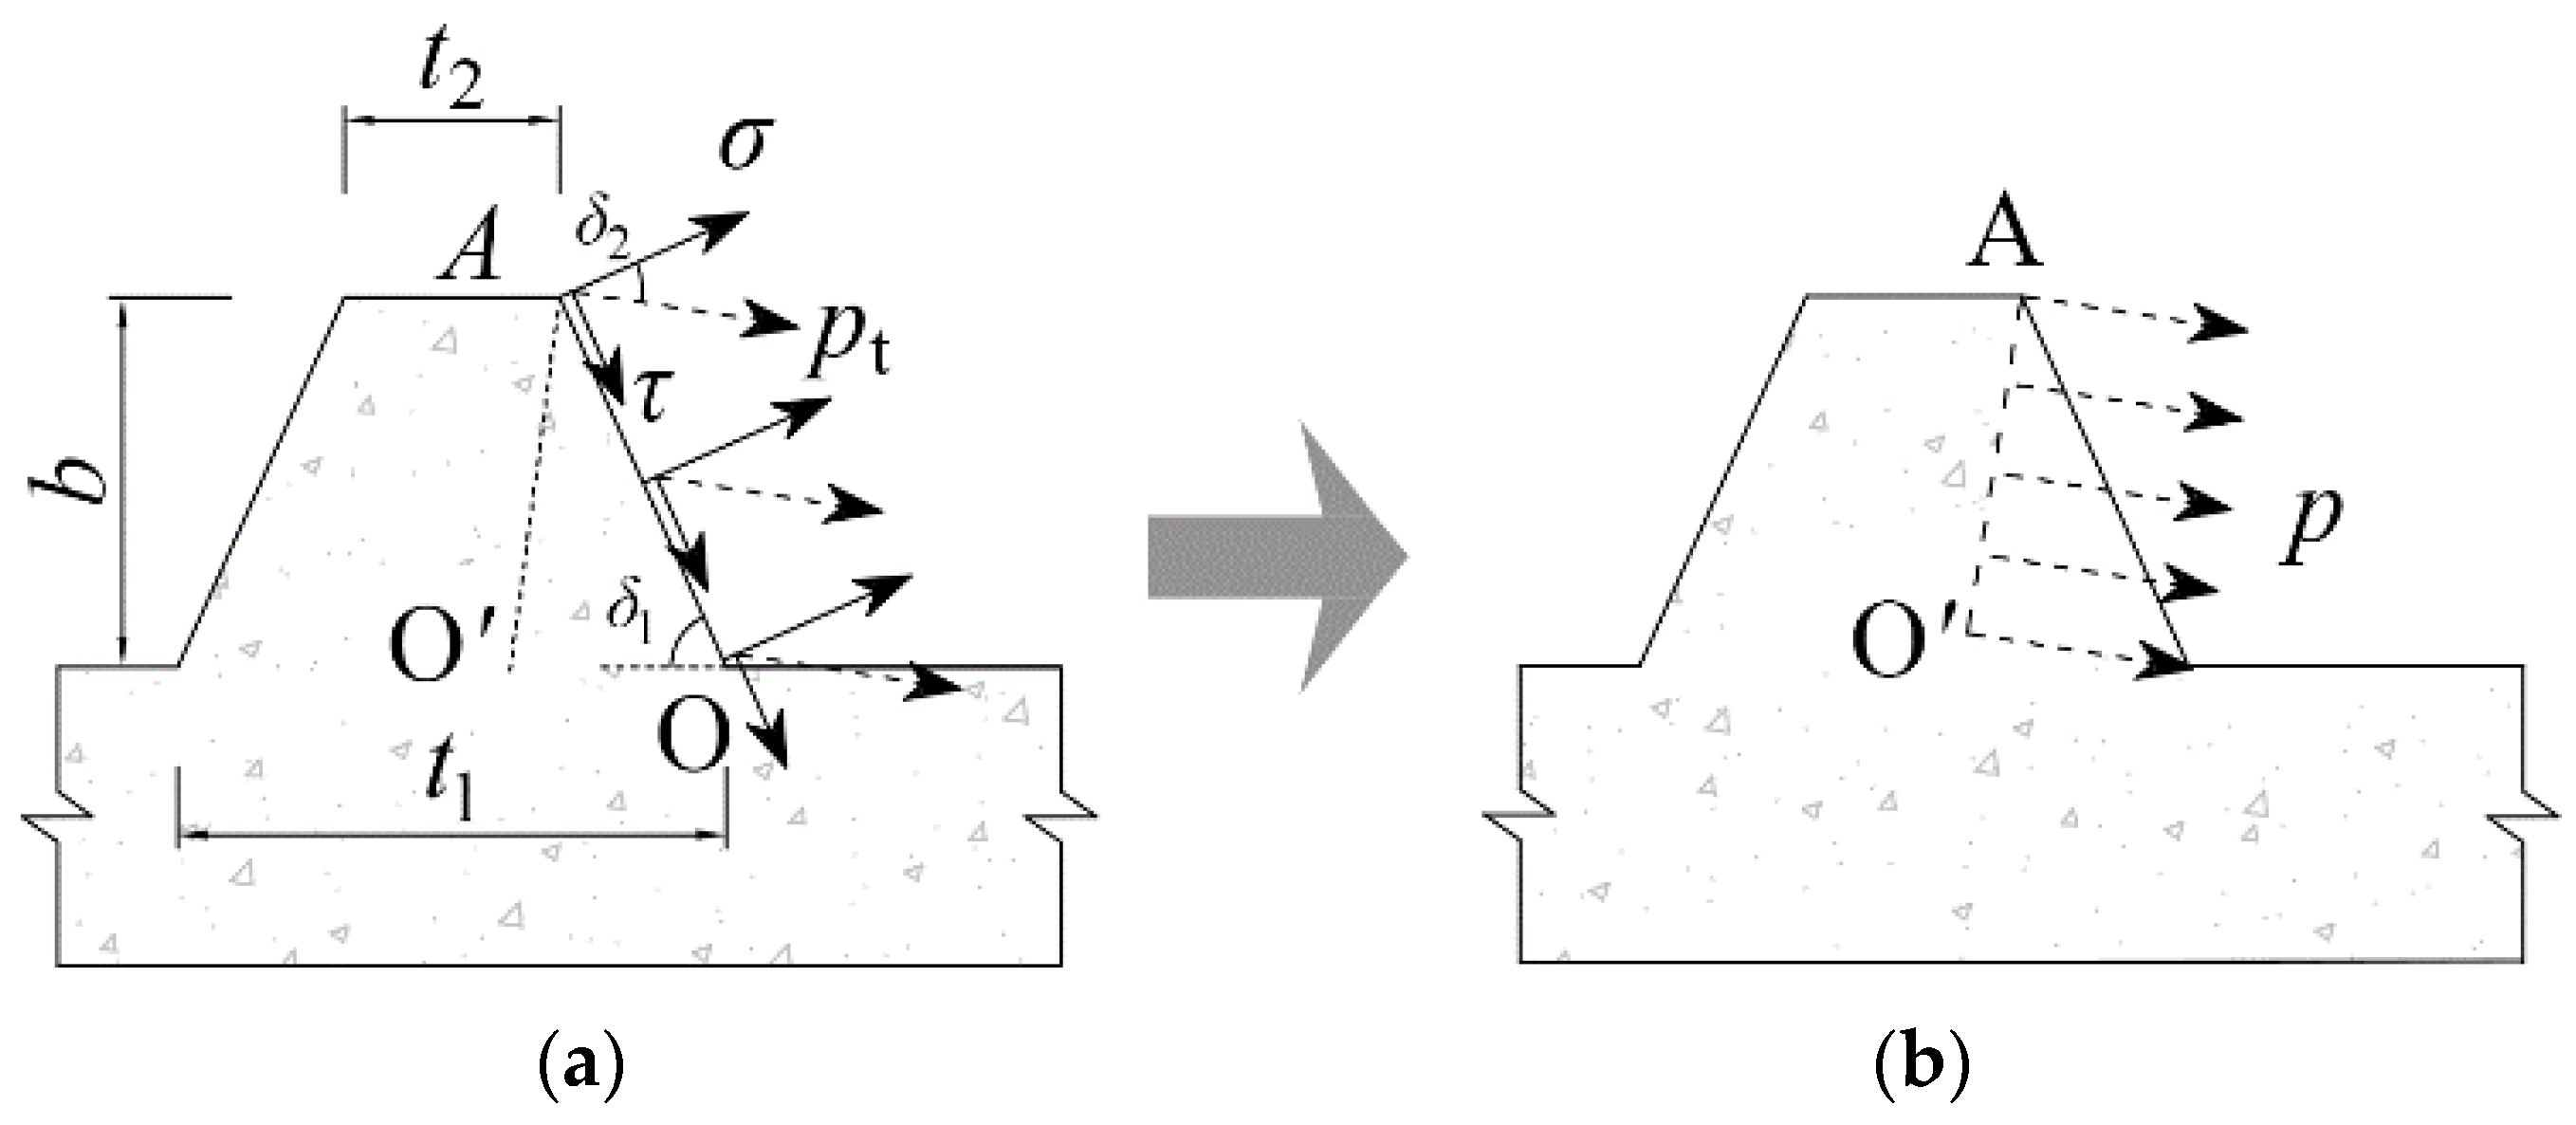
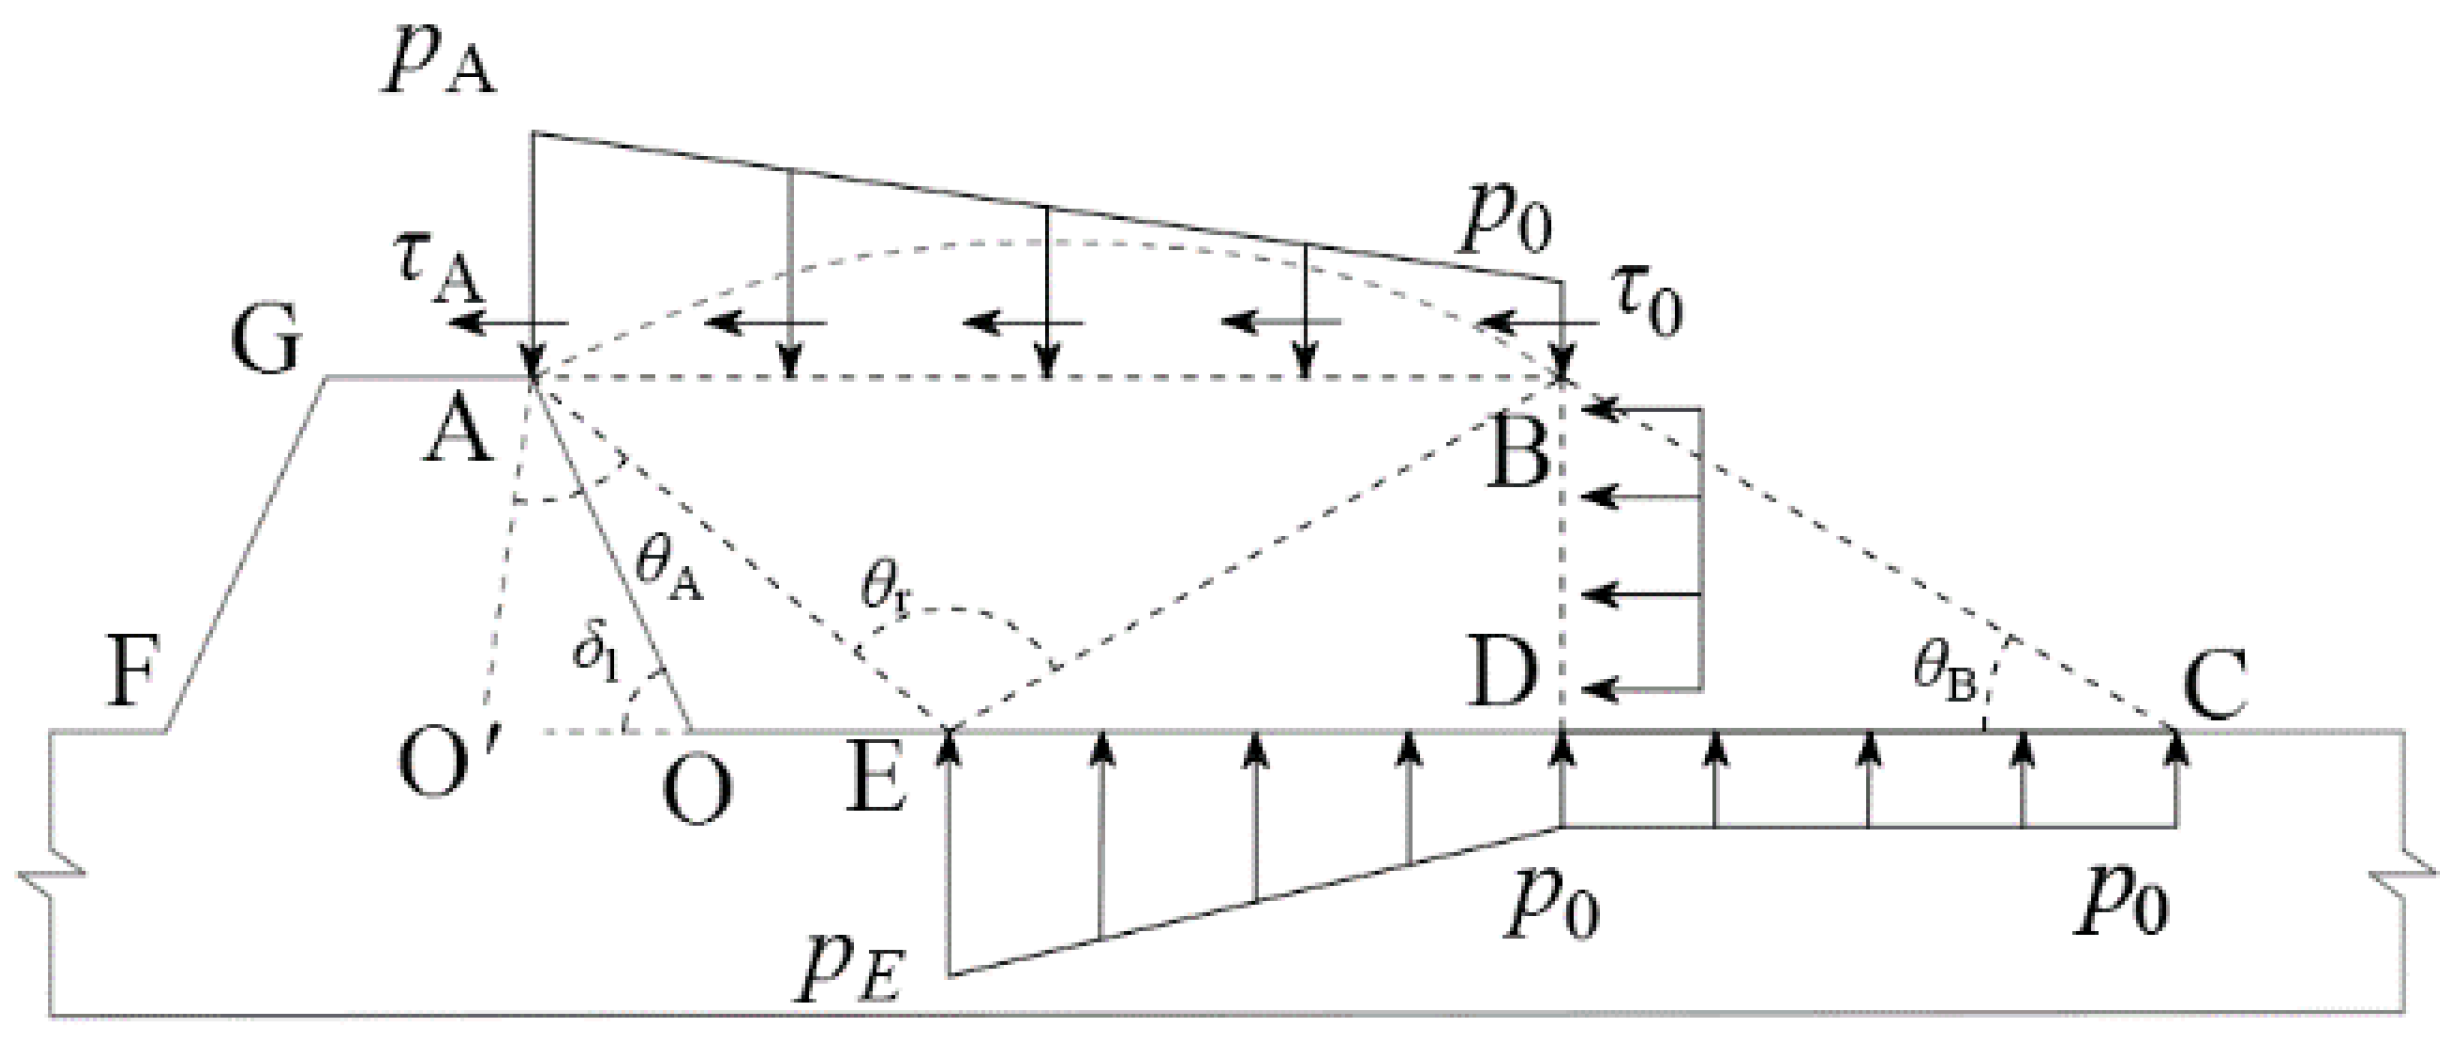
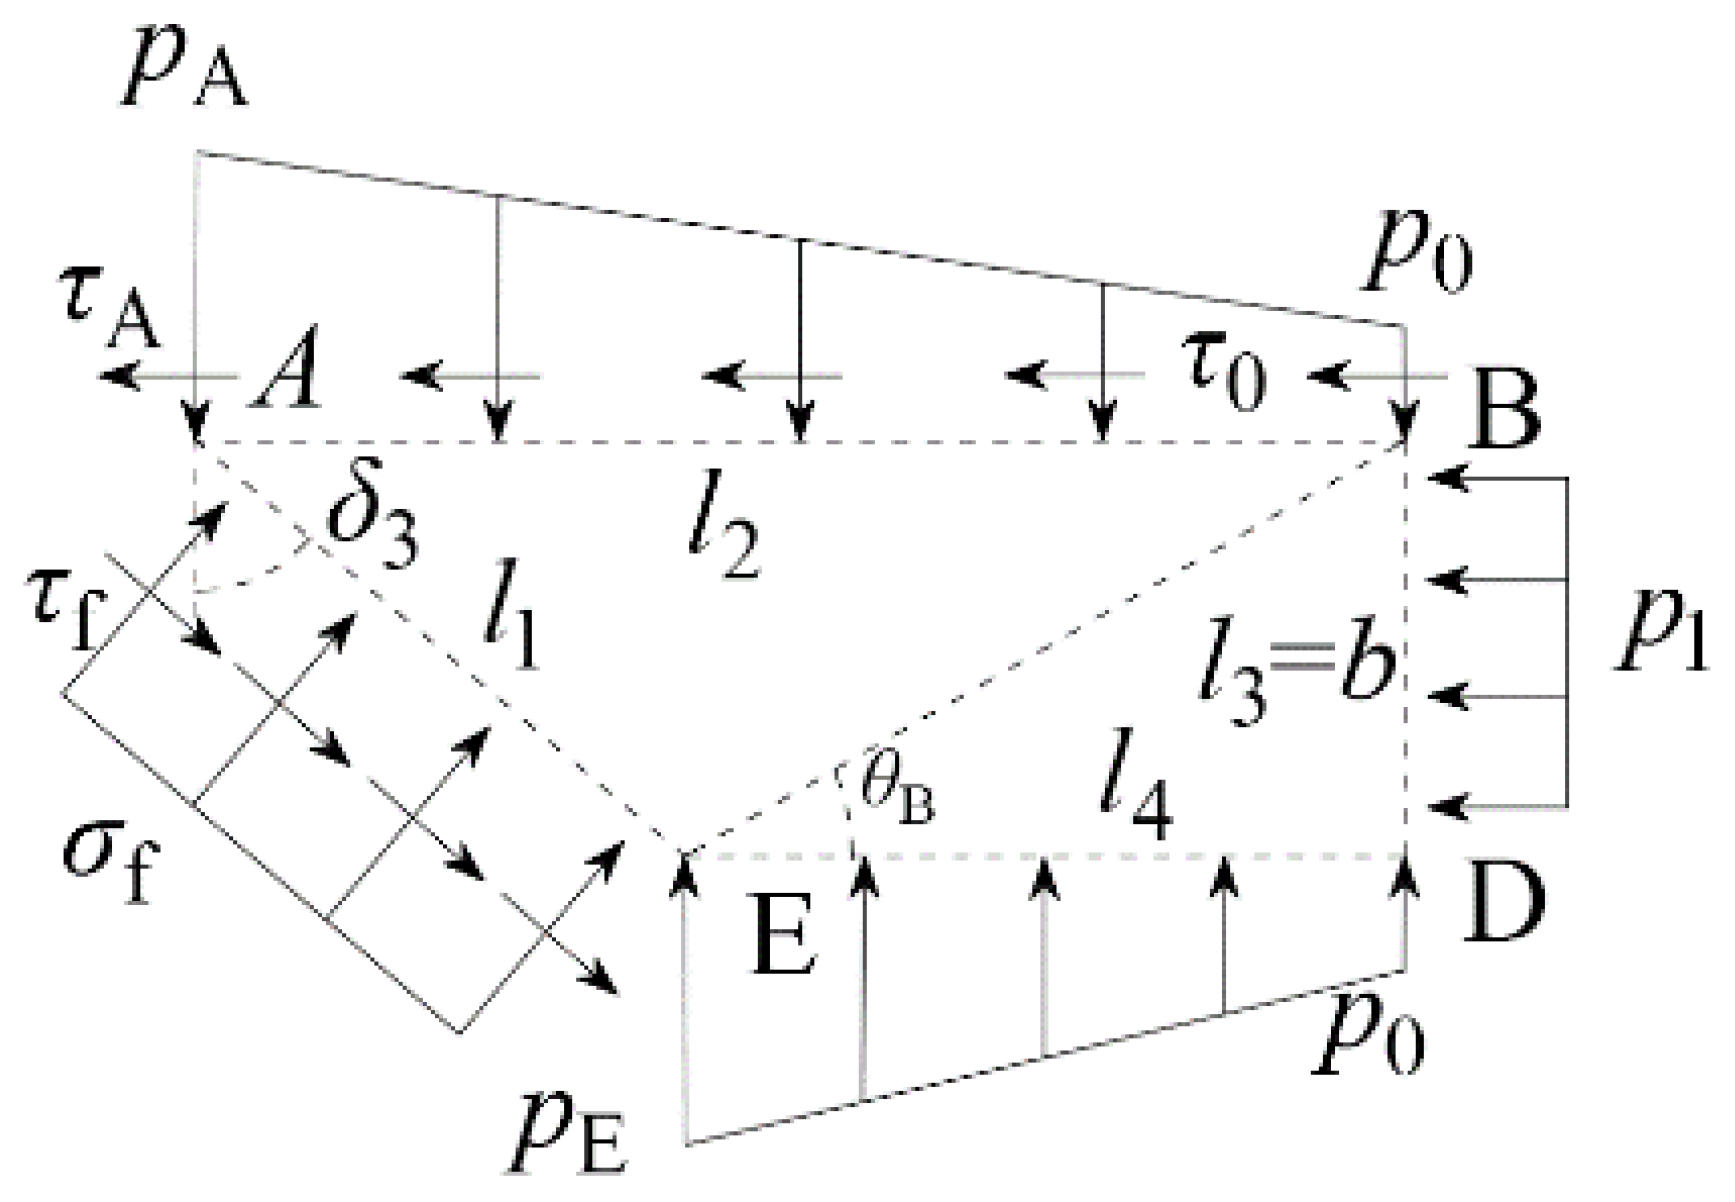
3.3. Theoretical Analysis
- (1)
- It was assumed that the vertical pressure on the CD surface is uniformly distributed and that the vertical pressure on the DE surface increases uniformly from p0 to pE, where p0 is the overlying soil pressure and pE is the normal stress at point E.
- (2)
- The friction force and cohesion on the CE surface were not considered.
- (3)
- The plastic curved surface AB was simplified as a plane. The normal and shear stresses were assumed to increase linearly. The normal and shear stresses at points A and B were pA and τA and p0 and τ0.
4. Discussion
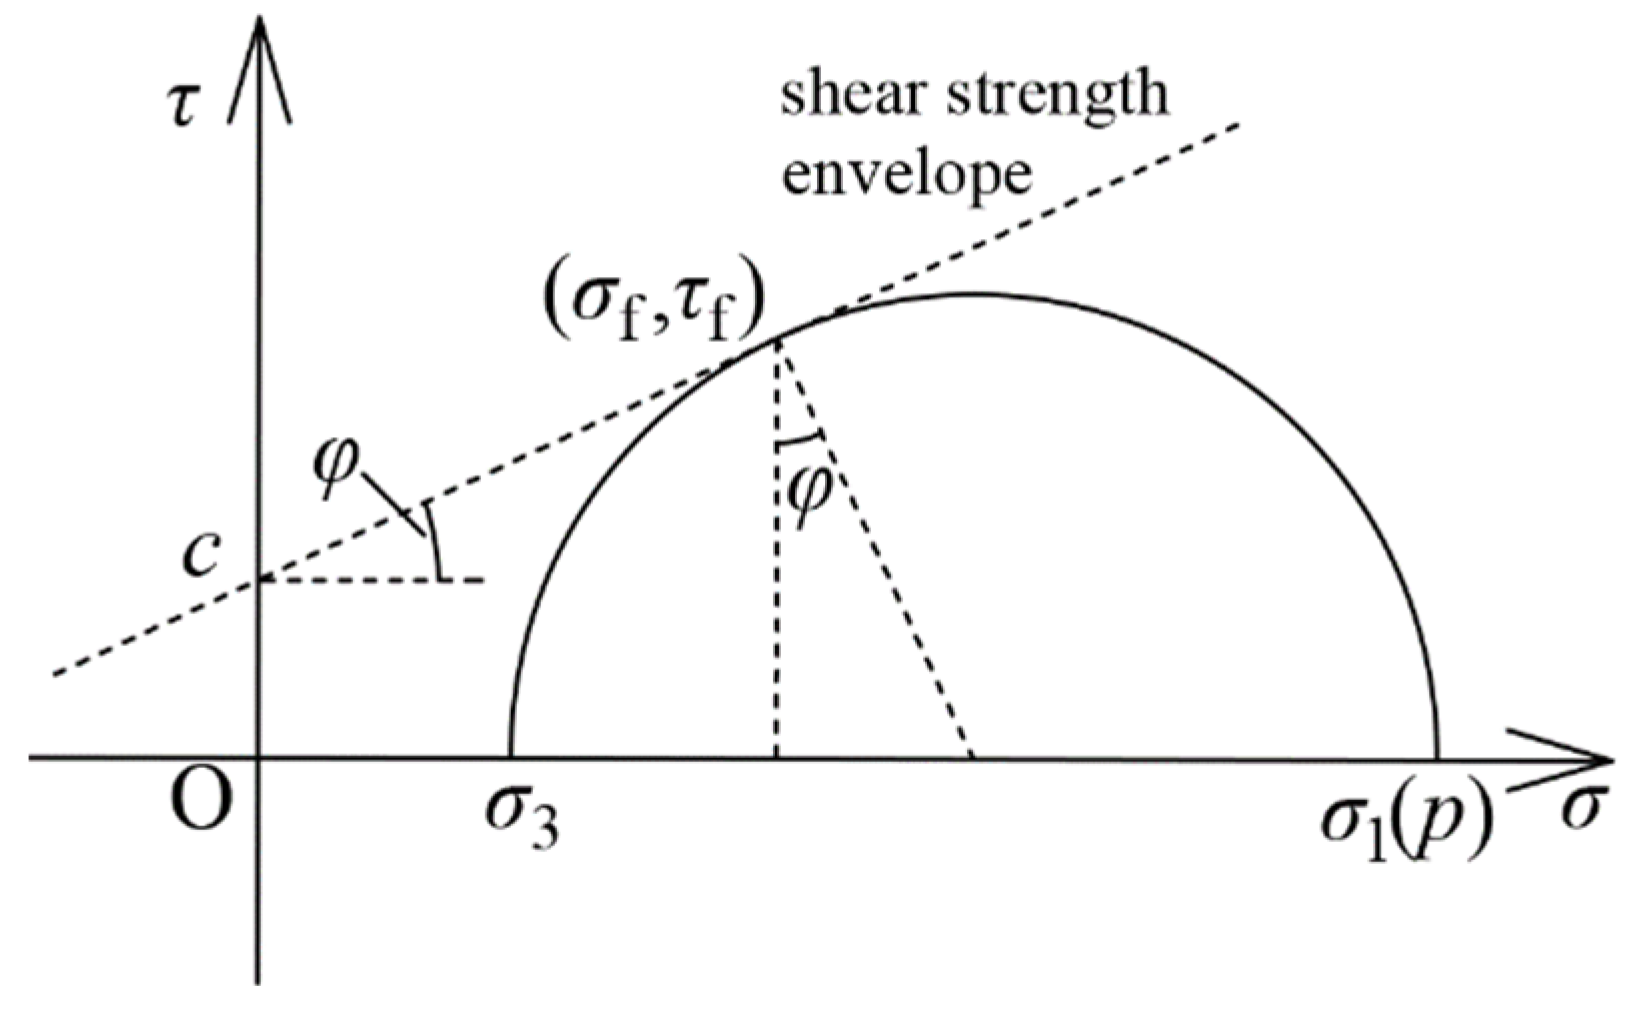
- (1)
- Assuming σ = p1, the initial value δ20 of the δ2 could be calculated.
- (2)
- Substituting the value into the equations in Section 3.3 and calculating the normal stress σ on the surface OA again.
- (3)
- Substitute the new σ into Equation (2) to obtain the new value of δ2, which is δ21.
- (4)
- Compare δ21 and δ20; when , δ2 = δ21, where is the criterion value, and it can be set at 0.1%.
- (5)
- When , assign the value of the δ21 to δ20 and repeat Equations (2)–(4) until the criterion in Equation (4) is satisfied to obtain the calculated value of δ2.
5. Conclusions
- (1)
- The bearing capacity of the screw shear plate was larger than that of the plane shear plate, indicating that the bearing capacity can be significantly improved by the screw pile compared with the circular pile.
- (2)
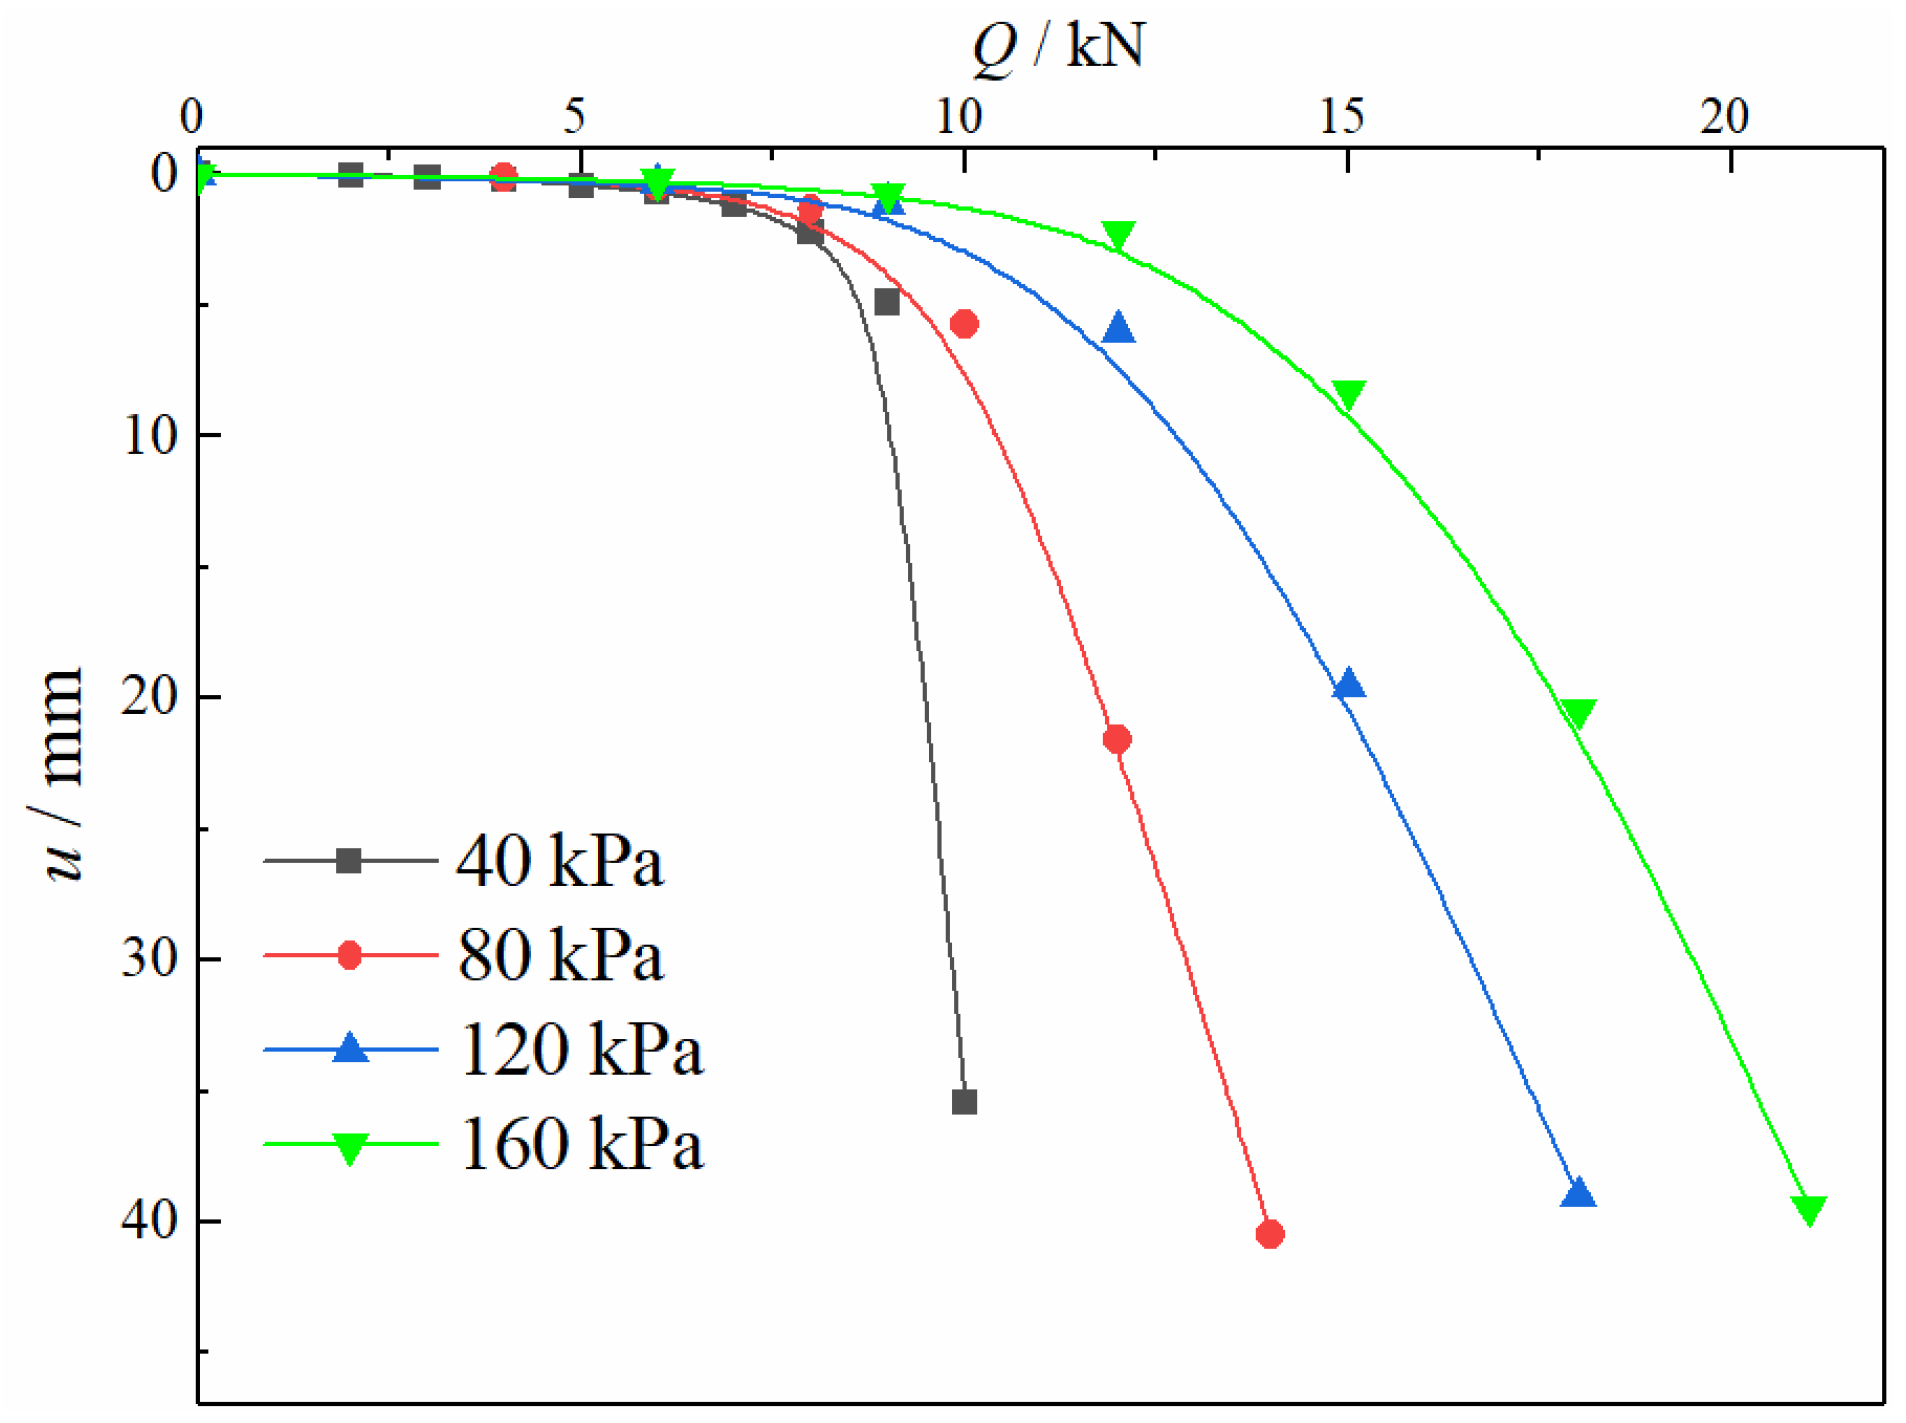
- With an increase in the screw pitch, the bearing capacity of the screw shear plate first increased and then decreased. There was an optimal screw pitch, enabling the bearing capacity and the bearing effect of the soil around the screw teeth to reach their maximum. The optimal screw pitch made the screw reach the IBF state, which is the critical screw pitch.
- (3)
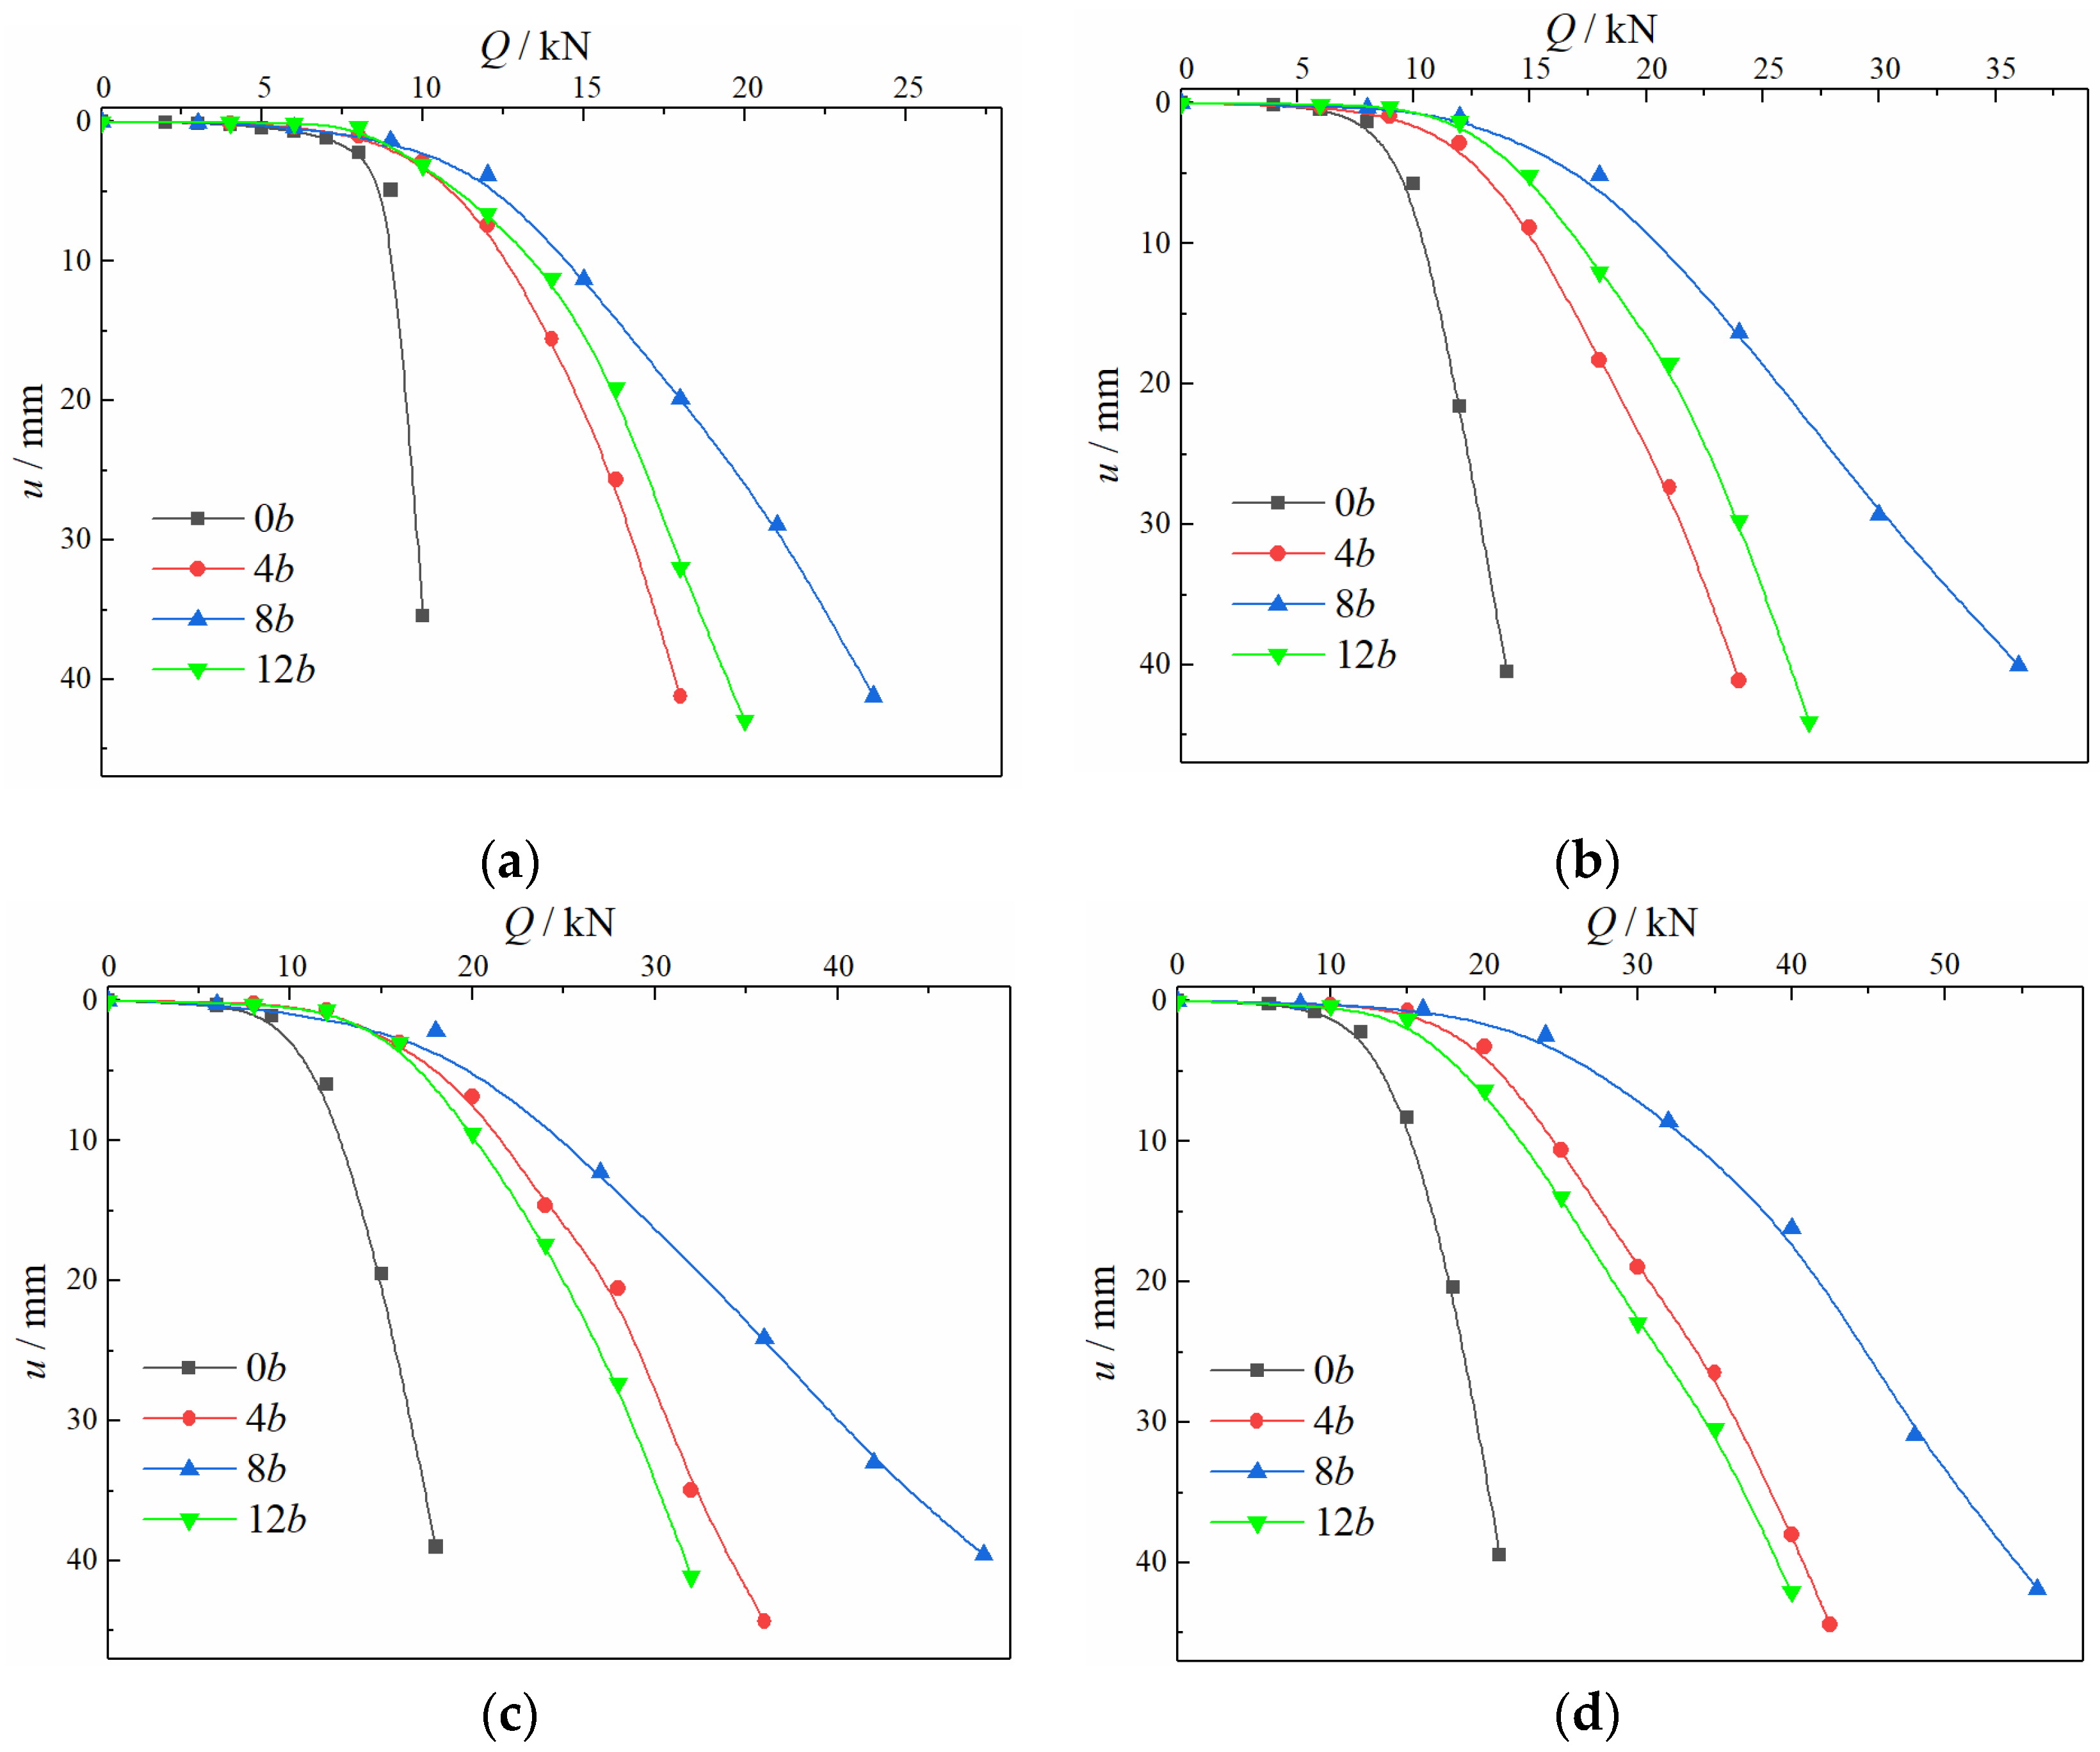
- For the screw piles in the IBF state, the main influence range of the screw teeth was about 4–5b along the loading direction and 1–2b along the vertical direction. The corresponding values of the core influence zone were about 1–2b and 1b.
- (4)
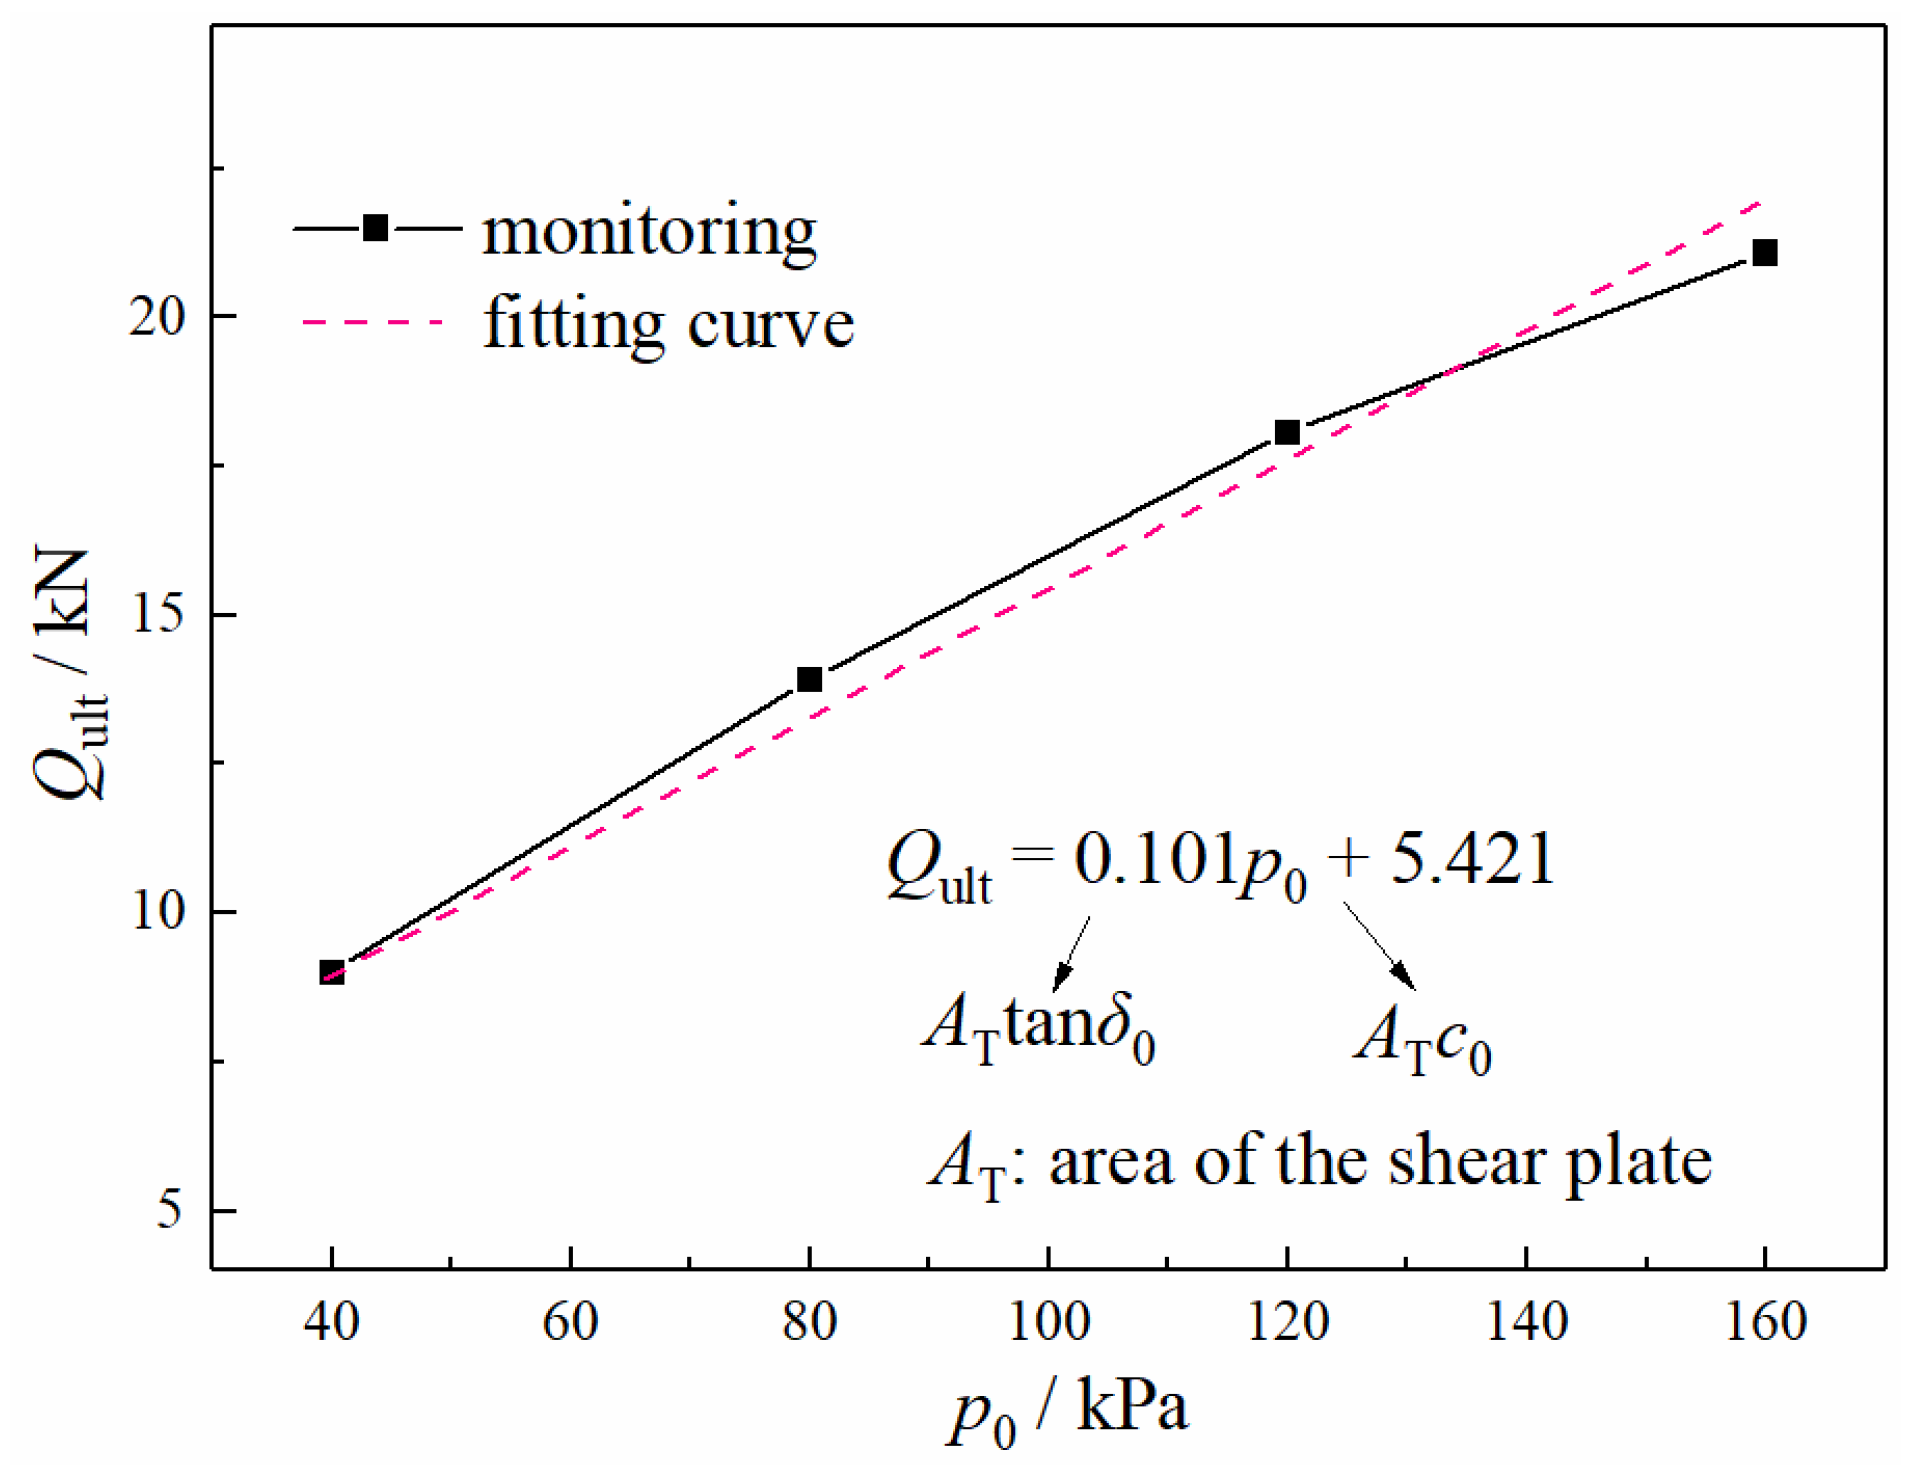
- The rationality of the proposed method for calculating the bearing capacity of the screw shear plate and the critical screw pitch in the IBF state was verified by the test results. The calculation equation of scr contains the shear strength parameters of the soil and the geometric parameters of the screw teeth, which have better applicability as scr than a general fixed value.
Author Contributions
Funding
Data Availability Statement
Conflicts of Interest
References
- Peng, Y.; Liu, J.; Ding, X.; Jiang, C. Performance of X-section concrete pile group in coral sand under vertical loading. China Ocean Eng. 2020, 34, 621–630. [Google Scholar] [CrossRef]
- Ren, L.W.; Guo, W.D.; Yang, Q.W. Analysis on bearing performance of Y-shaped piles under compressive and tensile loading. Proc. Inst. Civ. Eng.-Geotech. Eng. 2020, 173, 58–69. [Google Scholar] [CrossRef]
- Zhang, M.; Xu, P.; Cui, W.; Gao, Y. Bearing behavior and failure mechanism of squeezed branch piles. J. Rock Mech. Geotech. Eng. 2018, 10, 935–946. [Google Scholar] [CrossRef]
- Ma, H.W.; Liu, L.; Wang, P.; Yuan, S.; He, Q.R.; Yang, X.L. Calculation method and mechanism of ultimate side resistance of screw pile. Mar. Georesour. Geotech. 2021. [Google Scholar] [CrossRef]
- Karalar, M.; Dicleli, M. Effect of thermal induced flexural strain cycles on the low cycle fatigue performance of integral bridge steel H-piles. Eng. Struct. 2016, 124, 388–404. [Google Scholar] [CrossRef]
- Li, W.; Stuedlein, A.W.; Chen, Y.; Liu, H.; Cheng, Z. Response of pile groups with X and circular cross-sections subject to lateral spreading: 3D numerical simulations. Soil Dyn. Earthq. Eng. 2019, 126, 105774. [Google Scholar] [CrossRef]
- Sakr, M. Performance of helical piles in oil sand. Can. Geotech. J. 2009, 46, 1046–1061. [Google Scholar] [CrossRef] [Green Version]
- Spagnoli, G. Some considerations regarding the use of helical piles as foundation for offshore structures. Soil Mech. Found. Eng. 2013, 50, 102–110. [Google Scholar] [CrossRef]
- Mohajerani, A.; Bosnjak, D.; Bromwich, D. Analysis and design methods of screw piles: A review. Soils Found. 2016, 56, 115–128. [Google Scholar] [CrossRef] [Green Version]
- Zheng, X.; Chen, X.; Zhang, J. Stress analysis of screw-bored compaction cast-in-place piles. IOP Conf. Ser. Earth Environ. Sci. 2021, 719, 032003. [Google Scholar] [CrossRef]
- Malik, A.A.; Kuwano, J.; Tachibana, S.; Maejima, T. Effect of helix bending deflection on load settlement behavior of screw pile. Acta Geotech. 2019, 14, 1527–1543. [Google Scholar] [CrossRef]
- Perko, H.A. Helical Piles: A Practical Guide to Design and Installation, 1st ed.; John Wiley & Sons Inc.: Hoboken, NJ, USA, 2009. [Google Scholar]
- Kurian, N.P.; Shah, S.J. Studies on the behaviour of screw piles by the finite element method. Can. Geotech. J. 2009, 46, 627–638. [Google Scholar] [CrossRef]
- Meng, Z.; Chen, J.J.; Zhang, L.Y.; Wang, J.H. Field tests to investigate the installation effects of drilled displacement piles with screw-shaped shaft in clay. J. Geotech. Geoenviron. Eng. 2015, 141, 06015010. [Google Scholar] [CrossRef]
- Chen, Y.D.; Deng, A.; Wang, A.T.; Sun, H.S. Performance of screw–shaft pile in sand: Model test and DEM simulation. Comput. Geotech. 2018, 104, 118–130. [Google Scholar] [CrossRef]
- Aydin, M.; Bradka, T.; Kort, D. Osterberg cell load testing on helical piles. Geo-Front. 2011, 2011, 66–74. [Google Scholar] [CrossRef]
- Livneh, B.; Naggar, M.H.M. Axial testing and numerical modelling of square shaft helical piles under compressive and tensile loading. Can. Geotech. J. 2008, 45, 1142–1155. [Google Scholar] [CrossRef]
- Hawkins, K.; Thorsten, R. Load test results-large diameter helical pipe piles. Contemp. Top. Deep. Found. 2009, 488–495. [Google Scholar] [CrossRef]
- Tappenden, K.; Sego, D.; Robertson, P. Load transfer behaviour of full-scale instrumented screw anchors. Contemp. Top. Deep Found. 2009, 472–479. [Google Scholar] [CrossRef]
- Adams, J.I.; Klym, T.W. A study of anchorages for transmission tower foundations. Can. Geotech. J. 1972, 9, 89–104. [Google Scholar] [CrossRef]
- Narasimha Rao, S.; Prasad, Y.V.S.N.; Veeresh, C. Behaviour of embedded model screw anchors in soft clays. Geotechnique 1993, 43, 605–614. [Google Scholar] [CrossRef]
- Nasr, M.H. Performance-based design for helical piles. Contemp. Top. Deep Found. 2009, 496–503. [Google Scholar] [CrossRef]
- Meyerhof, G.G. The ultimate bearing capacity of foundations. Geotechnique 1951, 2, 301–332. [Google Scholar] [CrossRef]
- Terzaghi, K.; Peck, R.B. Soil Mechanics in Engineering Practice, 3rd ed.; John Wiley & Sons Inc.: Hoboken, NJ, USA, 1967. [Google Scholar]
- Shao, K.; Su, Q.; Liu, J.; Xiong, Z.; Wang, T. Optimization of inter-helix spacing for helical piles in sand. J. Rock Mech. Geotech. Eng. 2022, 14, 936–952. [Google Scholar] [CrossRef]
- MOHURD (Ministry of Housing and Urban-Rural Development, PRC). Technical Specification for Screw Concrete Pile; MOHURD: Beijing, China, 2016. (In Chinese)
- Qian, J.G.; Chen, H.W.; Jia, P.; Huang, M.S.; Hu, Y.Y. Experimental study of mechanical behaviours of grouting-screw pile interface. Chin. J. Rock Mech. Eng. 2013, 32, 1744–1749. (In Chinese) [Google Scholar]
- MOHURD (Ministry of Housing and Urban-Rural Development, PRC). Technical Code for Testing of Building Foundation Piles; MOHURD: Beijing, China, 2014. (In Chinese)
- Fateh, A.M.A.; Eslami, A.; Fahimifar, A. A study of the axial load behaviour of helical piles in sand by frustum confining vessel. Int. J. Phys. Model. Geotech. 2018, 18, 175–190. [Google Scholar] [CrossRef]
- Ho, H.M.; Malik, A.A.; Kuwano, J.; Brasile, S.; Tran, T.V.; Mazhar, M.A. Experimental and numerical study on pressure distribution under screw and straight pile in dense sand. Int. J. Geomech. 2022, 22, 04022139. [Google Scholar] [CrossRef]
- Ma, J.; Luo, L.; Ren, X.; Shi, H.; Yin, Y. Calculation method of bearing capacity of full concrete screw pile based on unified strength theory. J. Shanghai Jiaotong Univ. 2022, 56, 754–763. [Google Scholar] [CrossRef]


| Physical Quantities | Similarity Constant |
|---|---|
| Geometry | Cl = 2 |
| Modulus of elasticity | CE = 1 |
| Strain | Cε = 1 |
| Stress | Cσ = CE Cε = 2 |
| Poisson ratio | Cμ = 1 |
| Concentrated load | CF = Cσ Cl2 = 4 |
| Linear load | Cq = Cσ Cl = 2 |
| Area load | Cp = Cσ = 1 |
| Cement | Water | River Sand | Coarse Aggregate |
|---|---|---|---|
| 1.00 | 0.55 | 1.44 | 2.08 |
| Index | Es (MPa) | φ (°) | c (kPa) | ρ (g/cm3) | w (%) | e |
|---|---|---|---|---|---|---|
| Loess | 7.97 | 28.10 | 26.80 | 1.75 | 14.10 | 0.76 |
| Iterations | p0/kPa | tanδ2 | δ20/° | σ/kPa | δ21/° | Deviation/% | Final δ2/° | |
|---|---|---|---|---|---|---|---|---|
| 1 | 40.0 | 0.32 | 17.676 | 353.84 | 16.121 | 8.80 | NO | 16.031 |
| 2 | 0.29 | 16.121 | 369.26 | 16.035 | 0.53 | NO | ||
| 3 | 0.29 | 16.035 | 370.13 | 16.031 | 0.02 | YES |
| s | p0 | 40 kPa | 80 kPa | 120 kPa | 160 kPa |
|---|---|---|---|---|---|
| 4b | Qt/kN | 19.28 | 27.76 | 36.24 | 44.72 |
| Qult/kN | 17.86 | 23.72 | 34.55 | 40.95 | |
| η/% | 7.95 | 17.03 | 4.89 | 9.21 | |
| 8b | Qt/kN | 21.26 | 32.33 | 43.40 | 54.48 |
| Qult/kN | 23.78 | 36.00 | 48.15 | 55.88 | |
| η/% | −10.60 | −10.19 | −9.87 | −2.51 | |
| 12b | Qt/kN | 16.90 | 25.43 | 33.97 | 42.51 |
| Qult/kN | 19.69 | 26.22 | 31.71 | 39.54 | |
| η/% | −14.17 | −3.01 | 7.13 | 7.51 |
Publisher’s Note: MDPI stays neutral with regard to jurisdictional claims in published maps and institutional affiliations. |
© 2022 by the authors. Licensee MDPI, Basel, Switzerland. This article is an open access article distributed under the terms and conditions of the Creative Commons Attribution (CC BY) license (https://creativecommons.org/licenses/by/4.0/).
Share and Cite
Ma, J.; Luo, L.; Mu, T.; Guo, H.; Tang, Y. Experimental Study on Characteristics of Pile-Soil Interaction in Screw Piles. Buildings 2022, 12, 2091. https://doi.org/10.3390/buildings12122091
Ma J, Luo L, Mu T, Guo H, Tang Y. Experimental Study on Characteristics of Pile-Soil Interaction in Screw Piles. Buildings. 2022; 12(12):2091. https://doi.org/10.3390/buildings12122091
Chicago/Turabian StyleMa, Jiakuan, Lijuan Luo, Tong Mu, Hongtao Guo, and Yong Tang. 2022. "Experimental Study on Characteristics of Pile-Soil Interaction in Screw Piles" Buildings 12, no. 12: 2091. https://doi.org/10.3390/buildings12122091