

Numerical Analysis of Passive Piles under Surcharge Load in Extensively Deep Soft Soil

Abstract
:1. Introduction
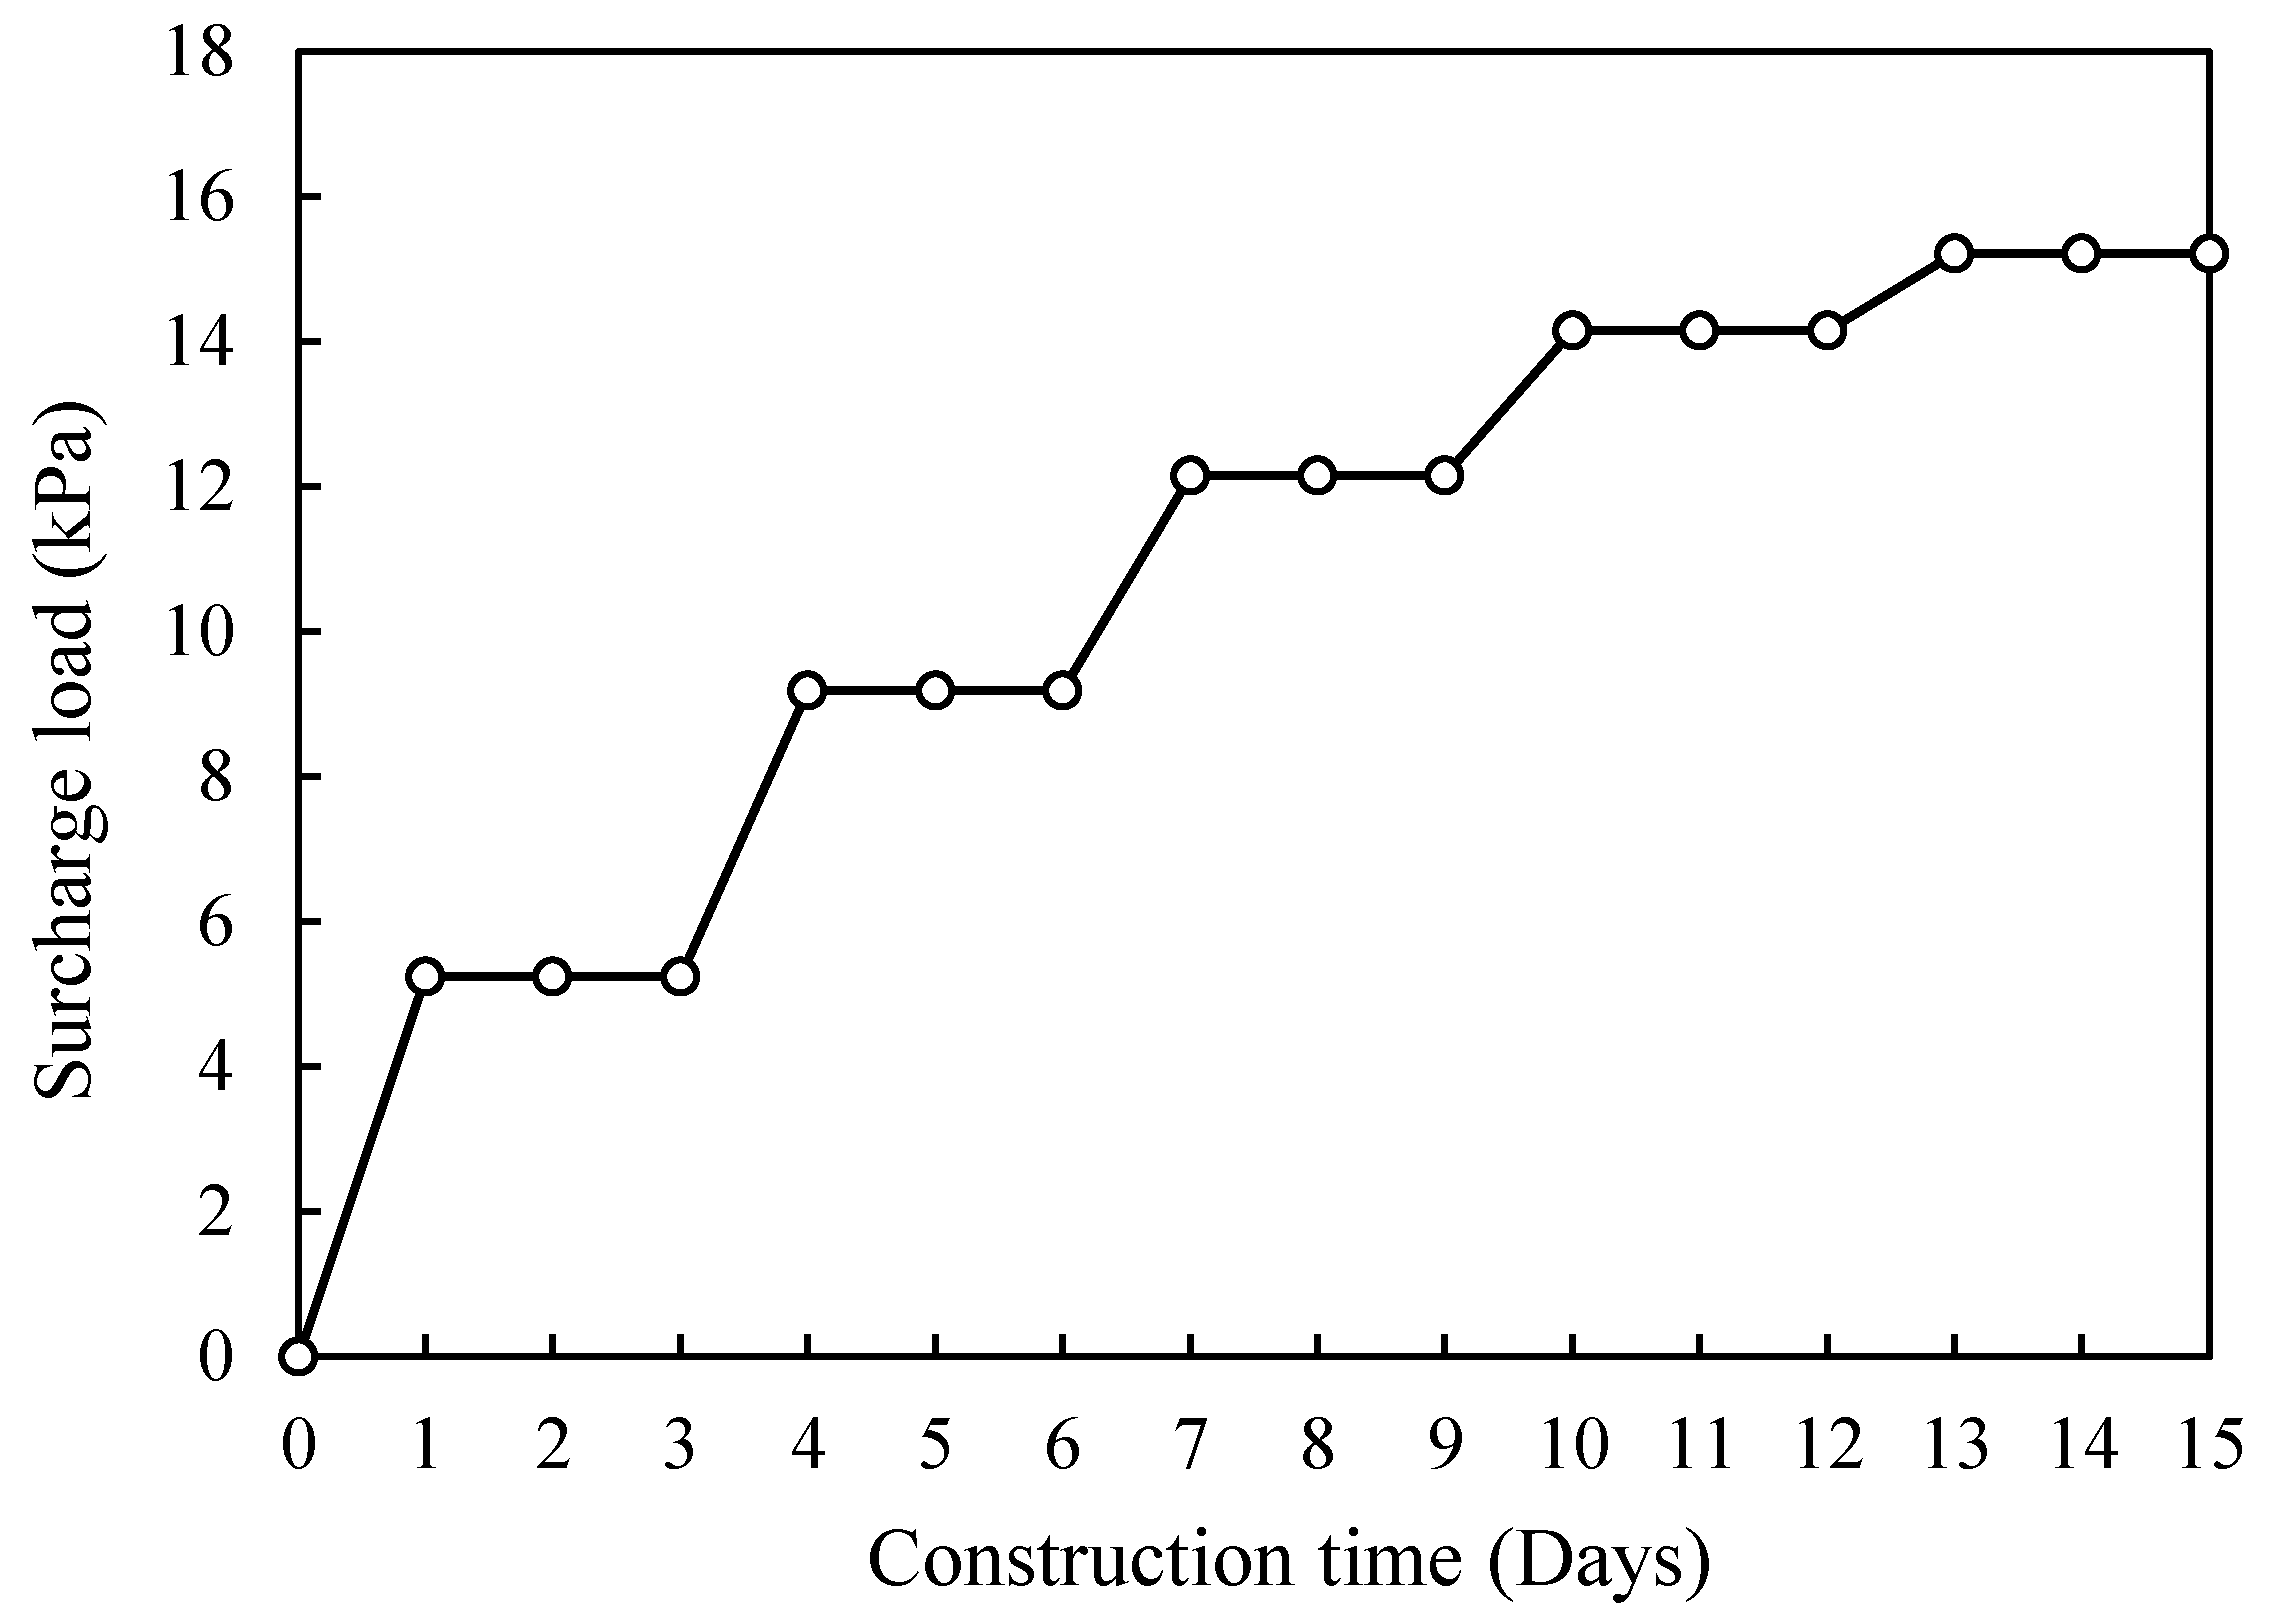
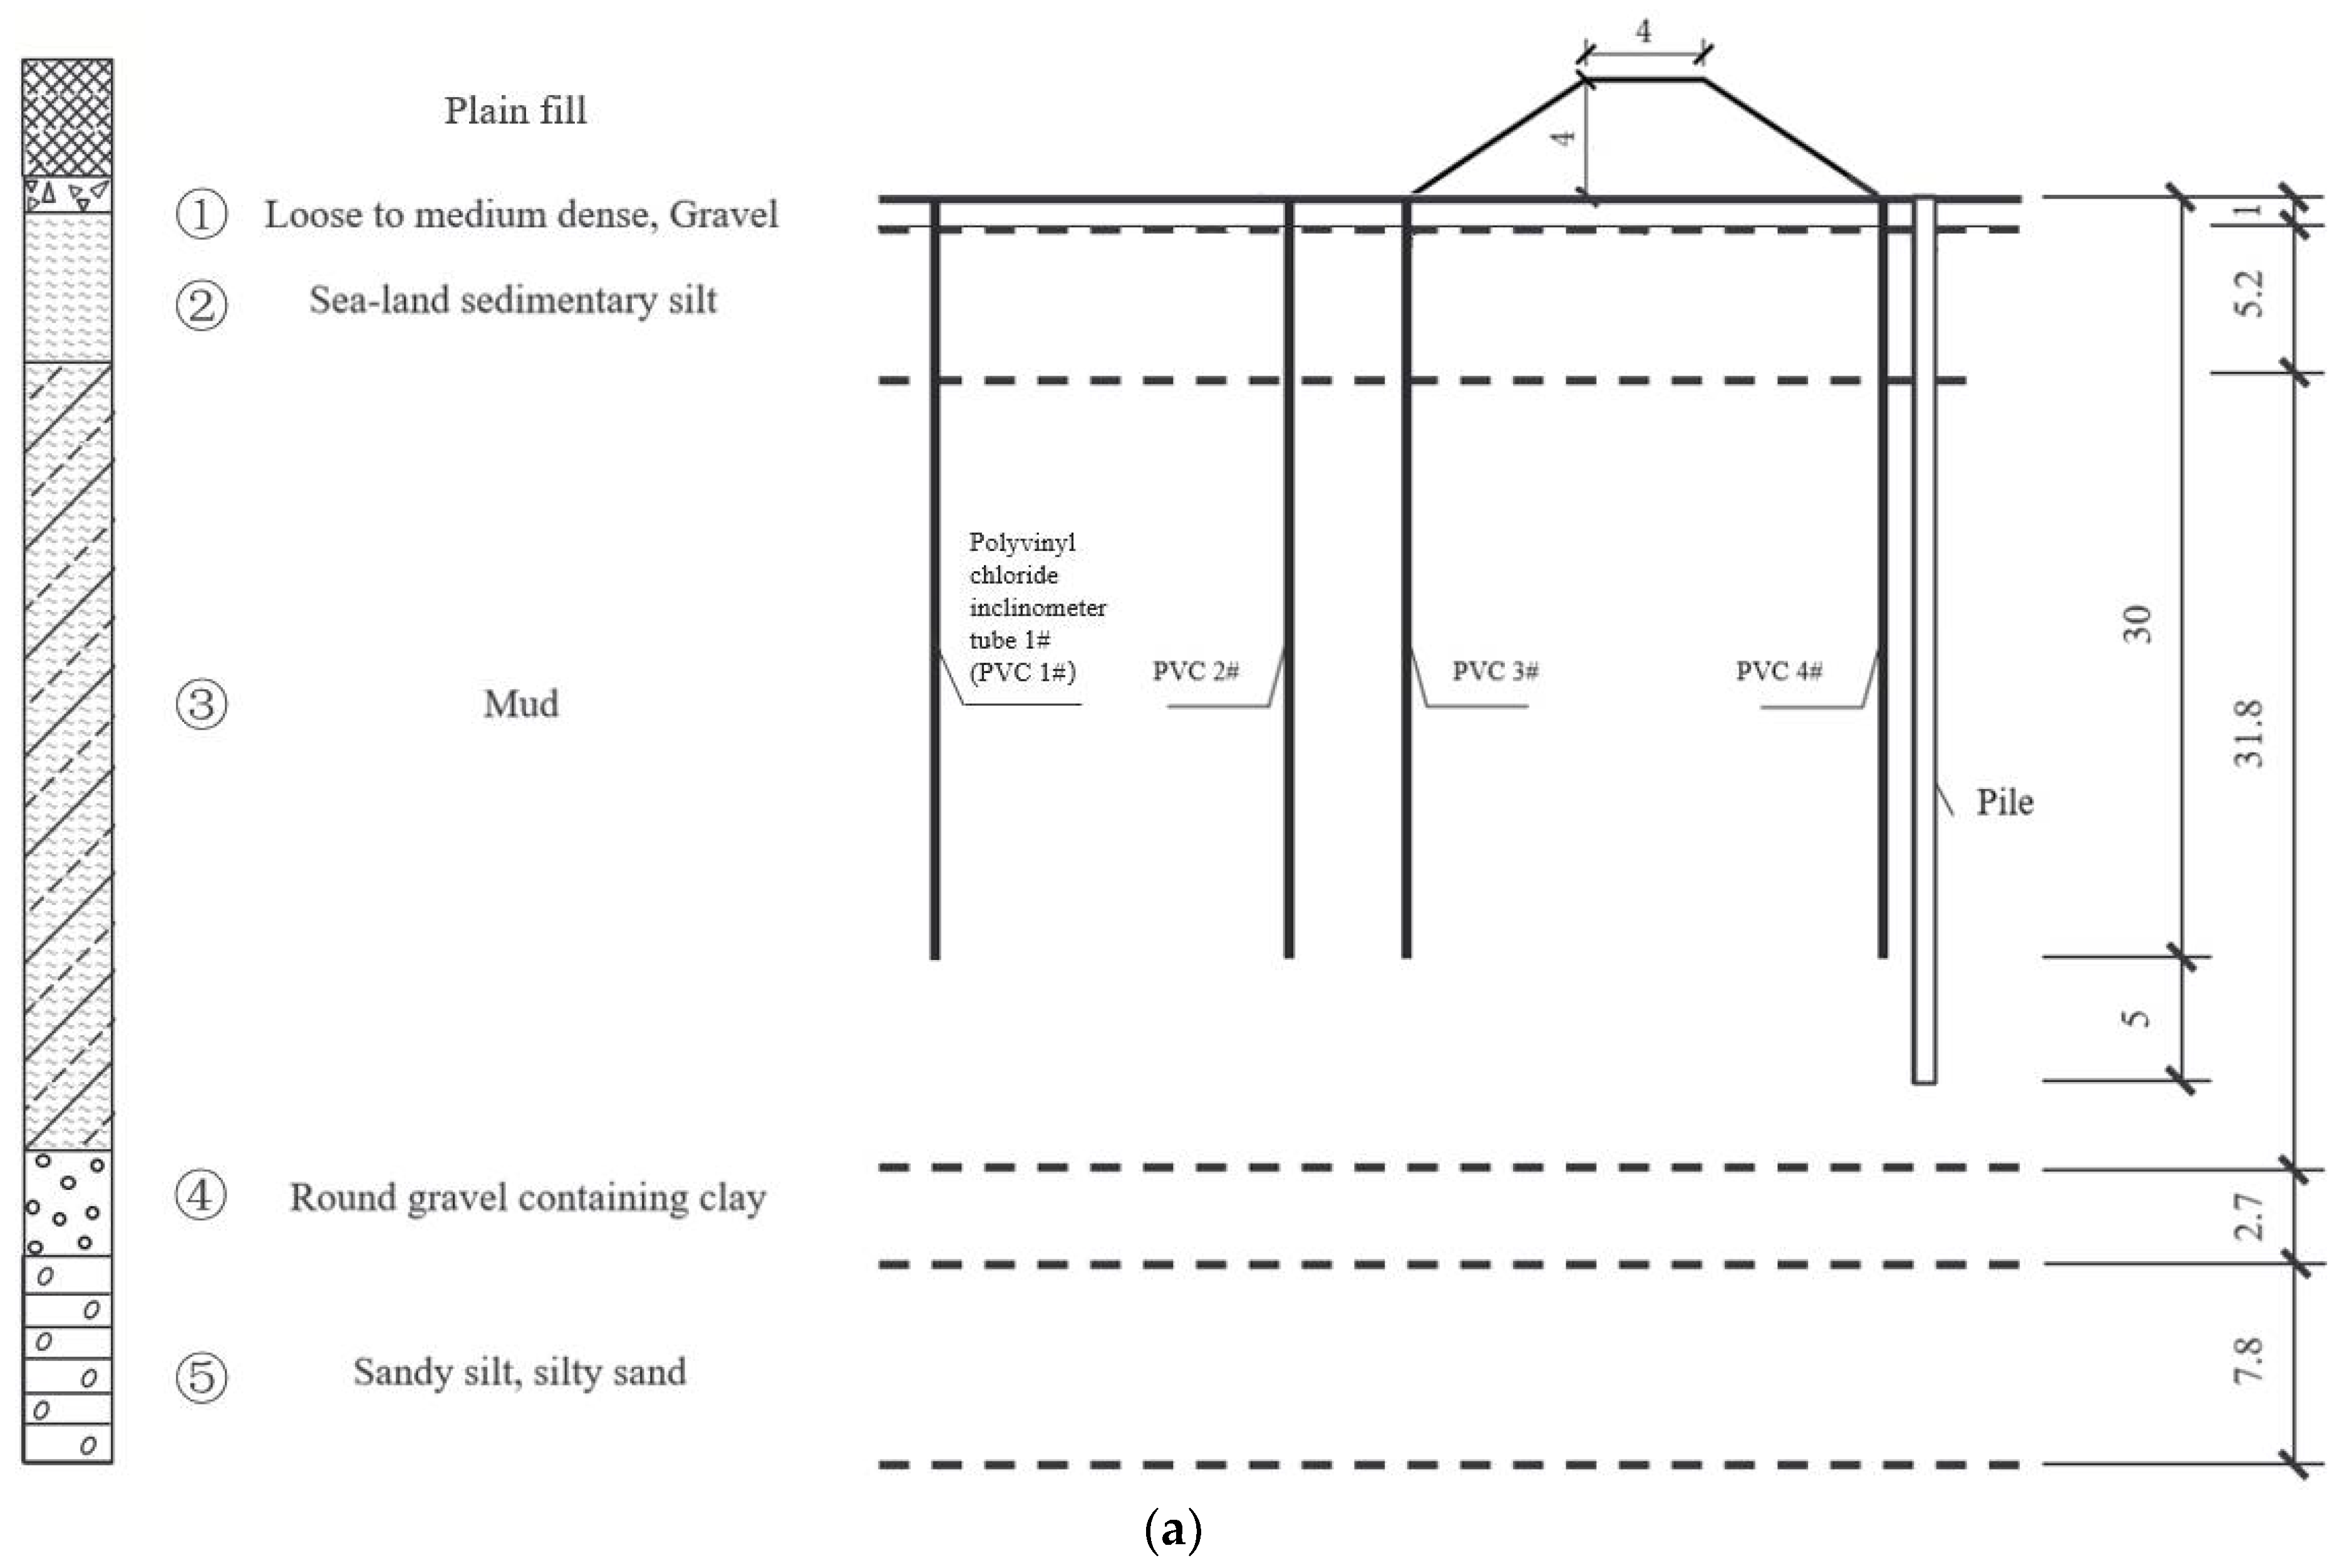
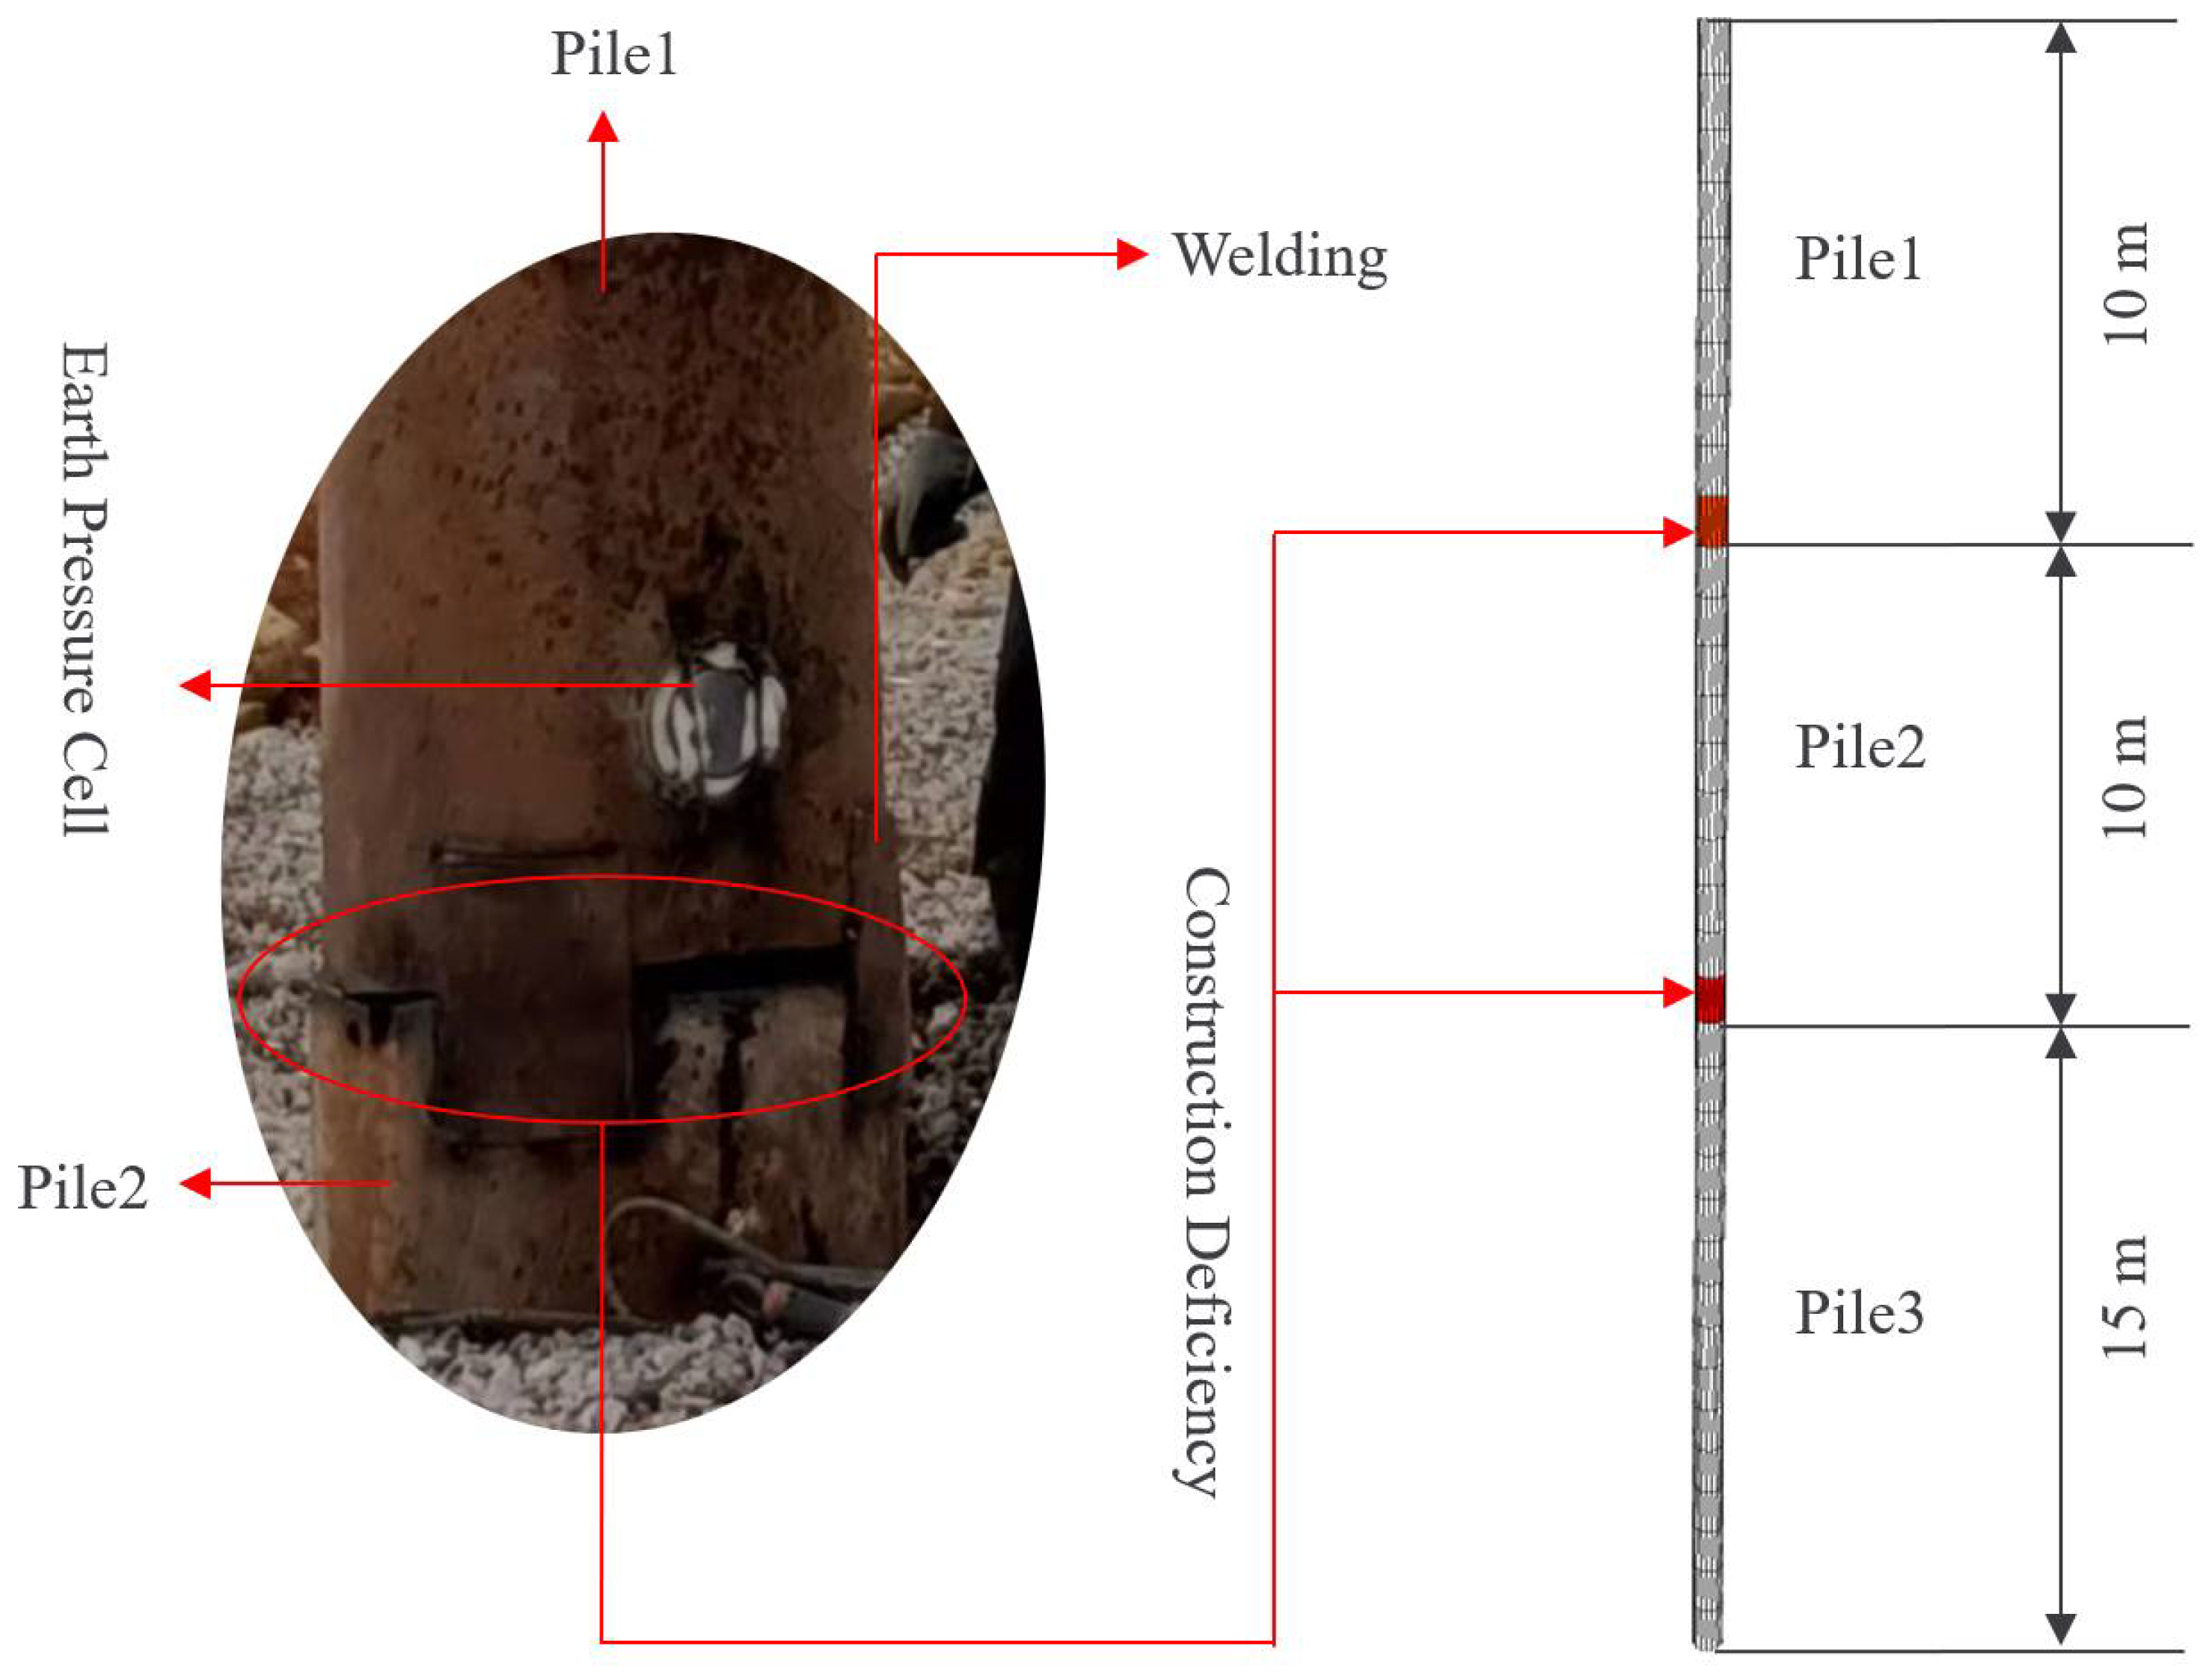
2. Field Test
3. Numerical Modelling
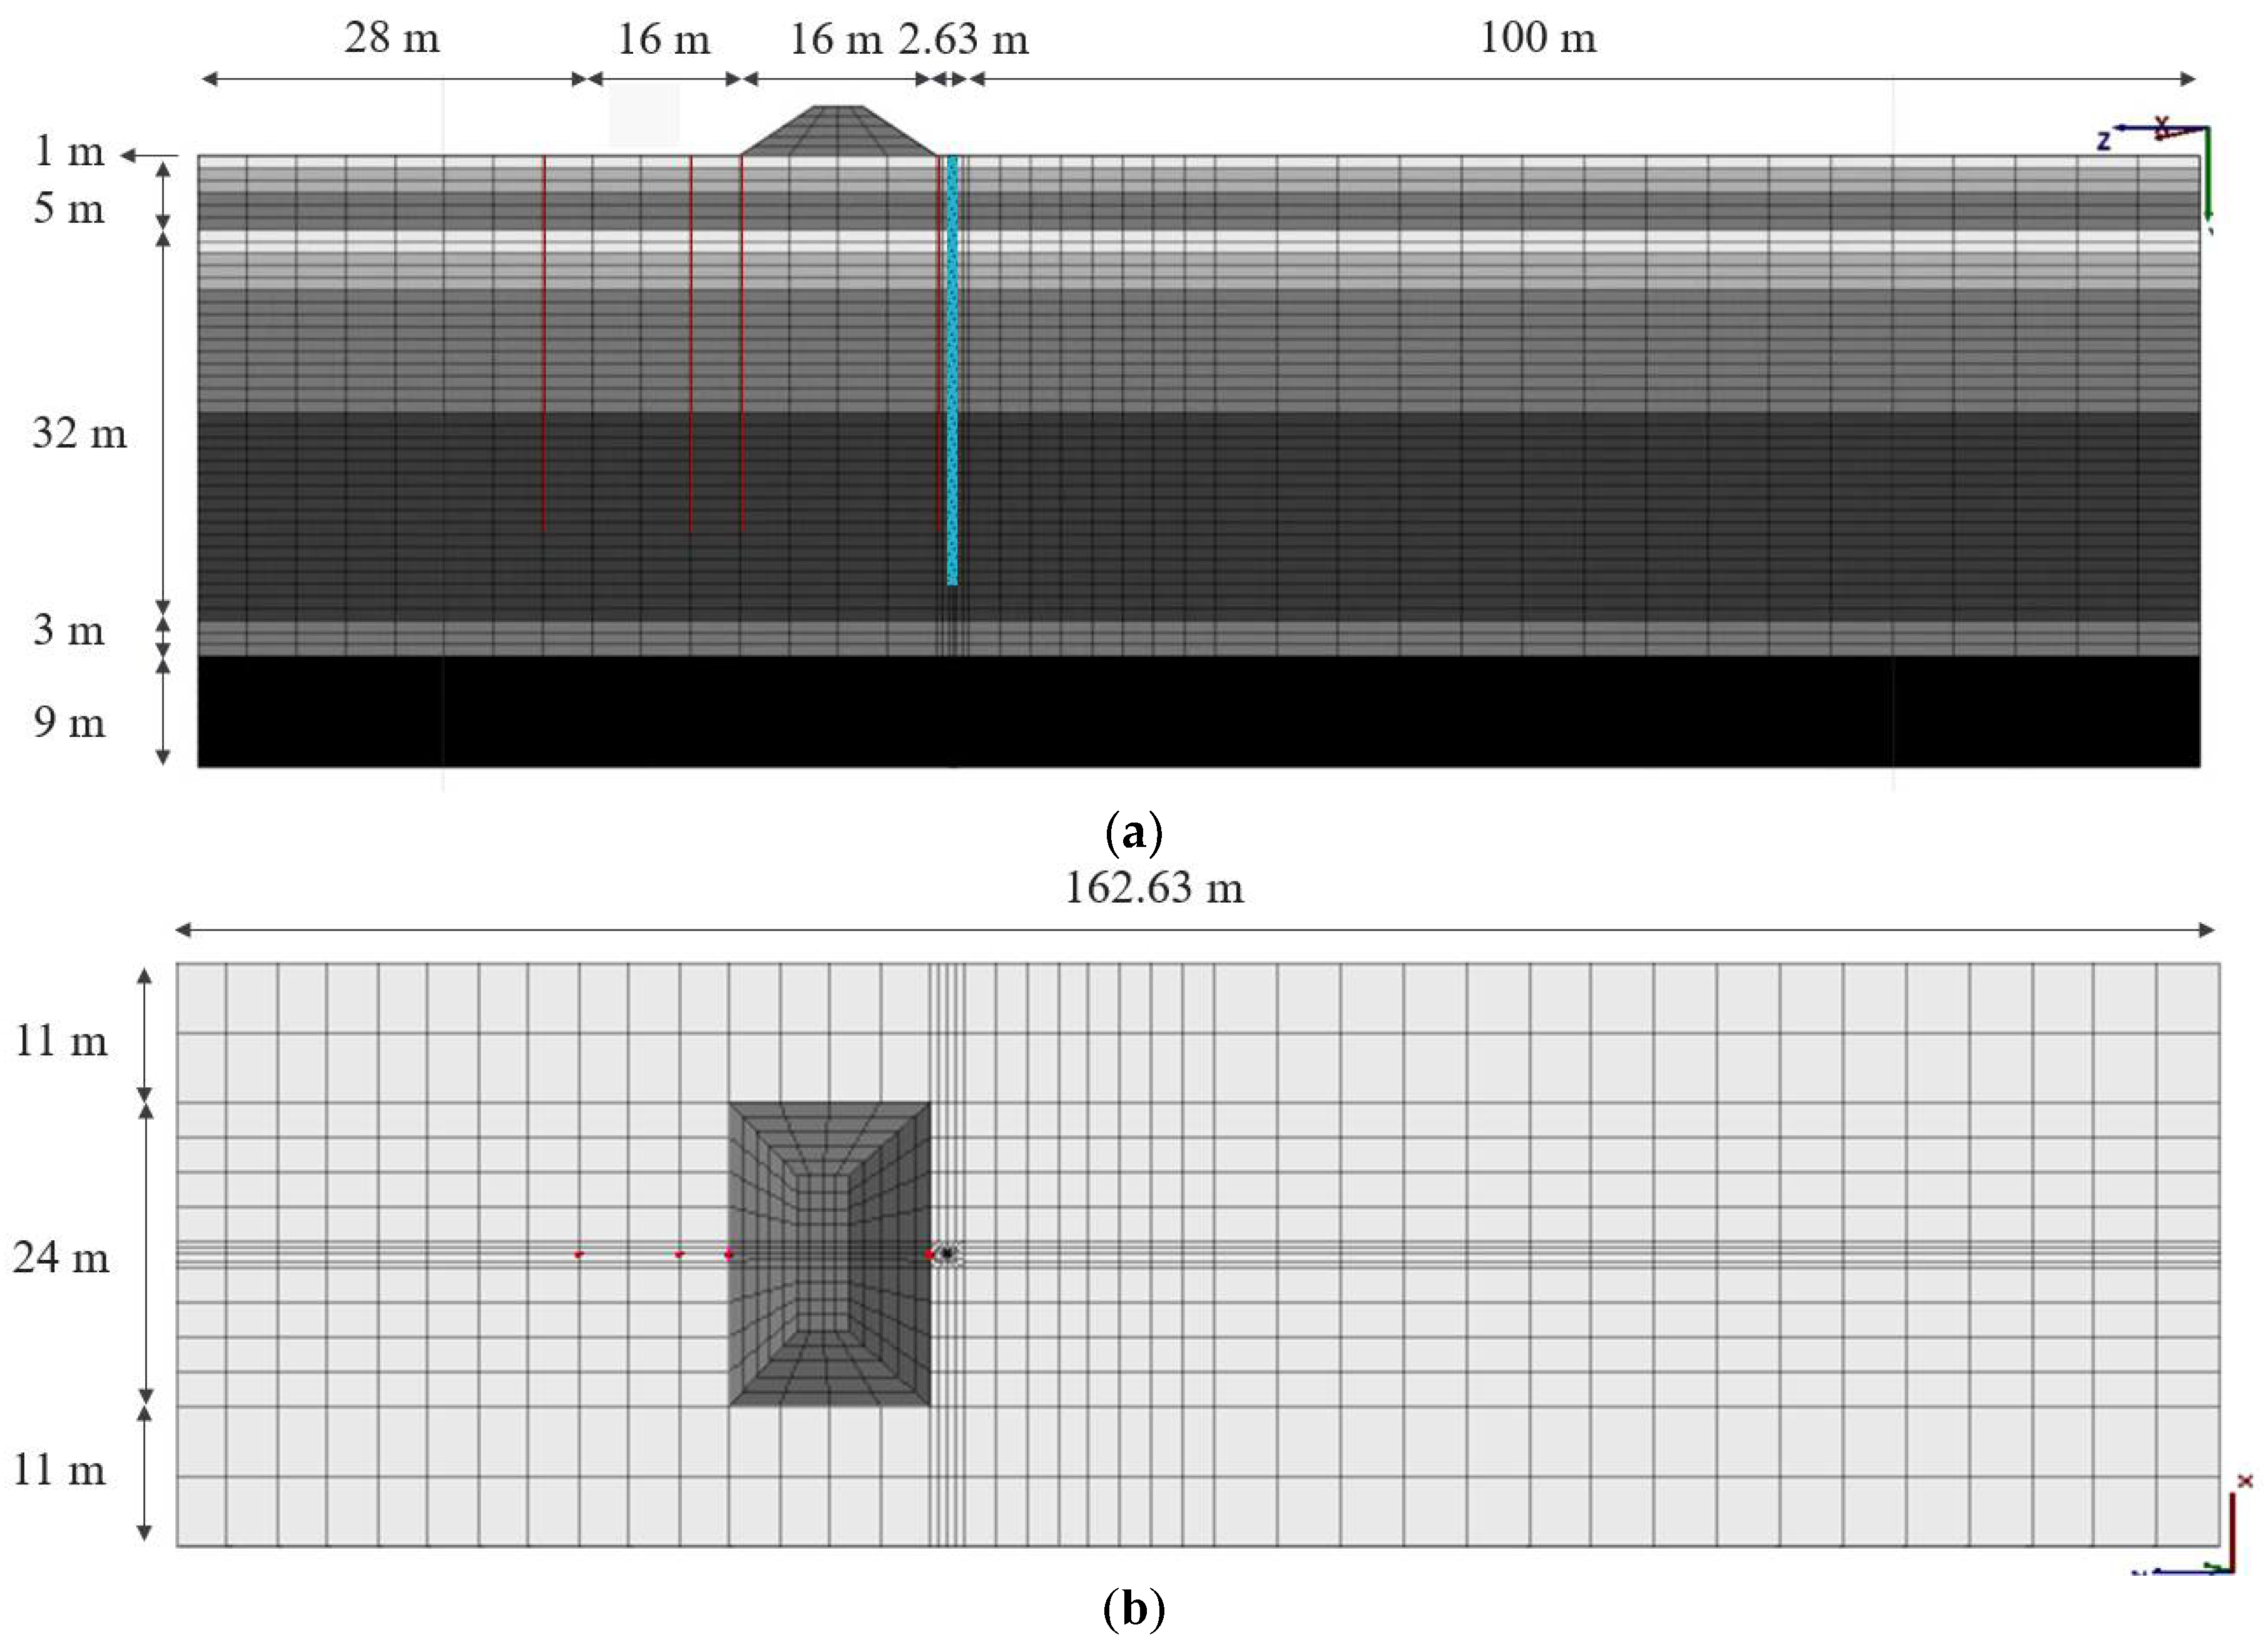
3.1. General
3.2. Soil and Structure Properties
4. Results and Discussion
4.1. Model Verification
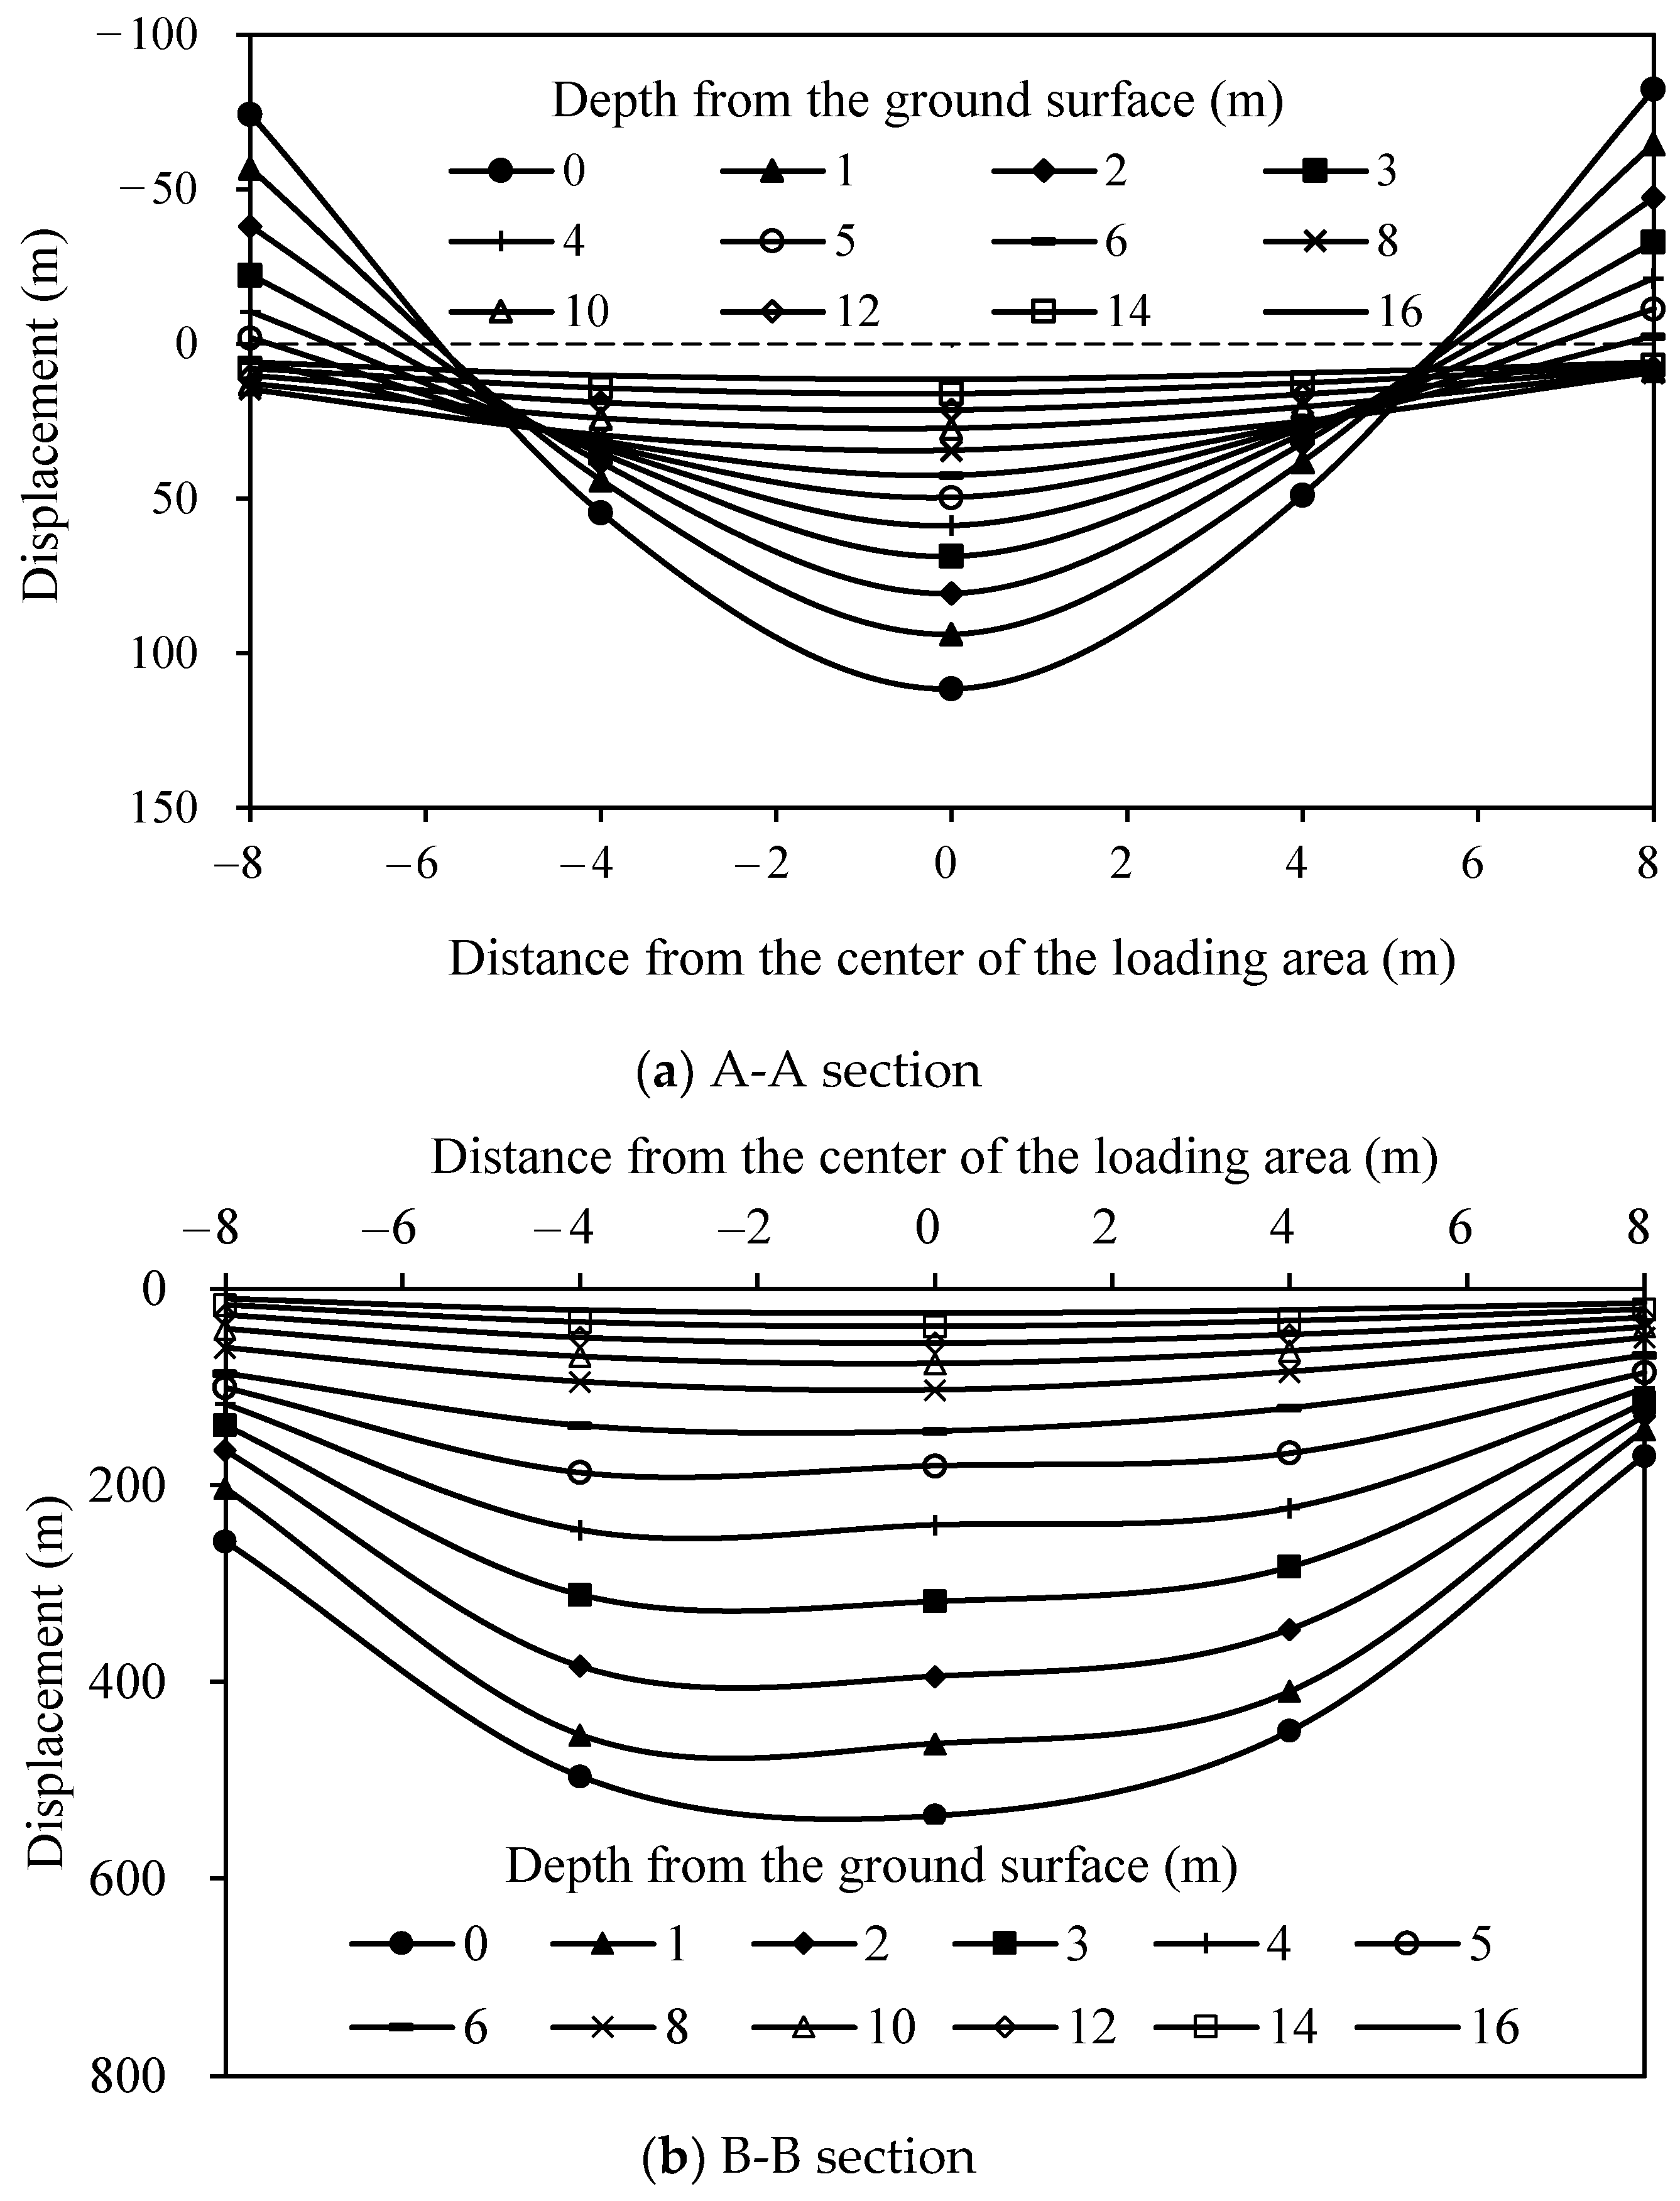
4.2. The Vertical Displacement of the Foundation Soil
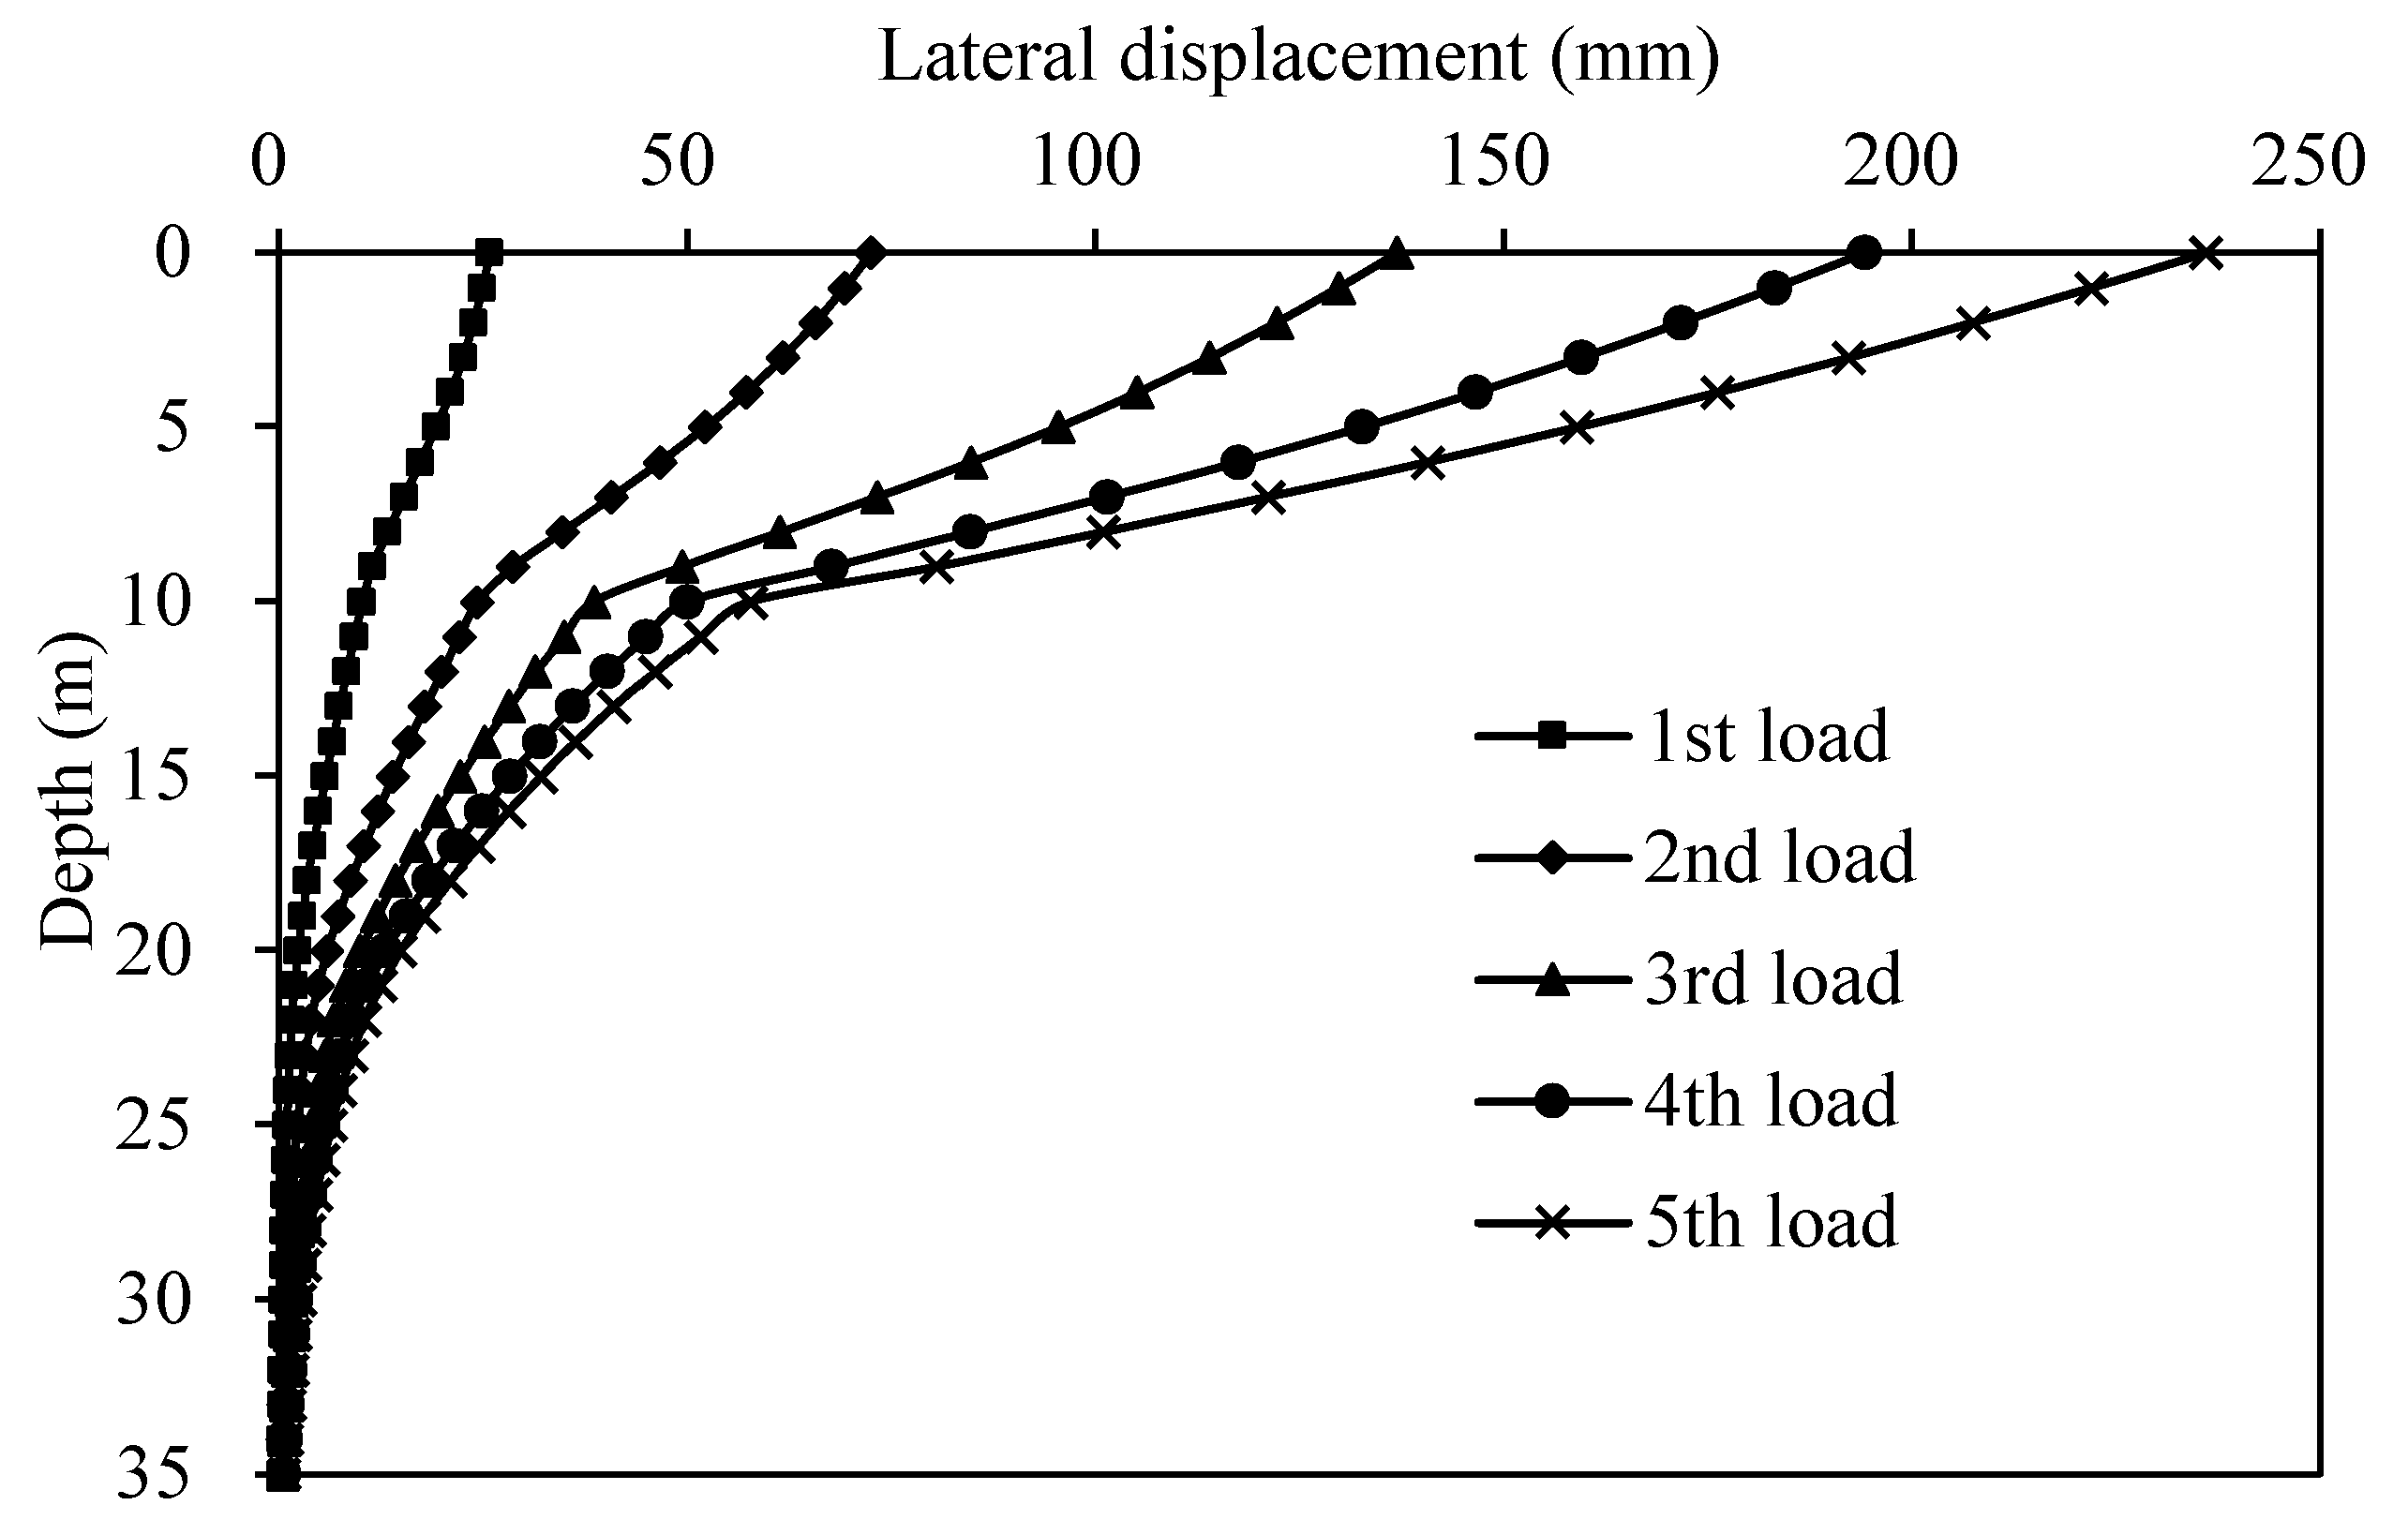
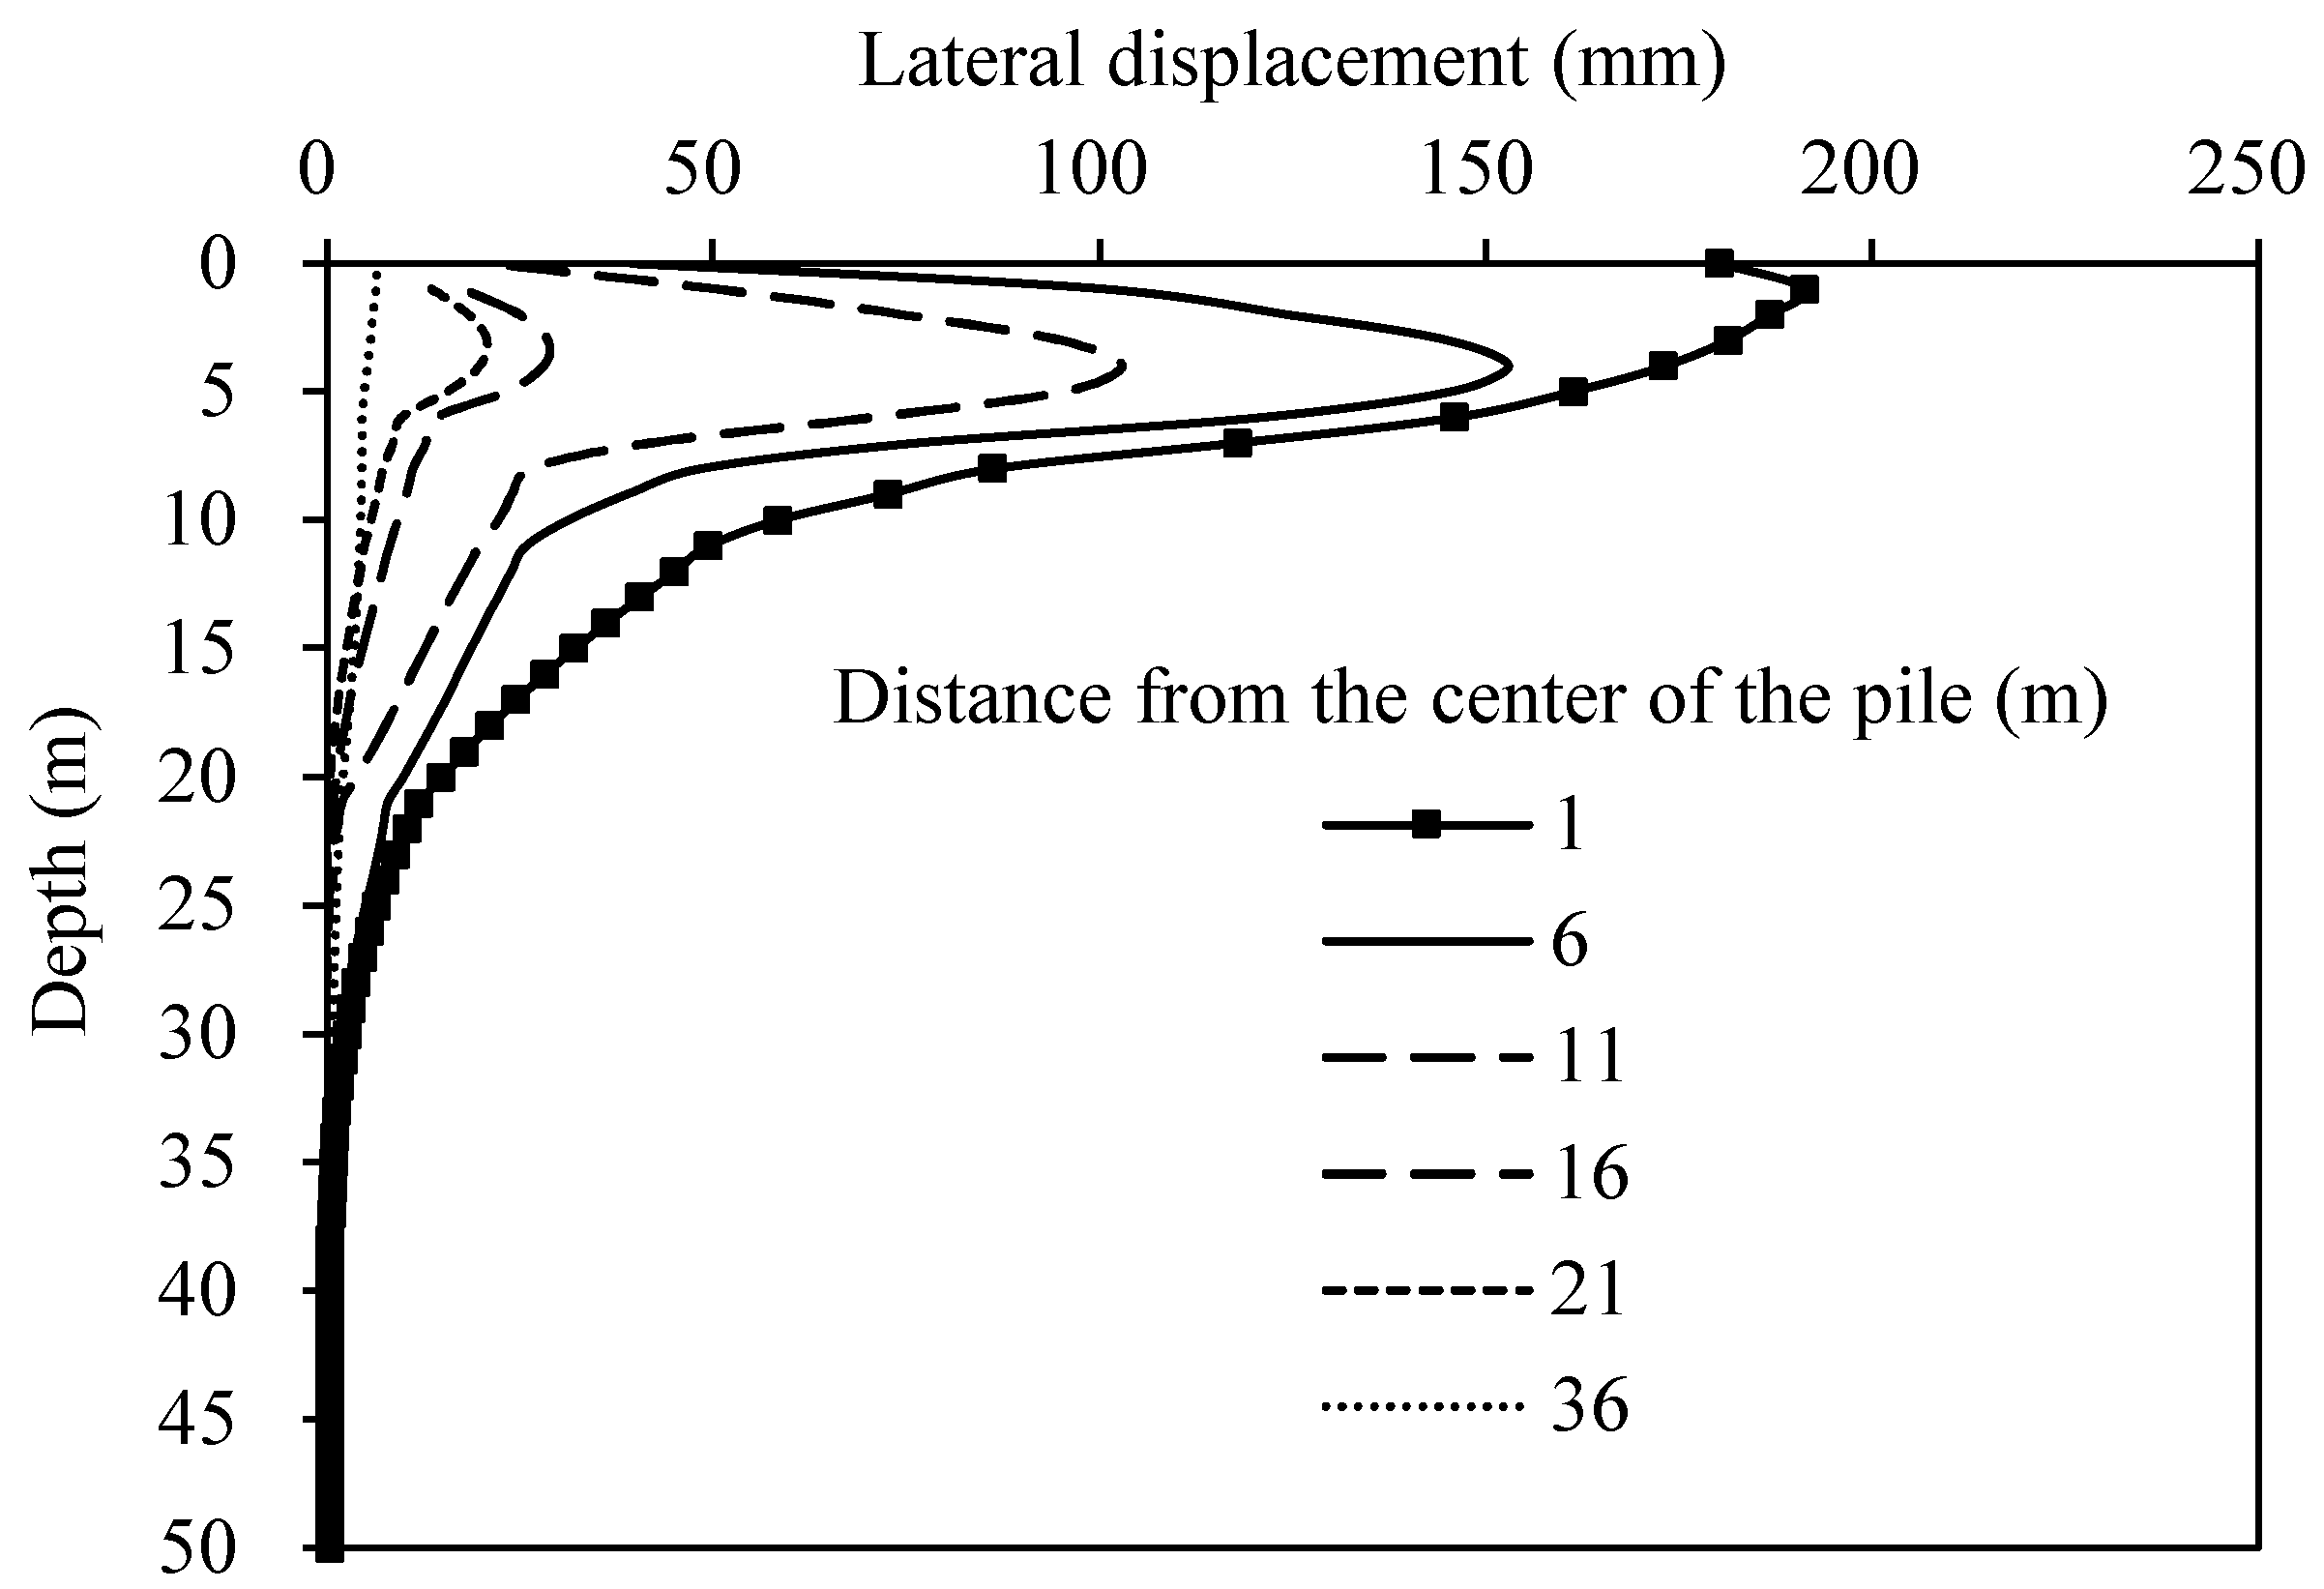
4.3. The Lateral Displacement of the Pile and the Foundation Soil
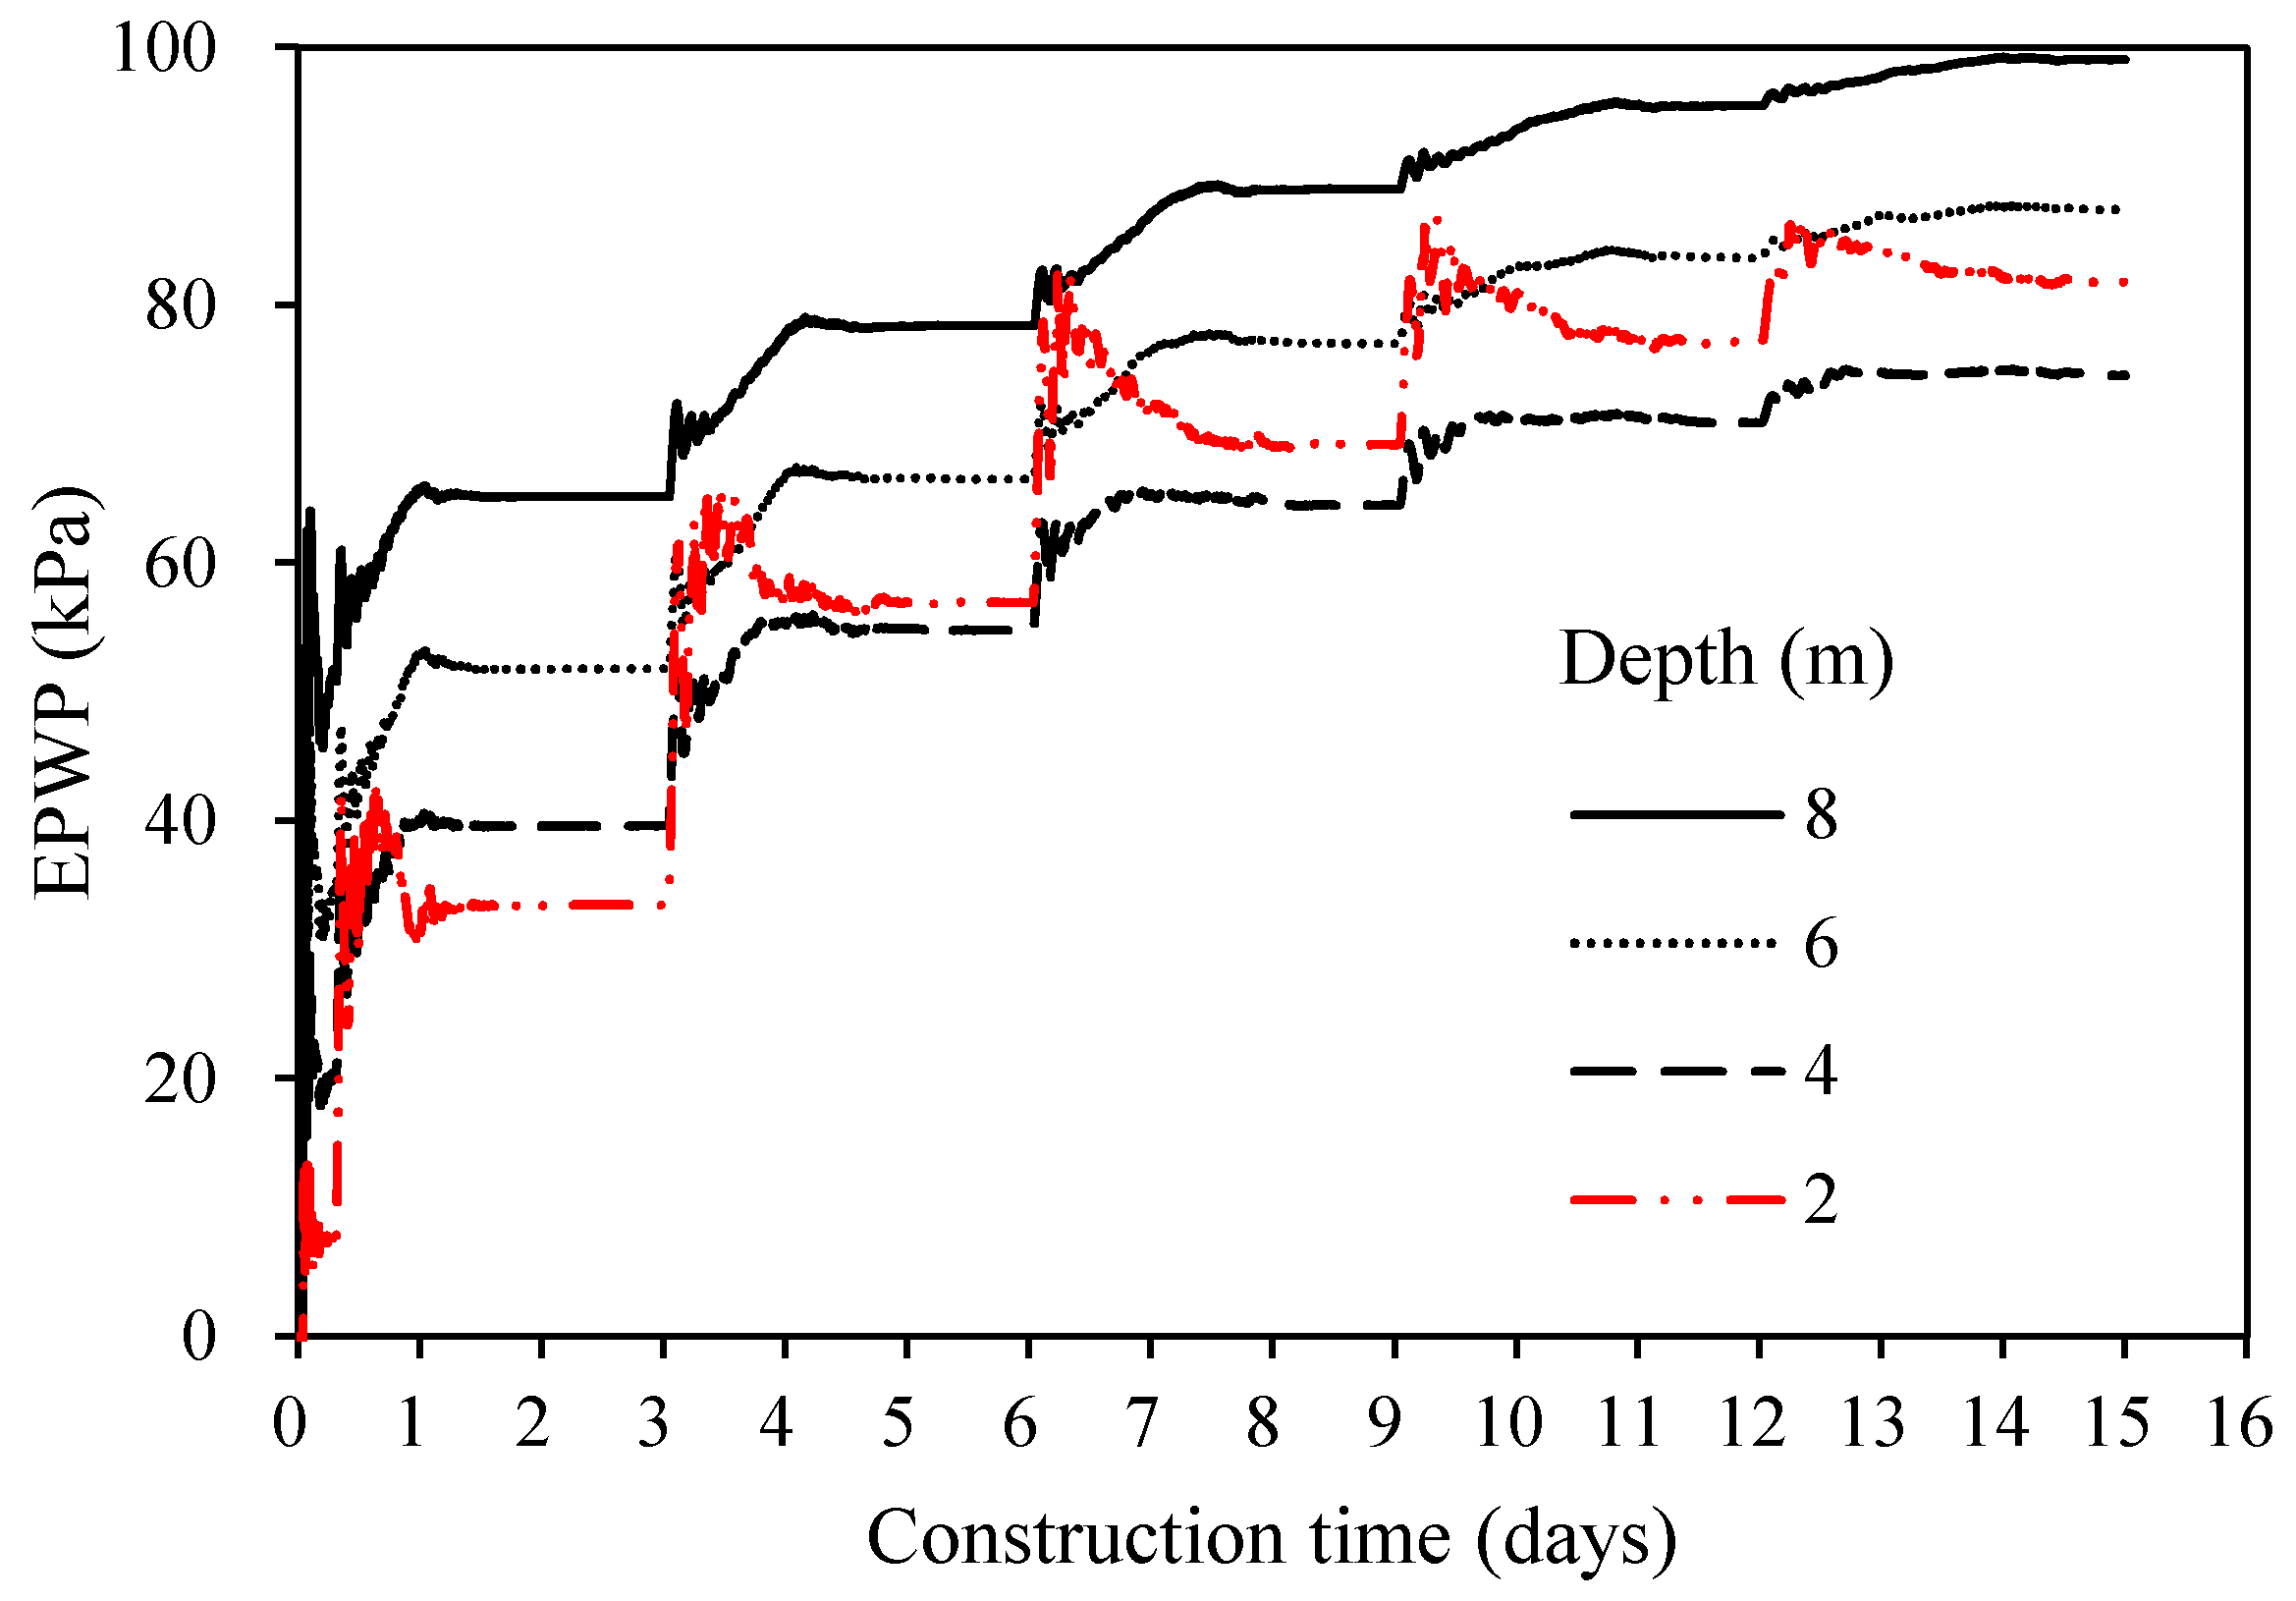
4.4. Excess Pore Water Pressure
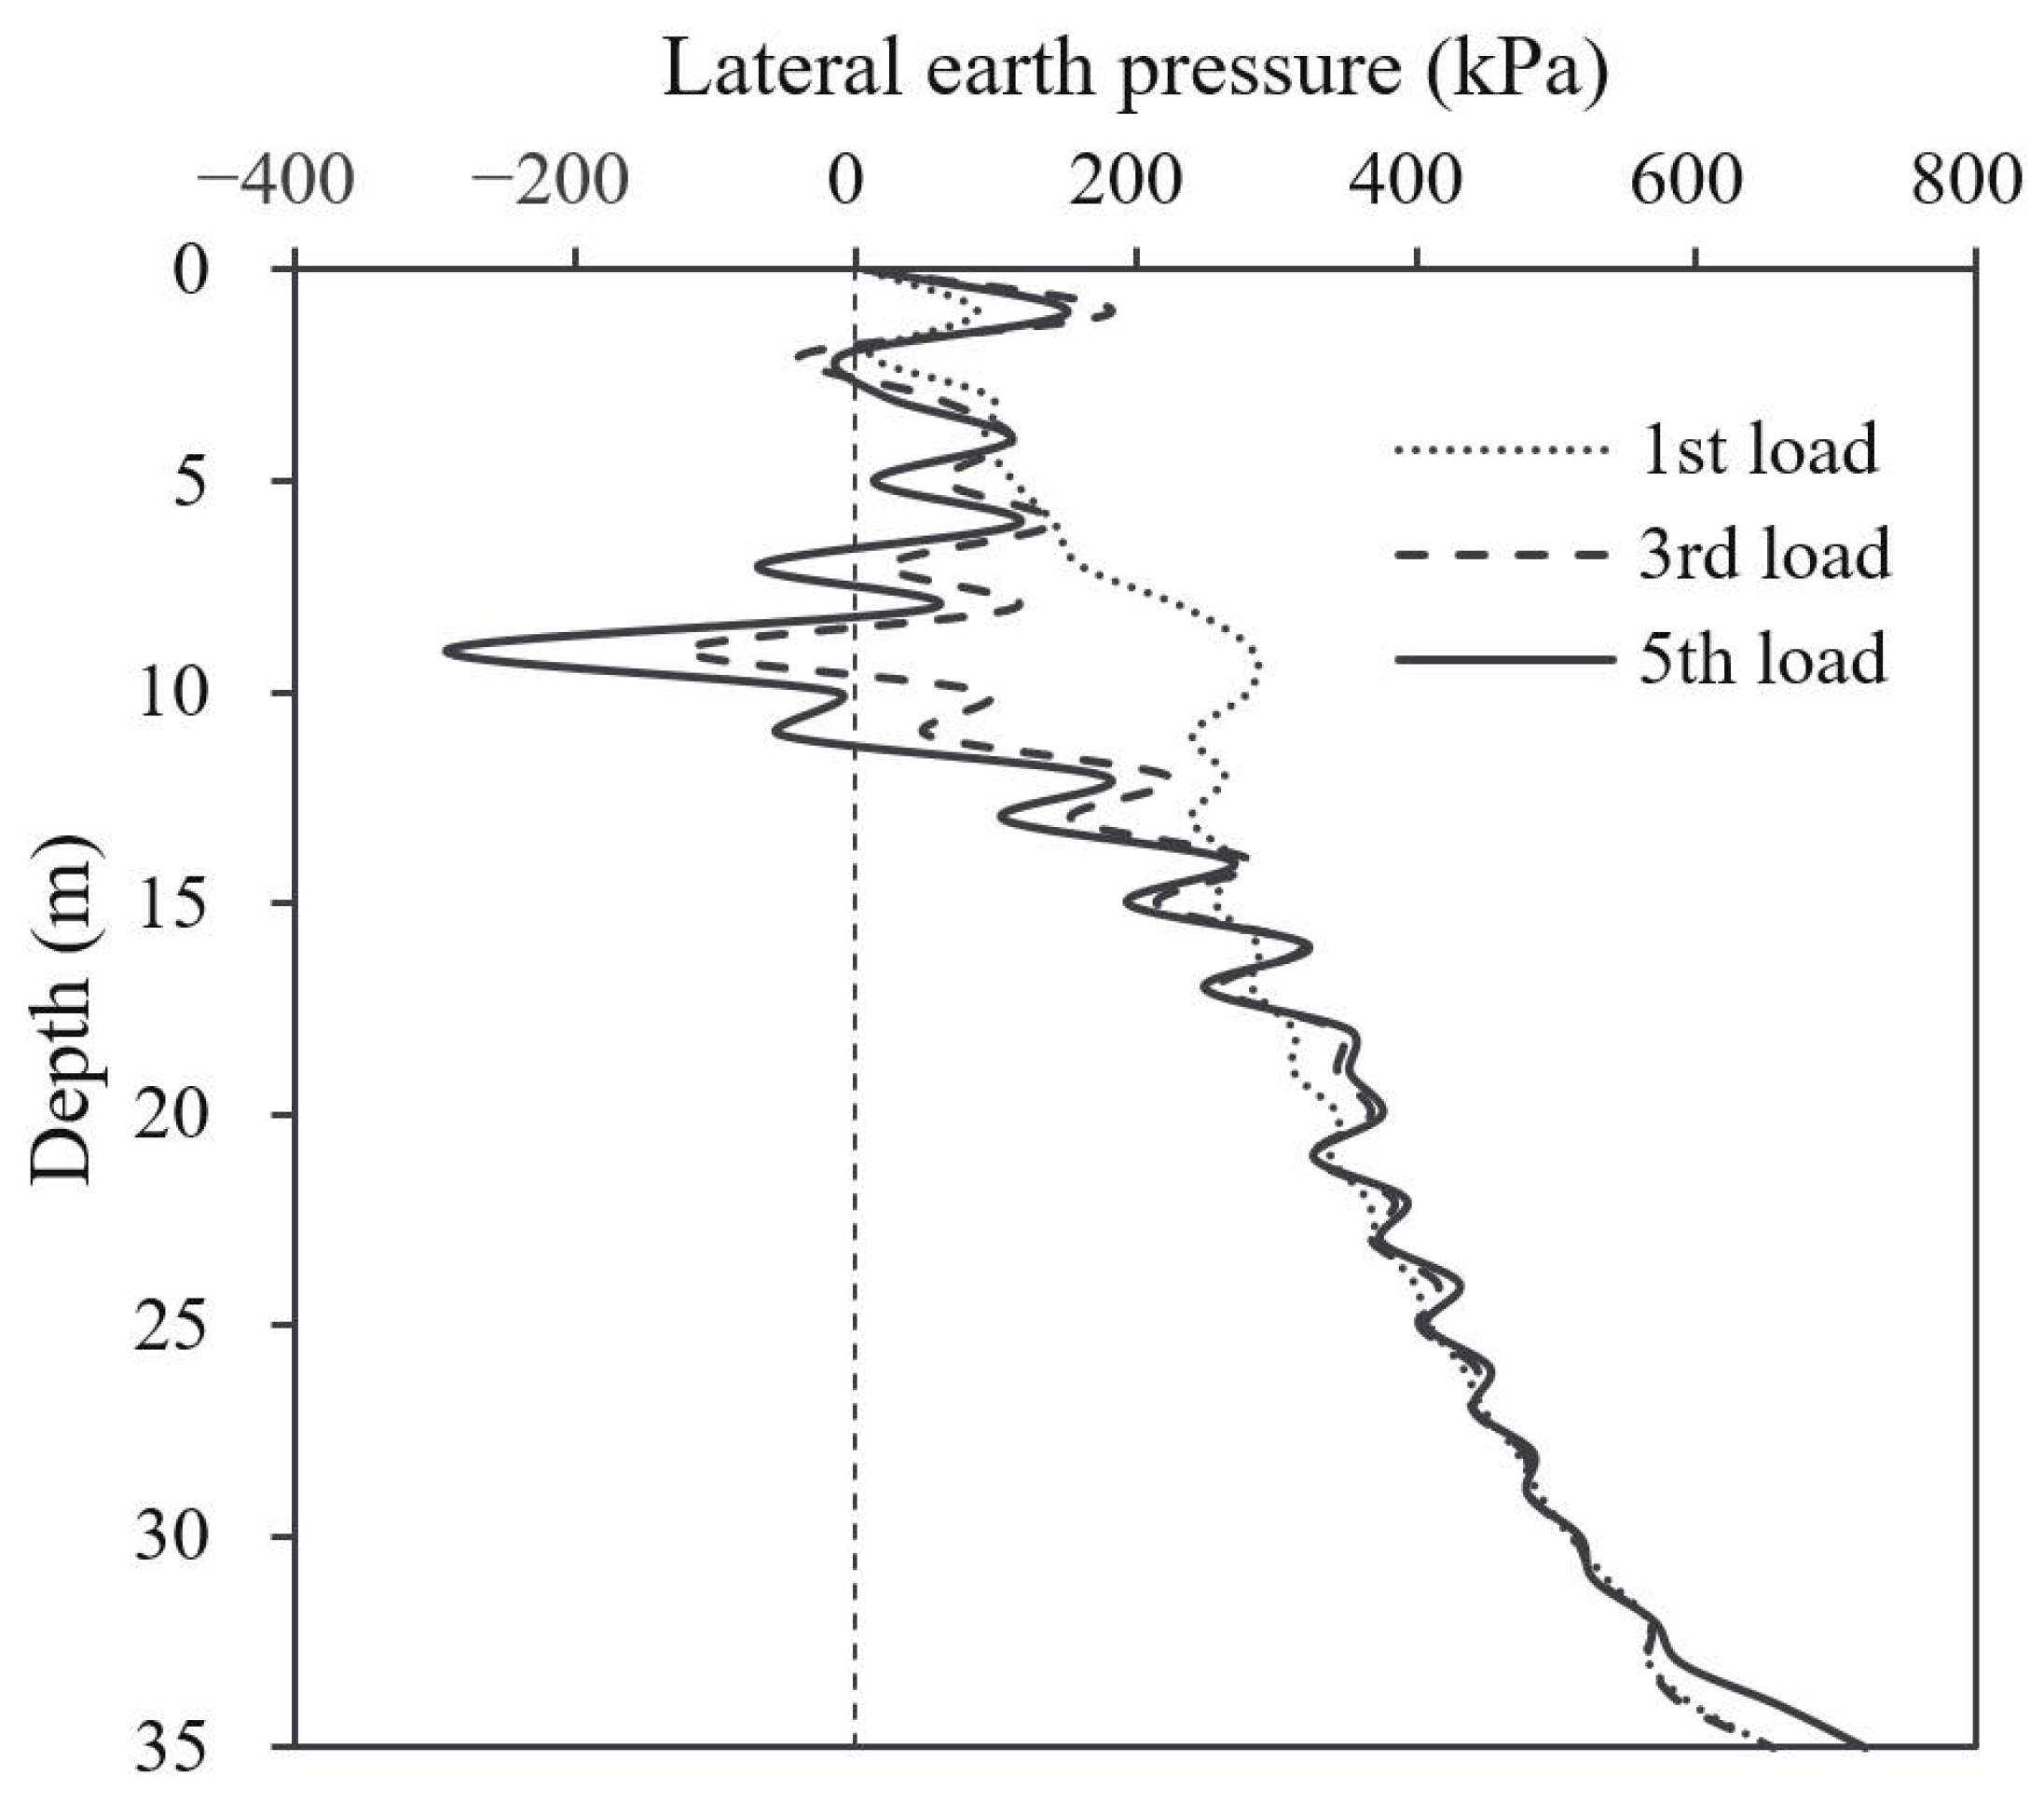
4.5. Lateral Earth Pressure
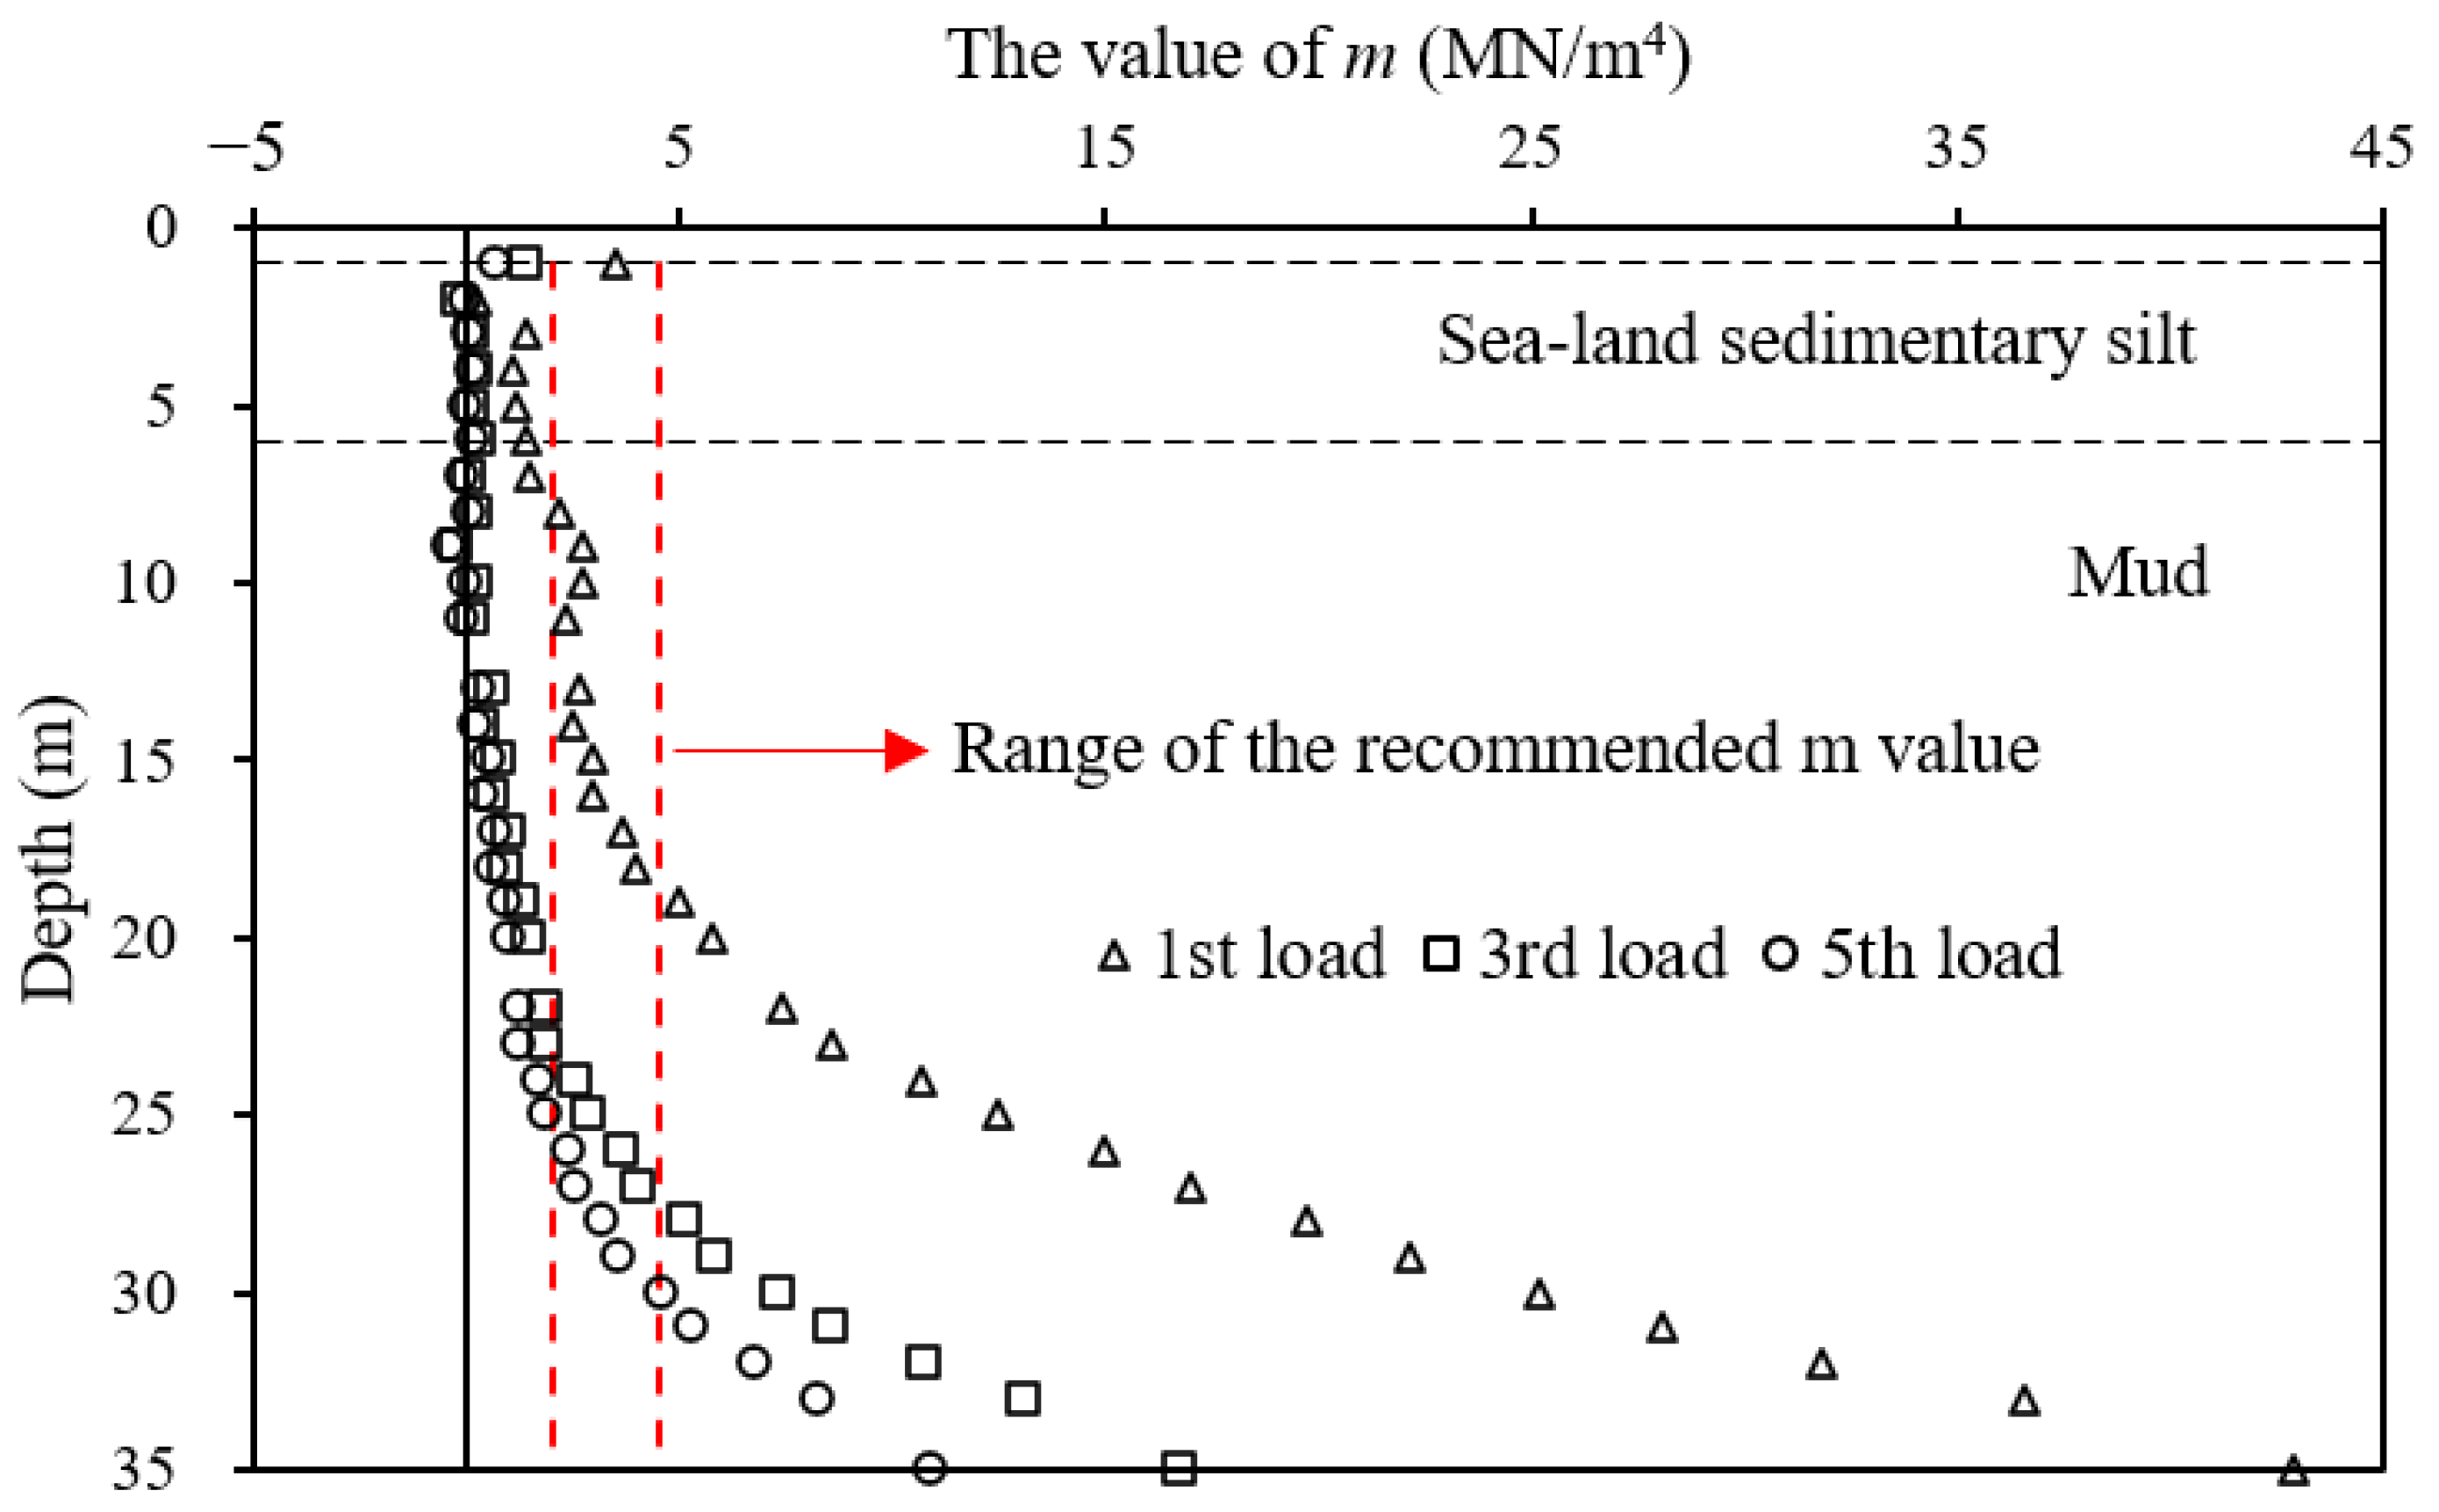
4.6. Variation of the m Value
5. Conclusions
- (1)
- The corner of the loading area developed large uplift deformation. The uplift deformation only happened within a shallow depth of 6 m for the foundation soil at the short edge of the loading area. The foundation soil at the center section always developed downward displacement at different depths.
- (2)
- The pile developed large lateral displacement for a shallow depth of 10 m. The lateral displacement decreased sharply with the increase in depth and increased with the placement of the new lift loading. The foundation soil developed the maximum lateral displacement at depths varying from 1 to 4 m in different cases instead of the ground surface. The lateral displacement of the soil was slight when the depth exceeded 30 m.
- (3)
- The EPWP initially increased significantly after the placement of the 1st lift loading. The increment of the EPWP was not linear with the increase of the surcharge load. The value of the EPWP continued to increase and accumulated with the placement of the new lift loading.
- (4)
- The lateral earth pressure typically increased with the increase in depth at the end of the 1st lift loading. The distribution of the lateral earth pressure in the shallow soil layer was complicated and a negative value was observed under a high surcharge load. The suction effect could be dominant at the soil-pile interface in the situation of high surcharge load and large soil movement.
- (5)
- The m value in the shallow soil layer was typically smaller than the lower limit of the recommended value, while the m value in the deep soil layer was significantly higher than the upper limit of the recommended value. The value of m decreased with the increase of the surcharge load. The design code overestimated the horizontal resistance of the shallow foundation soil at a high surcharge load and large lateral displacement.
Author Contributions
Funding
Institutional Review Board Statement
Informed Consent Statement
Data Availability Statement
Acknowledgments
Conflicts of Interest
References
- Springman, S.M.; Ellis, E.A. Full-height piled bridge abutments constructed on soft clay. Géotechnique 2001, 3, 3–14. [Google Scholar]
- Li, H.; Liu, S.; Yan, X.; Gu, W.; Tong, L. Effect of loading sequence on lateral soil-pile interaction due to excavation. Comput. Geotech. 2021, 134, 104134. [Google Scholar] [CrossRef]
- Poulos, H.G. Analysis of piles in soil undergoing lateral movement. J. Soil Mech. Found. Div. 1973, 391, 391–406. [Google Scholar] [CrossRef]
- Gu, M.; Han, J.; Zhao, M. Three-dimensional discrete-element method analysis of stresses and deformations of a single geogrid-encased stone column. Int. J. Géoméch. 2017, 17, 04017070. [Google Scholar] [CrossRef]
- Gu, M.; Han, J.; Zhao, M. Three-dimensional DEM analysis of single geogrid-encased stone columns under unconfined compression: A parametric study. Acta Geotech. 2017, 12, 559–572. [Google Scholar] [CrossRef]
- Gu, M.; Mo, H.; Qiu, J.; Yuan, J.; Xia, Q. Behavior of floating stone columns reinforced with geogrid encasement in model tests. Front. Mater. 2022, 9, 980851. [Google Scholar] [CrossRef]
- Springman, S.M. Lateral Loading on Piles due to Simulated Embankment Construction. Ph.D. Thesis, University of Cambridge, Cambridge, UK, 1989. [Google Scholar]
- Yuan, B.; Chen, W.; Zhao, J.; Li, L.; Liu, F.; Guo, Y.; Zhang, B. Addition of alkaline solutions and fibers for the reinforcement of kaolinite-containing granite residual soil. Appl. Clay Sci. 2022, 228, 106644. [Google Scholar] [CrossRef]
- Yuan, B.; Li, Z.; Chen, W.; Zhao, J.; Lv, J.; Song, J.; Cao, X. Influence of groundwater depth on pile-soil mechanical properties and fractal characteristics under cyclic loading. Fractal Fract. 2022, 6, 198. [Google Scholar] [CrossRef]
- Gu, M.; Cui, J.; Yuan, J.; Wu, Y.; Li, Y.; Mo, H. The stress and deformation of stone column-improved soft clay by discrete element modelling. Eur. J. Environ. Civ. Eng. 2020, 26, 1544–1560. [Google Scholar] [CrossRef]
- Gu, M.; Han, J.; Zhao, M. Three-dimensional DEM analysis of axially loaded geogrid-encased stone column in clay bed. Int. J. Géoméch. 2020, 1–11, 04019180. [Google Scholar] [CrossRef]
- Gu, M.; Zhao, M.; Zhang, L.; Han, J. Effects of geogrid encasement on lateral and vertical deformations of stone columns in model tests. Geosynth. Int. 2016, 23, 100–112. [Google Scholar] [CrossRef]
- Al-Abboodi, I.; Sabbagh, T.T.; Al-Salih, O. Response of passively loaded pile groups—An experimental study. Geomech. Eng. 2020, 333, 333–343. [Google Scholar]
- Karkush, M.O.; Aljorany, A.N.; Jaffar, G.S. Behavior of passive single pipe pile in sandy soil. IOP Conf. Ser. Mater. Sci. Eng. 2020, 737, 012106. [Google Scholar] [CrossRef]
- Karkush, M.O.; Jaffar, G.S. Simulation the behavior of passive rigid pile in sandy soil. J. Eng. Technol. Sci. 2020, 52, 449–467. [Google Scholar] [CrossRef]
- Yuan, B.; Chen, M.; Chen, W.; Luo, Q.; Li, H. Effect of pile-soil relative stiffness on deformation characteristics of the laterally loaded pile. Adv. Mater. Sci. Eng. 2022, 2022, 1–13. [Google Scholar] [CrossRef]
- Sabbagh, T.T.; Alsalih, O.; Al-Abboodi, I. Experimental investigation of batter pile groups behaviour subjected to lateral soil movement in sand. Int. J. Geotech. Eng. 2019, 14, 705–716. [Google Scholar] [CrossRef]
- Bellezza, I. Closed-form expressions for a rigid passive pile in a two-layered soil. Géotechnique Lett. 2020, 10, 242–249. [Google Scholar] [CrossRef]
- Ramalakshmi, M. Force-displacement response of bridge abutments under passive push. Mater. Today Proc. 2020, 43, 883–887. [Google Scholar] [CrossRef]
- Zhang, H.; Shi, M.; Guo, Y. Semianalytical solutions for abutment piles under combined active and passive loading. Int. J. Géoméch. 2020, 20, 04020171. [Google Scholar] [CrossRef]
- Zhang, H.; Shi, M.; Yang, L.; Guo, Y. A semianalytical solution for passively loaded piles adjacent to surcharge load. Adv. Civ. Eng. 2020, 2020, 1–19. [Google Scholar] [CrossRef]
- Cole, R.T. Full-Scale Effects of Passive Earth Pressure on the Lateral Resistance of Pile Caps. Ph.D. Thesis, Brigham Young University, Provo, UT, USA, 2003. [Google Scholar]
- Tavenas, F.; Mieussens, C.; Bourges, F. Lateral displacements in clay foundations under embankments. Can. Geotech. J. 1979, 16, 532–550. [Google Scholar] [CrossRef]
- Poulos, H.G. Difficulties in prediction of horizontal deformations of foundations. J. Soil Mech. Found. Div. 1972, 98, 843–848. [Google Scholar] [CrossRef]
- Li, H.-Q.; Wei, L.-M.; Feng, S.-Y.; Chen, Z. Behavior of piles subjected to surcharge loading in deep soft soils: Field tests. Geotech. Geol. Eng. 2019, 37, 4019–4029. [Google Scholar] [CrossRef]
- Nicu, N.D.; Antes, D.R.; Kessler, R.S. Field measurements on instrumented piles under an overpass abutment. Highway research record. In Proceedings of the 50th Annual Meeting of the Highway Research Board, Washington, DC, USA, 18–22 January 1971; pp. 90–102. [Google Scholar]
- Chai, J.; Ong, C.; Carter, J.; Bergado, D. Lateral displacement under combined vacuum pressure and embankment loading. Géotechnique 2013, 63, 842–856. [Google Scholar] [CrossRef] [Green Version]
- Ellis, E.; Springman, S. Modelling of soil–structure interaction for a piled bridge abutment in plane strain FEM analyses. Comput. Geotech. 2001, 28, 79–98. [Google Scholar] [CrossRef]
- Yang, M.; Shangguan, S.; Li, W.; Zhu, B. Numerical study of consolidation effect on the response of passive piles adjacent to surcharge load. Int. J. Géoméch. 2017, 17, 04017093. [Google Scholar] [CrossRef]
- Al-abboodi, I.; Sabbagh, T.T. Numerical modelling of passively loaded pile groups. Geotech. Geol. Eng. 2019, 37, 2747–2761. [Google Scholar] [CrossRef] [Green Version]
- Zhang, H.; Sun, K. Influence of surcharge load on the adjacent pile foundation in coastal floodplain. Insight-Civ. Eng. 2020, 3, 17–25. [Google Scholar] [CrossRef]
- Abo-Youssef, A.; Morsy, M.S.; ElAshaal, A.; ElMossallamy, Y.M. Numerical modelling of passive loaded pile group in multilayered soil. Innov. Infrastruct. Solut. 2021, 6, 1–13. [Google Scholar] [CrossRef]
- Yi, S.; Liu, J. Field investigation of steel pipe pile under lateral loading in extensively soft soil. Front. Mater. 2022, 9, 480. [Google Scholar] [CrossRef]
- Kelesoglu, M.; Springman, S. Analytical and 3D numerical modelling of full-height bridge abutments constructed on pile foundations through soft soils. Comput. Geotech. 2011, 38, 934–948. [Google Scholar] [CrossRef]
- FLAC3D 6.0 Document; Itasca Consulting Group: Minneapolis, MN, USA, 2018.
- Bransby, M.; Springman, S. 3-D finite element modelling of pile groups adjacent to surcharge loads. Comput. Geotech. 1996, 301, 301–324. [Google Scholar] [CrossRef]
- Winkler, E. Die Lehre von Elastizitat und Festigkeit (The Theory of Elasticity and Stiffness); H. Domenicus: Prague, Czech Republic, 1867. [Google Scholar]


| Materials | Cohesion | Friction Angle | Density | Young’s Modulus | Poisson | Constitutive Model |
|---|---|---|---|---|---|---|
| (kPa) | (°) | (g/cm3) | (Pa) | |||
| 1st layer | 0 | 37 | 1.65 | 1.0 ×10⁷ | 0.37 | Mohr-Coulomb |
| 2nd layer | 8.81 | 0.06 | 1.59 | 1.5 × 10⁶ | 0.45 | Drucker-Prager |
| 8.81 | 0.07 | 1.59 | 1.6 × 10⁶ | 0.45 | ||
| 3rd layer | 5.46 | 0.08 | 1.69 | 8 × 10⁶ | 0.30 | |
| 7.46 | 0.12 | 1.69 | 9 × 10⁶ | 0.30 | ||
| 10.46 | 0.20 | 1.69 | 1 × 10⁷ | 0.30 | ||
| 20.46 | 0.45 | 1.69 | 2 × 10⁷ | 0.30 | ||
| 4th layer | 3.0 | 32 | 2.05 | 5.2 × 10⁸ | 0.30 | Mohr-Coulomb |
| 5th layer | 60 | 45 | 2.25 | 1 × 10⁹ | 0.30 | |
| Steel pipe pile | - | - | - | 2.0 × 10¹¹ | 0.31 | Elastic |
| Inclinometer tube | - | - | - | 4.28 × 10⁸ | 0.30 | Elastic |
Publisher’s Note: MDPI stays neutral with regard to jurisdictional claims in published maps and institutional affiliations. |
© 2022 by the authors. Licensee MDPI, Basel, Switzerland. This article is an open access article distributed under the terms and conditions of the Creative Commons Attribution (CC BY) license (https://creativecommons.org/licenses/by/4.0/).
Share and Cite
Gu, M.; Cai, X.; Fu, Q.; Li, H.; Wang, X.; Mao, B. Numerical Analysis of Passive Piles under Surcharge Load in Extensively Deep Soft Soil. Buildings 2022, 12, 1988. https://doi.org/10.3390/buildings12111988
Gu M, Cai X, Fu Q, Li H, Wang X, Mao B. Numerical Analysis of Passive Piles under Surcharge Load in Extensively Deep Soft Soil. Buildings. 2022; 12(11):1988. https://doi.org/10.3390/buildings12111988
Chicago/Turabian StyleGu, Meixiang, Xiaocong Cai, Qiang Fu, Haibo Li, Xi Wang, and Binbing Mao. 2022. "Numerical Analysis of Passive Piles under Surcharge Load in Extensively Deep Soft Soil" Buildings 12, no. 11: 1988. https://doi.org/10.3390/buildings12111988