Article

Predicting the Cost Outcome of Construction Quality Problems Using Case-Based Reasoning (CBR)

by
Neşet Berkay Doğan
1,
Bilal Umut Ayhan
2,
Gokhan Kazar
3,
Murathan Saygili
1,
Yunus Emre Ayözen
4 and
Onur Behzat Tokdemir
5,*
1
Department of Civil Engineering, Middle East Technical University, Ankara 068000, Turkey
2
Department of Civil Engineering, Istanbul Bilgi University, Istanbul 34060, Turkey
3
Department of Civil Engineering, Istanbul Gelisim University, Istanbul 34310, Turkey
4
Head of Strategy Development, Ministry of Transport and Infrastructure of Republic of Turkey, Ankara 06490, Turkey
5
Department of Civil Engineering, Istanbul Technical University, Istanbul 34467, Turkey
*
Author to whom correspondence should be addressed.
Buildings 2022, 12(11), 1946; https://doi.org/10.3390/buildings12111946
Submission received: 7 October 2022 / Revised: 2 November 2022 / Accepted: 7 November 2022 / Published: 10 November 2022

Abstract

:
Quality problems are crucial in construction projects since poor quality might lead to delays, low productivity, and cost overruns. In case preventive actions are absent, a lack of quality results in a chain of problems. As a solution, this study deals with non-conformities proactively by adopting an AI-based predictive model approach. The main objective of this study is to provide an automated solution structured on the data recording system for the adverse impacts of construction quality failures. For this purpose, we collected 2527 non-conformance reports from 59 diverse construction projects to develop a predictive model regarding the cost impact of the quality problems. The first of three stages forming the backbone of the study determines crucial attributes linked to quality problems through a literature survey and the Delphi method. Secondly, the Analytical Hierarchy Process (AHP) and a Genetic Algorithm (GA) were used to determine the attribute weights. In the final stage, we developed models to predict the cost impacts of non-conformities, using Case-based Reasoning (CBR). We made a comparison between the developed models to select the most precise one. The results show that the performance of CBR-GA using an automated weighting model is slightly better than CBR-AHP based on a subjective weighting system, whereas the case is the opposite in standard deviation in forecasting the cost outcome of the quality failures. Using both automated and expert systems, the study forecasts the cost impact of failures and reveals the factors linked to poor record-keeping. Ultimately, we concluded that the outcome of non-conformities can be predicted and prevented using past events via the developed AI-based predictive model.

1. Introduction

Every construction is unique in scope, contract type, relevant specifications, construction environment, and methods applied. These variations between projects make performed actions non-repetitive. Each construction project thus carries uncertainty and risk, fostered by the project’s complexity. As a result, defects and quality issues become inevitable, leading to rework. Such issues also stimulate variances in construction budgets and schedules. All these factors in construction interact with each other and bring new management complexities to construction projects. One of the most important leading factors is quality failures among these management processes. High quality is directly linked to project success in that it eliminates potential delays [1] and excessive costs [1,2,3,4,5,6]. Love [1] recorded rework-related increases in mean cost (12.6%) and scheduling time (20.7%) in Australia’s building projects. In addition, rework cost is directly proportional to the contract value, in that high contract values come with high rework costs. Hence, the occurrence of rework decreases profit and productivity. For example, Love et al. [4] revealed a 28% rework-related loss in annual profit on average. It is obvious that when defects are detected before they happen, related costs can be averted. Furthermore, one failure in the construction factor tends to stimulate other failures, which is called a “domino effect” in construction [7]. Accordingly, managing and controlling unwanted events in construction could be more difficult if any of the control or data management systems do not exist [8]. As a result, a proactive quality control system is needed so that construction practitioners can be instantly informed about possible outcomes of defects. For this purpose, AI-based solutions should remedy such complex quality issues in construction [9]. However, a predictive model developed to estimate the cost impacts of quality failures in construction projects based on past NCRs does not exist. Thus, it is highly necessary to introduce a model to forecast the cost effects of quality failures.
Non-conformance reports (NCRs) record quality issues in construction sites. After recording them by NCRs, root cause analysis helps manage quality problems by addressing the source problem. This is crucial as learning from mistakes is at the center of organizational learning and improvement [10,11]. The possibility of malpractice, however, may cause overlooked failures or biased recording [12]. Therefore, the records on quality issues should be effectively used and widened on construction sites. At this point, a new NCR recording system and predictive models should be integrated to mitigate quality issues and their domino effects on construction cost overruns, time delays, and productivity [7,
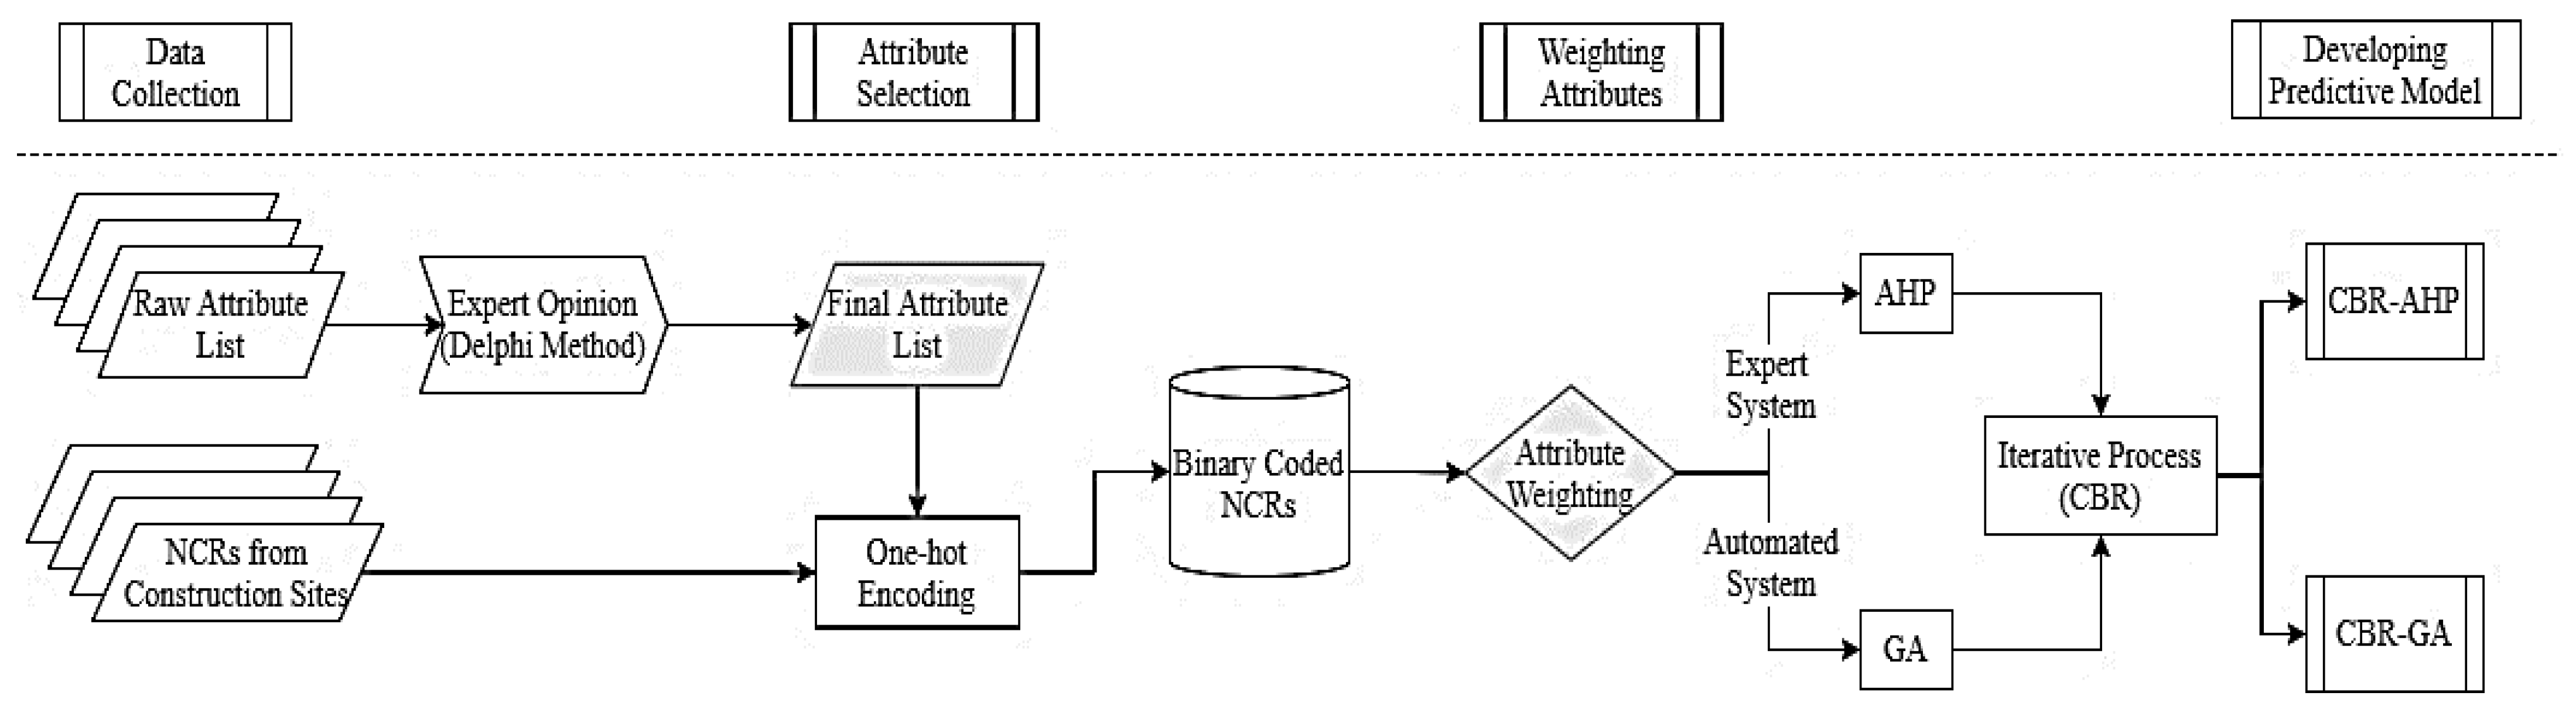
13]. Thus, the purpose of this research is to mitigate the negative cost influences of quality problems in construction projects and thus increase cost performance based on the NCRs. Thus, a prediction model-based early-warning system for quality management that estimates the cost impacts of upcoming cases using past data instead of the preset rules is highly essential. The by-product of the model is that inexperienced quality-control practitioners can be informed on the quality issues so that they record what is problematic through NCRs. Adopting an AI-based predictive model by using the CBR method is another unique part of this study to forecast the cost impact of quality issues based on past events.
NCRs occur during a period of the construction timeline, and we believe that the occurrences of these problems are interrelated with each other. Experiencing a failure is an early warning that a subsequent and, most likely, more severe failure will occur [7]. The data collected considering the order of occurrence can be viable to forecast an expected cost impact problem from the NCRs [14]. Therefore, the study aims to develop an artificial intelligence-based early-warning system to predict the outcome of the most likely non-conformances occurring in the project. The model utilizes the past data obtained from different construction projects so that the upcoming failures and their cost consequences are anticipated considering the present condition of the specific project. The collected data are in order according to their occurrence in the project, so the data and model collaboratively work to retrieve the most similar cases and summarize the information for the upcoming events. The model can adopt the recorded NCRs from an ongoing project as input. Then, it retrieves the most similar cases from its database using CBR and summarizes the significance of upcoming NCRs in terms of their types and cost impacts.

2. Literature Review

2.1. Quality Issues

Rework has a major cost impact on projects. To moderate this impact, the resultant costs of defects were studied using various methods [3,4,6,15,16]. Love [1] conducted a case study showing the rework cost of various project types in Australian construction. The results revealed that although cost reduction was needed with the help of less rework, the project type or procurement technique did not influence the rework amount. Hwang et al. [17] observed the project characteristics regarding their cost performance and suggested remedies addressing the root causes of rework. In another study with a similar goal, Forcada et al. [2] identified the cost impact factors for rework, including project characteristics and managerial issues. In addition, the literature studied the cost impact of rework in terms of direct [4] and indirect [1] costs, stating that the overall cost can be determined from the probabilities of its components [5]. Recently, Oleah et al. [13] revealed the causes that lead to reduced profits in building projects. Faulty work was among these factors.
Abu Aisheh [10] focused on mega-building construction and reviewed the literature in terms of lessons learned from these projects, obstacles lowering project performance, and ways to improve processes. The research also stated that these lessons help stakeholders while reducing the cost and frequency of unexpected events. To reduce defect costs, knowledge management and proper quality program were found to be effective in reaching the goal [14,18,19]. Josephson and Hammarlund [20] investigated the effectiveness of the early detection of defects in reducing rework costs. According to their study, this solution can help avoid rework and resultant costs, which informs the literature of the need for systems warning users about poor quality. Elbashbishy et al. [7] assessed construction-related risks to study cost overruns. In the research, they performed a risk simulation and used a genetic algorithm and an artificial neural network for output cost overruns. They addressed the chain of failure events and cost outcomes in their methodology. As there is a dynamic and triggering relationship between quality issues, real-time monitoring can enable taking immediate actions in quality programs. Zhong et al. [21] developed a system to monitor earth-rockfill dam constructions, and Kazemian et al. [22] were able to detect the defects in additive manufacturing. Finally, the quality of gravel piles was controlled using a monitoring system and the Internet of Things [23].
As safety is also an essential quality component, the authors have contributed to the literature. They have employed an artificial neural network (ANN) to forecast the outcome of incidents that occur on a construction site [24], and they used a hybrid model of CBR, AHP, ANN, and latent class clustering analysis to solve the heterogeneity problem in the dataset [25]. Moreover, a system applying an ANN was proposed to predict incident severity levels [26]. Finally, association rule mining was used to reveal the hidden relationships of attributes leading to construction accidents [27]. The ultimate aim was to create compact and predictive systems that emphasize safety and quality for construction practitioners. Regardless of the amount of effort in assessing the rework cost, the literature lacks proactive early warning systems informing the cost impacts of NCRs. The developed systems can only identify defects after an occurrence rather than detect them proactively. Hence, implementing a system that can detect the drawbacks of a quality system and inform practitioners of them is required.

2.2. Case-Based Reasoning (CBR)

CBR takes advantage of the similarity of issues alike; therefore, it is fed by the knowledge cumulated heretofore for effective handling of project complexity. CBR works similarly to the human reasoning approach and attempts to solve and identify problems by relying upon experience. In this sense, the machine learning technique CBR can predict outcomes based on previous cases, which are called databases. CBR utilizes a support decision mechanism and follows similar past cases to provide a new solution for existing problems [28]. Studies utilized the technique alongside ANN. Some authors [29,30,31] stated that CBR has better performance, whereas Kim et al. [32] claimed to achieve more accurate results with ANN. In terms of processing duration, ANN was proved to be longer than CBR [30], which means CBR prevails over ANN as quality systems must detect issues quickly. Due to a lack of information in the early project phases, constructing high-performance models is hard to achieve, regardless of the intelligence these models have. CBR plays an important role in working with little data, such as construction cost estimation, and was used in various studies [32,33,34,35,36,37,38,39,40,41]. In addition, cost estimation for different project types was at the center of the research. These types include railroad bridges [42], military facilities [43], housing projects [40,44,45], and pump stations [46]. However, quality was not a concern in these projects.
As construction projects require the participation of various parties with each having different interests and perspectives, these interests might end up conflicting with each other, leading to disputes. Therefore, research utilized CBR in dispute cases, as well. A CBR-based negotiation model, MEDIATOR, was developed by Li [47], providing impartial judgment for dispute cases. Furthermore, CBR models were developed in the literature to predict the outcome of litigation [48,49,50], attempting to reduce the excessive costs of litigation. Other areas using CBR include planning [51,52,53], risk response [54,55] hazard identification [56], and international market selection [30].

2.3. Research Statement

Diverse studies have explored the reasons for quality issues and the effect of such problems on construction cost performance [3,4,15,16]. A few of them utilized NCRs to understand the root causes of the quality issues and cost overruns due to defects [2,4,18]. However, these studies mainly focused on the records of quality defects to provide lesson learning from past data rather than predicting new possible cases related to poor quality. To the knowledge of the authors, there has been no predictive model developed to forecast the cost impacts of quality failures in construction projects based on past NCRs. In this sense, it is highly essential to achieve a model to predict the cost influences of quality failures and severe upcoming events regarding failures. Therefore, the main objective of this study is to develop a predictive model based on the NCRs recorded in diverse construction sites to forecast how and to what degree quality failures influence the cost performance of construction projects. Introducing an AI-based predictive model developed via the CBR method is another unique part of this study to predict the cost impacts of quality issues based on past events.
Since CBR models are affected by the attribute weights, the aforementioned research used different techniques to select the correct and accurate ones. Feature counting [33], gradient descent [33,57], multi-regression analysis [36], and decision trees [58] were among these methods. Yet, GA was found to be the most common in these studies [35,38,43,45,57]. However, in addition to the computer-based tools, expert opinion was considered valuable regarding the complexity factor [34]. It is necessary to consider both automated and subjective systems to develop a more accurate predictive CBR model. Therefore, it is available to make a comparison between two developed models and determine which one is better a predicting the cost effects of quality failures. As a result, this study was built on the foundation of GA and AHP to develop a predictive model using CBR, taking both a computerized approach and expert opinion into account, respectively.

3. Research Methodology and Results

This study pursues the development of a probabilistic model for detecting quality issues in advance for construction projects. For this reason, 2527 NCRs mostly causing reworks were collected from 59 diverse construction projects constructed by international construction companies. After that, these NCRs were analyzed based on the quality failure factors called “attributes” across the entire manuscript by using the Delphi technique. This means that each case was coded according to the involved factors. To move forward, the NCRs were preprocessed for machine learning, which necessitated one-hot encoding of the dataset. The result was a binary dataset. The technique used for machine learning was CBR, which relies heavily on the weights of the selected attributes, and the model was coded in a MATLAB environment. To assign proper weights to these attributes, two techniques were used, namely AHP and GA. Using two separate methods for weight assignment also helped compare the automated systems and expert opinion in CBR applications used in construction quality problems. As the main mechanism behind the CBR model is retrieving the most similar case to a given situation, the model was set to retrieve ten similar cases, which were used to calculate cost impact probability. Finally, the results were compared to the actual data to assess the accuracy of the CBR model (Figure 1).

3.1. Attribute Selection

The literature consisting of quality studies provided the initial list of attributes causing rework. Some of the studies revealed a limited number of causes, whereas some delved into these problem sources. Table 1 provides the initial list of the reasons for rework in construction projects. Before initiating the Delphi process, rework cases were sent to panelists (Table 2) so that they could give feedback on the relevant attributes, which were added to the primary attribute list. Some of the collected attributes had similar meanings (e.g., ‘incorrect or defective material usage’ and ‘damaged material usage’); therefore, these attributes were cleaned. The attributes shown in Table 1 were categorized under four main groups according to activity type and rework consequences. These were materials, design, construction, and operation. As the collected NCRs belong to construction phases, the categorization process was formed accordingly. The majority of client-related and subcontractor-related factors were eliminated, except for a small number of them explaining their impact on rework [59]. Similarly, pre-construction-related attributes were also removed from the list. All of these eliminations were mainly related to collected NCRs and their contents. Furthermore, the predictive model was developed on the quality failures related to construction phases rather than managerial aspects in this study.
The Delphi method ranked these attributes through an iterative process based on the responses of experts so the most relevant factors can be determined. Initially, as studies have recommended the number of panelists to be between 10 and 20 [25,67], this study identified 11 panelists for the Delphi process. These panelists with experience in construction quality management were selected from a list of civil engineers, mechanical engineers, and architects working for international construction companies and universities (Table 2 and Table 3). Along with the quality managers, two construction managers who have experience in both quality and project management processes were included in this study.
Then, a questionnaire aiming at ranking the attributes was prepared. Panelists anonymously responded to each item with a score between 1 (strong disagreement) and 7 (strong agreement) to provide a ranking of these attributes. Sample means and sample standard deviation of each set of responses were calculated [25,68,69] using Equations (1) and (2), where n indicates the number of responses (Xi) for each question.
x ¯ = 1 n i = 1 n X i  
s = 1 n i = 1 n ( X i   x ¯ )
According to these calculations, three cases were considered:
  • Attributes with a low mean score: These attributes were eliminated from the model.
  • Attributes with a high mean score and standard deviation: There was no consensus. A second iteration was needed to ensure agreement.
  • Attributes with high mean values and low standard deviation: These attributes were the most desired ones; therefore, they were kept in the model.
The attributes belonging to the first category were directly eliminated in the first round. However, the attributes falling into the second group, which needs another iteration, were sent back to the respondents. These attributes are marked with an asterisk (*). For example, the ‘Damaging material during transportation/loading’ attribute had a high standard deviation, thus making a second-round necessary. Finally, the third category was accepted without any change. It should be noted that design-related causes were not accepted as rework cases did not include the design phase. Therefore, there is only one item in the ‘Design’ category in the final attribute list (Table 4). Furthermore, panelists, specifically Panelists 1 and 9, commented on the given questionnaire. According to their suggestions, “Inadequate training”, “Inadequate staff”, and “Insufficient/improper workmanship” were similar terms and should be merged into one attribute. Their comment was accepted, and the three attributes were represented by a new attribute, called ‘Inadequate staff and insufficient/improper workmanship’. On the other hand, panelists recommended that ‘Problem with warehouse (Labeling, etc.)’ and ‘Problems with documentation’ should be combined; however, this comment was rejected since the latter constitutes more than the former. At the end of the process, a final list emerged consisting of the 25 diverse attributes categorized into five different groups (Table 4). It should be emphasized here that the primary purpose of this process was not only to extract the final attribute list but also to assign a weight to each attribute observed in quality failures. This enabled the generation of a binary form (1 or 0) for each case, indicating whether or not a related sub-attribute exists in an NCR. The final list of attributes can be seen in Table 4. The overall process of the Delphi technique is given in Figure 2.

3.2. Determining Attribute Weights

For CBR models to make an accurate assessment, assigning a proper weight to each attribute is essential. This study used two different techniques for that purpose. The first method was AHP, which employs an expert system for decision making, and the second was GA, a computerized automated algorithm. Each method has its strengths and weaknesses. Doğan et al. [57] stated that automated methods could remove the need for finding qualified experts and overcome subjective opinions. In contrast, An et al. [34] advocated the importance of expert opinions because computerized algorithms are not able to comprehend the overall process. Therefore, this study utilized both approaches to observe and compare the outcomes.

3.3. Analytic Hierarchy Process (AHP)

AHP is commonly used as a decision-making tool [70,71]. Through pairwise comparison, the method ranks various alternatives. Although these alternatives can be sorted manually, such a method would lead to a bias in selection, affecting the overall decision. Inconsistency in the expert opinion is overcome by AHP [72] with the help of inherent indices such as the consistency index (CI) and the random consistency index (CR). According to the definition of Saaty [73], AHP steps are as follows:
  • Problem identification and decision hierarchy generation.
  • Comparison matrix, C, formation using Table 5.
  • Normalizing matrix C by the sum of each column, si, to obtain weights, where the new matrix is called B.
  • Calculating the average of each row to generate the weight matrix, w.
To calculate CI and CR, the dot product of matrices w and C were calculated and normalized with the weight. This calculation yielded a new matrix, R. The maximum value, λmax, of R represents the divergence among the attributes. Equation (3) shows the formula for CI and CR. Saaty [73] proposed a random consistency index table (RC) (Table 6); the RC values were determined for the number of alternatives to be compared:
R = b 11 b 1 n b n 1 b nn   .   w i w n = r i r n   R normalized = r i r n ,   where   r i =   i = 1 n r i w i   ,   i = 1 ,   2 ,   3 n   λ max = max R normalized CI   Consistency   Index = λ max 1 n 1   CR   Consistency   Ratio = CI RI 10 %  
Figure 3 shows the overall AHP process that was applied to this study. Rework cases were binary coded, i.e., the attribute was assigned a one (1) if it was observed in the non-conformance case and a zero (0) if this was not the situation. The weighted sum (fwi) of all attributes was calculated by aggregating the observation frequency of each item (fij) for the cost impact (ci). The weighted summations were normalized (fwi-norm) in each group and multiplied with the frequency (fi) to calculate the comparison criteria (cci) before AHP. Table 7 shows the process information of this study (the design attribute was not included since it had only one attribute).
The results of AHP are shown in Table 7. According to these results, specific attributes with a high observation frequency have minor cost impacts (such as M2 and O4). In contrast, some of the least observed attributes explain most of the cost impact on the project budget. The pairwise comparison in Figure 4 shows both layers of AHP. Construction-related causes became the most prevalent after the first iteration of the method. As expected, design-related attributes were given the lowest score.
Table 8 summarizes the obtained weights for each attribute to be fed to the CBR unit. The CR value assessed the consistency in the results. As the CR of each attribute should be less than 10%, no issue was encountered in this situation.

3.4. Genetic Algorithm (GA)

The GA method is a heuristic AI technique adopting natural selection principles [57]. Doğan et al. [57] developed a CBR model using three different optimization techniques, namely, gradient descent, feature counting, and GA. The result of this study shows that the CBR model optimized with GA has a better performance compared to the other two methods in predicting the cost of structural systems. Moreover, Kim and Kim [38] developed and validated a GA-based CBR predictive model to estimate preliminary construction costs. A previous study [45] concluded that the cost estimation of family houses in the design phase can be precisely performed via the CBR predictive model assisted with GA for weighting attributes. The solutions are indicated by the chromosomes whose success is defined by the fitness criteria in the GA. The GA performs four main steps to reach the goal: Initialization, selection, crossover, and mutation. The GA is initiated by randomly distributing the chromosomes to the solution space. Then, each chromosome is evaluated regarding the fitness criteria defined by the user. Then, chromosomes with better performance are selected to proceed with reproduction because the aim is to preserve reproduction within the high-score members. This selection results in the domination of the best-performing chromosomes in the population over time.
In this study, GA took place in dealing with the weighting process of attributes. AHP requires hands-on calculations, whereas GA promotes automation, which could be a better solution to provide a complete, adaptable, and fast model setup. Then, the CBR model advances to predict the cost impact of the quality failures using the calculated weights from the GA. GA progresses iteratively, and the algorithm crosses over or mutates the attribute weights. Since tuning the GA parameters is based on a trial-and-error process, there were two criteria that the authors followed when deciding the best option. These were the cost of computation (time spent on obtaining the best fit) and obtaining the minimum RMSE. There is a trade-off between obtaining the best fitness score and the time consumed to reach the goal. The smaller crossover and mutation rates yield an increase in the resolution of computational progress so that the speed of iterations decreases dramatically. After several attempts, the optimum number of chromosomes (population) was determined as 50. The crossover and mutation rates were 0.5 and 0.1, respectively. The iterations were initialized by weighting the attributes as 1, and the root mean squared error (RMSE) was selected as a fitness criterion (Equation (4)). The stop criterion was defined according to RMSE such that when GA could not produce a lower RMSE value along with 9500 subsequent iterations, it would be terminated. Then, GA found the solution set with the minimum error. For GA calculations, Evolver from the Decision Tools Suite [75] was used.
Root   Mean   Square   Error   RMSE =     1 n ( y i   y i ) 2 n                        
Here, yi′ is the actual cost impact and y′ is the prediction. The 35,872nd iteration gave the minimum error, and the local minimum was 26,375th (see Figure 5). Table 9 provides the resultant weights.

3.5. Case-Based Reasoning (CBR)

CBR addresses the complexity of the construction industry by using knowledge-based approaches rather than rule-based techniques. It mimics human memory and its reasoning ability so that it can assess new problems based on previous experiences. CBR can also improve itself when new cases are provided due to its inherent four-step cycle: Retrieve, Reuse, Revise, and Retain. The performance of a CBR model is strongly affected by attribute weights and matching type, as will be explained in further paragraphs. Figure 6 shows the overall CBR process. The method initially requires attribute weights. After a new case is given as input, the model assesses the similarity of the case based on the old cases through a similarity matrix where similar attributes are assigned one and mismatching ones are given zero. The most similar cases are retrieved so that they can be observed. If the requirements are not fulfilled, CBR revises the solution to retrieve more relevant cases. As soon as the model finds the outcome of the given case, it is retained in the updated case base.
In this study, when the outputs were taken from GA and AHP models, two separate weight matrices were created. Initially, 150 cases were randomly selected from the dataset. Then, the similarity score of each case was calculated using Equation (5), where S is the similarity matrix, W is the weight matrix, and S_W is the total of attribute weights.
Similarity   Score   =   S   × W S _ W
For a case to be labeled as similar, the required calculated similarity score was determined to be at least 0.98. When this score was achieved, the case was added to the similarity matrix. As the data were binary, an exact match was preferred as a matching type. It was also necessary to find cases successive to similar cases so that the cost impact probability could be calculated, which is the ultimate aim of the study. The CBR model captures the most similar cases from the database and retrieves a certain number of consecutive quality failures to develop the cost impact probabilities accordingly (Figure 6). The optimum number of consecutive cases was determined as a range between 1 and 25 so that the minimum error and standard deviation were achieved. To observe the error in the CBR model, the mean absolute error (MAE) was used (Equation (6)).
MAE = 1 n t = 1 n | y i   y i |  
In this equation, yi′ is the actual cost impact and yi is the predicted one.
As a comparison between expert opinion and computerized algorithms to CBR models, the study showed that the GA algorithm outperformed AHP in terms of MAE. While the minimum MAE of GA was 7.20%, that of AHP was 7.76% when three successive cases were used. Furthermore, it was found that for the standard deviation to be the minimum, the number of successful cases should be set to 10. The results are provided in Table 10 and Figure 7. Here, emphasis was given to lowering the uncertainty. Therefore, ten successive cases were used in the model.
As shown in Table 10, although the average MAEs of the five cost impacts in the model using attribute weights obtained via GA were lower than those obtained via AHP, the standard deviations of the cost impacts in the AHP model were lower than with GA. Furthermore, while the overall MAE and standard deviation with AHP were 8.12% and 3.93%, respectively, they were 7.55% and 4.09% with GA. It was evident that the two techniques did not differ significantly (Figure 8).

4. Discussion

Several studies have focused on identifying the root causes of quality failures and the impacts of such problems on cost performance in construction projects. Although these studies could help to understand the reasons for quality issues, a new approach should be developed to mitigate the cost impact of quality failures. For this purpose, it is highly necessary to develop a predictive model to forecast the adverse cost effects of quality problems. In this study, we introduced a CBR-based predictive model by using expert (CBR-AHP) and automated weighting methods (CBR-GA). The comparison results show that even though the performances of the two models are not different significantly, CBR-GA is slightly better at predicting the cost impacts of the quality failures according to the CBR-AHP model based on the MAE scores. The result achieved in this study is also consistent with a previous study [38,45,57]. The main reason behind this finding is that a computerized system is an objective and automated system that receives output easily within high-level computations according to the expert system. AHP is a well-known expert judgment technique and heavily relies on subjective evaluations provided by participants [34]. Optimization of the predictive models is an important aspect to use such models for new datasets. New optimization methods should be introduced for diverse predictive models. Thus, it is necessary to find more precise optimization techniques to support predictive models. This study shows that an automated system used in weighting attributes for the CBR model could be more reliable to estimate the cost impacts of quality failures.
To deal with cost overruns in construction projects, quality failures should be estimated before they occur. Particularly, it has become more difficult to manage construction costs all over the world after COVID-19 and the Russia–Ukraine war. Fluctuations in material prices, increasing petroleum prices, and a lack of a highly skilled labor force stimulate poor cost performances in the construction industry. Moreover, controlling each construction parameter within the estimated time and budget is one of the most challenging factors during ongoing construction processes. It is a well-known fact that failure in one of the factors leads to failures in other construction factors. This situation is called a “domino effect” in the literature [76]. All these problems are the main reasons for the quality issues observed in construction projects and increased cost overruns. The construction industry is now behind in technological improvements and there is still a lack of digitalization in the construction companies. We believe that the introduced predictive model could help construction experts to prevent quality failures and their cost impacts effectively. Such an automated system will bring a new approach to integrating digital solutions into construction projects.
Furthermore, this study recommends an automated data collection system to record all quality failures. If quality failures are recorded in a web-based system, it is easy to manage and control quality issues by using a prediction system based on the CBR. There is still a lack of data collection and management systems to record each event that occurs in construction projects Therefore, construction process issues such as managing quality failures or other construction factors could easily be brought under control.
The major contributions of the study can be divided into three factors. Firstly, it provides insight into the importance of record-keeping in theory and the problems in reality. Quality teams often fail in keeping high-quality records, and they suffer from inexperienced staff being responsible for running efficient record-keeping mechanisms. Therefore, the factors revealed in this study can and should inform the relevant practitioners. Secondly, it was shown that the magnitude of the cost impact can be predicted following a CBR approach and the gravity of different attributes in quality problems can be obtained using AHP and GA. Finally, the study compared expert opinion and automated systems, revealing that the automation of these practices can be as valuable as expert knowledge in quality studies.
As a practical contribution, the construction experts can integrate the developed CBR model into their record-keeping system proposed in a previous study [56]. Accordingly, an automated predictive system for quality failures that have crucial cost impacts can be detected. Such systems could prevent cost overruns and improve the quality of construction work. Moreover, disputes between stakeholders due to quality issues can be significantly eliminated since AI-based approaches have the potential to reduce occupational safety issues [56]. In summary, expenditures due to quality issues such as legal, reworks, productivity, and the labor force can be effectively reduced by using such a predictive model.
The study, however, is limited as it incorporated only the recorded quality issues rather than every single case observed. However, for a more accurate and applicable model, the case database should be enlarged. The data preparation method applied in this study is a considerably long-duration operation; however, it can be shortened by employing other AI methods such as Natural Language Processing. It can ease the evaluation of NCRs and data modeling [59]. In the case that the model is used practically, it is advised that people using the model should be trained appropriately so that the aims can be fully reached. Furthermore, not implementing the developed CBR model in a construction project is another limitation of this study, and this subject can be addressed in detail in future studies. The contributing factors related to quality failures can be also considered and categorized according to construction type levels such as building, infrastructure, and industrial projects. Moreover, the final list can be improved by separating some attribute factors rather than grouping them. For instance, “Inadequate training”, “Inadequate staff”, and “Insufficient/improper workmanship” attributes can be evaluated and inserted separately into the final attribute list. Identifying the most important factors leading to quality failures and evaluating which attributes play a more crucial role in predicting non-conformities in construction could be the subject of another future study. Finally, additional techniques to AHP and GA will assess their fitness to attribute weight determination in future research. All these aspects are major recommendations for further studies to be practiced.

Contribution to Body of Knowledge

This research has major benefits for practitioners who are responsible for construction quality management. The current study will make contributions to the body of knowledge in three different directions:
  • The theoretical contribution of this study is showing that using a machine learning approach (CBR) provides opportunities to predict the cost outcome of quality failures when they occur and prevent the domino effect of one failure on another. This study also provides results about which system (automated or subjective) is better to estimate the result of quality failures by using a predictive algorithm.
  • As a practical contribution, the proposed predictive system can aid construction professionals in better managing cost overruns coming from quality failures in construction projects. If the predictive model is fed with quality failure data recorded at construction sites, it is available to forecast the cost outcome of the quality failures and severe upcoming events efficiently.
  • This research also provides directions for future studies by (i) collecting systematic quality failure data in construction sites and using such data by applying diverse Machine Learning approaches to predict the outcome of quality failures in a better way, (ii) considering the interaction effects of quality failures to achieve more precise predictive algorithms, (iii) changing the structure of attributes and contributing factors to develop new machine learning models, (iv) opening a new window to predicting cost overruns due to quality failures, and (v) using a different computerized system instead of GA and AHP to develop machine learning algorithms.

5. Conclusions

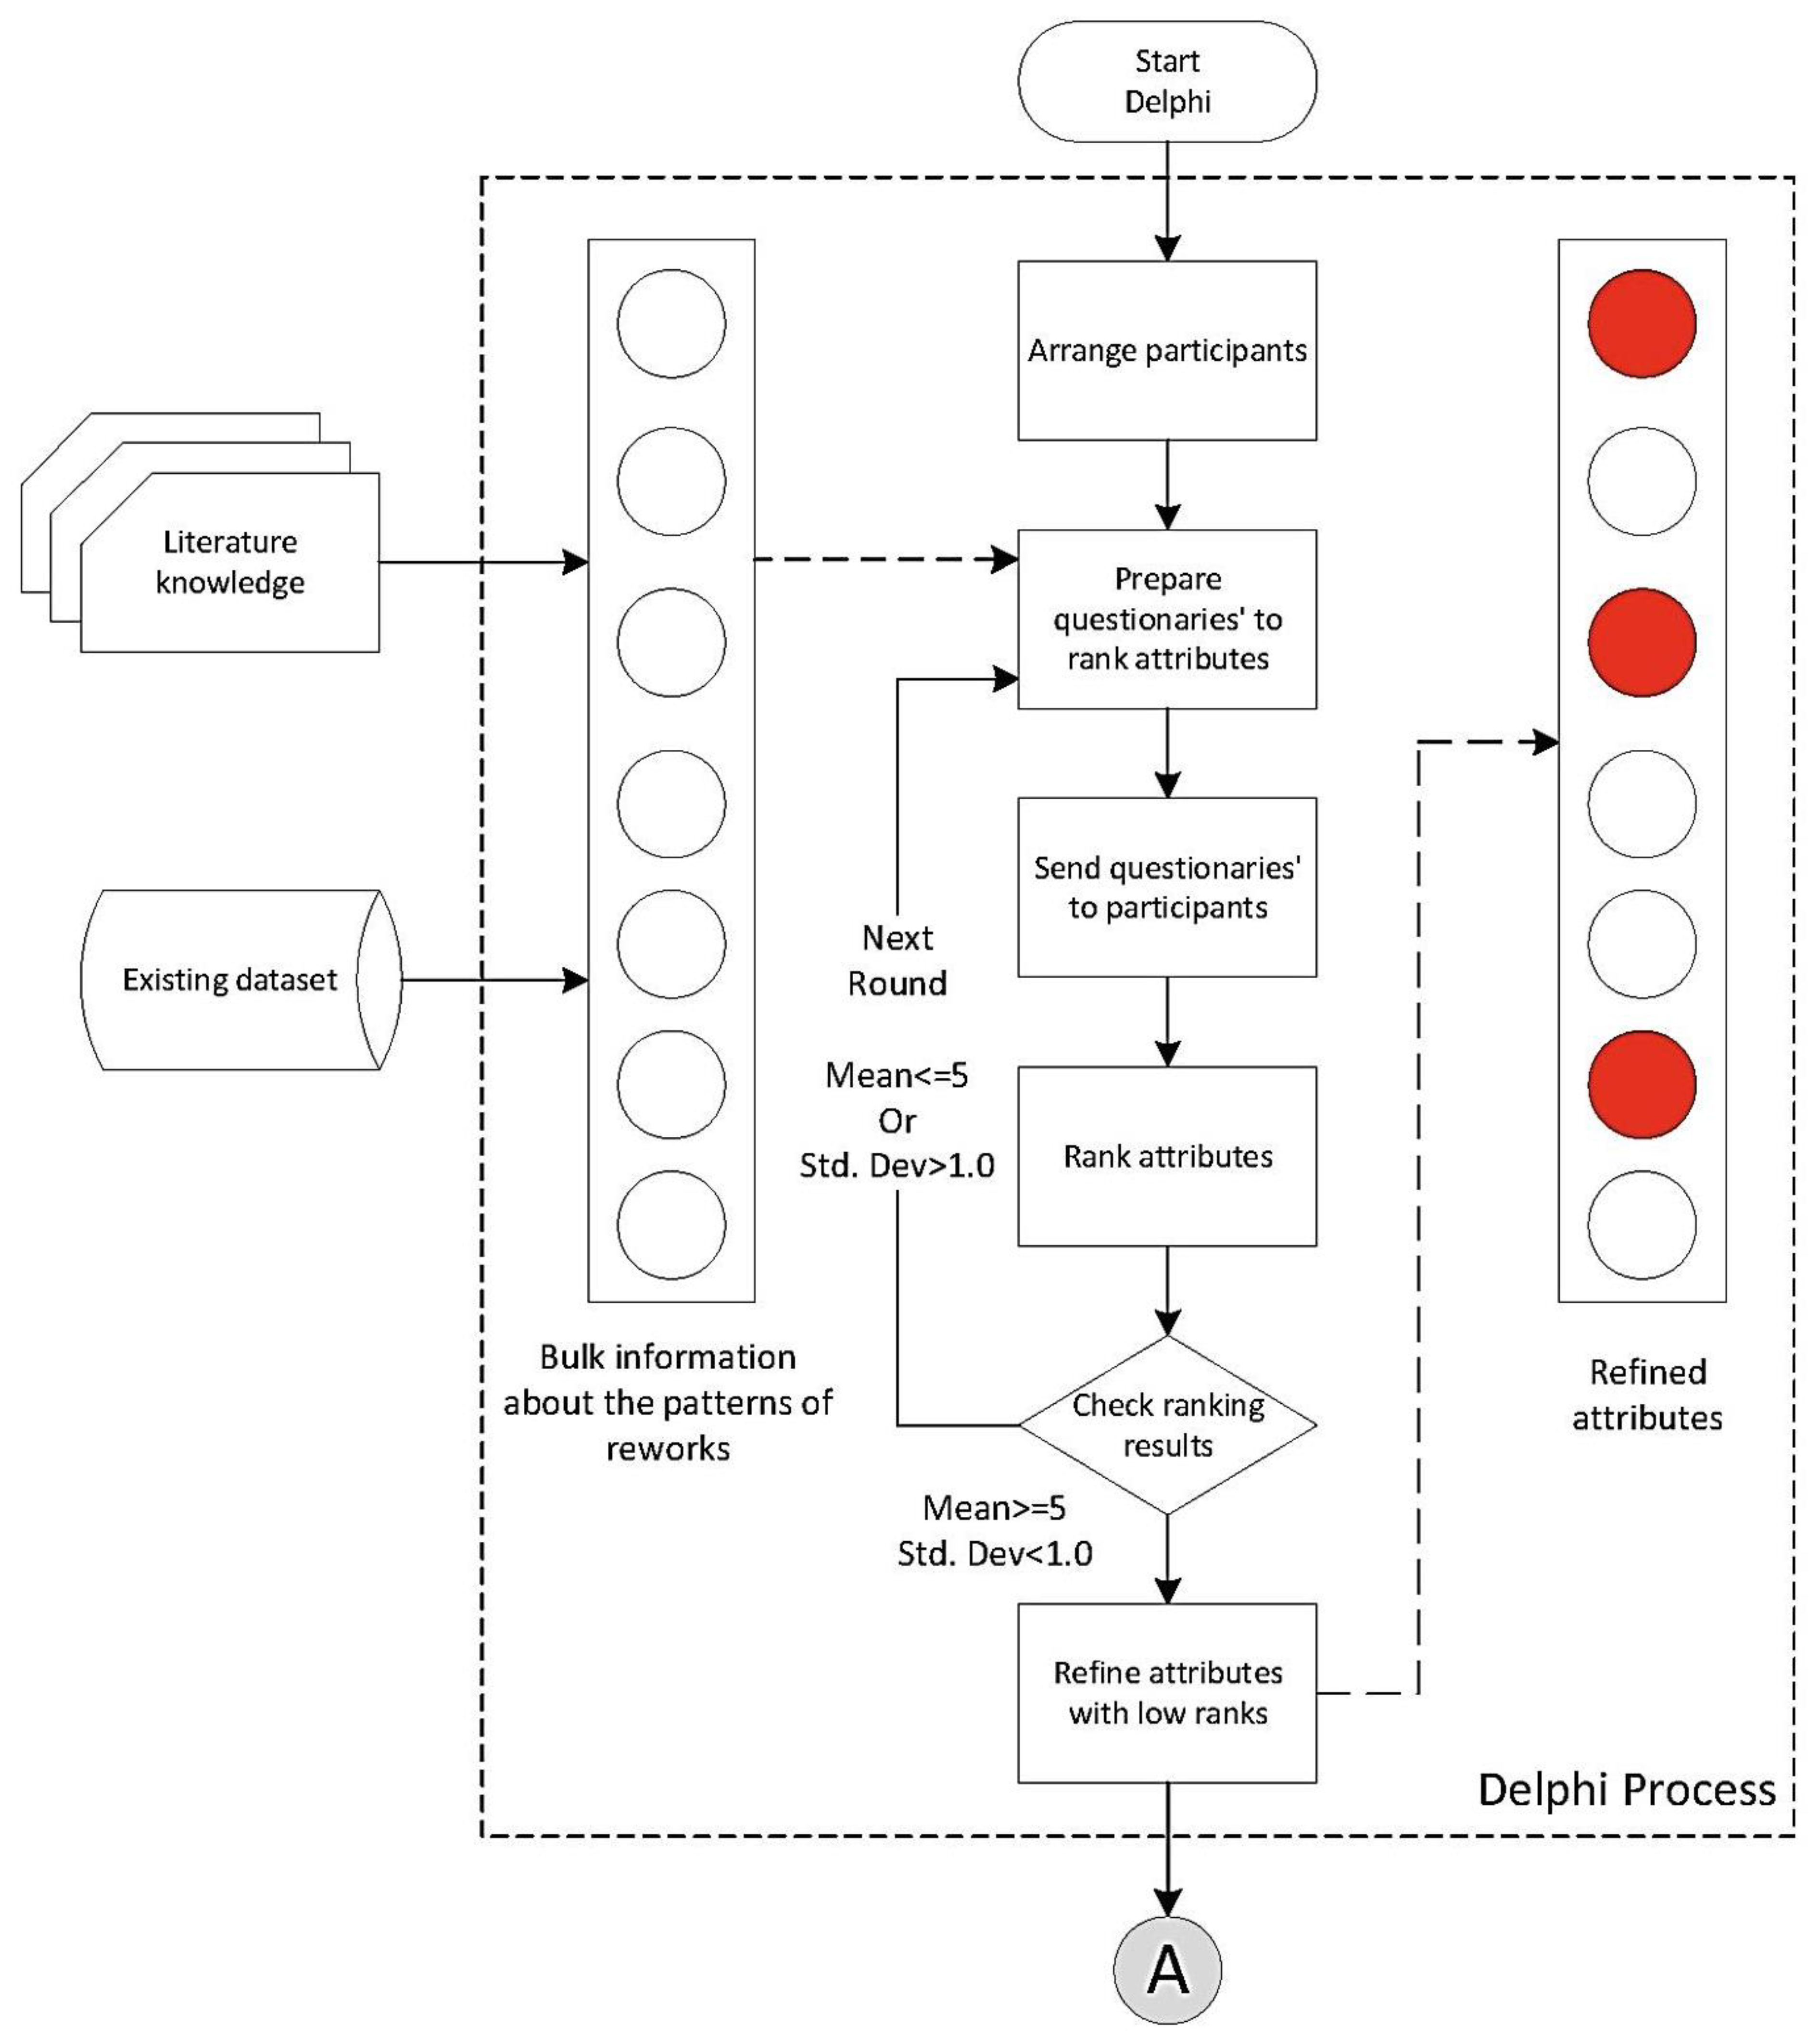
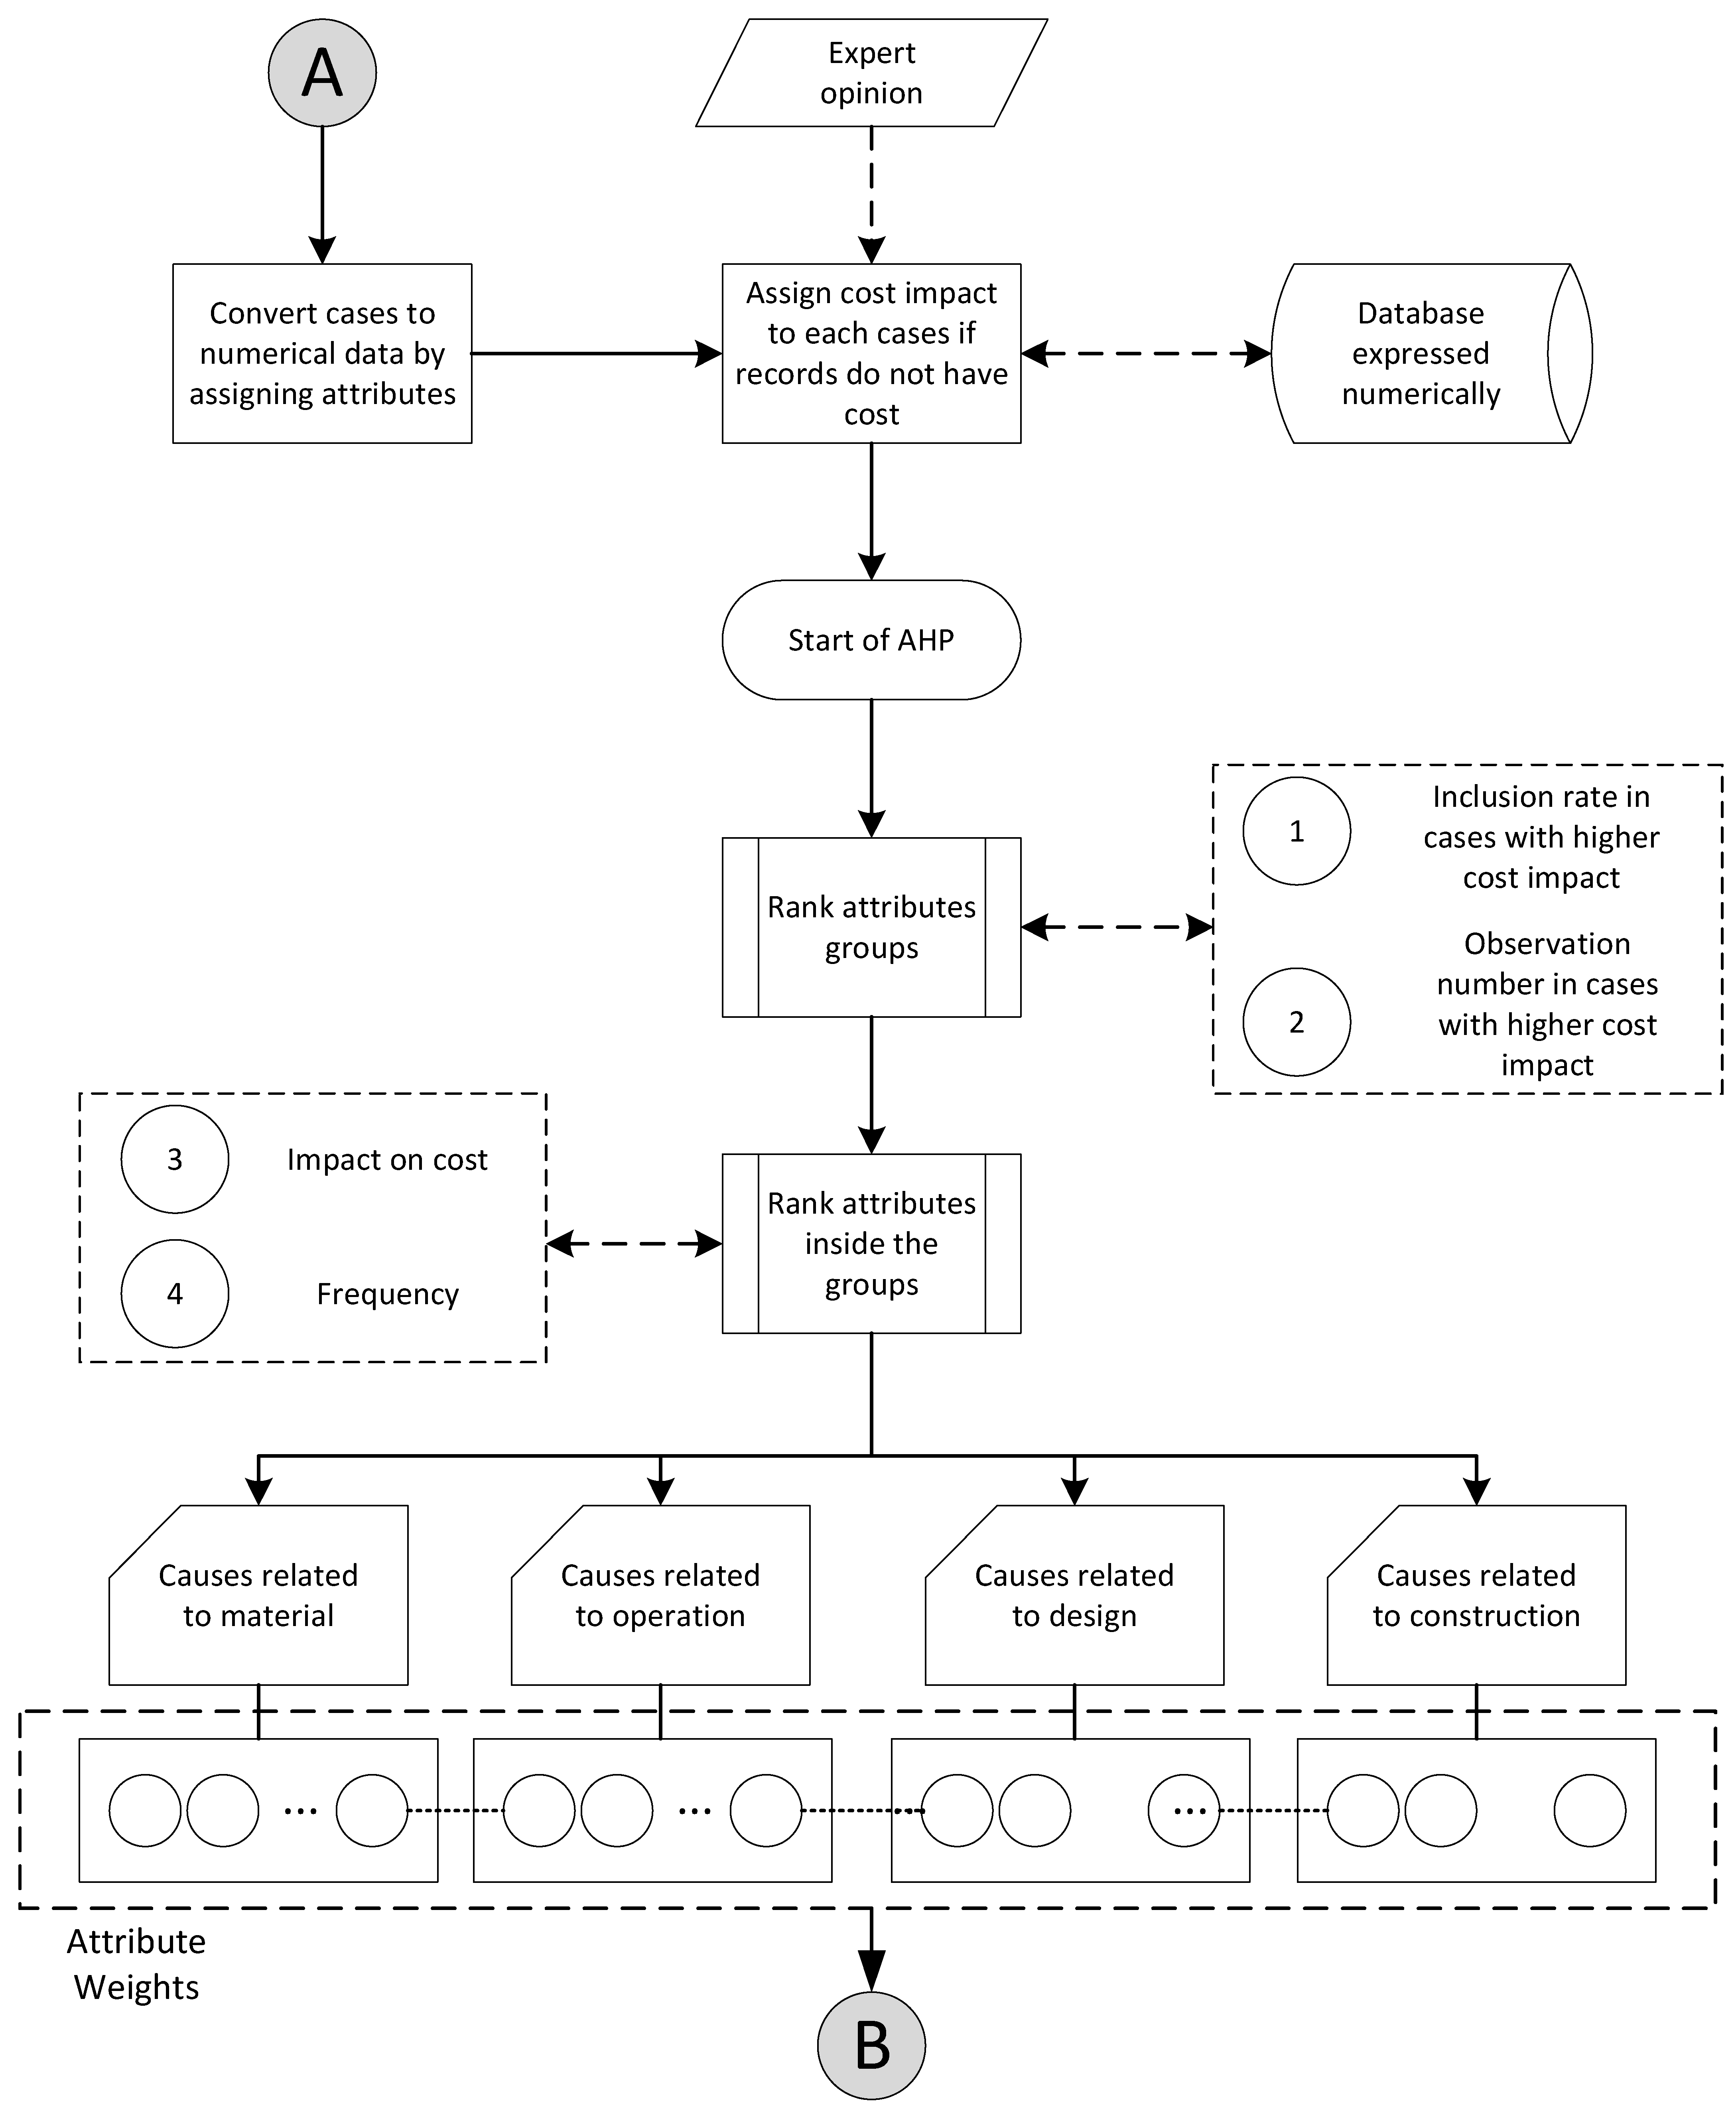
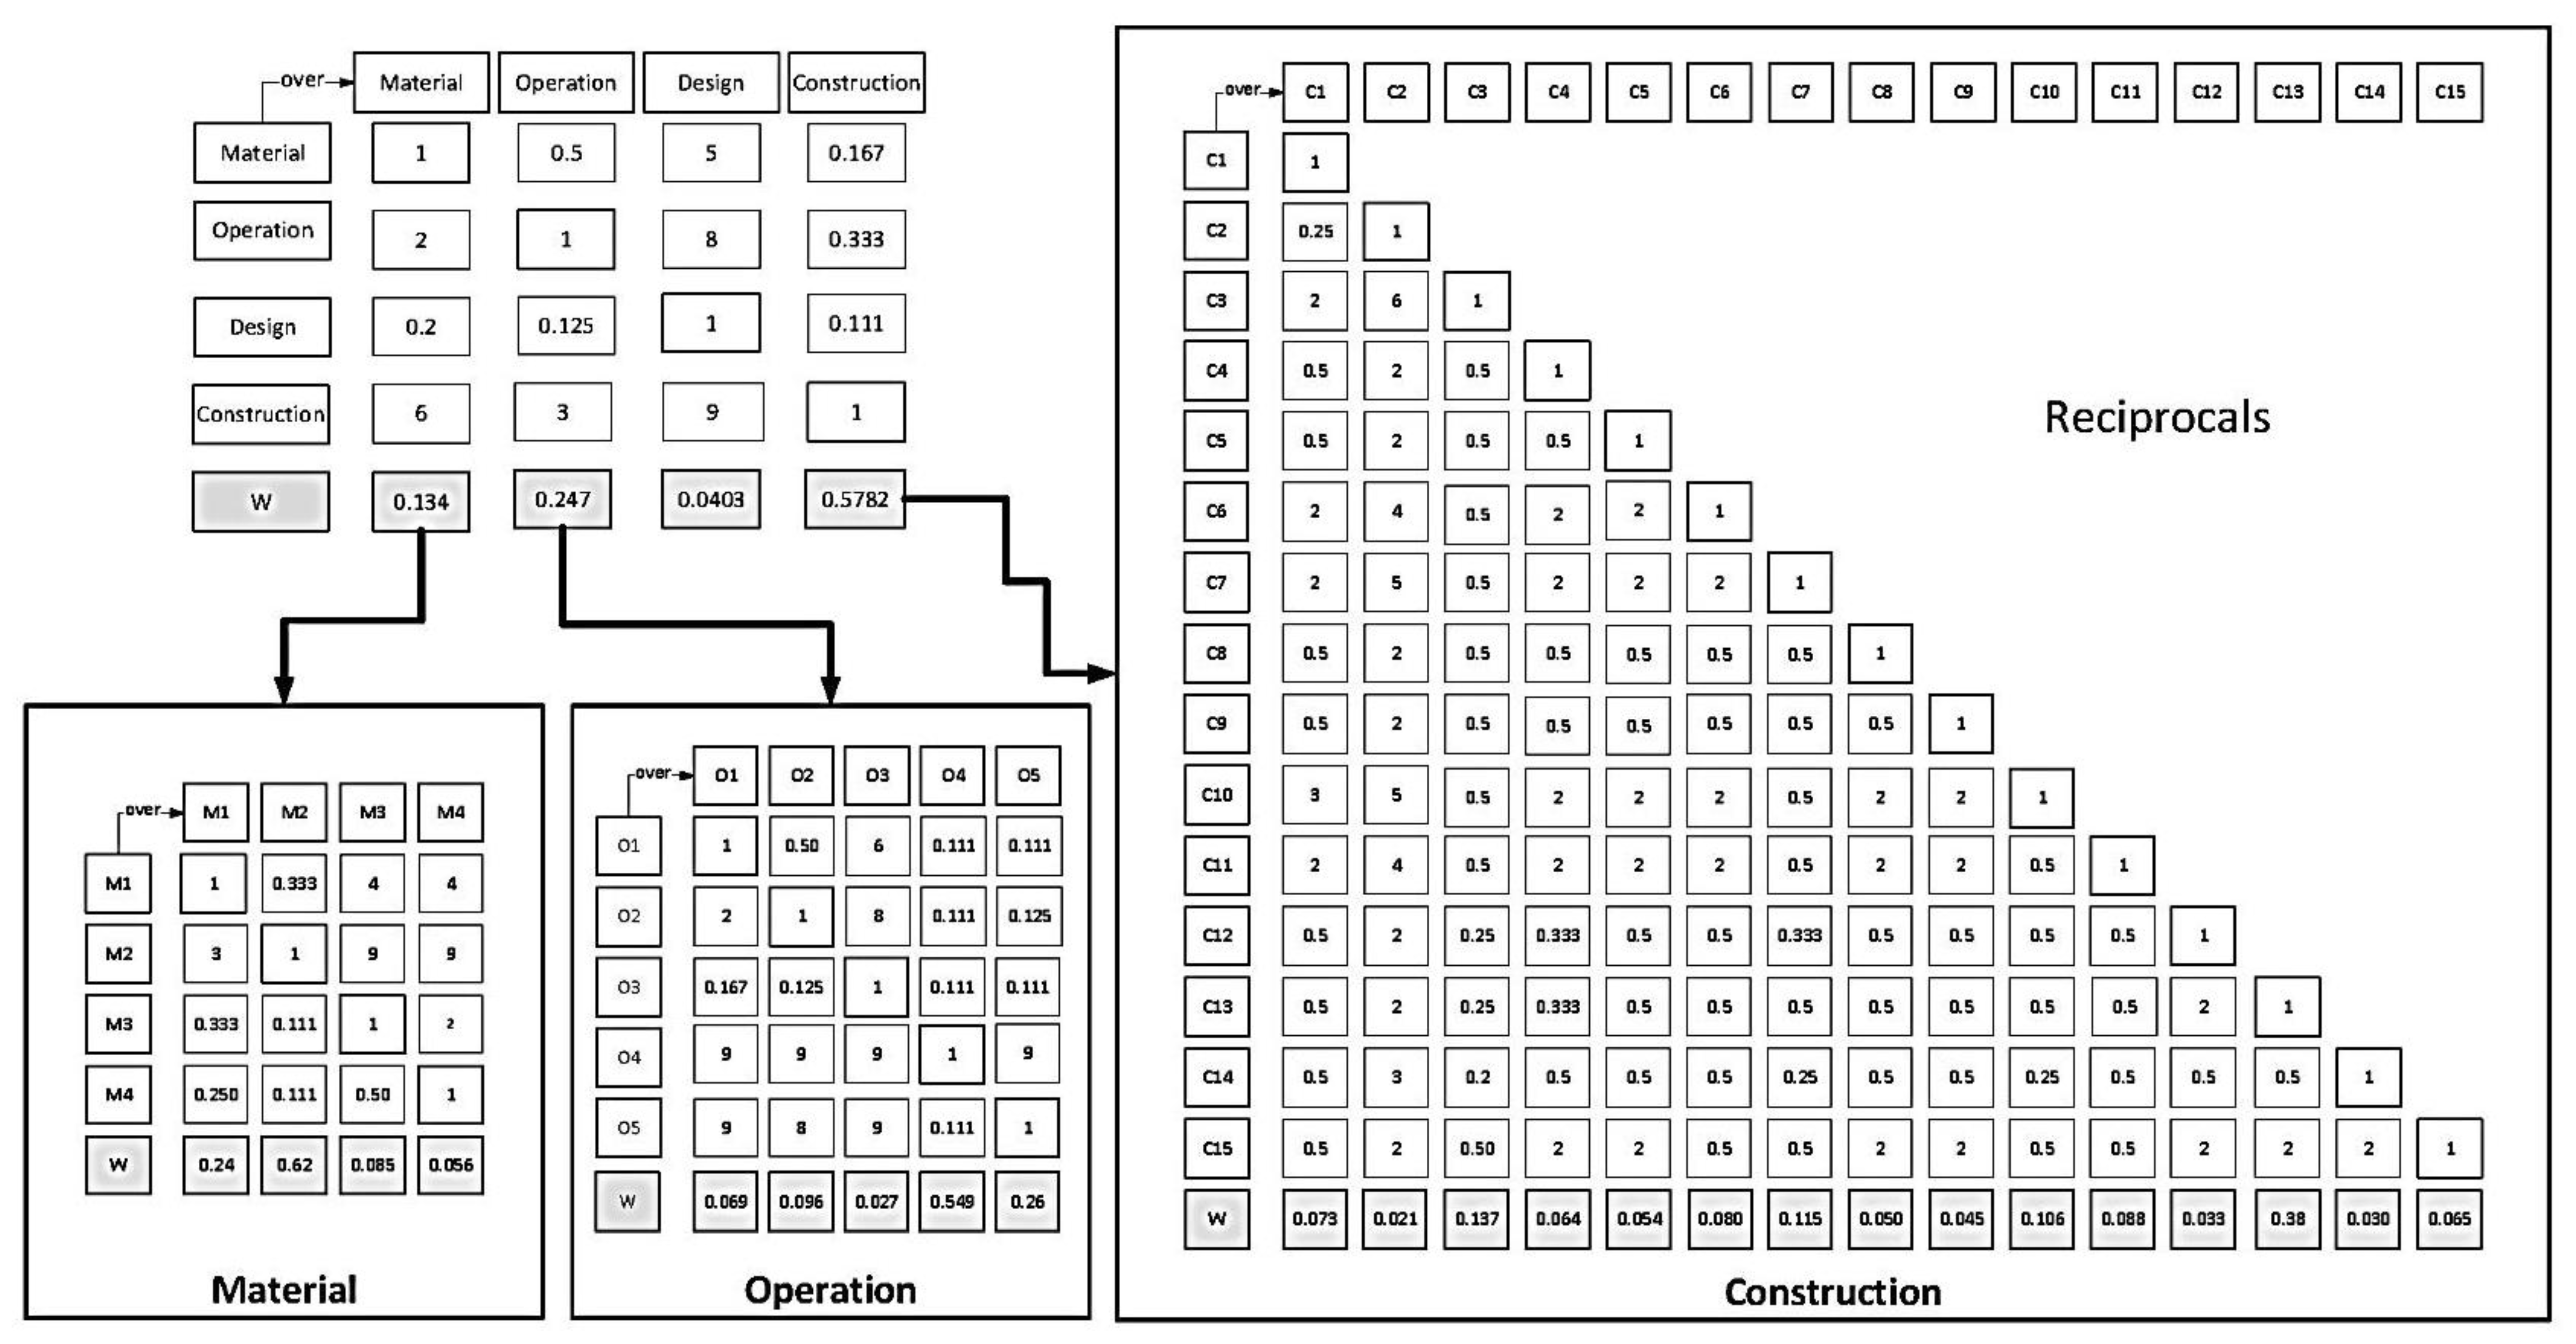
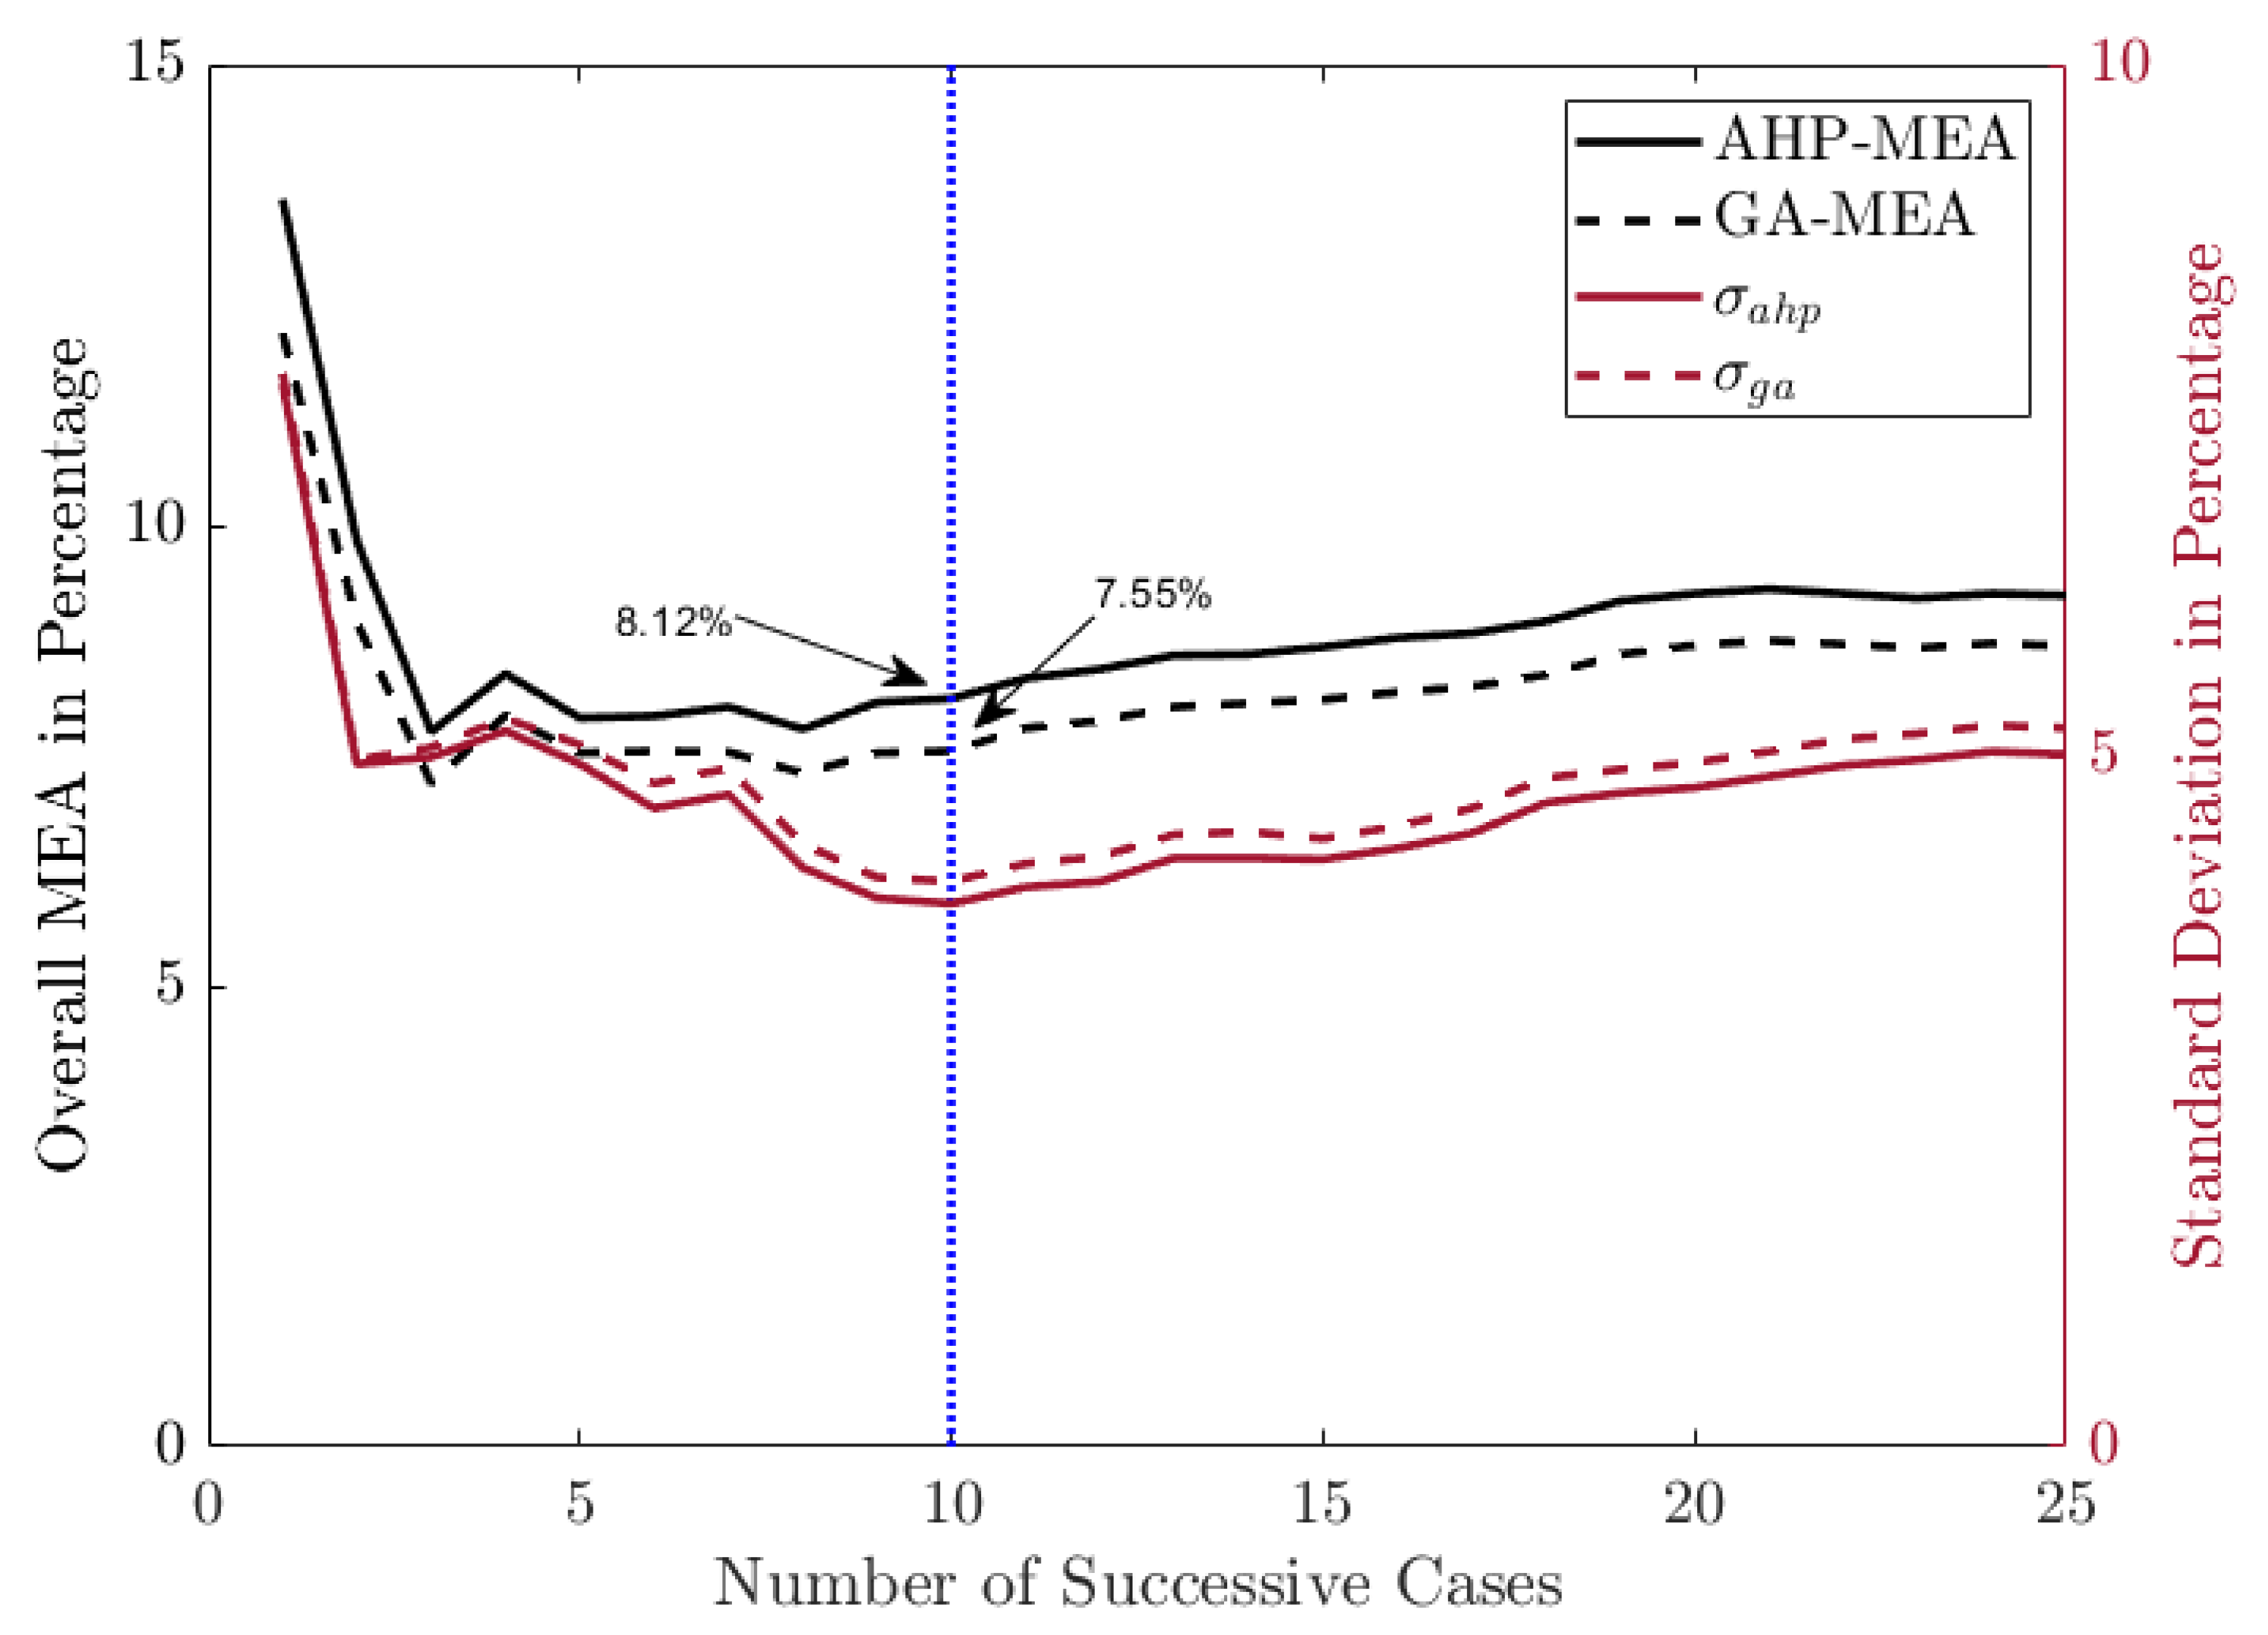
The poor quality of construction processes and products creates further problems in the project schedule and budget, in addition to harming companies’ prestige. Therefore, this study aimed to lower the occurrence rate of poor-quality work by implementing an early warning mechanism. The main objective of the developed predictive models was to provide preventive strategies for practitioners. Therefore, if there is a systematic data-recording system within the predictive algorithm, this could be used as an early warning mechanism to provide protective practices before quality failures occur. For this purpose, quality data were initially collected and subjected to the Delphi technique to define the attributes leading to poor quality. As each attribute had a different impact rate on the problem, weights were assigned to each of them, using both AHP and GA separately. In the final stage, CBR predicted possible NCR outcomes in terms of the cost impact. The findings revealed that the MAE of CBR-AHP and CBR-GA was 8.12% and 7.55%, respectively. CBR-GA is slightly better in predicting the cost impacts of quality failures according to the CBR-AHP model based on the MAE scores. As a comparison between expert opinion and computerized algorithms to CBR models, the study showed that the GA algorithm outperformed AHP in terms of MAE. While the minimum MAE of GA was 7.20%, that of AHP was 7.76% when three successive cases were used. Furthermore, it was found that for the standard deviation to reach its minimum, the number of successful cases should be set to 10. Therefore, we concluded that an automation-based prediction system is better than a subjective-based system. Moreover, this study proves that it is possible to achieve an accurate predictive model (CBR) using quality failure reports. The introduced predictive model can be used to forecast the cost outcome of quality failures observed in ongoing projects and upcoming events when the algorithm is fed essential and adequate recorded data. Accordingly, such machine learning algorithms have major potential to manage and control cost overruns and time delays coming from quality failures. We also recommend a holistic data collection system for quality failures to achieve more effective predictive algorithms.
Since the construction industry is behind in automation systems and digitization, this study will open a new door to using such a method to manage quality failures efficiently. Thus, we emphasized that a record-keeping system, which is lacking in construction projects, is highly essential to manage and control management factors in the construction industry. The results achieved in this study will encourage construction practitioners to adopt automated solutions for complex construction issues such as occupational safety, quality failures, and management processes. In conclusion, integrating automated systems such as AI-based construction management approaches will bring effective solutions to mitigate construction delays and cost overruns in the long term.

Author Contributions

Conceptualization, N.B.D. and B.U.A.; methodology, N.B.D. and B.U.A.; software, N.B.D. and B.U.A.; validation N.B.D. and B.U.A.; formal analysis, N.B.D. and B.U.A.; investigation, N.B.D., B.U.A., G.K. and M.S.; resources, O.B.T. and Y.E.A.; data curation, N.B.D. and B.U.A.; writing—review and editing, G.K., M.S. and O.B.T.; visualization, N.B.D. and B.U.A.; supervision, O.B.T.; project administration, O.B.T. and Y.E.A.; funding acquisition, Y.E.A. All authors have read and agreed to the published version of the manuscript.

Funding

This research received no external funding.

Data Availability Statement

Some or all data, models, or code that support the findings of this study are available from the corresponding author upon reasonable request.

Acknowledgments

The authors would like to thank the experts who participated in the Delphi and AHP process for their efforts and the companies that provided data anonymously for their contributions.

Conflicts of Interest

The authors declare no conflict of interest.

References

  1. Love, P.E.D. Influence of Project Type and Procurement Method on Rework Costs in Building Construction Projects. J. Constr. Eng. Manag. 2002, 128, 18–29. [Google Scholar] [CrossRef] [Green Version]
  2. Forcada, N.; Gangolells, M.; Casals, M.; Macarulla, M. Factors Affecting Rework Costs in Construction. J. Constr. Eng. Manag. 2017, 143, 04017032. [Google Scholar] [CrossRef] [Green Version]
  3. Love, P.E.D.; Teo, P.; Morrison, J. Revisiting Quality Failure Costs in Construction. J. Constr. Eng. Manag. 2017, 144, 05017020. [Google Scholar] [CrossRef]
  4. Love, P.E.D.; Smith, J.; Ackermann, F.; Irani, Z.; Teo, P. The costs of rework: Insights from construction and opportunities for learning. Prod. Plan. Control 2018, 29, 1082–1095. [Google Scholar] [CrossRef]
  5. Love, P.E.; Sing, C.-P. Determining the probability distribution of rework costs in construction and engineering projects. Struct. Infrastruct. Eng. 2013, 9, 1136–1148. [Google Scholar] [CrossRef]
  6. Garg, S.; Misra, S. Understanding the components and magnitude of the cost of quality in building construction. Eng. Constr. Arch. Manag. 2022, 29, 26–48. [Google Scholar] [CrossRef]
  7. Elbashbishy, T.S.; Hosny, O.A.; Waly, A.F.; Dorra, E.M. Assessing the Impact of Construction Risks on Cost Overruns: A Risk Path Simulation–Driven Approach. J. Manag. Eng. 2022, 38, 04022058. [Google Scholar] [CrossRef]
  8. Karim, R.A.; Latief, Y.; Zagloel, T.Y. Measuring and Benchmarking the Quality Culture Maturity of Construction Companies in Indonesia. Int. J. Eng. 2022, 35, 2027–2039. [Google Scholar] [CrossRef]
  9. Luo, H.; Ling, L.; Chen, K.; Fordjour, A.-A.M.; Chen, L. Digital technology for quality management in construction: A review and future research directions. Dev. Built Environ. 2022, 12, 100087. [Google Scholar] [CrossRef]
  10. Abu Aisheh, Y.I. Lessons Learned, Barriers, and Improvement Factors for Mega Building Construction Projects in Developing Countries: Review Study. Sustainability 2021, 13, 10678. [Google Scholar] [CrossRef]
  11. Hijazi, R.A. Factors Hindering Quality Performance in Construction Projects: An Empirical Study. J. Manag. Res. 2021, 13, 70. [Google Scholar] [CrossRef]
  12. Sheng, D.; Ding, L.; Zhong, B.; Love, P.E.; Luo, H.; Chen, J. Construction quality information management with blockchains. Autom. Constr. 2020, 120, 103373. [Google Scholar] [CrossRef]
  13. Oleah, C.; Afolabi, A.O.; Osoaku, F.; Ochiba, D. Impediments to contractors’ profitability in building projects. AIP Conf. Proc. 2022, 2437, 020141. [Google Scholar] [CrossRef]
  14. Adekunle, P.; Aigbavboa, C.; Akinradewo, O.; Oke, A.; Aghimien, D. Construction Information Management: Benefits to the Construction Industry. Sustainability 2022, 14, 11366. [Google Scholar] [CrossRef]
  15. Barber, P.; Graves, A.; Hall, M.; Sheath, D.; Tomkins, C. Quality failure costs in civil engineering projects. Int. J. Qual. Reliab. Manag. 2000, 17, 479–492. [Google Scholar] [CrossRef]
  16. Oke, A.E.; Ugoje, O.F. Assessment of rework cost of selected building projects in Nigeria. Int. J. Qual. Reliab. Manag. 2013, 30, 799–810. [Google Scholar] [CrossRef]
  17. Hwang, B.G.; Thomas, S.R.; Haas, C.T.; Caldas, C.H. Measuring the Impact of Rework on Construction Cost Performance. J. Constr. Eng. Manag. 2009, 135, 187–198. [Google Scholar] [CrossRef]
  18. Jafari, A.; Love, P.E.D. Quality Costs in Construction: Case of Qom Monorail Project in Iran. J. Constr. Eng. Manag. 2013, 139, 1244–1249. [Google Scholar] [CrossRef]
  19. Olayinka, R.; Suresh, S.; Chinyio, E. Impact of knowledge management on the cost of poor quality. Proc. Inst. Civ. Eng.–Manag. Procure. Law 2015, 168, 177–188. [Google Scholar] [CrossRef]
  20. Josephson, P.-E.; Hammarlund, Y. The causes and costs of defects in construction: A study of seven building projects. Autom. Constr. 1999, 8, 681–687. [Google Scholar] [CrossRef]
  21. Zhong, D.; Li, X.; Cui, B.; Wu, B.; Liu, Y. Technology and application of real-time compaction quality monitoring for earth-rockfill dam construction in deep narrow valley. Autom. Constr. 2018, 90, 23–38. [Google Scholar] [CrossRef]
  22. Kazemian, A.; Yuan, X.; Davtalab, O.; Khoshnevis, B. Computer vision for real-time extrusion quality monitoring and control in robotic construction. Autom. Constr. 2019, 101, 92–98. [Google Scholar] [CrossRef]
  23. Chen, F.; Jiao, H.; Han, L.; Shen, L.; Du, W.; Ye, Q.; Yu, G. Real-time monitoring of construction quality for gravel piles based on Internet of Things. Autom. Constr. 2020, 116, 103228. [Google Scholar] [CrossRef]
  24. Ayhan, B.U.; Tokdemir, O.B. Predicting the outcome of construction incidents. Saf. Sci. 2019, 113, 91–104. [Google Scholar] [CrossRef]
  25. Ayhan, B.U.; Tokdemir, O.B. Safety assessment in megaprojects using artificial intelligence. Saf. Sci. 2019, 118, 273–287. [Google Scholar] [CrossRef]
  26. Ayhan, B.U.; Tokdemir, O.B. Accident Analysis for Construction Safety Using Latent Class Clustering and Artificial Neural Networks. J. Constr. Eng. Manag. 2020, 146, 04019114. [Google Scholar] [CrossRef]
  27. Ayhan, B.U.; Doğan, N.B.; Tokdemir, O.B. An association rule mining model for the assessment of the correlations between the attributes of severe accidents. J. Civ. Eng. Manag. 2020, 26, 315–330. [Google Scholar] [CrossRef] [Green Version]
  28. Aamodt, A.; Plaza, E. Case-Based Reasoning: Foundational Issues, Methodological Variations, and System Approaches. AI Commun. 1994, 7, 39–59. [Google Scholar] [CrossRef]
  29. Arditi, D.; Tokdemir, O.B. Comparison of Case-Based Reasoning and Artificial Neural Networks. J. Comput. Civ. Eng. 1999, 13, 25. [Google Scholar] [CrossRef]
  30. Ozorhon, B.; Dikmen, I.; Birgonul, M.T. Case-Based Reasoning Model for International Market Selection. J. Constr. Eng. Manag. 2006, 132, 940–948. [Google Scholar] [CrossRef]
  31. Kim, S.-Y.; Choi, J.-W.; Kim, G.-H.; Kang, K.-I. Comparing Cost Prediction Methods for Apartment Housing Projects: CBR versus ANN. J. Asian Arch. Build. Eng. 2005, 4, 113–120. [Google Scholar] [CrossRef]
  32. Kim, G.-H.; An, S.-H.; Kang, K.-I. Comparison of construction cost estimating models based on regression analysis, neural networks, and case-based reasoning. Build. Environ. 2004, 39, 1235–1242. [Google Scholar] [CrossRef]
  33. Ahn, J.; Ji, S.-H.; Ahn, S.J.; Park, M.; Lee, H.-S.; Kwon, N.; Lee, E.-B.; Kim, Y. Performance evaluation of normalization-based CBR models for improving construction cost estimation. Autom. Constr. 2020, 119, 103329. [Google Scholar] [CrossRef]
  34. An, S.-H.; Kim, G.-H.; Kang, K.-I. A case-based reasoning cost estimating model using experience by analytic hierarchy process. Build. Environ. 2007, 42, 2573–2579. [Google Scholar] [CrossRef]
  35. Choi, S.; Kim, D.Y.; Han, S.H.; Kwak, Y.H. Conceptual Cost-Prediction Model for Public Road Planning via Rough Set Theory and Case-Based Reasoning. J. Constr. Eng. Manag. 2014, 140, 04013026. [Google Scholar] [CrossRef] [Green Version]
  36. Jin, R.; Cho, K.; Hyun, C.; Son, M. MRA-based revised CBR model for cost prediction in the early stage of construction projects. Expert Syst. Appl. 2012, 39, 5214–5222. [Google Scholar] [CrossRef]
  37. Jin, R.; Han, S.; Hyun, C.; Kim, J. Improving Accuracy of Early Stage Cost Estimation by Revising Categorical Variables in a Case-Based Reasoning Model. J. Constr. Eng. Manag. 2014, 140, 04014025. [Google Scholar] [CrossRef]
  38. Kim, K.J.; Kim, K. Preliminary Cost Estimation Model Using Case-Based Reasoning and Genetic Algorithms. J. Comput. Civ. Eng. 2010, 24, 499–505. [Google Scholar] [CrossRef]
  39. Kim, S. Interval Estimation of Construction Cost Using Case-Based Reasoning and Genetic Algorithms. J. Asian Arch. Build. Eng. 2012, 11, 327–334. [Google Scholar] [CrossRef] [Green Version]
  40. Koo, C.; Hong, T.; Hyun, C.; Koo, K. A CBR-based hybrid model for predicting a construction duration and cost based on project characteristics in multi-family housing projects. Can. J. Civ. Eng. 2010, 37, 739–752. [Google Scholar] [CrossRef]
  41. Lee, S.; Jin, Y.; Woo, S.; Shin, D.H. Approximate cost estimating model of eco-type trade for river facility construction using case-based reasoning and genetic algorithms. KSCE J. Civ. Eng. 2013, 17, 292–300. [Google Scholar] [CrossRef]
  42. Kim, B.-S.; Hong, T. Revised Case-Based Reasoning Model Development Based on Multiple Regression Analysis for Railroad Bridge Construction. J. Constr. Eng. Manag. 2012, 138, 154–162. [Google Scholar] [CrossRef]
  43. Ji, S.-H.; Park, M.; Lee, H.-S.; Ahn, J.; Kim, N.; Son, B. Military Facility Cost Estimation System Using Case-Based Reasoning in Korea. J. Comput. Civ. Eng. 2011, 25, 218–231. [Google Scholar] [CrossRef] [Green Version]
  44. Ji, C.; Hong, T.; Hyun, C. CBR Revision Model for Improving Cost Prediction Accuracy in Multifamily Housing Projects. J. Manag. Eng. 2010, 26, 229–236. [Google Scholar] [CrossRef]
  45. Hong, T.; Hyun, C.; Moon, H. CBR-based cost prediction model-II of the design phase for multi-family housing projects. Expert Syst. Appl. 2011, 38, 2797–2808. [Google Scholar] [CrossRef]
  46. Marzouk, M.; Ahmed, R.M. A case-based reasoning approach for estimating the costs of pump station projects. J. Adv. Res. 2011, 2, 289–295. [Google Scholar] [CrossRef] [Green Version]
  47. Li, H. Case-based reasoning for intelligent support of construction negotiation. Inf. Manag. 1996, 30, 231–238. [Google Scholar] [CrossRef]
  48. Tokdemir, O.B. Using Case-Based Reasoning to Predict the Outcome of Construction Litigation. Comput. Civ. Infrastruct. Eng. 1999, 14, 385–393. [Google Scholar] [CrossRef]
  49. Chen, J.-H.; Hsu, S.-C. Hybrid ANN-CBR model for disputed change orders in construction projects. Autom. Constr. 2007, 17, 56–64. [Google Scholar] [CrossRef]
  50. Cheng, M.-Y.; Tsai, H.-C.; Chiu, Y.-H. Fuzzy case-based reasoning for coping with construction disputes. Expert Syst. Appl. 2009, 36, 4106–4113. [Google Scholar] [CrossRef]
  51. Dzeng, R.-J.; Tommelein, I.D. Product modeling to support case-based construction planning and scheduling. Autom. Constr. 2004, 13, 341–360. [Google Scholar] [CrossRef]
  52. Dzeng, R.-J.; Tommelein, I.D. Boiler Erection Scheduling Using Product Models and Case-Based Reasoning. J. Constr. Eng. Manag. 1997, 123, 338–347. [Google Scholar] [CrossRef]
  53. Ryu, H.-G.; Lee, H.-S.; Park, M. Construction Planning Method Using Case-Based Reasoning (CONPLA-CBR). J. Comput. Civ. Eng. 2007, 21, 410–422. [Google Scholar] [CrossRef]
  54. Fan, Z.-P.; Li, Y.-H.; Zhang, Y. Generating project risk response strategies based on CBR: A case study. Expert Syst. Appl. 2015, 42, 2870–2883. [Google Scholar] [CrossRef]
  55. Forbes, D.; Smith, S.D.; Horner, M. A case-based reasoning approach for selecting risk management techniques. In Proceedings of the Association of Researchers in Construction Management, ARCOM 2007–Proceedings of the 23rd Annual Conference, Belfast, UK, 3–5 September 2007; pp. 735–744. Available online: https://www.semanticscholar.org/paper/A-case-based-reasoning-approach-for-selecting-risk-Forbes-Smith/0910a86cbf080eef6b78e1a584b333191e9ef416 (accessed on 10 January 2022).
  56. Goh, Y.M.; Chua, D.K.H. Case-Based Reasoning for Construction Hazard Identification: Case Representation and Retrieval. J. Constr. Eng. Manag. 2009, 135, 1181–1189. [Google Scholar] [CrossRef]
  57. Doğan, S.Z.; Arditi, D.; Günaydın, H.M. Determining Attribute Weights in a CBR Model for Early Cost Prediction of Structural Systems. J. Constr. Eng. Manag. 2006, 132, 1092–1098. [Google Scholar] [CrossRef] [Green Version]
  58. Doğan, S.Z.; Arditi, D.; Günaydin, H.M. Using Decision Trees for Determining Attribute Weights in a Case-Based Model of Early Cost Prediction. J. Constr. Eng. Manag. 2008, 134, 146–152. [Google Scholar] [CrossRef] [Green Version]
  59. Doğan, N.B. Predicting the Cost Impacts of Construction Non-Conformities Using CBR-AHP and CBR-GA Models. Master’s Thesis, Middle East Technical University, Ankara, Turkey, 2021. [Google Scholar]
  60. Abdul-Rahman, H. Capturing the Cost of Quality Failures in Civil Engineering. Int. J. Qual. Reliab. Manag. 1993, 10, 20–32. [Google Scholar] [CrossRef]
  61. Love, P.; Li, H. Quantifying the causes and costs of rework in construction. Constr. Manag. Econ. 2000, 18, 479–490. [Google Scholar] [CrossRef]
  62. Love, P.E.D.; Li, H. Overcoming the problems associated with quality certification. Constr. Manag. Econ. 2000, 18, 139–149. [Google Scholar] [CrossRef]
  63. Love, P.E.D.; Edwards, D.J. Forensic project management: The underlying causes of rework in construction projects. Civ. Eng. Environ. Syst. 2004, 21, 207–228. [Google Scholar] [CrossRef]
  64. Yap, J.B.H.; Low, P.L.; Wang, C. Rework in Malaysian building construction: Impacts, causes and potential solutions. J. Eng. Des. Technol. 2017, 15, 591–618. [Google Scholar] [CrossRef]
  65. Balouchi, M.; Gholhaki, M.; Niousha, A. Reworks causes and related costs in construction: Case of Parand mass housing project in Iran. Int. J. Qual. Reliab. Manag. 2019, 36, 1392–1408. [Google Scholar] [CrossRef]
  66. Trach, R.; Pawluk, K.; Lendo-Siwicka, M. Causes of Rework in Construction Projects in Ukraine. Arch. Civ. Eng. 2019, 65, 61–74. [Google Scholar] [CrossRef] [Green Version]
  67. Hallowell, M.R.; Gambatese, J.A. Qualitative Research: Application of the Delphi Method to CEM Research. J. Constr. Eng. Manag. 2010, 136, 99–107. [Google Scholar] [CrossRef]
  68. Kuzucuoglu, D.; Ayhan, B.U.; Tokdemir, O.B. Integrating Lean Construction into the Civil Engineering Curriculum. Int. J. Eng. Educ. 2019, 35, 1787–1802. [Google Scholar]
  69. Seyis, S.; Ergen, E. A decision making support tool for selecting green building certification credits based on project delivery attributes. Build. Environ. 2017, 126, 107–118. [Google Scholar] [CrossRef]
  70. Badri, A.; Nadeau, S.; Gbodossou, A. Proposal of a risk-factor-based analytical approach for integrating occupational health and safety into project risk evaluation. Accid. Anal. Prev. 2012, 48, 223–234. [Google Scholar] [CrossRef]
  71. Saaty, T.L. Decision making with the analytic hierarchy process. Int. J. Serv. Sci. 2008, 1, 83. [Google Scholar] [CrossRef] [Green Version]
  72. Aminbakhsh, S.; Gunduz, M.; Sonmez, R. Safety risk assessment using analytic hierarchy process (AHP) during planning and budgeting of construction projects. J. Saf. Res. 2013, 46, 99–105. [Google Scholar] [CrossRef]
  73. Saaty, T.L. How to make a decision: The analytic hierarchy process. Eur. J. Oper. Res. 1990, 48, 9–26. [Google Scholar] [CrossRef]
  74. Alonso, J.A.; Lamata, M.T. Consistency in the Analytic Hierarchy Process. A new approach. Int. J. Uncertain. Fuzziness Knowlege-Based Syst. 2006, 14, 445–459. [Google Scholar] [CrossRef] [Green Version]
  75. Evolver 8.1: Sophisticated Optimization for Excel. Palisade. 2020. Available online: https://www.palisade.com/evolver/ (accessed on 10 January 2021).
  76. Wang, L.; Du, W.; Chu, S.; Shi, M.; Li, J. Intelligent science and technology assists safety culture construction. In Proceedings of the 2021 International Conference on Advanced Enterprise Information System, AEIS 2021, St. Petersburg, Russia, 18–20 June 2021; pp. 40–43. [Google Scholar] [CrossRef]
Figure 1. Research Methodology Flow.
Buildings 12 01946 g001
Figure 2. The summary of the Delphi Process [59].
Buildings 12 01946 g002
Figure 3. Weight calculation by AHP [59].
Buildings 12 01946 g003
Figure 4. Pairwise comparison of rework attributes [59].
Buildings 12 01946 g004
Figure 5. RMSE vs. iteration number [59].
Buildings 12 01946 g005
Figure 6. Steps followed in CBR [59].
Buildings 12 01946 g006
Figure 7. Overall MAE vs. Number of Successive Cases [59].
Buildings 12 01946 g007
Figure 8. Comparison of MAE values of AHP and GA models [59].
Buildings 12 01946 g008
Table 1. Bulk information for rework attributes [59].
IDRework AttributesStudy
a1Poor ground condition[60]
a2Difficulty in building
a3Design/Information problems
a4Materials
b1Construction-related problems[20]
b2Design problems
b3Poor site management
b4Poor workmanship
b5Subcontractors’ problems
c1Change on design/construction phases[1,61,62]
c2Error on design/construction phases
c3Omission on design/construction phases
c7Damage on construction
c8Value management
c9Ineffective use of IT by a design team
c10Design Scope freezing
c11Client change
c12Poor morale
c13Conflict
c14Delusion of Supervision
c15Contractual claims
c16Cost overruns
c17Time overruns
c18Cost/schedule growth
c19Safety
d1Design changes[63]
d2Construction changes
d3Client
d4Design team
d5Site management
d6Subcontractor
d7Project scope
d8Contract documentation
d9Project communication
d10Procurement strategy
d11Design management
e1 Poor site condition[64]
e2Insufficient time for design stage
e3Poor coordination between client and design team
e4Client-related factor
e5Poor site supervision and inspection
e6Improper construction technology
e7Improper handling of material and delivery
e8Improper handling of machines and equipment
e9Poor contract documentation
e10Poor client and end-user coordination
e11Poor sub-contractor management
e12Poor site management
e13Construction error due to misunderstanding of design
e14Poor coordination among design team
e15Unclear project management process
e16Poor quality management by design team
e17Poor quality management by contractor
f1Improper handling, delivery, or providing proper materials[65]
f2Unclear project management process
f3Poor sub-contractor management
f4Poor design constructability
f5Poor site supervision and inspection
f6Need to combine hard and delicate operations
f7Failure to define standard executive procedures
g1Lack of coordination and poor communication[66]
g2Design change initiated by owner
g3Lack of experience and knowledge of design and construction process
g4Lack of funding allocated for site investigations
g5Lack of client involvement in project
g6Insufficient time and money spent on briefing process
g7Expenditure on low fees to prepare contract documentation
g8Incomplete design at the time of tender
g9Poor coordination of design
g10Design change initiated due to financial and economic changes
g11Omissions of items from contract documentation
g12Errors made in contract documentation
g13Insufficient time to prepare contract documentation
g14Inadequate client brief to prepare detailed contract documentation
g15Insufficient skill levels to complete required task
g16Ineffective use of information technologies
Table 2. Criteria for panelists [59].
RequirementEducational Degree
Ed1B.Sc. department:
- (Ed1-1) Mechanical Engineering
- (Ed1-2) Civil Engineering
- (Ed1-3) Architecture
Ed2At least one of these certificates: - (Ed2-1) Auditor Certificate - (Ed2-2) Lead Auditor Certificate
Ed3Graduate-level background in construction or quality management
Experience level
Ex1At least ten years of experience in the construction industry
Ex2At least five years of experience in quality control and management
Table 3. Details of panelists [59].
TitleAcademic TitleExperienceCertificate
Academic Staff/Civil EngineerProf.20–25-
Mech. Eng./Quality Cont. Man. M.Sc.20–25(Ed2-1,2)
Mech. Eng./Quality Cont. Man.B.Sc.15–20(Ed2-1,2)
Architect/Quality Cont. Man.B.Sc.10–15(Ed2-1,2)
Academic Staff/ArchitectAssoc. Prof.10–15-
Civil Eng./Project ManagerB.Sc.25–30-
Architect/Project ManagerB.Sc. 20–25-
Architect/Quality Cont. Sup.M.Sc.15–20(Ed2-1)
Civil Eng./Quality Cont. Sup.Ph.D.15–20(Ed2-1,2)
Architect/Site Eng.B.Sc.10–15(Ed2-1)
Table 4. List of final rework attributes used in the study [59].
GroupAttributesID
MaterialsImproper handling of material and deliveryM1
Incorrect or defective material usageM2
Procurement of incorrect materialM3
Damaging material during transportation/loading M4
DesignDesign problem/changes on constructionD1
ConstructionDamaging the completed workC1
Work in confined spaceC2
Construction errors due to misunderstanding of designC3
Inadequate preparation before starting the work C4
Inadequate site cleaning after completing the work C5
Incompliance with technical specificationC6
Insufficient/improper workmanship C7
Lack of documents on siteC8
Inadequate tools/equipmentC9
Inadequate application procedureC10
Insufficient review of drawings C11
Lack of drawings on siteC12
Delays in construction timelineC13
Insufficient number of site supervisorsC14
Not following work sequenceC15
OperationProblems with purchasing departmentO1
Problems with warehouse (labeling, etc.)O2
Sending wrong material from warehouseO3
Lack of supervision O4
Problems with documentation O5
Table 5. AHP Scale [59].
Scale DefinitionReciprocals
1Equal importance of two elements1
3Low importance of one element over another1/3
5Strong importance of one element over another1/5
7Very strong importance of one element over another1/7
9Absolute importance of one element over another1/9
2,4,6,8Intermediate values1/2, 1/4, 1/6, 1/8
Table 6. RI values proposed by Alonso and Lamata [59,74].
Element Size123456789101112131415
RI000.520.881.111.251.341.411.451.491.511.541.551.571.58
Table 7. Details of rework attributes before AHP [59].
Attributes ID Number
Attribute GroupsCost Impact (ci)123456789101112131415
Causes related to inventory10.5160.5710.5650.395
Group name: M20.3200.2980.3910.395
30.1180.0900.0220.158
40.0390.0360.0220.053
50.0070.0060.0000.000
fwi 1.6991.6071.5001.868
fwi-norm 0.2550.2410.2250.280
fi 0.1980.6930.0600.049
Causes related to procurement10.7140.2500.0000.6030.711
Group name: O20.2140.5000.0000.2680.111
30.0710.1671.0000.0870.141
40.0000.0830.0000.0360.037
50.0000.0000.0000.0050.000
fwi 1.3572.0833.0001.5711.504
fwi-norm 0.1430.2190.3150.1650.158
fi 0.0100.0090.0010.8800.100
Causes related to construction10.5290.0000.6370.6490.6230.5900.6170.7670.5000.6700.5820.6150.2500.1820.563
Group name: C20.3030.6670.2540.2860.2640.2680.2770.1670.2250.2470.2860.2690.4500.5450.291
30.1080.0000.0660.0390.0570.0880.0720.0670.2250.0490.0840.0770.2000.2730.107
40.0440.3330.0360.0130.0570.0440.0280.0000.0250.0260.0410.0380.1000.0000.029
50.0170.0000.0080.0130.0000.0100.0070.0000.0250.0080.0070.0000.0000.0000.010
fwi 1.7172.6671.5241.4551.5471.6151.5311.3001.8501.4551.6051.5382.1502.0911.631
fwi-norm 0.0670.1040.0590.0570.0600.0630.0600.0510.0720.0570.0620.0600.0840.0810.064
fi 0.0560.0010.3210.0140.0100.0770.2000.0110.0070.1920.0820.0050.0040.0020.019
Table 8. Attribute weights after AHP [59].
Attribute ID Number
Attribute GroupsGroup IDGroup WeightsCR for Groups123456789101112131415CR’
Causes related to inventoryM0.1340.0910.2400.6200.0850.056-----------0.078
Causes related to procurementO0.2470.0690.0960.0270.5490.260----------0.018
Causes related to designD0.0400.040--------------0.000
Causes related to constructionC0.5780.0730.0210.1370.0640.0540.0800.1150.0500.0450.1060.0880.0330.0380.0300.0650.050
Table 9. Attribute weights after GA [59].
Attribute ID Number
Attribute GroupsGroup ID123456789101112131415
Causes related to inventoryM0.9580.0130.7160.883-----------
Causes related to procurementO0.2260.9660.7620.5510.894----------
Causes related to designD0.852--------------
Causes related to constructionC0.5920.7810.9750.3010.1700.0010.0720.5720.6010.0190.5420.6120.8800.9880.519
Table 10. Overall MAE and standard deviations of successive cases [59].
No. Successive CasesAHPGA
Overall MAEStandard DeviationOverall MAEStandard Deviation
113.54%7.69%12.09%7.77%
29.83%4.94%8.95%4.97%
37.76%4.99%7.20%5.06%
48.39%5.18%7.94%5.27%
57.91%4.94%7.53%5.08%
67.93%4.62%7.55%4.80%
78.03%4.72%7.54%4.91%
87.79%4.19%7.31%4.36%
98.08%3.97%7.53%4.12%
108.12%3.93%7.55%4.09%
118.34%4.05%7.80%4.22%
128.44%4.09%7.88%4.27%
138.59%4.26%8.03%4.43%
148.60%4.26%8.07%4.45%
158.68%4.25%8.11%4.40%
168.78%4.33%8.19%4.49%
178.83%4.44%8.25%4.62%
188.96%4.66%8.38%4.84%
199.18%4.73%8.60%4.90%
209.26%4.77%8.70%4.95%
219.31%4.85%8.75%5.03%
229.26%4.93%8.71%5.12%
239.21%4.97%8.67%5.16%
249.26%5.03%8.72%5.22%
259.24%5.01%8.69%5.20%
Publisher’s Note: MDPI stays neutral with regard to jurisdictional claims in published maps and institutional affiliations.

