
Predicting Crack Width in CFRP-Strengthened RC One-Way Slabs Using Hybrid Grey Wolf Optimizer Neural Network Model

 ,
,  ,
,  ,
,  and
and
Abstract
:1. Introduction
- Volumetric change due to plastic, autogenous, and drying shrinkage, creep under sustained load, thermal stresses at elevated temperatures, and chemical incompatibility of concrete components.
- Direct stresses caused by applied loads or reactions, or internal stresses caused by continuity, reversible fatigue load, long-term deflection, camber in pre-stressed systems, and environmental effects, including differential movement in structural systems.
- Flexural stress caused by bending.
2. Crack Width Calculation for Concrete Flat Slabs
- Calculation of Crack Widths (Clause 4.4.2.4)—formulae are provided for crack width calculations which apply to both beams and slabs for a range of design situations and are applicable irrespective of the overall depth of the element;
- Control of Cracking without Direct Calculation (Clause 4.4.2.3)—a simplified design method is allowed, the rules for which have been derived using the crack width formulae. Minimum reinforcement areas are determined, and limits are placed on bar diameter and bar spacing. Alternatively, for slabs with an overall depth, Ds, not exceeding 200 mm subjected to bending without significant axial tension (i.e., in a state of flexure), cracking is assumed to be satisfactory if the detailing rules in Clause 5.4.3 of Eurocode 2 are satisfied.
3. Material and Methods
3.1. Materials
3.1.1. Cement
3.1.2. Water
3.1.3. Fine and Coarse Aggregates
3.1.4. Carbon Fiber-Reinforced Polymer
3.1.5. Adhesive
3.2. Concrete Mixture Design and Preparation
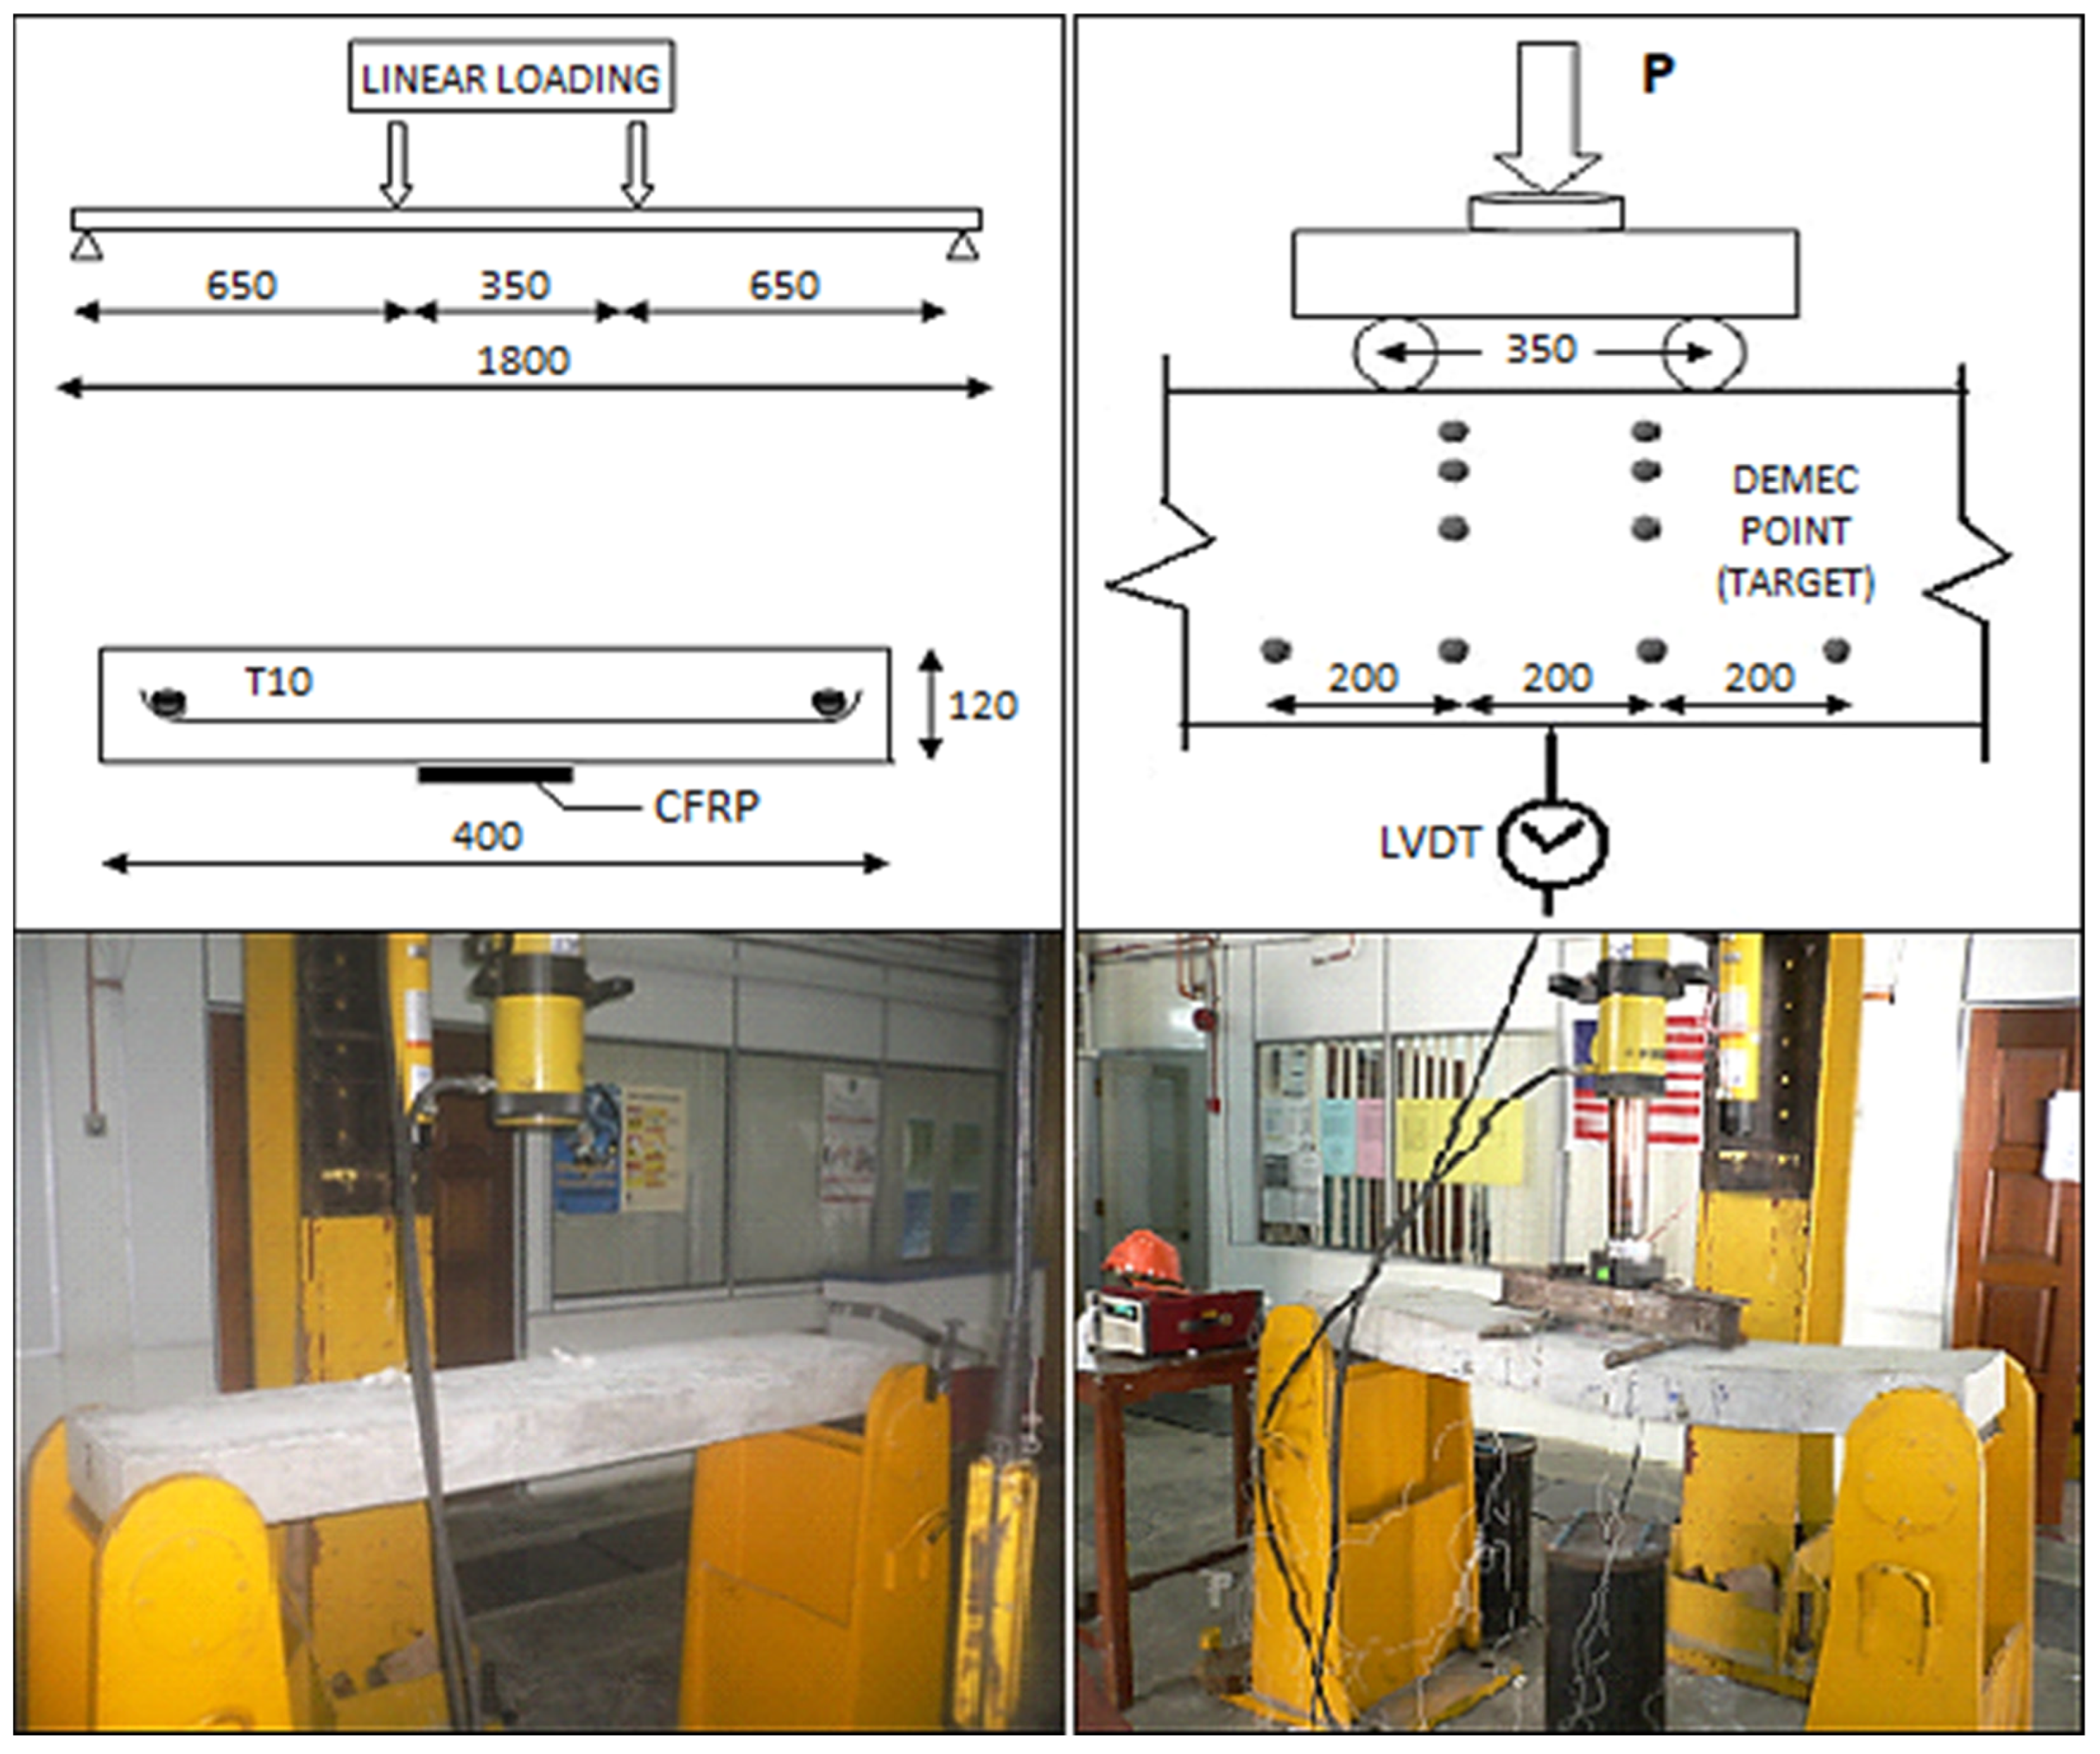
3.3. Test Rig
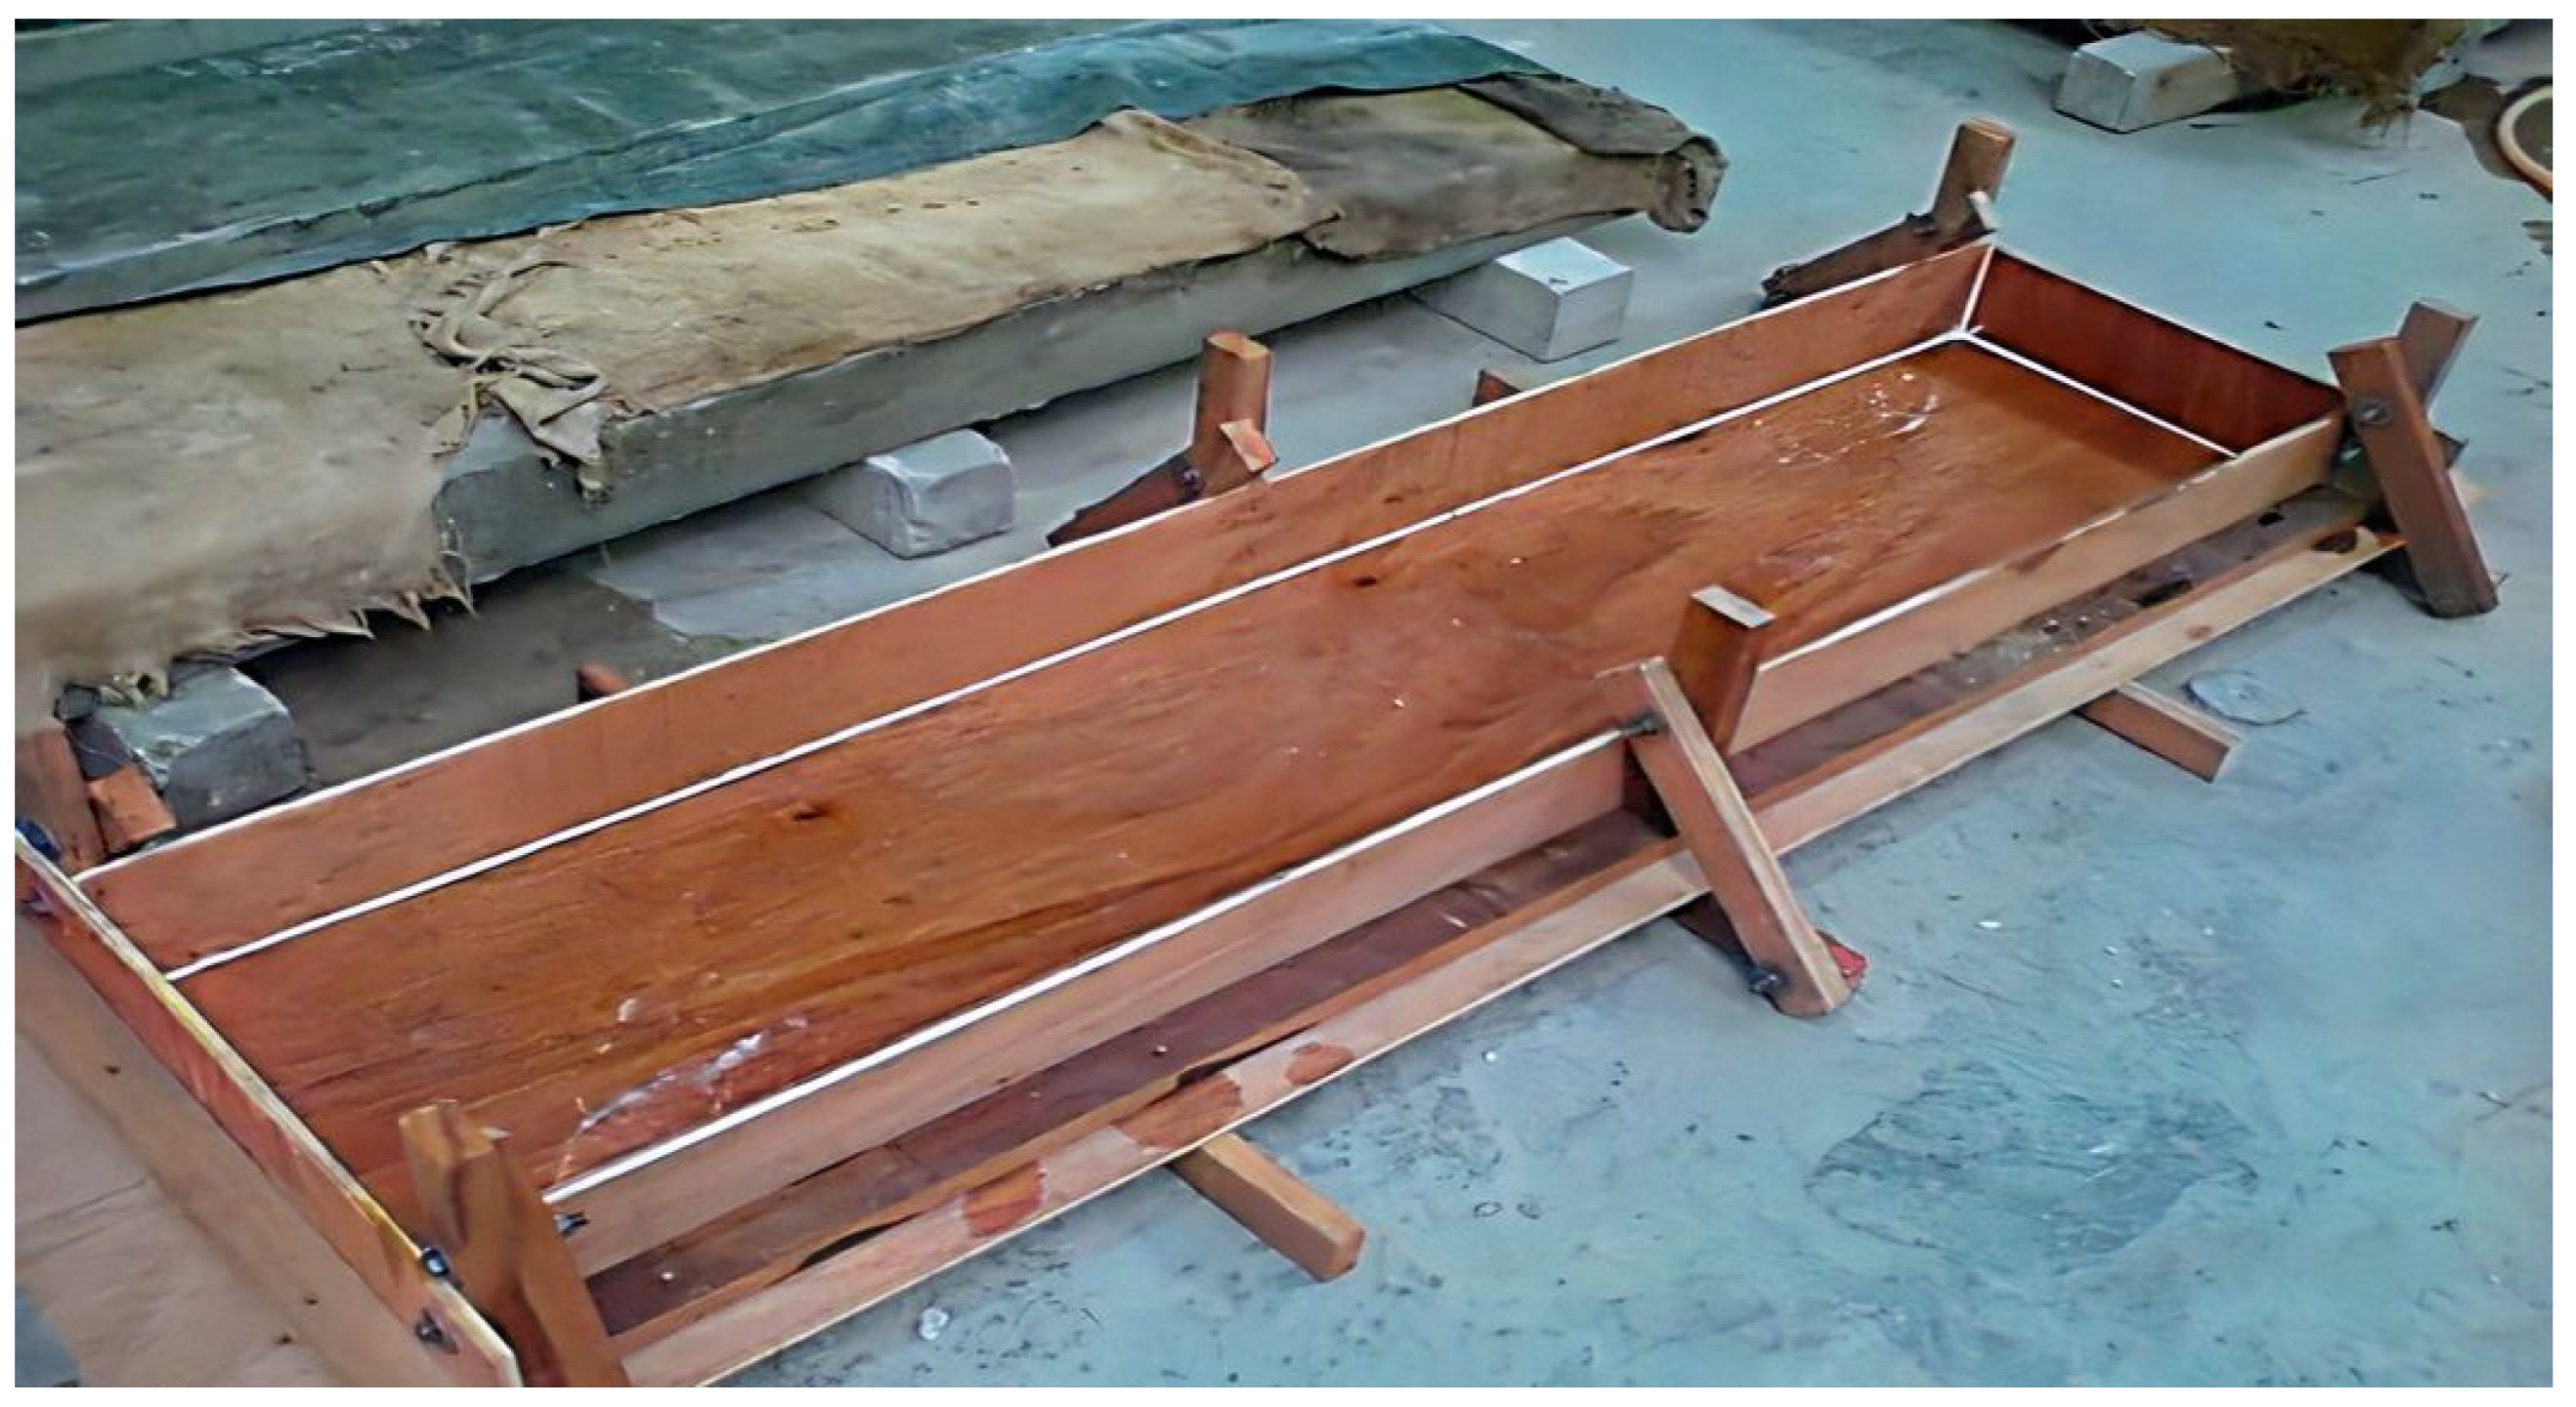
3.3.1. Formwork
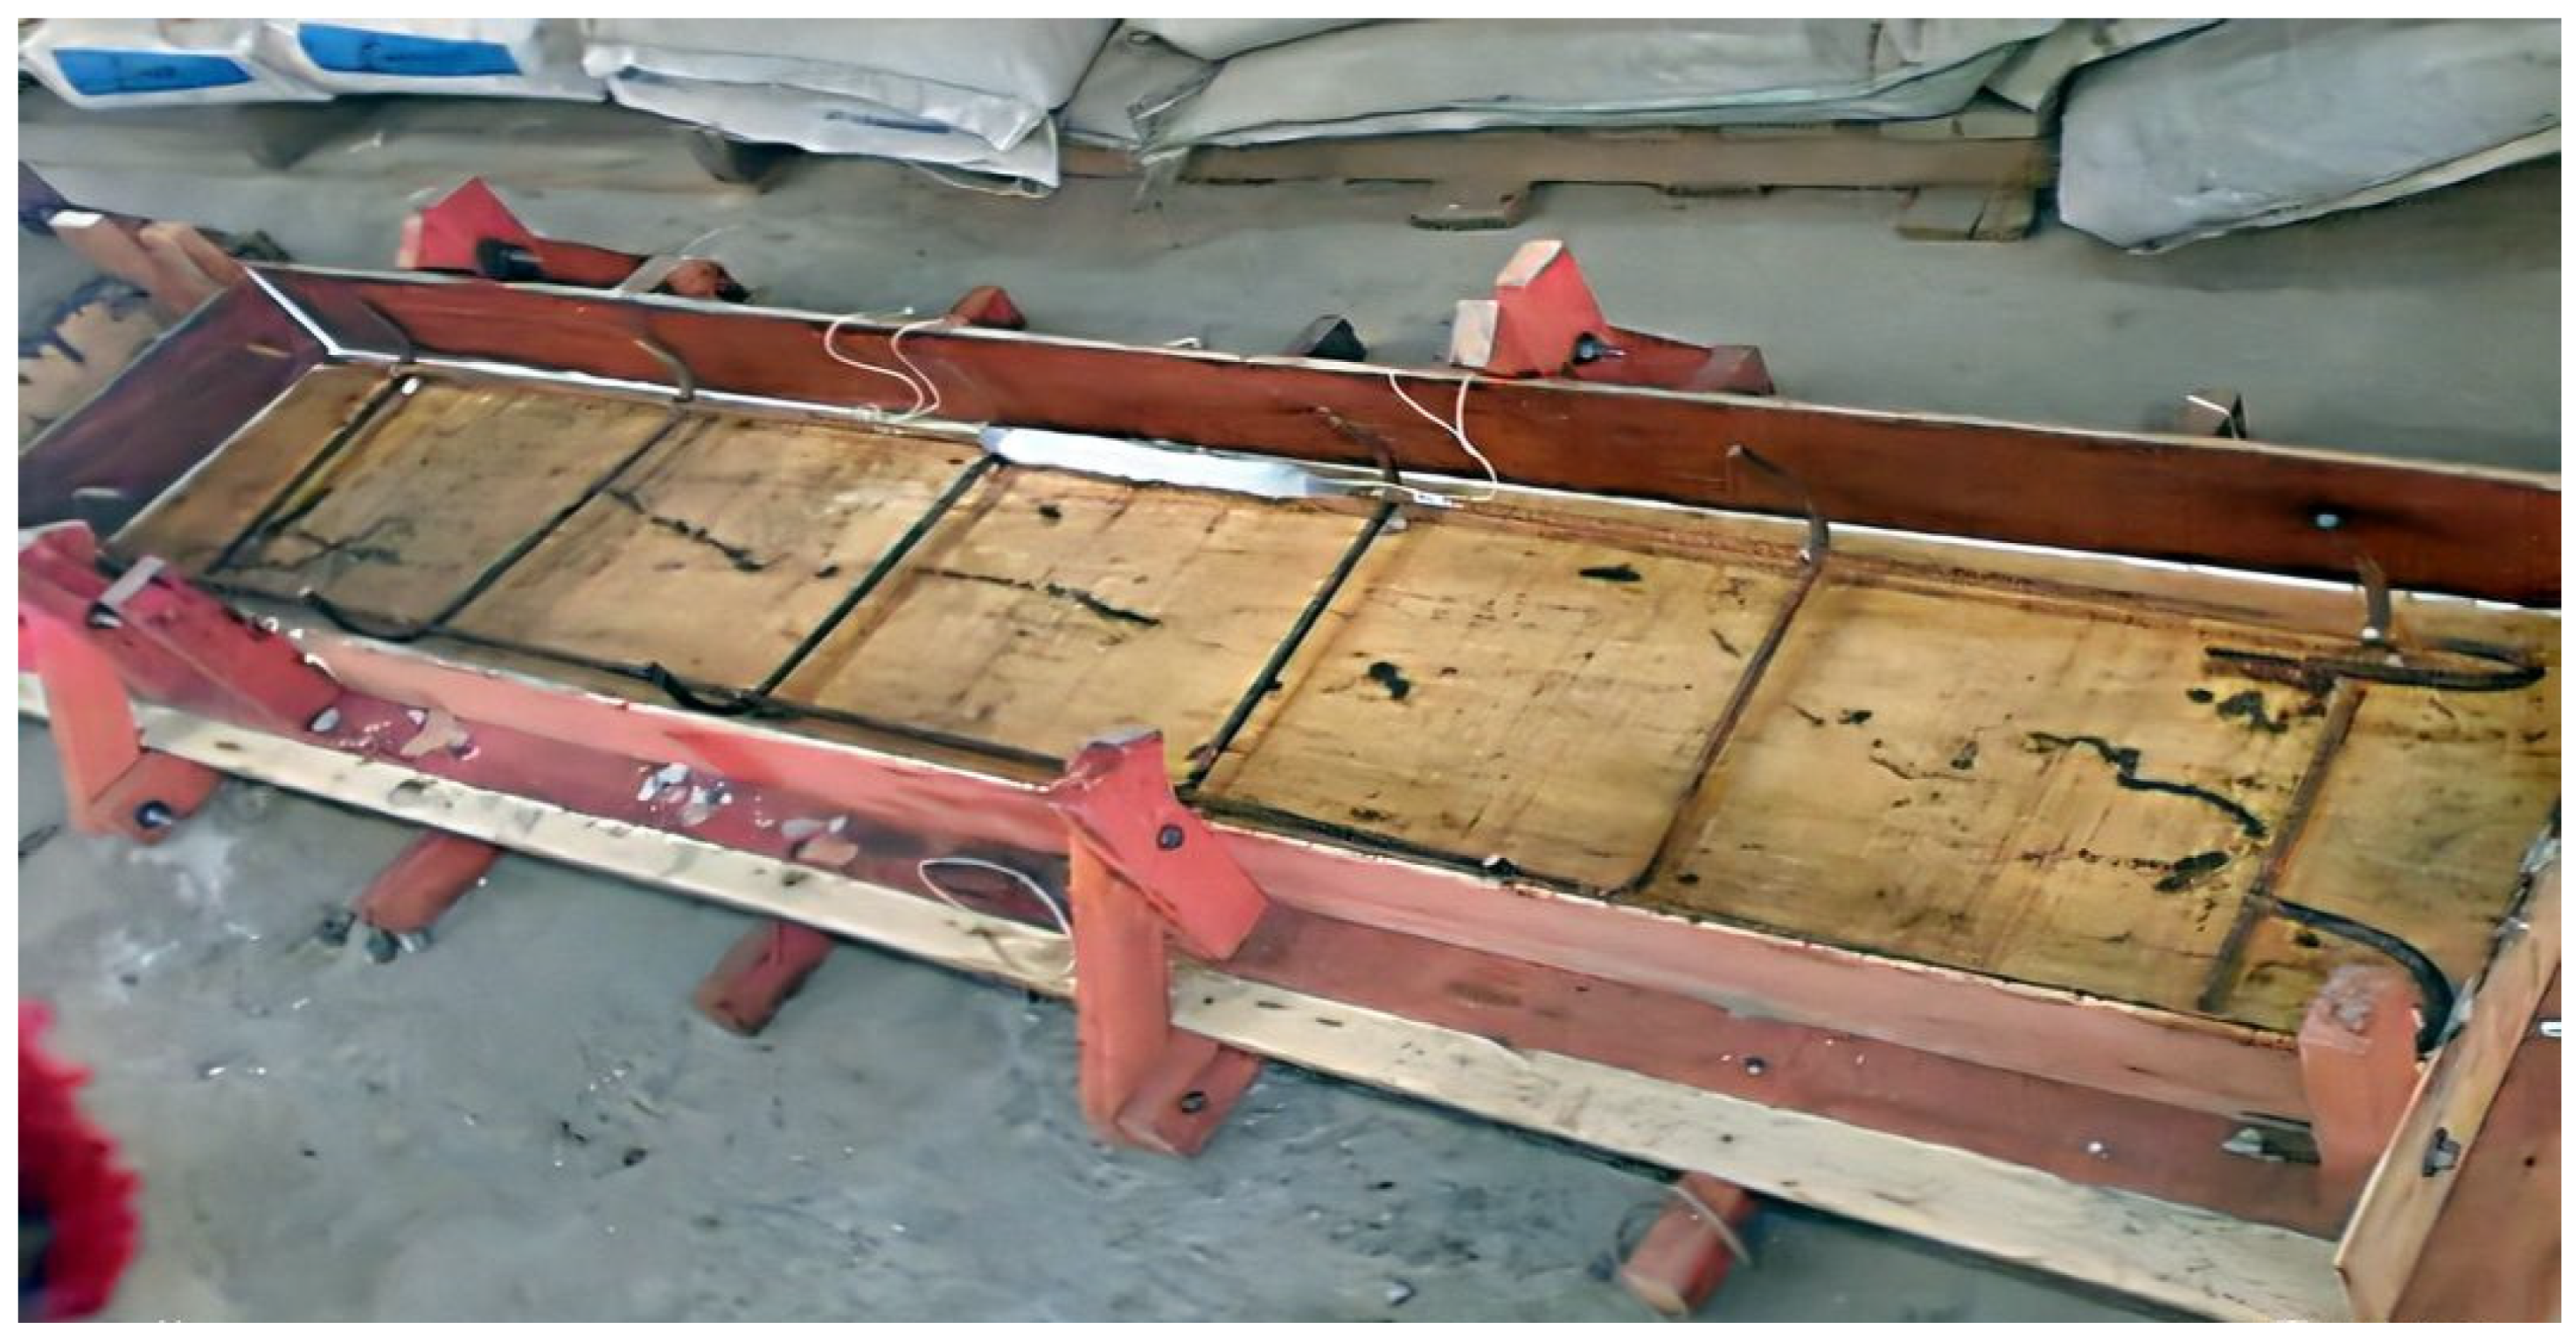
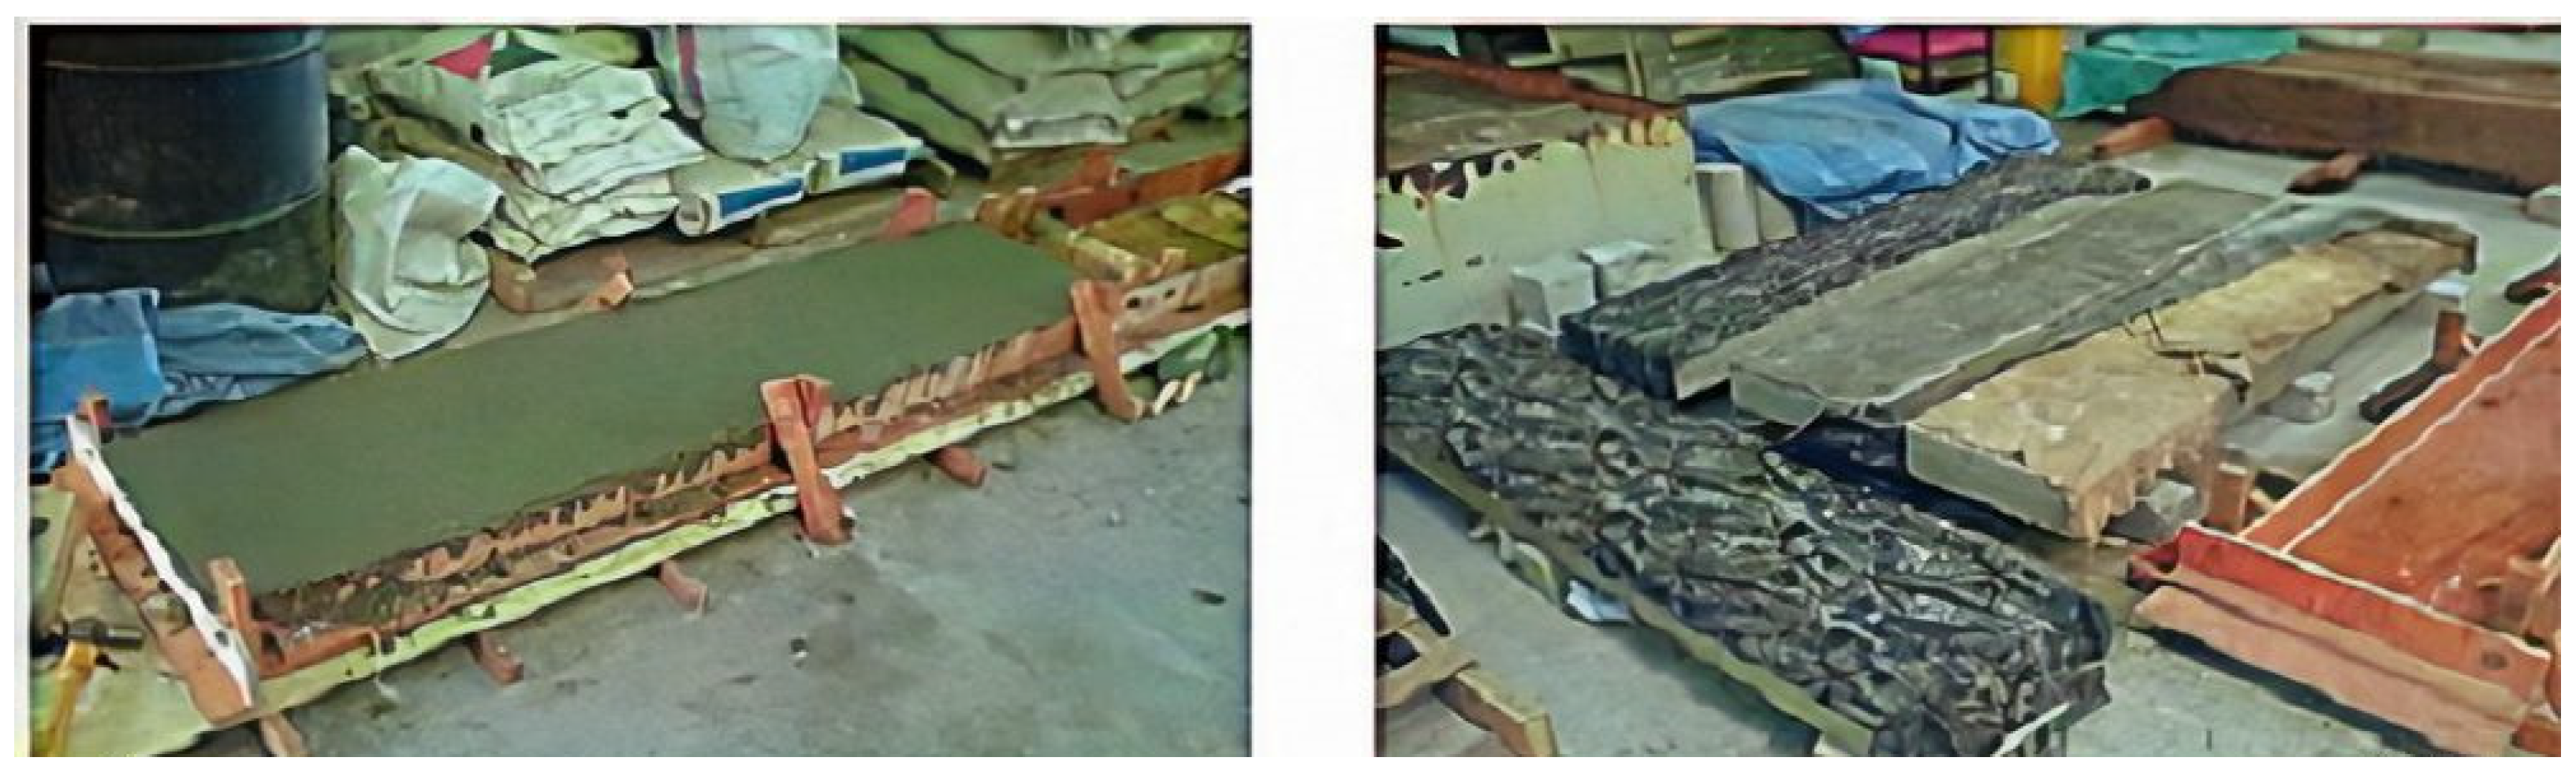
3.3.2. Reinforcing Bar and Concrete Casting
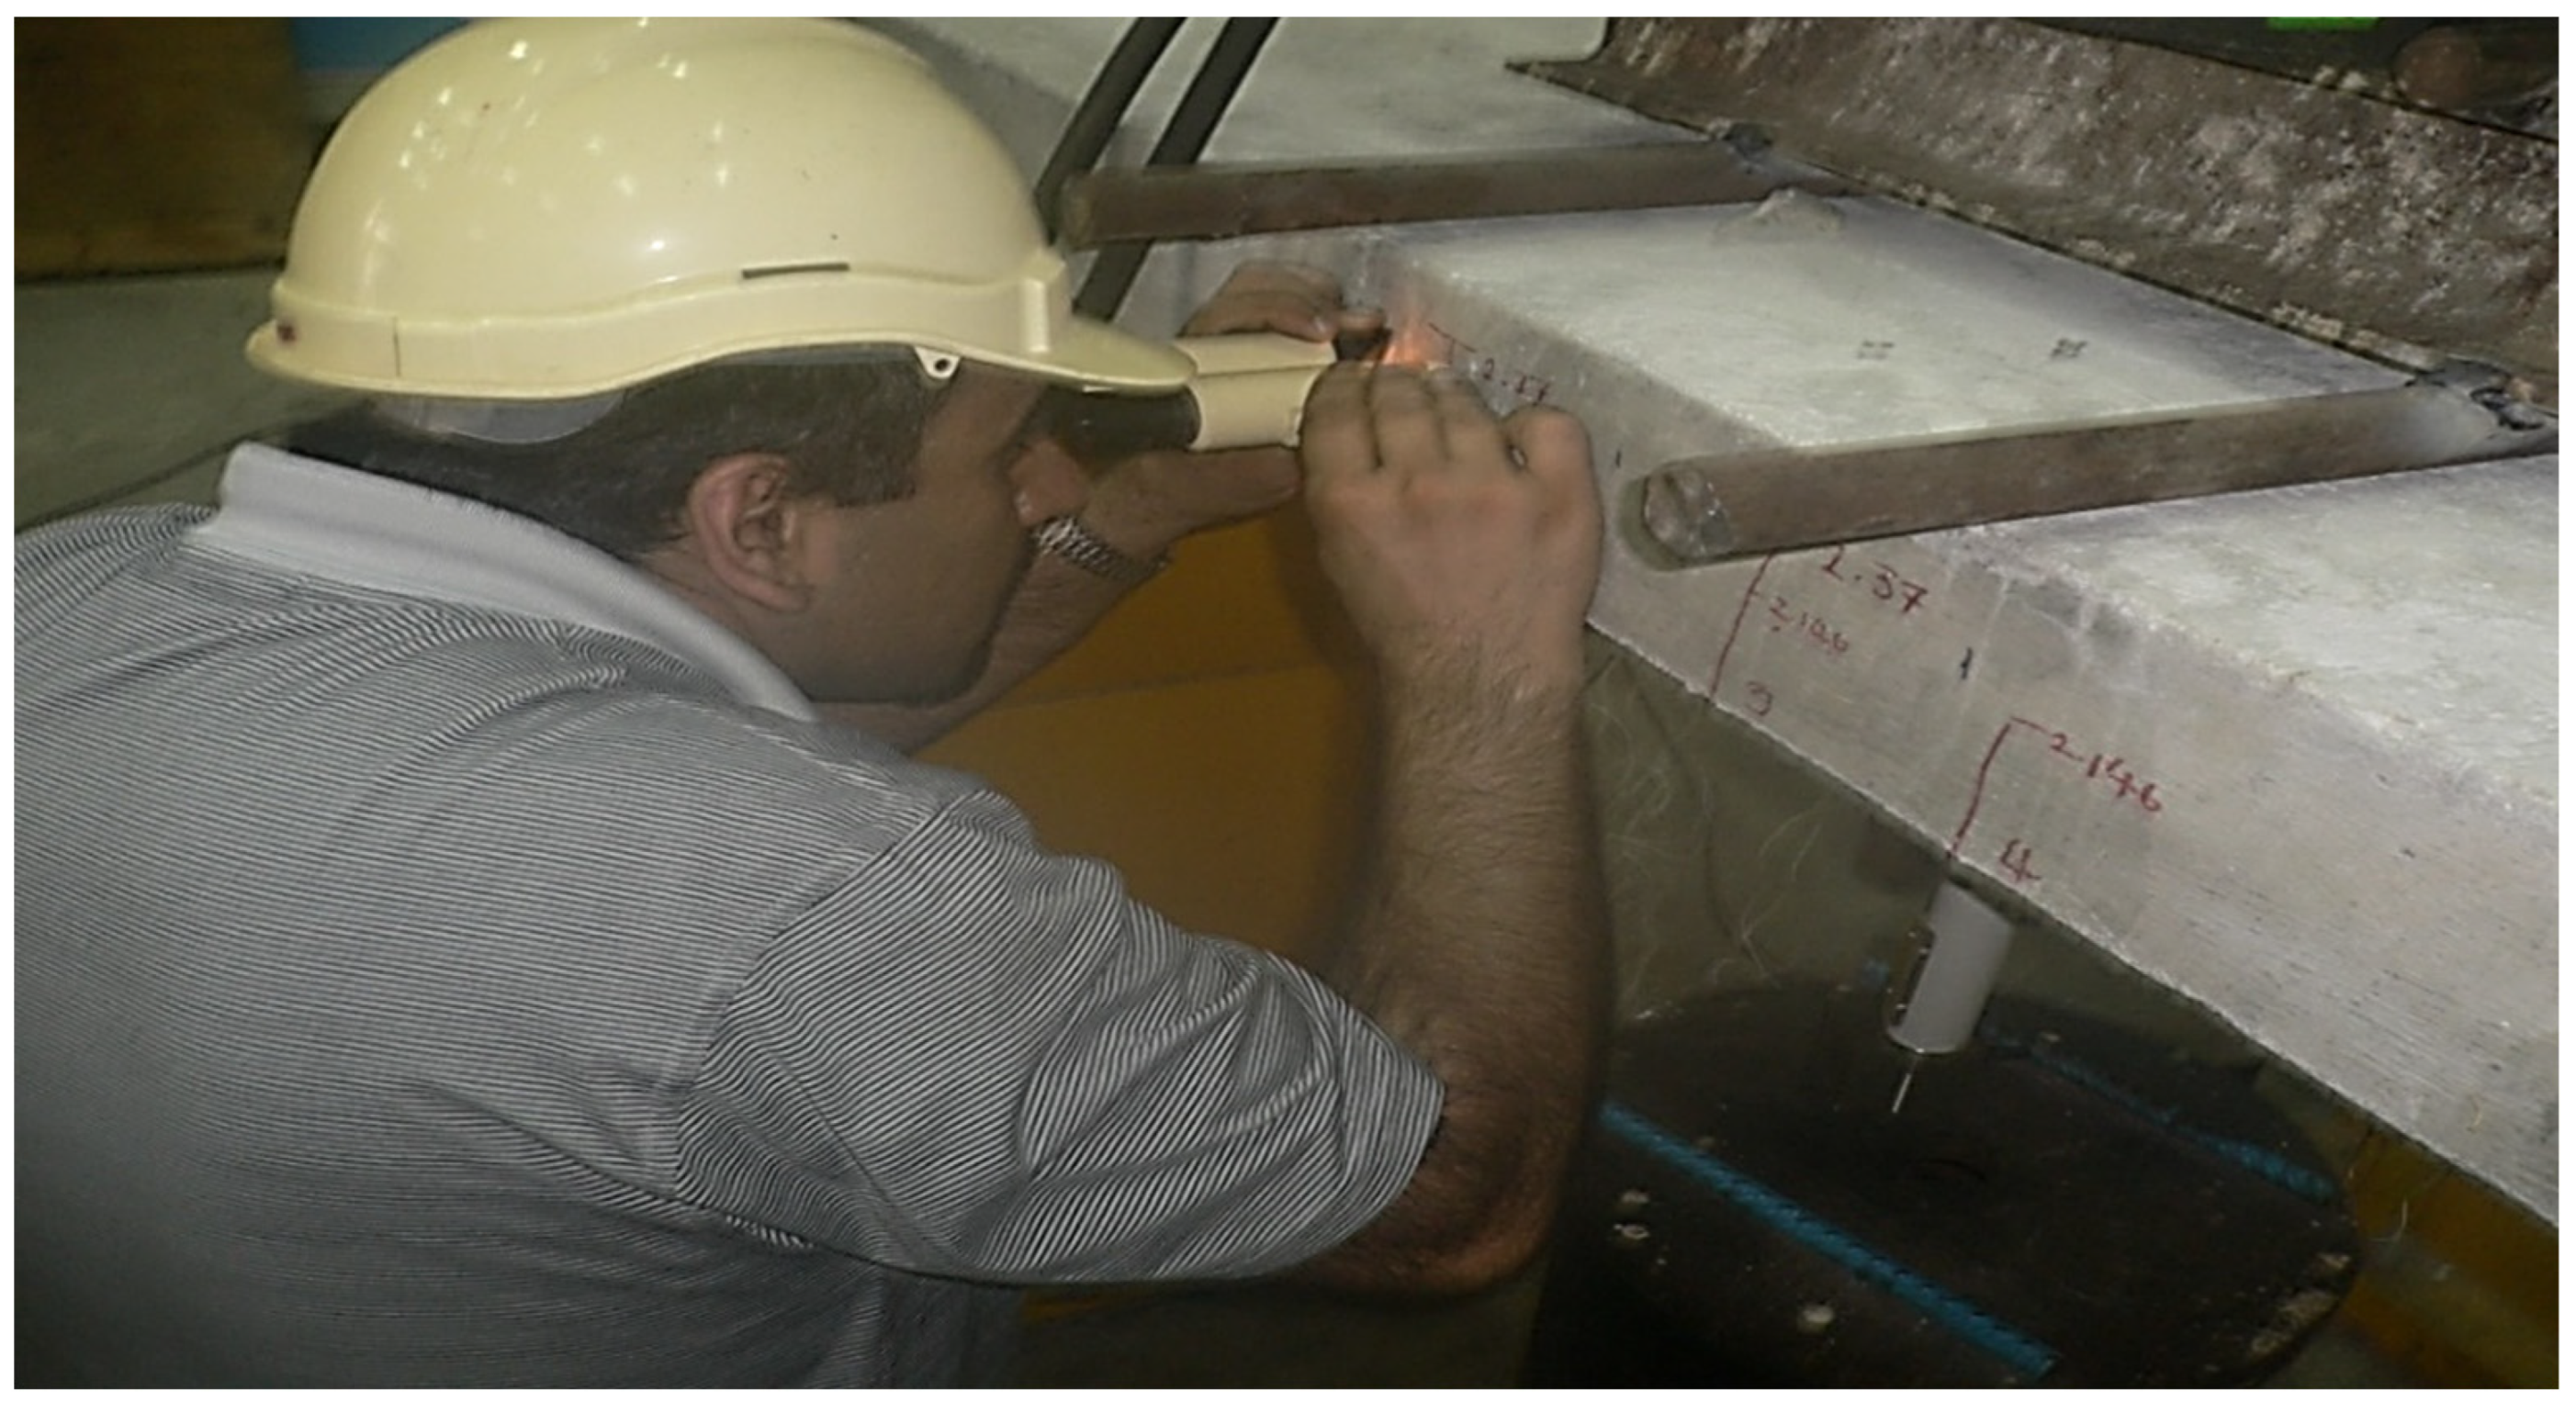
3.3.3. Instrumentation
- Linear variable differential transducers (LVDT)
- Data Logger
- Handheld microscope
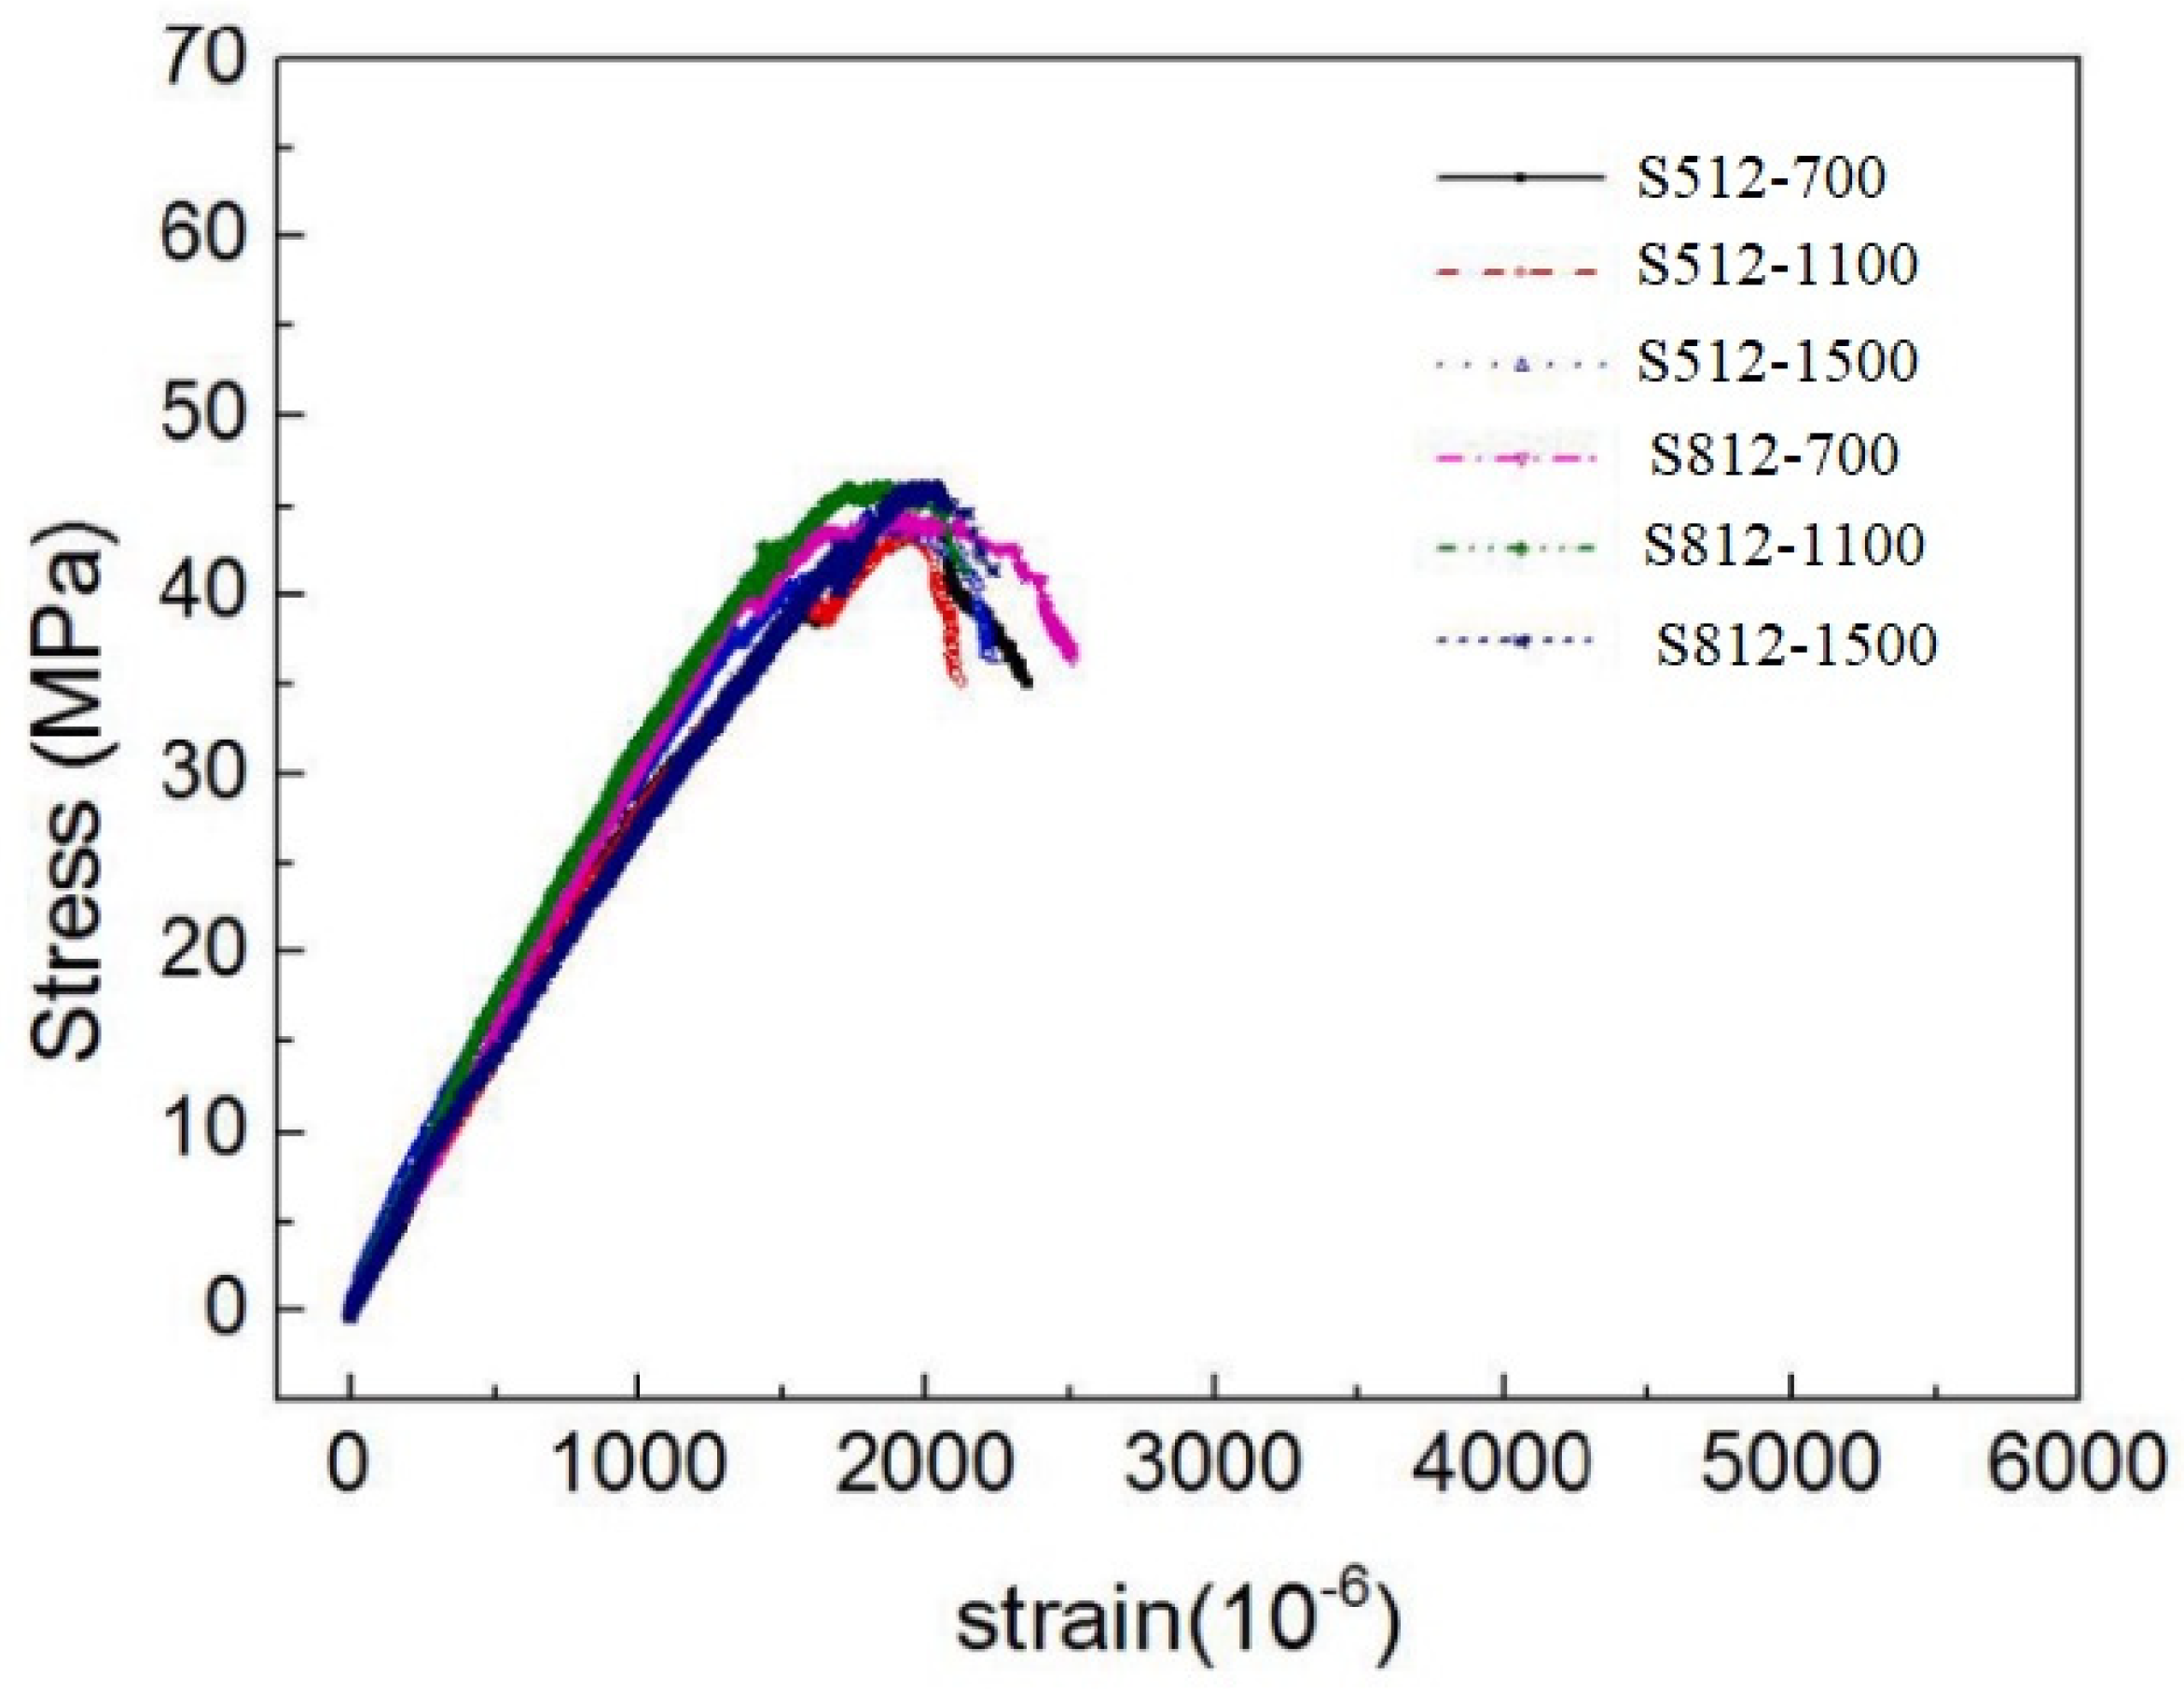
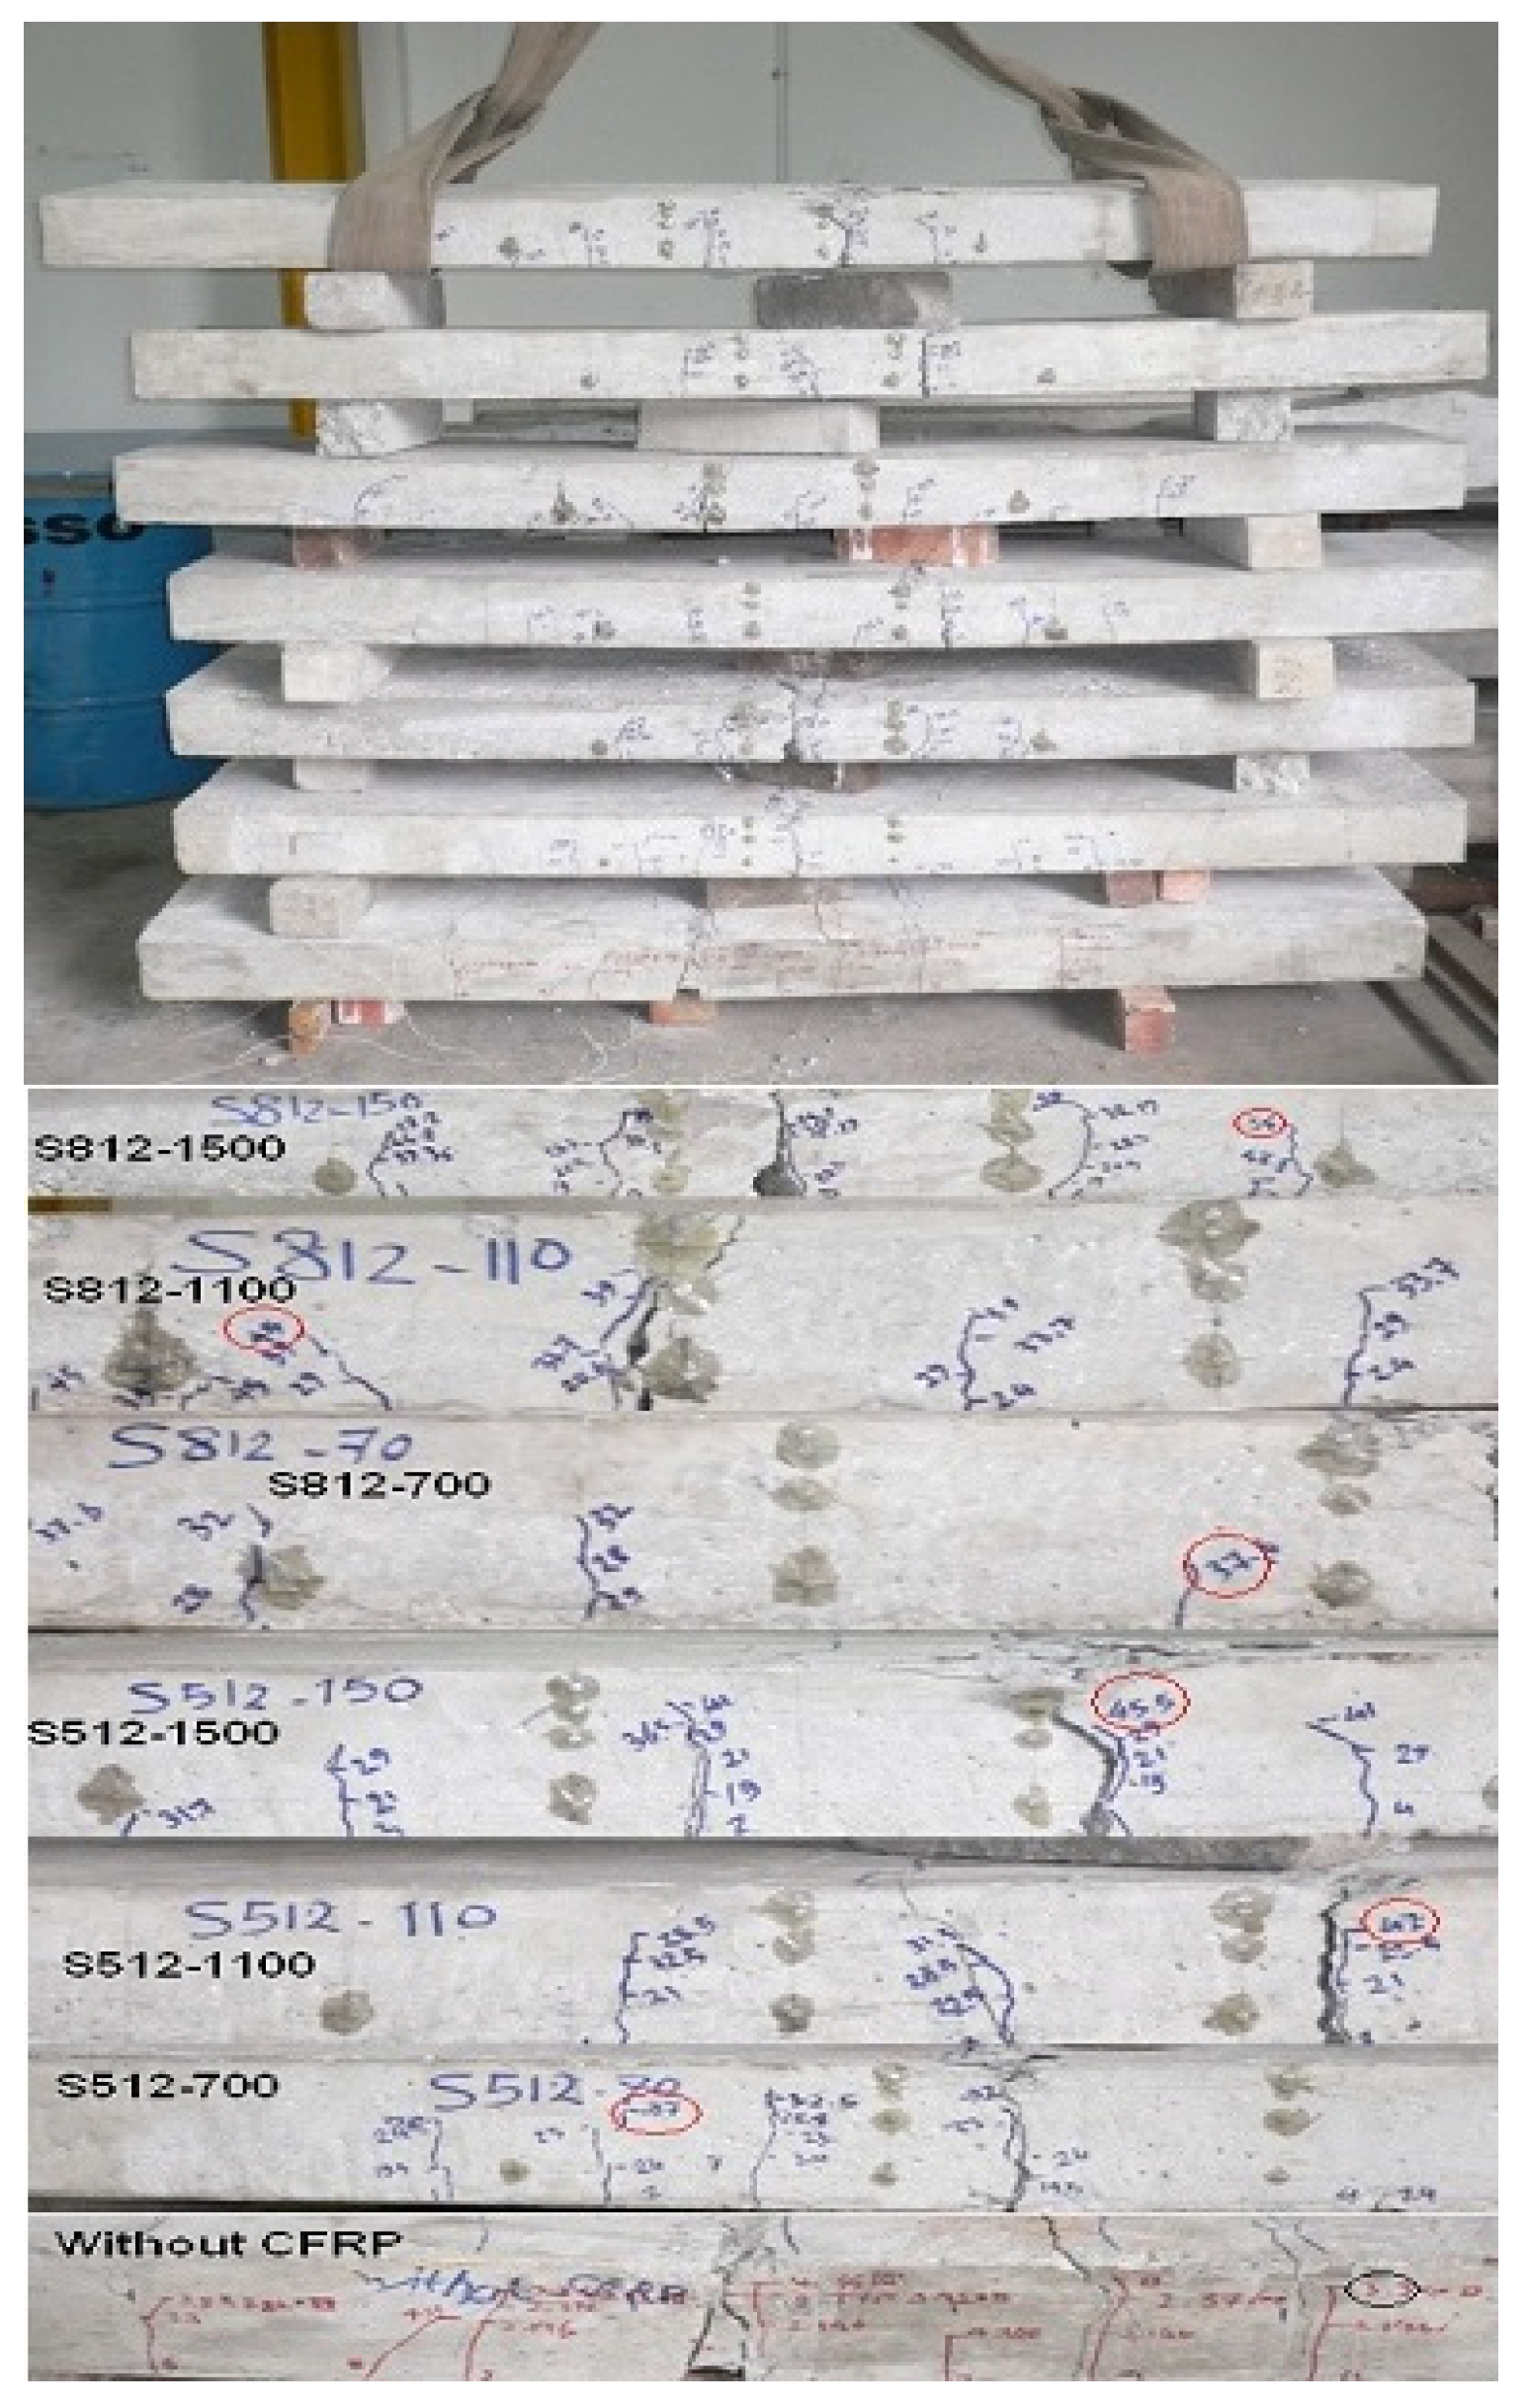
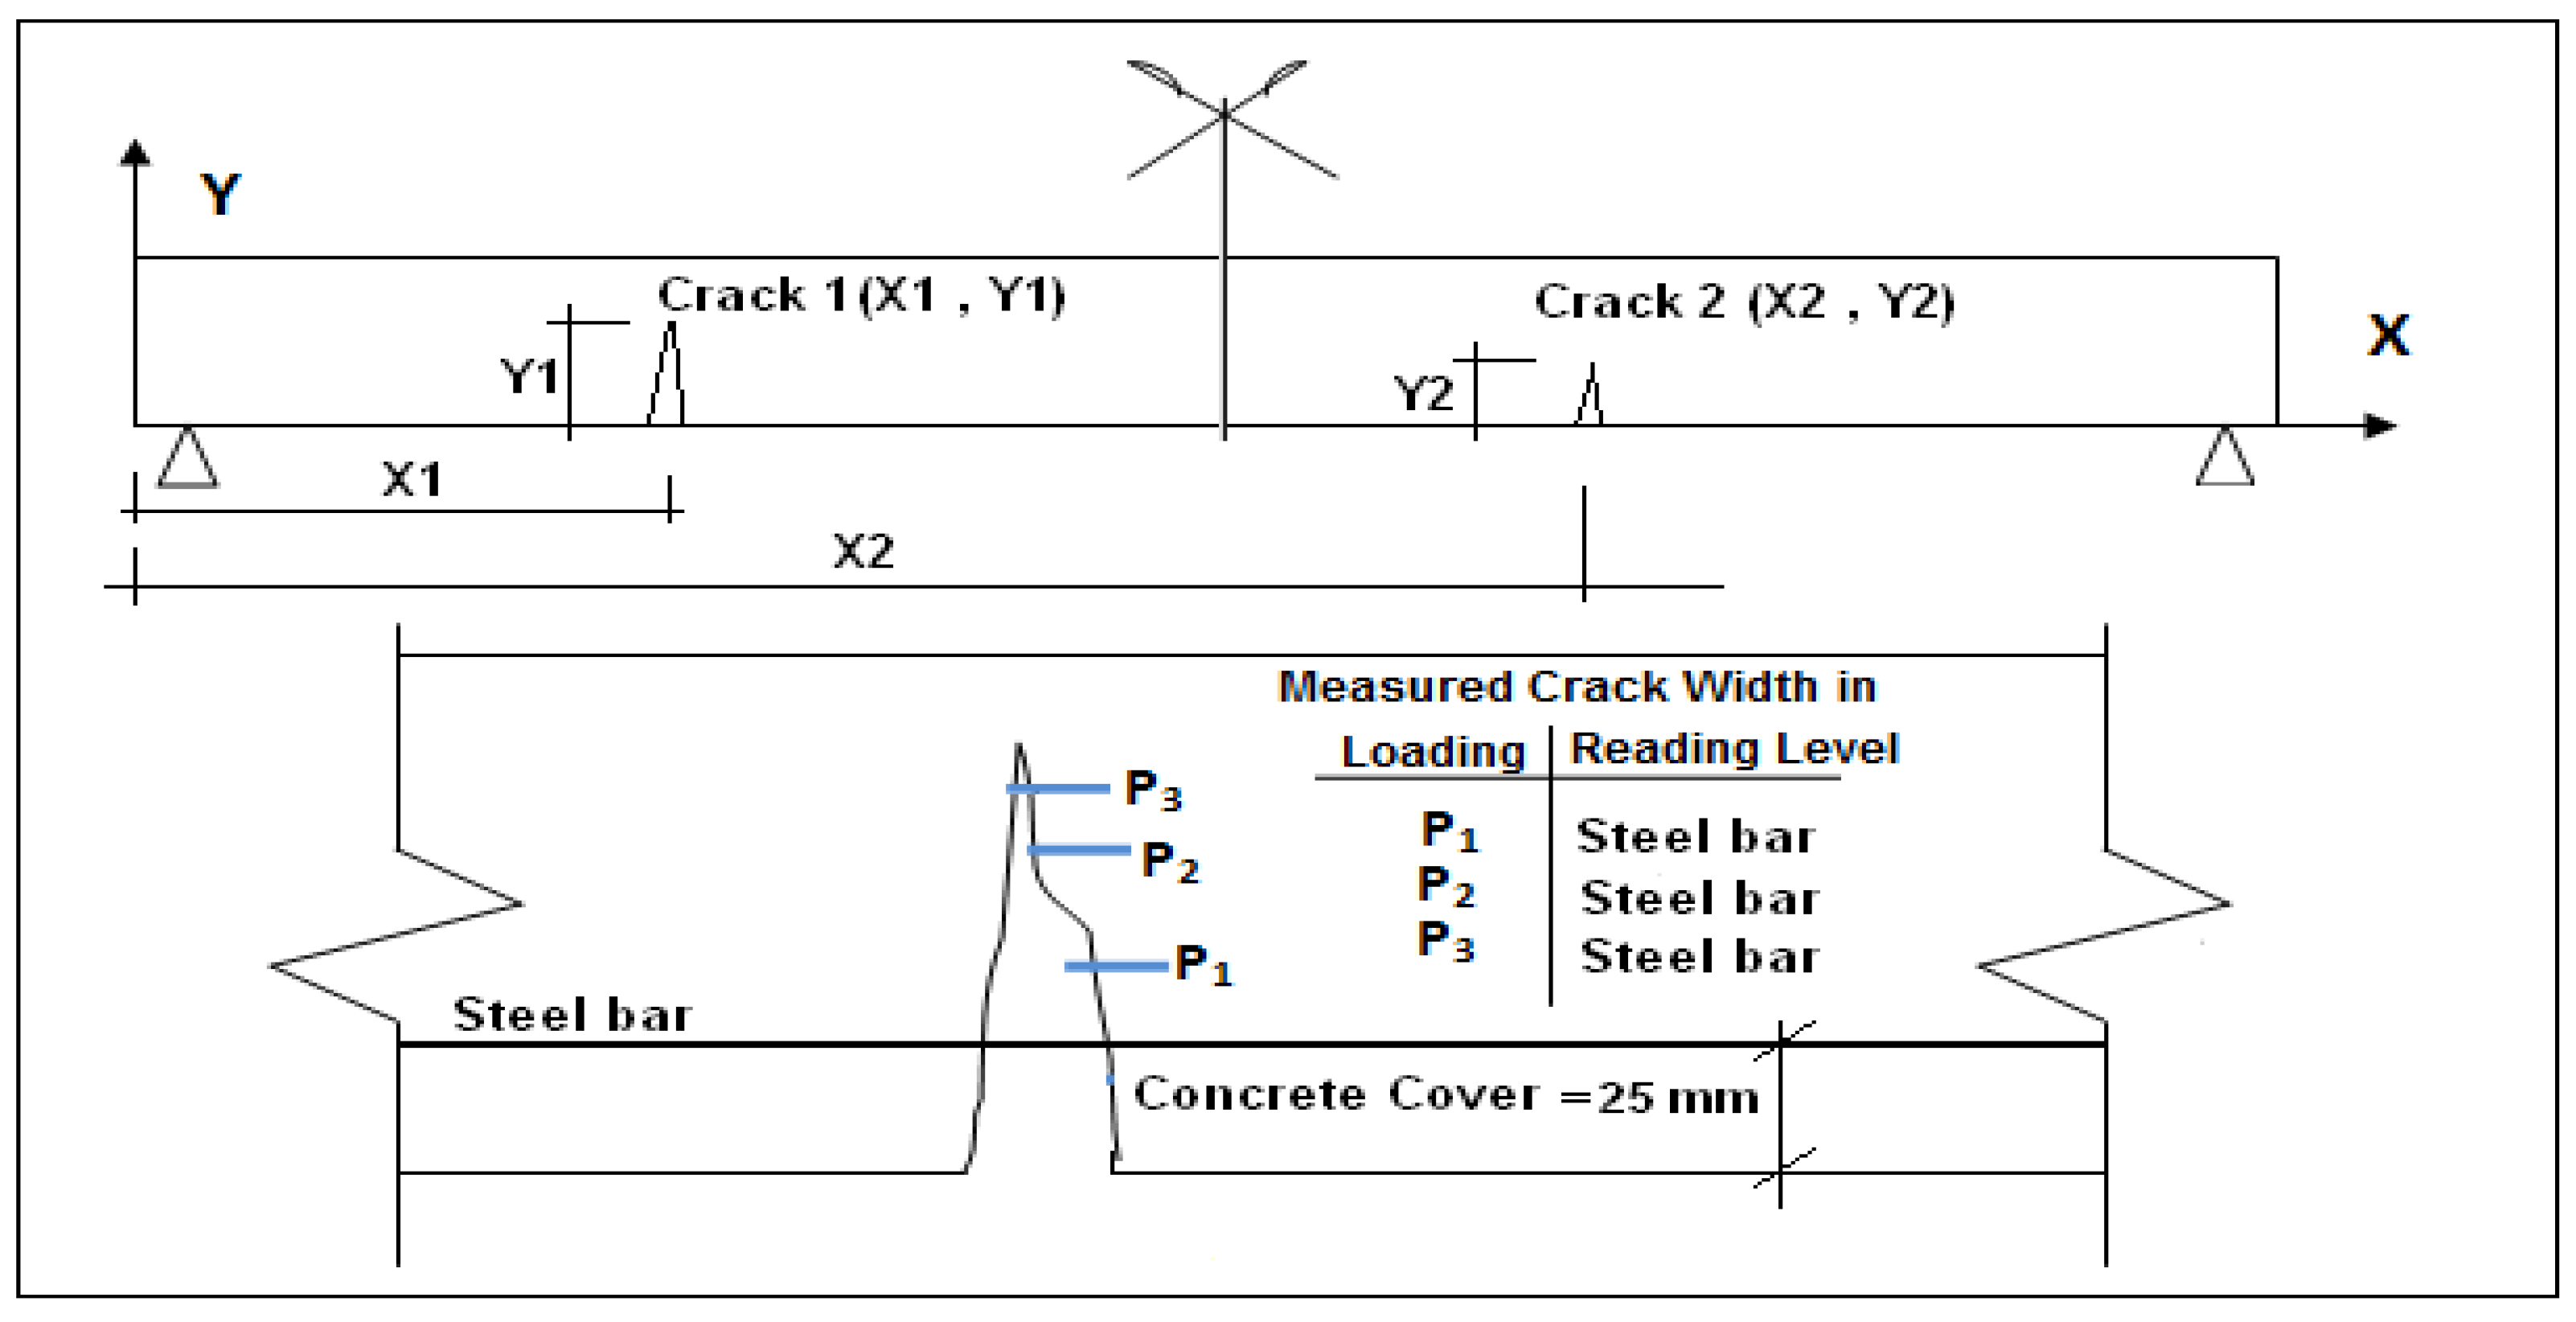
4. Experimental Results
5. Informational Model for Crack Width Prediction
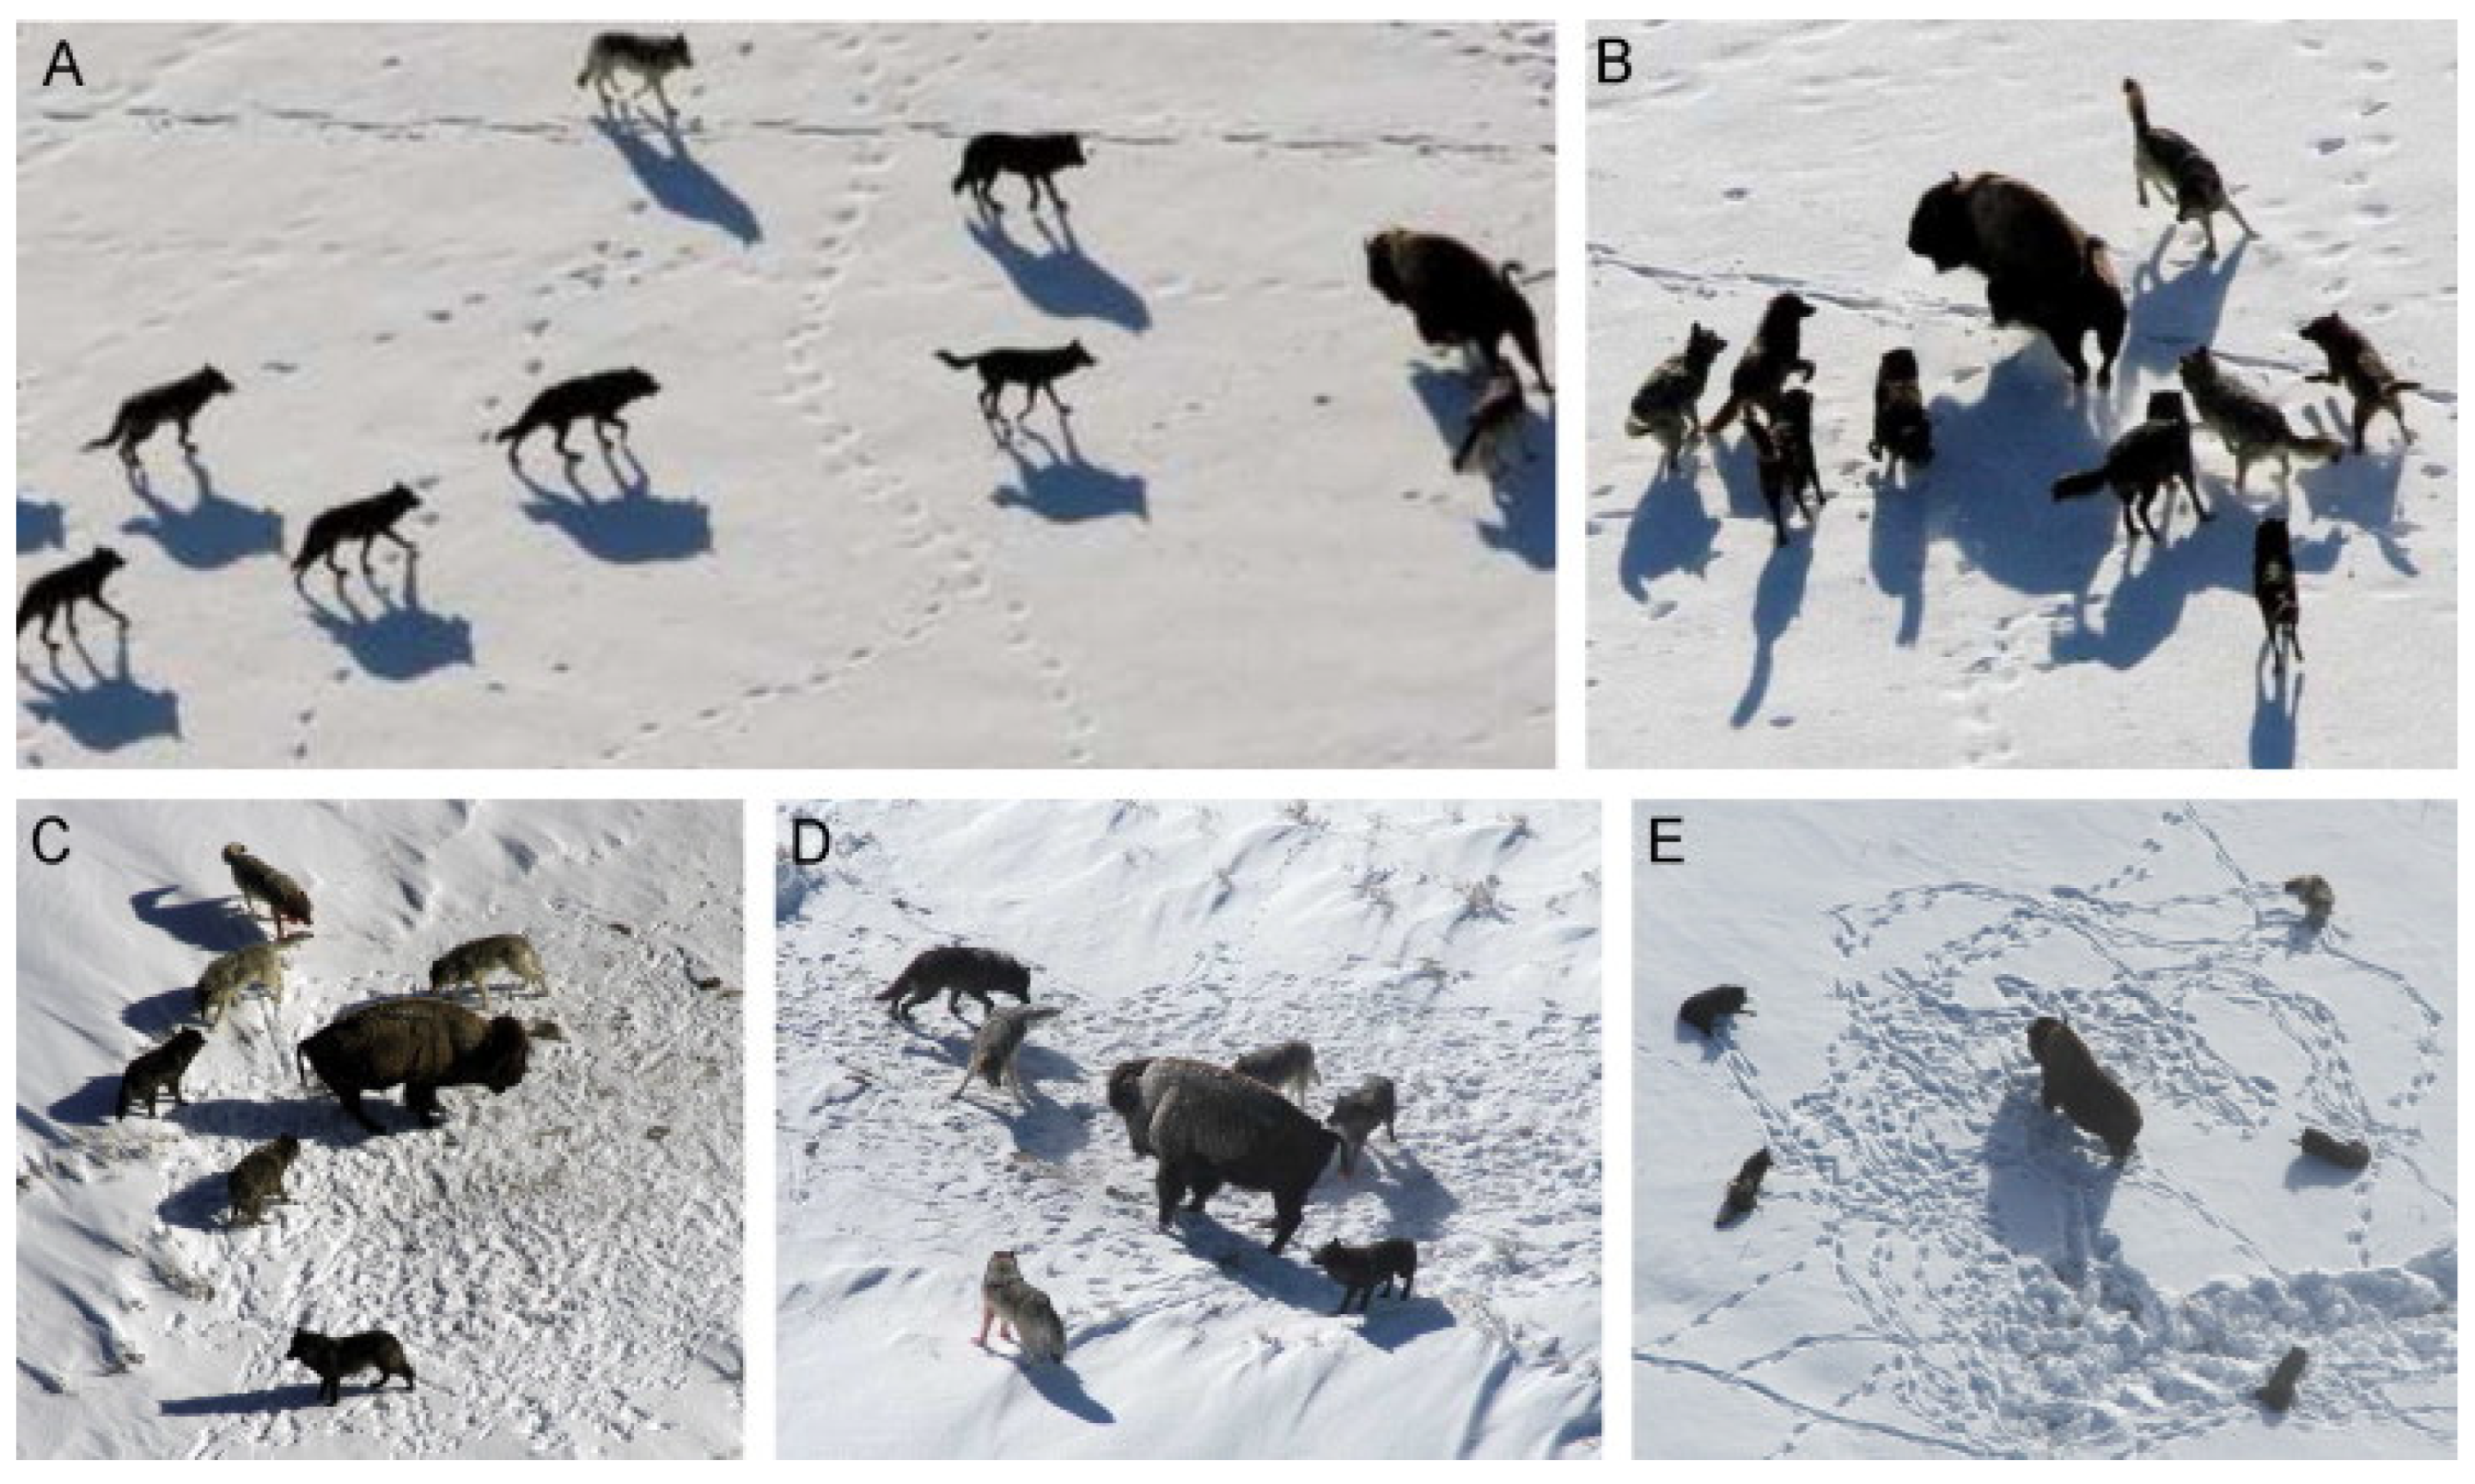
5.1. ANN and Grey Wolf Optimization Algorithm
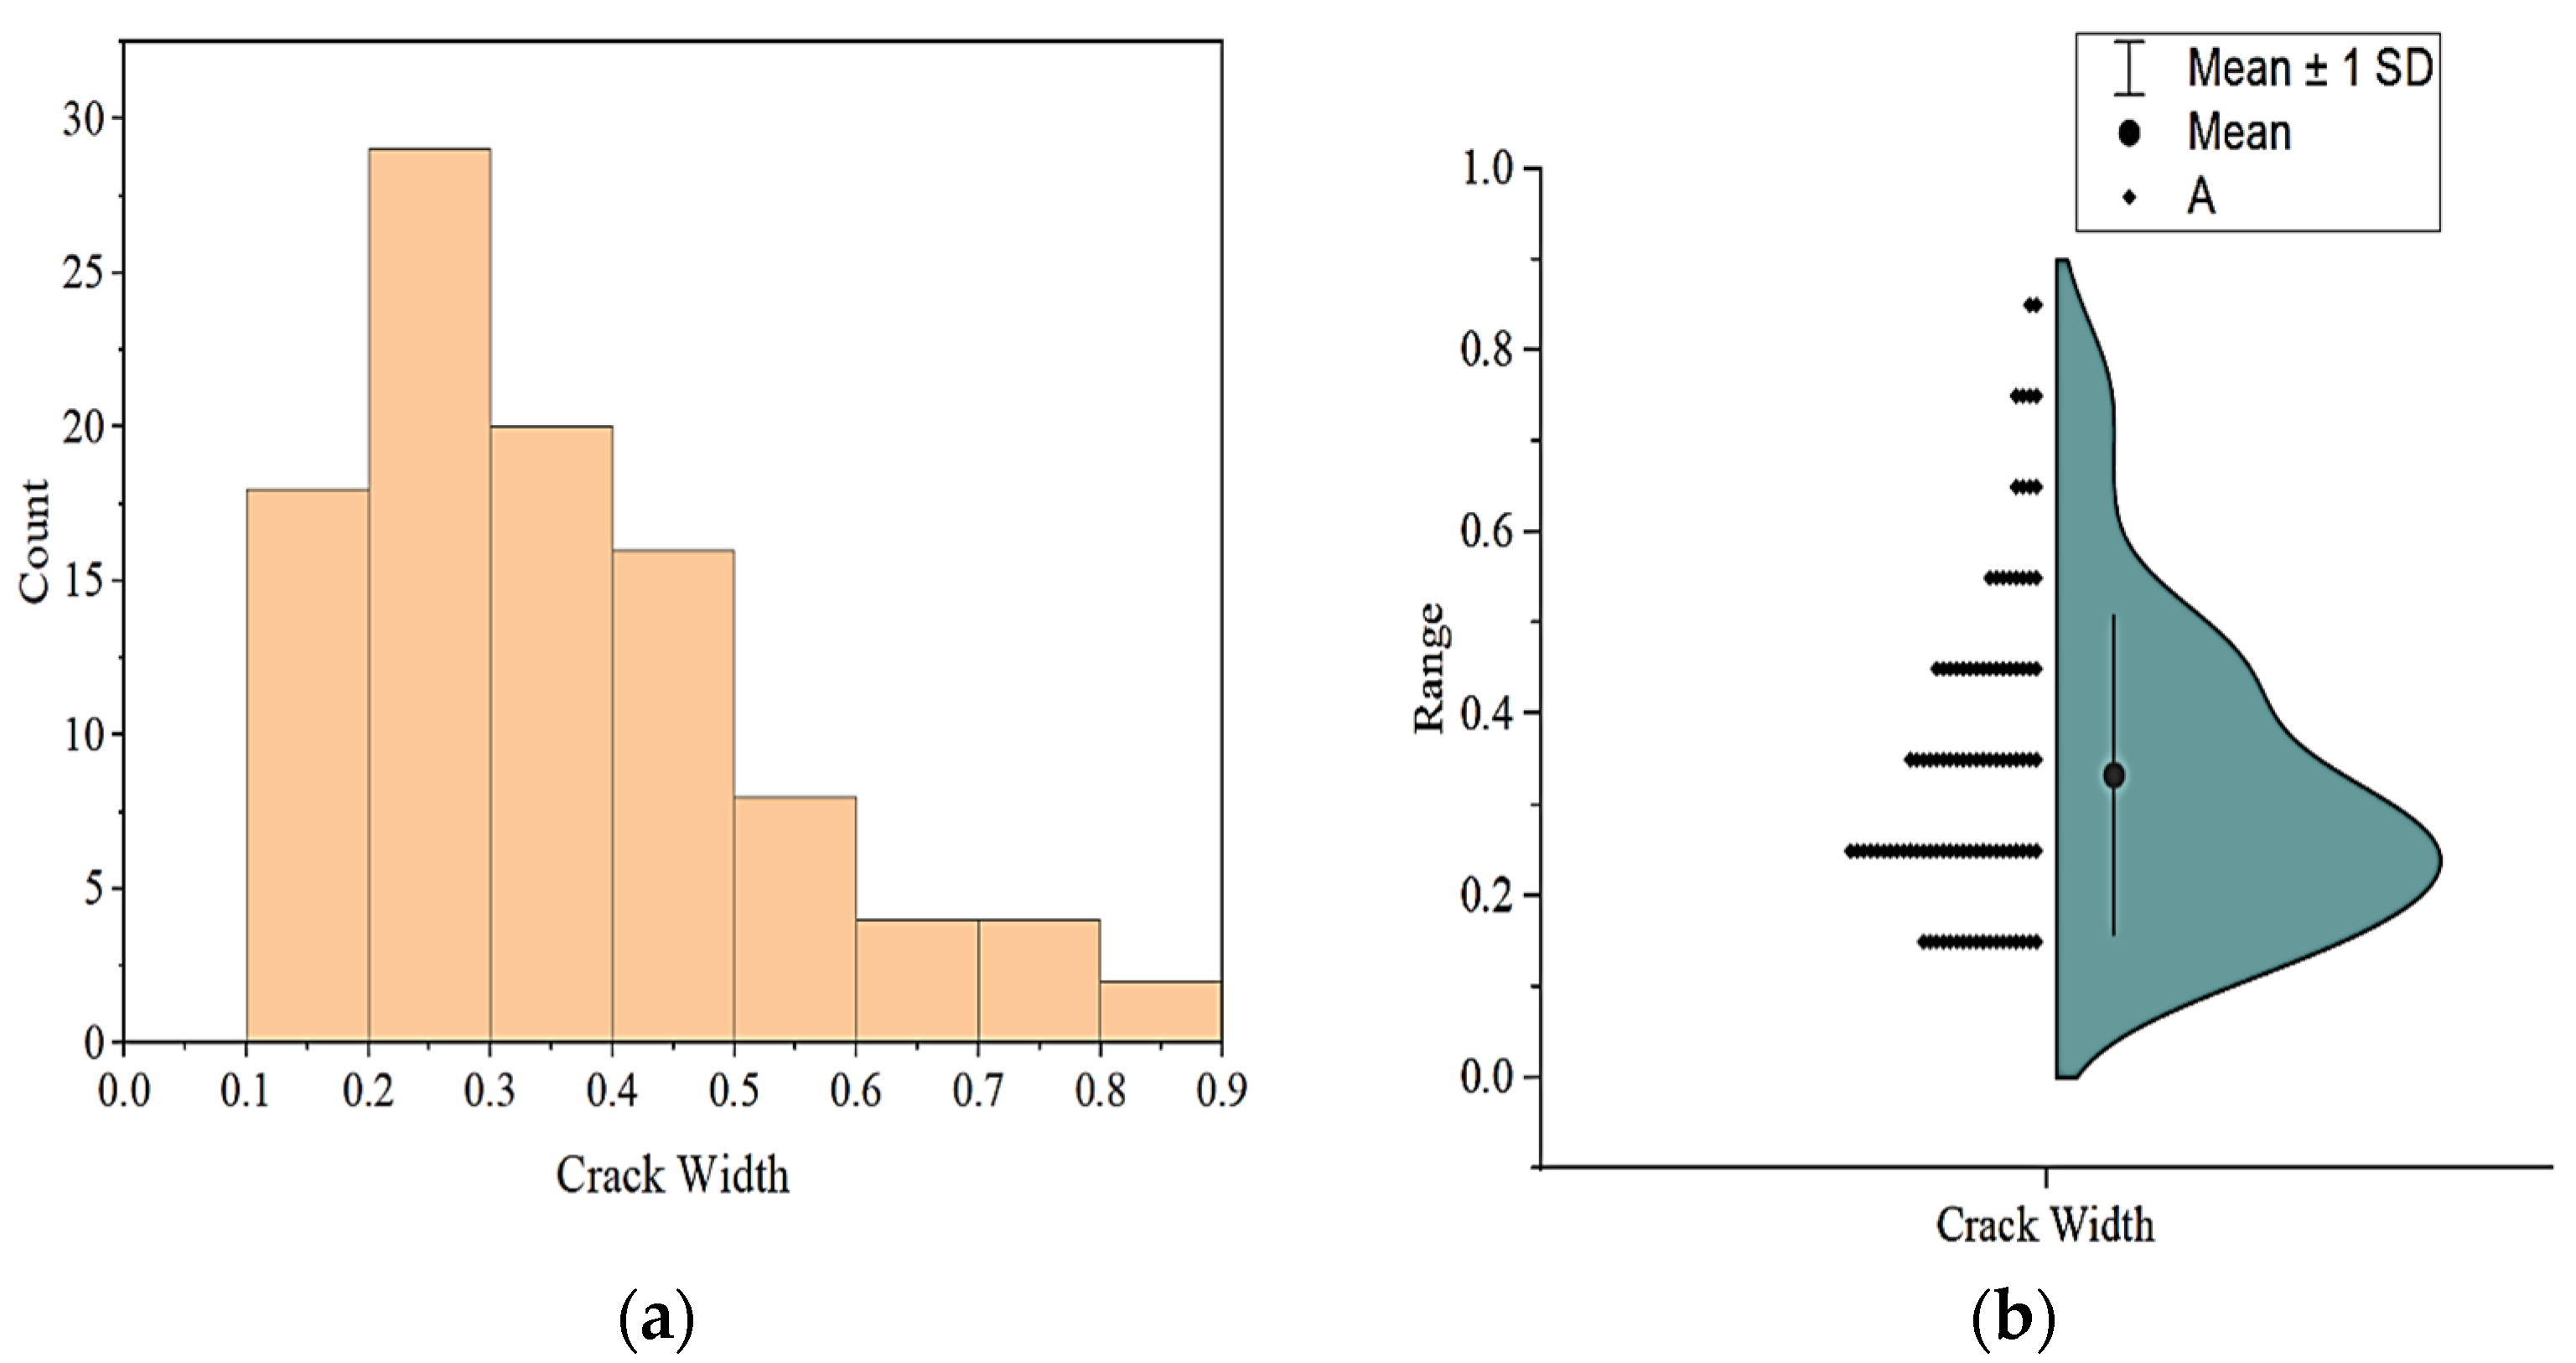
5.2. Generation of Training and Testing Data Sets
5.3. Multiple Linear Regression and Imperialist Competitive Algorithm Models
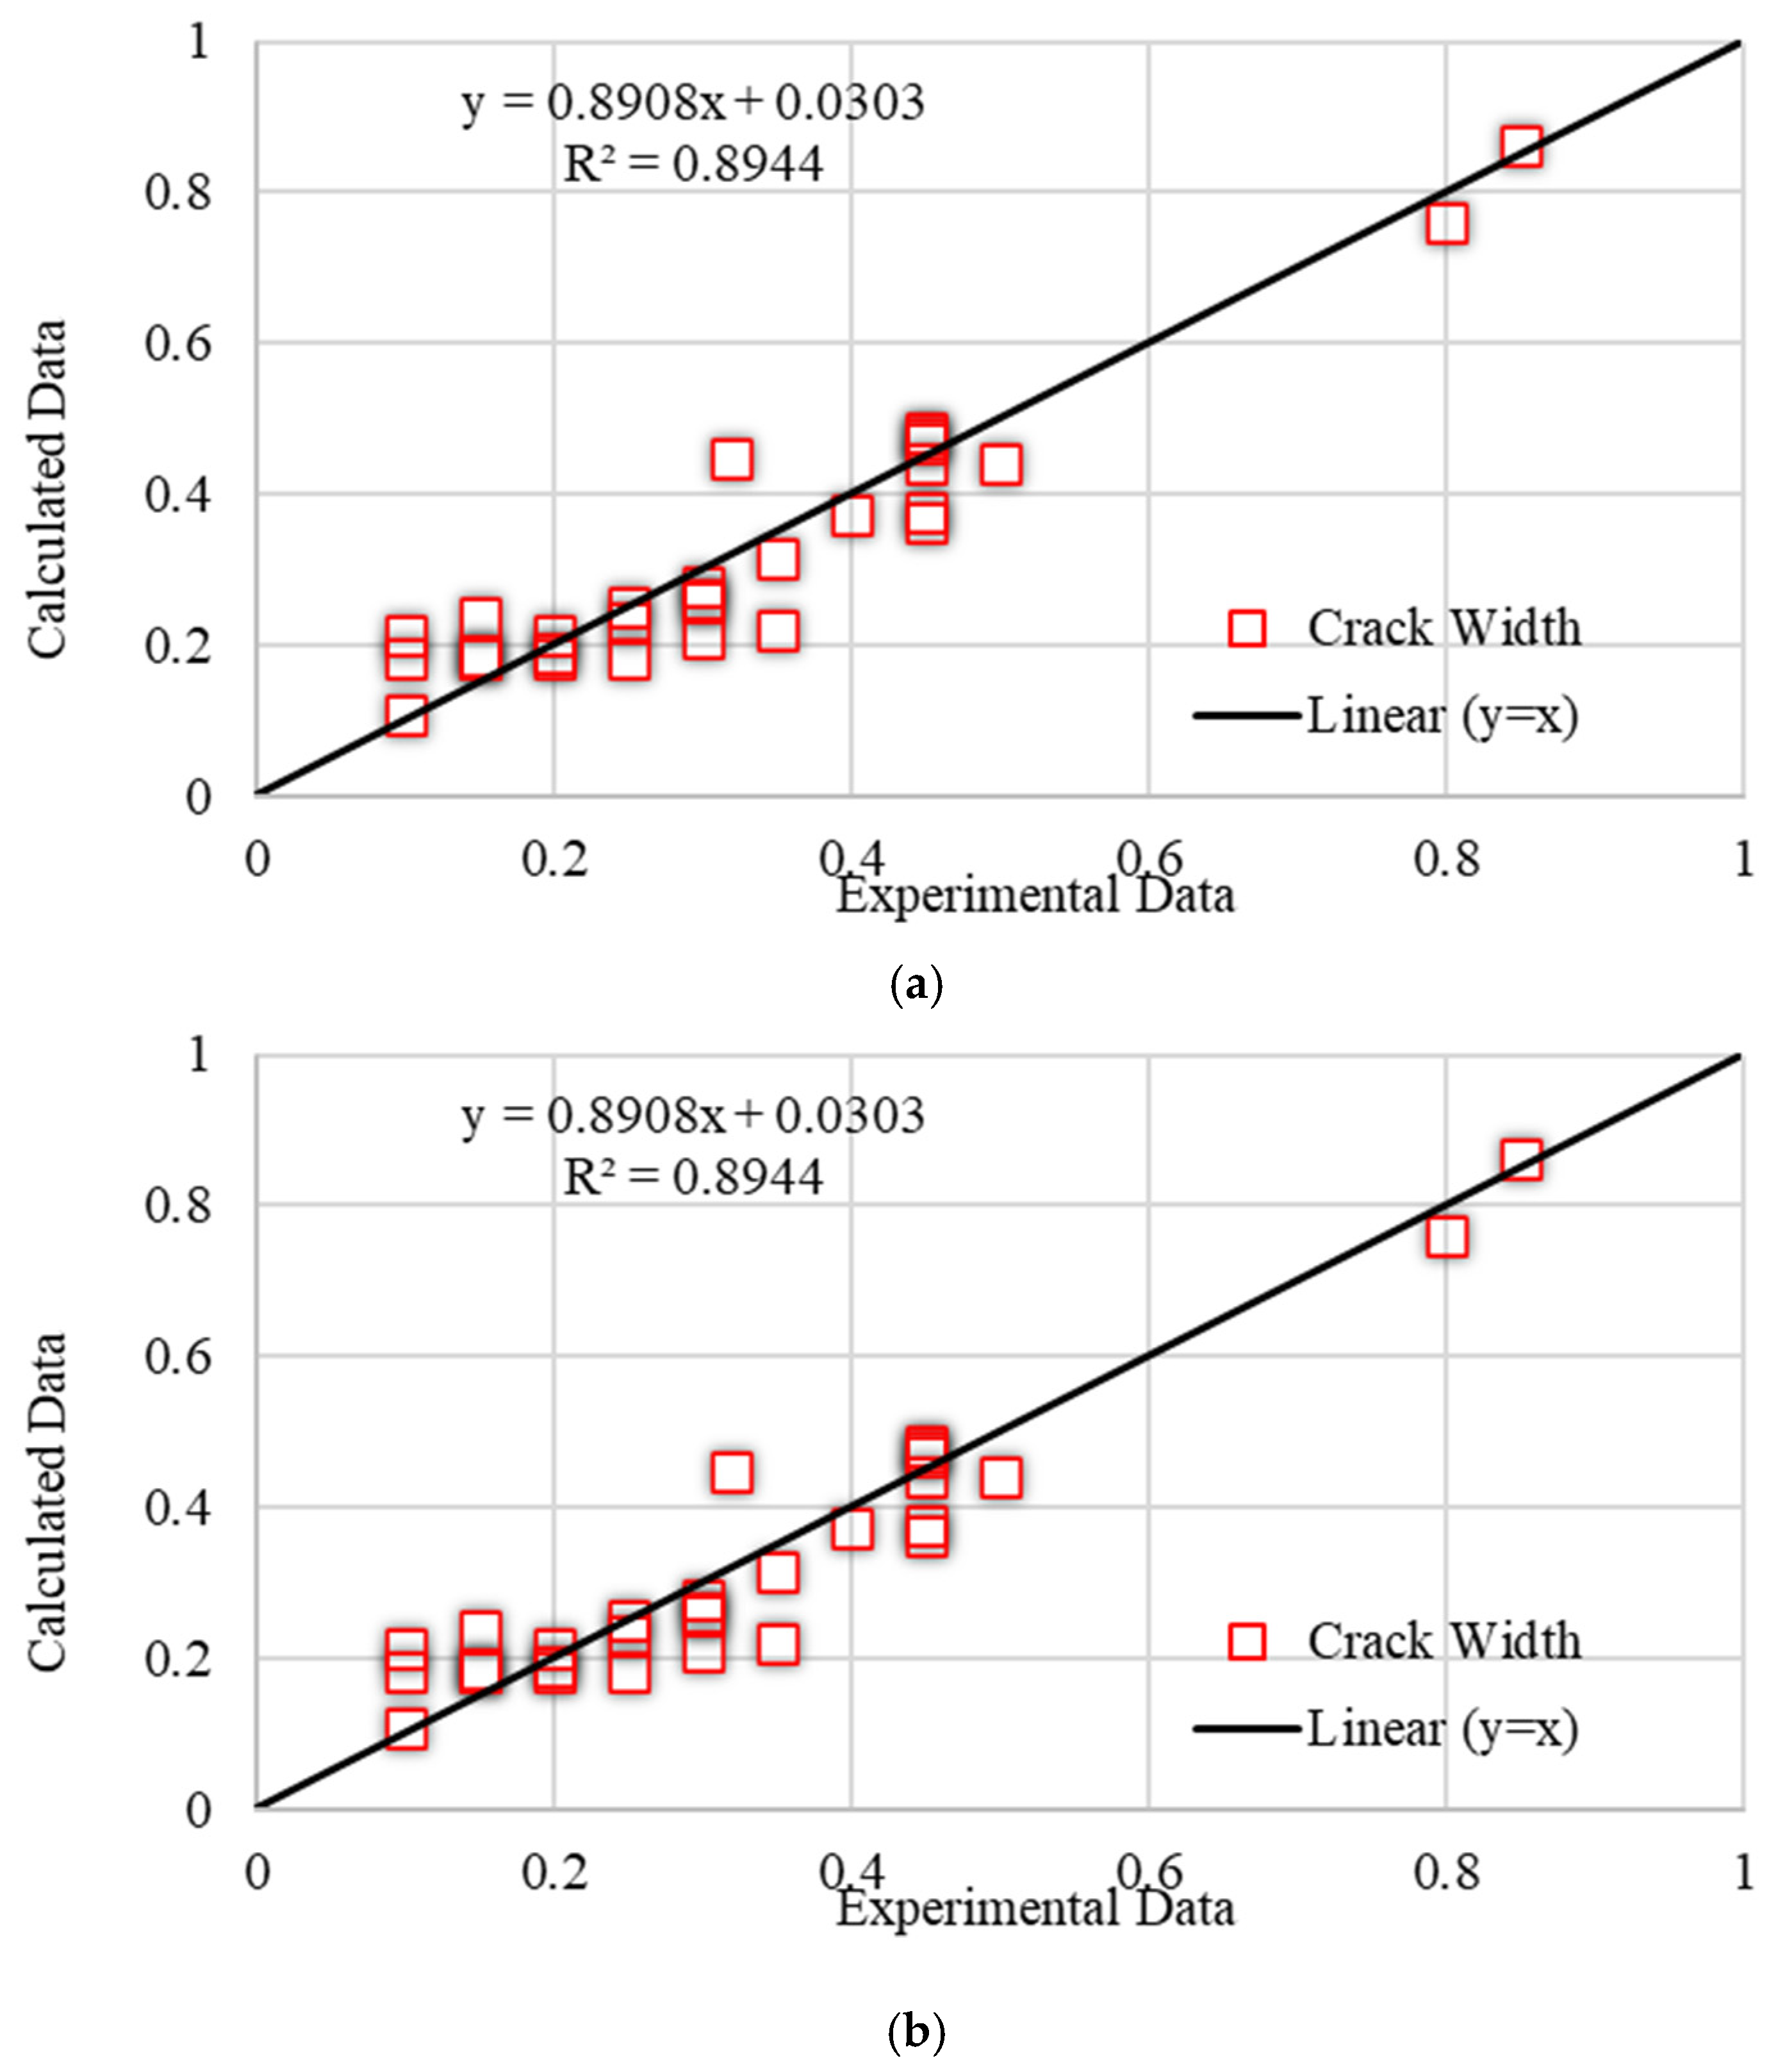
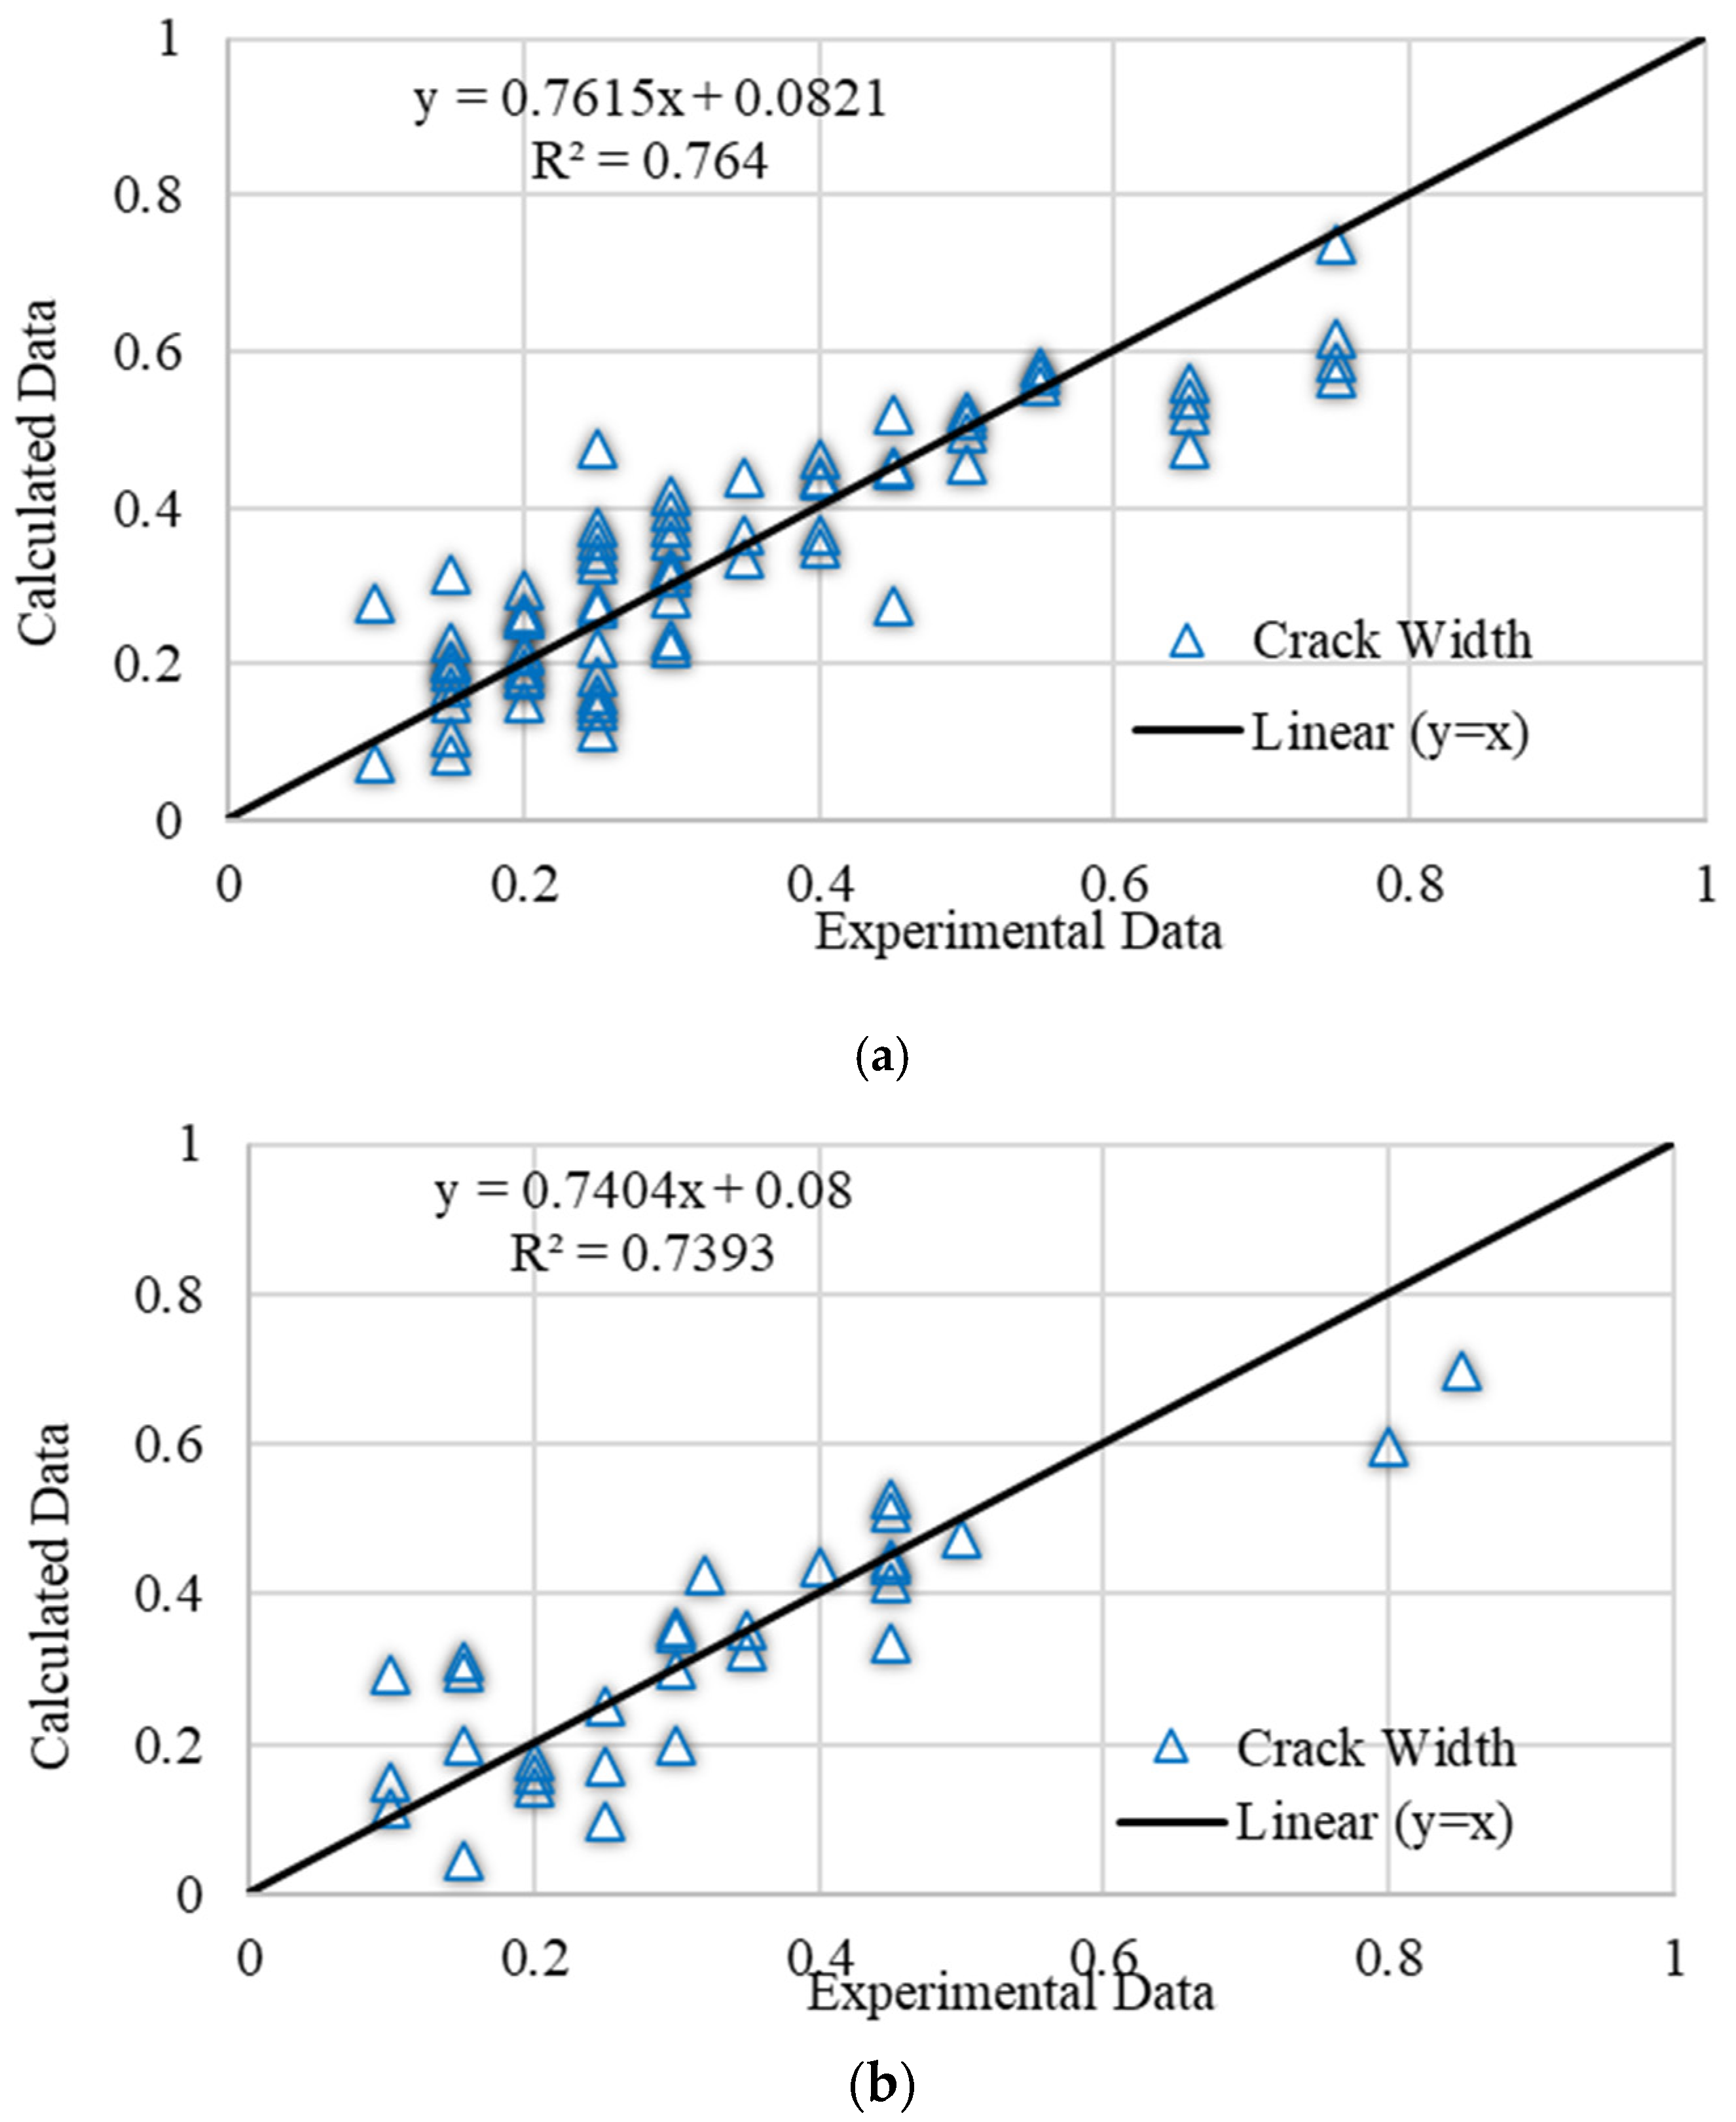
5.4. Comparison of Accuracy of Proposed GWO-ANN Model
6. Conclusions
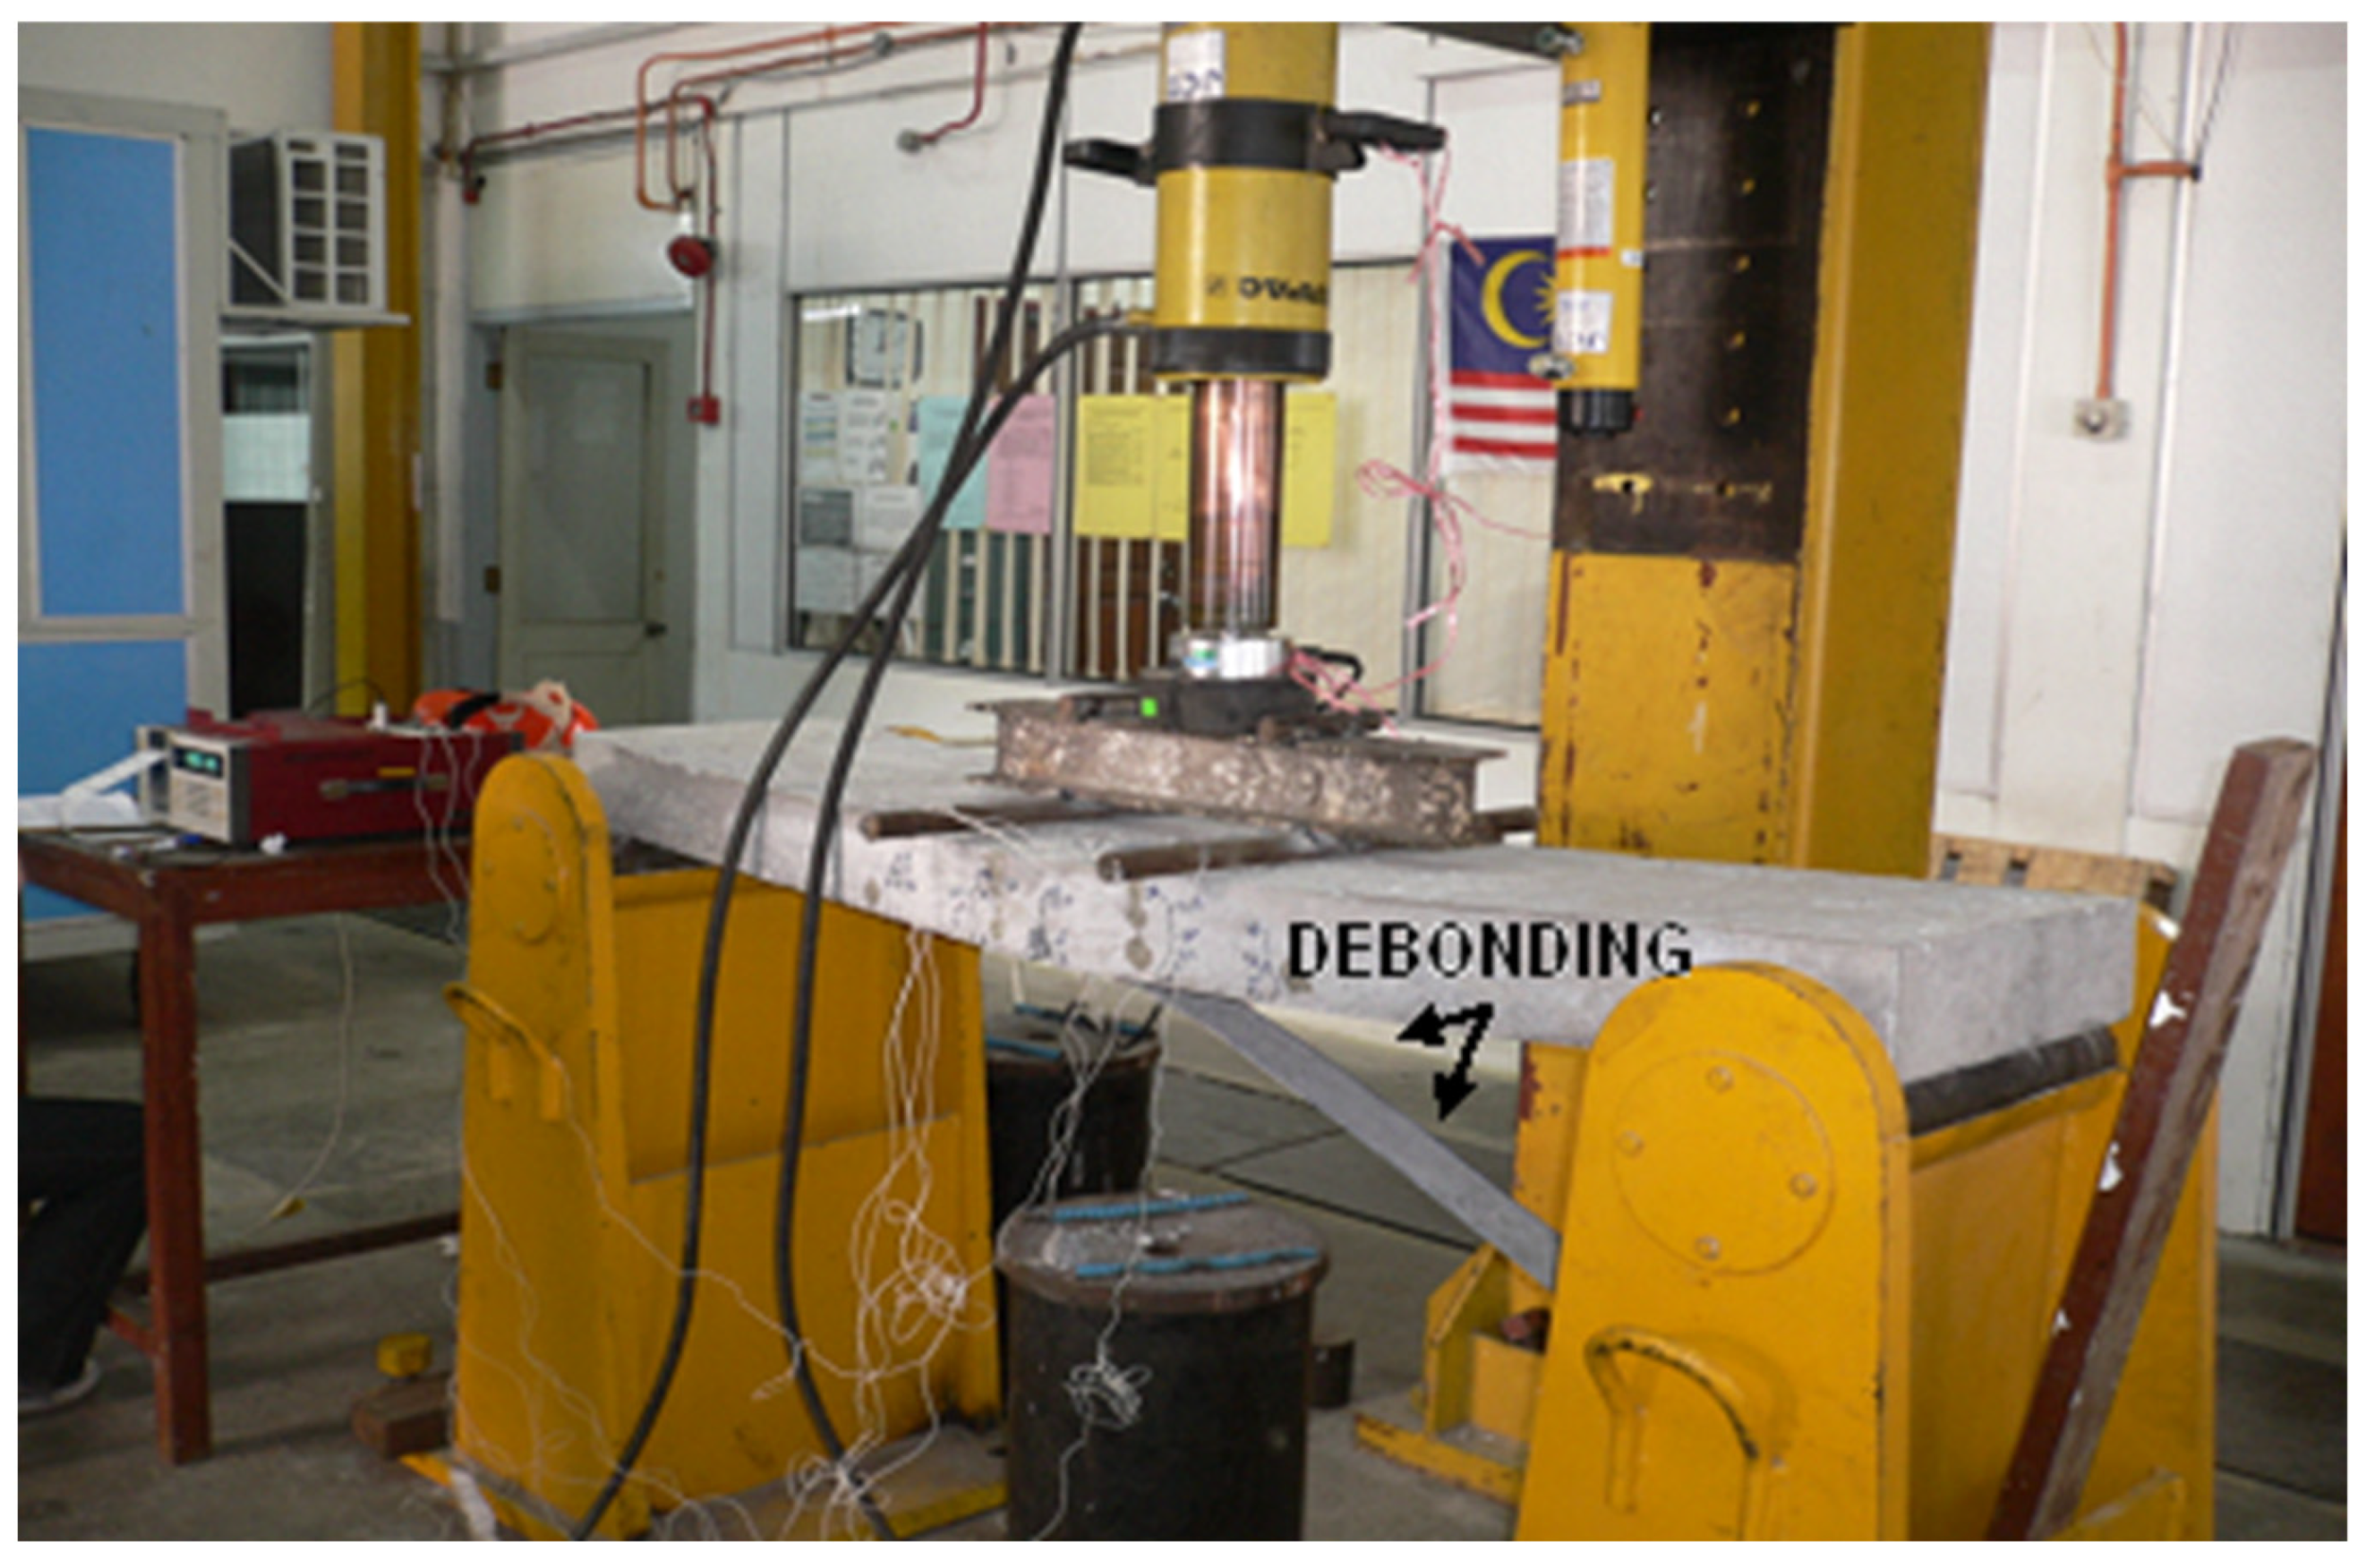
- Before steel reinforcement’s yielding, the CFRP plate was de-bonded at the CFRP/concrete contact.
- EC2 provides an unconservative estimation for the RC slabs’ crack widths when CFRP laminates are attached to the slab for strengthening purposes. This behavior can be explained by the fact that attaching the CFRP laminates to the RC slabs leads to increased stiffness and bending moment capacity of the section, which is not accounted for by the EC2 formulas and may be associated with the unconservative estimation for the crack widths.
- On average, the crack width in slabs retrofitted with CFRP laminates increased by around 80% compared to a slab without CFRP. Nevertheless, increasing the length and width of CFRP laminates had a minor effect on strength and crack development.
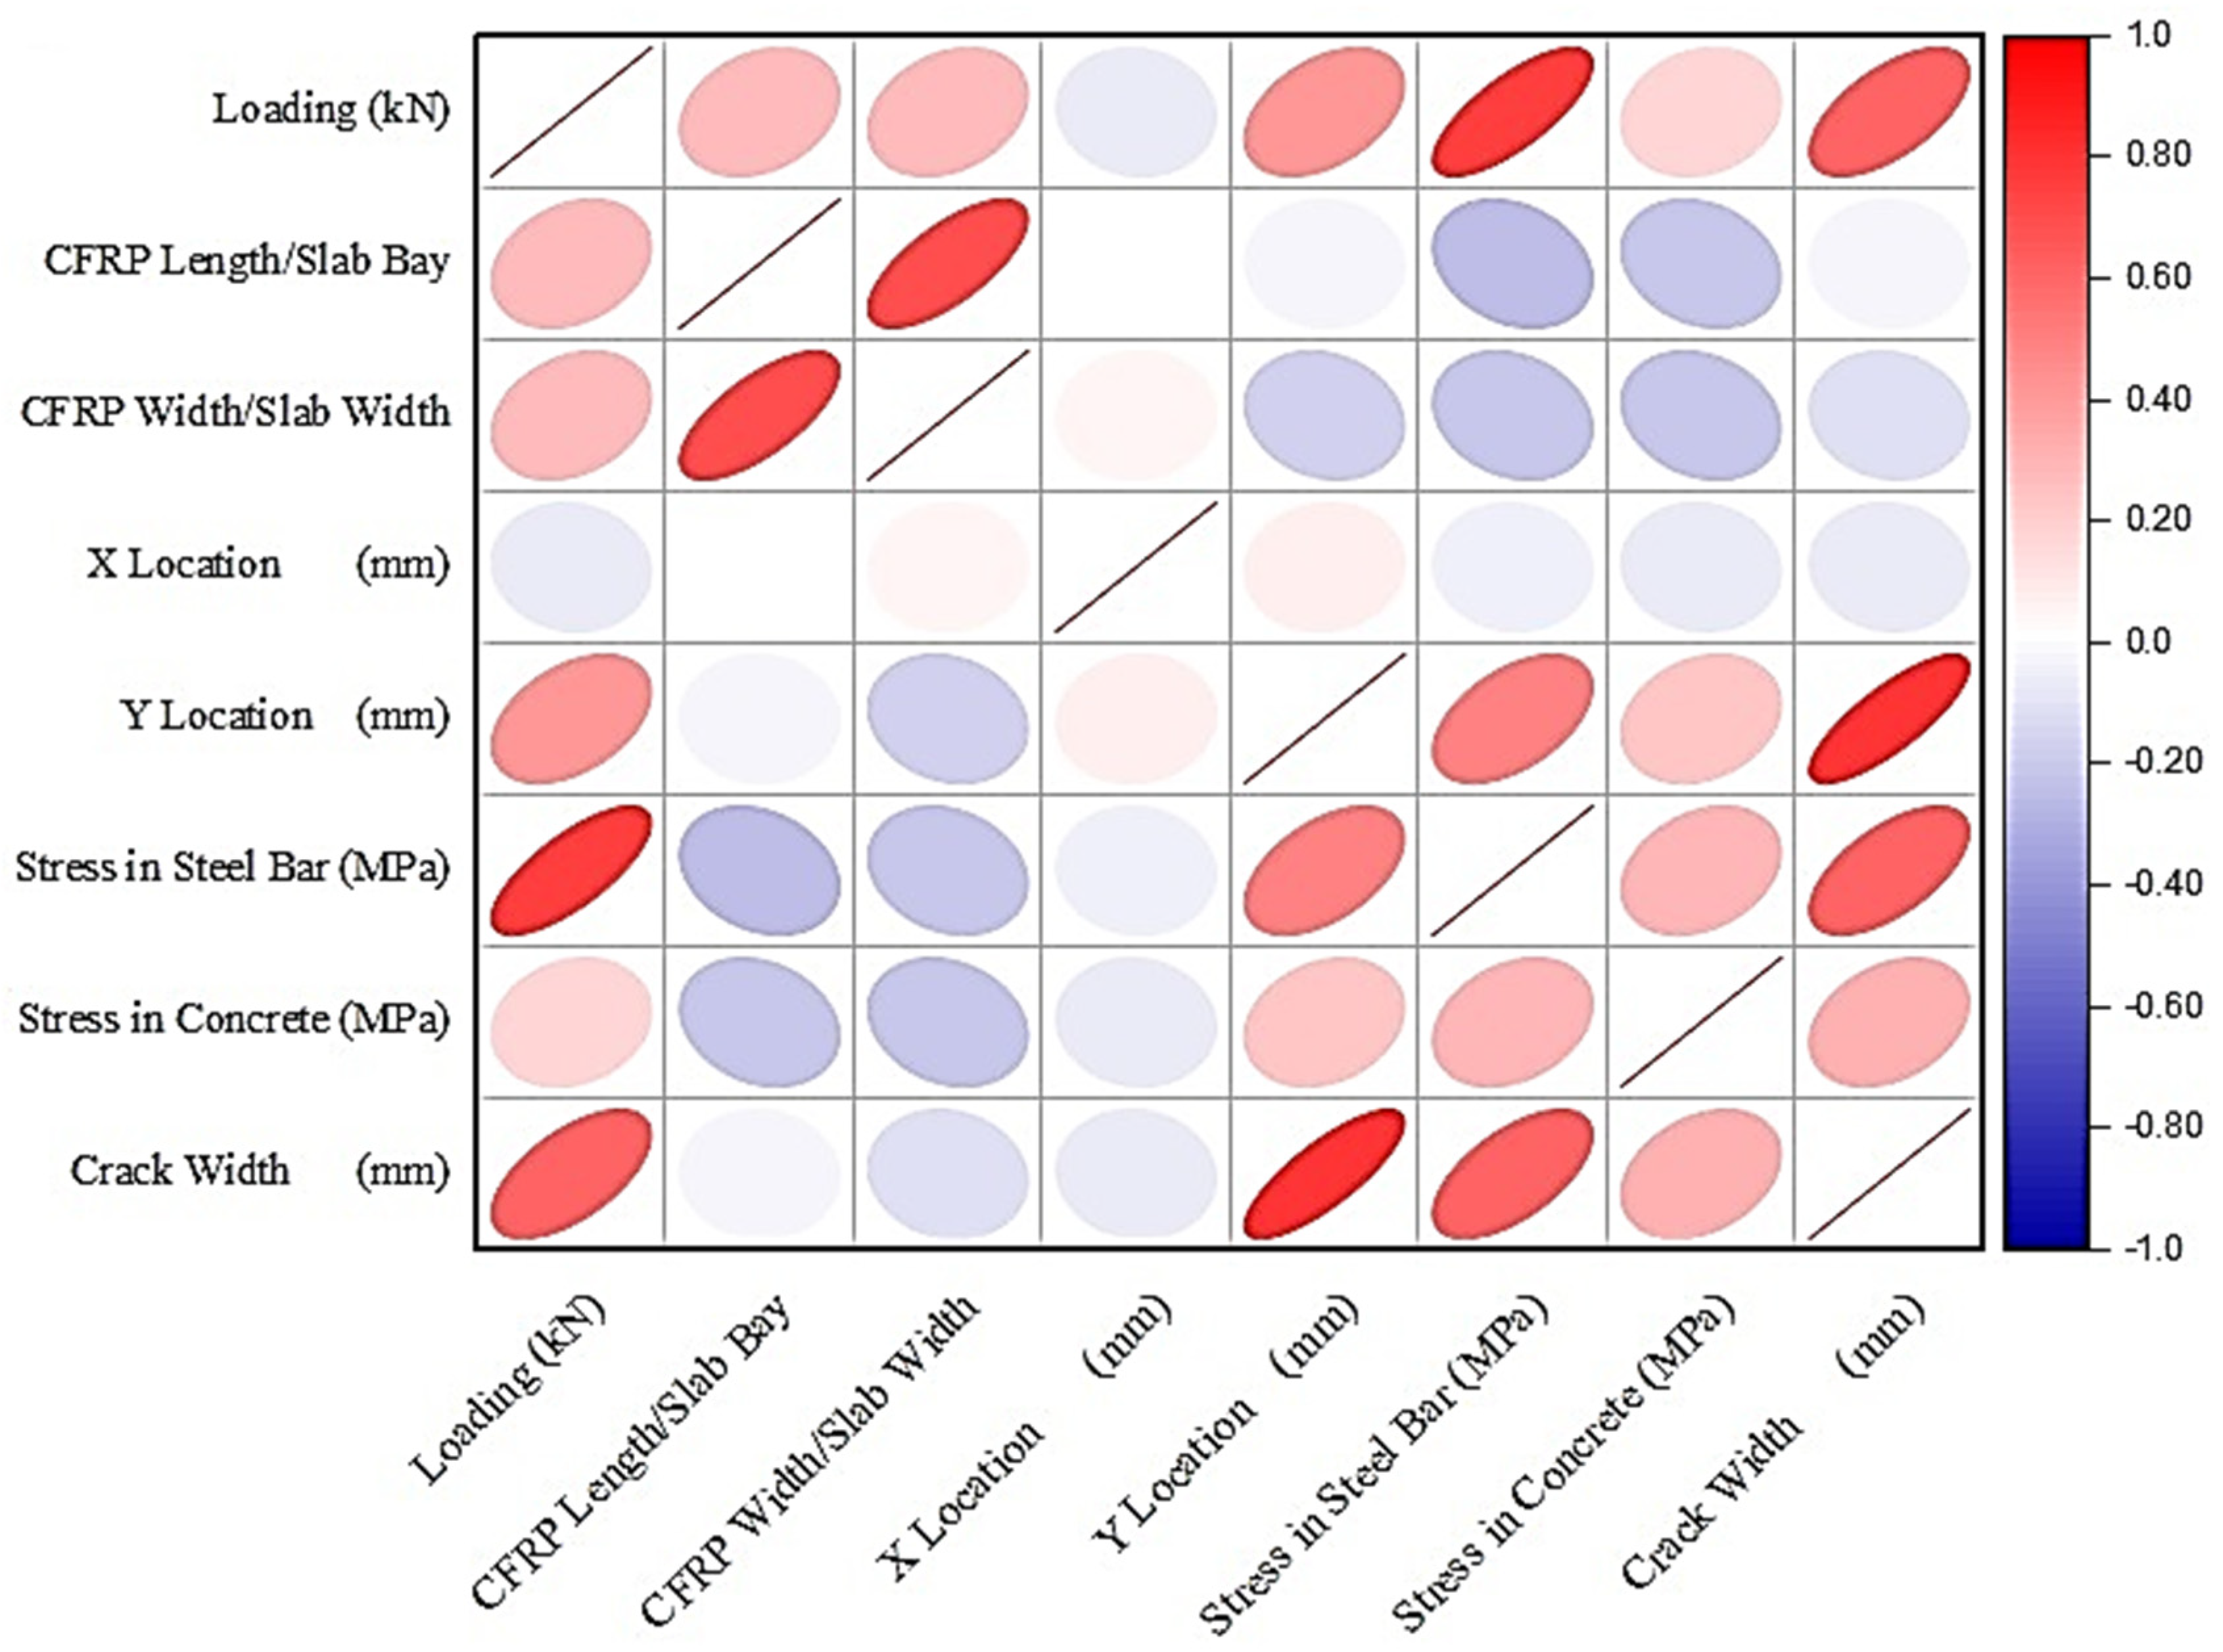
- The results confirm the higher reliability of the proposed GWO-ANN model for estimating the crack width in flat slabs compared to the multiple linear regression (MLR) model. The statistical metrics used, namely RMSE, AAE, and VAF, showed the better performance of the proposed GWO-ANN model in comparison with the MLR model. It captures the underlying mechanisms involved in the crack development of the slab. Accordingly, the proposed equation developed using the MLR model can be directly used without time-consuming analysis and computations. This empirical expression is primarily a function of the slab/CFRP geometry and the crack location.
Author Contributions
Funding
Data Availability Statement
Conflicts of Interest
Appendix A

| Input Parameters | Output | |||||||
|---|---|---|---|---|---|---|---|---|
| ID | Loading (kN) | CFRP Length/Slab Bay | CFRP Width/Slab Width | X Location (mm) | Y Location (mm) | Steel Bar Stress (MPa) | Concrete Stress (MPa) | Crack Width (mm) |
| 1 | 24 | 0.388 | 0.1 | 580 | 35 | 142.5 | 8.269 | 0.2 |
| 2 | 24 | 0.388 | 0.1 | 710 | 40 | 142.5 | 8.269 | 0.15 |
| 3 | 24 | 0.388 | 0.1 | 860 | 40 | 142.5 | 8.269 | 0.25 |
| 4 | 25 | 0.388 | 0.1 | 850 | 63 | 227.4 | 9.17 | 0.45 |
| 5 | 25 | 0.388 | 0.1 | 1160 | 35 | 227.4 | 9.17 | 0.2 |
| 6 | 25 | 0.388 | 0.1 | 480 | 75 | 227.4 | 9.17 | 0.3 |
| 7 | 25 | 0.388 | 0.1 | 550 | 85 | 227.4 | 9.17 | 0.4 |
| 8 | 28 | 0.388 | 0.1 | 700 | 70 | 303 | 10.466 | 0.3 |
| 9 | 28 | 0.388 | 0.1 | 1060 | 45 | 303 | 10.466 | 0.25 |
| 10 | 28 | 0.388 | 0.1 | 1140 | 65 | 303 | 10.466 | 0.4 |
| 11 | 32 | 0.388 | 0.1 | 1040 | 60 | 340 | 10.81 | 0.3 |
| 12 | 33 | 0.388 | 0.1 | 700 | 85 | 351 | 11.11 | 0.45 |
| 13 | 33 | 0.388 | 0.1 | 830 | 80 | 351 | 11.11 | 0.65 |
| 14 | 37 | 0.388 | 0.1 | 820 | 95 | 359 | 13.82 | 0.75 |
| 15 | 20 | 0.61 | 0.1 | 710 | 35 | 67.42 | 6.88 | 0.2 |
| 16 | 21 | 0.61 | 0.1 | 1060 | 45 | 107.5 | 7.44 | 0.15 |
| 17 | 23 | 0.61 | 0.1 | 870 | 30 | 167.7 | 8.01 | 0.25 |
| 18 | 23 | 0.61 | 0.1 | 720 | 70 | 167.7 | 8.01 | 0.3 |
| 19 | 23 | 0.61 | 0.1 | 1060 | 75 | 167.7 | 8.01 | 0.25 |
| 20 | 39 | 0.61 | 0.1 | 855 | 65 | 215 | 9.13 | 0.45 |
| 21 | 39 | 0.61 | 0.1 | 1060 | 80 | 215 | 9.13 | 0.5 |
| 22 | 39 | 0.61 | 0.1 | 735 | 85 | 215 | 9.13 | 0.55 |
| 23 | 40 | 0.61 | 0.1 | 850 | 70 | 276.3 | 10.53 | 0.5 |
| 24 | 40 | 0.61 | 0.1 | 1060 | 85 | 276.3 | 10.53 | 0.65 |
| 25 | 42 | 0.61 | 0.1 | 1060 | 95 | 366 | 10.91 | 0.8 |
| 26 | 20 | 0.83 | 0.1 | 1030 | 40 | 92.27 | 5.19 | 0.1 |
| 27 | 20 | 0.83 | 0.1 | 850 | 30 | 92.27 | 5.19 | 0.15 |
| 28 | 21 | 0.83 | 0.1 | 700 | 25 | 118.4 | 6.1 | 0.25 |
| 29 | 21 | 0.83 | 0.1 | 850 | 50 | 118.4 | 6.1 | 0.2 |
| 30 | 21 | 0.83 | 0.1 | 1050 | 50 | 118.4 | 6.1 | 0.15 |
| 31 | 29 | 0.83 | 0.1 | 700 | 40 | 187 | 8.69 | 0.3 |
| 32 | 29 | 0.83 | 0.1 | 850 | 70 | 187 | 8.69 | 0.3 |
| 33 | 29 | 0.83 | 0.1 | 1030 | 65 | 187 | 8.69 | 0.25 |
| 34 | 29 | 0.83 | 0.1 | 1160 | 60 | 187 | 8.69 | 0.15 |
| 35 | 32 | 0.83 | 0.1 | 600 | 20 | 210.7 | 9.35 | 0.25 |
| 36 | 36 | 0.83 | 0.1 | 850 | 75 | 251.26 | 10.38 | 0.45 |
| 37 | 41 | 0.83 | 0.1 | 1140 | 85 | 289.3 | 11.94 | 0.45 |
| 38 | 45.5 | 0.83 | 0.1 | 480 | 55 | 363.35 | 14.41 | 0.35 |
| 39 | 45.5 | 0.83 | 0.1 | 690 | 85 | 363.35 | 14.41 | 0.55 |
| 40 | 45.5 | 0.83 | 0.1 | 1000 | 85 | 363.35 | 14.41 | 0.75 |
| 41 | 19.5 | 0.388 | 0.16 | 1220 | 35 | 25.88 | 3.51 | 0.25 |
| 42 | 25 | 0.388 | 0.16 | 640 | 25 | 51.77 | 5.73 | 0.15 |
| 43 | 25 | 0.388 | 0.16 | 730 | 20 | 51.77 | 5.73 | 0.2 |
| 44 | 25 | 0.388 | 0.16 | 1170 | 30 | 51.77 | 5.73 | 0.25 |
| 45 | 25 | 0.388 | 0.16 | 1215 | 55 | 51.77 | 5.73 | 0.2 |
| 46 | 28 | 0.388 | 0.16 | 635 | 60 | 214.48 | 7.55 | 0.3 |
| 47 | 28 | 0.388 | 0.16 | 730 | 65 | 214.48 | 7.55 | 0.25 |
| 48 | 32 | 0.388 | 0.16 | 640 | 70 | 340.2 | 11.71 | 0.32 |
| 49 | 32 | 0.388 | 0.16 | 1170 | 45 | 340.2 | 11.71 | 0.45 |
| 50 | 32 | 0.388 | 0.16 | 1220 | 80 | 340.2 | 11.71 | 0.45 |
| 51 | 37 | 0.388 | 0.16 | 950 | 45 | 356 | 22.1 | 0.35 |
| 52 | 37 | 0.388 | 0.16 | 1170 | 85 | 356 | 0.65 | |
| 53 | 21 | 0.61 | 0.16 | 760 | 25 | 72.5 | 7.86 | 0.1 |
| 54 | 24 | 0.61 | 0.16 | 1040 | 10 | 121 | 9.21 | 0.15 |
| 55 | 29 | 0.61 | 0.16 | 680 | 20 | 176.6 | 11.42 | 0.2 |
| 56 | 29 | 0.61 | 0.16 | 860 | 30 | 176.6 | 11.42 | 0.15 |
| 57 | 29 | 0.61 | 0.16 | 1045 | 45 | 176.6 | 11.42 | 0.2 |
| 58 | 34 | 0.61 | 0.16 | 760 | 35 | 239 | 13.51 | 0.2 |
| 59 | 34 | 0.61 | 0.16 | 860 | 40 | 239 | 13.51 | 0.25 |
| 60 | 34 | 0.61 | 0.16 | 1055 | 75 | 288 | 13.51 | 0.45 |
| 61 | 39 | 0.61 | 0.16 | 300 | 10 | 288 | 15.84 | 0.2 |
| 62 | 39 | 0.61 | 0.16 | 630 | 40 | 288 | 15.84 | 0.25 |
| 63 | 39 | 0.61 | 0.16 | 775 | 75 | 288 | 15.84 | 0.5 |
| 64 | 39 | 0.61 | 0.16 | 860 | 60 | 288 | 15.84 | 0.45 |
| 65 | 39 | 0.61 | 0.16 | 1140 | 35 | 288 | 15.84 | 0.1 |
| 66 | 39 | 0.61 | 0.16 | 1385 | 45 | 288 | 15.84 | 0.15 |
| 67 | 45 | 0.61 | 0.16 | 300 | 20 | 358.8 | 15.84 | 0.3 |
| 68 | 45 | 0.61 | 0.16 | 600 | 20 | 358.8 | 18.18 | 0.25 |
| 69 | 45 | 0.61 | 0.16 | 650 | 70 | 358.8 | 18.18 | 0.5 |
| 70 | 45 | 0.61 | 0.16 | 790 | 90 | 358.8 | 18.18 | 0.75 |
| 71 | 45 | 0.61 | 0.16 | 1245 | 25 | 358.8 | 18.18 | 0.2 |
| 72 | 45 | 0.61 | 0.16 | 1385 | 60 | 358.8 | 18.18 | 0.4 |
| 73 | 21 | 0.83 | 0.16 | 760 | 20 | 75.7 | 6.83 | 0.1 |
| 74 | 21 | 0.83 | 0.16 | 1020 | 25 | 75.7 | 6.83 | 0.15 |
| 75 | 21.5 | 0.83 | 0.16 | 755 | 40 | 85.3 | 7.77 | 0.2 |
| 76 | 22 | 0.83 | 0.16 | 1035 | 30 | 115.8 | 9.38 | 0.25 |
| 77 | 28 | 0.83 | 0.16 | 760 | 55 | 149.7 | 10.45 | 0.3 |
| 78 | 28 | 0.83 | 0.16 | 1045 | 60 | 149.7 | 10.45 | 0.3 |
| 79 | 29 | 0.83 | 0.16 | 860 | 25 | 187.8 | 12.19 | 0.15 |
| 80 | 32 | 0.83 | 0.16 | 860 | 55 | 222.2 | 13.39 | 0.3 |
| 81 | 32 | 0.83 | 0.16 | 1055 | 80 | 222.2 | 13.39 | 0.4 |
| 82 | 39 | 0.83 | 0.16 | 610 | 35 | 222.2 | 14.6 | 0.1 |
| 83 | 40 | 0.83 | 0.16 | 1170 | 40 | 249 | 15.2 | 0.15 |
| 87 | 44 | 0.83 | 0.16 | 625 | 60 | 288 | 16.61 | 0.5 |
| 85 | 44 | 0.83 | 0.16 | 860 | 85 | 288 | 16.61 | 0.55 |
| 86 | 48 | 0.83 | 0.16 | 640 | 75 | 321 | 18.1 | 0.65 |
| 87 | 54 | 0.83 | 0.16 | 860 | 95 | 363 | 20.76 | 0.85 |
| 88 | 21 | 0 | 0 | 640 | 30 | 191 | 9.21 | 0.25 |
| 89 | 21 | 0 | 0 | 760 | 34 | 191 | 9.21 | 0.3 |
| 90 | 21 | 0 | 0 | 980 | 41 | 191 | 9.21 | 0.3 |
| 91 | 23 | 0 | 0 | 750 | 62 | 222 | 10.21 | 0.35 |
| 92 | 24 | 0 | 0 | 647 | 54 | 258 | 11.18 | 0.3 |
| 93 | 24 | 0 | 0 | 990 | 66 | 258 | 11.18 | 0.35 |
| 94 | 24 | 0 | 0 | 1100 | 35 | 298.8 | 13.21 | 0.15 |
| 95 | 26 | 0 | 0 | 1285 | 30 | 321.2 | 15.41 | 0.2 |
| 96 | 33 | 0 | 0 | 680 | 80 | 362 | 18.21 | 0.45 |
| 97 | 33 | 0 | 0 | 1080 | 75 | 362 | 18.21 | 0.25 |
| 98 | 33 | 0 | 0 | 1270 | 55 | 362 | 18.21 | 0.4 |
| 99 | 33 | 0 | 0 | 590 | 40 | 362 | 18.21 | 0.35 |
| 100 | 33 | 0 | 0 | 380 | 60 | 362 | 18.21 | 0.4 |
| 101 | 33.3 | 0 | 0 | 740 | 95 | 367.3 | 223.2 | 0.75 |
References
- Nawy, E.G.; Orenstein, G.S. Crack width control in reinforced concrete two-way slabs. J. Struct. Div. 1970, 96, 701–721. [Google Scholar] [CrossRef]
- Nawy, E.G. Reinforced Concrete; Prentice-Hall: Hoboken, NJ, USA, 1985; ISBN 0137716435. [Google Scholar]
- Baumann, R.A.; Weisgerber, F.E. Yield-line analysis of slabs-on-grade. J. Struct. Eng. 1983, 109, 1553–1568. [Google Scholar] [CrossRef]
- Ross, T.J.; Krawinkler, H. Impulsive direct shear failure in RC slabs. J. Struct. Eng. 1985, 111, 1661–1677. [Google Scholar] [CrossRef]
- Park, R.; Gamble, W.L. Reinforced Concrete Slabs; John Wiley & Sons: Hoboken, NJ, USA, 1999; ISBN 0471348503. [Google Scholar]
- Gergely, P.; Lutz, L.A. Maximum crack width in reinforced concrete flexural members. Spec. Publ. 1968, 20, 87–117. [Google Scholar]
- EN 1992-1-1; Eurocode 2: Design of Concrete Structures—Part 1. British Standard Institution: London, UK, 2004.
- Mosallam, A.S.; Mosalam, K.M. Strengthening of two-way concrete slabs with FRP composite laminates. Constr. Build. Mater. 2003, 17, 43–54. [Google Scholar] [CrossRef]
- El Maaddawy, T.; Soudki, K. Strengthening of reinforced concrete slabs with mechanically-anchored unbonded FRP system. Constr. Build. Mater. 2008, 22, 444–455. [Google Scholar] [CrossRef]
- Zheng, X.; Wan, B.; Huang, P.; Huang, J. Experimental study of hybrid strengthening technique using carbon fiber laminates and steel plates for reinforced concrete slabs. Constr. Build. Mater. 2019, 210, 324–337. [Google Scholar] [CrossRef]
- Chen, C.-C.; Chen, S.-L. Strengthening of reinforced concrete slab-column connections with carbon fiber reinforced polymer laminates. Appl. Sci. 2020, 10, 265. [Google Scholar] [CrossRef] [Green Version]
- Duxson, P.; Provis, J.L.; Lukey, G.C.; Van Deventer, J.S. The role of inorganic polymer technology in the development of ‘green concrete’. Cem. Concr. Res. 2007, 37, 1590–1597. [Google Scholar] [CrossRef]
- Naser, M.; Hawileh, R.; Abdalla, J. Fiber-reinforced polymer composites in strengthening reinforced concrete structures: A critical review. Eng. Struct. 2019, 198, 109542. [Google Scholar] [CrossRef]
- Abiodun, O.I.; Jantan, A.; Omolara, A.E.; Dada, K.V.; Mohamed, N.A.; Arshad, H. State-of-the-art in artificial neural network applications: A survey. Heliyon 2018, 4, e00938. [Google Scholar] [CrossRef] [PubMed]
- Pan, Y.; Zhang, L. Roles of artificial intelligence in construction engineering and management: A critical review and future trends. Autom. Constr. 2021, 122, 103517. [Google Scholar] [CrossRef]
- Lagaros, N.D.; Plevris, V. Artificial Intelligence (AI) Applied in Civil Engineering. Appl. Sci. 2022, 12, 7595. [Google Scholar] [CrossRef]
- Mangalathu, S.; Shin, H.; Choi, E.; Jeon, J.-S. Explainable machine learning models for punching shear strength estimation of flat slabs without transverse reinforcement. J. Build. Eng. 2021, 39, 102300. [Google Scholar] [CrossRef]
- Lagaros, N.D.; Papadrakakis, M. Learning improvement of neural networks used in structural optimization. Adv. Eng. Soft. 2004, 35, 9–25. [Google Scholar] [CrossRef]
- Plevris, V.; Tsiatas, G. Computational Structural Engineering: Past Achievements and Future Challenges. Front. Built Environ. 2018, 4, 21. [Google Scholar] [CrossRef]
- Kandiri, A.; Sartipi, F.; Kioumarsi, M. Predicting Compressive Strength of Concrete Containing Recycled Aggregate Using Modified ANN with Different Optimization Algorithms. Appl. Sci. 2021, 11, 485. [Google Scholar] [CrossRef]
- Dabiri, H.; Kioumarsi, M.; Kheyroddin, A.; Kandiri, A.; Sartipi, F. Compressive strength of concrete with recycled aggregate; a machine learning-based evaluation. Clean. Mater. 2022, 3, 100044. [Google Scholar] [CrossRef]
- Waris, M.I.; Mir, J.; Plevris, V.; Ahmad, A. Predicting compressive strength of CRM samples using Image processing and ANN. IOP Conf. Ser. Mater. Sci. Eng. 2020, 899, 012014. [Google Scholar] [CrossRef]
- Ahmadi, M.; Kheyroddin, A.; Dalvand, A.; Kioumarsi, M. New empirical approach for determining nominal shear capacity of steel fiber reinforced concrete beams. Constr. Build. Mater. 2020, 234, 117293. [Google Scholar] [CrossRef]
- Sharib, S.; Ahmad, N.; Plevris, V.; Ahmad, A. Prediction Models for Load Carrying Capacity of RC Wall through Neural Network. In Proceedings of the 14th ECCOMAS Thematic Conference on Evolutionary and Deterministic Methods for Design, Optimization and Control (EUROGEN 2021), 2021, ECCOMAS, Athens, Greece, 28–30 June 2021; pp. 132–142. [Google Scholar] [CrossRef]
- Yaseen, Z.M.; Deo, R.C.; Hilal, A.; Abd, A.M.; Bueno, L.C.; Salcedo-Sanz, S.; Nehdi, M.L. Predicting compressive strength of lightweight foamed concrete using extreme learning machine model. Adv. Eng. Soft. 2018, 115, 112–125. [Google Scholar] [CrossRef]
- Ahmad, A.; Plevris, V.; Khan, Q.-u.-Z. Prediction of Properties of FRP-Confined Concrete Cylinders Based on Artificial Neural Networks. Crystals 2020, 10, 811. [Google Scholar] [CrossRef]
- Solorzano, G.; Plevris, V. Design of Reinforced Concrete Isolated Footings under Axial Loading with Artificial Neural networks. In Proceedings of the 14th ECCOMAS Thematic Conference on Evolutionary and Deterministic Methods for Design, Optimization and Control (EUROGEN 2021), Athens, Greece, 28–30 June 2021; pp. 118–131. [Google Scholar]
- Papadrakakis, M.; Papadopoulos, V.; Lagaros, N.D.; Oliver, J.; Huespe, A.E.; Sanchez, P. Vulnerability analysis of large concrete dams using the continuum strong discontinuity approach and neural networks. Struct. Saf. 2008, 30, 217–235. [Google Scholar] [CrossRef]
- Imran Waris, M.; Plevris, V.; Mir, J.; Chairman, N.; Ahmad, A. An alternative approach for measuring the mechanical properties of hybrid concrete through image processing and machine learning. Constr. Build. Mater. 2022, 328, 126899. [Google Scholar] [CrossRef]
- Faridmehr, I.; Shariq, M.; Plevris, V.; Aalimahmoody, N. Novel hybrid informational model for predicting the creep and shrinkage deflection of reinforced concrete beams containing GGBFS. Neural Comput. Appl. 2022, 34, 13107–13123. [Google Scholar] [CrossRef]
- Ben Seghier, M.E.A.; Corriea, J.A.F.O.; Jafari-Asl, J.; Malekjafarian, A.; Plevris, V.; Trung, N.-T. On the modeling of the annual corrosion rate in main cables of suspension bridges using combined soft computing model and a novel nature-inspired algorithm. Neural Comput. Appl. 2021, 33, 15969–15985. [Google Scholar] [CrossRef]
- Asteris, P.G.; Plevris, V. Neural Network approximation of the masonry failure under biaxial compressive stress. In Proceedings of the 3rd South-East European Conference on Computational Mechanics (SEECCM III), Kos Island, Greece, 12–14 June 2013; pp. 584–598. [Google Scholar]
- Menna, D.W.; Genikomsou, A.S. Punching Shear Response of Concrete Slabs Strengthened with Ultrahigh-Performance Fiber-Reinforced Concrete Using Finite-Element Methods. Pract. Period. Struct. Des. Constr. 2021, 26, 04020057. [Google Scholar] [CrossRef]
- Torabian, A.; Isufi, B.; Mostofinejad, D.; Ramos, A.P. Flexural strengthening of flat slabs with FRP composites using EBR and EBROG methods. Eng. Struct. 2020, 211, 110483. [Google Scholar] [CrossRef]
- Chalot, A.; Roy, N.; Michel, L.; Ferrier, E. Mechanical behavior of a full-scale RC wall-slab connection reinforced with frp under cyclic loading. Eng. Struct. 2021, 239, 112146. [Google Scholar] [CrossRef]
- Beeby, A.W.; Narayanan, R.S.; Narayanan, R. Designers’ Handbook to Eurocode 2: Design of Concrete Structures; Thomas Telford: London, UK, 1995; ISBN 0727716689. [Google Scholar]
- Bye, G.C. Portland Cement: Composition, Production and Properties; Thomas Telford: London, UK, 1999; ISBN 0727727664. [Google Scholar]
- Bsi, B. 8110-1; Structural Use of Concrete, Code of Practice for Design and Construction, Part 1. British Standard Institution: London, UK, 1997.
- Clarke, J.; Waldron, P. The reinforcement of concrete structures with advanced composites. Struct. Eng. 1996, 74, 283–288. [Google Scholar]
- Teychenne, D.; Franklin, R.; Erntroy, H. Design of Normal Concrete Mixes; Department of the Environment: London, UK, 1975.
- Agatonovic-Kustrin, S.; Beresford, R. Basic concepts of artificial neural network (ANN) modeling and its application in pharmaceutical research. J. Pharm. Biomed. Anal. 2000, 22, 717–727. [Google Scholar] [CrossRef]
- Muro, C.; Escobedo, R.; Spector, L.; Coppinger, R. Wolf-pack (Canis lupus) hunting strategies emerge from simple rules in computational simulations. Behav. Process. 2011, 88, 192–197. [Google Scholar] [CrossRef] [PubMed]
- Mirjalili, S.; Mirjalili, S.M.; Lewis, A. Grey Wolf Optimizer. Adv. Eng. Soft. 2014, 69, 46–61. [Google Scholar] [CrossRef] [Green Version]
- Lagaros, N.D.; Plevris, V.; Kallioras, N.A. The Mosaic of Metaheuristic Algorithms in Structural Optimization. Arch. Comput. Methods Eng. 2022. [Google Scholar] [CrossRef]


| Steel Stress (fs) (MPa) | Maximum Bar Diameter (db) (mm) | Maximum Spacing—Pure Bending (mm) |
|---|---|---|
| 360 | 10 | 50 |
| 320 | 12 | 100 |
| 280 | 16 | 150 |
| 240 | 20 | 200 |
| 200 | 25 | 250 |
| 160 | 32 | 300 |
| Oxide Composition | CaO | SiO2 | Al2O3 | Fe2O3 | MgO | SO3 | K2O | Na2O | LOI |
|---|---|---|---|---|---|---|---|---|---|
| % | 63.4 | 19.8 | 5.1 | 3.1 | 2.5 | 2.4 | 1 | 0.19 | 1.8 |
| Laminate Type | Elastic Modulus [GPa] | Tensile Strength [MPa] | Failure Strain [%] |
|---|---|---|---|
| Sika CarboDur Plates | 165 | 3100 | 1.7 |
| Adhesive Type | Service Temperature | Elastic Modulus [GPa] | Tensile Strength [MPa] (7 Days Curing) | |
|---|---|---|---|---|
| Curing at +15 °C | Curing at +35 °C | |||
| Sikadur-30 | −40 °C to +45 °C (when cured at >+23 °C) | 11.2 (at +23 °C) | 24–27 | 26–31 |
| Test and Its Relevant Standards | Specimens and Size | Age of Testing (Day) |
|---|---|---|
| Compressive strength BS EN 12390-3:2002 | Cubes of 100 mm | 7 and 28 |
| Splitting tensile strength BS EN 1390-6:2000 | Cylinder of 150 mm diameter × 300 mm height | 28 |
| Modules of elasticity BS EN 1881-121:1983 | Cylinder of 150 mm diameter × 300 mm height | 28 |
| Slab Code | Slump (mm) | Compressive Strength (MPa) | Tensile Strength (MPa) | Modulus of Elasticity (MPa) |
|---|---|---|---|---|
| S512-700 | 40 | 46 | 6.8 | 25,842 |
| S512-1100 | 41 | 47 | 5.5 | 28,101 |
| S512-1500 | 44 | 42 | 6.3 | 25,963 |
| S812-700 | 46 | 41 | 5.9 | 26,028 |
| S812-1100 | 44 | 47 | 5.7 | 24,567 |
| S812-1500 | 40 | 49 | 6.8 | 26,789 |
| WCFRP | 42 | 46 | 6.4 | 23,879 |
| Mean Value | 45 | 6.2 | 25,880 | |
| Slab Code | CFRP Width (mm) | CFRP Length (mm) |
|---|---|---|
| S512-700 | 50 | 700 |
| S512-1100 | 50 | 1100 |
| S512-1500 | 50 | 1500 |
| S812-700 | 80 | 700 |
| S812-1100 | 80 | 1100 |
| S812-1500 | 80 | 1500 |
| WCFRP * | - | - |
| Slab | First Crack | Ultimate Stage | |||||
|---|---|---|---|---|---|---|---|
| Ex-Load (kN) | Ex-Moment (kN∙m) | Anal-Moment (kN∙m) | Ex-Load (kN) | Ex-Moment (kN∙m) | Ex-Crack Width (mm) | EC2-Crack Width (mm) | |
| S512-700 | 7.5 | 4.9 | 5.26 | 37 | 12 | 0.75 | 0.27 |
| S512-1100 | 10 | 6.5 | 5.26 | 42 | 13.7 | 0.80 | 0.27 |
| S512-1500 | 10 | 6.5 | 5.26 | 45.5 | 14.78 | 0.78 | 0.27 |
| S812-700 | 9.5 | 6.2 | 5.45 | 37 | 12.07 | 0.86 | 0.27 |
| S812-1100 | 10.3 | 6.7 | 5.45 | 45 | 14.62 | 0.89 | 0.27 |
| S812-1500 | 10.5 | 6.8 | 5.45 | 54 | 17.87 | 0.95 | 0.27 |
| WCFRP | 7 | 4.6 | 4.93 | 33.3 | 10.8 | 0.45 | 0.27 |
| S512-700 | S512-1100 | ||||||
|---|---|---|---|---|---|---|---|
| Loading (kN) | Location (mm) | Crack Width (mm) | Loading (kN) | Location (mm) | Crack Width (mm) | ||
| X | Y | X | Y | ||||
| 24 | 580 | 35 | 0.20 | 20 | 710 | 35 | 0.20 |
| 24 | 710 | 40 | 0.15 | 21 | 1060 | 45 | 0.15 |
| 24 | 860 | 40 | 0.25 | 23 | 870 | 30 | 0.25 |
| 25 | 850 | 63 | 0.45 | 23 | 720 | 70 | 0.30 |
| 25 | 1160 | 35 | 0.20 | 23 | 1060 | 75 | 0.25 |
| 25 | 480 | 75 | 0.30 | 39 | 855 | 65 | 0.45 |
| 25 | 550 | 85 | 0.40 | 39 | 1060 | 80 | 0.50 |
| 28 | 700 | 70 | 0.30 | 39 | 735 | 85 | 0.55 |
| 28 | 1060 | 45 | 0.25 | 40 | 850 | 70 | 0.50 |
| 28 | 1140 | 65 | 0.40 | 40 | 1060 | 85 | 0.65 |
| 32 | 1040 | 60 | 0.30 | 42 | 1060 | 95 | 0.80 |
| 33 | 700 | 85 | 0.45 | - | - | - | - |
| 33 | 830 | 80 | 0.65 | - | - | - | - |
| 37 | 820 | 95 | 0.75 | - | - | - | - |
| - | - | - | - | - | - | - | - |
| S512-1500 | S812-700 | ||||||
|---|---|---|---|---|---|---|---|
| Loading (kN) | Location (mm) | Crack Width (mm) | Loading (kN) | Location (mm) | Crack Width (mm) | ||
| X | Y | X | Y | ||||
| 20 | 1030 | 40 | 0.10 | 19.5 | 1220 | 35 | 0.25 |
| 20 | 850 | 30 | 0.15 | 25 | 640 | 25 | 0.15 |
| 21 | 700 | 25 | 0.25 | 25 | 730 | 20 | 0.20 |
| 21 | 850 | 50 | 0.20 | 25 | 1170 | 30 | 0.25 |
| 21 | 1050 | 50 | 0.15 | 25 | 1215 | 55 | 0.20 |
| 29 | 700 | 40 | 0.30 | 28 | 635 | 60 | 0.30 |
| 29 | 850 | 70 | 0.30 | 28 | 730 | 65 | 0.25 |
| 29 | 1030 | 65 | 0.25 | 32 | 640 | 70 | 0.32 |
| 29 | 1160 | 60 | 0.15 | 32 | 1170 | 45 | 0.45 |
| 32 | 600 | 20 | 0.25 | 32 | 1220 | 80 | 0.45 |
| 36 | 850 | 75 | 0.45 | 37 | 950 | 45 | 0.35 |
| 41 | 1140 | 85 | 0.45 | 37 | 1170 | 85 | 0.65 |
| 45.5 | 480 | 55 | 0.35 | 19.5 | 1220 | 35 | 0.25 |
| S812-1100 | S812-1500 | ||||||
|---|---|---|---|---|---|---|---|
| Loading (kN) | Location (mm) | Crack Width (mm) | Loading (kN) | Location (mm) | Crack Width (mm) | ||
| X | Y | X | Y | ||||
| 21 | 760 | 25 | 0.10 | 21 | 760 | 20 | 0.10 |
| 24 | 1040 | 10 | 0.15 | 21 | 1020 | 25 | 0.15 |
| 29 | 680 | 20 | 0.20 | 21.5 | 755 | 40 | 0.20 |
| 29 | 860 | 30 | 0.15 | 22 | 1035 | 30 | 0.25 |
| 29 | 1045 | 45 | 0.20 | 28 | 760 | 55 | 0.30 |
| 34 | 760 | 35 | 0.20 | 28 | 1045 | 60 | 0.30 |
| 34 | 860 | 40 | 0.25 | 29 | 860 | 25 | 0.15 |
| 34 | 1055 | 75 | 0.45 | 32 | 860 | 55 | 0.30 |
| 39 | 300 | 10 | 0.20 | 32 | 1055 | 80 | 0.40 |
| 39 | 630 | 40 | 0.25 | 39 | 610 | 35 | 0.10 |
| 39 | 775 | 75 | 0.50 | 40 | 1170 | 40 | 0.15 |
| 39 | 860 | 60 | 0.45 | 44 | 625 | 60 | 0.50 |
| 39 | 1140 | 35 | 0.10 | 44 | 860 | 85 | 0.55 |
| Statistical Parameters | Unit | Type | Max | Min | STD | Average |
|---|---|---|---|---|---|---|
| Loading | (kN) | Input | 54.0 | 19.5 | 8.3 | 31.4 |
| CFRP Length/Slab Bay | - | Input | 0.8 | 0.0 | 0.3 | 0.5 |
| CFRP Width/Slab Width | - | Input | 0.2 | 0.0 | 0.1 | 0.1 |
| X Location | mm | Input | 1385.0 | 300.0 | 233.1 | 870.5 |
| Y Location | mm | Input | 95.0 | 10.0 | 22.7 | 53.7 |
| Stress in Steel Bar | MPa | Input | 367.3 | 25.9 | 98.5 | 236.7 |
| Stress in Concrete | MPa | Input | 22.32 | 3.5 | 21.5 | 13.7 |
| Crack Width | mm | Output | 0.9 | 0.1 | 0.2 | 0.3 |
| Topology | Train | Test | ||||
|---|---|---|---|---|---|---|
| RMSE | AAE | VAF% | RMSE | AAE | VAF% | |
| GWO-ANN 2L(7-4) | 0.05 | 0.15 | 91% | 0.06 | 0.20 | 89% |
| GWO-ANN 2L(4-5) | 0.08 | 0.24 | 78% | 0.10 | 0.36 | 68% |
| GWO-ANN 2L(3-4) | 0.06 | 0.19 | 86% | 0.09 | 0.29 | 77% |
| Parameter | Value |
|---|---|
| Max generations | 300 |
| Search agents | 10 |
| Topology | Train | Test | ||||
|---|---|---|---|---|---|---|
| RMSE | AAE | VAF% | RMSE | AAE | VAF% | |
| MLR | 0.08 | 0.24 | 76% | 0.09 | 0.32 | 74% |
Publisher’s Note: MDPI stays neutral with regard to jurisdictional claims in published maps and institutional affiliations. |
© 2022 by the authors. Licensee MDPI, Basel, Switzerland. This article is an open access article distributed under the terms and conditions of the Creative Commons Attribution (CC BY) license (https://creativecommons.org/licenses/by/4.0/).
Share and Cite
Razavi Tosee, S.V.; Faridmehr, I.; Nehdi, M.L.; Plevris, V.; Valerievich, K.A. Predicting Crack Width in CFRP-Strengthened RC One-Way Slabs Using Hybrid Grey Wolf Optimizer Neural Network Model. Buildings 2022, 12, 1870. https://doi.org/10.3390/buildings12111870
Razavi Tosee SV, Faridmehr I, Nehdi ML, Plevris V, Valerievich KA. Predicting Crack Width in CFRP-Strengthened RC One-Way Slabs Using Hybrid Grey Wolf Optimizer Neural Network Model. Buildings. 2022; 12(11):1870. https://doi.org/10.3390/buildings12111870
Chicago/Turabian StyleRazavi Tosee, Seyed Vahid, Iman Faridmehr, Moncef L. Nehdi, Vagelis Plevris, and Kiyanets A. Valerievich. 2022. "Predicting Crack Width in CFRP-Strengthened RC One-Way Slabs Using Hybrid Grey Wolf Optimizer Neural Network Model" Buildings 12, no. 11: 1870. https://doi.org/10.3390/buildings12111870