
Progressive Collapse Resistance of RC Beam–Slab Substructures Made with Rubberized Concrete

 , , ,
, , ,  ,
,
Abstract
:1. Introduction
2. Previous Experimental Study
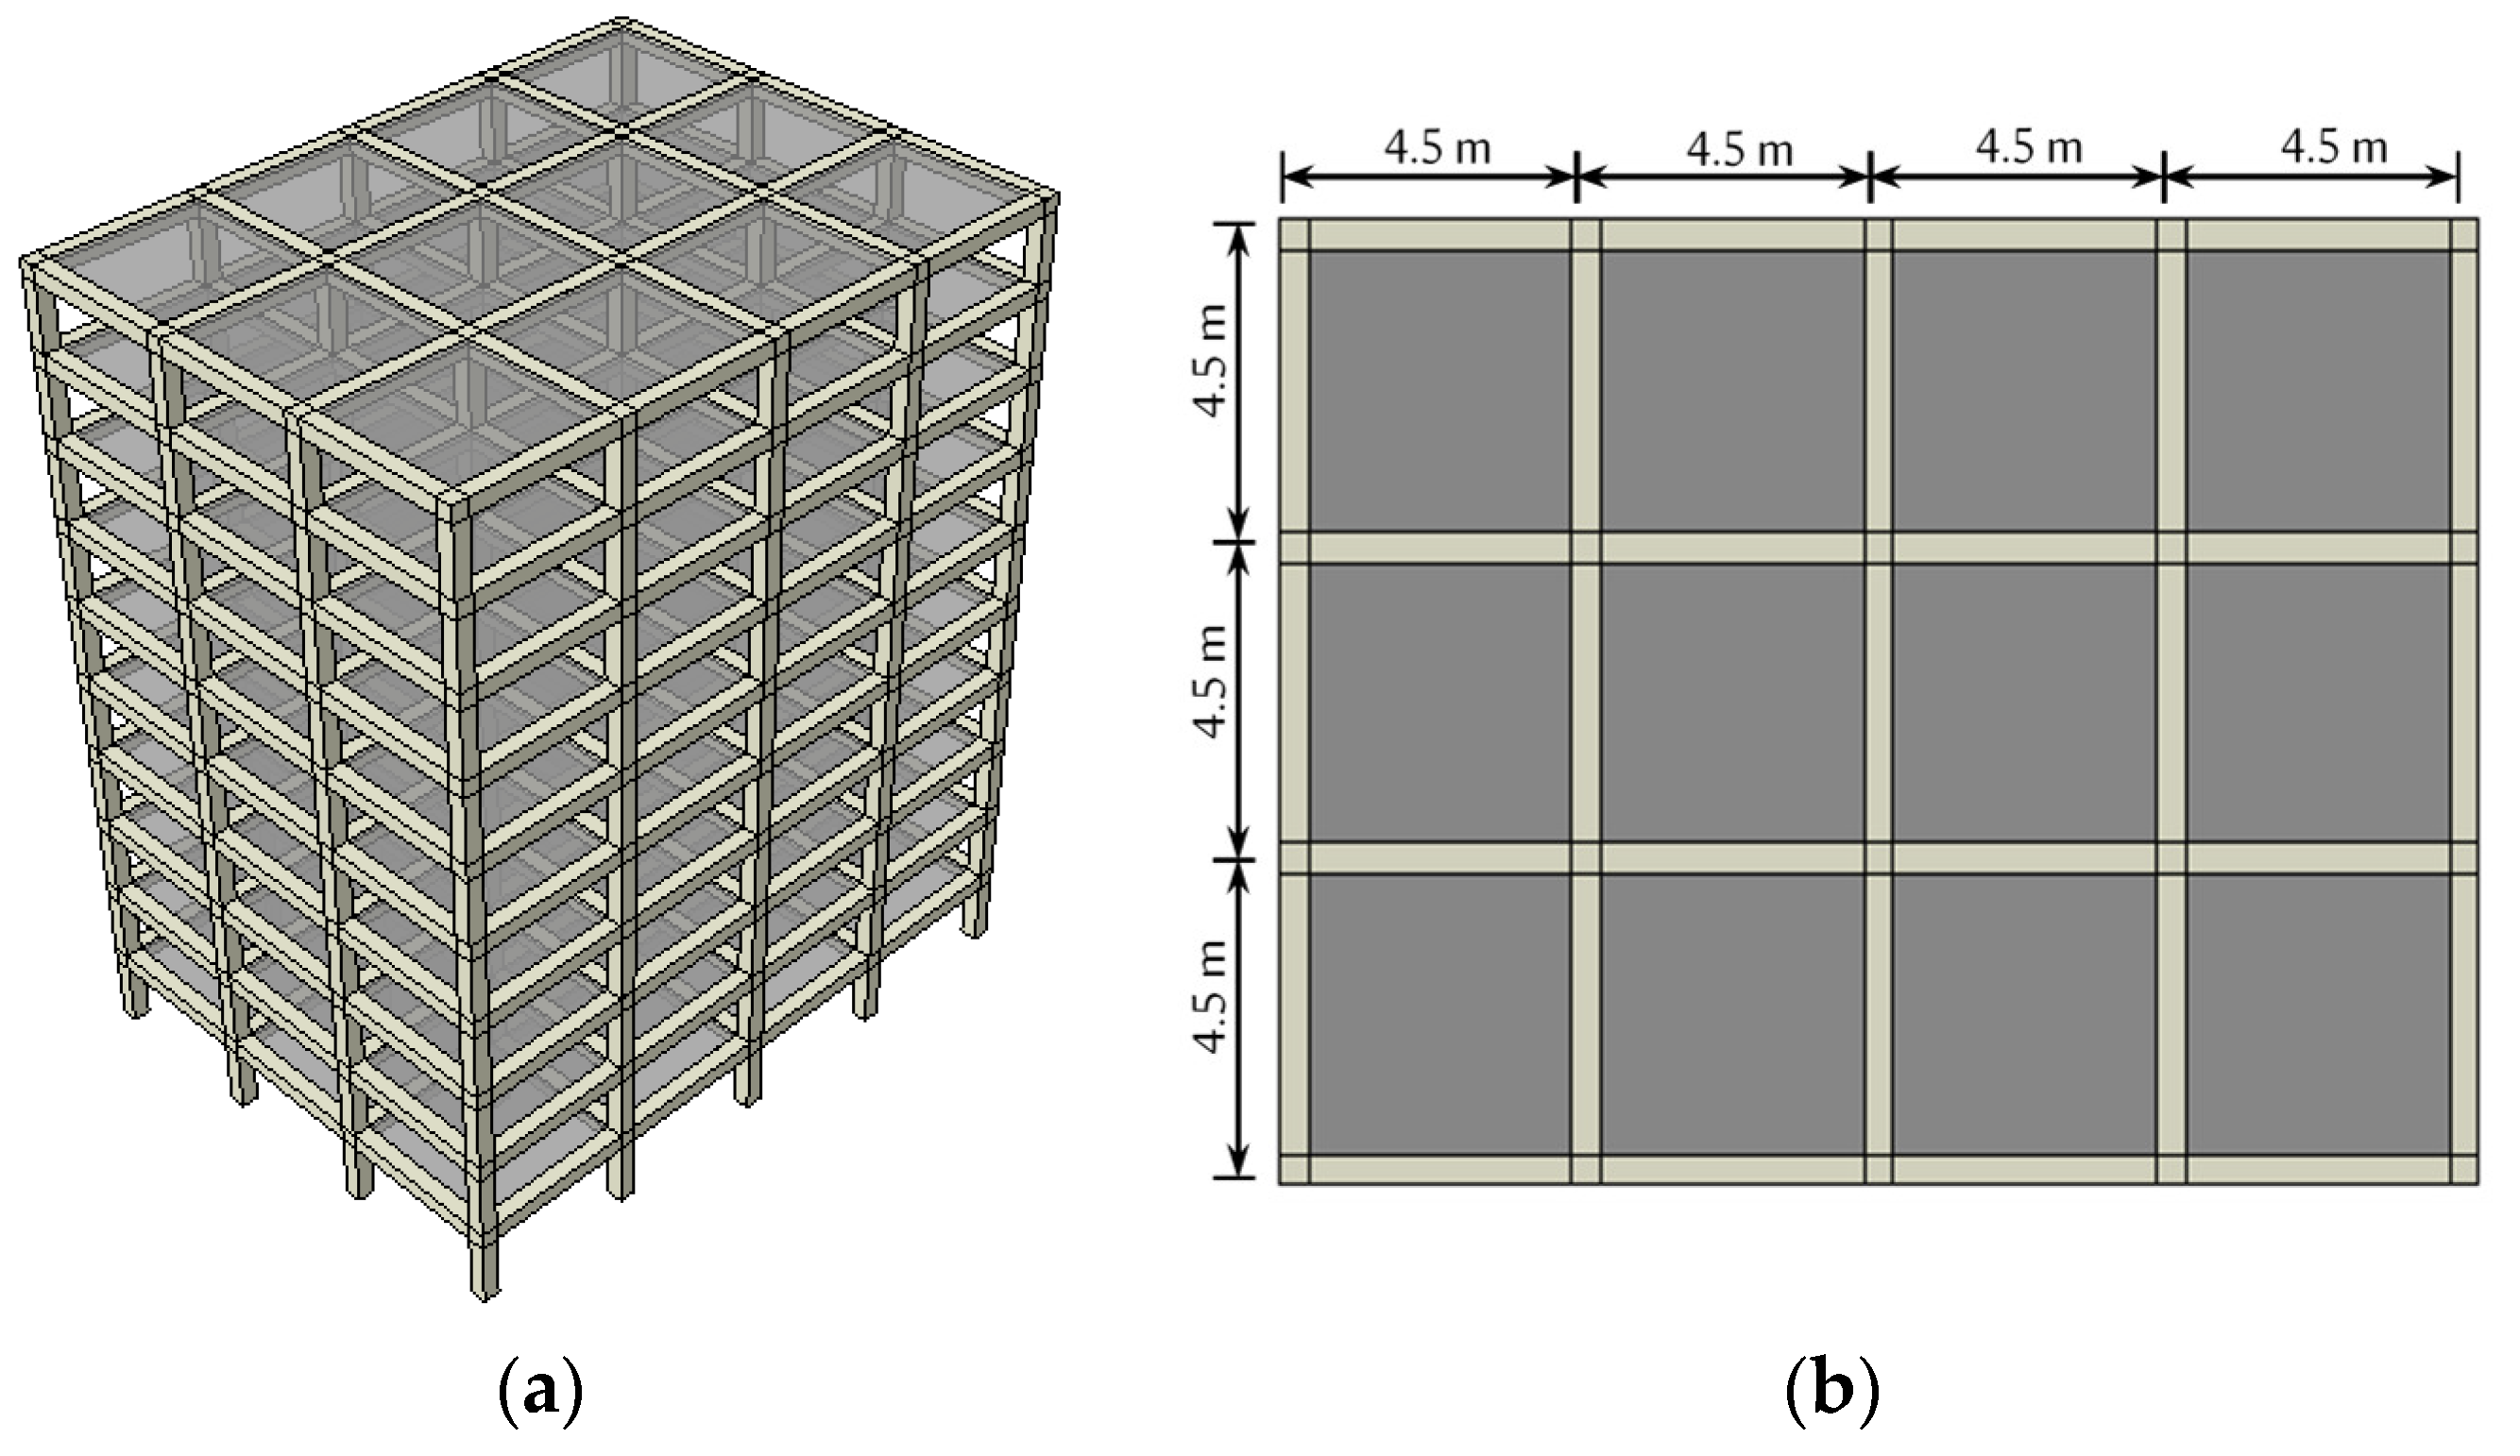
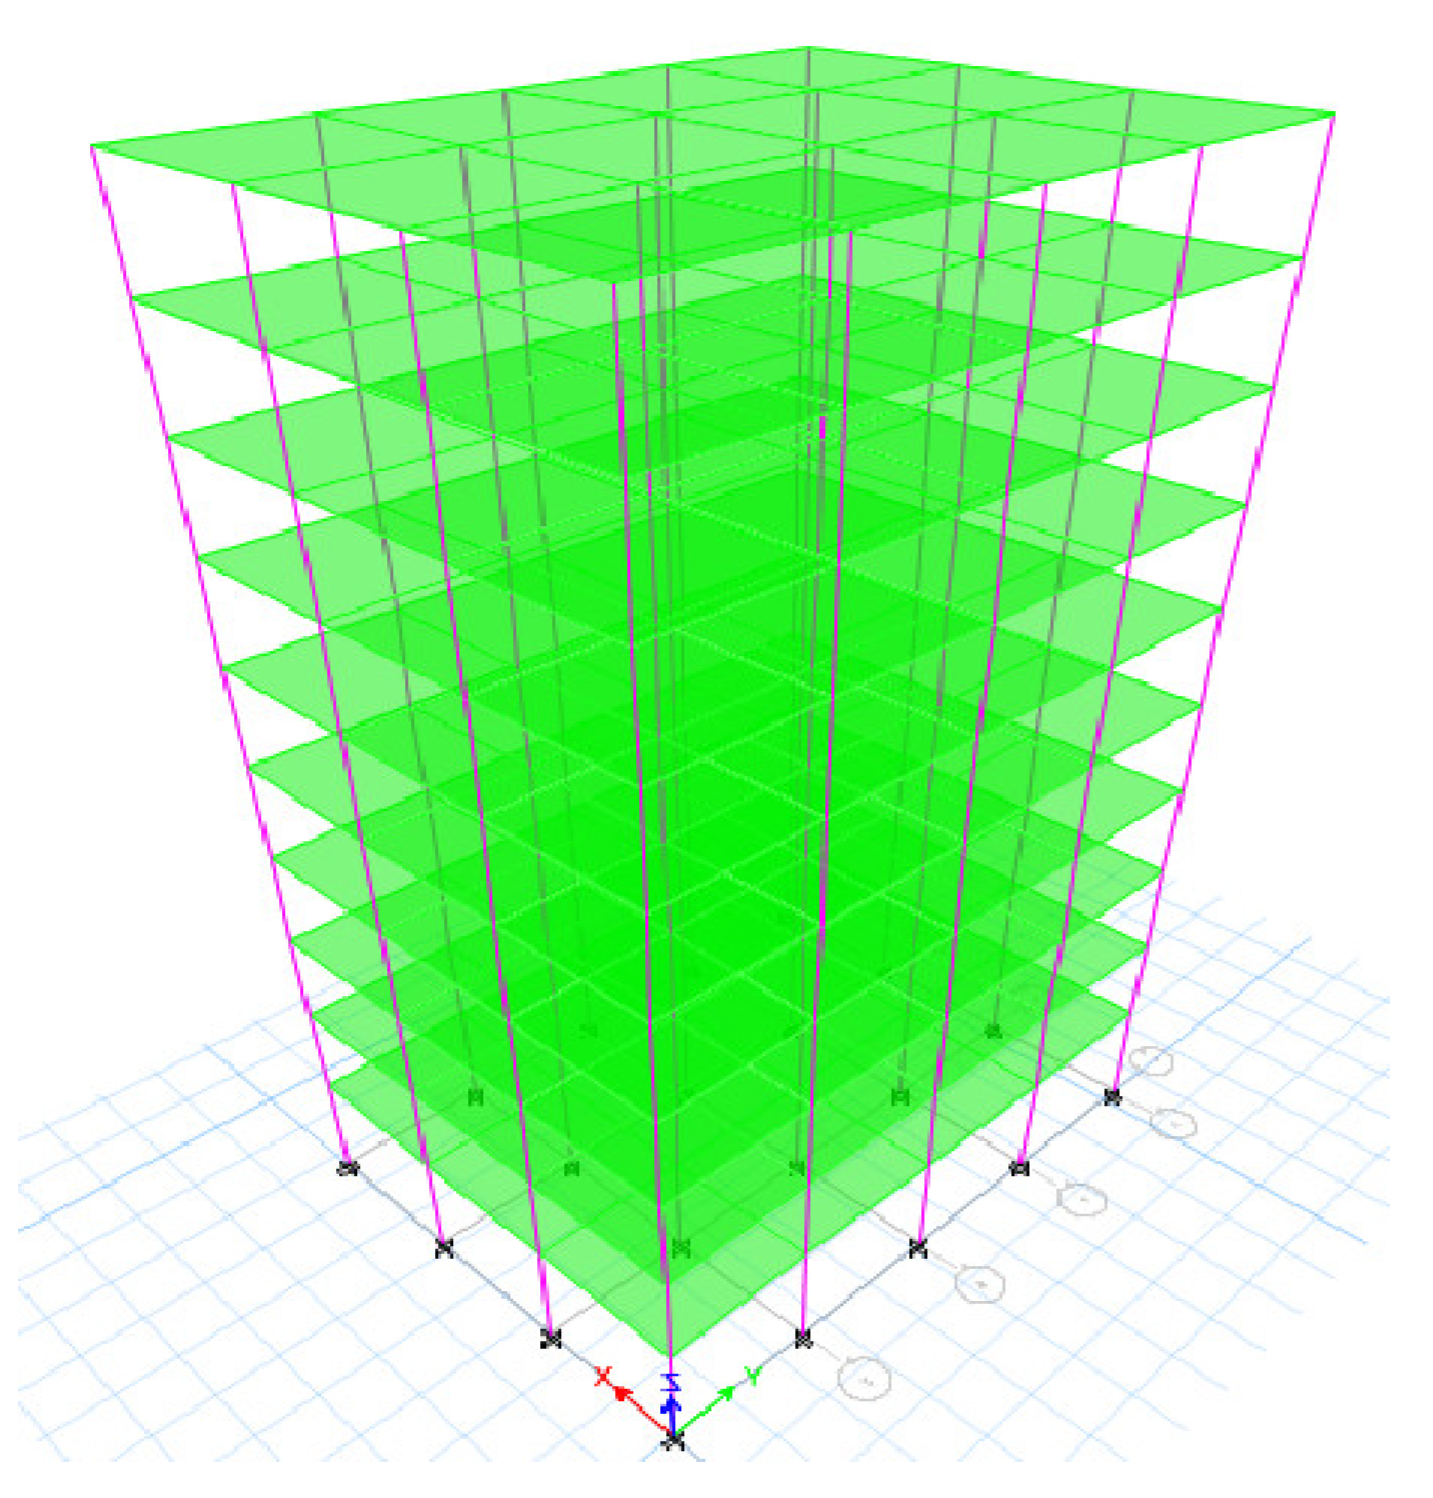
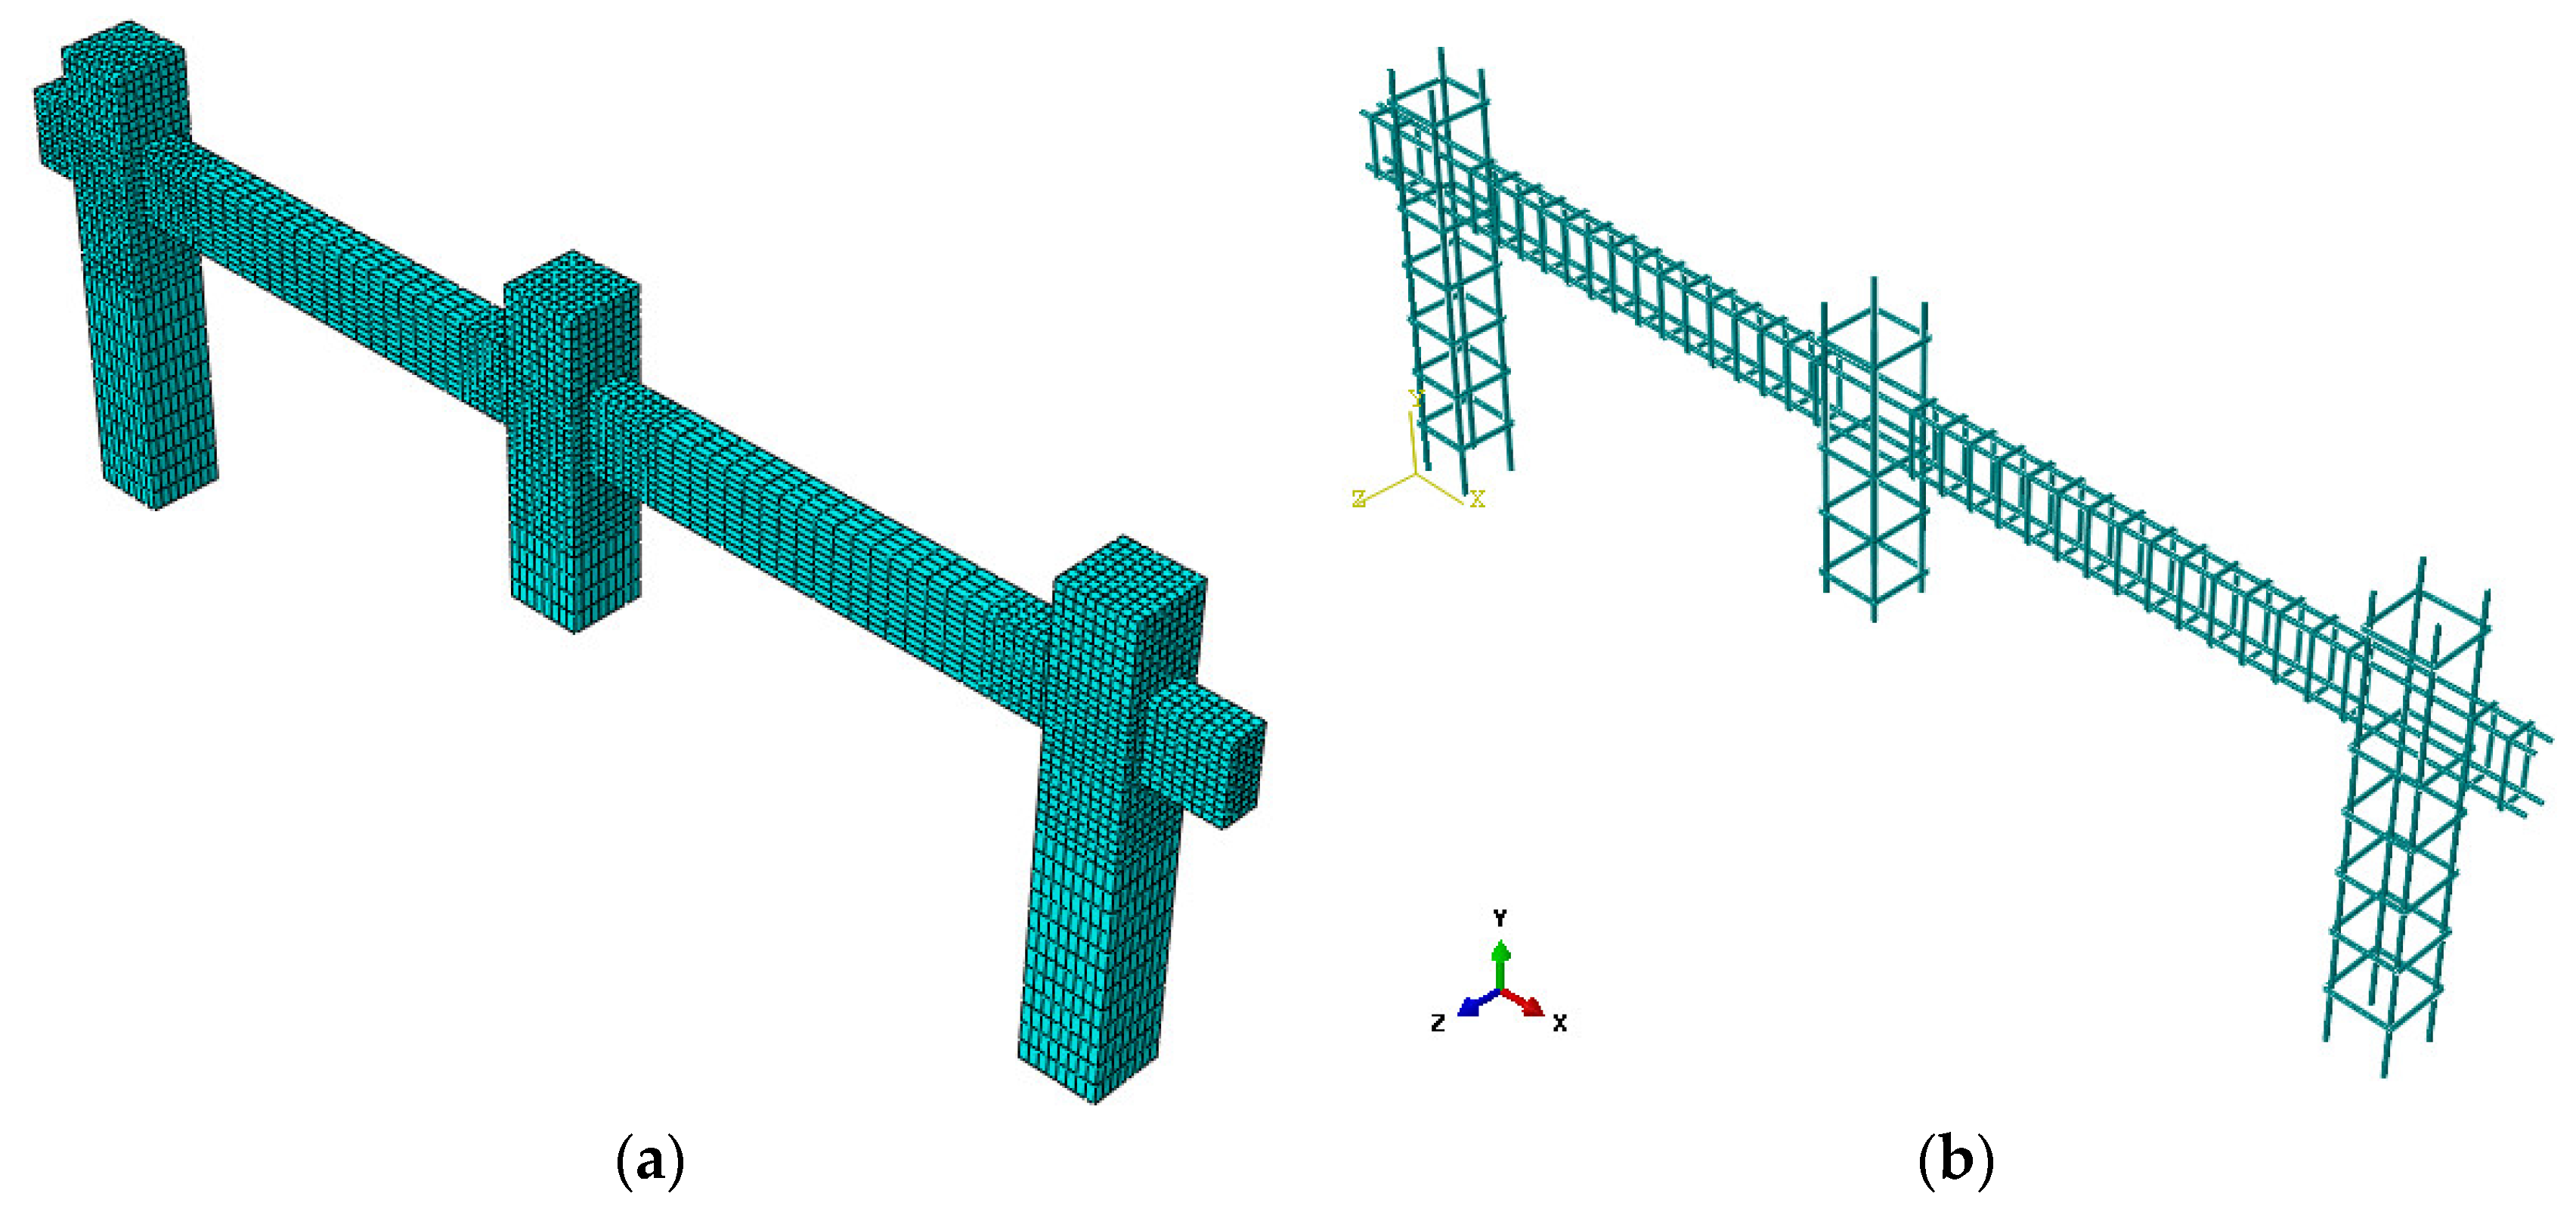
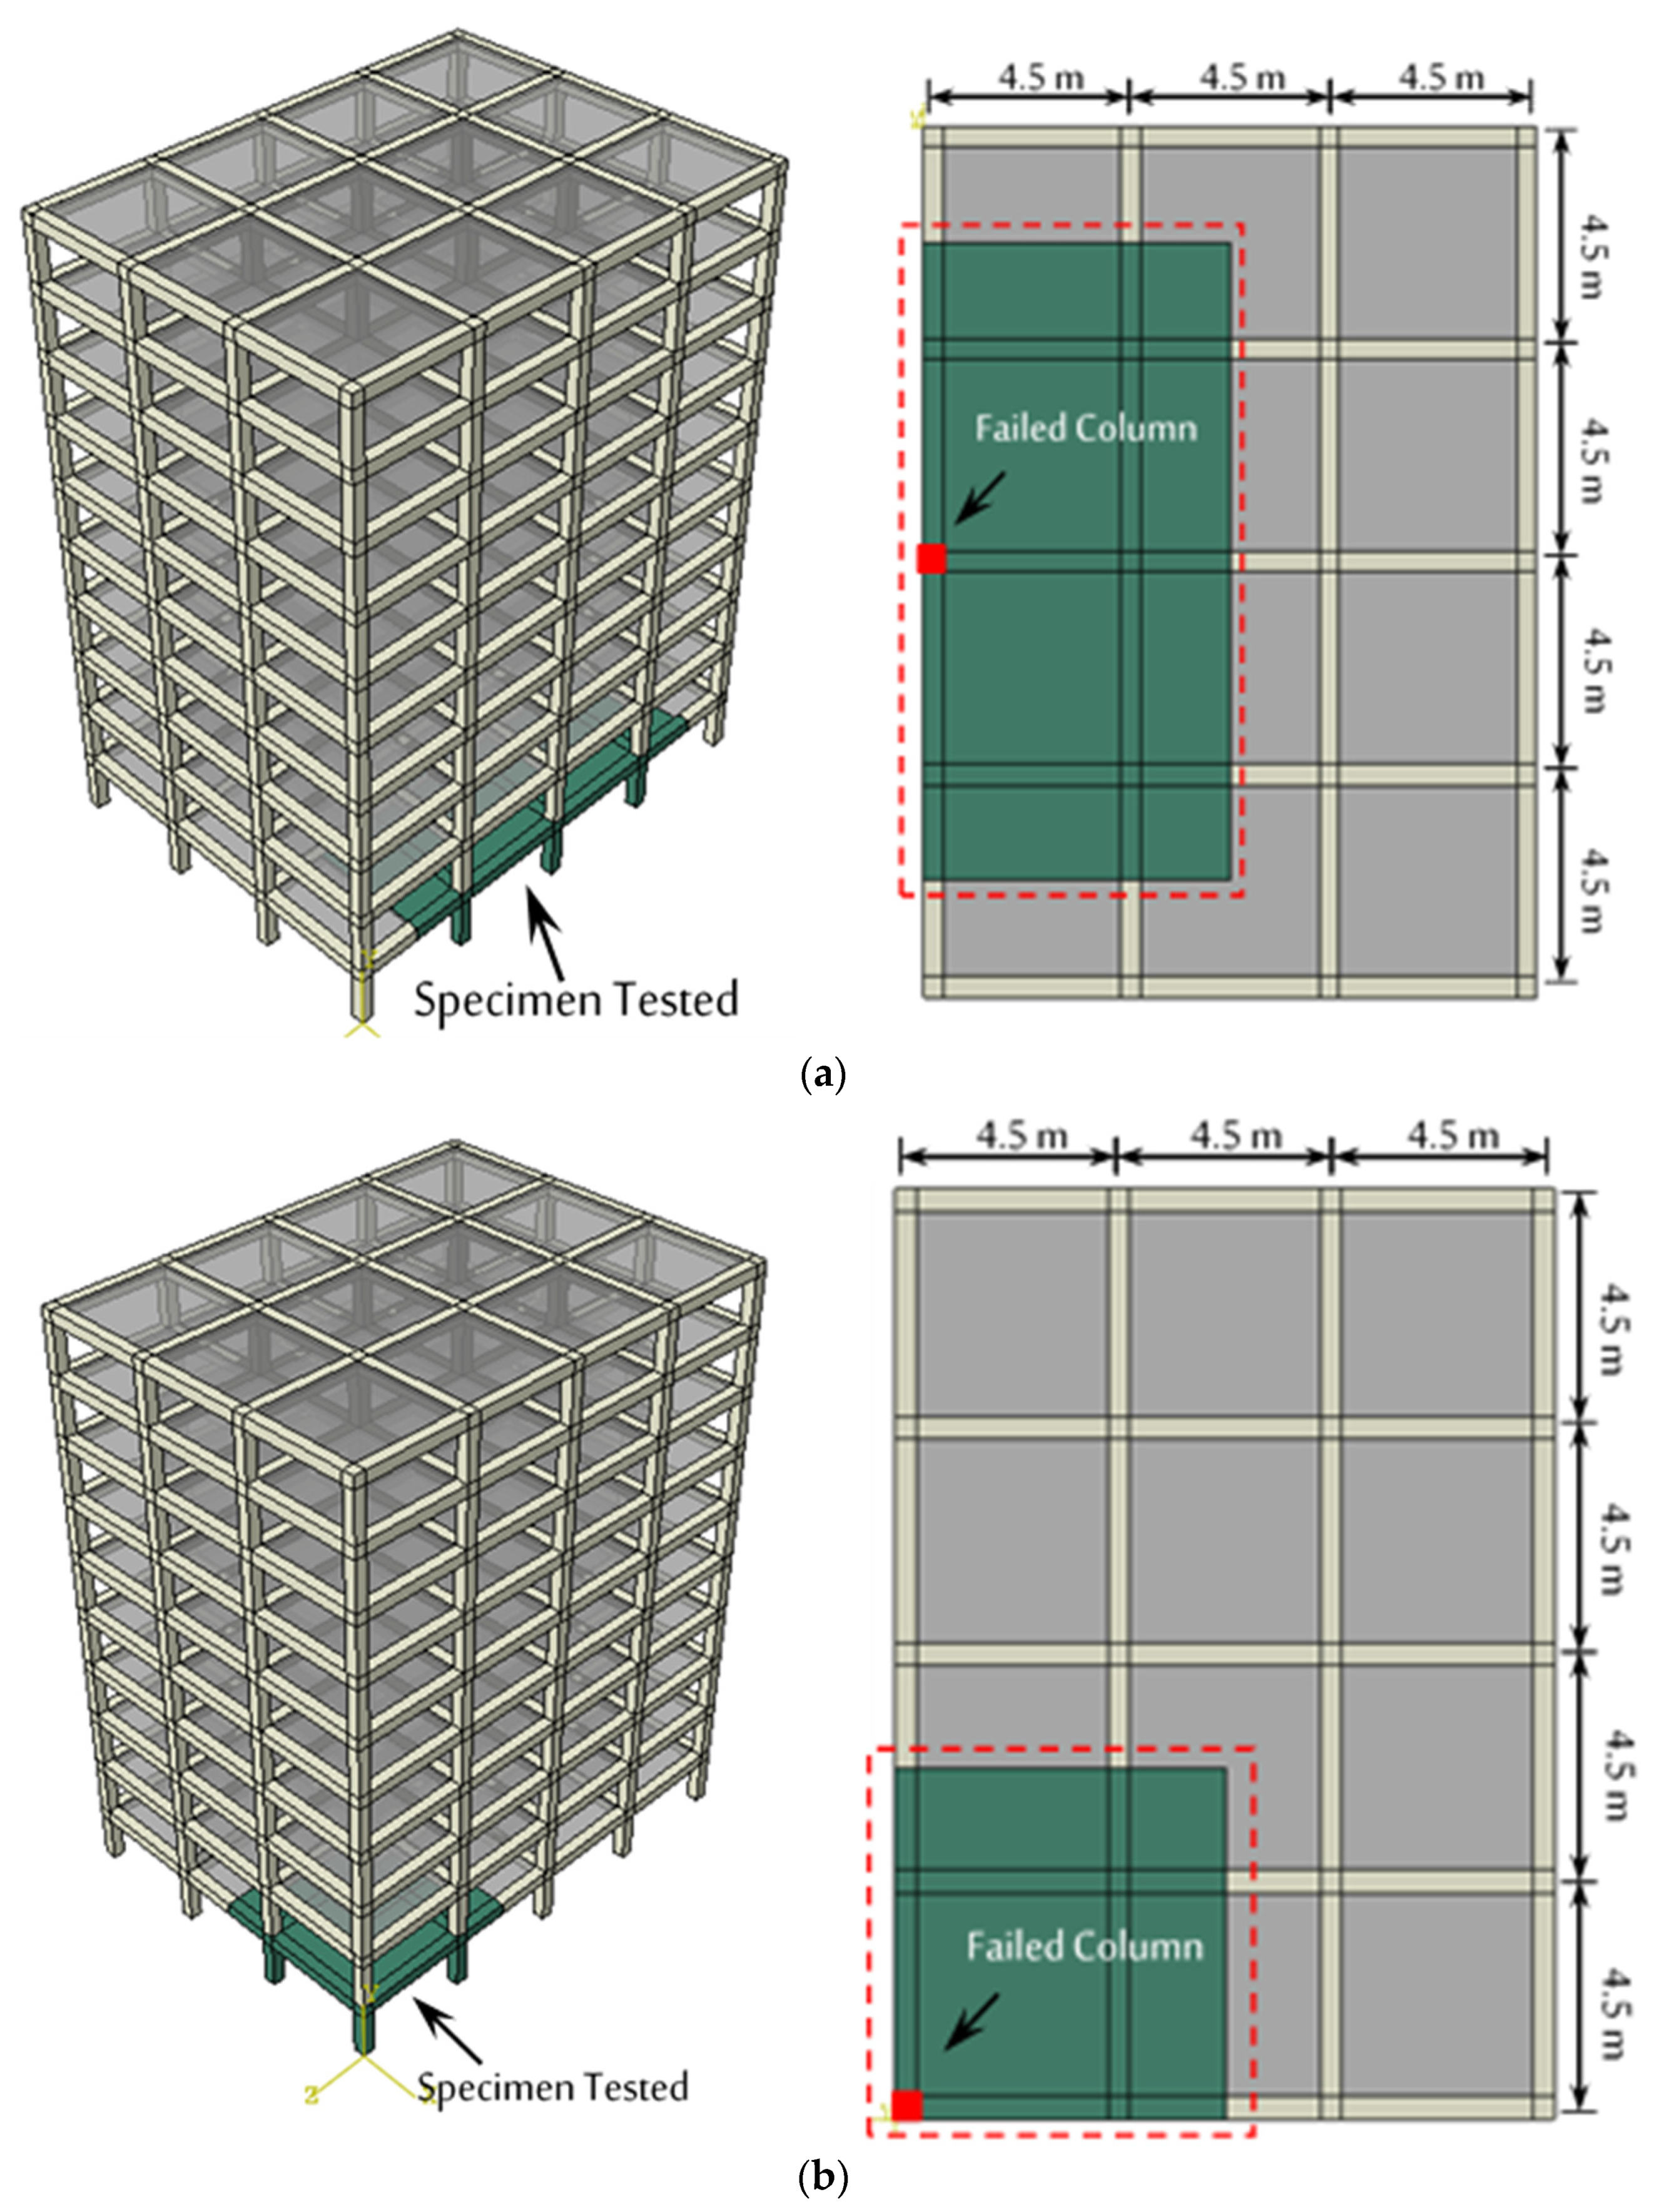
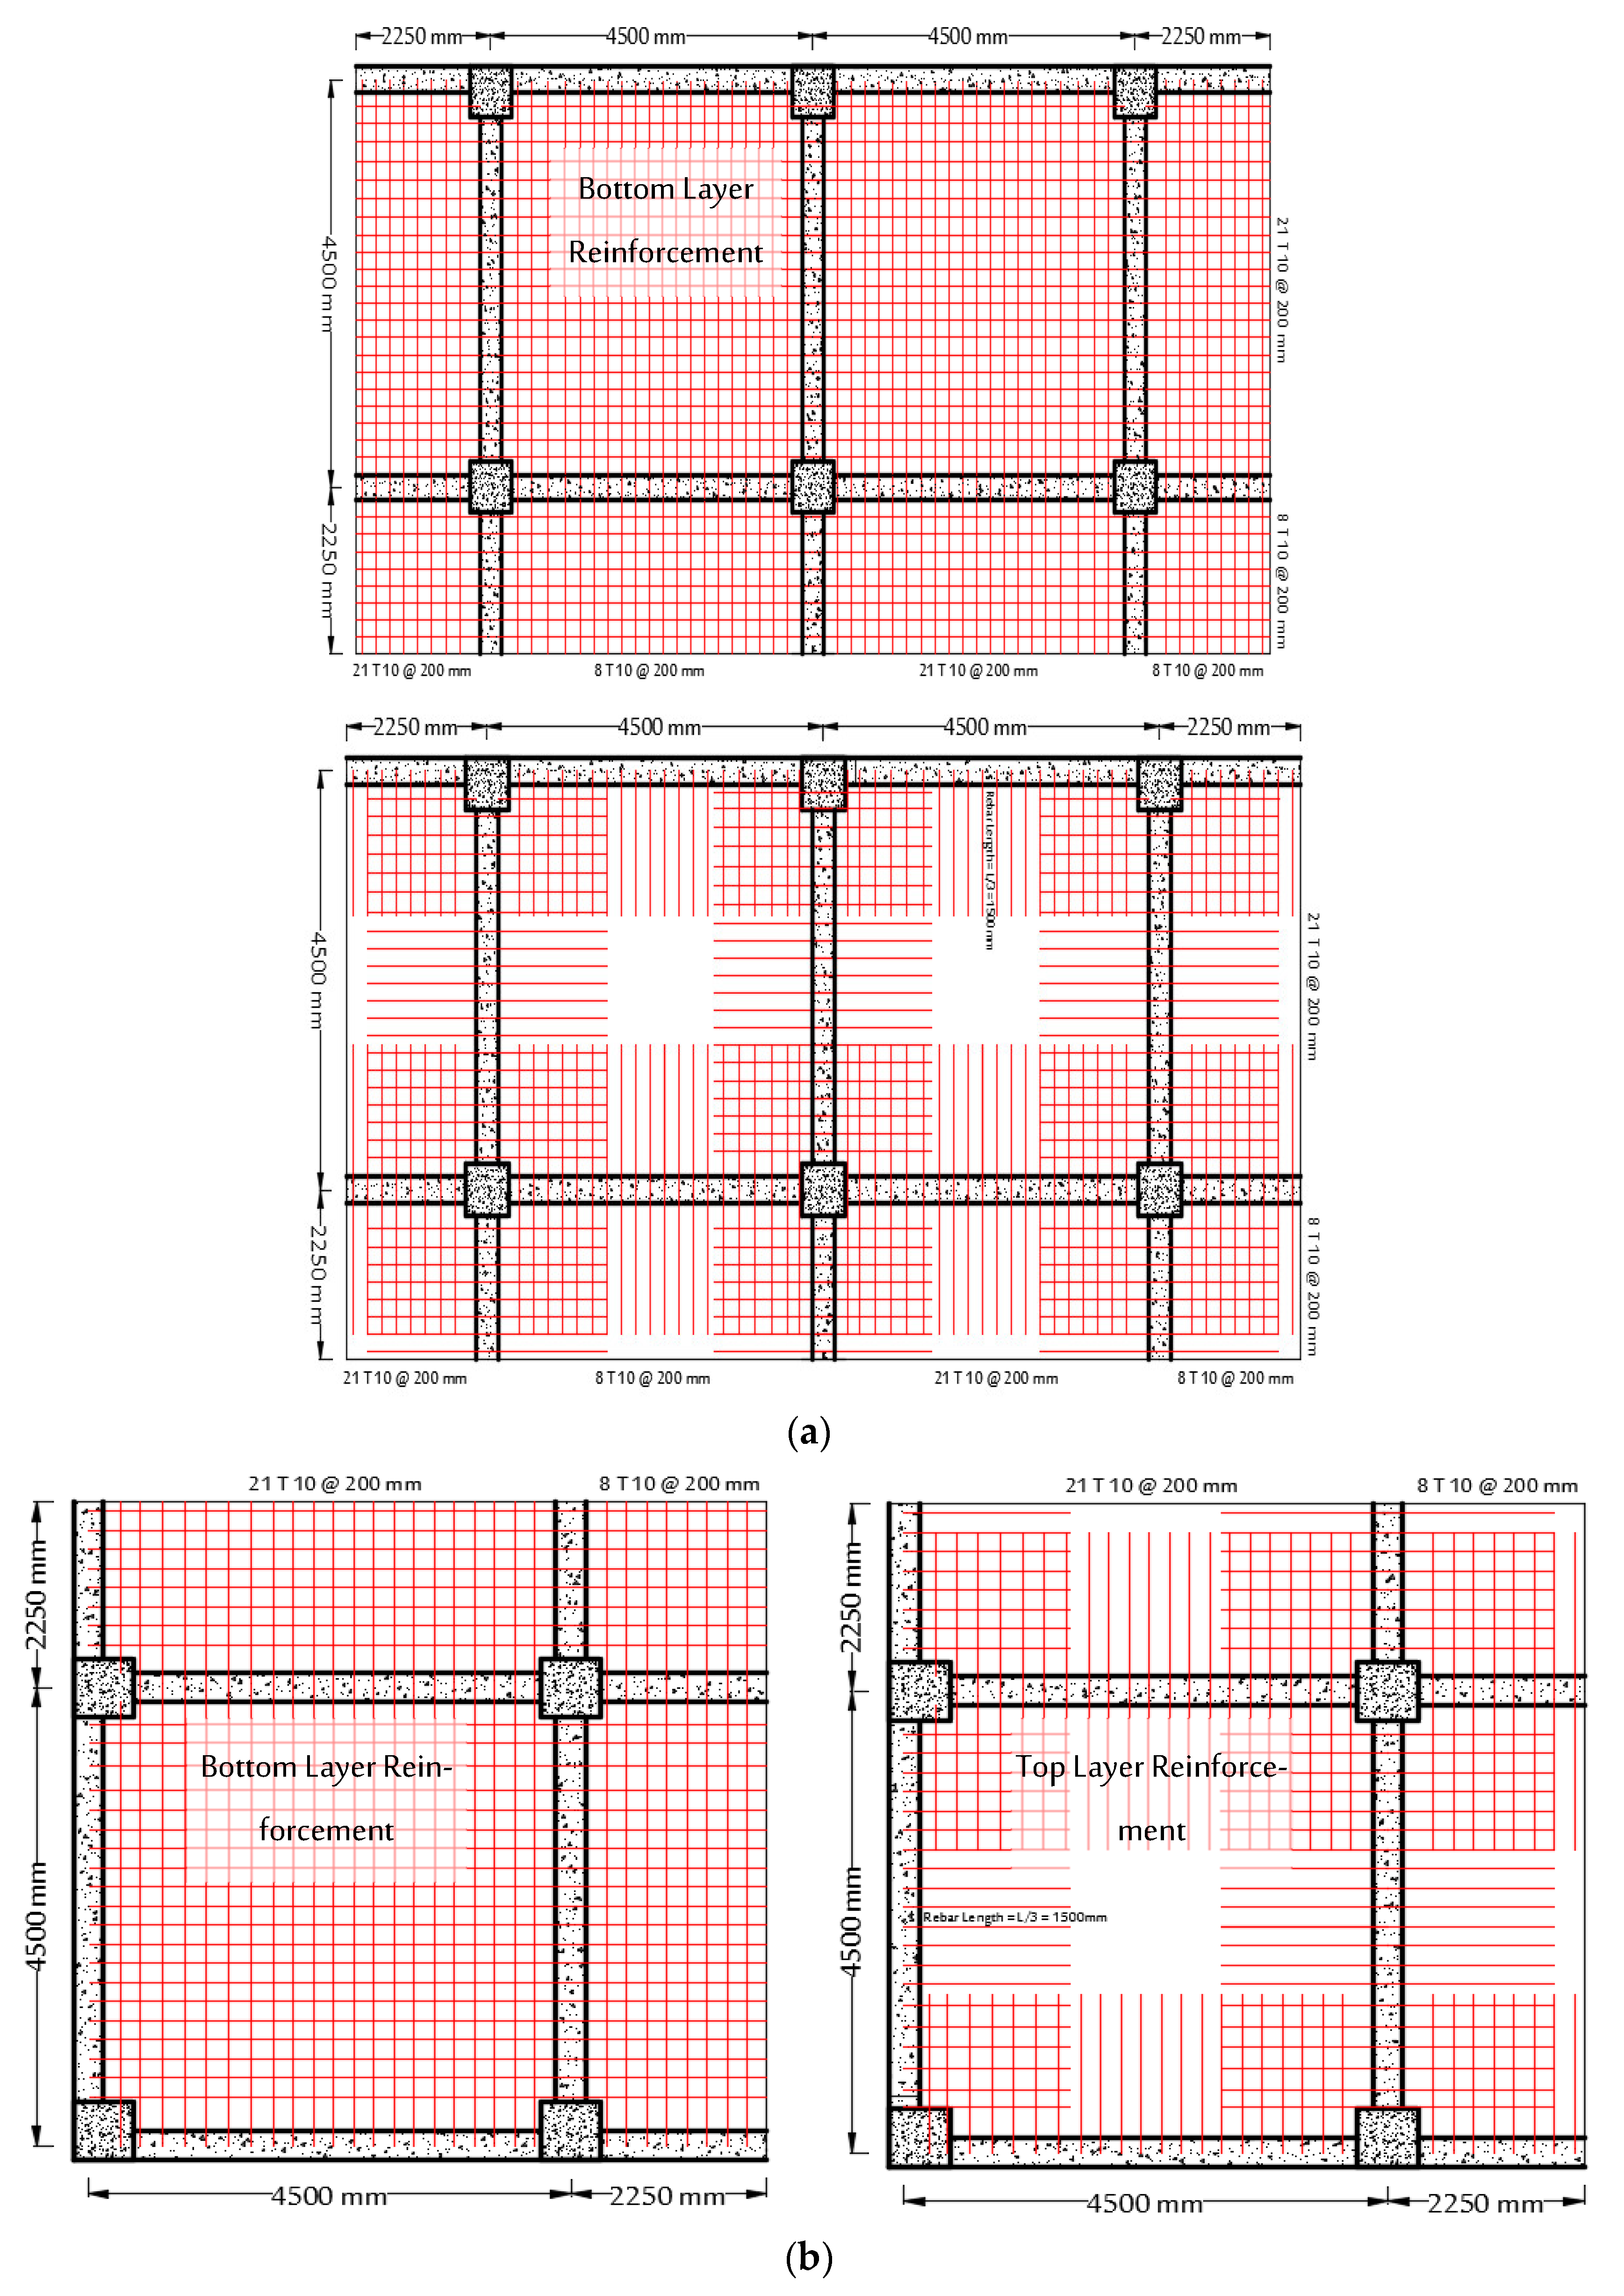
3. Details of the 3D RC Beam–Slab Substructures
4. FE Simulation Technique
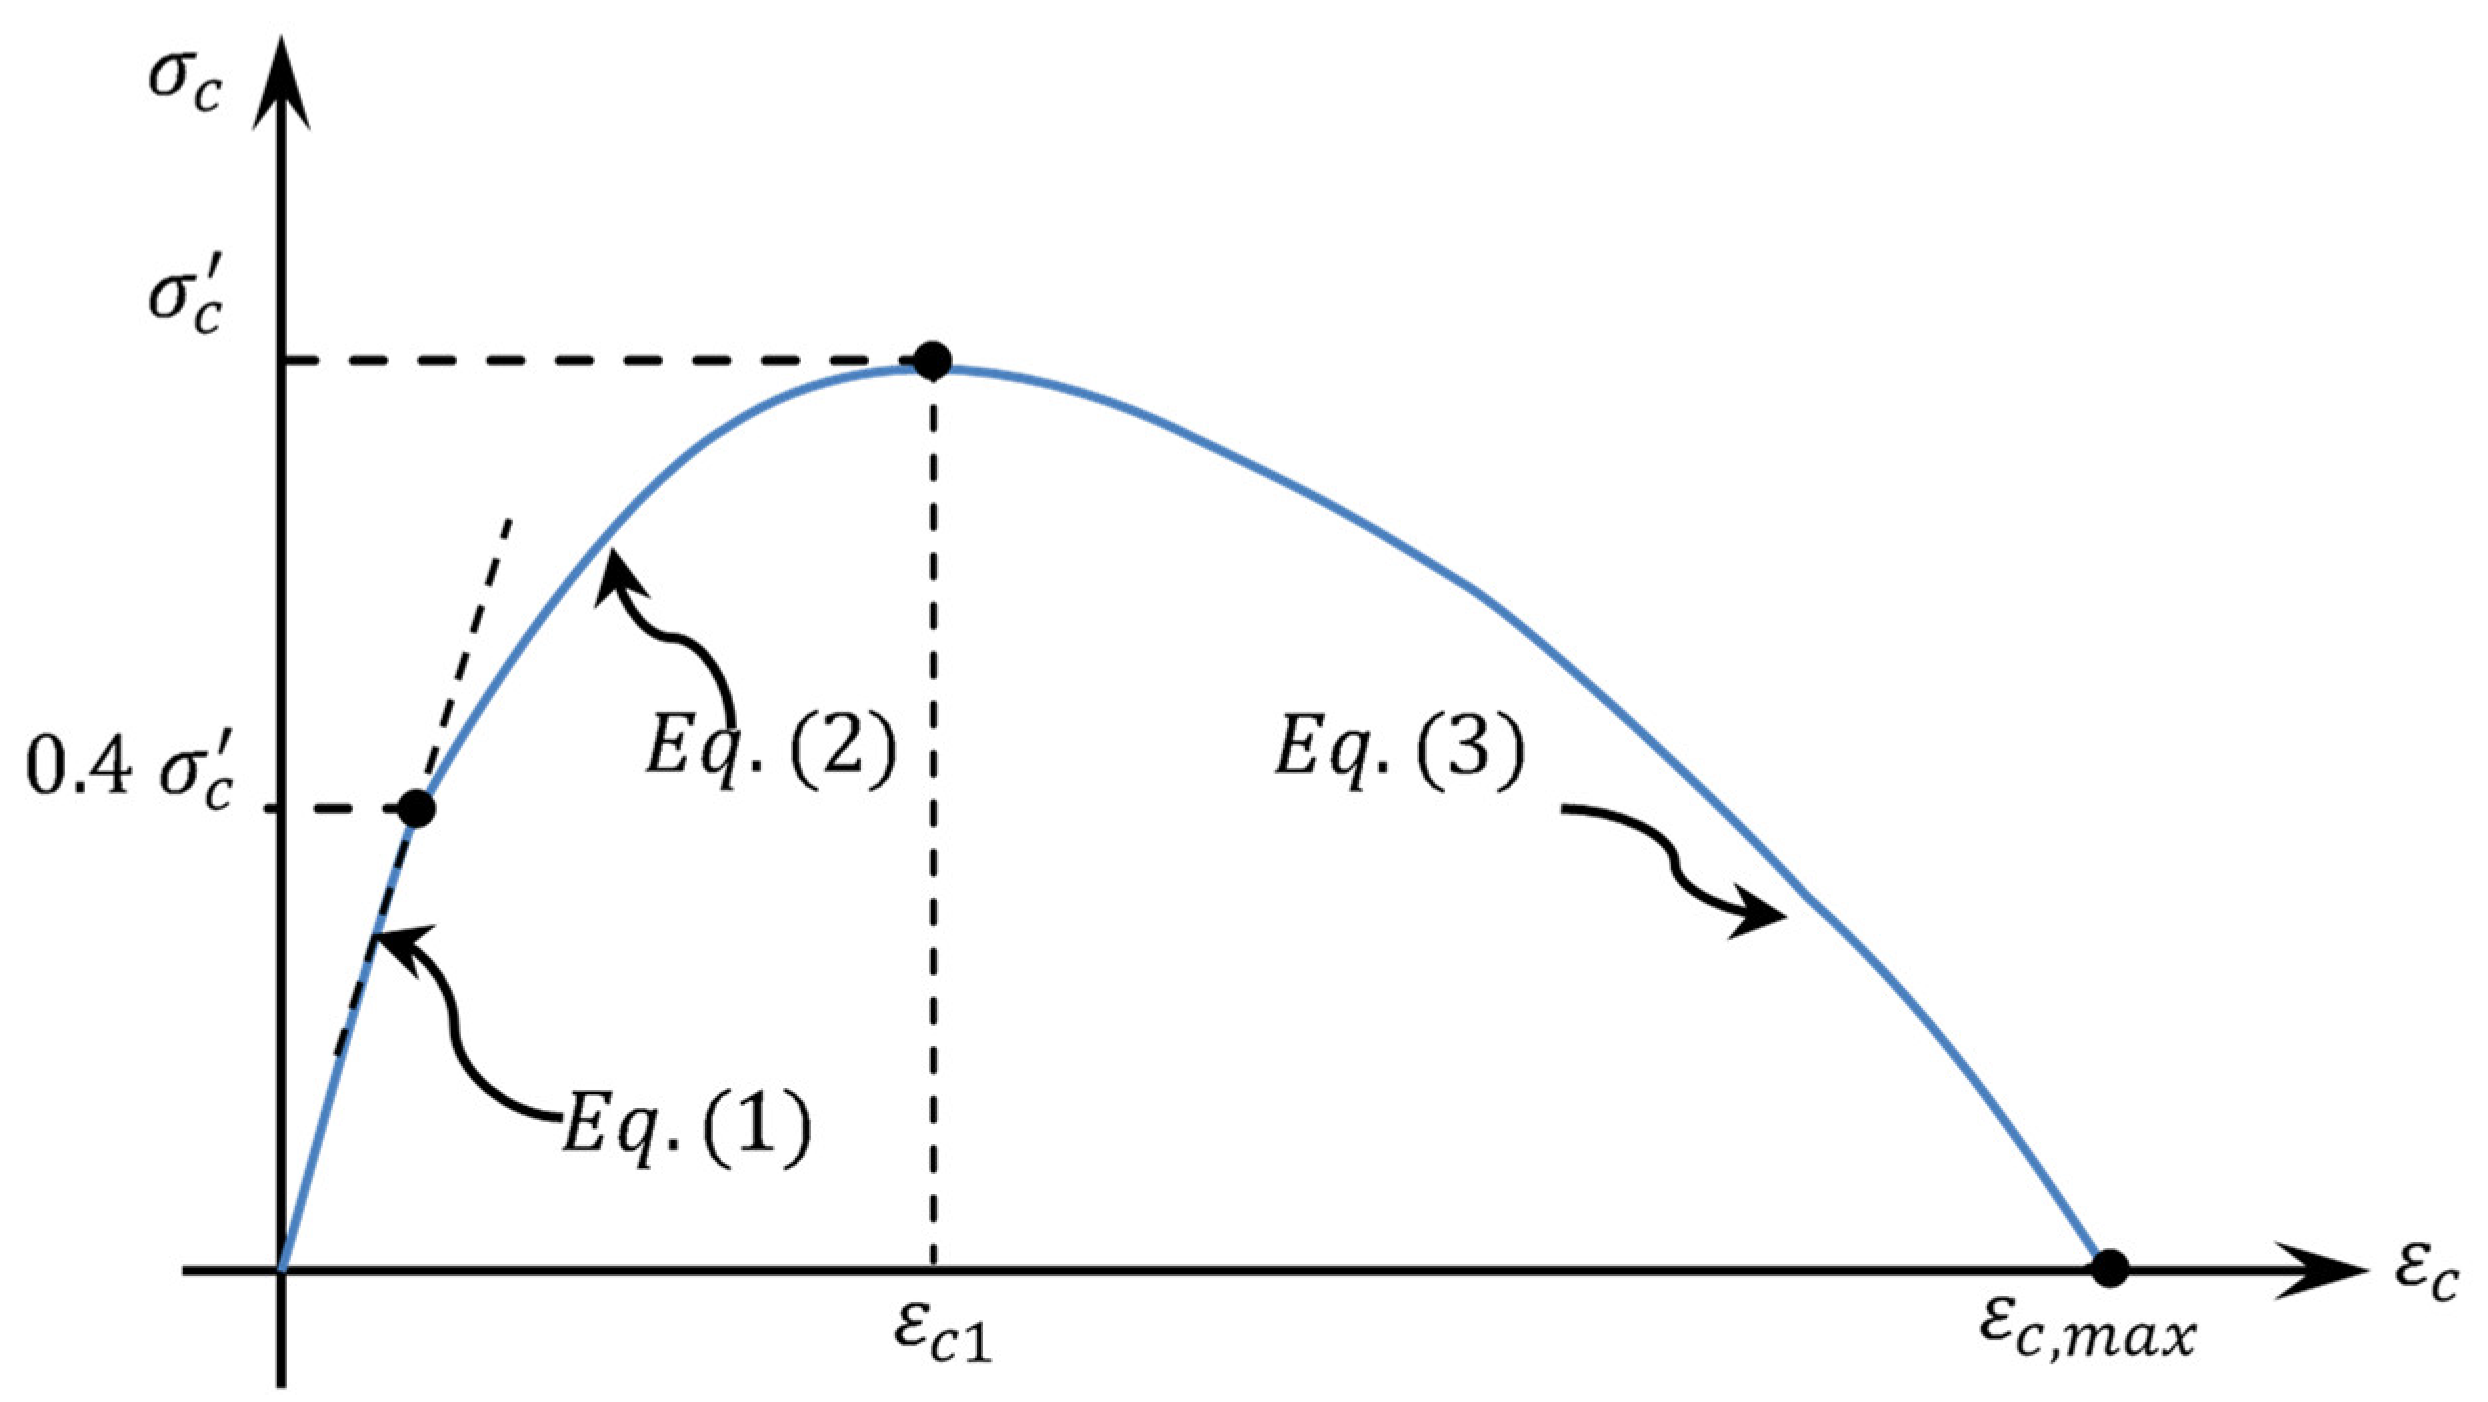
4.1. Modelling of Concrete Materials
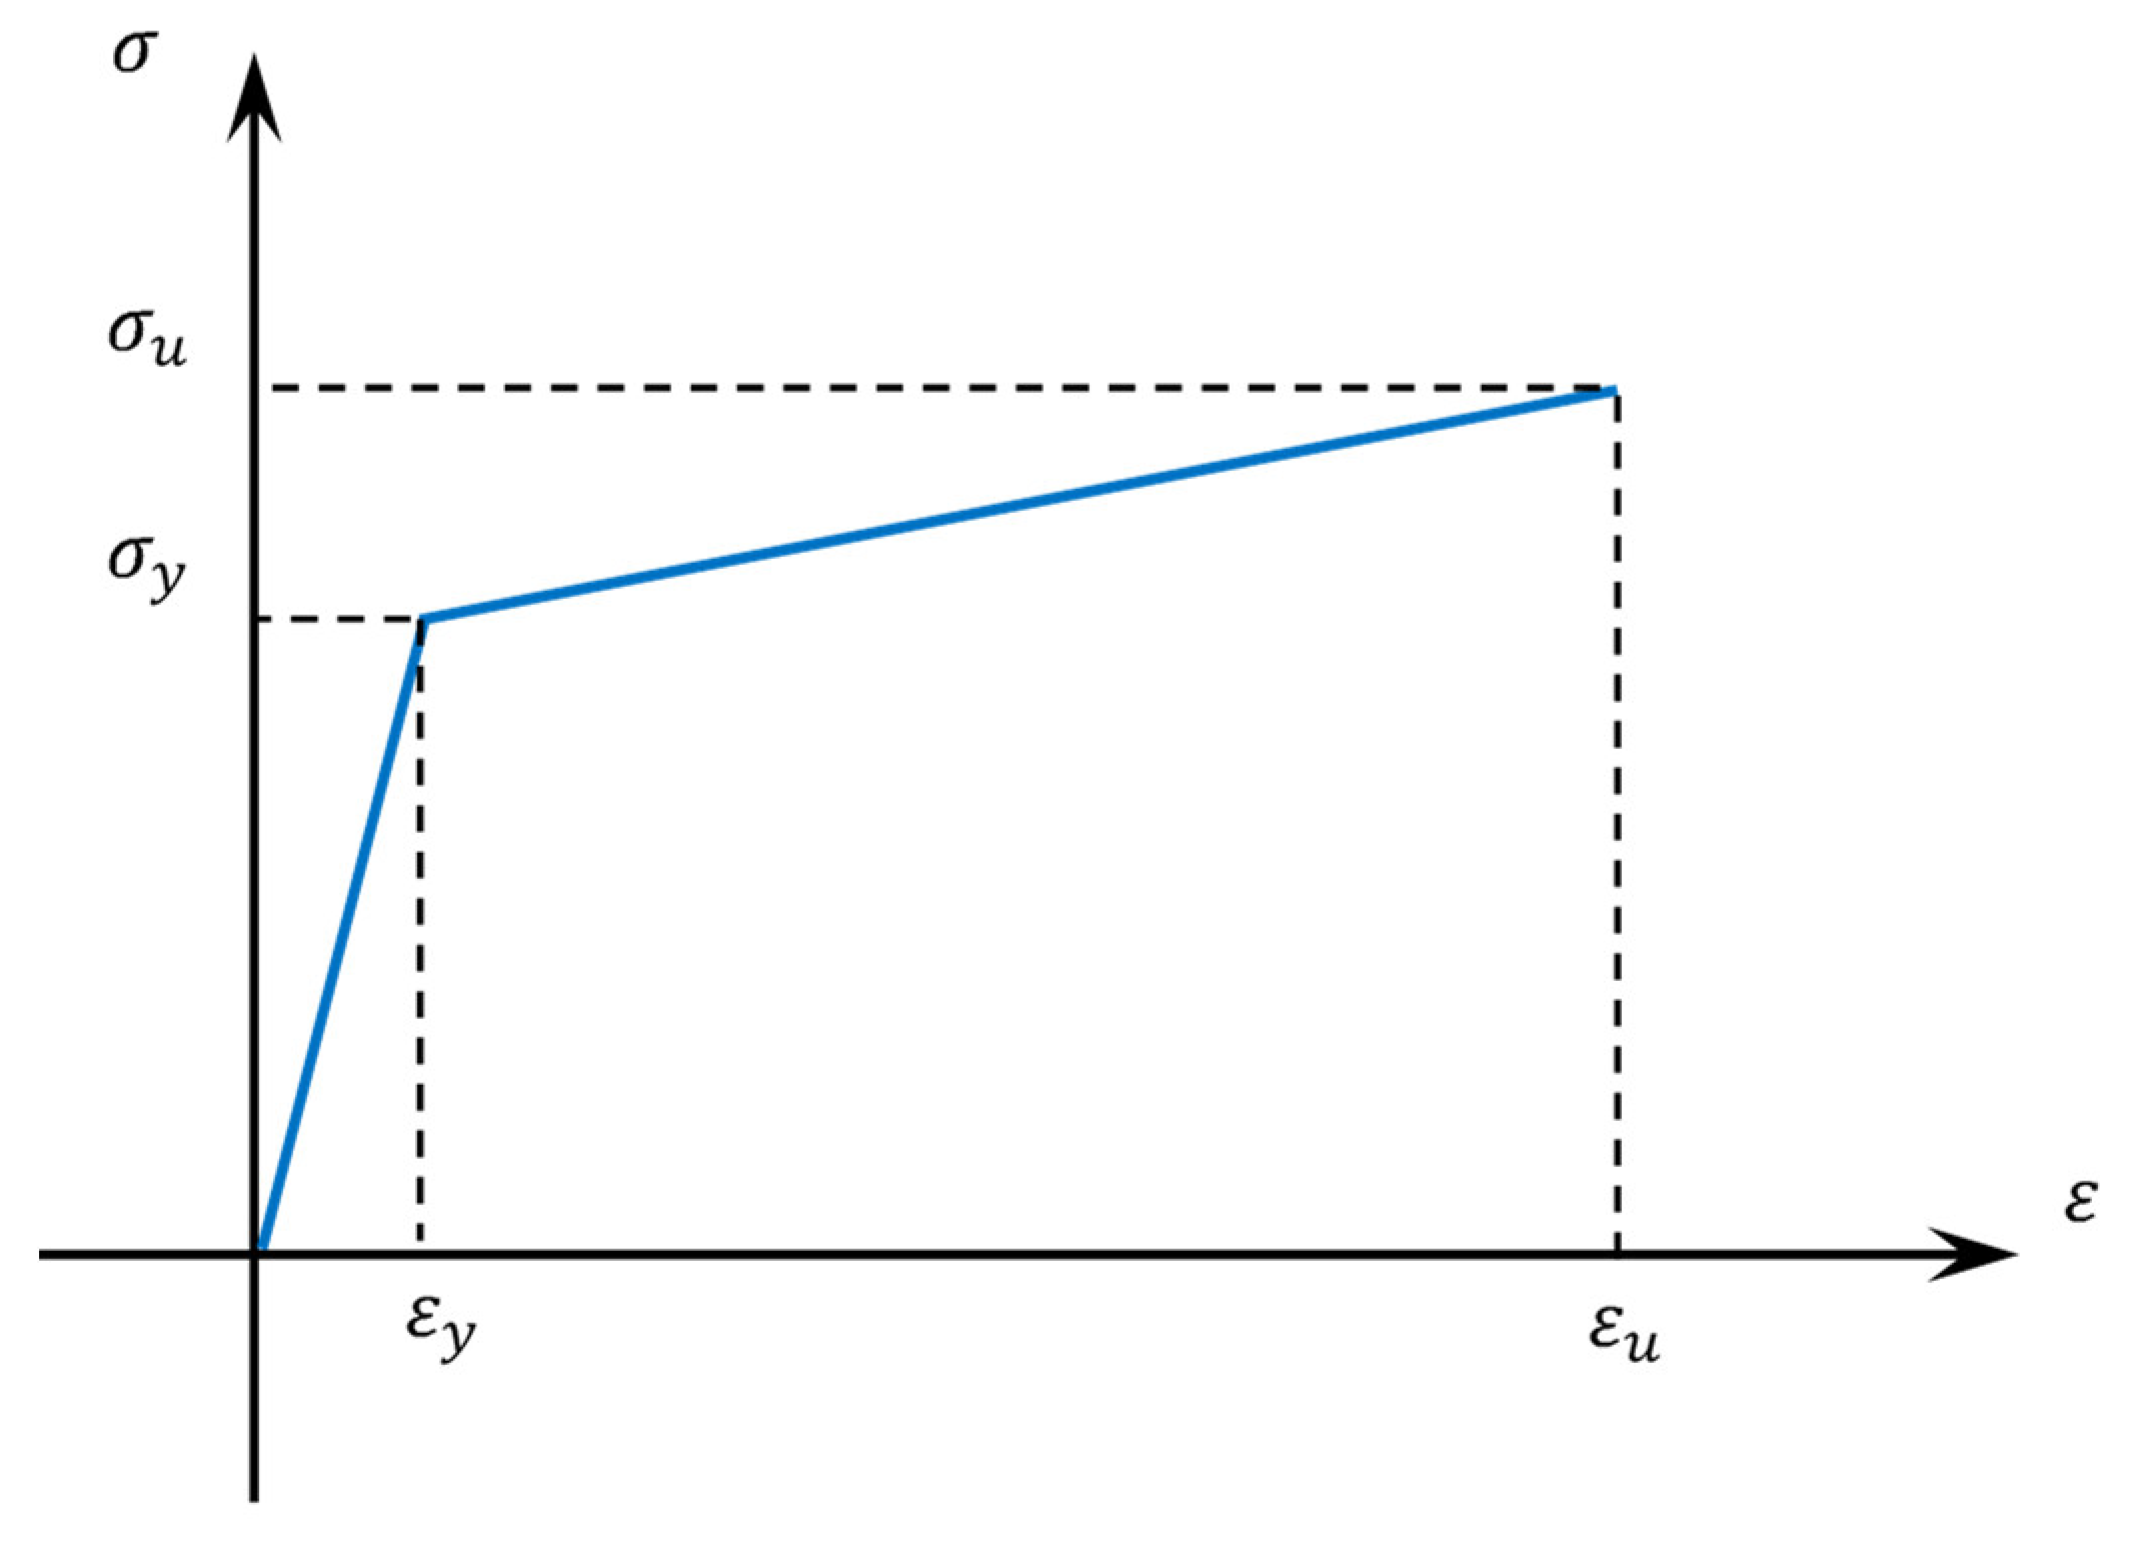
4.2. Modelling of Reinforcing Steel Rebars
4.3. Finite Elements
4.4. Constraints and Interactions
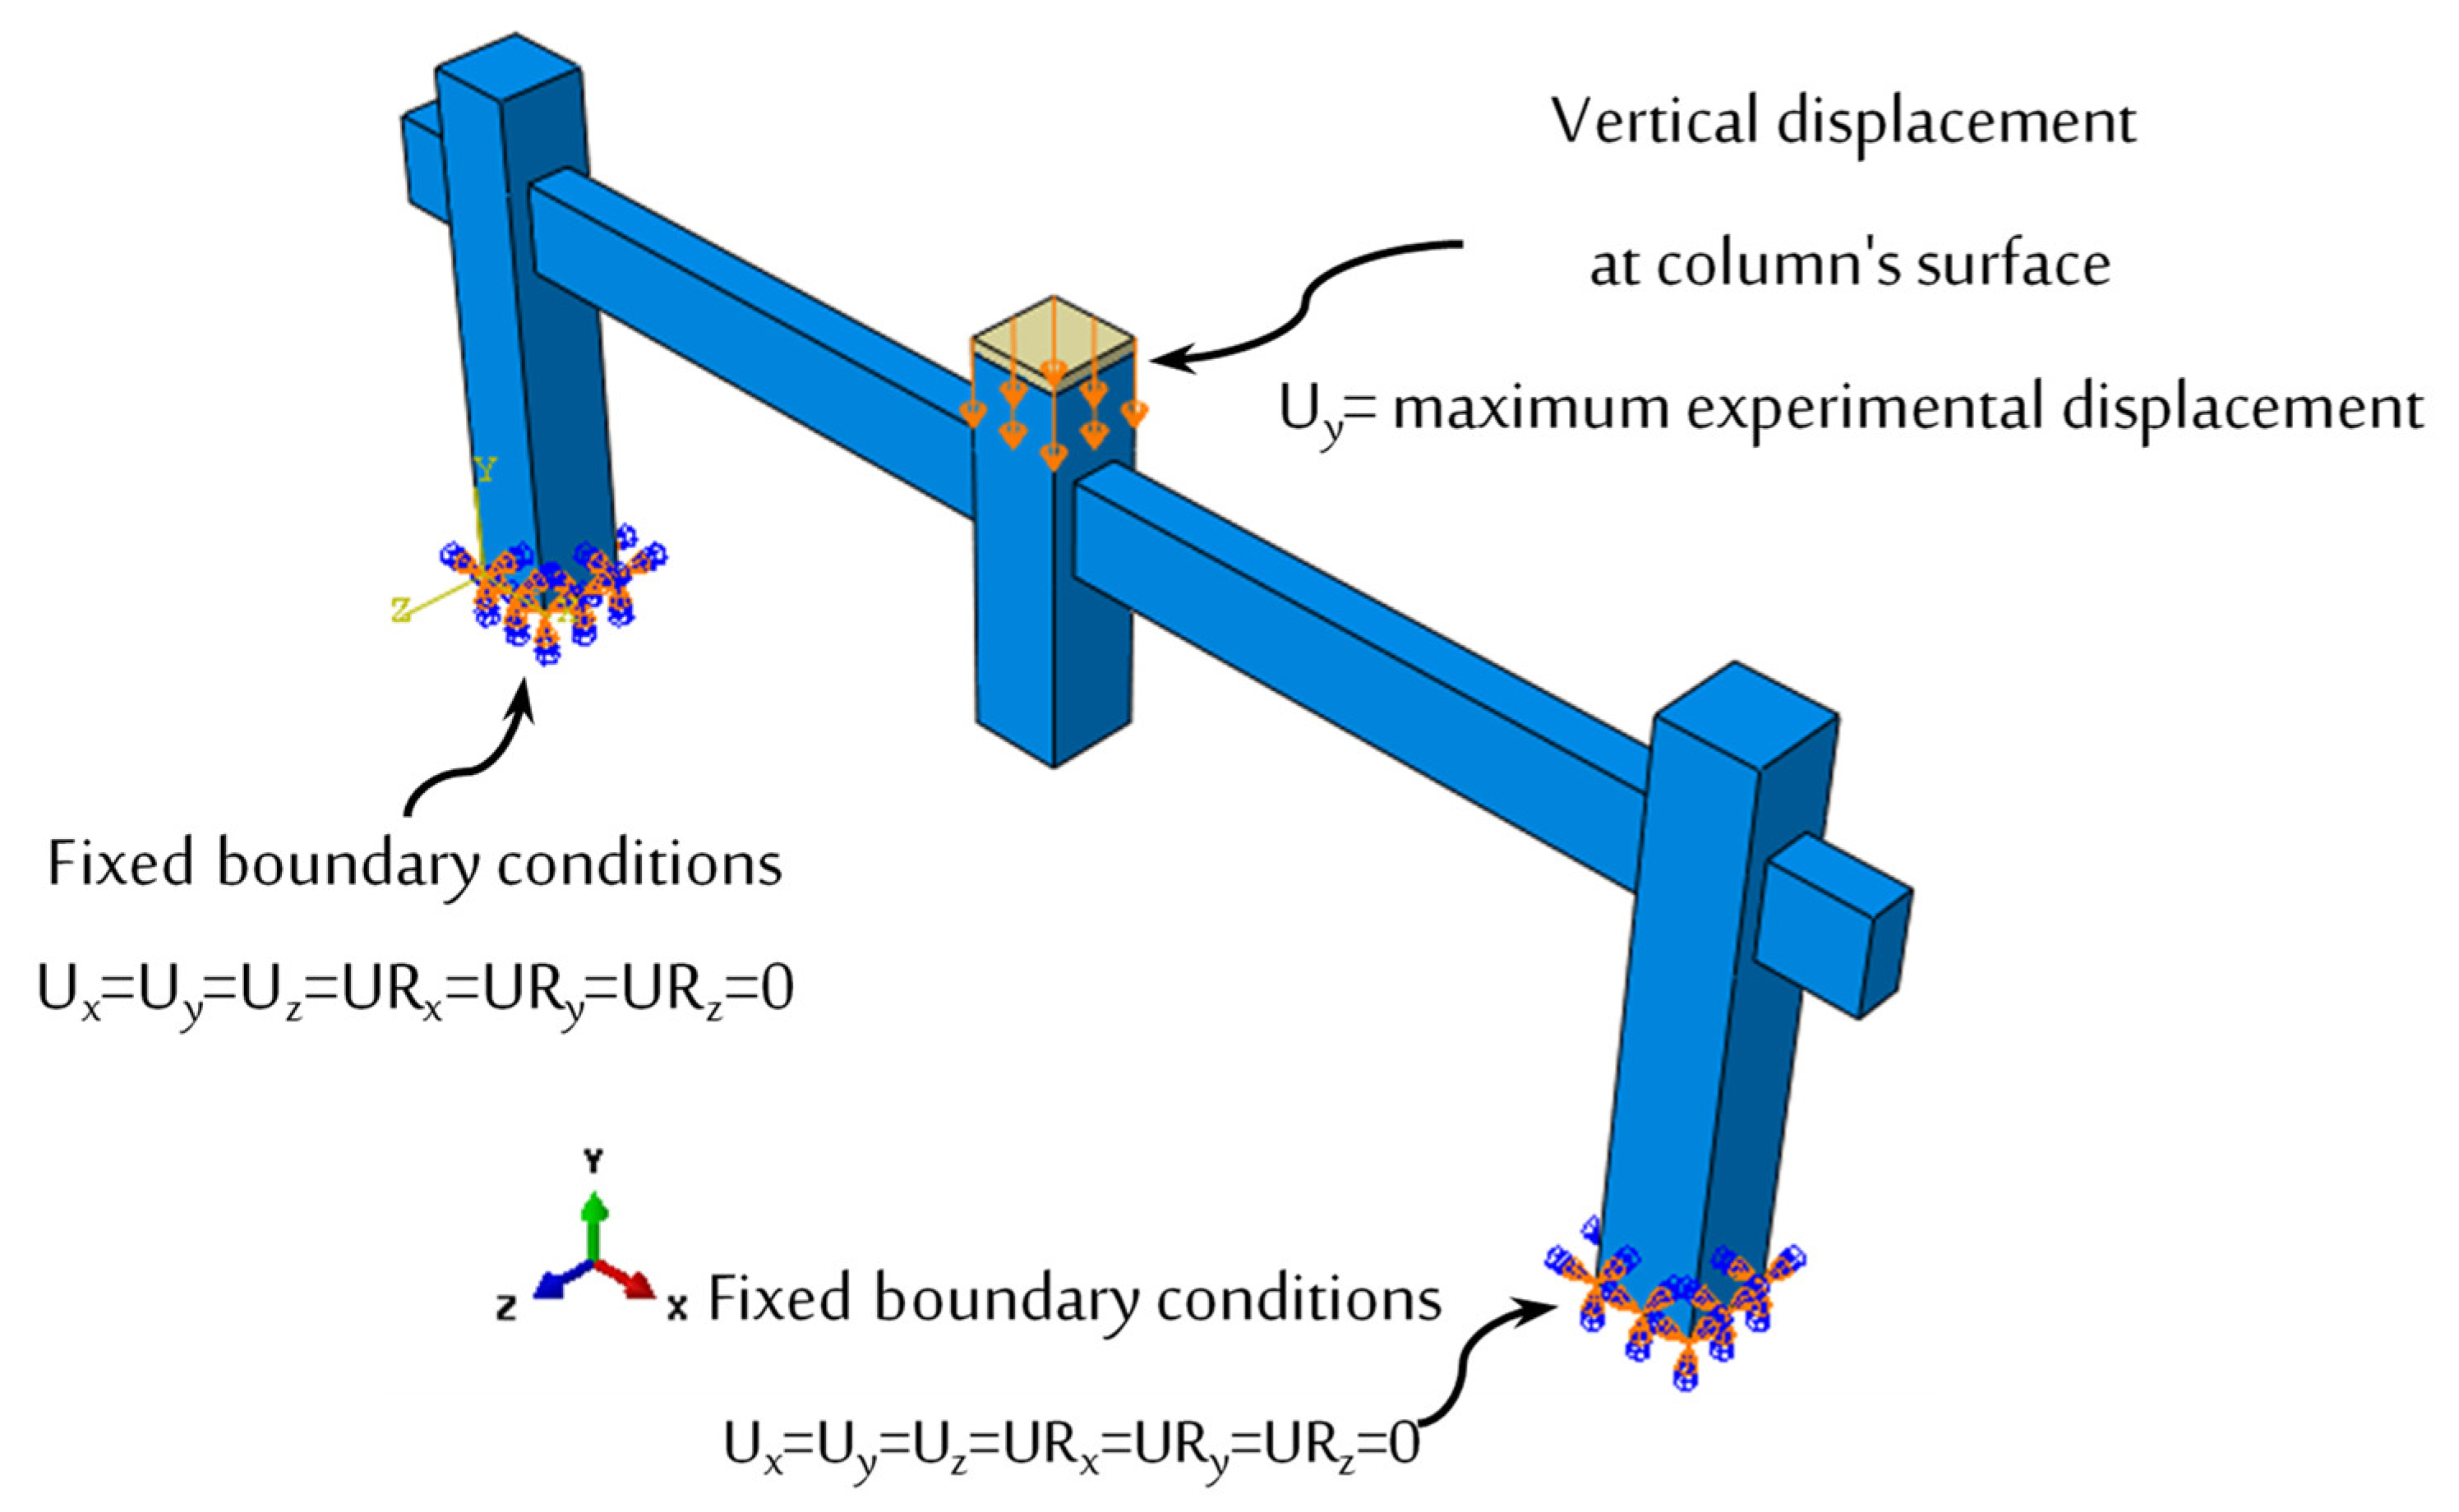
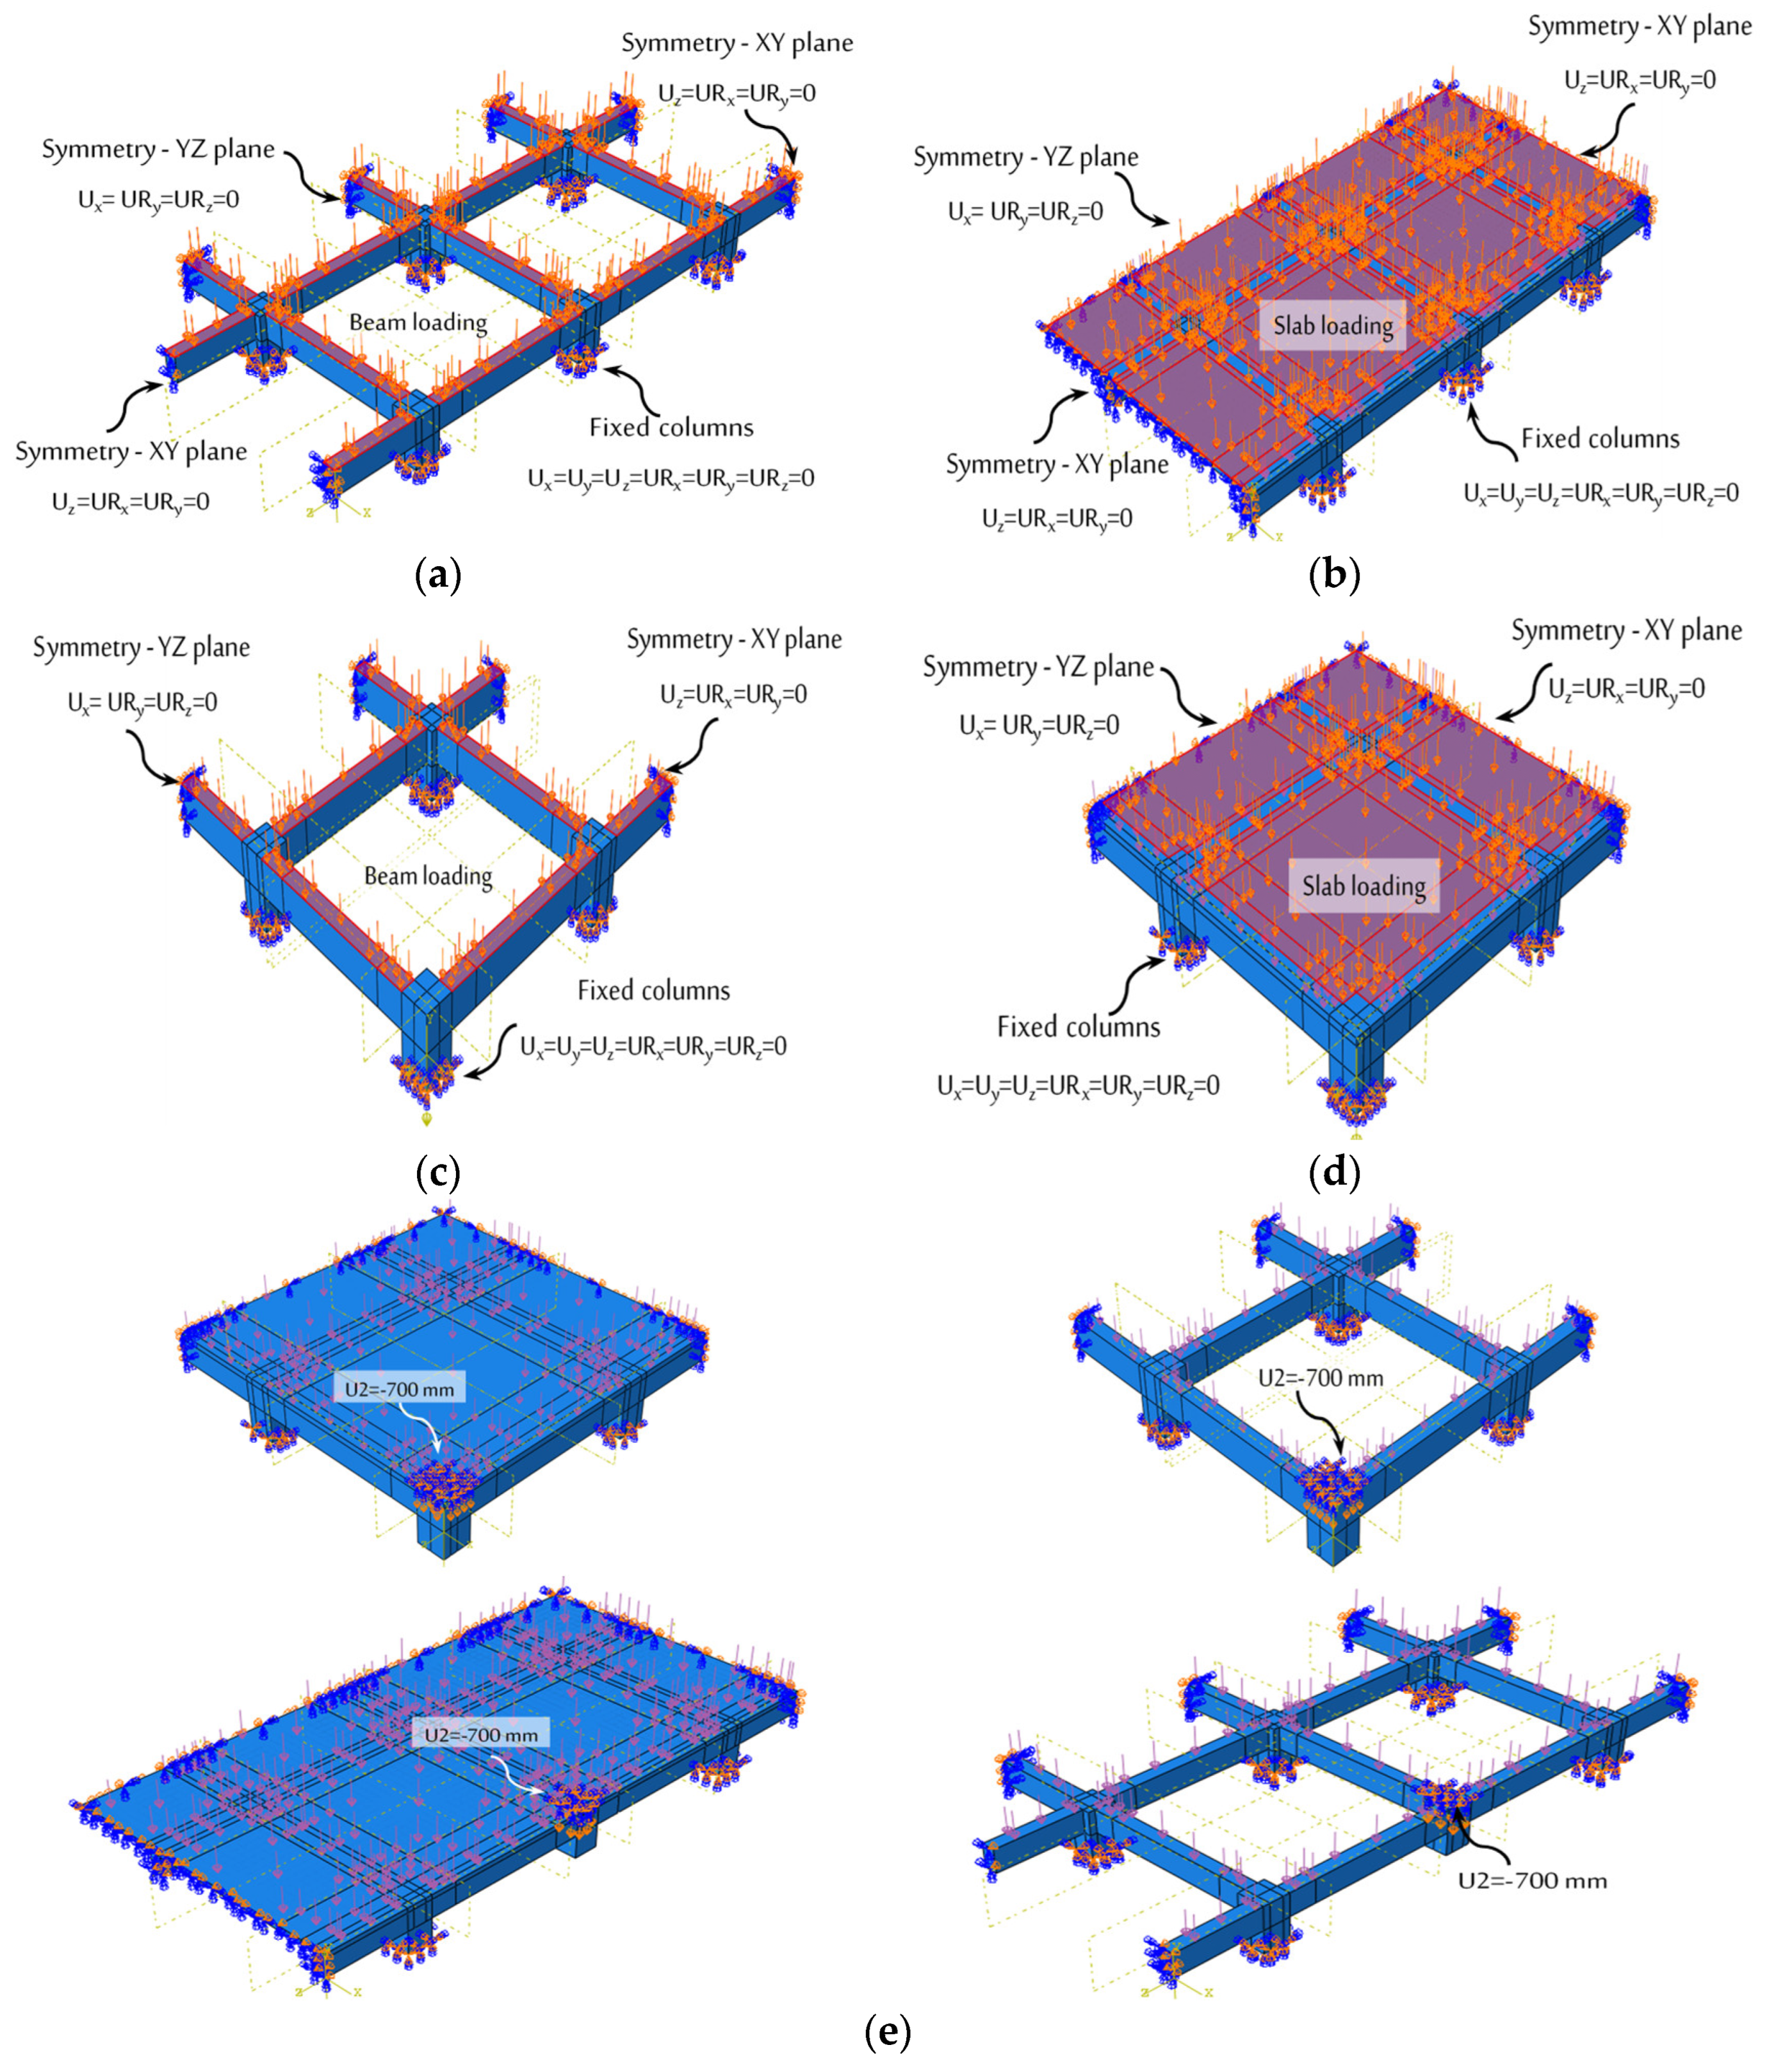
4.5. Boundary Conditions and Loading Application
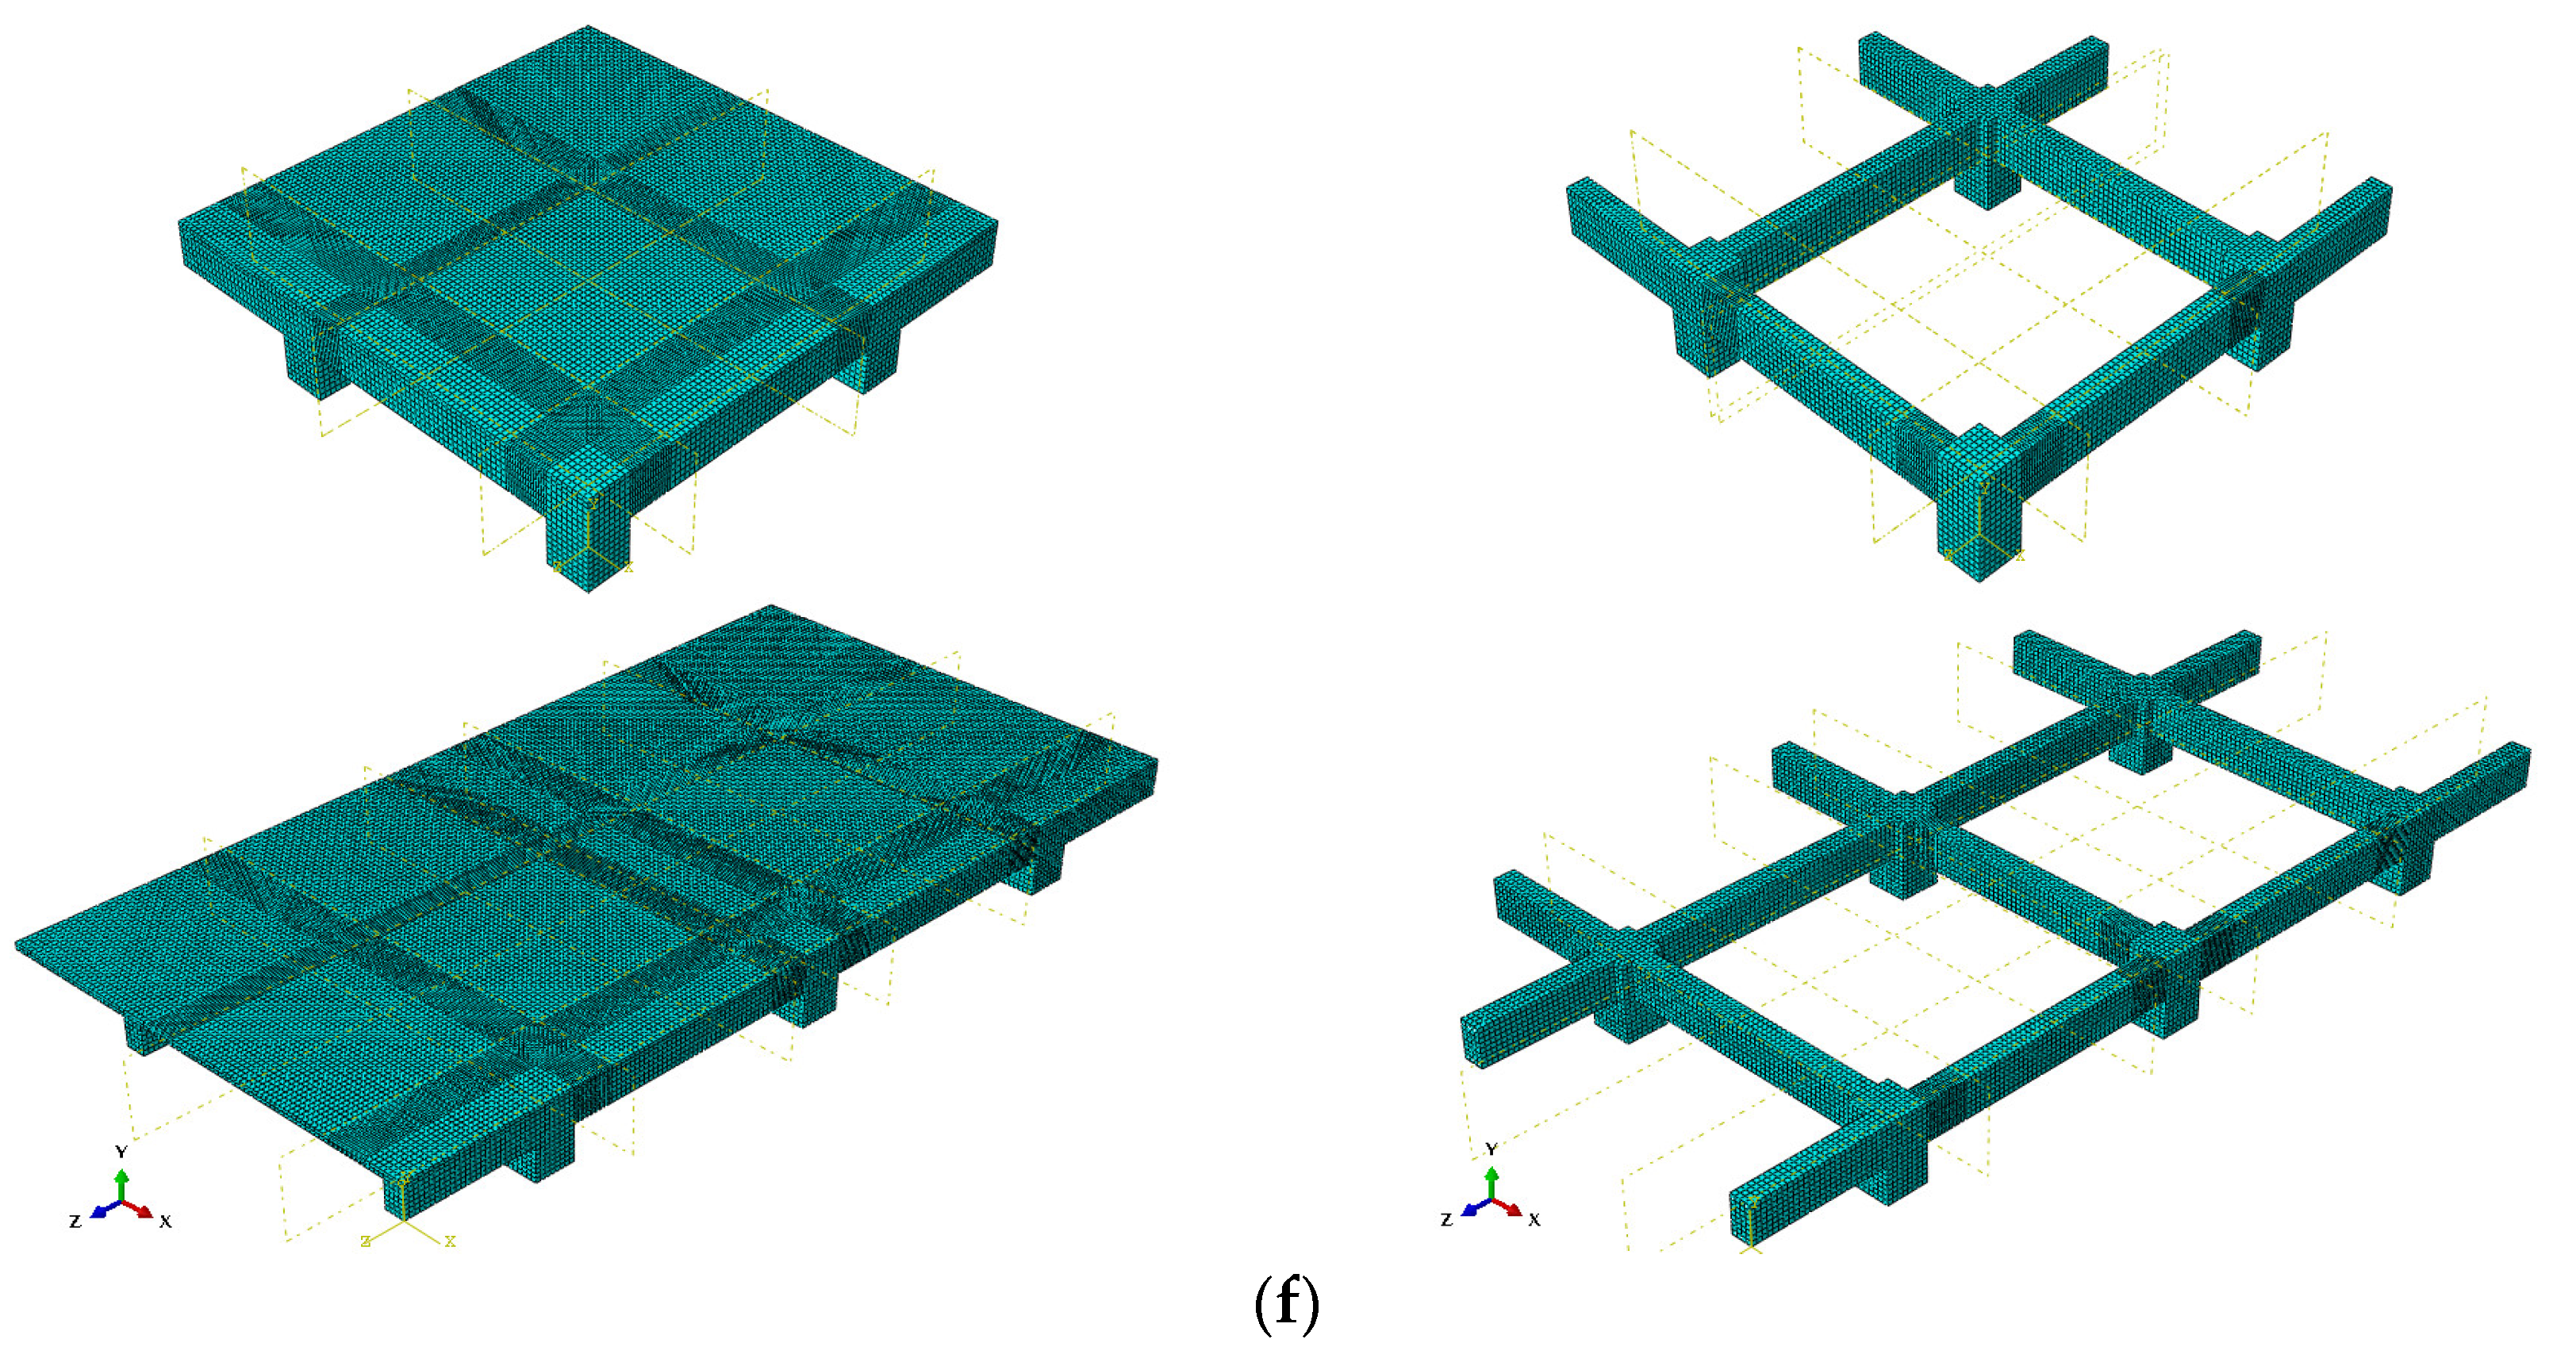
4.6. FE Mesh Convergence
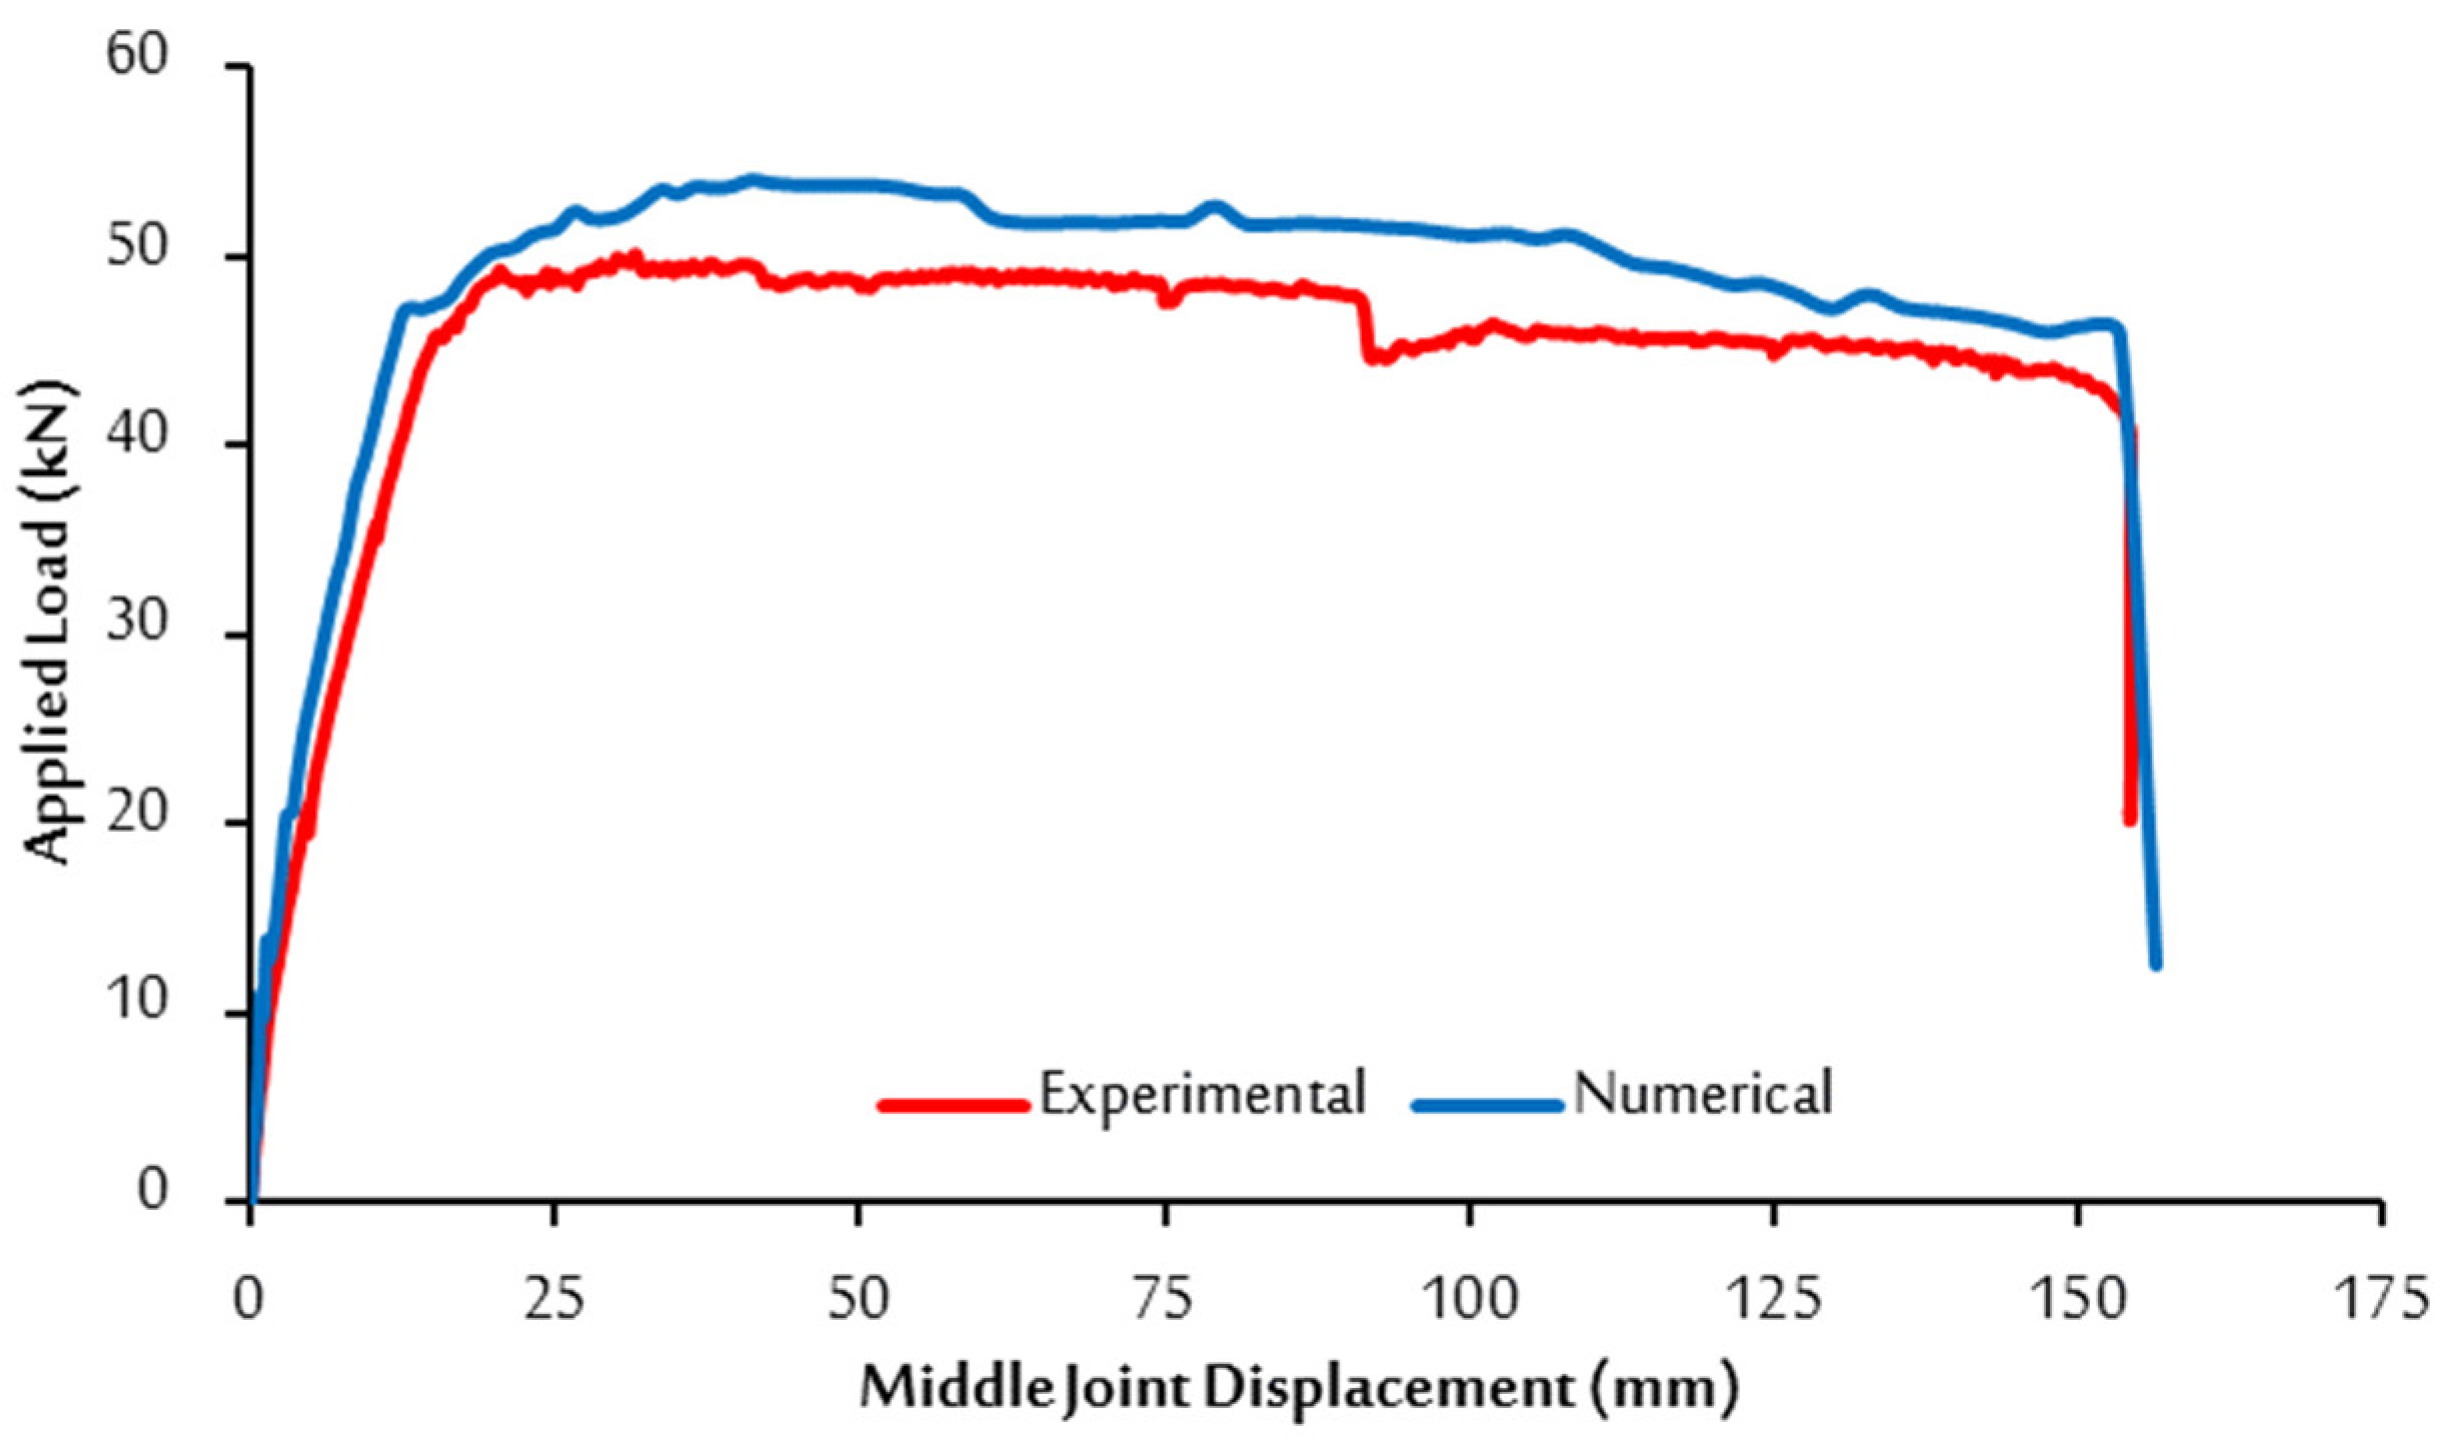
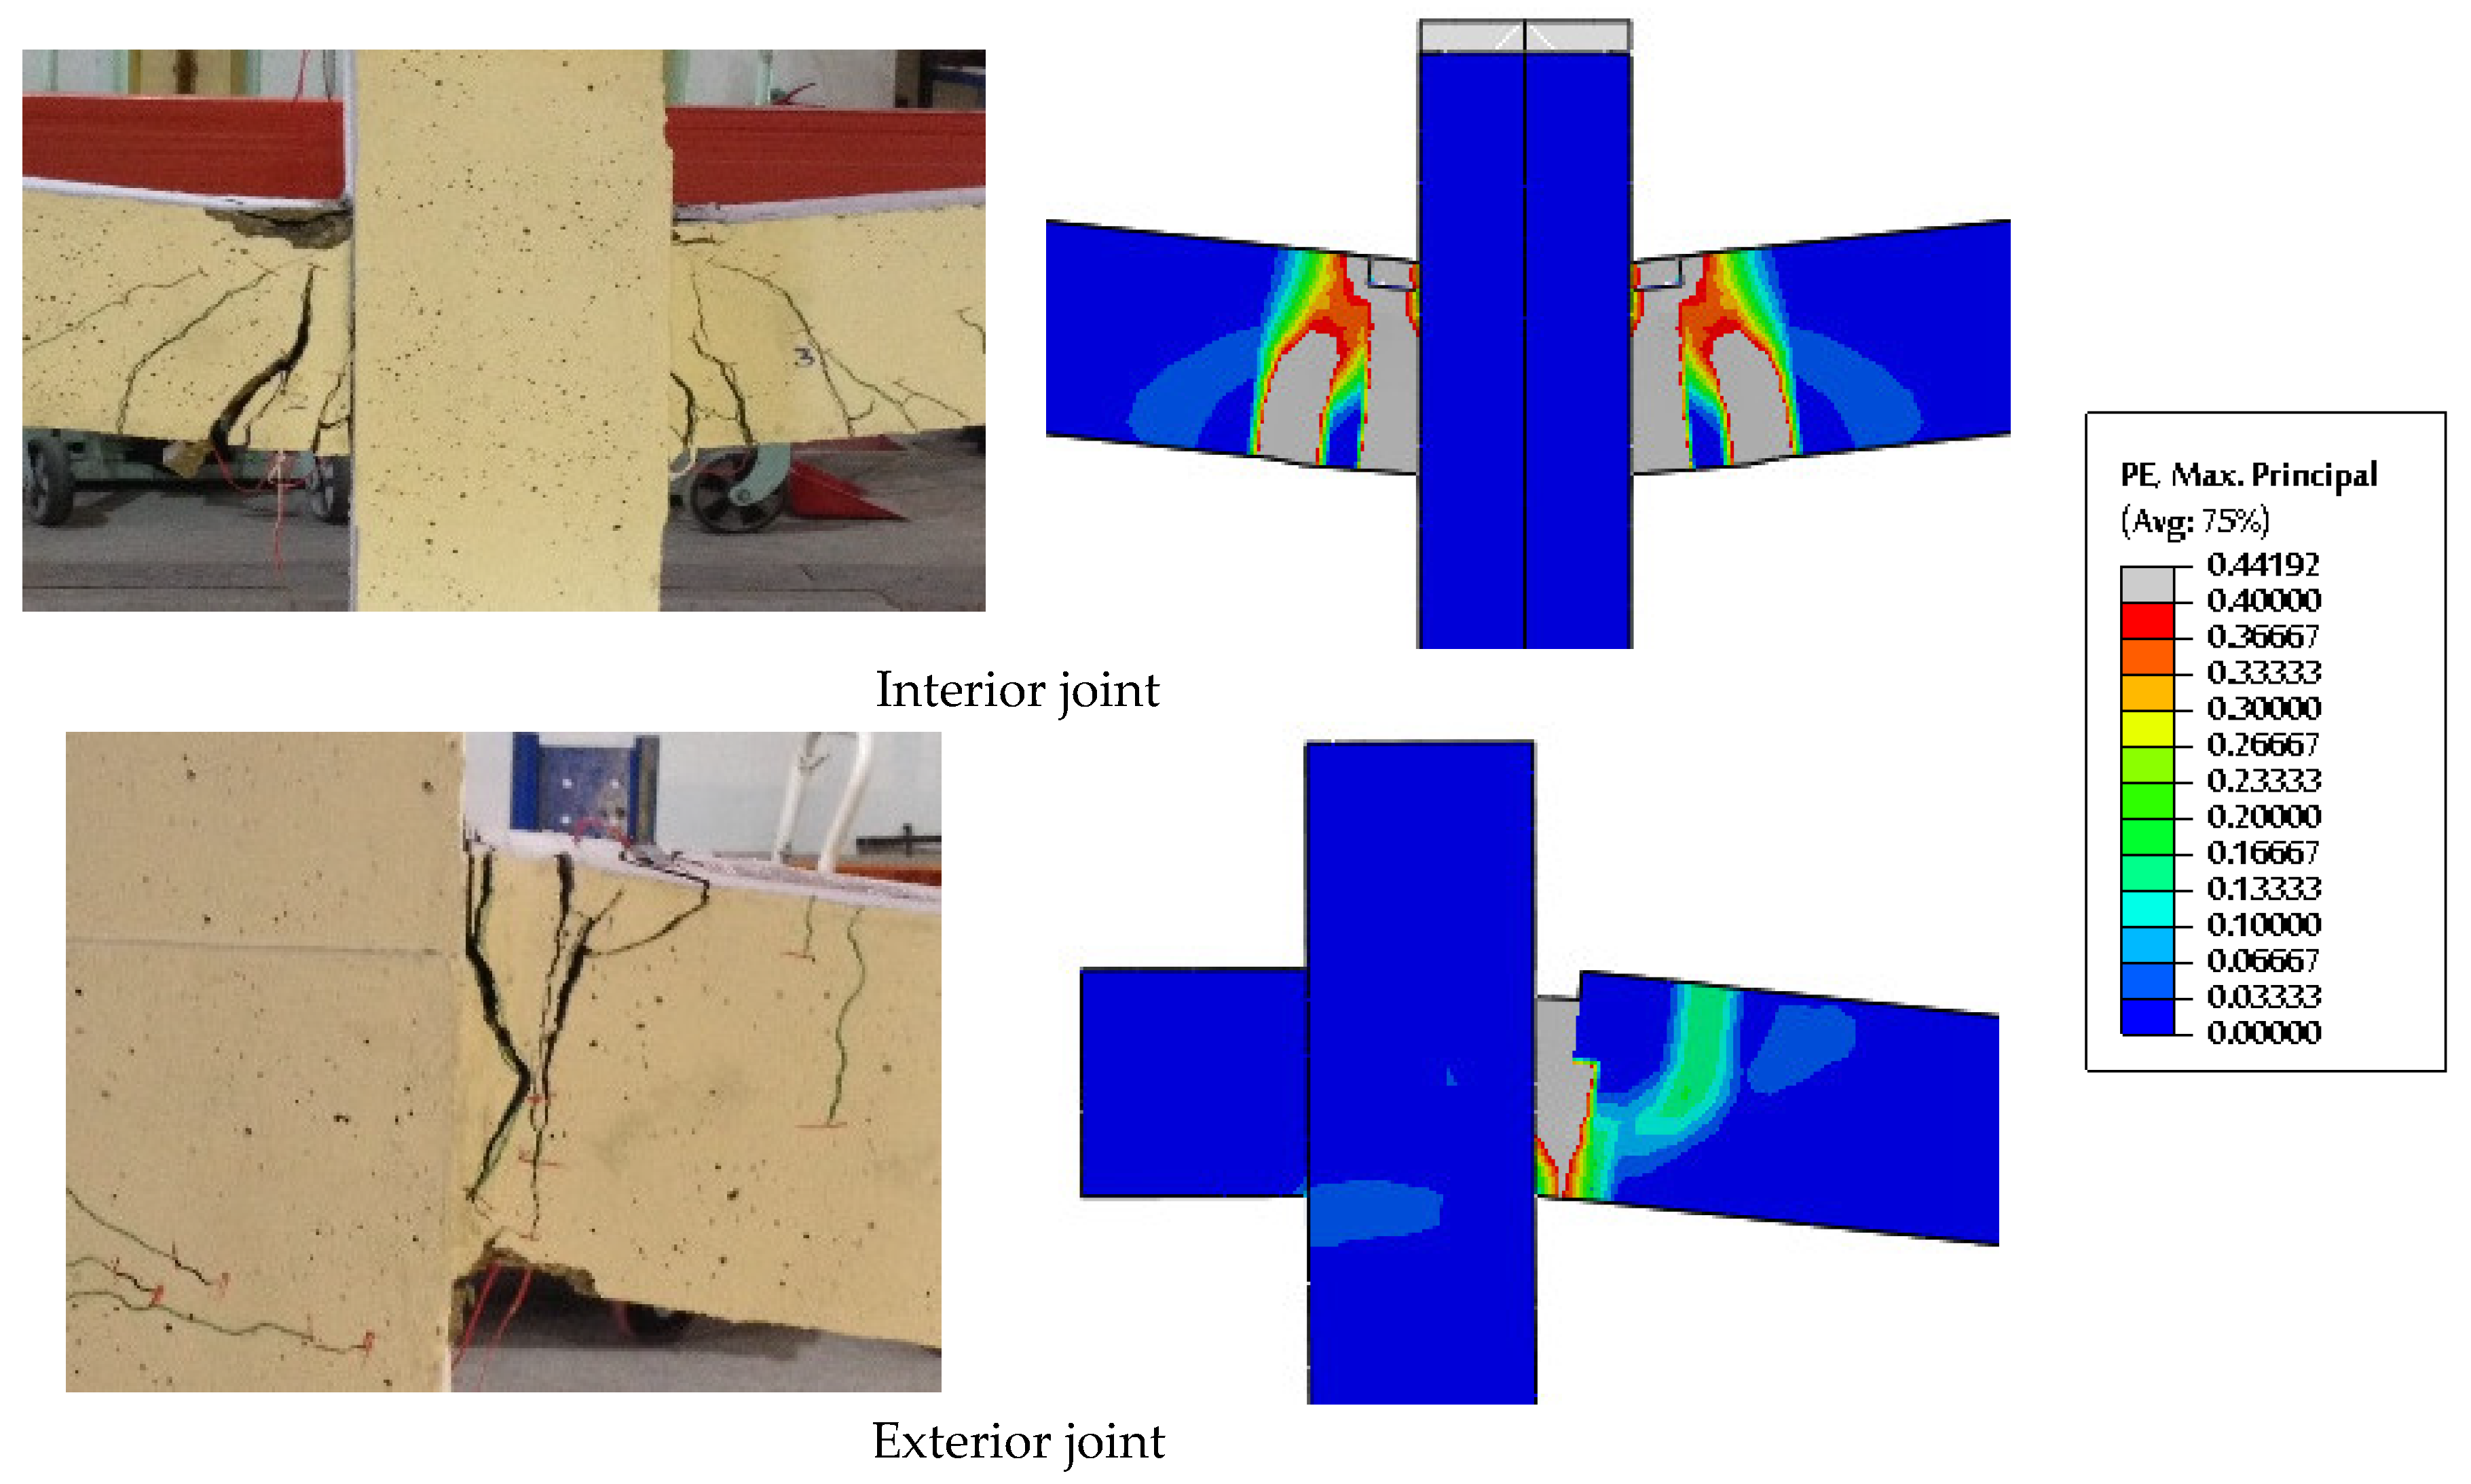
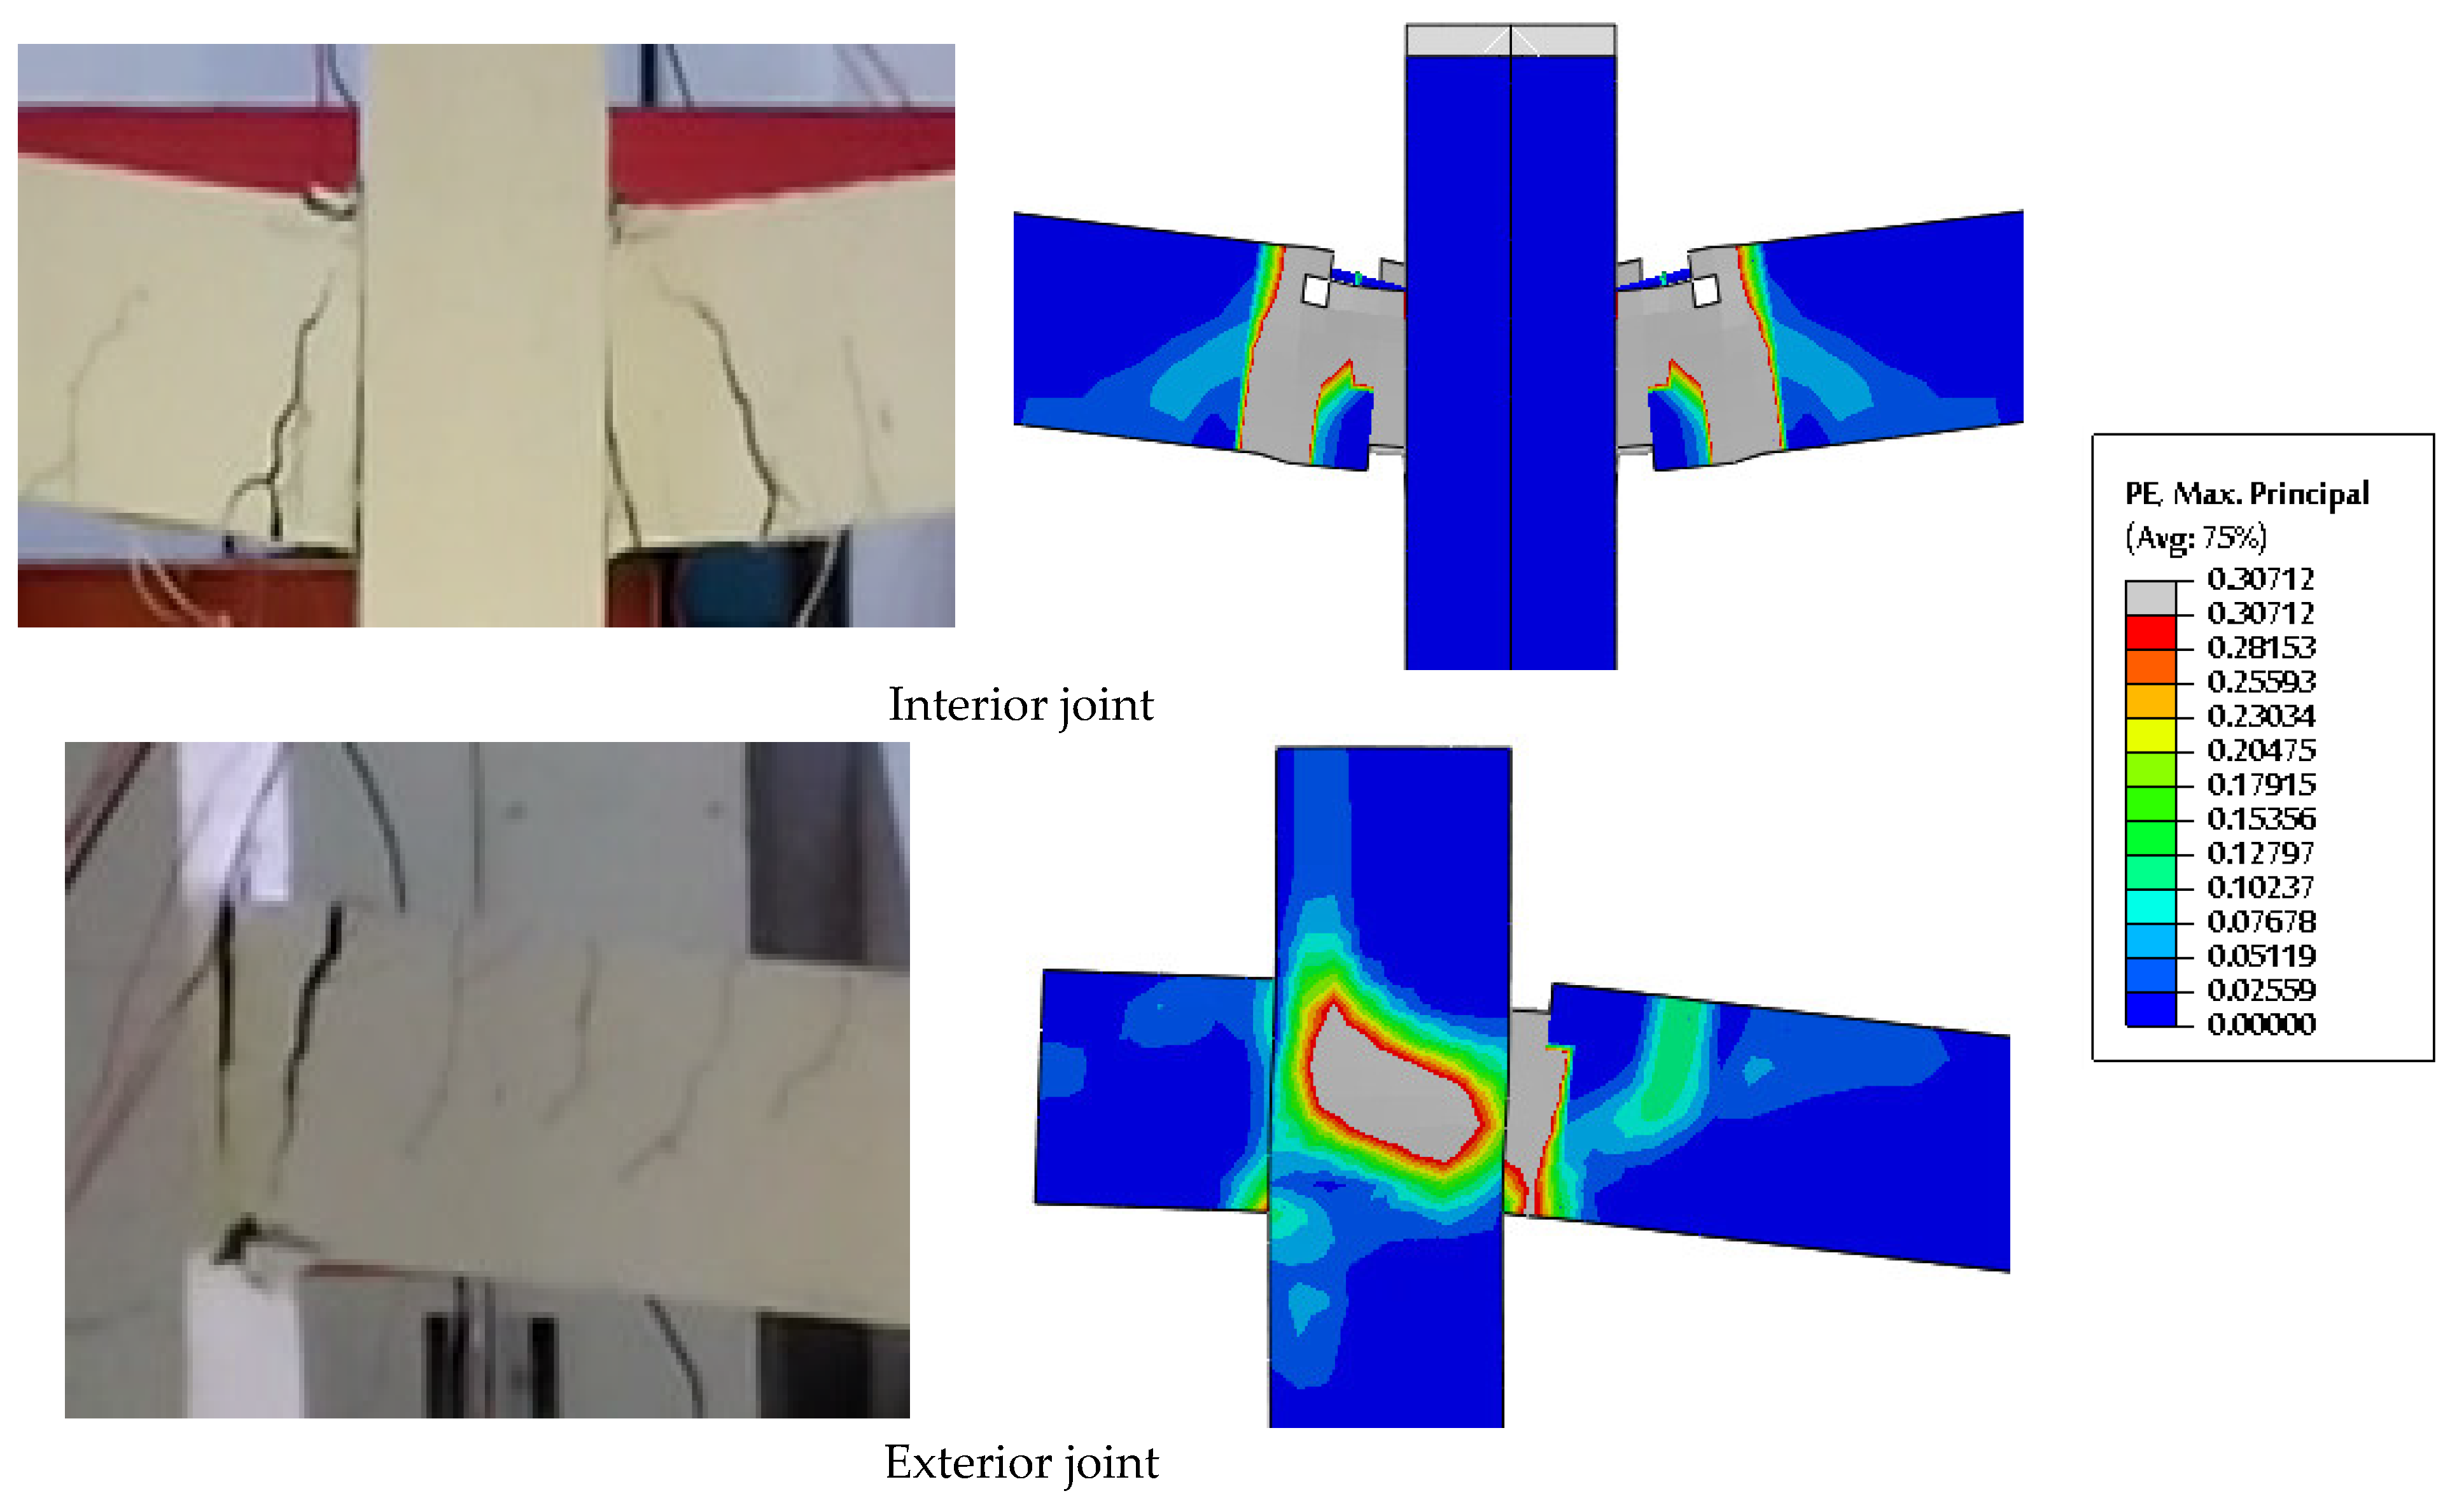
5. Validation of Finite Element Modelling
6. Progressive Collapse Analysis of the 3D Beam–Slab Substructures
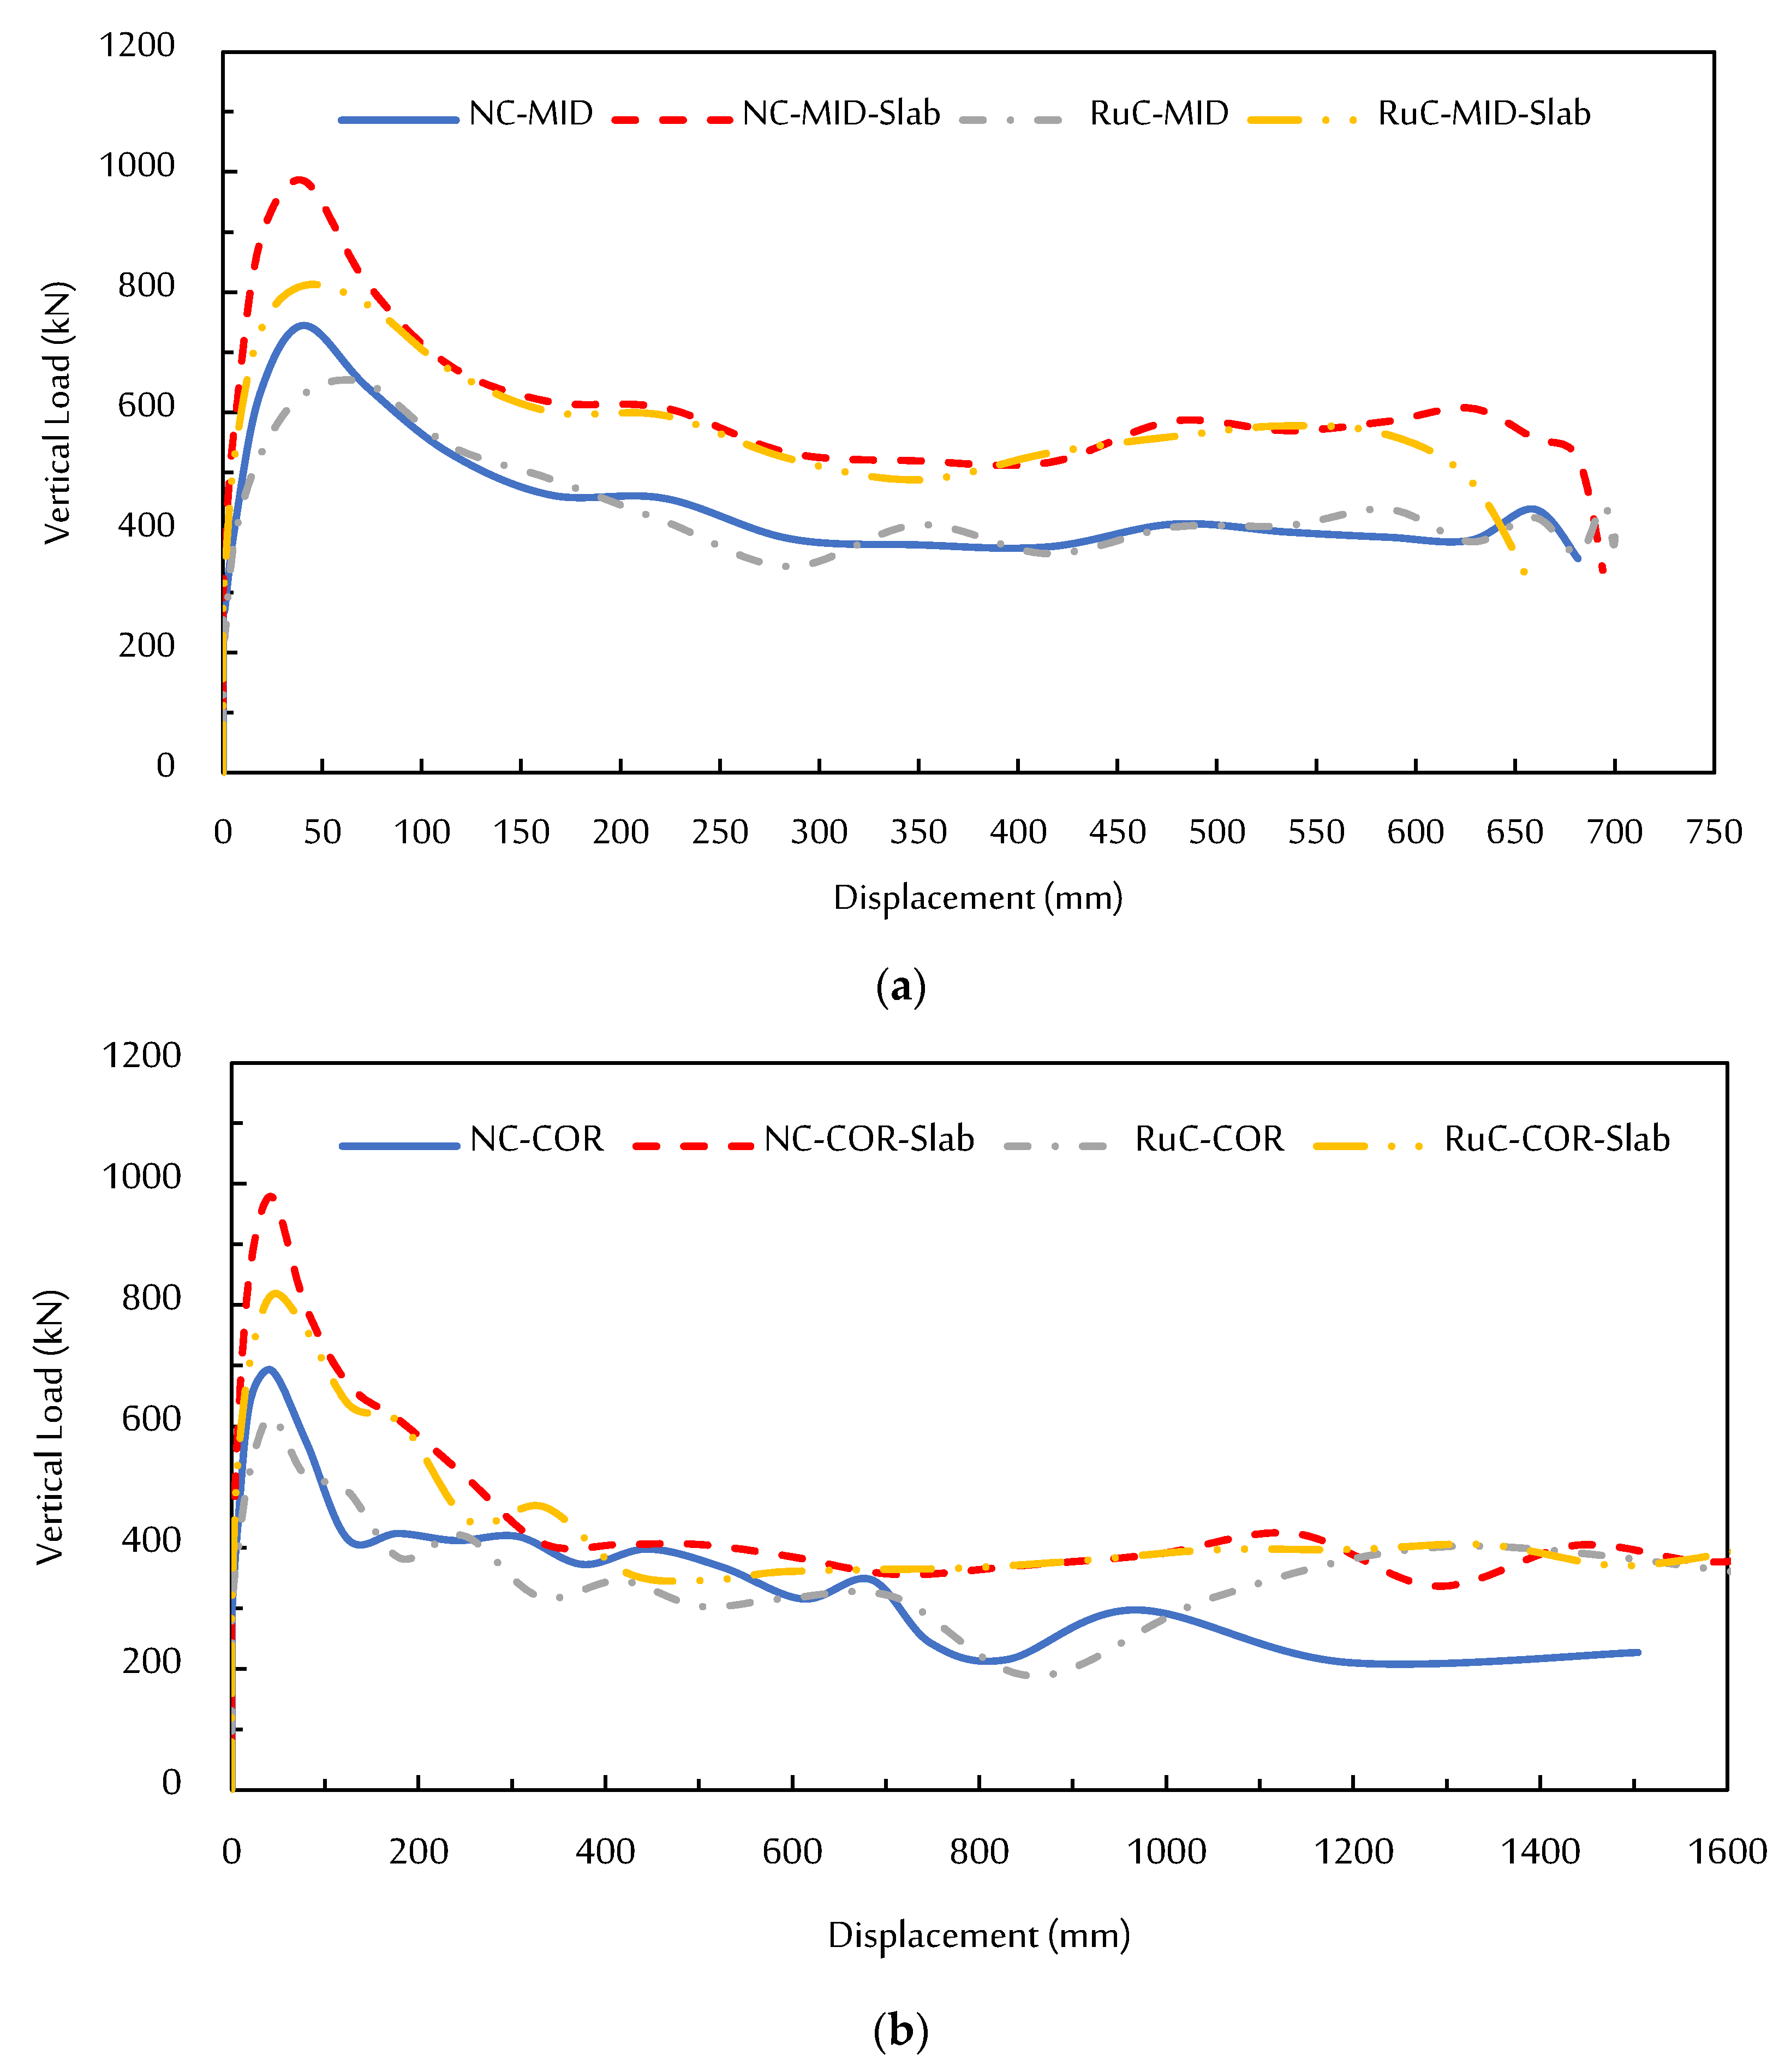
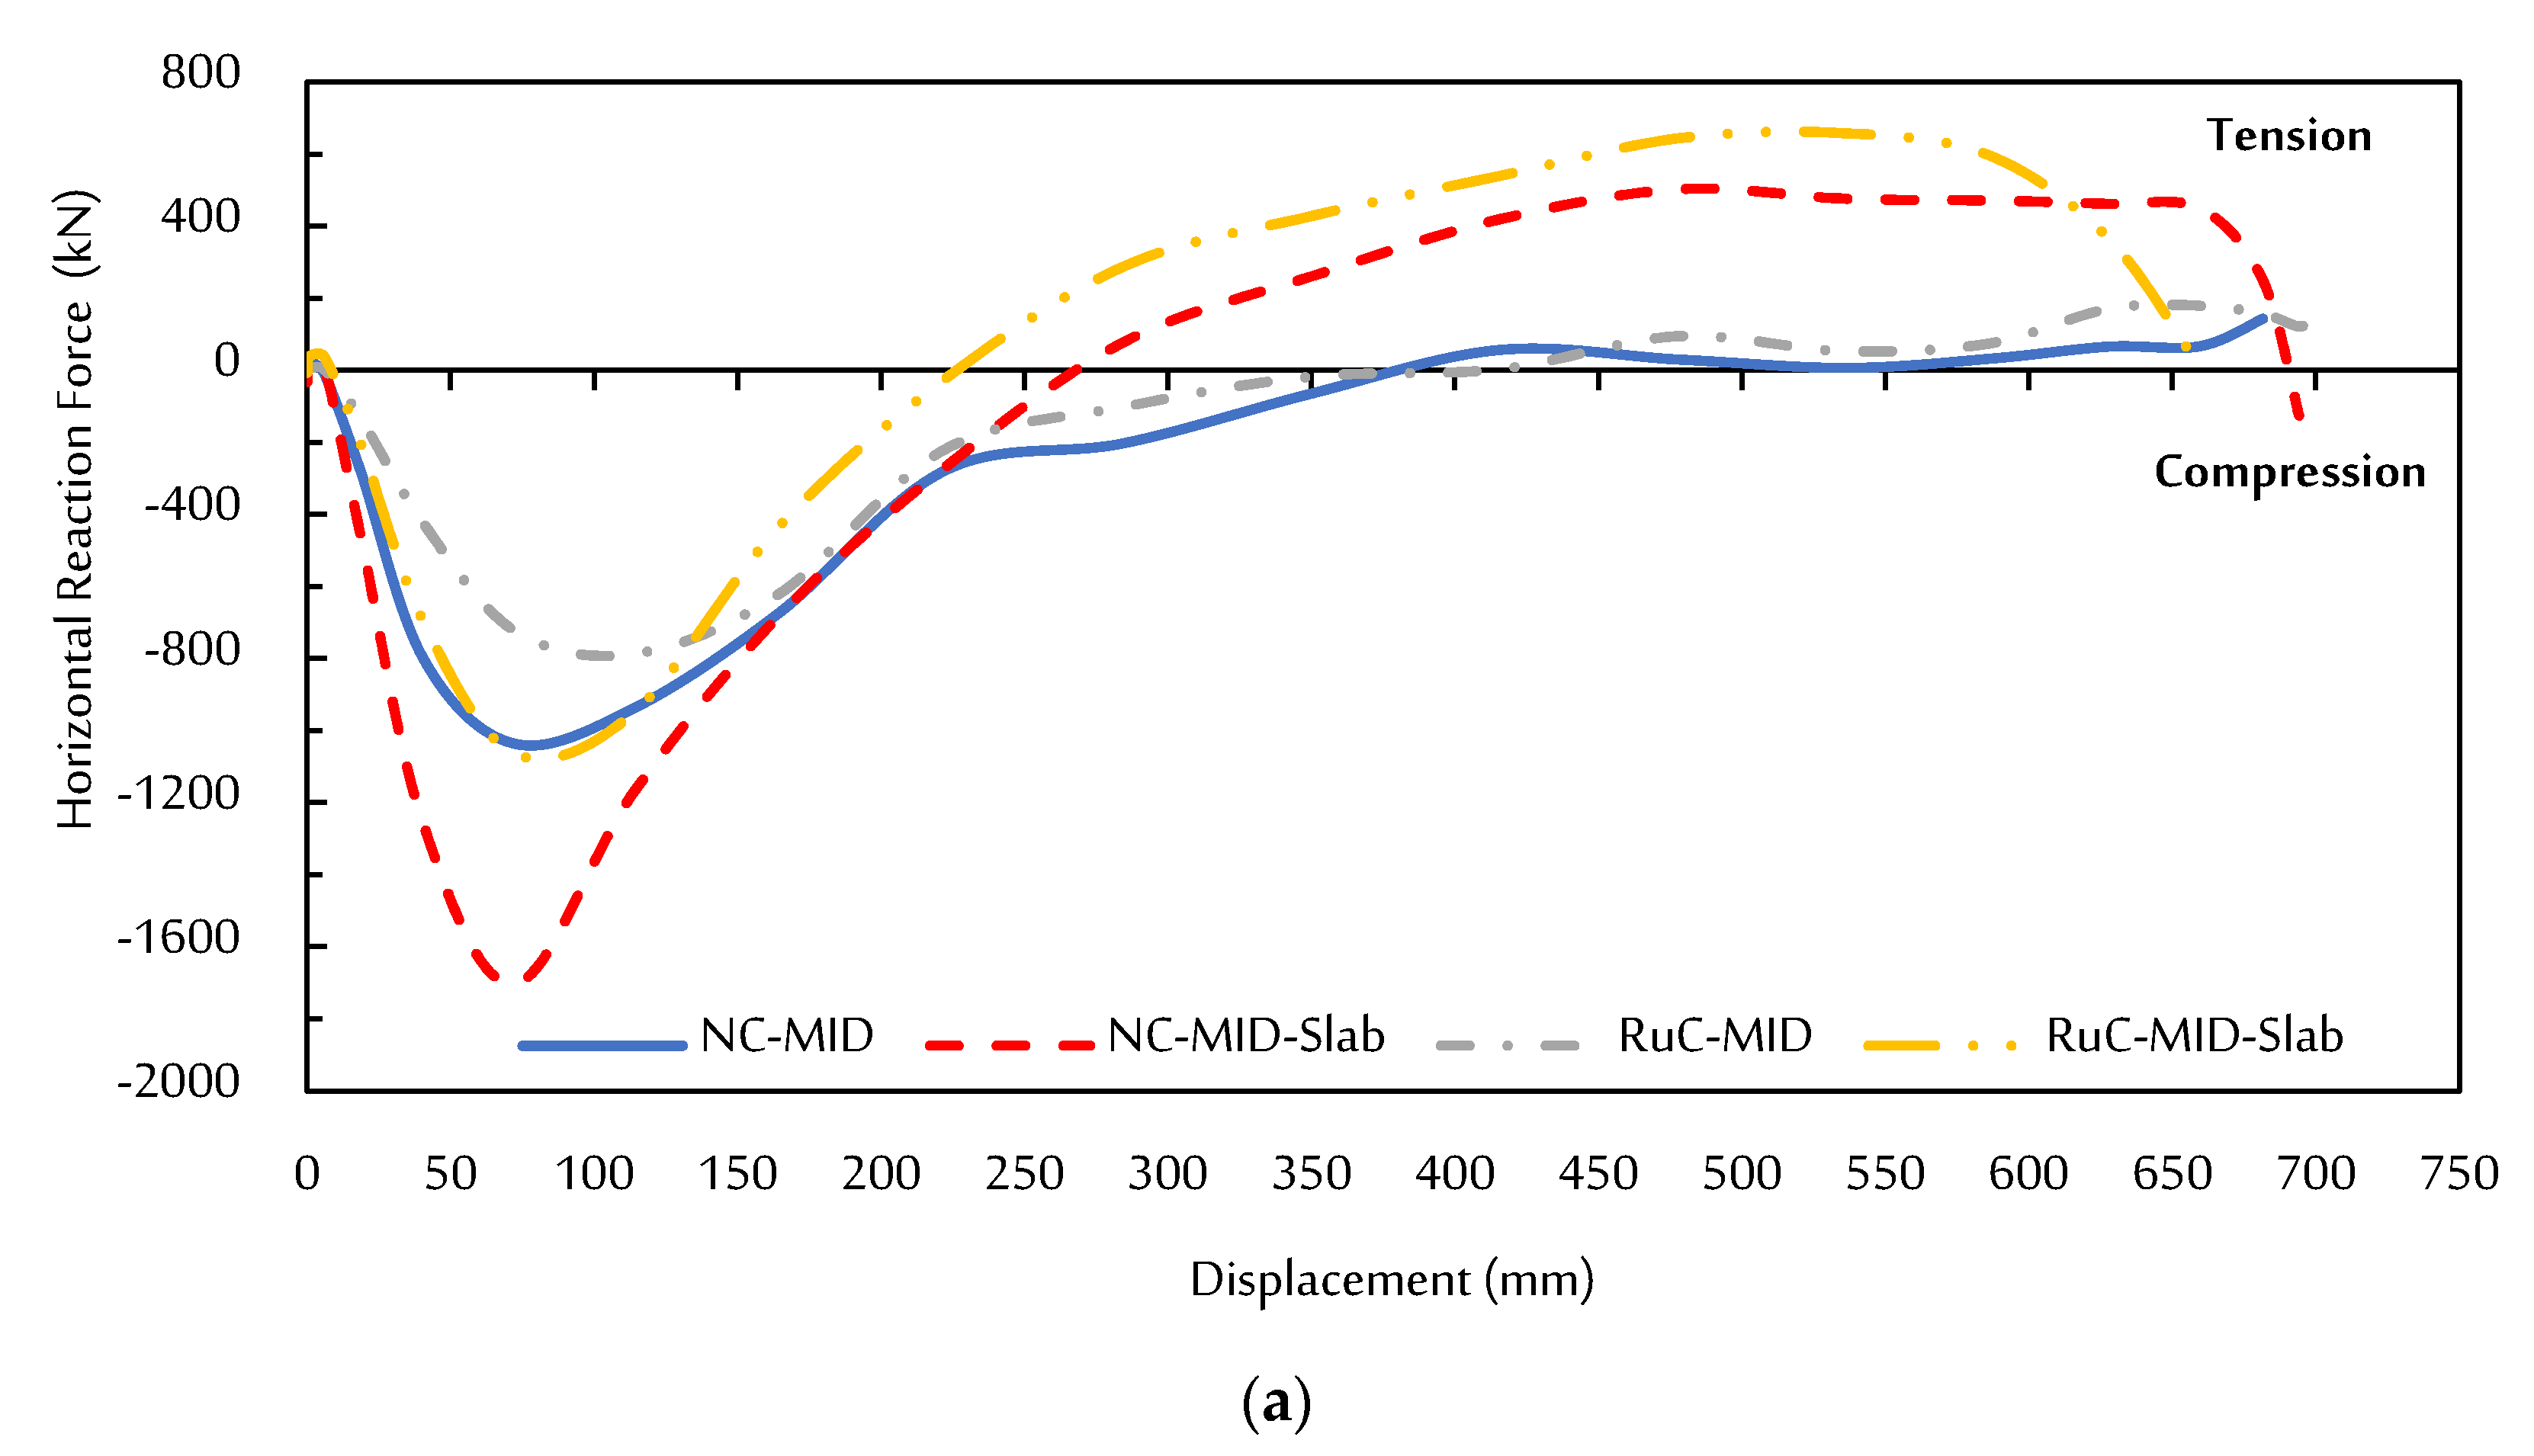
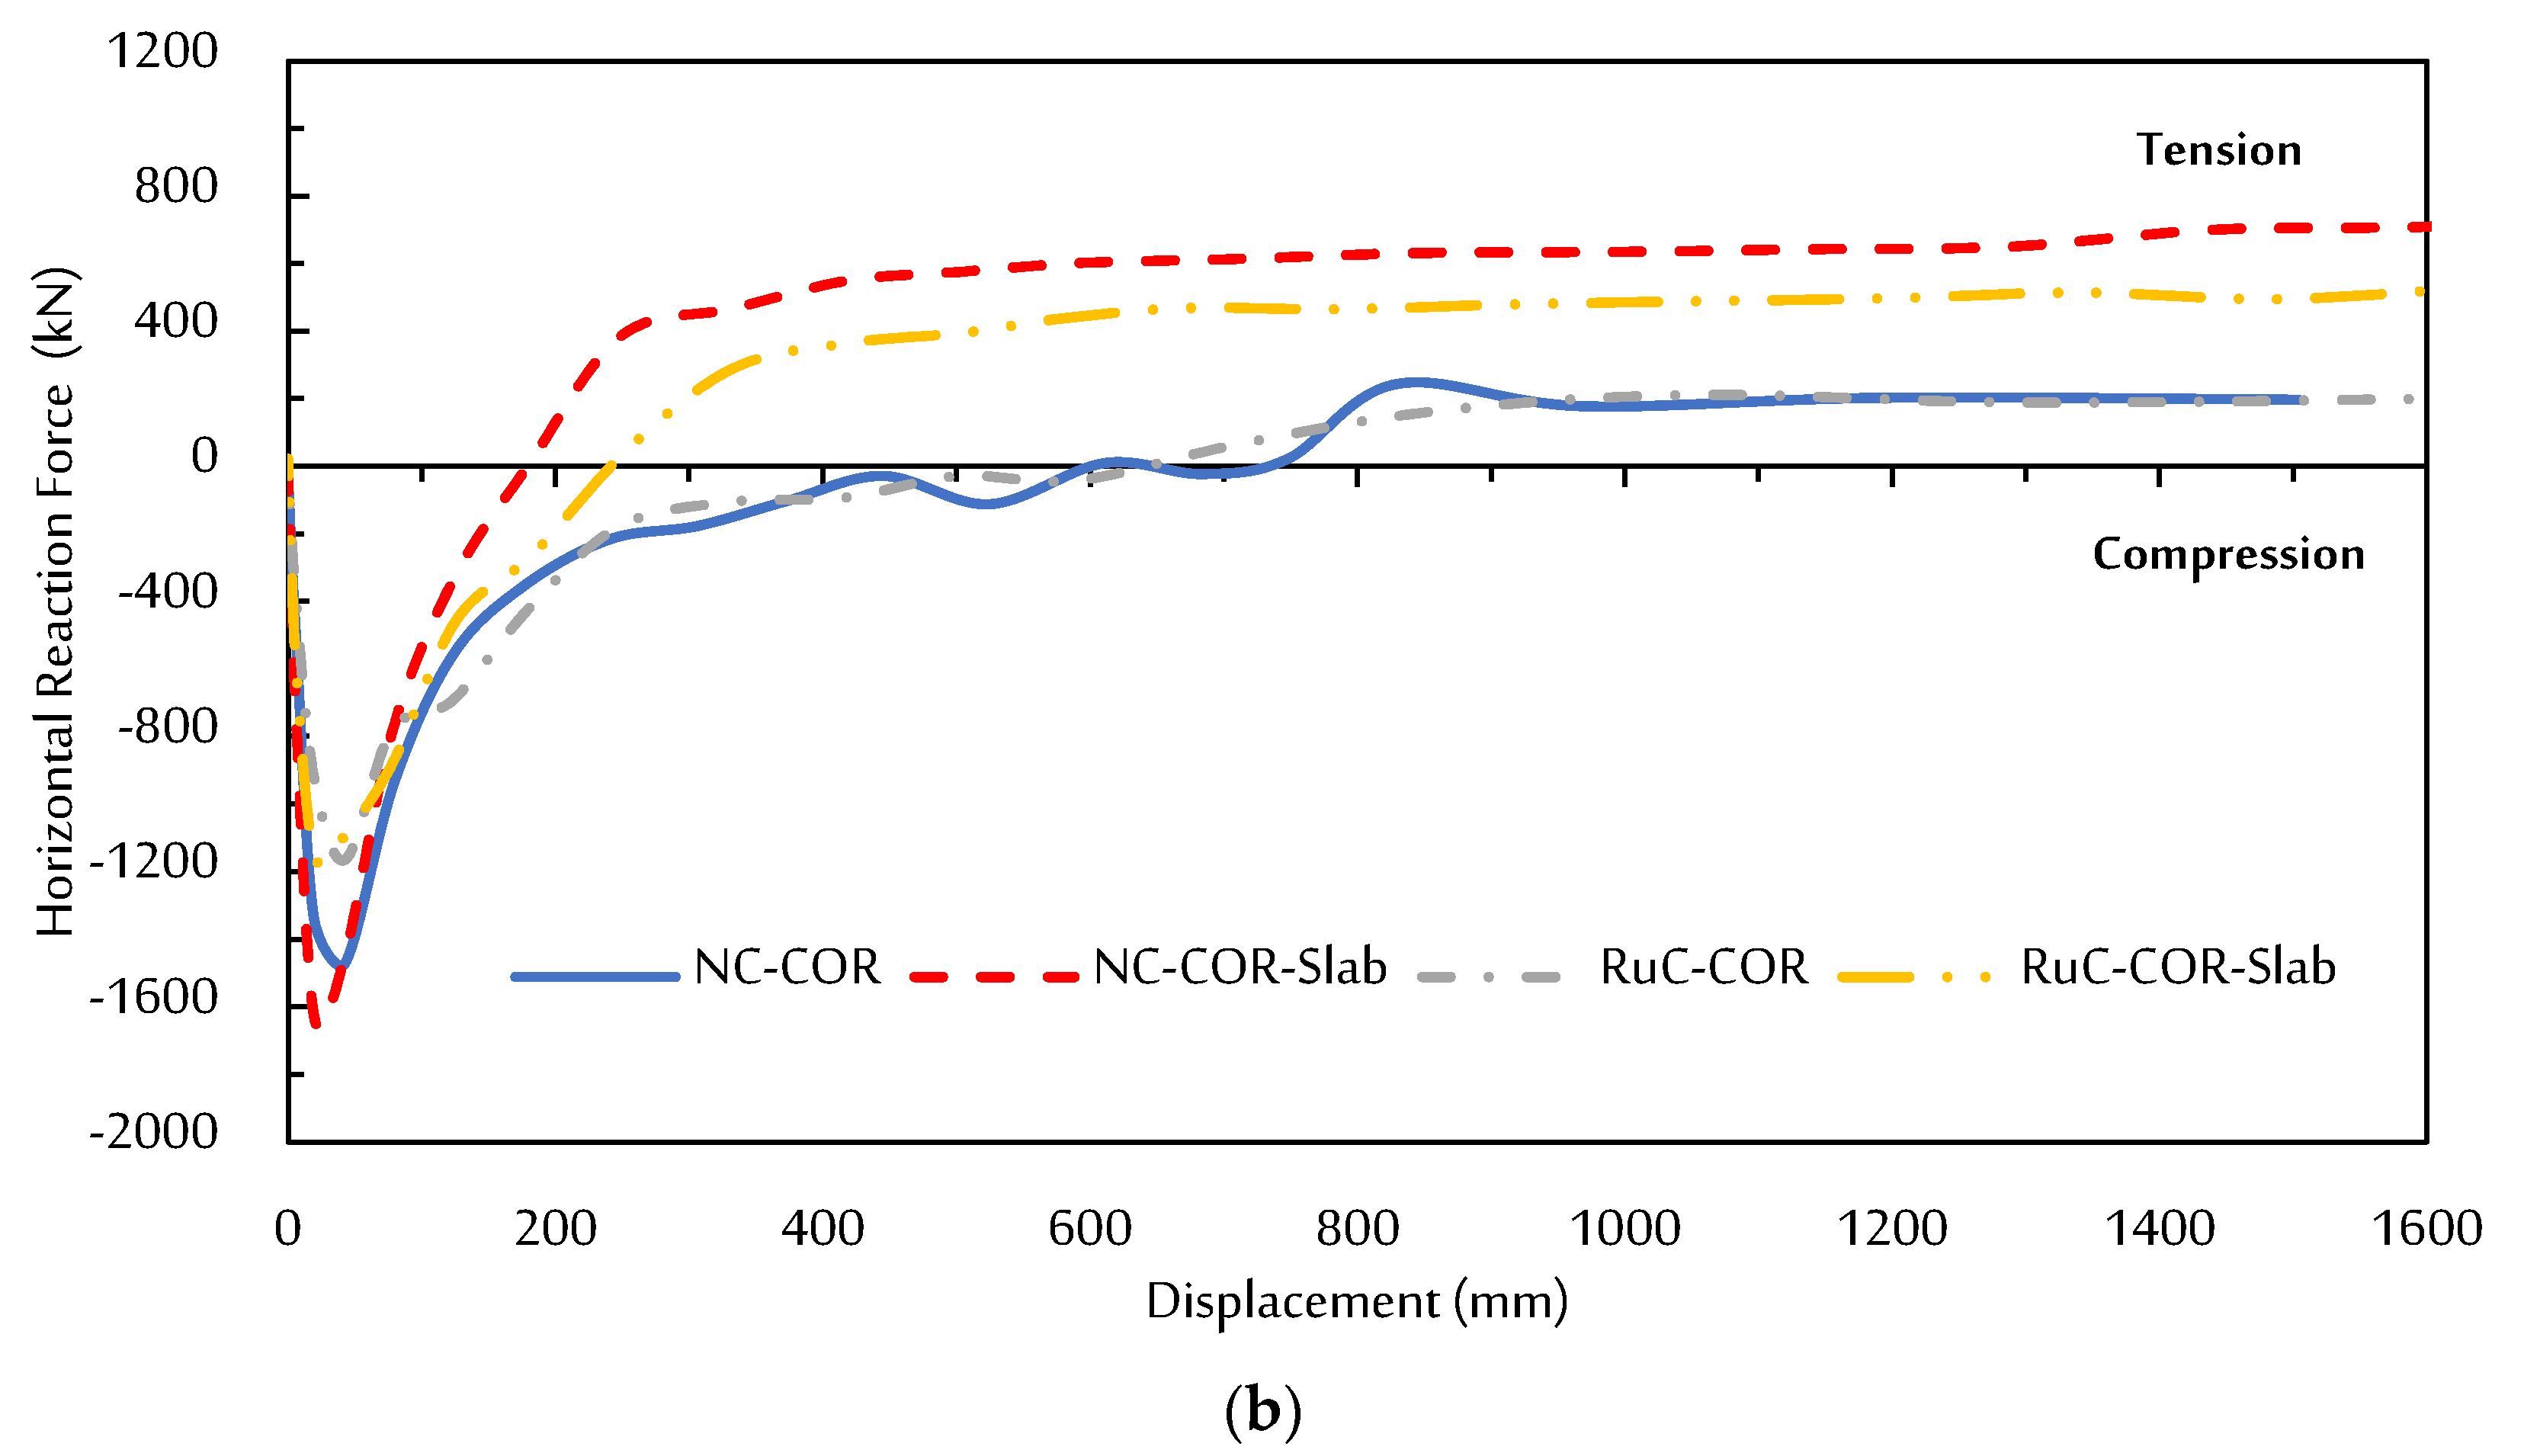
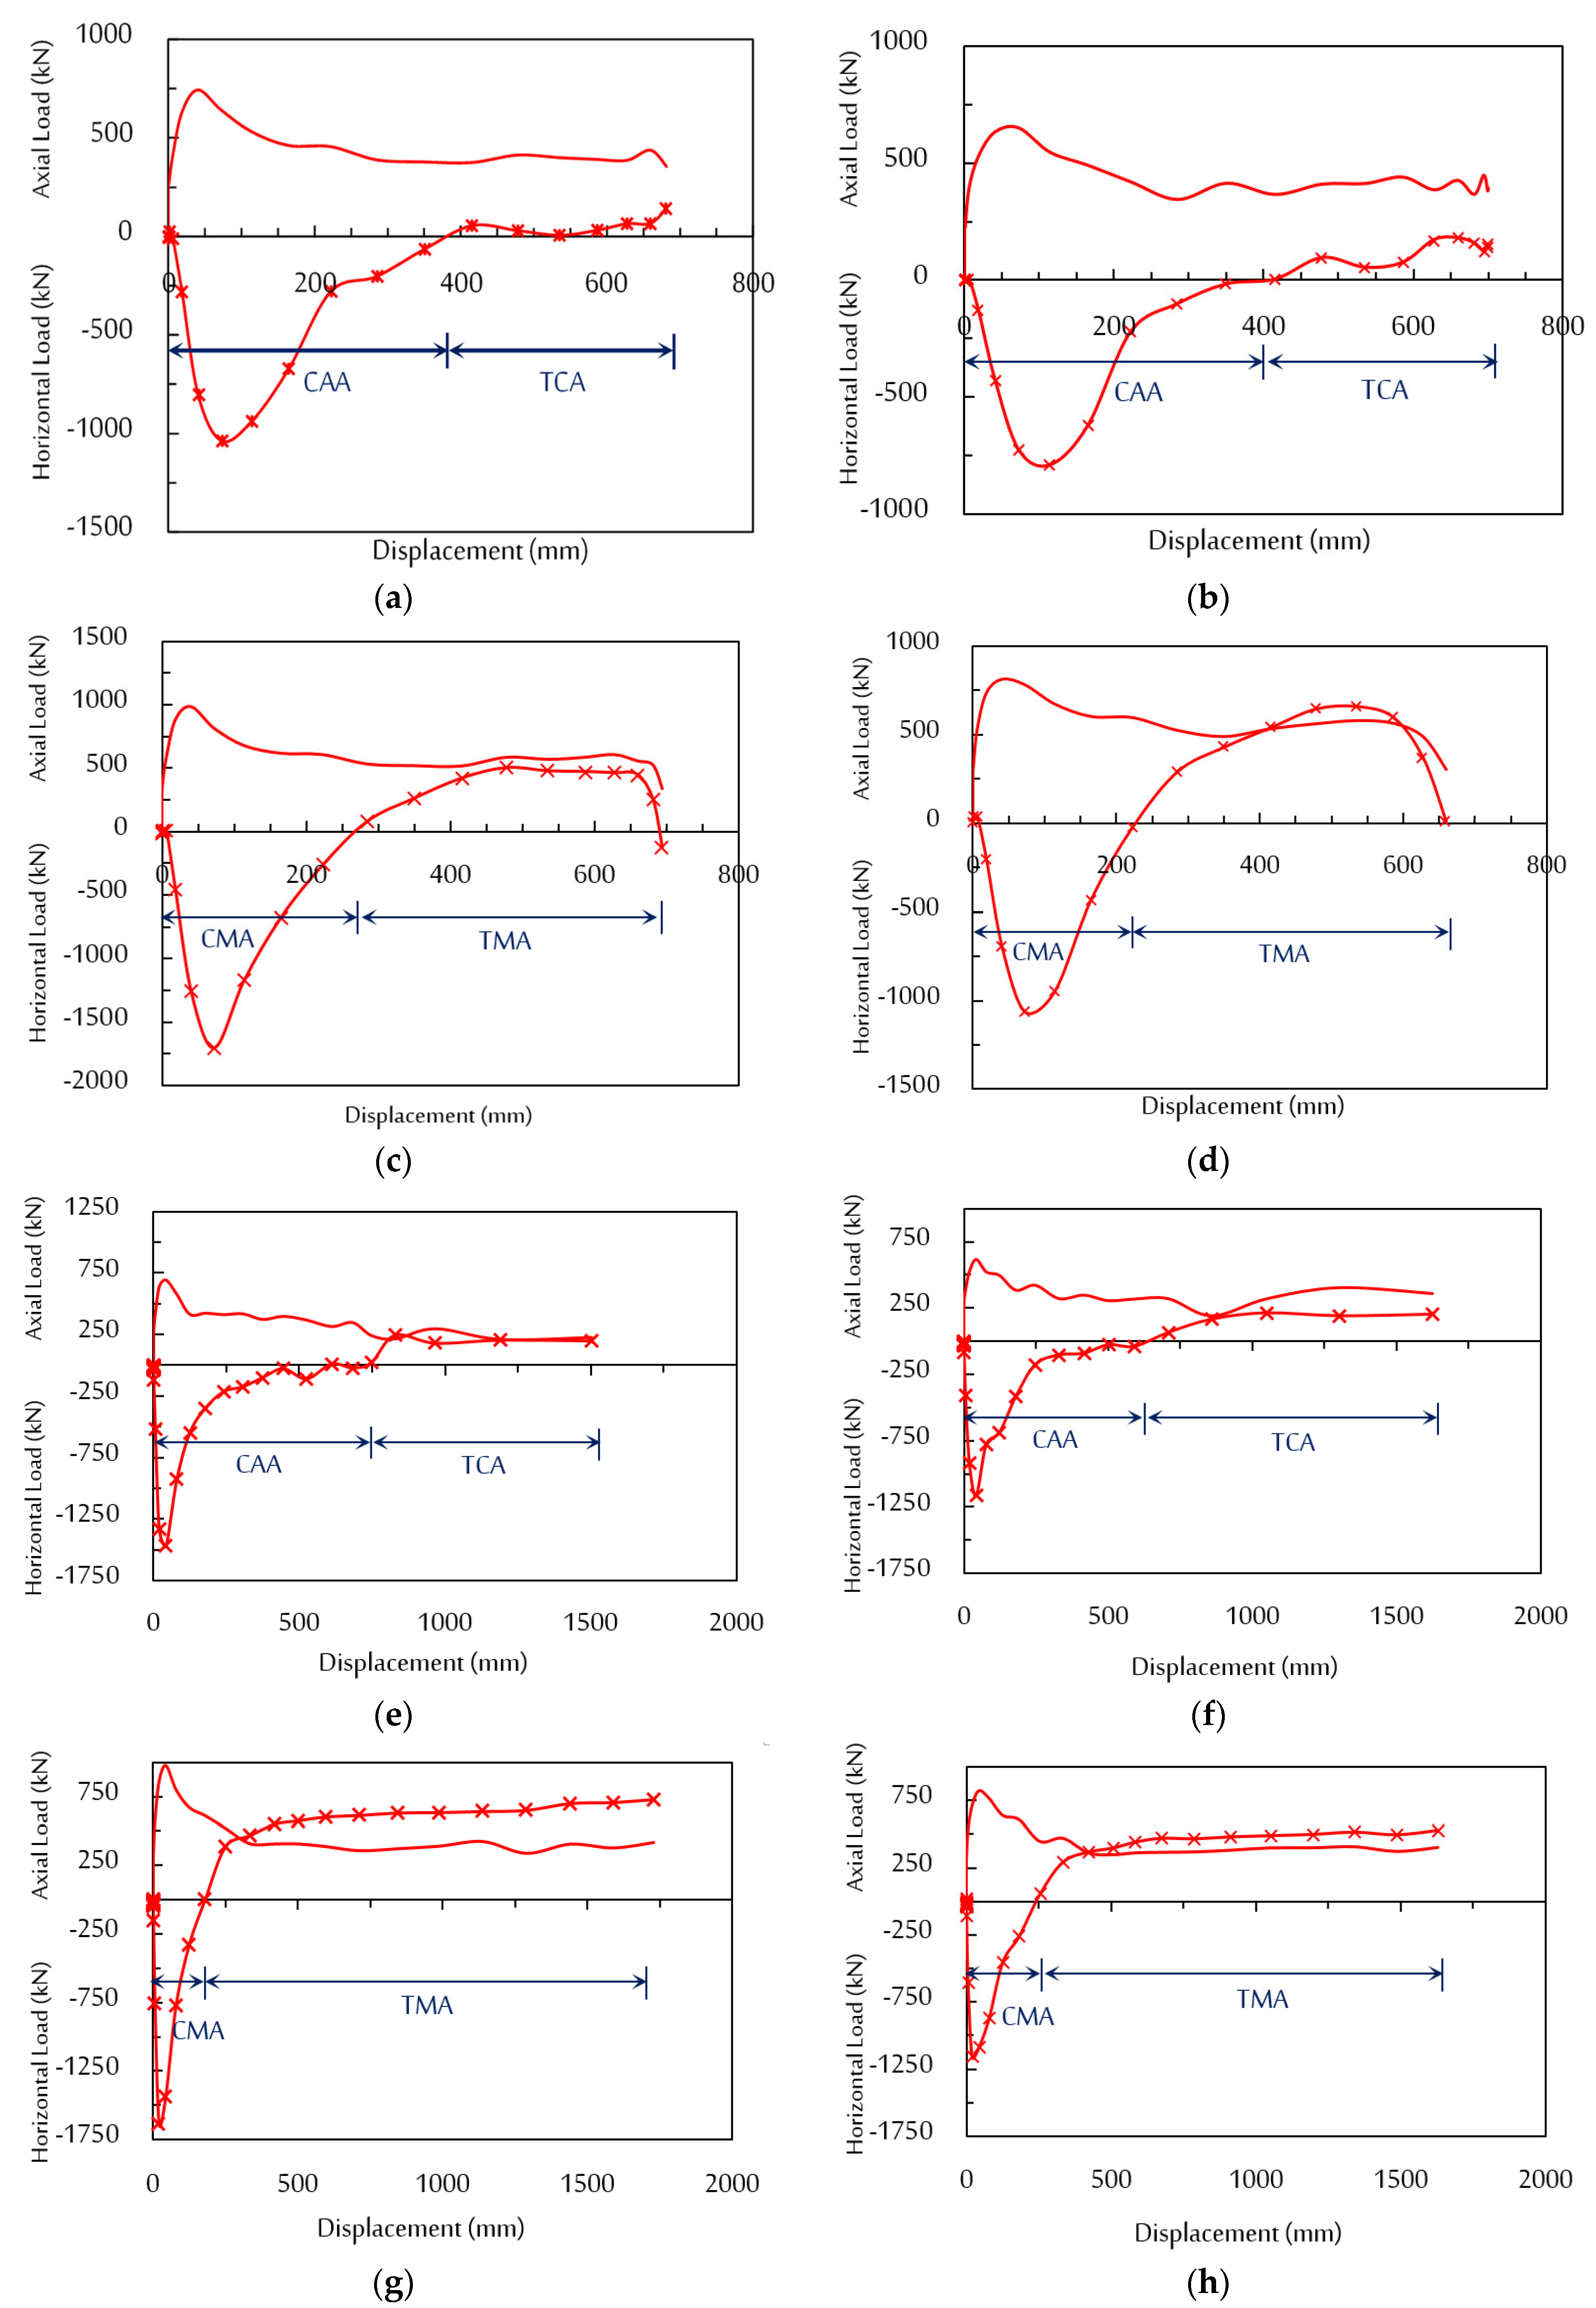
6.1. Load–Displacement Characteristics
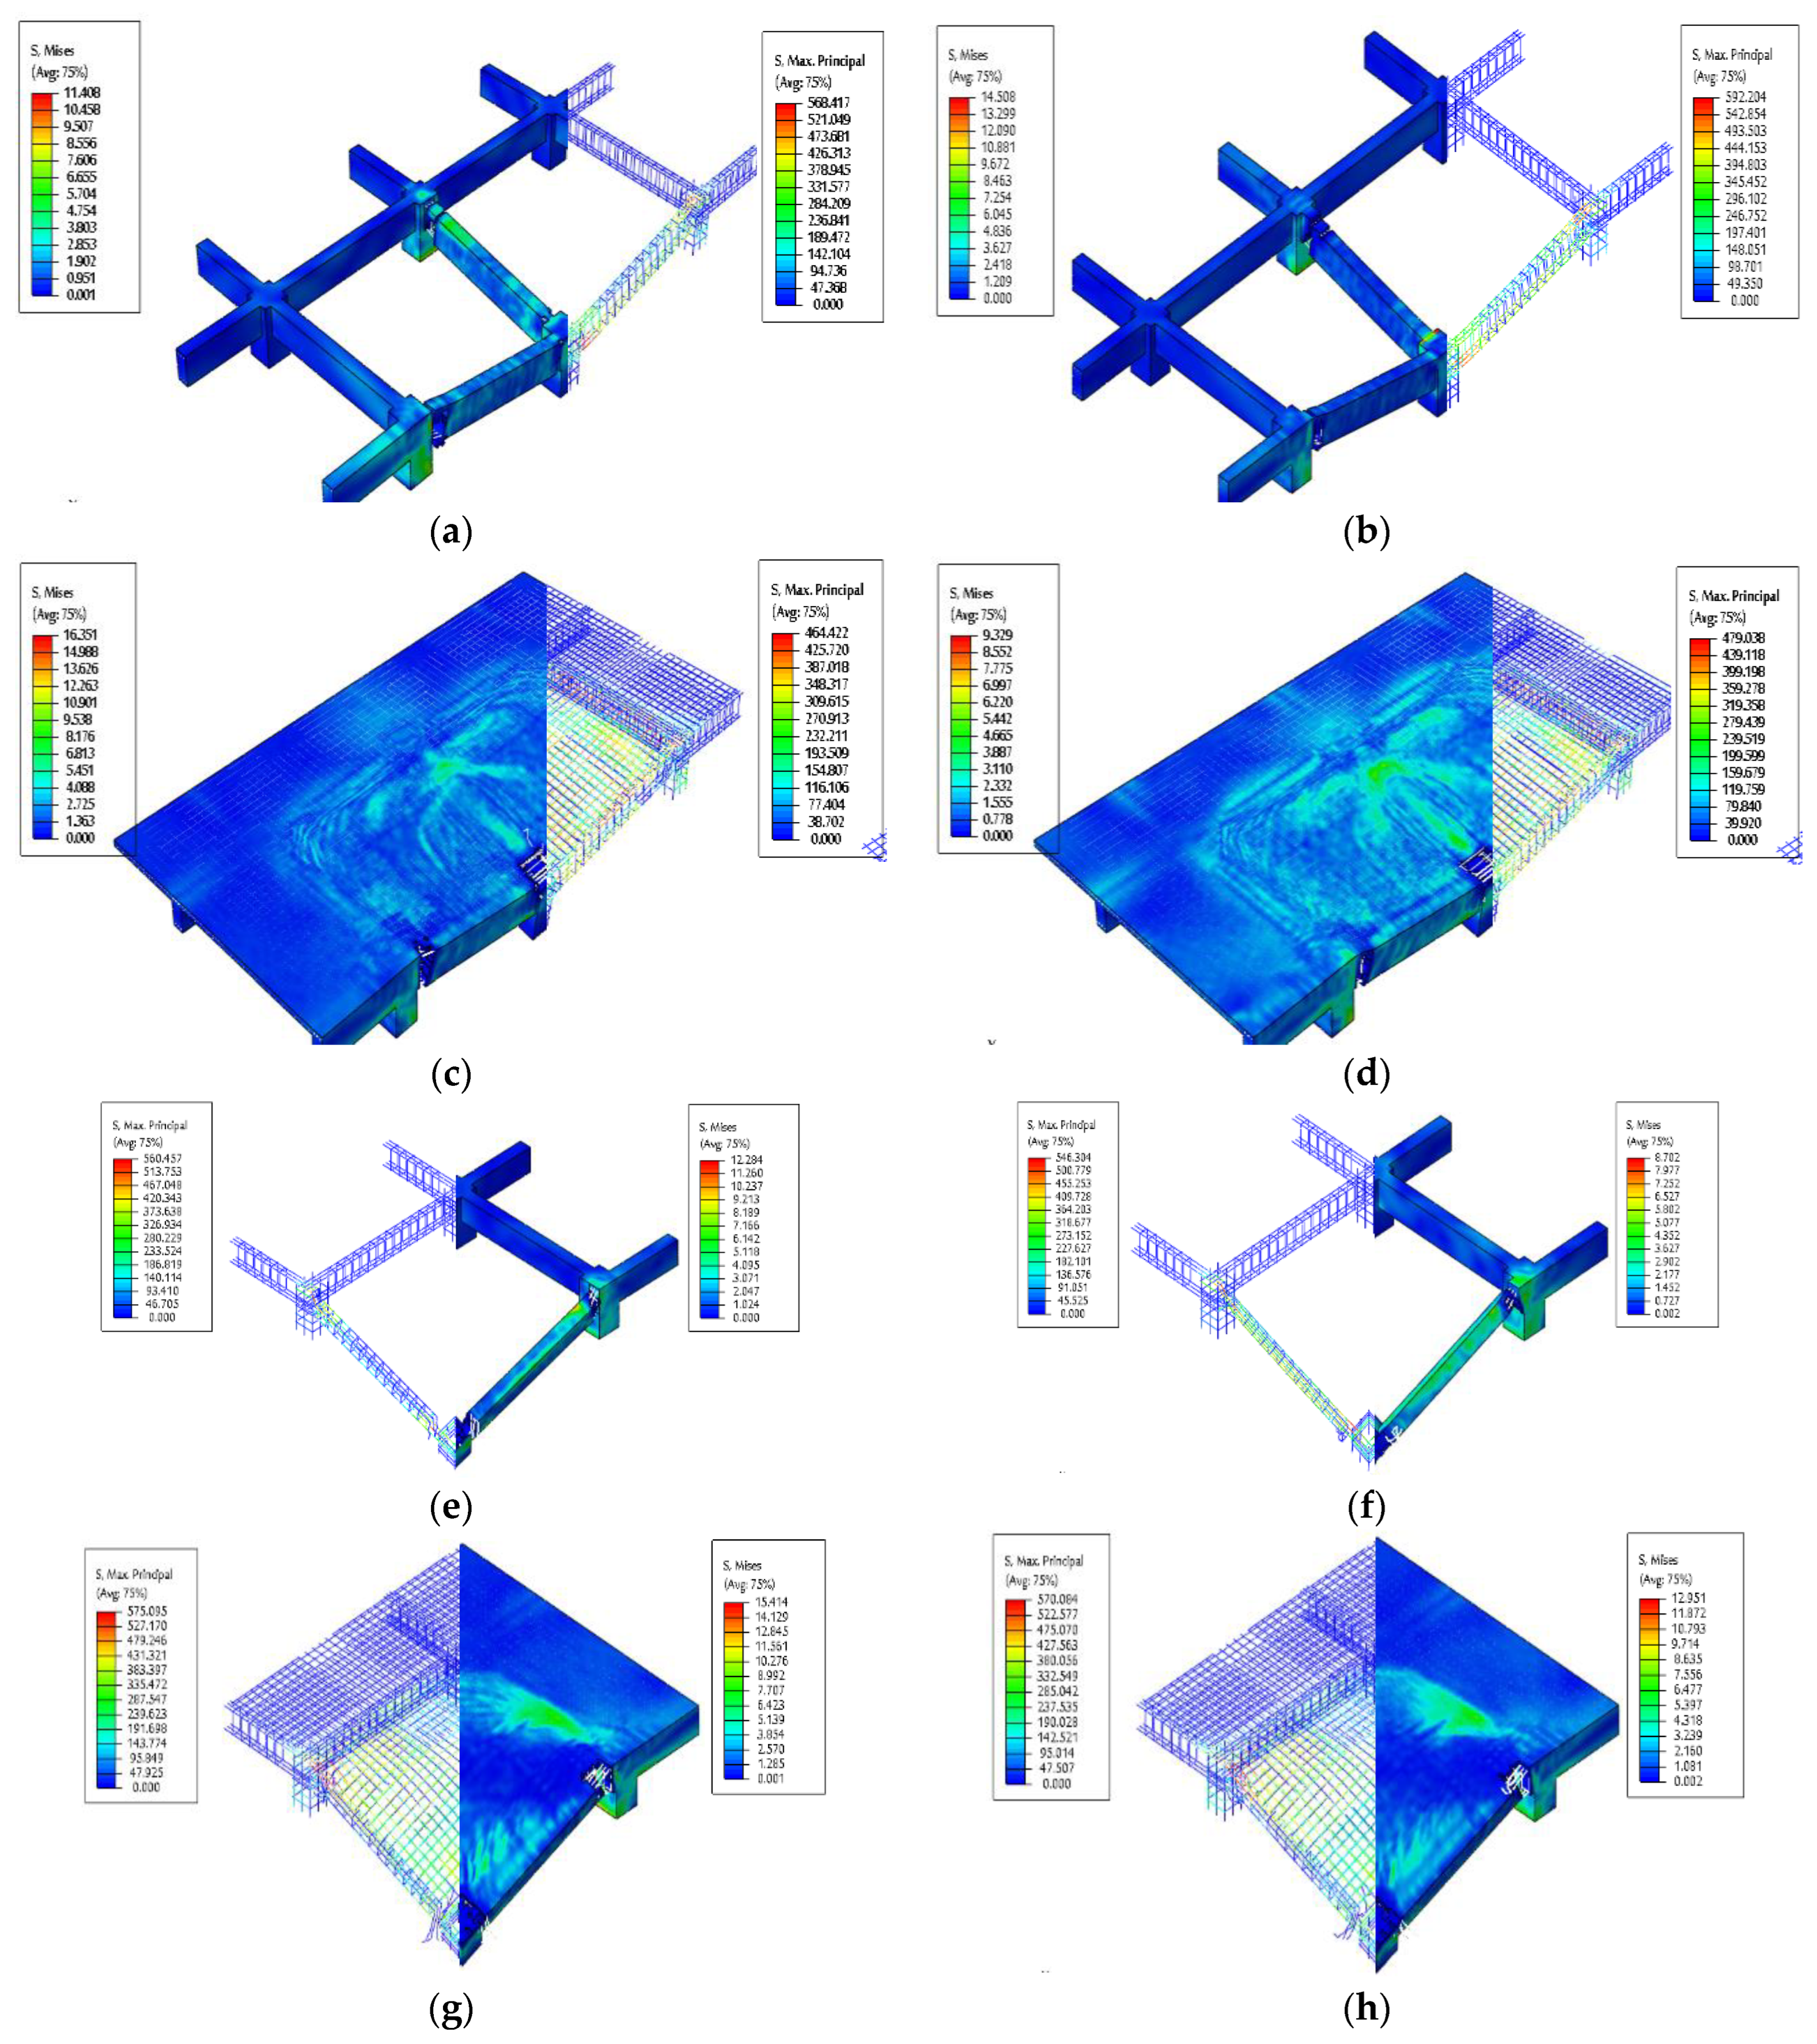
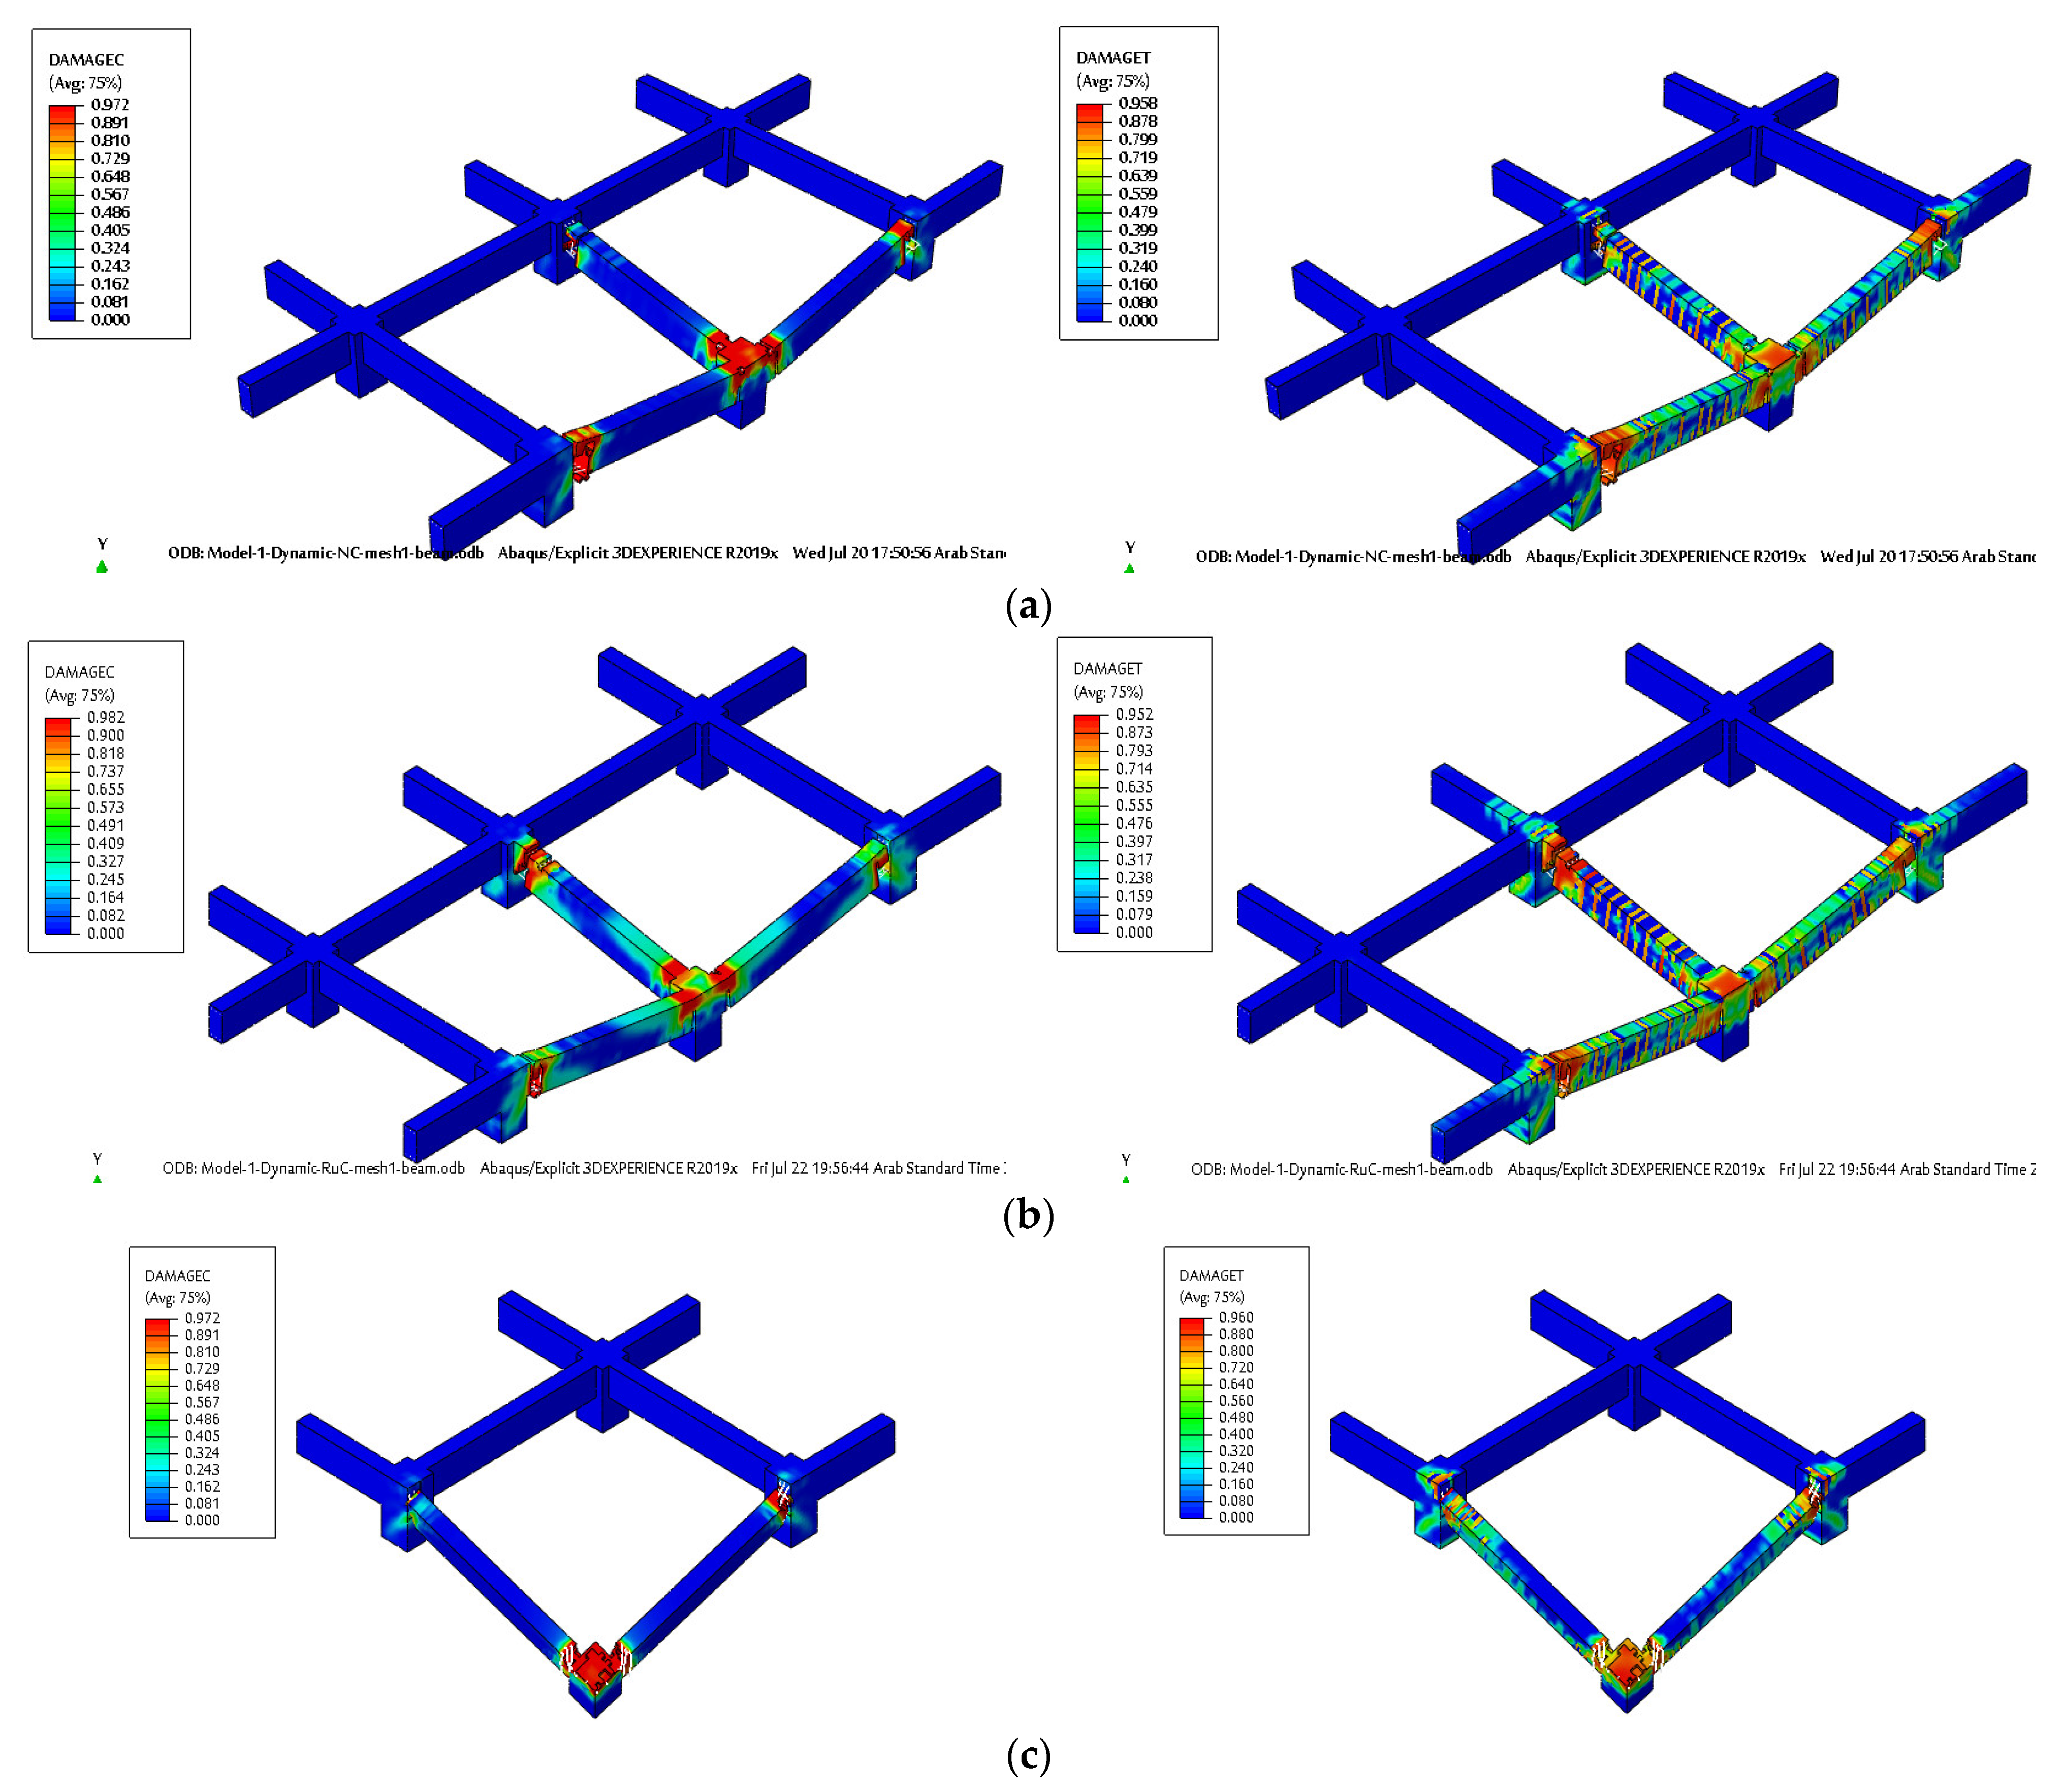
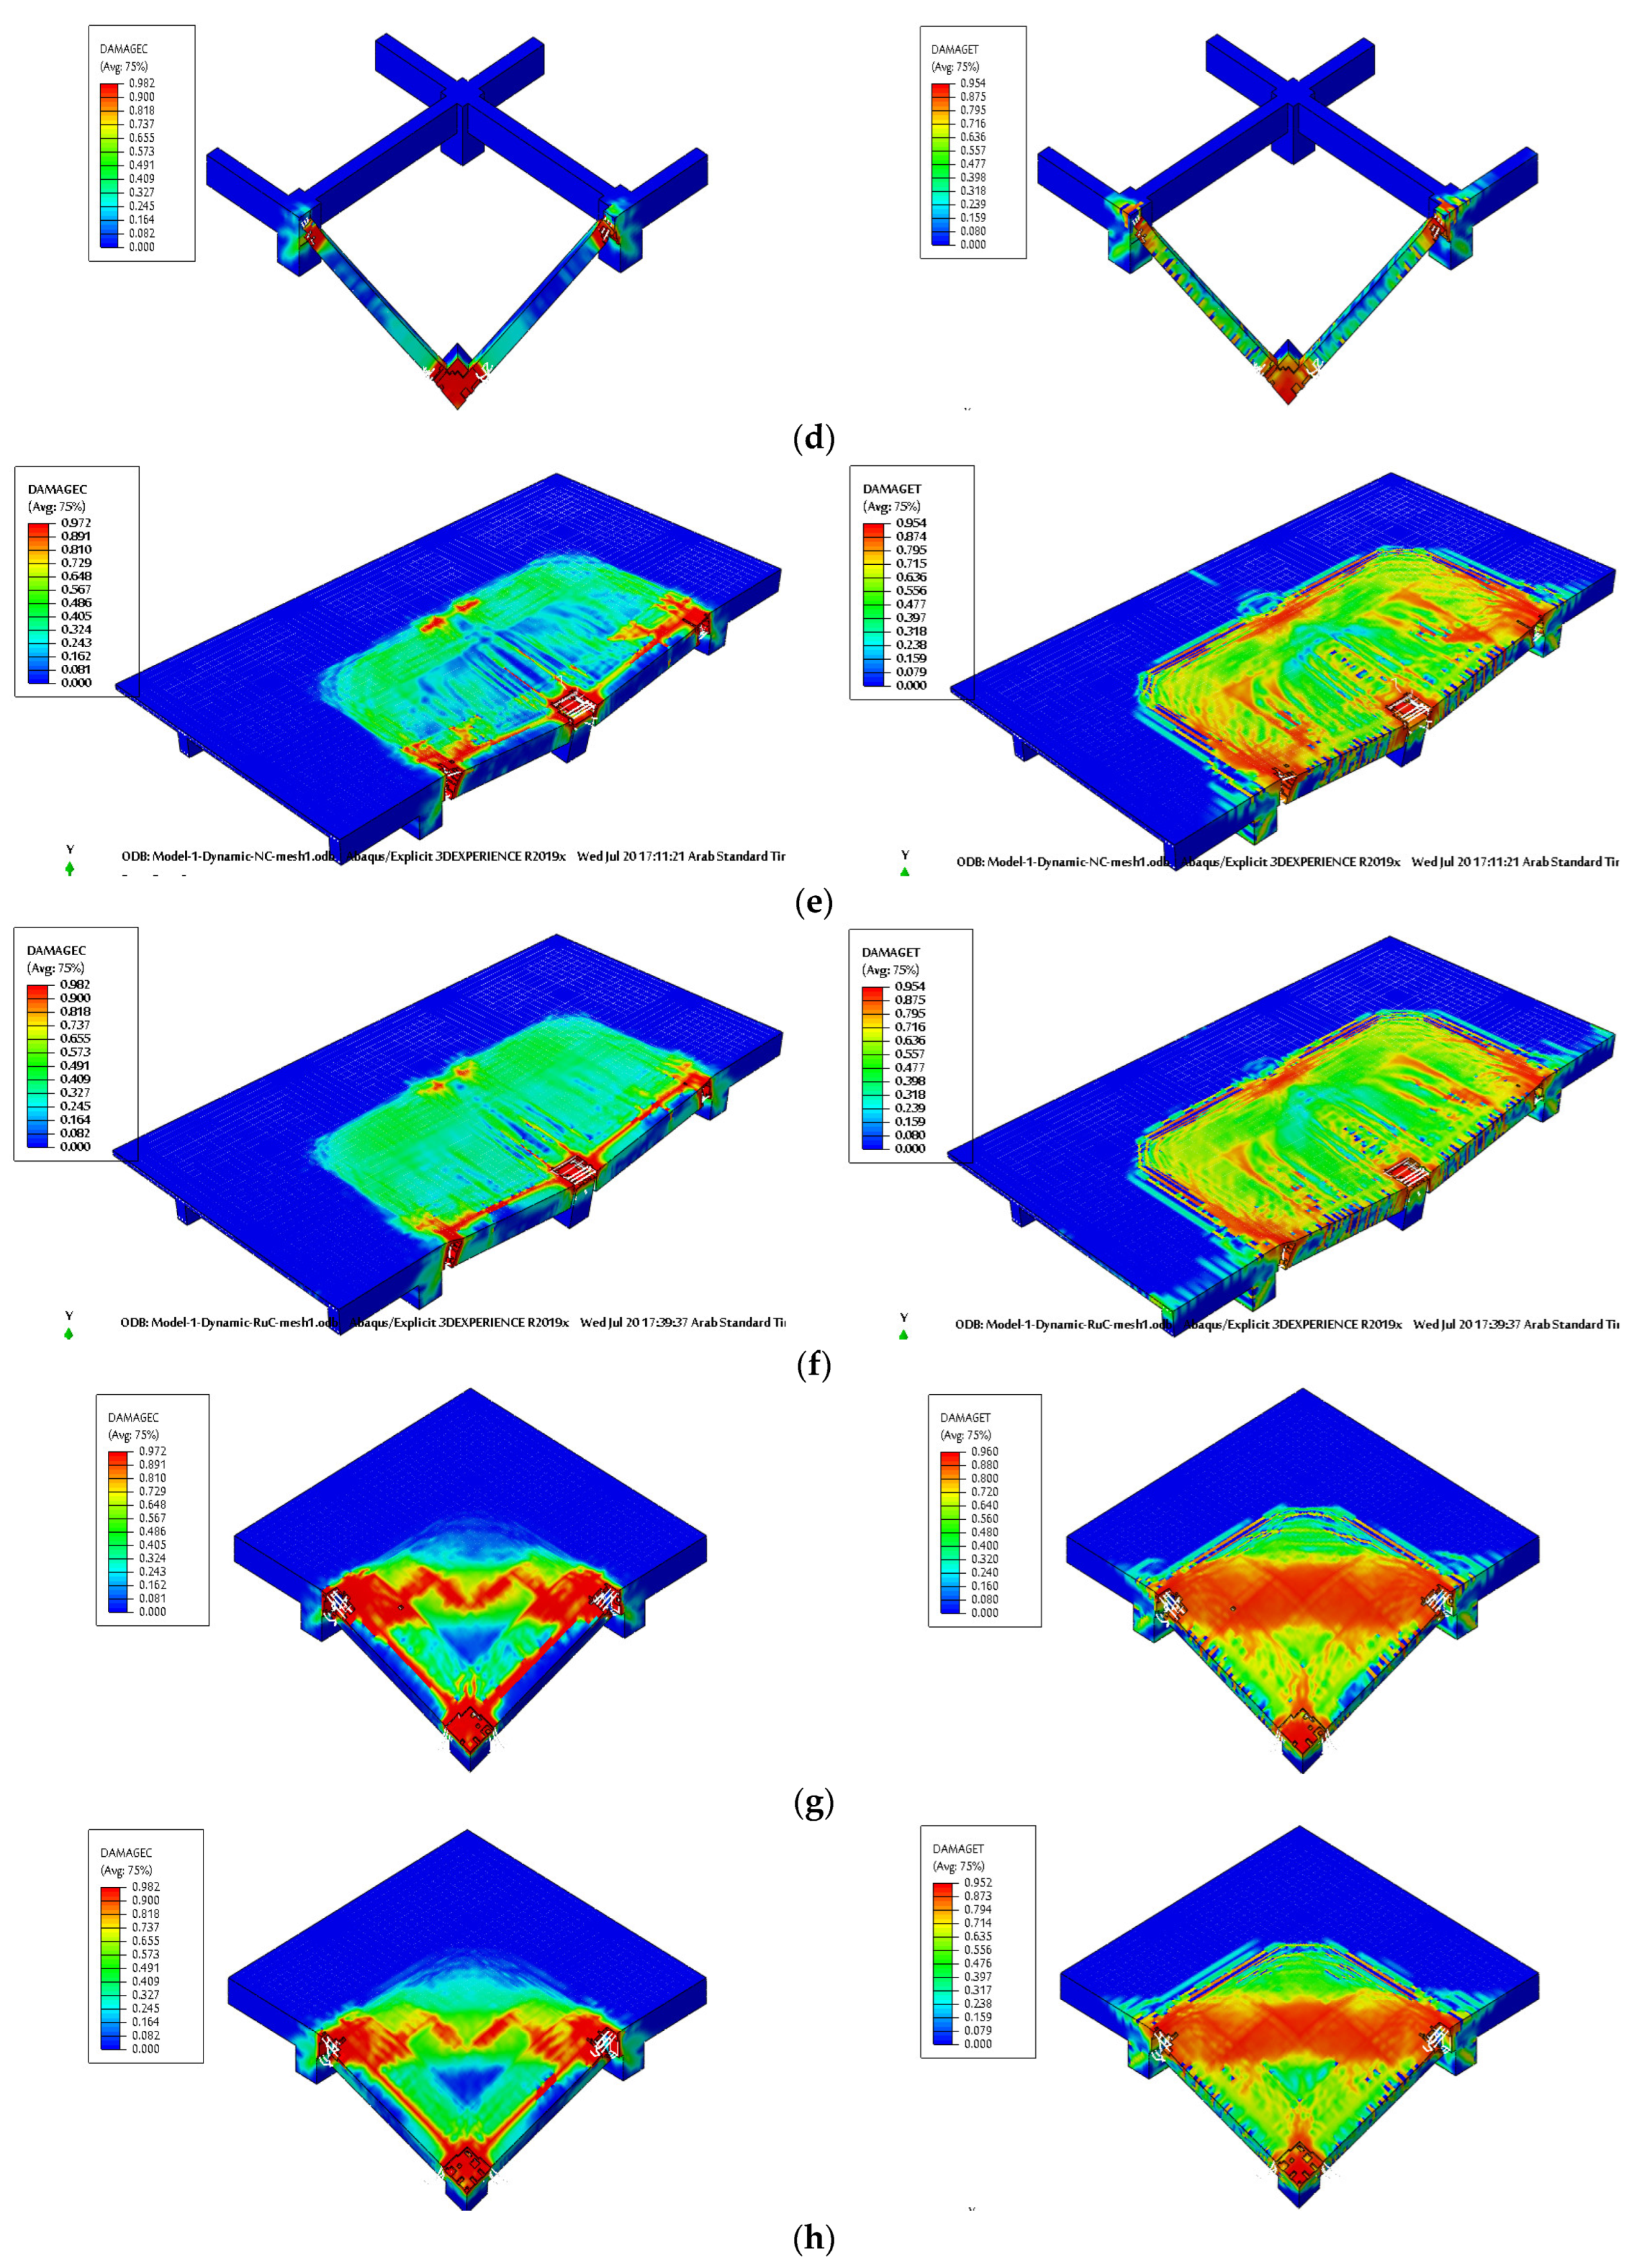
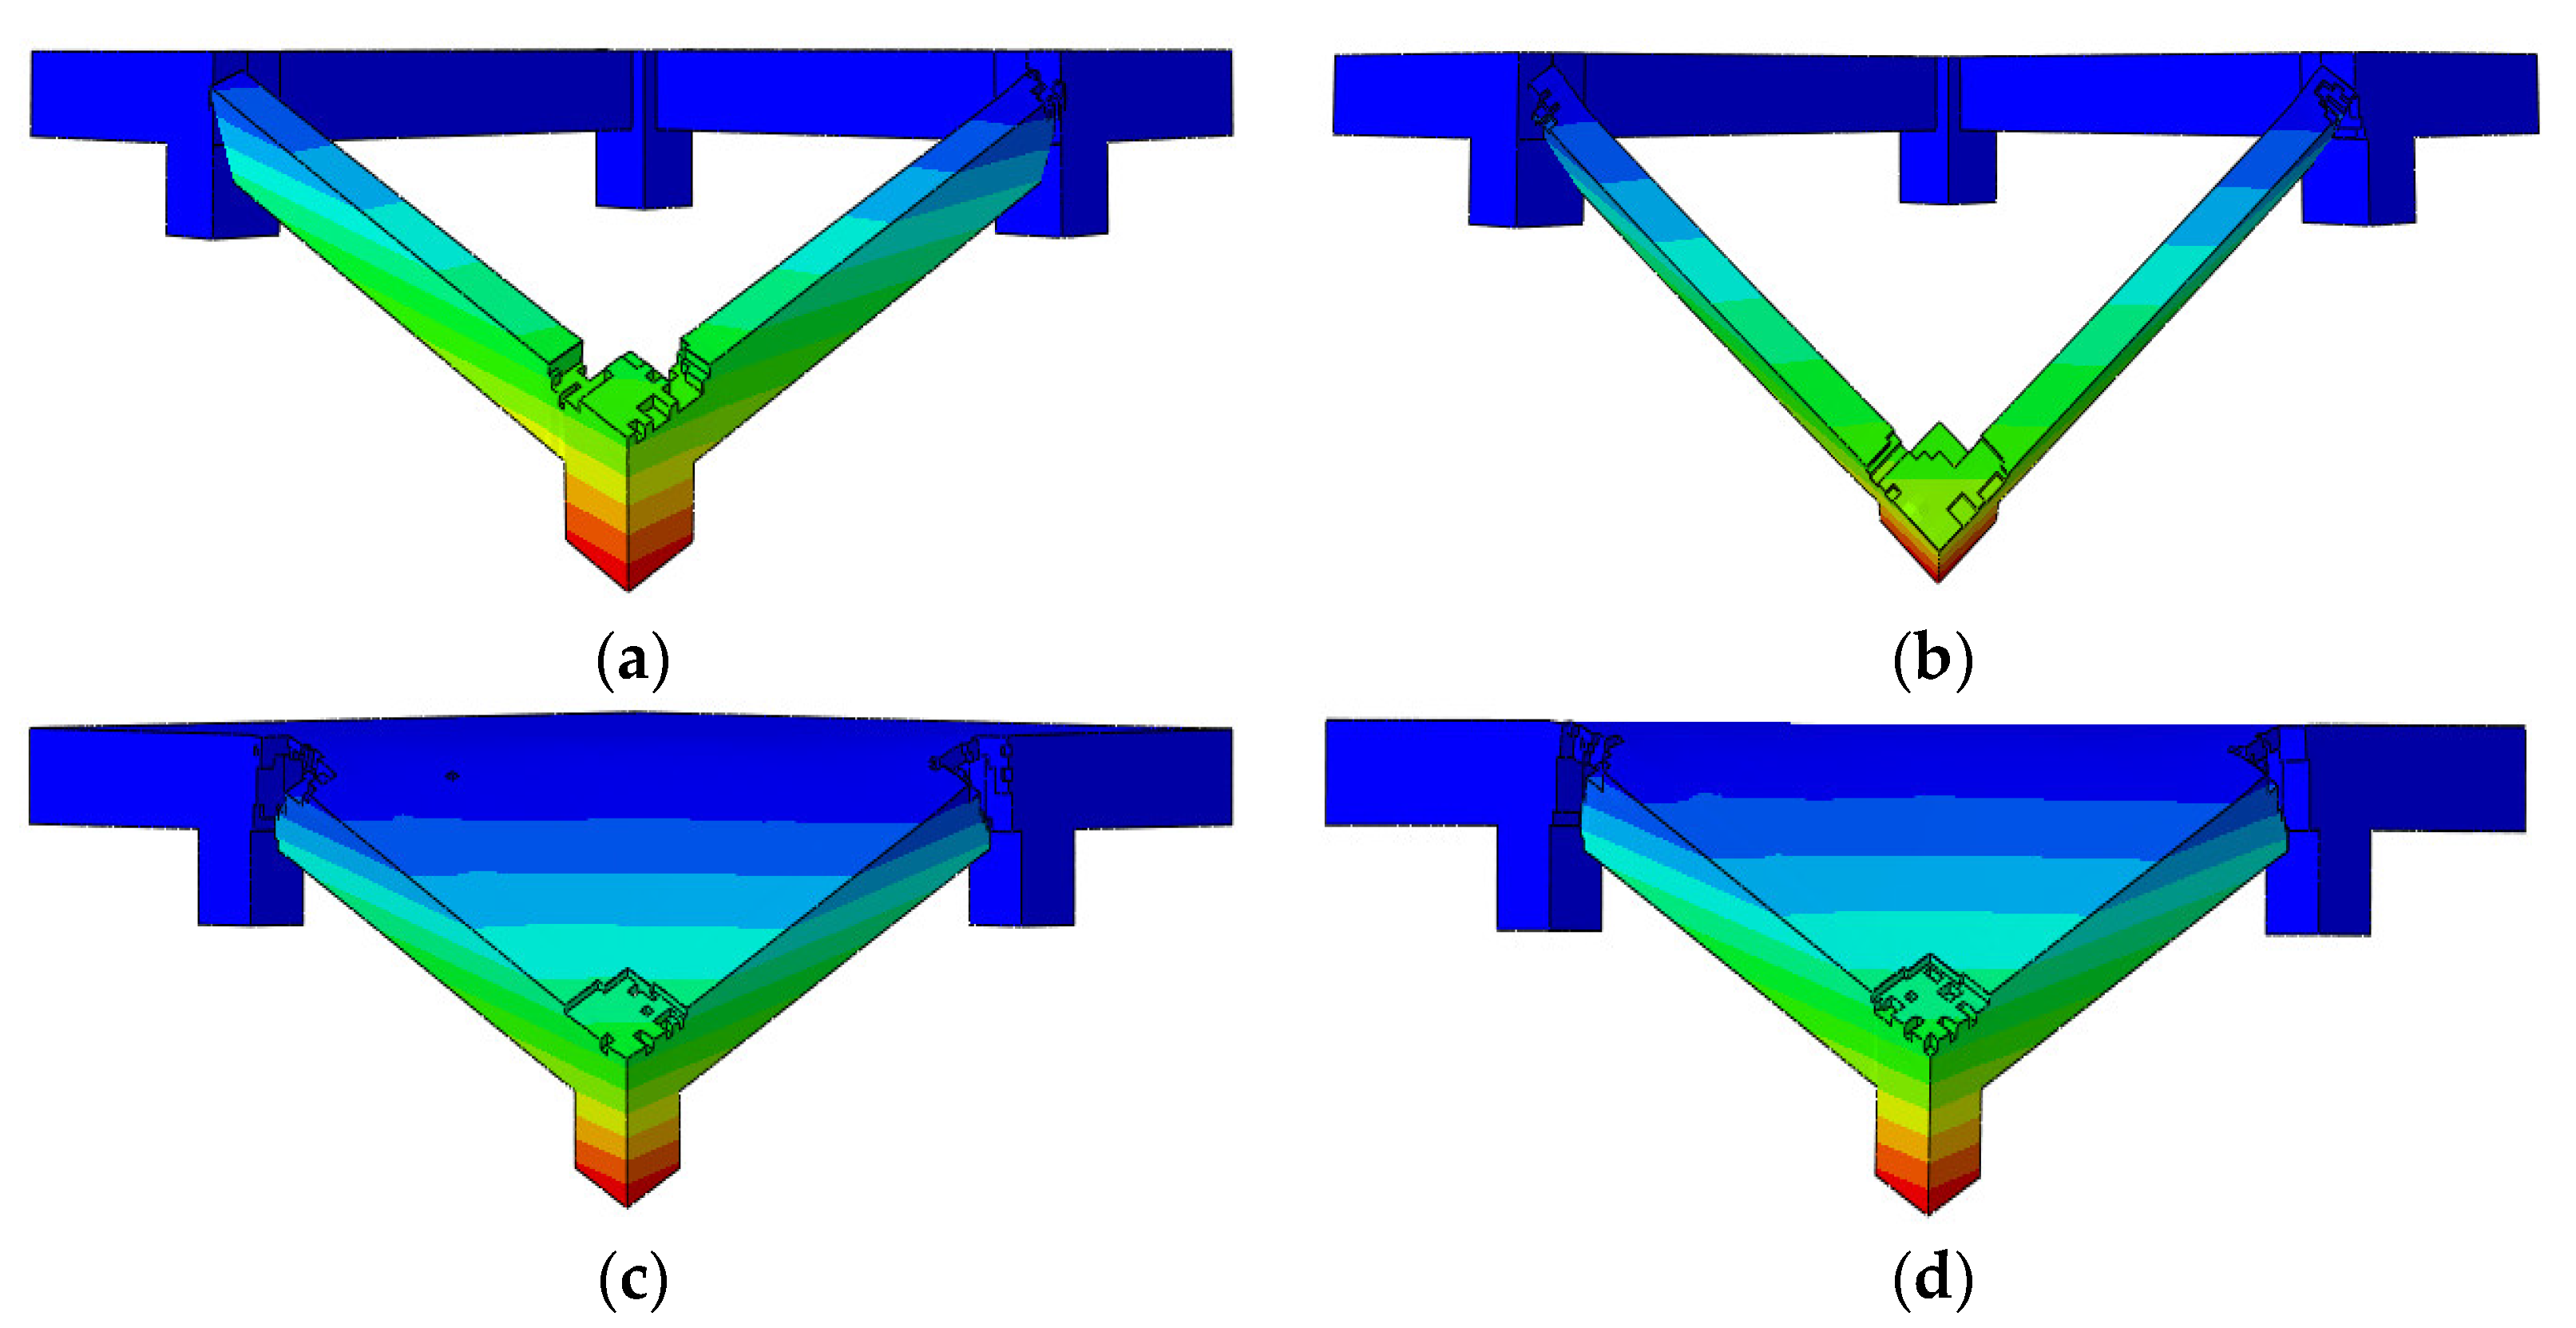
6.2. Analysis of Collapse Mechanisms
6.3. Effect of Slabs against Progressive Collapse
6.4. Effectiveness of the Use of Rubberized Concrete
7. Conclusions
- The FE simulation model produced extremely satisfactory findings in comparison with the available experimental test results in the literature for the load–displacement characteristics, crack patterns, and failure modes. It successfully addressed the majority of the issues relating to time savings, cost savings, and the potential risk of progressive collapse in experimental tests of the 3D beam–slab substructures.
- The inclusion of the slab mechanical properties in the FE modelling increased the load resistance by an average of 33% for the tested specimens, and it also improves the frame’s stiffness, ductility, and integrity. Moreover, the specimens with slabs exhibited higher potential for energy absorption, which reached up to 55%.
- Compared to the specimens without slabs, the specimens with slabs have significantly higher progressive collapse resistance. The increase ratios reached up to 40% under small deformations (i.e., the beam mechanism) and up to 58% under large deformations (i.e., the catenary mechanism).
- Compared to NC specimens, the RuC specimens recorded a reduction in the maximum vertical load as a result of lower compressive strength and modulus of elasticity. The reduction ratio reached up to 21% and 15% for RuC specimens with and without slabs, respectively.
- Comparing the energy absorption of RuC specimens, it was found that NC specimens recorded a slight increase in energy absorption that reached up to 10.7% in the case of presence slabs, while RuC specimens recorded an increase in energy absorption that reached up to 17.6% in the case of absence slabs.
- The significant differences between the NC and RuC mixture appeared in the CAA/CMA stage, in which the distribution of DAMAGEC and DAMAGET in the RuC specimens was more than those for the NC specimens. However, no significant differences between the two mixtures were observed in the TCA/TMA stage.
- Despite the low load-carrying capacities of the RuC specimens, they showed an ability to absorb energy more than or close to the NC specimens. Moreover, the performance of the RuC specimens was excellent in the TCA/TMA stage, which is the last line of defense against progressive collapse, and which develops additional resilience to significant deformation to prevent or even mitigate progressive collapse.
- The results of this study encourage the use of RC structures constructed using special concrete because RuC can be utilized as an eco-friendly construction material to improve the ductility of RC elements and also provide an environmentally friendly solution to the disposal of waste tires.
Author Contributions
Funding
Institutional Review Board Statement
Informed Consent Statement
Data Availability Statement
Conflicts of Interest
References
- ASCE. Minimum Design Loads and Associated Criteria for Buildings and Other Structures; ASCE: Reston, VA, USA, 2017. [Google Scholar]
- Bažant, Z.P.; Zhou, Y.J. Why did the world trade center collapse?—Simple analysis. J. Eng. Mech. 2002, 128, 2–6. [Google Scholar]
- Pearson, C.; Delatte, N.J. Ronan point apartment tower collapse and its effect on building codes. J. Perform. Constr. Facil. 2005, 19, 172. [Google Scholar] [CrossRef] [Green Version]
- Osteraas, J.D. Murrah building bombing revisited: A qualitative assessment of blast damage and collapse patterns. J. Perform. Constr. Facil. 2006, 20, 330–335. [Google Scholar] [CrossRef]
- Lu, X.; Guan, H.; Sun, H.; Li, Y.; Zheng, Z.; Fei, Y.; Yang, Z.; Zuo, L. A preliminary analysis and discussion of the condominium building collapse in surfside, Florida, US, June 24, 2021. Front. Struct. Civ. 2021, 15, 1097–1110. [Google Scholar] [CrossRef]
- Liu, X.-Y.; Qin, W.-H.; Xu, Z.-D.; Xi, Z.; Zhang, Z.-C. Investigation on the progressive collapse resistance of three-dimensional concrete frame structures reinforced by steel-FRP composite bar. J. Build. Eng. 2022, 59, 105116. [Google Scholar] [CrossRef]
- British Standard Institute (BIS). Structural Use of Concrete, Part 1: Code of Practice for Design and Construction; British Standard Institute: London, UK, 1997. [Google Scholar]
- European Committee for Standardization (CEN). Eurocode 1: Actions on Structures. Part 1–7: General Actions-Accidental Actions; European Committee for Standardization: Brussels, Belgium, 2006. [Google Scholar]
- GSA. Progressive Collapse Analysis and Design Guidelines for New Federal Office Buildings and Major Modernization Projects; GSA: Washington, DC, USA, 2003.
- Department of Defense (DoD). Design of Buildings to Resist Progressive Collapse: Unified Facilities Criteria (UFC) 4-023-03; Department of Defense: Washington, DC, USA, 2010.
- CECS 392-2014; Code for Anti-Collapse Design of Building Structures. China Association for Engineering Construction Standardization (CECS): Bejing, China, 2014.
- Alogla, K.; Weekes, L.; Augusthus-Nelson, L. A new mitigation scheme to resist progressive collapse of RC structures. Constr. Build. Mater. 2016, 125, 533–545. [Google Scholar] [CrossRef]
- Li, Z.; Liu, Y.; Huo, J.; Rong, H.; Chen, J.; Elghazouli, A.Y. Experimental assessment of fire-exposed RC beam-column connections with varying reinforcement development lengths subjected to column removal. Fire Saf. J. 2018, 99, 38–48. [Google Scholar] [CrossRef]
- Lu, X.; Lin, K.; Gu, D.; Li, Y. Experimental Study of Novel Concrete Frames Considering Earthquake and Progressive Collapse. In Concrete Structures in Earthquake; Springer: Berlin/Heidelberg, Germany, 2019; pp. 29–45. [Google Scholar]
- Qian, K.; Li, B. Strengthening of multibay reinforced concrete flat slabs to mitigate progressive collapse. J. Struct. Eng. 2015, 141, 04014154. [Google Scholar] [CrossRef]
- Liu, T.; Xiao, Y.; Yang, J.; Chen, B. CFRP Strip Cable Retrofit of RC Frame for Collapse Resistance. J. Compos. Constr. 2016, 21, 04016067. [Google Scholar] [CrossRef]
- Ali, B.H.; Mete Güneyisi, E.; Bigonah, M. Assessment of Different Retrofitting Methods on Structural Performance of RC Buildings against Progressive Collapse. Appl. Sci. 2022, 12, 1045. [Google Scholar] [CrossRef]
- Elsayed, W.M.; Moaty, M.A.A.; Issa, M.E. Effect of reinforcing steel debonding on RC frame performance in resisting progressive collapse. HBRC J. 2016, 12, 242–254. [Google Scholar] [CrossRef]
- Hrabova, K.; Teply, B.; Vymazal, T. Sustainability assessment of concrete mixes. In Proceedings of the IOP Conference Series: Earth and Environmental Science, Changsha, China, 18–20 September 2020; p. 012021. [Google Scholar]
- Lehner, P.; Horňáková, M. Effect of Amount of Fibre and Damage Level on Service Life of SFR Recycled Concrete in Aggressive Environment. Buildings 2021, 11, 489. [Google Scholar] [CrossRef]
- Ismail, M.K.; Hassan, A.A. Ductility and cracking behavior of reinforced self-consolidating rubberized concrete beams. J. Mater. Civ. Eng. 2017, 29, 04016174. [Google Scholar] [CrossRef]
- Mendis, A.S.; Al-Deen, S.; Ashraf, M.J.C.; Materials, B. Flexural shear behaviour of reinforced Crumbed Rubber Concrete beam. Constr. Build. Mater. 2018, 166, 779–791. [Google Scholar] [CrossRef]
- Zheng, L.; Huo, X.S.; Yuan, Y.J. Strength, modulus of elasticity, and brittleness index of rubberized concrete. J. Mater. Civ. Eng. 2008, 20, 692–699. [Google Scholar] [CrossRef]
- Sadek, D.M.; El-Attar, M.M. Structural behavior of rubberized masonry walls. J. Clean. Prod. 2015, 89, 174–186. [Google Scholar] [CrossRef]
- Ahmed, D.A.; Jumaa, G.B.; Khalighi, M.J.C.; Materials, B. Mechanical properties and shear strength of rubberized fibrous reinforced concrete beams without stirrups. Constr. Build. Mater. 2022, 350, 128796. [Google Scholar] [CrossRef]
- Noaman, A.T.; Bakar, B.A.; Akil, H.M.; Alani, A. Fracture characteristics of plain and steel fibre reinforced rubberized concrete. Constr. Build. Mater. 2017, 152, 414–423. [Google Scholar] [CrossRef]
- Son, K.S.; Hajirasouliha, I.; Pilakoutas, K. Strength and deformability of waste tyre rubber-filled reinforced concrete columns. Constr. Build. Mater. 2011, 25, 218–226. [Google Scholar] [CrossRef]
- Ganesan, N.; Raj, B.; Shashikala, A. Behavior of self-consolidating rubberized concrete beam-column joints. ACI Mater. J. 2013, 110, 697. [Google Scholar]
- Huang, X.; Ranade, R.; Ni, W.; Li, V.C. On the use of recycled tire rubber to develop low E-modulus ECC for durable concrete repairs. Constr. Build. Mater. 2013, 46, 134–141. [Google Scholar] [CrossRef]
- Issa, C.A.; Salem, G. Utilization of recycled crumb rubber as fine aggregates in concrete mix design. Constr. Build. Mater. 2013, 42, 48–52. [Google Scholar] [CrossRef]
- Guo, Y.-C.; Zhang, J.-H.; Chen, G.-M.; Xie, Z.-H. Compressive behaviour of concrete structures incorporating recycled concrete aggregates, rubber crumb and reinforced with steel fibre, subjected to elevated temperatures. J. Clean. Prod. 2014, 72, 193–203. [Google Scholar] [CrossRef]
- Alwesabi, E.A.; Abu Bakar, B.S.; Alshaikh, I.M.H.; Akil, H.M. Experimental investigation on mechanical properties of plain and rubberised concretes with steel–polypropylene hybrid fibre. Constr. Build. Mater. 2020, 233, 117194. [Google Scholar] [CrossRef]
- Yu, J.; Tan, K.H. Structural behavior of RC beam-column subassemblages under a middle column removal scenario. J. Struct. Eng. 2013, 139, 233–250. [Google Scholar] [CrossRef]
- Ahmadi, R.; Rashidian, O.; Abbasnia, R.; Mohajeri Nav, F.; Usefi, N. Experimental and numerical evaluation of progressive collapse behavior in scaled RC beam-column subassemblage. Shock Vib. 2016, 2016, 3748435. [Google Scholar] [CrossRef]
- Almusallam, T.; Al-Salloum, Y.; Ngo, T.; Mendis, P.; Abbas, H. Experimental investigation of progressive collapse potential of ordinary and special moment-resisting reinforced concrete frames. Mater. Struct. 2017, 50, 137. [Google Scholar] [CrossRef]
- Elsanadedy, H.M.; Almusallam, T.H.; Al-Salloum, Y.A.; Abbas, H. Investigation of precast RC beam-column assemblies under column-loss scenario. Constr. Build. Mater. 2017, 142, 552–571. [Google Scholar] [CrossRef]
- Lim, N.S.; Tan, K.; Lee, C. Effects of rotational capacity and horizontal restraint on development of catenary action in 2-D RC frames. Eng. Struct. 2017, 153, 613–627. [Google Scholar] [CrossRef]
- Gu, X.-L.; Zhang, B.; Wang, Y.; Wang, X.-L. Experimental investigation and numerical simulation on progressive collapse resistance of RC frame structures considering beam flange effects. J. Build. Eng. 2021, 42, 102797. [Google Scholar] [CrossRef]
- Kang, S.-B.; Wang, S.; Gao, S. Analytical study on one-way reinforced concrete beam-slab sub-structures under compressive arch action and catenary action. Eng. Struct. 2020, 206, 110032. [Google Scholar] [CrossRef]
- Qian, K.; Li, B. Performance of three-dimensional reinforced concrete beam-column substructures under loss of a corner column scenario. J. Struct. Eng. 2013, 139, 584–594. [Google Scholar] [CrossRef]
- Qian, K.; Li, B.J.A.S.J. Slab effects on response of reinforced concrete substructures after loss of corner column. ACI Struct. J. 2012, 109, 845–855. [Google Scholar]
- Qian, K.; Li, B.J.A.S.J. Resilience of flat slab structures in different phases of progressive collapse. ACI Struct. J. 2016, 113, 537–548. [Google Scholar] [CrossRef]
- Ibrahim AL-Shaikh, N.F. Numerical Analysis of Masonry-Infilled Reinforced Concrete Frames. J. Sci. Technol. 2014, 19, 21–28. [Google Scholar]
- Altheeb, A.; Alshaikh, I.M.; Abadel, A.; Nehdi, M.; Alghamdi, H.J. Effects of Non-Structural Walls on Mitigating the Risk of Progressive Collapse of RC Structures. Lat. Am. J. Solids Struct. 2022, 19, e440. [Google Scholar] [CrossRef]
- Alshaikh, I.M.; Bakar, B.A.; Alwesabi, E.A.; Akil, H.M. Experimental investigation of the progressive collapse of reinforced concrete structures: An overview. Structures 2020, 25, 881–900. [Google Scholar] [CrossRef]
- Kiakojouri, F.; De Biagi, V.; Chiaia, B.; Sheidaii, M.R. Progressive collapse of framed building structures: Current knowledge and future prospects. Eng. Struct. 2020, 206, 110061. [Google Scholar] [CrossRef]
- Alshaikh, I.M.; Bakar, B.A.; Alwesabi, E.A.; Akil, H.M. Progressive collapse of reinforced rubberised concrete: Experimental study. Constr. Build. Mater. 2019, 226, 307–316. [Google Scholar] [CrossRef]
- Deng, X.-F.; Liang, S.-L.; Fu, F.; Qian, K. Effects of high-strength concrete on progressive collapse resistance of reinforced concrete frame. J. Struct. Eng. 2020, 146, 04020078. [Google Scholar] [CrossRef]
- Alshaikh, I.M.; Bakar, B.A.; Alwesabi, E.A.; Zeyad, A.M.; Magbool, H.M. Finite element analysis and experimental validation of progressive collapse of reinforced rubberized concrete frame. Structures 2021, 33, 2361–2373. [Google Scholar] [CrossRef]
- Alshaikh, I.M.; Bakar, B.A.; Alwesabi, E.A.; Abadel, A.A.; Alghamdi, H.; Altheeb, A.; Tuladhar, R.J. Progressive collapse behavior of steel fiber-reinforced rubberized concrete frames. J. Build. Eng. 2022, 57, 104920. [Google Scholar] [CrossRef]
- Ismail, M.K.; Hassan, A.A.A. Shear behaviour of large-scale rubberized concrete beams reinforced with steel fibres. Constr. Build. Mater. 2017, 140, 43–57. [Google Scholar] [CrossRef]
- ACI. Building Code Requirements for Structural Concrete and Commentary; American Concrete Institute: Indianapolis, IN, USA, 2011. [Google Scholar]
- ETABS-CSI. Integrated Finite Element Analysis and Design of Structures Basic Analysis Reference Manual, 17; Computers and Structures Inc: Berkeley, CA, USA, 2018. [Google Scholar]
- ABAQUS. User Assistance; Dassault Systèmes Simulia Corporation: Providence, RI, USA, 2019. [Google Scholar]
- Lubliner, J.; Oliver, J.; Oller, S.; Oñate, E. A plastic-damage model for concrete. Int. J. Solids Struct. 1989, 25, 299–326. [Google Scholar] [CrossRef]
- Lee, J.; Fenves, G.L. Plastic-damage model for cyclic loading of concrete structures. J. Eng. Mech. 1998, 124, 892–900. [Google Scholar] [CrossRef]
- Hognestad, E. Study of Combined Bending and Axial Load in Reinforced Concrete Members; University of Illinois at Urbana Champaign, College of Engineering: Champaign, IL, USA, 1951. [Google Scholar]
- Stoner, J. Finite Element Modelling of GFRP Reinforced Concrete Beams; University of Waterloo: Waterloo, ON, Canada, 2015. [Google Scholar]
- Wang, T.; Hsu, T.T. Nonlinear finite element analysis of concrete structures using new constitutive models. Comput. Struct. 2001, 79, 2781–2791. [Google Scholar] [CrossRef]
- Bi, K.; Ren, W.-X.; Cheng, P.-F.; Hao, H. Domino-type progressive collapse analysis of a multi-span simply-supported bridge: A case study. Eng. Struct. 2015, 90, 172–182. [Google Scholar] [CrossRef] [Green Version]
- Botez, M.; Bredean, L.; Ioani, A. Improving the accuracy of progressive collapse risk assessment: Efficiency and contribution of supplementary progressive collapse resisting mechanisms. Comput. Struct. 2016, 174, 54–65. [Google Scholar] [CrossRef]
- Nguyen, V.-Q.; Nizamani, Z.A.; Park, D.; Kwon, O.-S. Numerical simulation of damage evolution of Daikai station during the 1995 Kobe earthquake. Eng. Struct. 2020, 206, 110180. [Google Scholar] [CrossRef]
- Pham, A.T.; Tan, K.H.; Yu, J. Numerical investigations on static and dynamic responses of reinforced concrete sub-assemblages under progressive collapse. Eng. Struct. 2017, 149, 2–20. [Google Scholar] [CrossRef]
- Shi, Y.; Li, Z.-X.; Hao, H. A new method for progressive collapse analysis of RC frames under blast loading. Eng. Struct. 2010, 32, 1691–1703. [Google Scholar] [CrossRef]
- Wu, K.-C.; Li, B.; Tsai, K.-C. The effects of explosive mass ratio on residual compressive capacity of contact blast damaged composite columns. J. Constr. Steel Res. 2011, 67, 602–612. [Google Scholar] [CrossRef]
- Luccioni, B.M.; Aráoz, G.F.; Labanda, N.A. Defining erosion limit for concrete. Int. J. Prot. Struct. 2013, 4, 315–340. [Google Scholar] [CrossRef]
- Tang, E.K.; Hao, H. Numerical simulation of a cable-stayed bridge response to blast loads, Part I: Model development and response calculations. Eng. Struct. 2010, 32, 3180–3192. [Google Scholar] [CrossRef]
- Kumar, V.; Kartik, K.; Iqbal, M. Experimental and numerical investigation of reinforced concrete slabs under blast loading. Eng. Struct. 2020, 206, 110125. [Google Scholar] [CrossRef]
- Titoum, M.; Tehami, M.; Achour, B.; Jaspart, J.-P. Analysis of semi-continuous composite beams with partial shear connection using 2-D finite element approach. Asian J. Appl. Sci. 2008, 1, 185–205. [Google Scholar] [CrossRef] [Green Version]
- A615/A615M-03a; Specification for Deformed and Plain Carbon-Steel Bars for Concrete Reinforcement. ASTM International: Conshohocken, PA, USA, 2003.
- Hradil, P.; Talja, A. Ductility Limits of High Strength Steels; Online at FIMECC Research Portal and VTT. 2016. Available online: https://cris.vtt.fi/en/publications/ductility-limits-of-high-strength-steels (accessed on 15 September 2022).
- Bridgman, P.W. Studies in Large Plastic Flow and Fracture; Harvard University Press: Cambridge, MA, USA, 1964. [Google Scholar]
- Baltay, P.; Gjelsvik, A. Coefficient of friction for steel on concrete at high normal stress. J. Mater. Civ. Eng. 1990, 2, 46–49. [Google Scholar] [CrossRef]
- Dat, P.X.; Tan, K.H. Experimental response of beam-slab substructures subject to penultimate-external column removal. J. Struct. Eng. 2015, 141, 04014170. [Google Scholar] [CrossRef]
- Eren, N.; Brunesi, E.; Nascimbene, R. Influence of masonry infills on the progressive collapse resistance of reinforced concrete framed buildings. Eng. Struct. 2019, 178, 375–394. [Google Scholar] [CrossRef]
- Pham, A.T.; Lim, N.S.; Tan, K.H. Investigations of tensile membrane action in beam-slab systems under progressive collapse subject to different loading configurations and boundary conditions. Eng. Struct. 2017, 150, 520–536. [Google Scholar] [CrossRef]
- Huang, H.; Huang, M.; Zhang, W.; Guo, M.; Liu, B. Progressive collapse of multistory 3D reinforced concrete frame structures after the loss of an edge column. Struct. Infrastruct. Eng. 2022, 18, 249–265. [Google Scholar] [CrossRef]
- Lu, X.; Lin, K.; Li, Y.; Guan, H.; Ren, P.; Zhou, Y. Experimental investigation of RC beam-slab substructures against progressive collapse subject to an edge-column-removal scenario. Eng. Struct. 2017, 149, 91–103. [Google Scholar] [CrossRef]
- Qian, K.; Li, B.; Ma, J.-X. Load-carrying mechanism to resist progressive collapse of RC buildings. J. Struct. Eng. 2015, 141, 04014107. [Google Scholar] [CrossRef]
- Ren, P.; Li, Y.; Lu, X.; Guan, H.; Zhou, Y. Experimental investigation of progressive collapse resistance of one-way reinforced concrete beam–slab substructures under a middle-column-removal scenario. Eng. Struct. 2016, 118, 28–40. [Google Scholar] [CrossRef]
- Masi, A.; Digrisolo, A.; Santarsiero, G. Analysis of a Large Database of Concrete Core Tests with Emphasis on Within-Structure Variability. Materials 2019, 12, 1985. [Google Scholar] [CrossRef] [Green Version]
- Alwesabi, E.A.; Bakar, B.A.; Alshaikh, I.M.; Akil, H.M. Impact resistance of plain and rubberized concrete containing steel and polypropylene hybrid fiber. Mater. Today Commun. 2020, 25, 101640. [Google Scholar] [CrossRef]
- Alwesabi, E.A.; Bakar, B.A.; Alshaikh, I.M.; Zeyad, A.M.; Altheeb, A.; Alghamdi, H. Experimental investigation on fracture characteristics of plain and rubberized concrete containing hybrid steel-polypropylene fiber. Structures 2021, 33, 4421–4432. [Google Scholar] [CrossRef]


| Concrete Mixture | Cement | Water | Coarse Agg. | Fine Agg. | Crumb Rubber | Superplasticizer |
|---|---|---|---|---|---|---|
| NC (kg/m3) | 241.6 | 538.1 | 620.1 | 904.7 | 0 | 1.6 (liters) |
| RuC (kg/m3) | 241.6 | 538.1 | 620.1 | 723.7 | 51.5 | 1.6 (liters) |
| Parameter | Value | Denotation |
|---|---|---|
| 38 (calibrated value) | Alshaikh et al. [49] | |
| 0.1 (default value) | ABAQUS [54] | |
| 1.16 (default value) | ABAQUS [54]; Lubliner et al. [55] | |
| 0.7 (default value) | ABAQUS [54] | |
| 0 (default value) | ABAQUS [54] | |
| Elasticity | Eo = 26,713 MPa for NC Eo = 20,704 MPa for RuC | ACI 318M-11 [52] |
| for NC and RuC | Widely utilized in the FEM simulations |
| Specimen ID | NC | RuC |
|---|---|---|
| Tensile cracking strain (mm/mm) | 0.435 | 0.320 |
| Compressive inelastic strain (mm/mm) | 0.051 | 0.065 |
| Rebar Diameter (mm) | (MPa) | (MPa) | (MPa) | ||
|---|---|---|---|---|---|
| 6 | 204,119 | 410 | 0.00201 | 507 | 0.0872 |
| 10 | 202,522 | 514 | 0.00254 | 625 | 0.1107 |
| 12 | 204,161 | 567 | 0.00278 | 653 | 0.1136 |
| Rebar Diameter (mm) | (MPa) | (MPa) | ||||
|---|---|---|---|---|---|---|
| 6 | at yield | 410 | 411 | 0.00201 | 0.00201 | 0 |
| at ultimate | 507 | 515 | 0.08720 | 0.08360 | 0.0816 | |
| 10 | at yield | 514 | 515 | 0.00254 | 0.00254 | 0 |
| at ultimate | 625 | 695 | 0.11070 | 0.10500 | 0.102 | |
| 12 | at yield | 567 | 569 | 0.00278 | 0.00278 | 0 |
| at ultimate | 653 | 728 | 0.11360 | 0.10800 | 0.105 | |
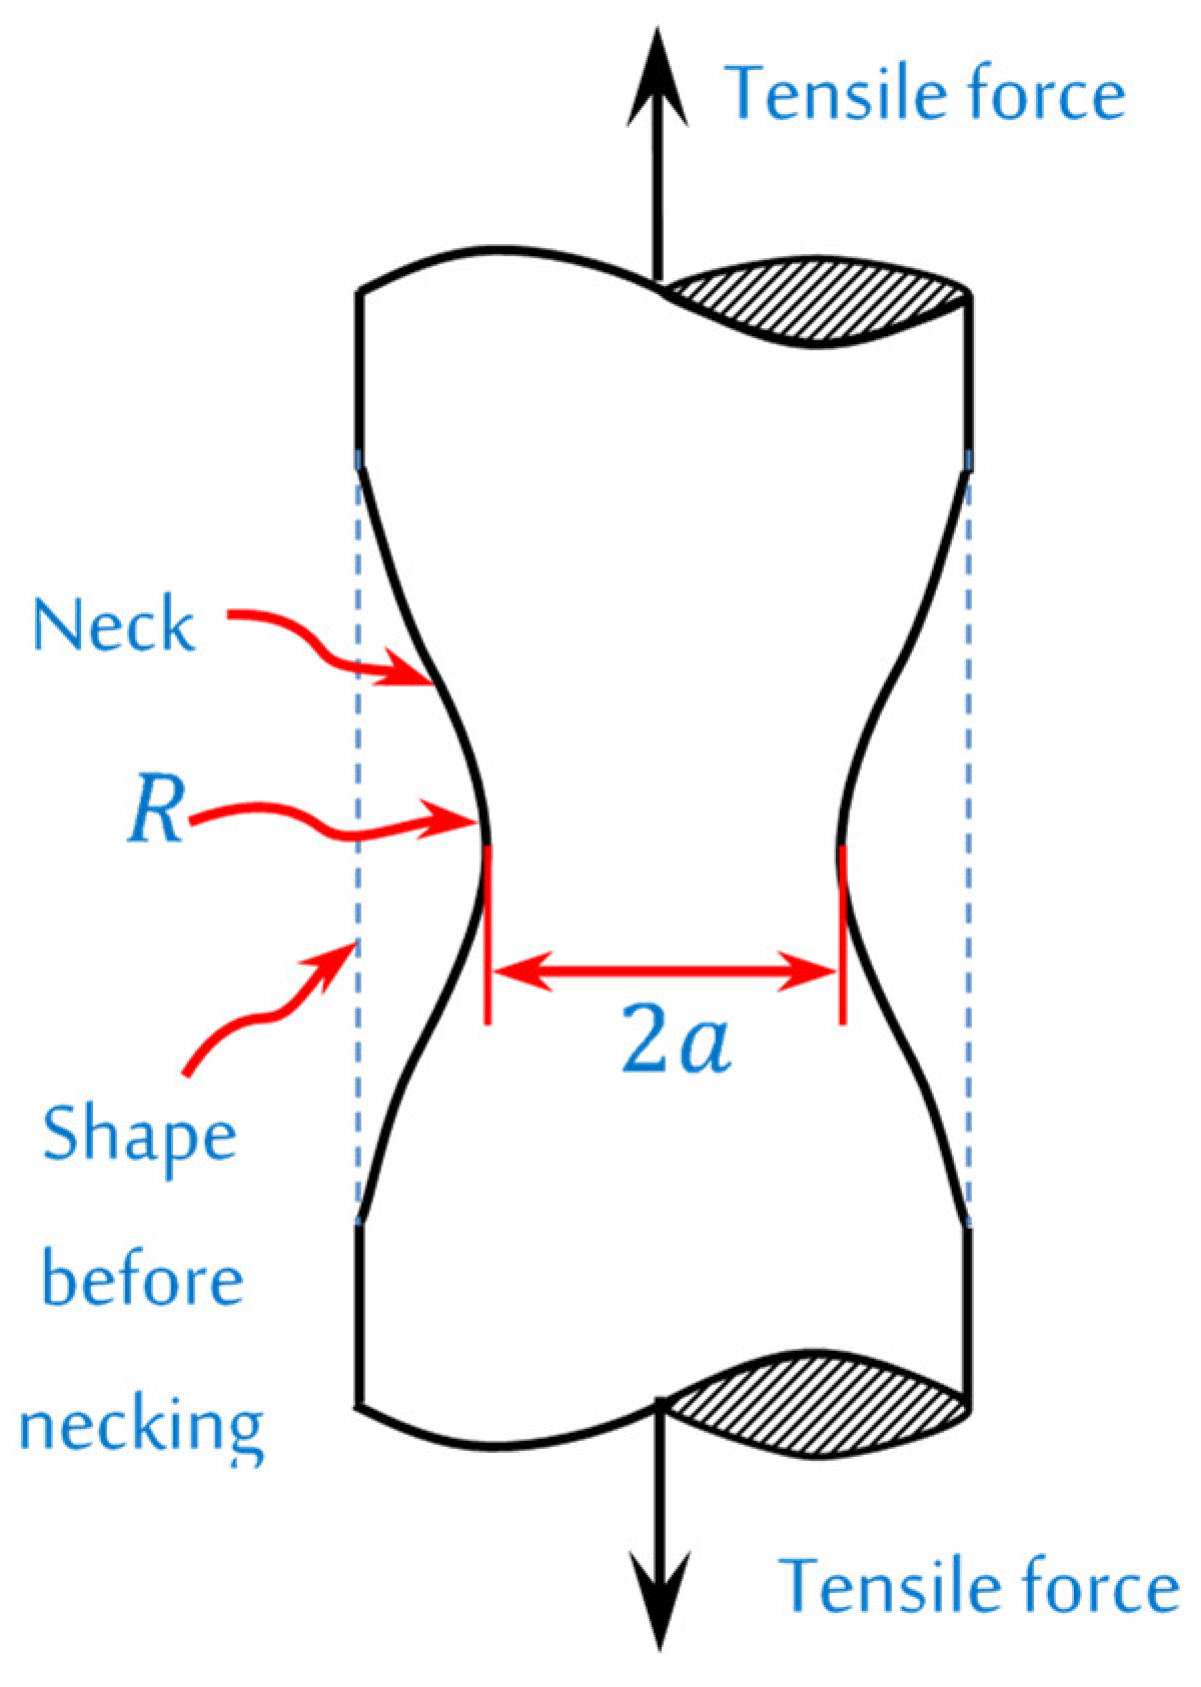
| Rebar Diameter (mm) | (mm) * | (mm) * | (mm) | Stress Tri-Axiality | |
|---|---|---|---|---|---|
| 10 | 8.02 | 2.55 | 10 | 0.481 | 1.347 |
| Mesh types | Element Type | Elements Number | (kN) | (kN) | Running Time (s) * | |
|---|---|---|---|---|---|---|
| Mesh-size 1 | T3D2 | 532 | 53.293 | 58.133 | 0.92 | 720 |
| C3D8R | 764 | |||||
| Mesh-size 2 | T3D2 | 692 | 57.521 | 0.93 | 960 | |
| C3D8R | 980 | |||||
| Mesh-size 3 | T3D2 | 1464 | 56.782 | 0.94 | 4080 | |
| C3D8R | 9124 |
| Specimen ID | Result | Experimental * | Numerical | Exp./Num. |
|---|---|---|---|---|
| NC | (kN) | 53.293 | 56.782 | 0.94 |
| (mm) | 137.82 | 137.01 | 1.01 | |
| (kN.mm) | 6697.6 | 7070.03 | 0.95 | |
| RuC | (kN) | 48.274 | 53.985 | 0.894 |
| (mm) | 156.62 | 156.477 | 1.001 | |
| (kN.mm) | 6851.1 | 7581.209 | 0.904 |
| Scenarios | Specimen ID | Details | Mixtures | No. of Specimens |
|---|---|---|---|---|
| Scenario “A” (A middle column was removed) | NC-MID | without slab (see Figure 17a) | NC | 1 |
| NC-MID-Slab | with slab (see Figure 17b) | 1 | ||
| RuC-MID | without slab (see Figure 17a) | RuC | 1 | |
| RuC-MID-Slab | with slab (see Figure 17b) | 1 | ||
| Scenario “B” (A corner column was removed) | NC-COR | without slab (see Figure 17c) | NC | 1 |
| NC-COR-Slab | with slab (see Figure 17d) | 1 | ||
| RuC-COR | without slab (see Figure 17c) | RuC | 1 | |
| RuC-COR-Slab | with slab (see Figure 17d) | 1 | ||
| Total Specimens | 8 | |||
| Specimen ID | Energy Absorption (kN.m) | Maximum Vertical Load (kN) | TMA/TCA Started (mm) | Maximum TMA/TCA (kN) | Maximum THR (kN) | Maximum CHR (kN) |
|---|---|---|---|---|---|---|
| NC-COR | 483.06 | 692.34 | 698.73 | 423.72 | 244.17 | −1470.75 |
| RuC-COR | 568.28 | 616.39 | 637.46 | 495.05 | 211.41 | −1164.32 |
| NC-COR-Slab | 751.91 | 978.51 | 179.07 | 669.66 | 730.13 | −1638.39 |
| RuC-COR-Slab | 694.25 | 817.76 | 242.51 | 636.01 | 527.24 | −1158.67 |
| NC-MID | 304.34 | 744.49 | 384.89 | 531.76 | 142.89 | −1036.24 |
| RuC-MID | 307.26 | 647.73 | 405.87 | 489.24 | 179.06 | −786.42 |
| NC-MID-Slab | 421.62 | 985.61 | 270.54 | 617.51 | 502.55 | −1702.04 |
| RuC-MID-Slab | 380.81 | 811.06 | 227.06 | 601.05 | 658.26 | −1063.97 |
Publisher’s Note: MDPI stays neutral with regard to jurisdictional claims in published maps and institutional affiliations. |
© 2022 by the authors. Licensee MDPI, Basel, Switzerland. This article is an open access article distributed under the terms and conditions of the Creative Commons Attribution (CC BY) license (https://creativecommons.org/licenses/by/4.0/).
Share and Cite
Alshaikh, I.M.H.; Abadel, A.A.; Sennah, K.; Nehdi, M.L.; Tuladhar, R.; Alamri, M. Progressive Collapse Resistance of RC Beam–Slab Substructures Made with Rubberized Concrete. Buildings 2022, 12, 1724. https://doi.org/10.3390/buildings12101724
Alshaikh IMH, Abadel AA, Sennah K, Nehdi ML, Tuladhar R, Alamri M. Progressive Collapse Resistance of RC Beam–Slab Substructures Made with Rubberized Concrete. Buildings. 2022; 12(10):1724. https://doi.org/10.3390/buildings12101724
Chicago/Turabian StyleAlshaikh, Ibrahim M. H., Aref A. Abadel, Khaled Sennah, Moncef L. Nehdi, Rabin Tuladhar, and Mohammed Alamri. 2022. "Progressive Collapse Resistance of RC Beam–Slab Substructures Made with Rubberized Concrete" Buildings 12, no. 10: 1724. https://doi.org/10.3390/buildings12101724