1. Introduction
The conservation of World Cultural Heritage has been a globally shared responsibility since the 1972 UNESCO Convention [
1]. The importance of cultural heritage as a legacy from the past has been recognized throughout time as an essential source of identity for local communities, preventing cultural globalization, and promoting values such as cultural diversity and social cohesion. Besides its intrinsic value as a source of knowledge and inspiration for present and future generations, its contribution to sustainable development is being incrementally acknowledged [
2], and the United Nations includes the safeguarding of cultural heritage as a driver and enabler of sustainability within their 2030 Agenda for Sustainable Development [
3].
The fact is that safeguarding our vast building stock is well aligned with the world’s ambitious climate goals to greatly reduce carbon emissions by: (i) promoting energy renovation, reducing the extremely high energy consumption of buildings; and (ii) avoiding the embodied carbon emissions associated with the demolition and construction of new buildings. It should be noted that, according to the World Green Building Council (WGBC), this embodied carbon from the construction industry makes up a staggering 11% of global carbon emissions [
4]. Therefore, conservation (including the renovation and retrofitting of existing built structures) should be seen as a priority action in the construction sector and should always be prioritized over substantial demolition, as it is typically the lowest-carbon option. This has been already singled out in the European Green Deal [
5] or by local authorities (e.g., the municipality of London [
6]).
Nevertheless, the conservation of built cultural heritage is a difficult task that requires a deep understanding of the building. Without a proper understanding of the building’s structural and thermal behavior, traditional interventions in the built heritage involve full or partial demolition, the substitution of the structural system and materials, or neglect, with the subsequent irretrievable loss of the heritage and its fabric. Thus, aiming to ensure the structural safety of the building and/or its energy efficiency, the first actions should focus on obtaining a better understanding of the materials, the structural behavior, and the comfort conditions, among others. This entails thorough on-site experimental campaigns and monitoring, as well as specialized expertise, and needs to be addressed in a multidisciplinary way. A generally accepted methodology on how to address a conservation project is defined similarly to the one used in medicine [
7]: (i) anamnesis (condition survey); (ii) diagnosis (identification of the causes of damage); and (iii) therapy and controls (choice of the remedial measures and monitoring of the intervention).
In particular, the built heritage of the previous century entails specific conservation challenges, which are mainly related to the newly developed forms of construction and materials that were developed at the time, such as reinforced concrete. Many times, the materials and construction techniques were untested, which led to deficient performance in many cases. However, these buildings have a unique character due to their singularity and the fundamental role they played in the development of new construction techniques. For that reason, preserving the authenticity of the buildings and their structures is paramount and requires adequate assessment methodologies and conservation measures, aiming, in particular, at maximizing the respect for the original structure and materials.
In the last years, international conservation principles have been defined to ensure an adequate approach when facing the evaluation of these structures. An example of these principles is found in the “Recommendations for the Analysis and Restoration of Structures of Architectural Heritage” [
7] or in the ICOMOS International Charters. ICOMOS has also defined some specific approaches for the conservation of 20th-century architectural heritage [
8,
9]. These documents reiterate the importance of a thorough acquisition of knowledge of the structure, aimed at understanding its original characteristics and its evolution, over time, until its current situation. This is, again, crucial, because respecting the authenticity of the site is not always simple, as the conservation of the fabric and the management of the site may require some tolerance for change. A proper understanding of the cultural significance of a site is thus also essential for managing change.
The methodology and recommendations include different tasks, considering documentation as a key to properly understanding the significance and the fabric [
10]. Surveying and diagnostic investigations are also very much relevant to assess the current physical condition of the building and its vulnerabilities. The structural diagnosis of the built heritage should be based on direct observation and damage and material decay, as well as quantitative approaches that include on-site and laboratory testing and monitoring [
11,
12,
13,
14,
15,
16]. The assessment of the comfort conditions and energy efficiency of a building is typically based on long-term thermal and humidity monitoring strategies that can aid in calibrating numerical models that simulate the thermal conditions [
17,
18,
19,
20].
Only after the definition of the significance and the current physical condition of the building, it is possible to decide on the most adequate remedial measures able to respect authenticity and stop degradation phenomena. The main objective of the paper is to show the importance of inspection and diagnostic activities to prepare a Conservation Management Plan (CMP) for modern architectural heritage. This objective is illustrated using the Beira Central Station in Mozambique as the case study. A CMP is an internationally recognized tool that aims to guide the conservation and management of places of cultural significance, as a “
document which sets out what is significant in a place and, consequently, what policies are appropriate to enable that significance to be retained in its future use and development” [
21].
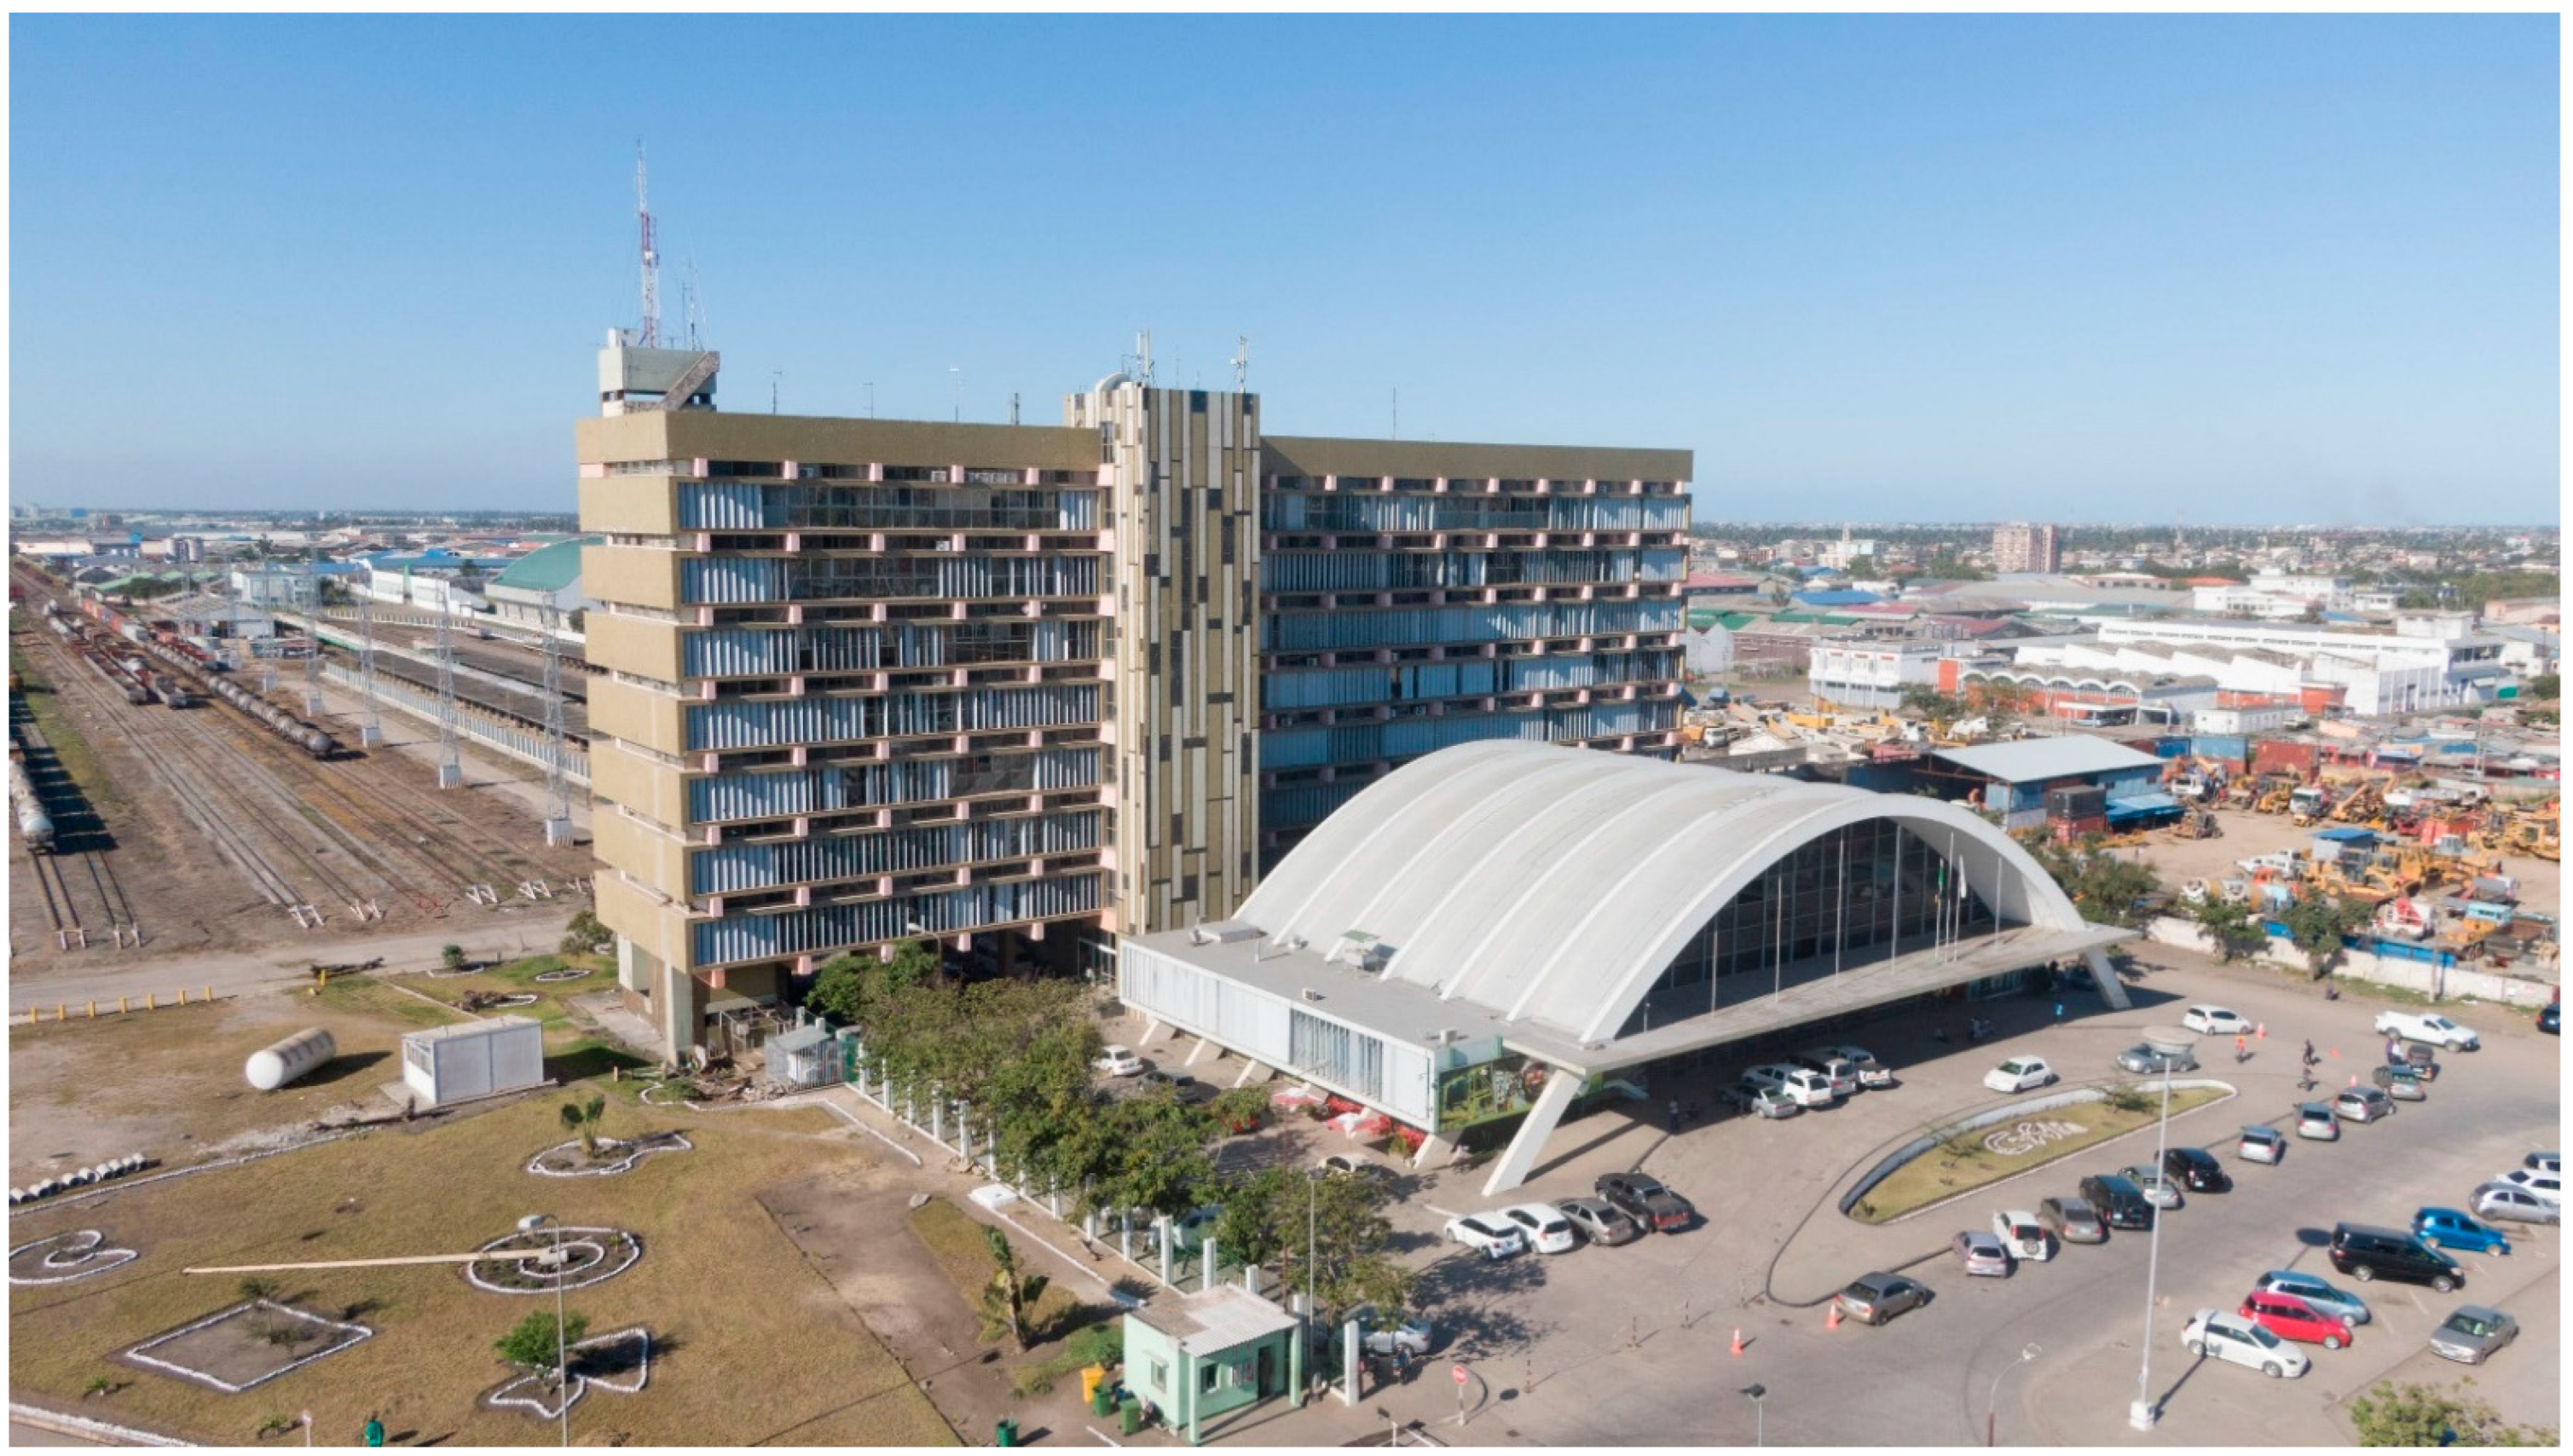
The Beira Central Station, in Mozambique (
Figure 1), was considered among the one hundred more important 20th-century Portuguese engineering buildings [
22]. The building is an icon for the city of Beira, the second largest city in Mozambique in the recent past, located on the central coast of the country. The relevance of this building also lies in its architecture. The monumental expression and the meld of sculptural and geometric shapes, colors, and materials in the context of its landscape setting within the city have remarkable aesthetic qualities. It is an excellent example of the architectural synthesis of the post-war international Modern Movement inspired by Le Corbusier’s maxims and post-war Modern Movement architecture, influenced by tropical considerations. The building was designed by the three most important architects of the city as a common endeavor. The architects applied materials and construction technology that was expected to demonstrate the application of the scientific principles of climatic responsive design tailored to provide thermal comfort and function in a tropical climate setting, which will be discussed in the paper.
In summary, the building represents a magnificent example of the Modern Movement in Colonial Portuguese Africa. Beira was a major city in the country, but deteriorated areas are very much present today. For that reason, the rehabilitation of the railway station does not just mean the conservation of this iconic building for the citizens, but also an improvement in the urban context.
Among the inspection and diagnosis activities carried out, the paper has a particular focus on (a) the material degree of deterioration and (b) indoor thermal comfort. It is noted that both aspects (the material and construction technology; and the adapted climatic responsive design) were identified as key attributes contributing to the building’s significance and should be preserved and enhanced as much as possible. These works will not only be key to proposing specific policies for the CMP that will guarantee the proper conservation of this outstanding building but also to discussing the long-term performance of buildings of the Modern Movement with low maintenance and the success of comfort concepts in local climatic conditions.
To present the developed work, the paper has been divided into four subsequent sections. First, a description of the origin of the building and its configuration is made to provide better knowledge and contextualize the information regarding the subsequent tasks. Then, a damage analysis of the building provides information about the current state of the conservation of the building. The material state of conservation is included in another section, which provides information about the non-destructive tests performed, as well as the laboratory tests and the dynamic identification campaign. Finally, a section about the climatic analysis is provided, which includes the results of the monitoring and the comfort study.
2. The Case Study: The Beira Central Station
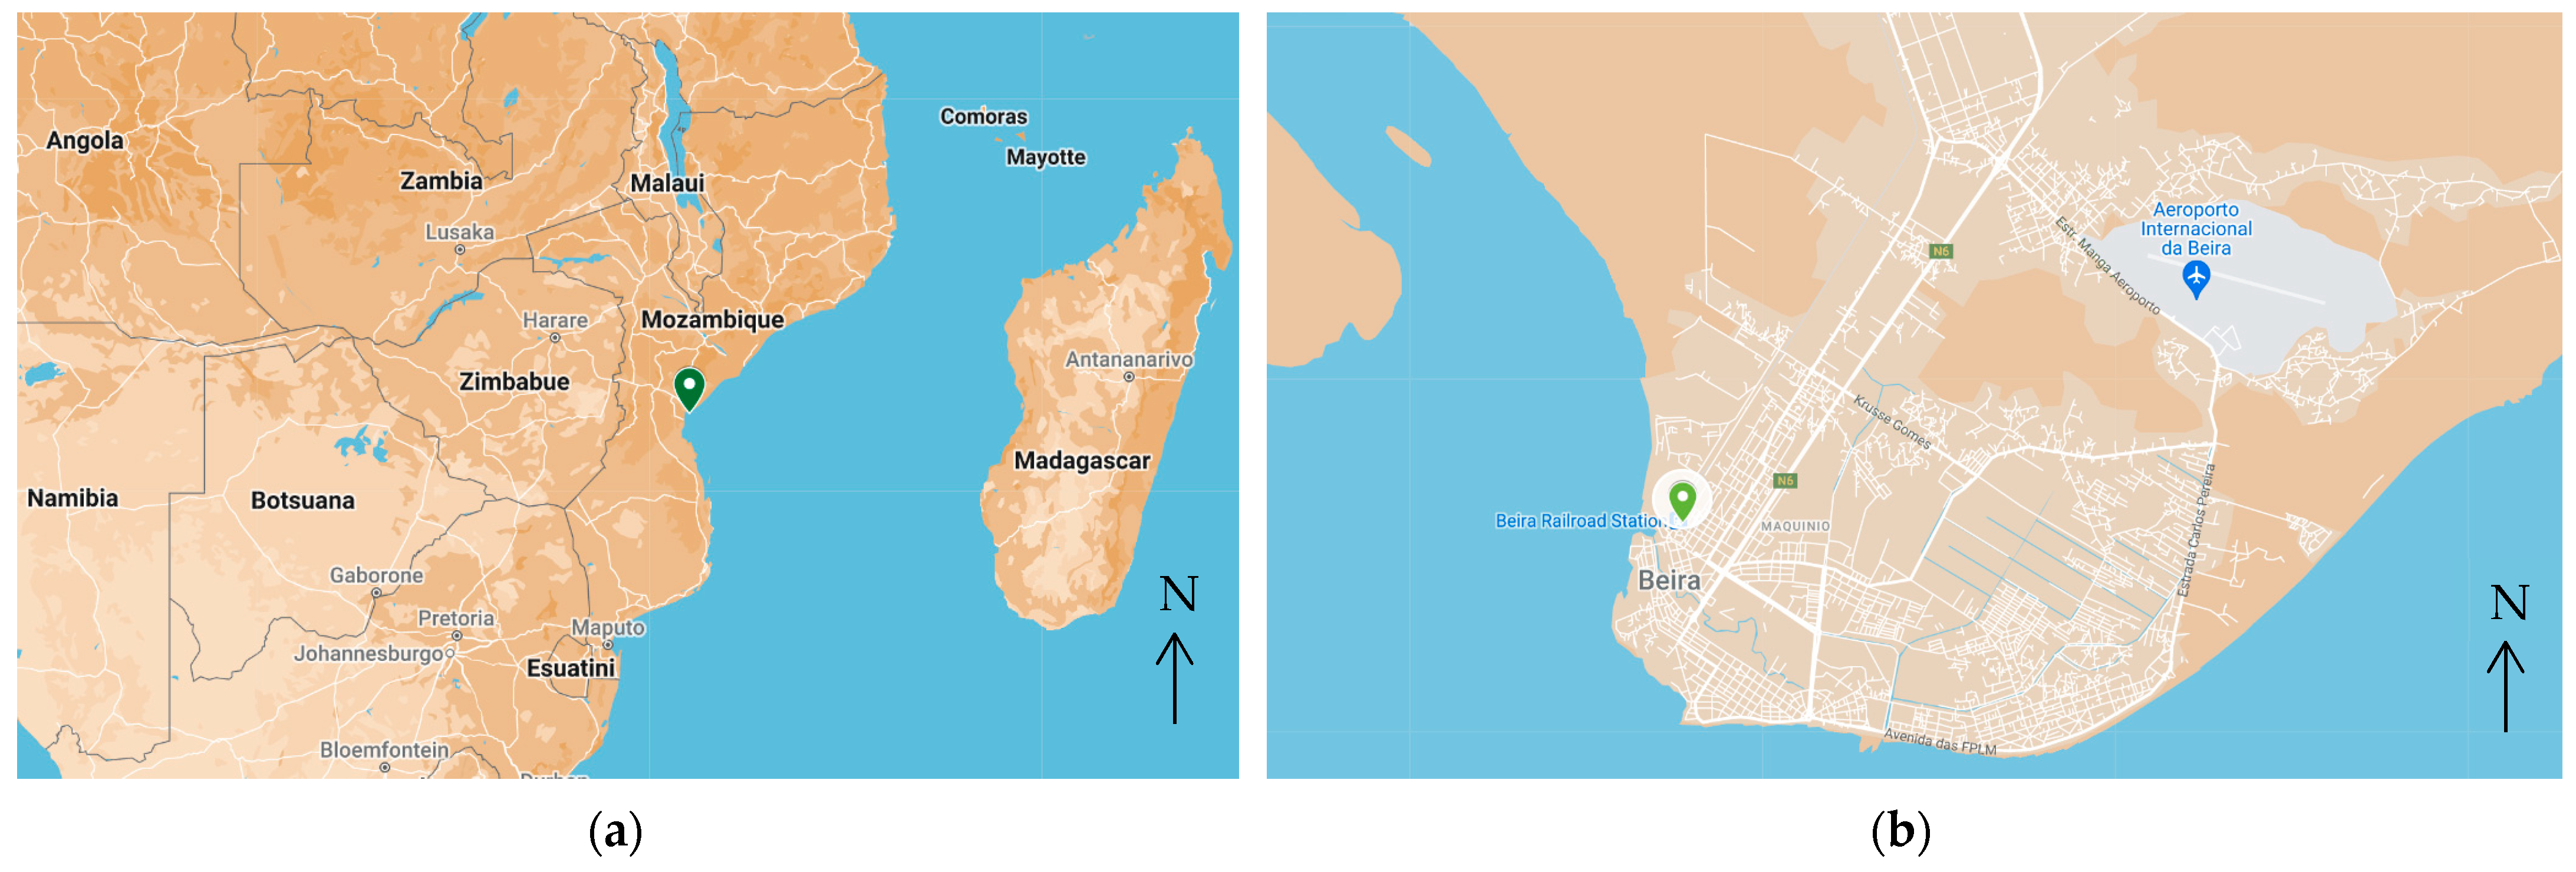
Beira Central Station is located at the mouth of the Pungue river along the Indian Ocean in Mozambique (
Figure 2). The building is an icon for the city of Beira. The relevance of the building lies in the architecture and the iconic and popular dimension in the broader context of railway history in Africa. Beira witnessed some of the most important projects of the Modern Movement in Colonial Portuguese Africa. In the 1950s–60s, Beira was a glamorous and vivid city and its history is intrinsically linked to the railway’s development in Africa. The train station complex includes also the regional headquarters of the railway and port company and was inaugurated in 1966 as the most important public work investment in the city. This large, monumental building results from a team of three architects (João Garizo do Carmo, Francisco José de Castro, and Paulo de Melo Sampaio) and interprets exemplarily the International Style language [
23].
The first objective of this work was to understand the significance of the station and its values (cultural, social, historical, aesthetic, or others). The data collected include original drawings and design elements, old photos, old newspapers and magazines, as well as interviews with people involved in the construction and management of the building.
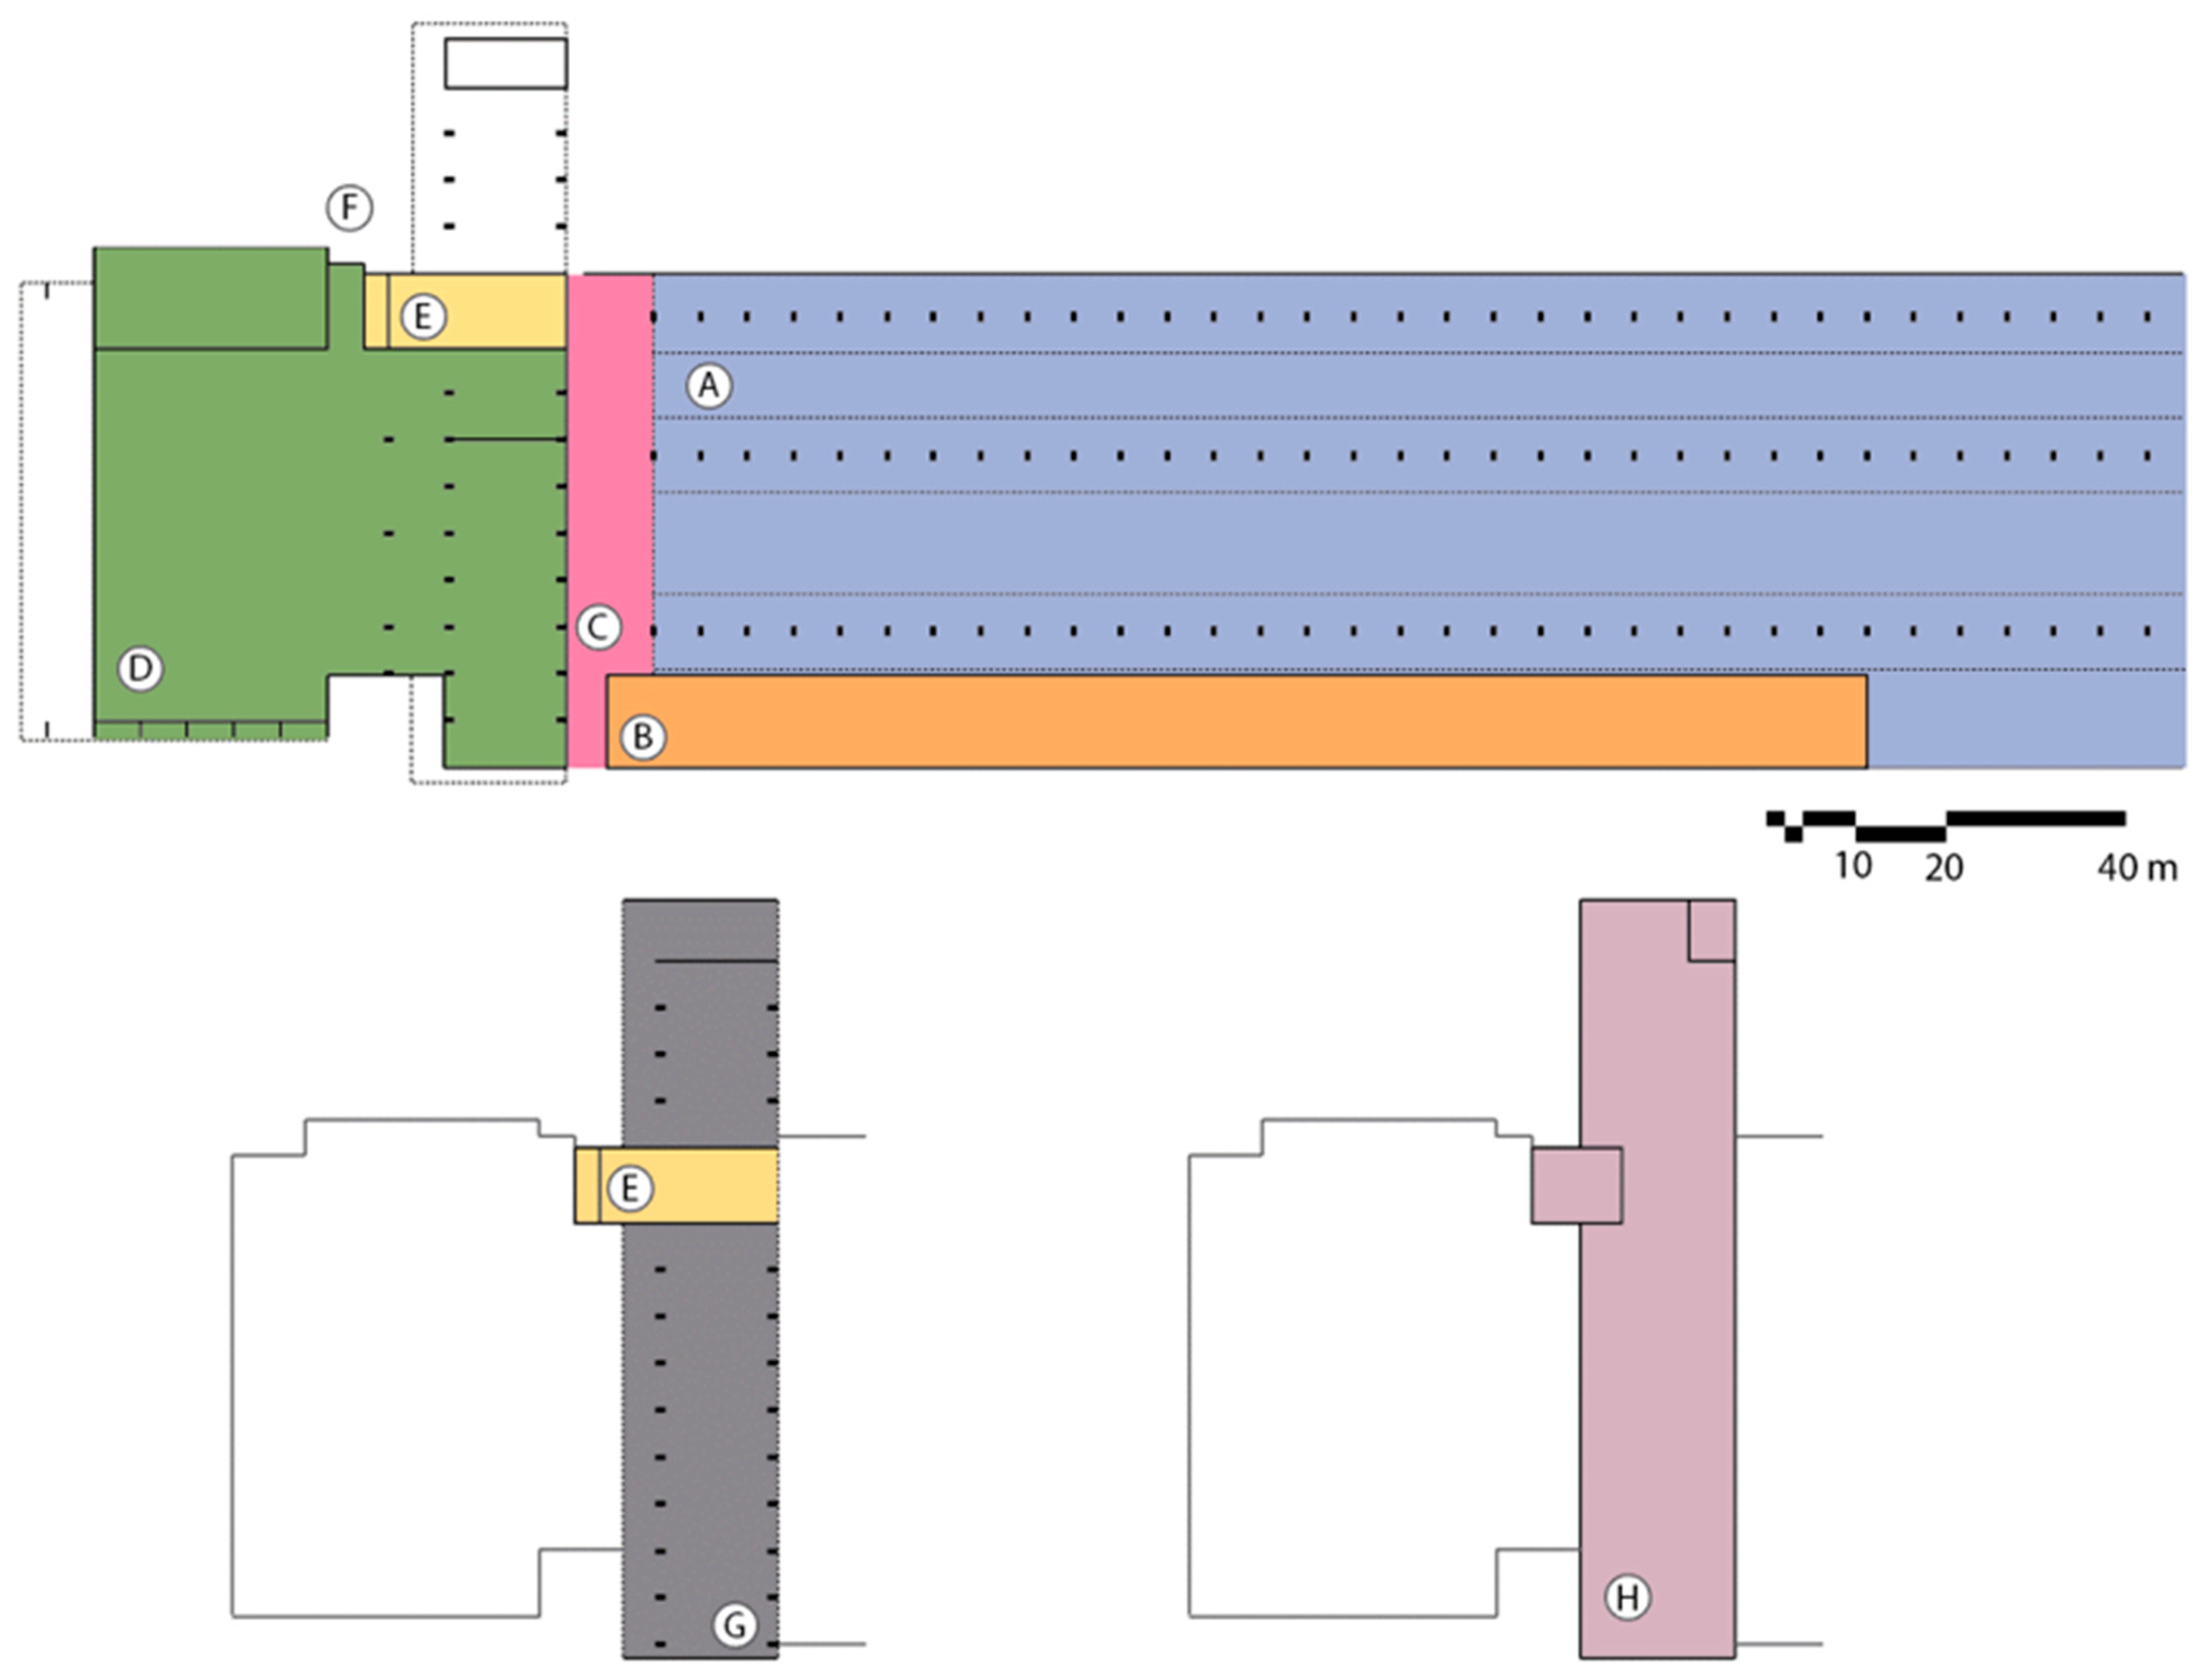
The volumetric definition of the Beira Railway Station is based on the two general functional zones defined in the program, the station zone and the administration zone. This program is organized in three areas of a distinct functional character (
Figure 3): the atrium body (orange), the administration body (green), and the platforms zone (blue), which are defined as different independent geometrical volumes articulated by transitional spaces.
The atrium body is a parabolic volume, covered with a vaulted membrane made of concrete and supported by seven inverted parabolic arches. The vault is arranged across the longitudinal axis of the station square and presents the upper part glassed in this direction, while in the other direction it rests on a rectangular base covered externally with a mural of glass mosaic on the southeast side and a cantilevered rectangular prism on the northwest side. All the elements are unified since the parabolic arches that define the main space intercept both volumes and are covered by a horizontal slab that creates a porch on the side of the main access, which is a structure suspended from the arches through steel ties.
Behind the atrium, the body of the administration appears as a rectangular prism eight floors high. The ground floor of the body of the administration is part of the atrium of the train station, which is connected by a space defined by a concrete slab. The seven upper floors plus the top ledge are defined as minor overlapping rectangular prisms which show in elevation recessed frames, extensive and continuous fenêtres en longueur protected by vertical brise-soleils in the main façade. In the rear elevation, the fenêtres en longueur are interspersed with masonry elements, plastered flaps, and pilasters coated with glass mosaics. The lifts and main stairs are contained in a rectangular volume visible in the main façade, finished by a mosaic mural of colored glass.
The third area corresponds to the railway platforms zone, which is articulated with the administration body through a lowered concrete slab supported by an autonomous structure of pilotis. The railway tracks and platforms are covered by porches defined as inverted slabs supported on central pillars of oblique design. This area also includes the longitudinal building adjacent to the southeastern platform, the command building of the railway station, which is designed as a sequence of twenty-seven modules covered by lower plain slabs and upper reinforced concrete vaults.
Given the large size of the building, eight different areas can be identified to refer to the performed works (
Figure 4), namely the (A) platforms; (B) the command body for the platforms; (C) the transition space between platforms and the atrium; (D) the atrium (entrance hall); (E) the main staircase at the administrative body; (F) the administrative body; (G) the exterior area and façades; and (H) the roof.
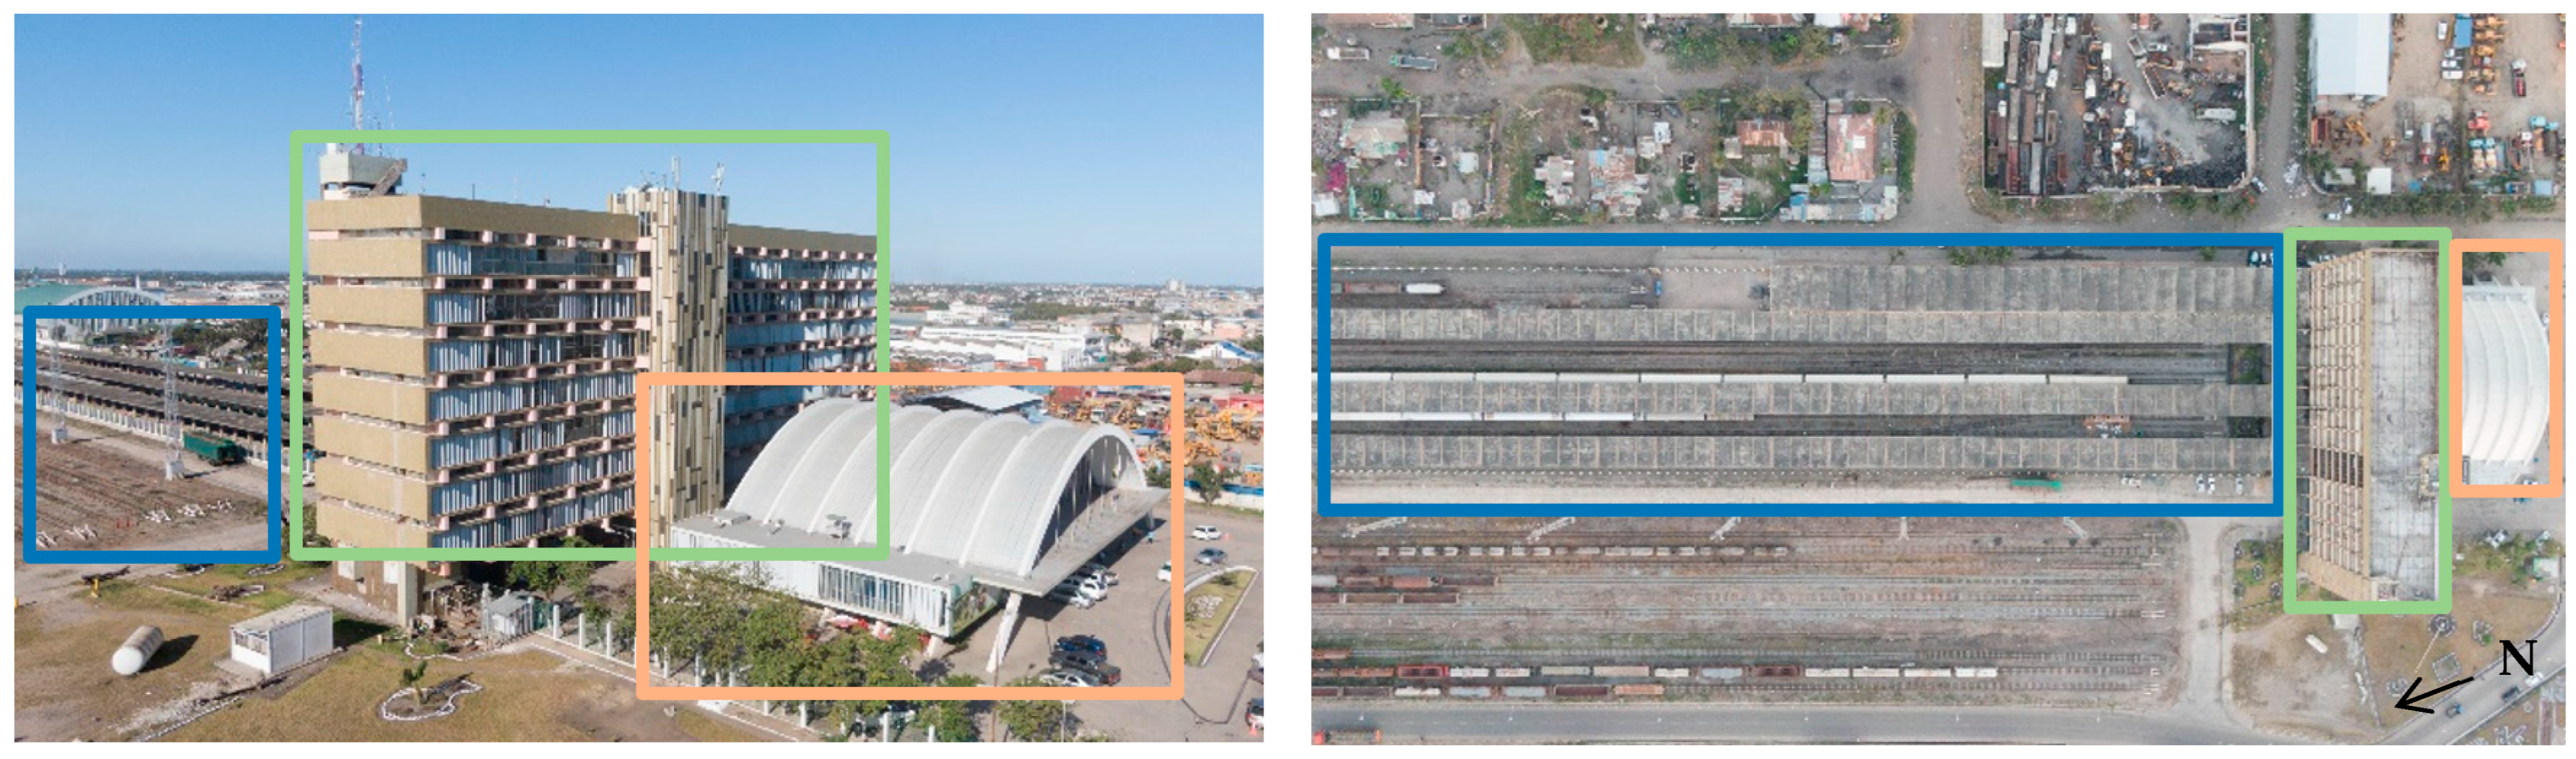
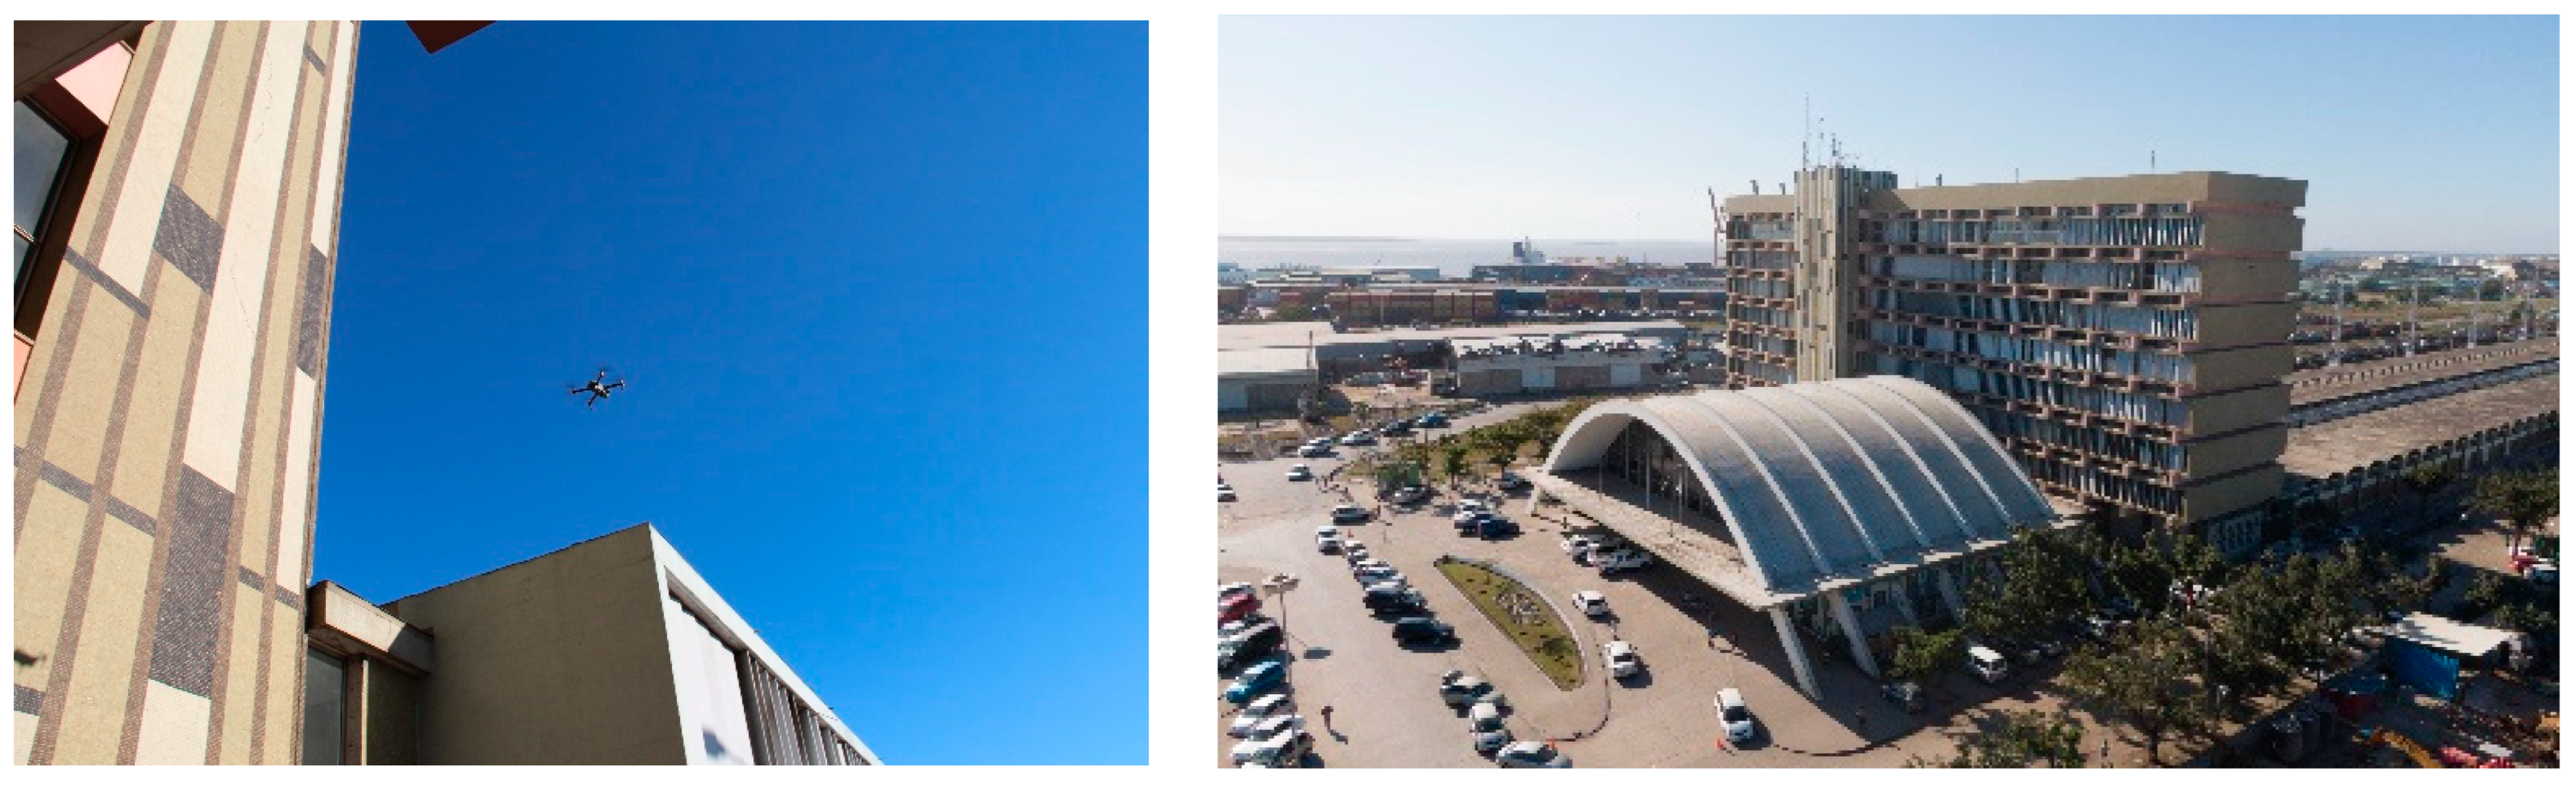
A detailed survey of the building was carried out. The different areas of the building were photographed to document the building elements (architectural, structural, infrastructure, and decorative) and the most representative damage observed. In order to obtain an accurate geometrical representation of the building areas, including inaccessible areas, such as exterior ones, a drone survey (using a DJI Mavic 2 Pro) was carried out (
Figure 5). All exterior areas of the building were documented with aerial photos and videos, including the atrium, the main administrative body, and the platforms with the command body.
3. Damage Survey
In order to analyze the current condition of the railway station, an extensive building survey was carried out. In general, the building remains in a reasonable state of conservation, without interventions that have substantially altered its original physiognomy. Nevertheless, the building lacks maintenance and has been subjected to important extreme natural events, namely cyclones. From the visual inspection, several types of damage were found and described according to the MCDS damage atlas for concrete [
24,
25], ranging in degree of severity.
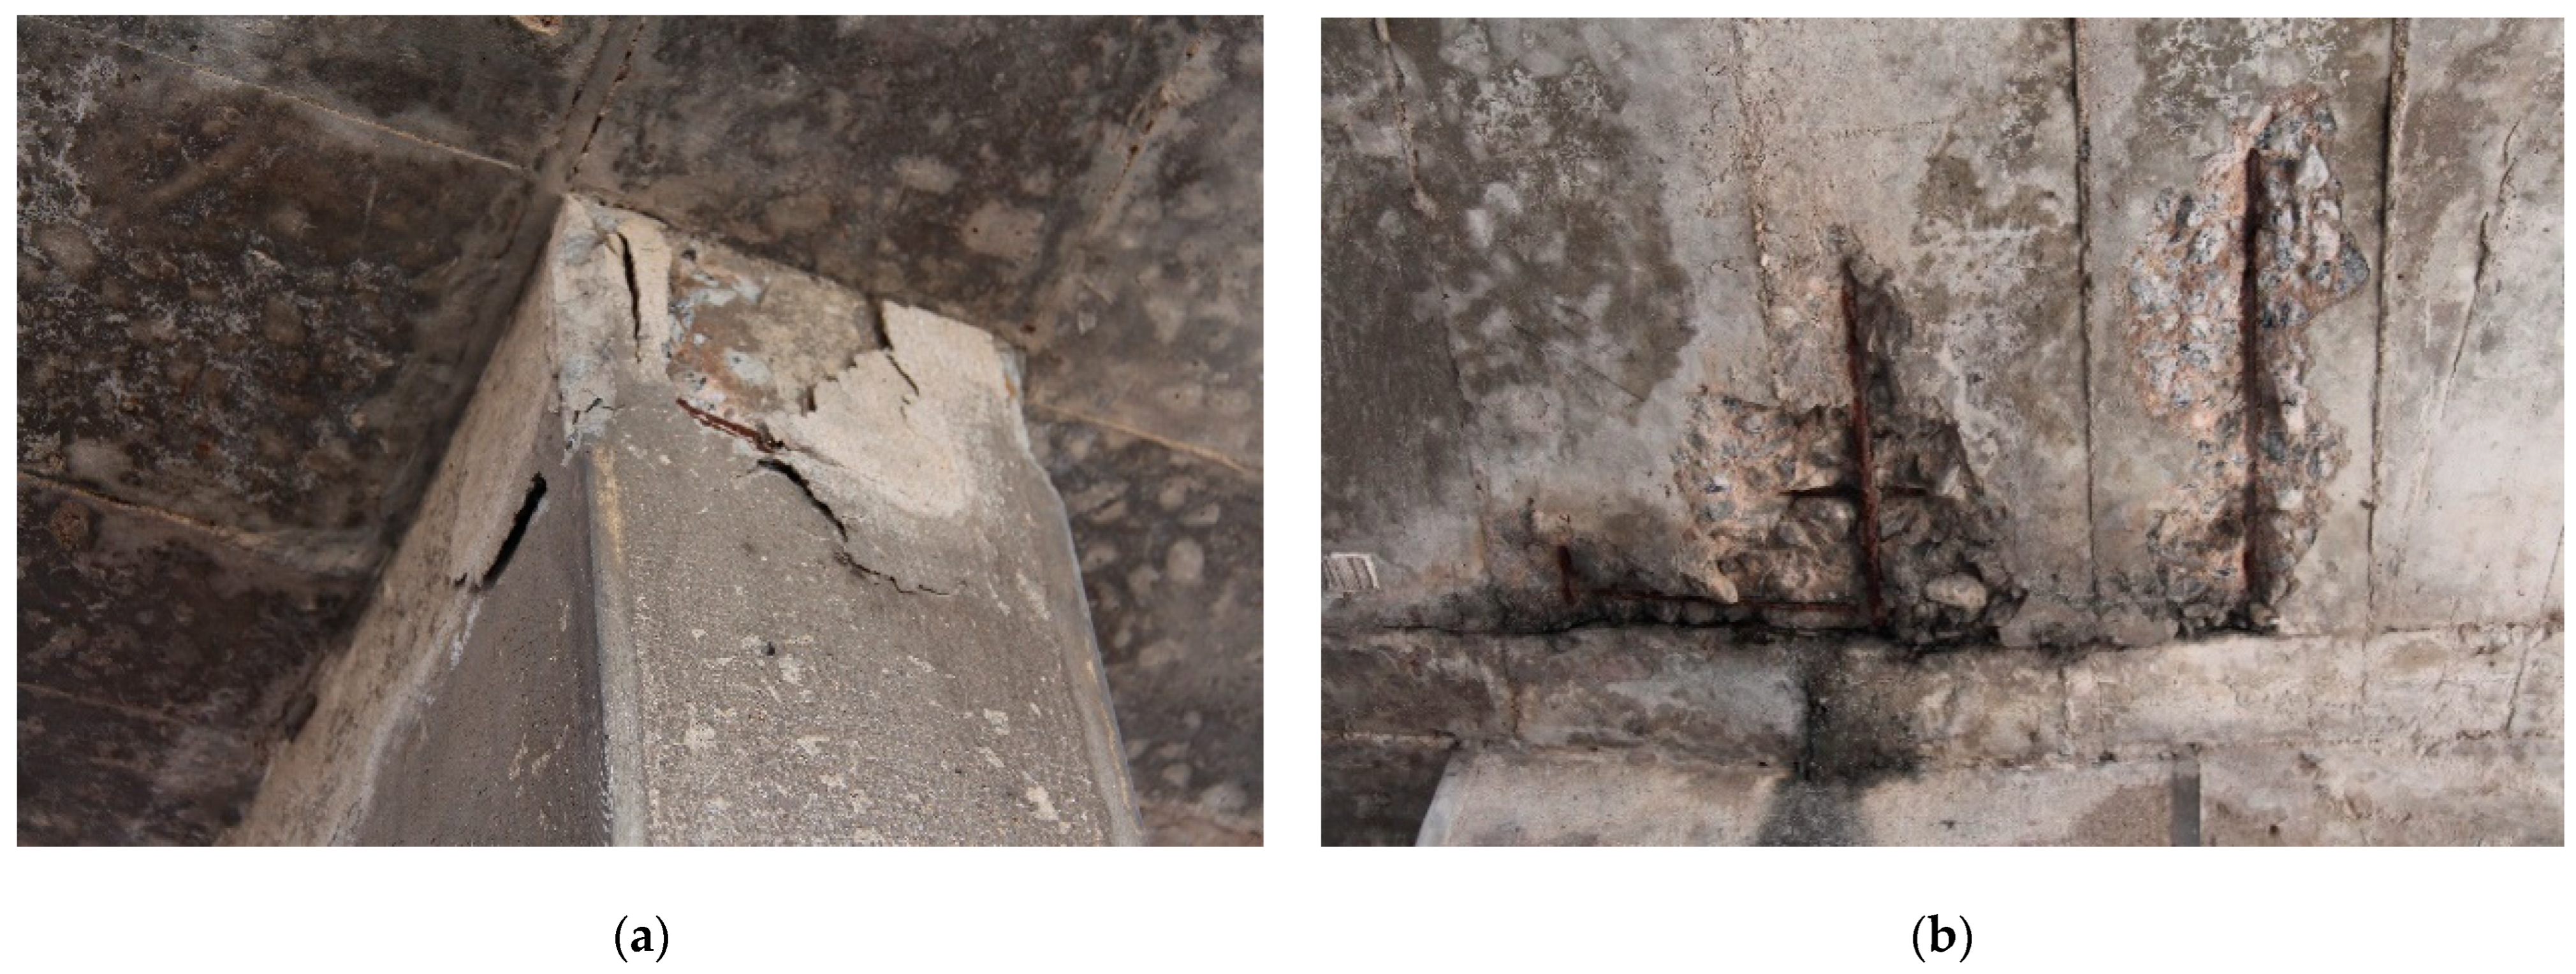
In the area of the platforms, the most significant damage observed is related to the corrosion of the reinforcement within the exposed concrete elements of the porches (
Figure 6). The corrosion of steel elements is widespread throughout this area. The direct exposure of the elements to the weather and the low level of maintenance after the onset of damage aggravated the condition. As a result of the corrosion, the disintegration of the concrete is also evident, such as cracking and spalling. Damage is more intense at the construction joints, where water infiltrates easily. Leaching, efflorescence, and other water-induced deposits are also widespread on the surface. Additionally, structural and non-structural elements show mechanical damage due to impact, as a result of the use of the building.
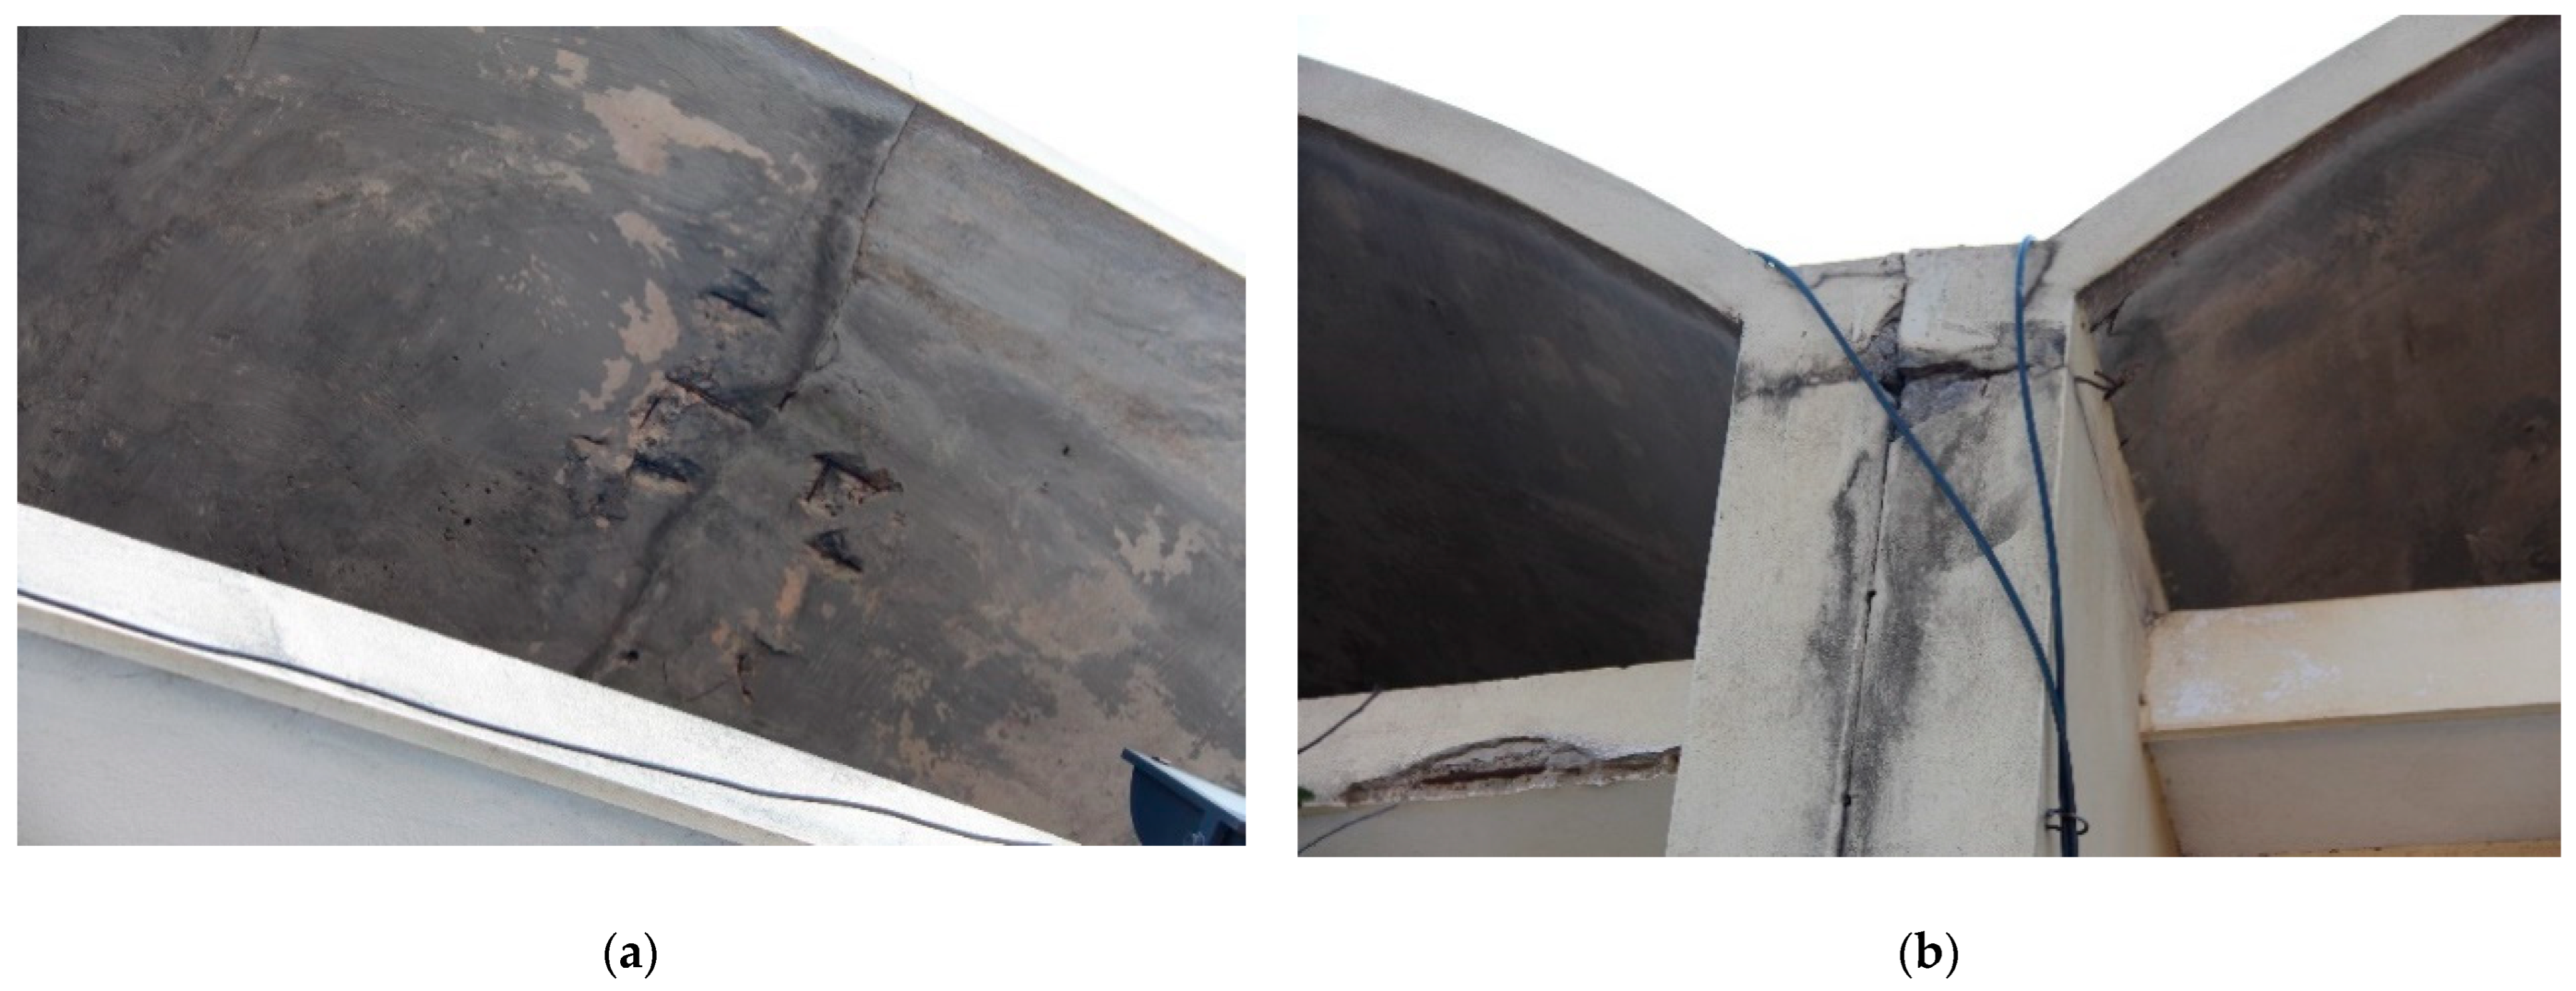
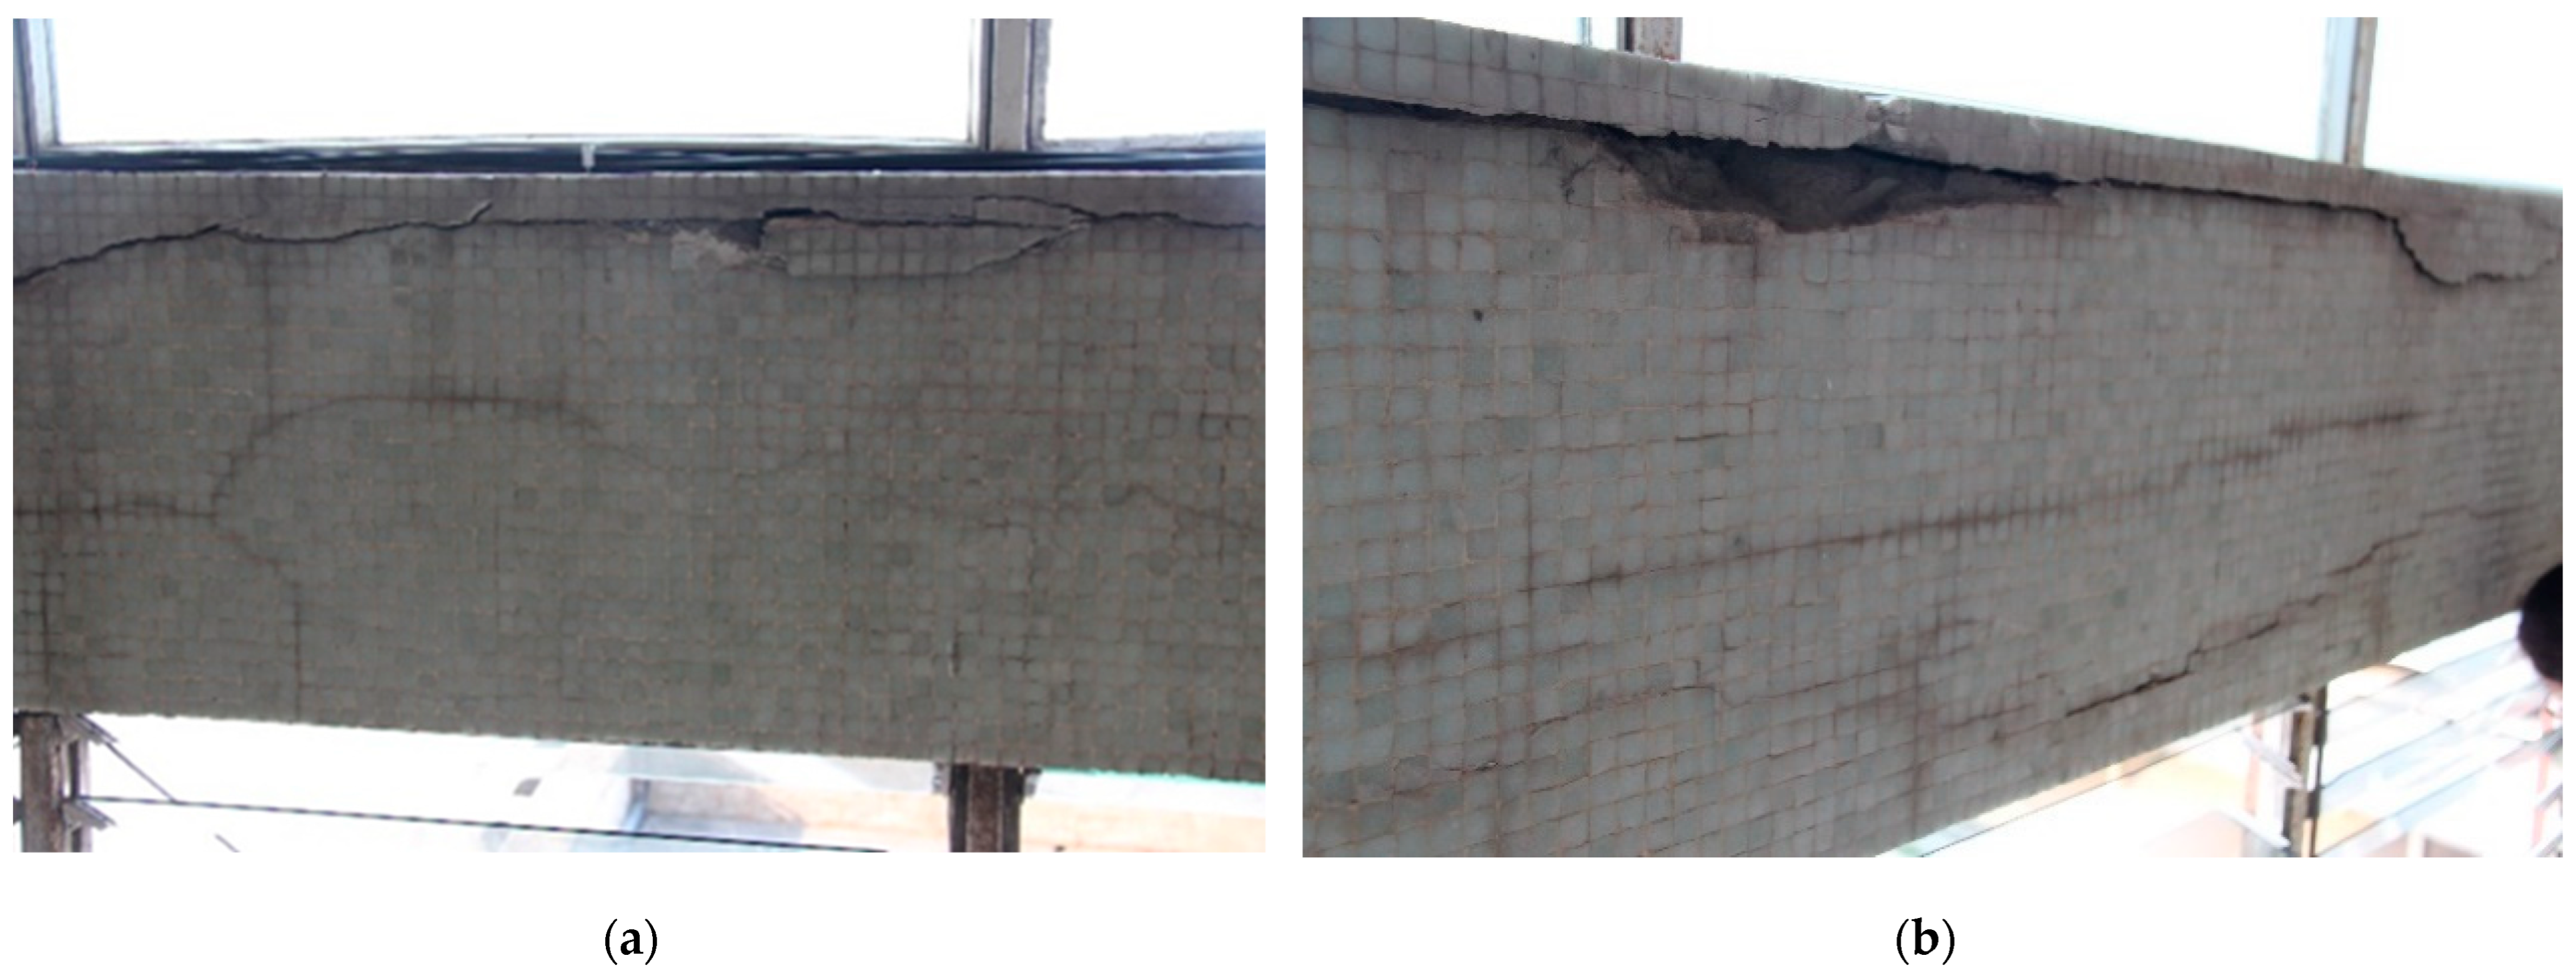
In the command body for the platforms, the most frequent damage observed is cracking at walls and beams. The corrosion of steel reinforcement is also present and widespread in the vaults and beams, which are the structural elements directly exposed to weather conditions (
Figure 7). As a result, there is the recurrent spalling and cracking of the concrete. In addition, there is much non-structural damage on the walls, mostly related to the installation of air-conditioning units.
In the atrium, the structural elements are in an overall good state of conservation. The most significant damage was observed on the beams that support the first floor of the administrative body. Interconnected cracks are observed, defining a map-cracking pattern on the beams on both sides. Cracks are also observed on other elements, namely on the wall enclosing the staircase that gives access to the toilet facilities under the restaurant and on the concrete slab that covers the transition space between the public and the passage atrium. Regarding non-structural damage, the most relevant issue is related to the damage observed at the glazed elevation of the atrium, involving missing elements, broken windows, window frame deformations, and corrosion. The observed damage in these elements has been severely aggravated by Cyclone Idai, which hit Beira on 15 March 2019. Additional damage observed includes staining, mechanical damage, and issues related to recent interventions and repairs.
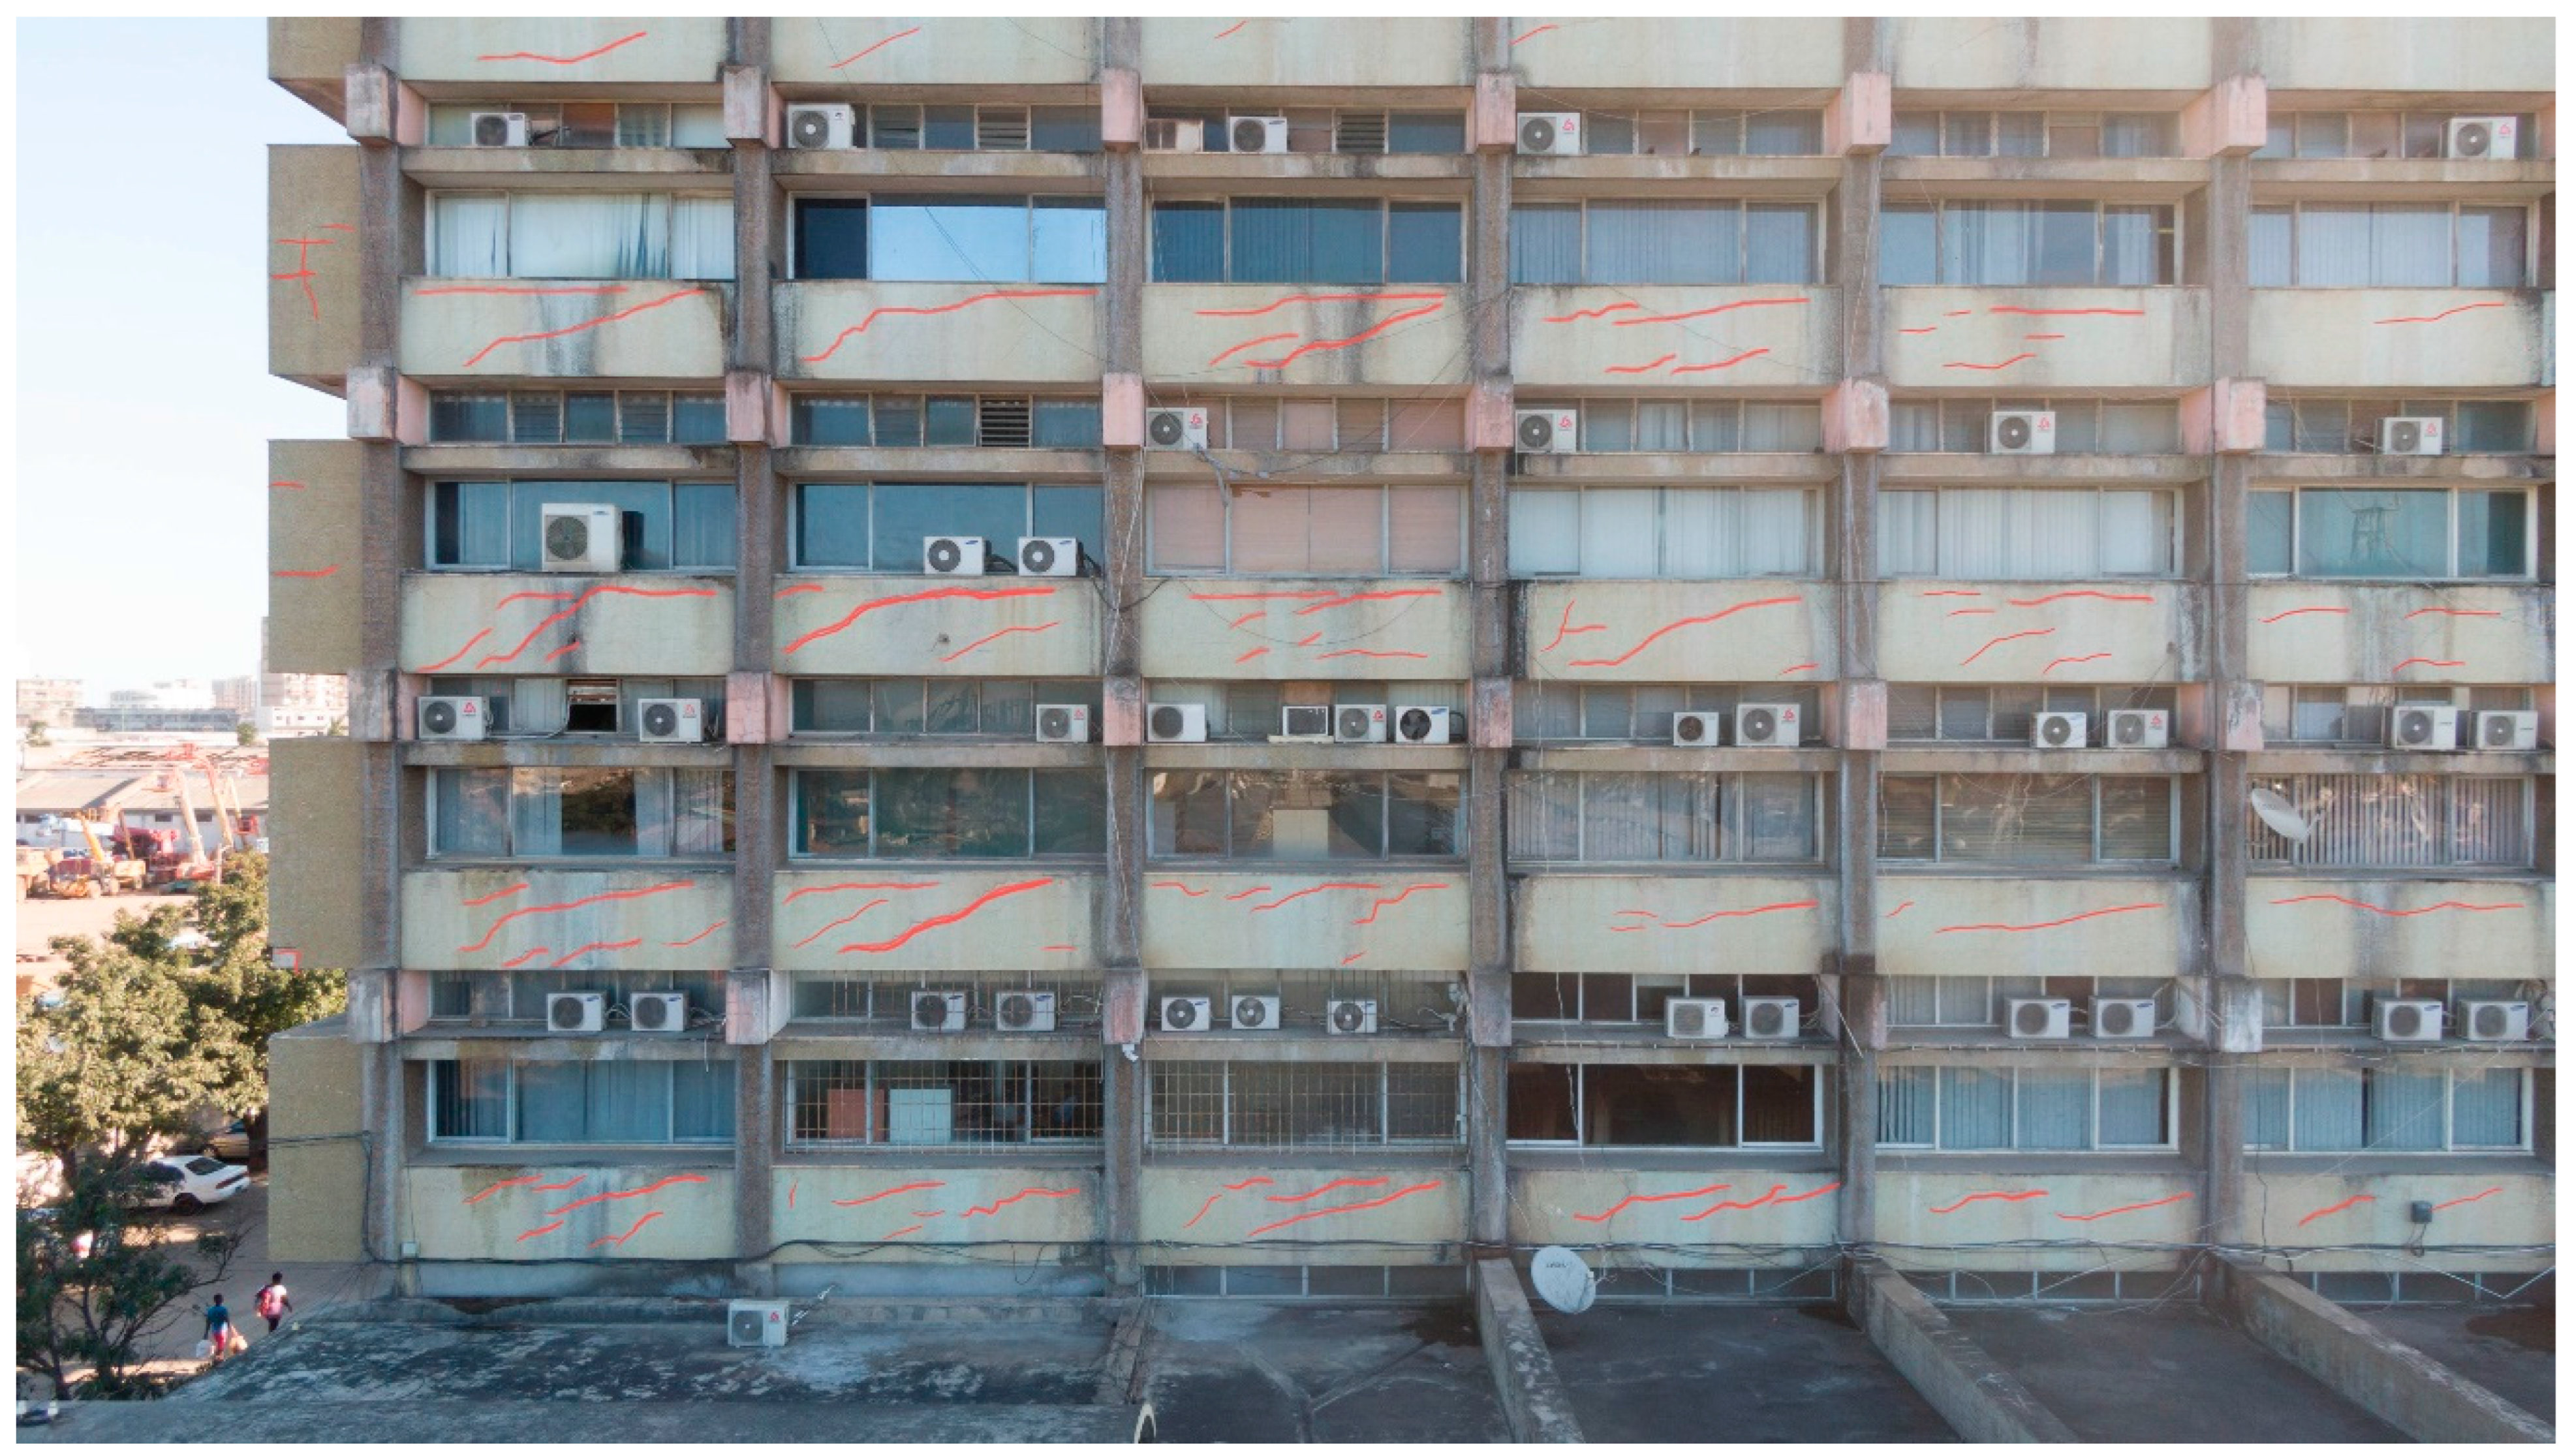
In the administrative body, the most frequent damage is cracking on the masonry walls (
Figure 8). Specifically, diagonal cracks were systematically observed on the walls that separate the glazed hallway from the office area. A few cracks are also visible in the structural elements, namely beams and columns. Another recurrent damage observed is related to the windows and the
brise-soleils of the gallery. The cyclone Idai caused the loss of many elements and damaged others. Decay was also visible through the advanced state of the corrosion of metallic elements, such as the anchors of the
brise-soleil and the window frames. Recent interventions include the installation of new toilet facilities and modifications of the original distribution of space and have altered the original design and visual aspect of the administrative body.
In the staircase of the administrative body, cracks are observed in the beams of the rear façade that supports the windows (
Figure 9). These cracks were observed in the beams of all floors. The lateral walls of the staircase also present widespread cracking. There is a general decay of the window elements of the glazed façade, showing signs of corrosion, the deformation of metallic profiles, and missing or broken elements. Previous interventions have also altered the original aspect of the building. A systematic loss of the ceramic tiles on the steps was detected. Decorative elements also show widespread damage. Original elements are lost and others show evident signs of decay, such as corrosion or broken parts.
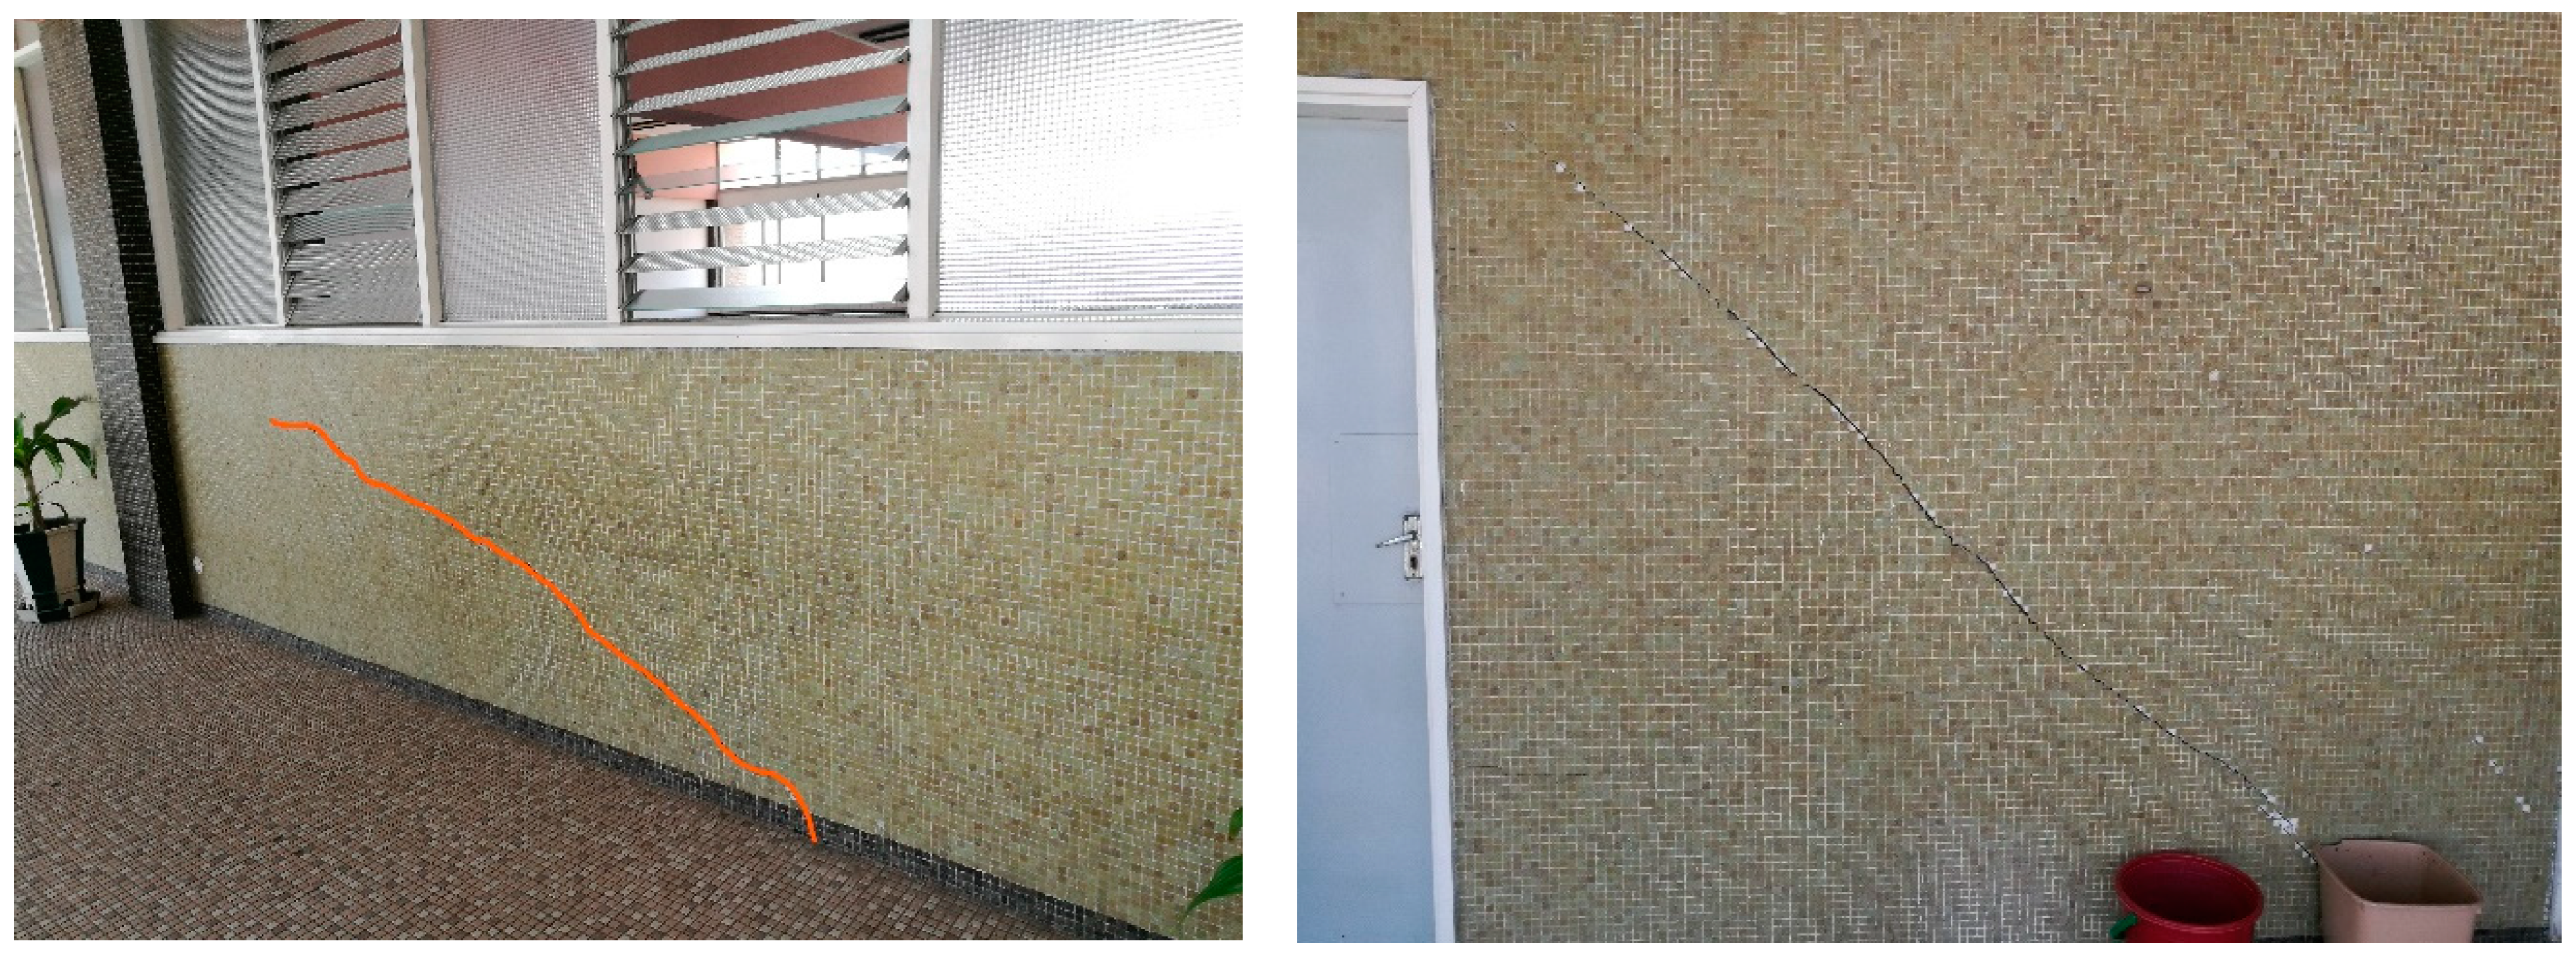
Regarding the exterior areas of the building, all masonry façades of the administrative body show significant widespread cracking, mostly following a random distribution. However, masonry walls on the ground level, including those finished with a continuous ceramic tile mosaic, show a clearer pattern involving significant diagonal cracks, also found in the administrative body (
Figure 10). The generalized corrosion of metallic elements and window frames was also observed. Additionally, recent interventions involving the installation of new facilities, the construction of adjacent sheds concealing the ceramic mosaics, or the hanging of new advertisement signs have also affected the external appearance of the building, which is detrimental from the point of view of aesthetics and authenticity.
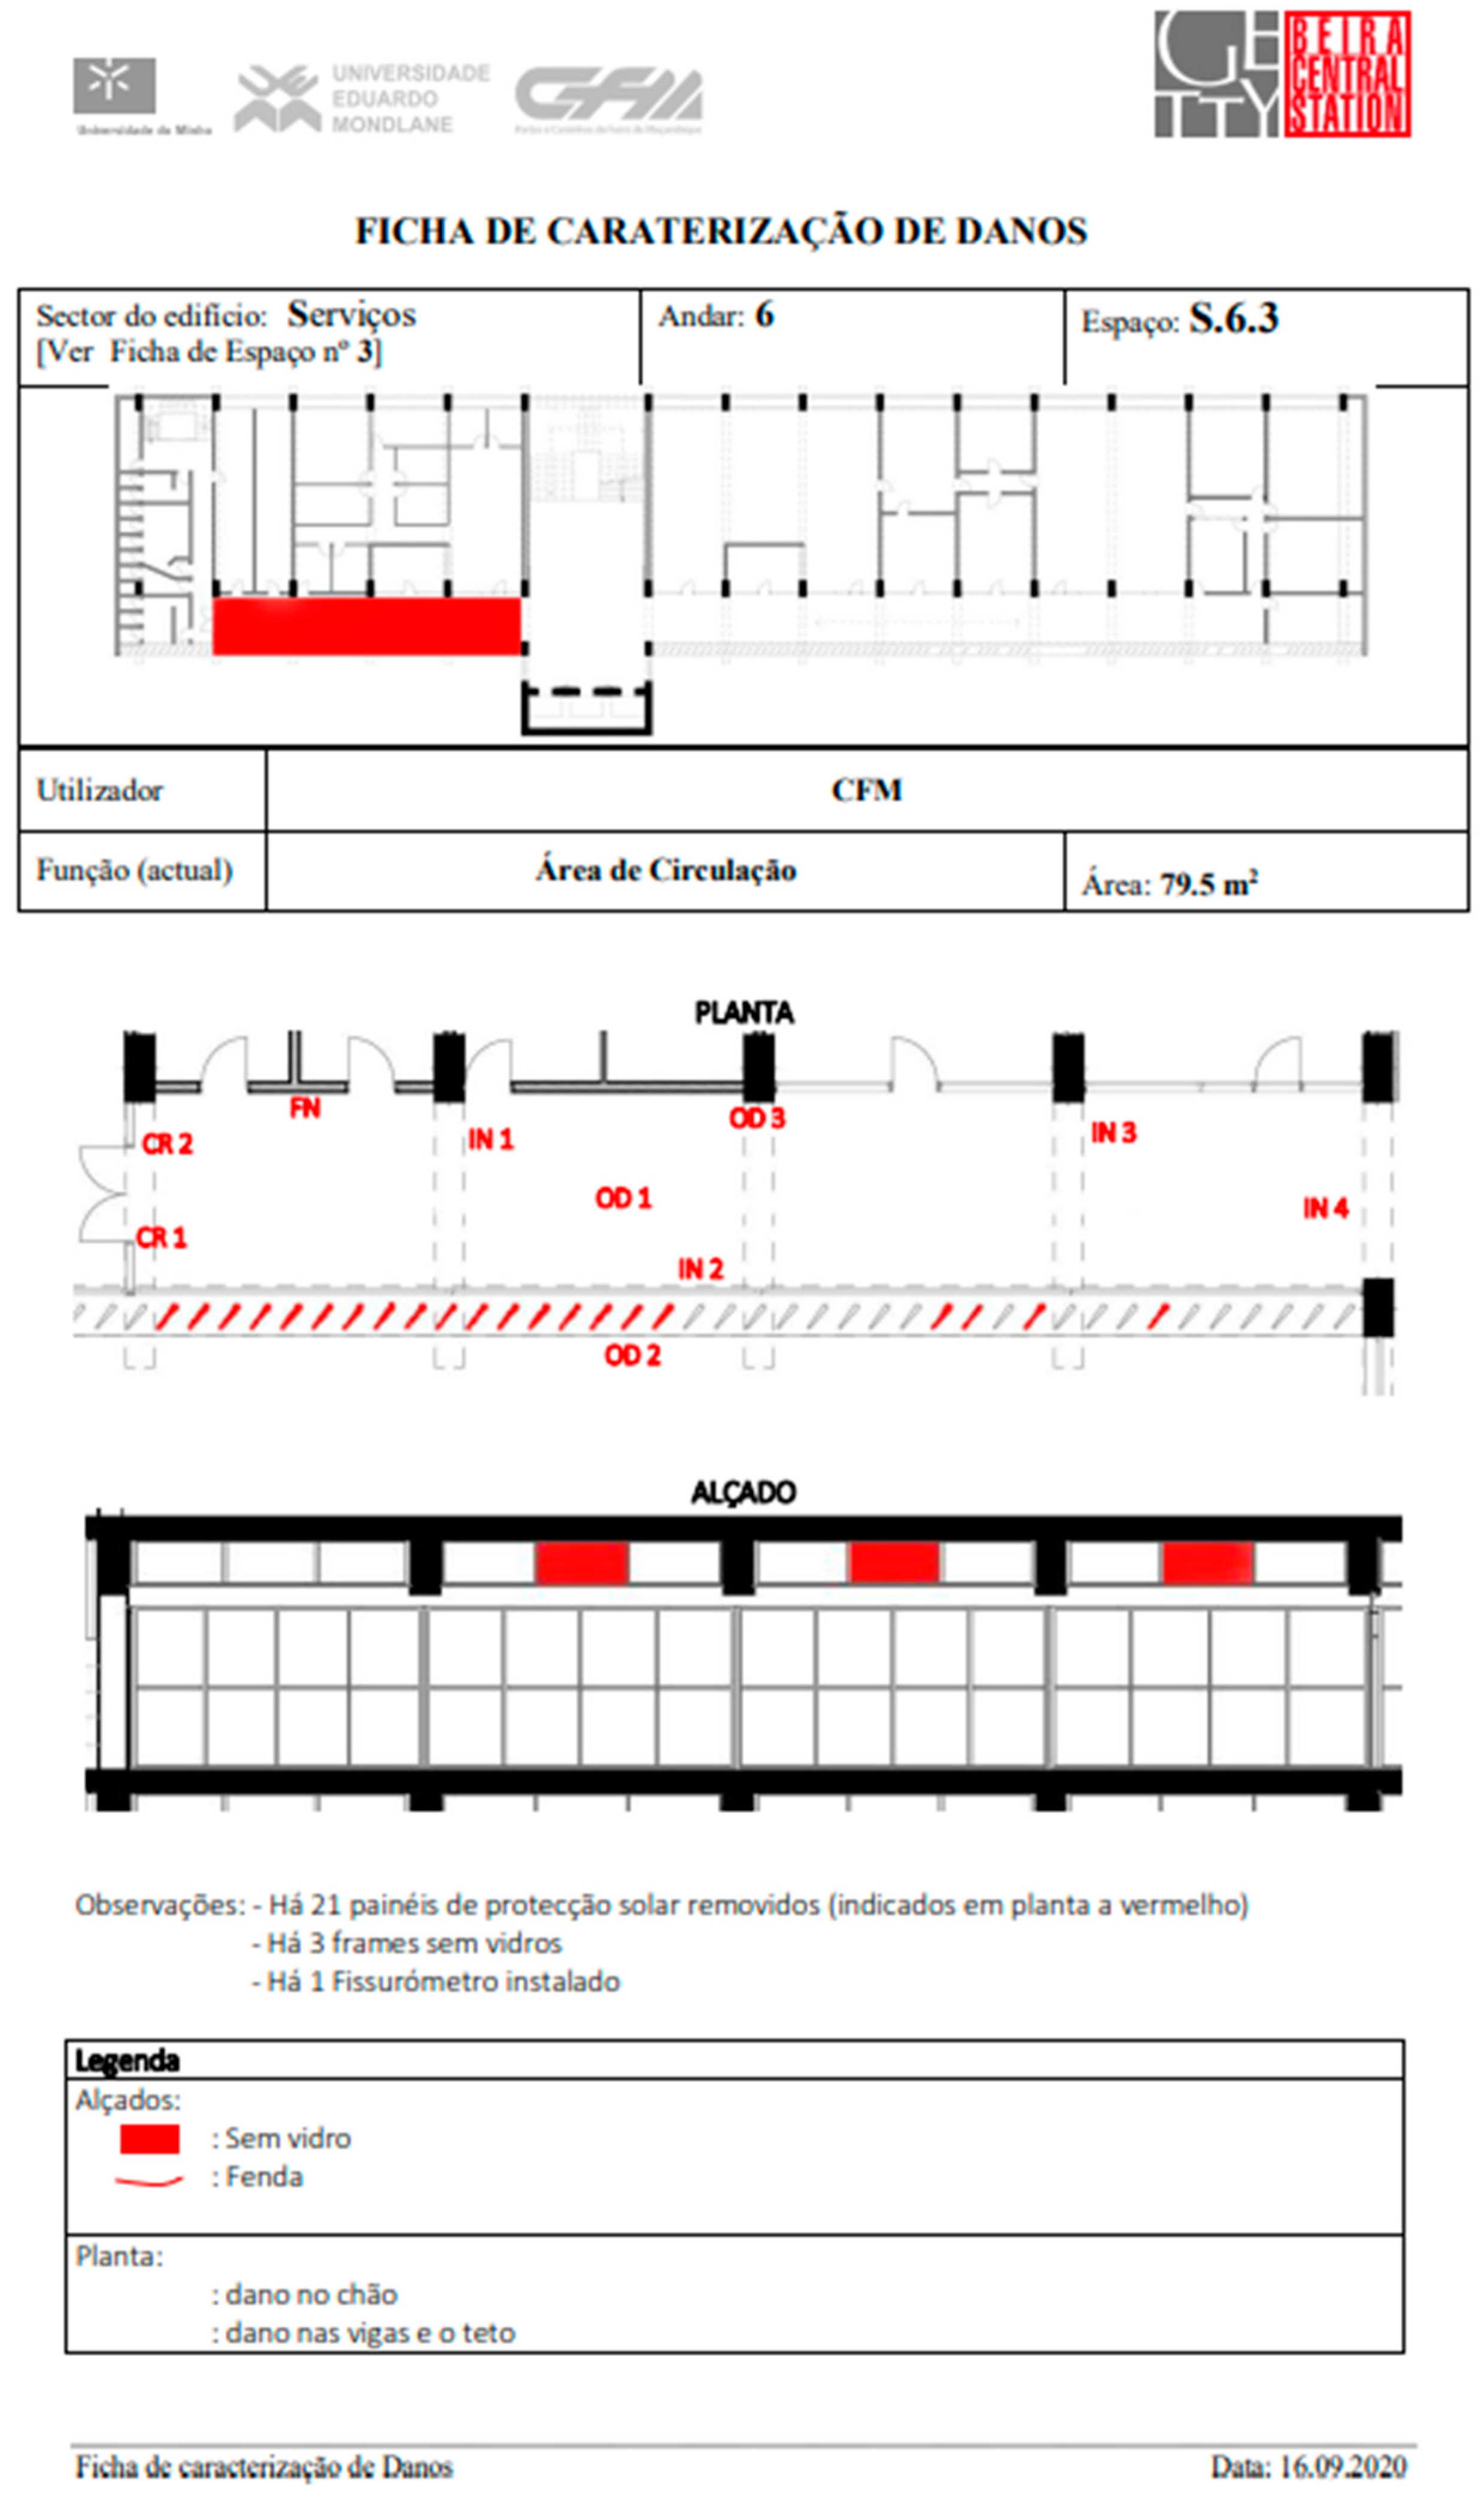
As part of the damage survey works, a detailed comprehensive database with information about the damage to each space in the building was created. The information is collected in sheets (
Figure 11) with the objective of (i) obtaining a comprehensive database that serves as a reference for the current state of the conservation of the building and (ii) generating a tool that helps in the process of the management and maintenance of the building. These sheets will be a working tool where the information can be updated following the same system that has been employed to create them. The tools are thus aimed at becoming a documentation tool, registering not only the current state of the building but also later alterations, repair works, and interventions carried out.
4. Material State of Conservation: On-Site and Laboratory Tests
The non-destructive testing campaign and the laboratory tests carried out are mainly intended to provide information about the quality, uniformity, and state of conservation of the concrete elements. Both the Ultrasonic Pulse Velocity (UPV) test and the Rebound Hamer (RH) test are aimed to evaluate in-place the quality and homogeneity of concrete materials. They are able to delineate regions in a structure of poor quality or deteriorated concrete. Through empirical correlations, they can also be used to predict the strength of the concrete, but the reliability of the methods without calibration with tests in concrete cores removed from the structure is weak. The UPV test can also be applied to evaluate the dynamic modulus of the concrete. Additionally, the core extraction and the laboratory tests help to provide more detailed information about the condition of the concrete.
4.1. Ultrasonic Pulse Velocity Test
The UPV test is a well-known, non-destructive technique that is applied for the determination of the velocity of the propagation of pulses of ultrasonic waves in the material. The test procedure and application are well established in several international standards [
26,
27]. The test is performed by sending an ultrasonic wave from a transmitter to a receiver through the concrete, recording the transmission time. The wave propagation velocity in the concrete can be correlated with its physical and elastic properties, such as density, Poisson’s ratio, and dynamic elasticity modulus. It is also applicable to assess the uniformity and local quality of the concrete and to detect deteriorated areas. Cracks and internal voids within the concrete obstruct the wave path and delay the arrival of the ultrasonic pulse. Lower velocities thus indicate possibly deteriorated areas and possible internal defects in the concrete.
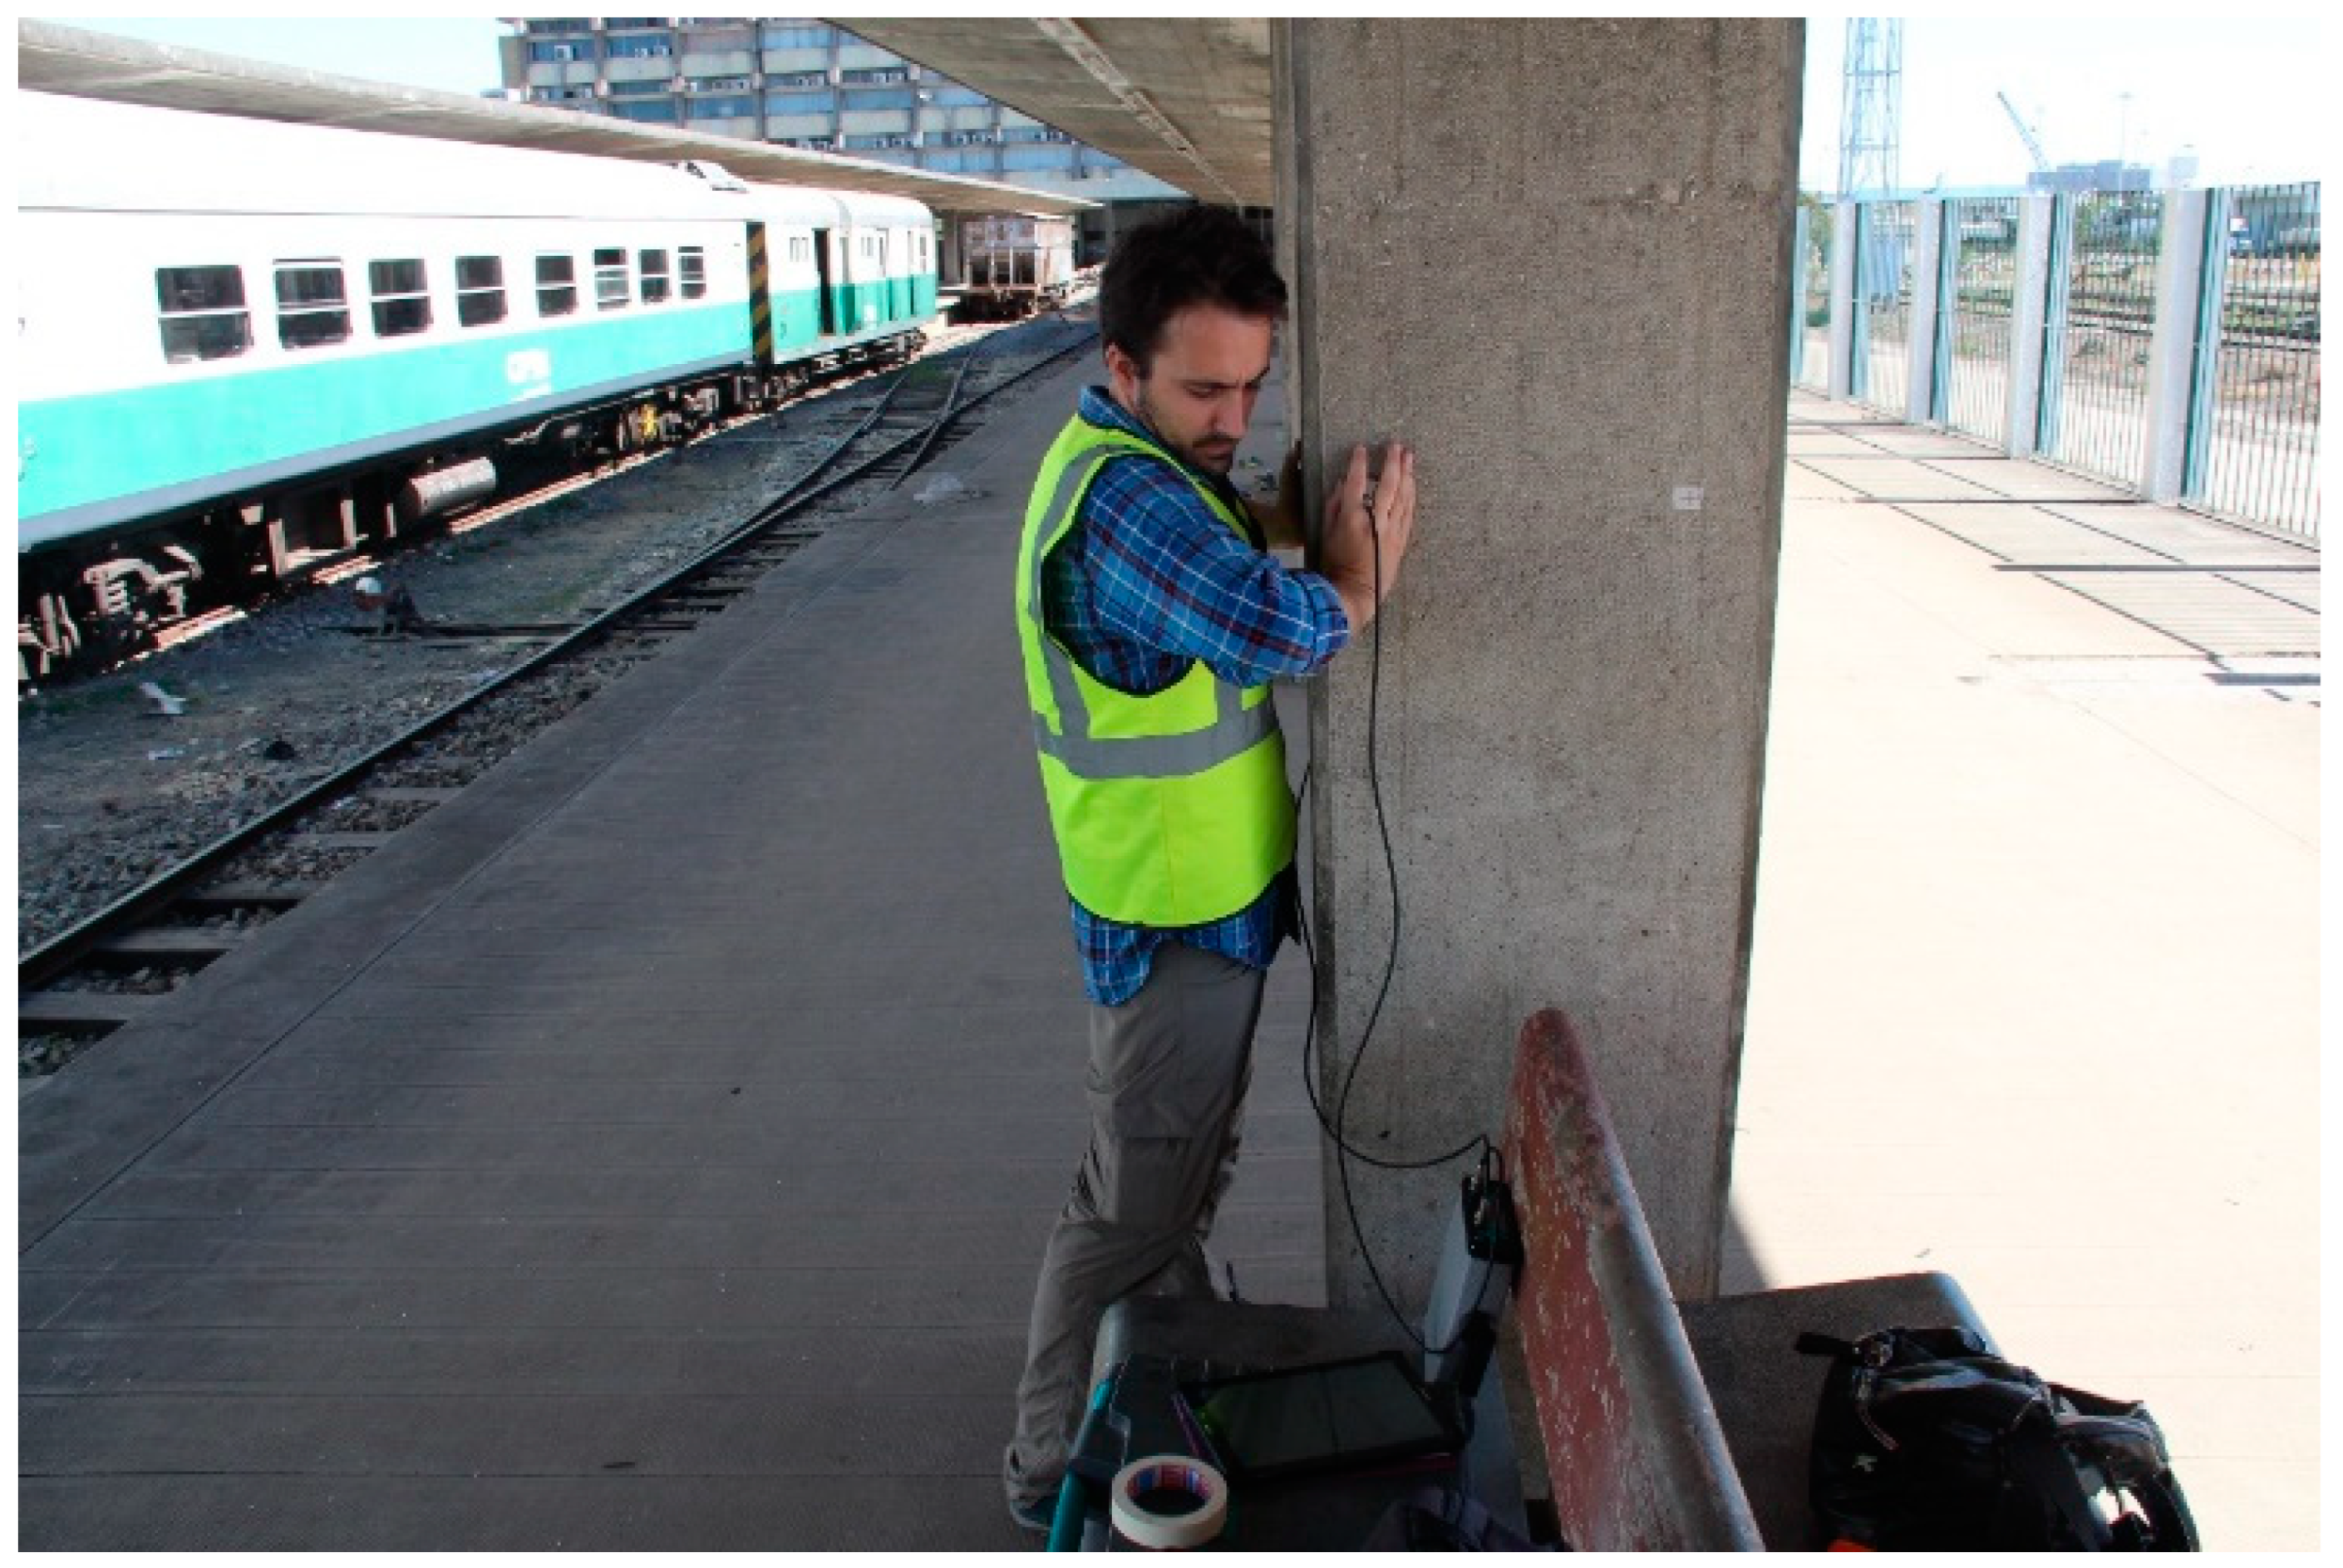
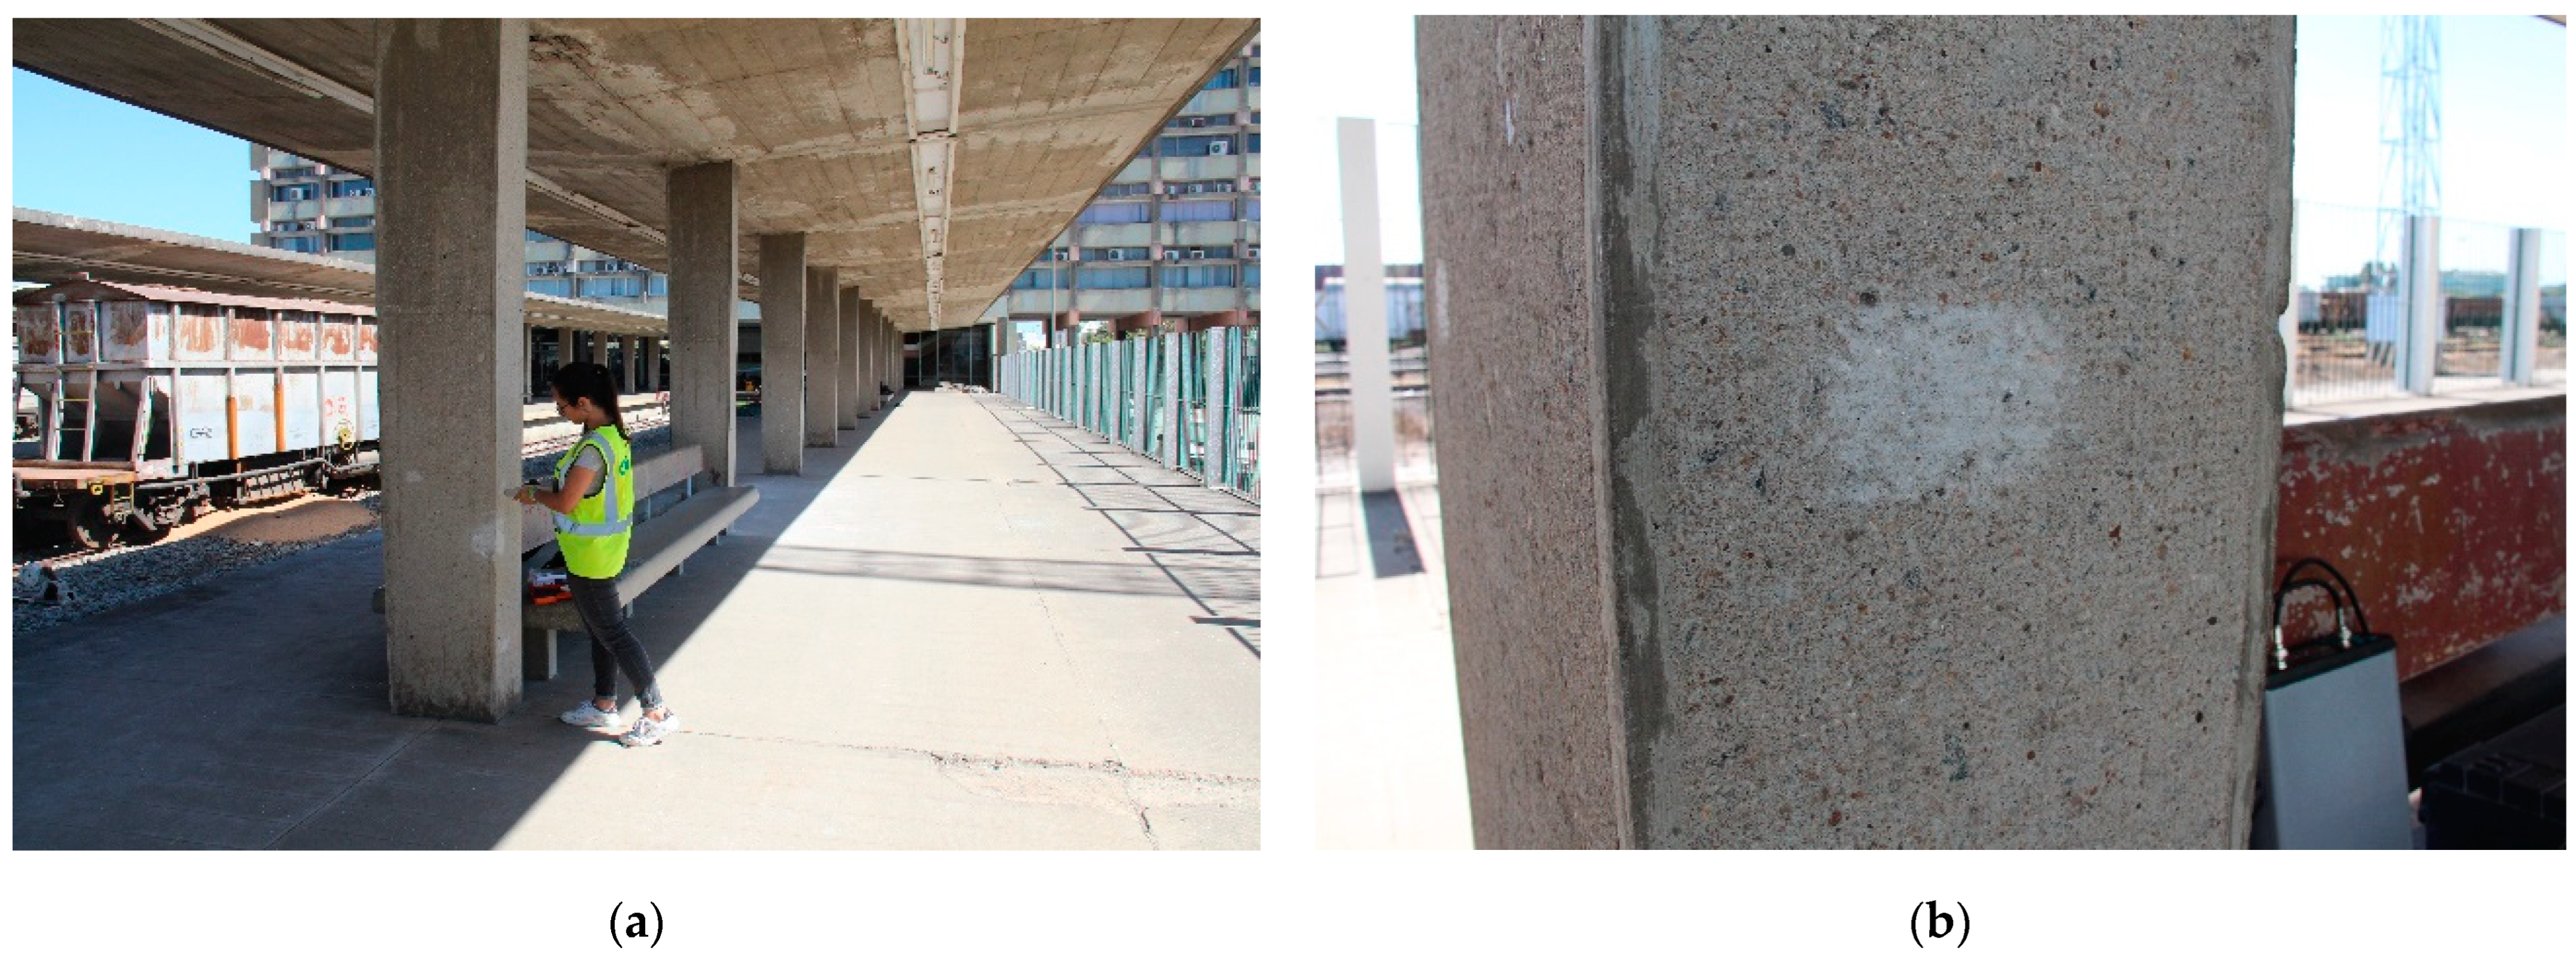
The UPV tests were performed in eight representative locations throughout the building. All tests were performed on concrete primary structural elements of the building, namely columns and beams. Exposed concrete structural elements, not covered by tiles, such as the columns in the platforms area, were preferred (
Figure 12), as the columns in the administration body were all rendered with ceramic tiles. One of the concrete parabolic arches that define the atrium volume was also investigated. Two types of tests were used. The direct transmission arrangement, consisting of placing the transducers on opposite faces of the element, was used in all locations except one, where the indirect transmission arrangement was used. The tests were conducted with Pundit Lab equipment (manufactured by Proceq) with 0.1 μs precision and two 54 kHz frequency transmission transducers. A coupling agent was used to give acoustical coupling between the concrete and the face of each transducer. The equipment measures the wave travel time (
T). Once the distance between the centers of transducer faces (
L) is known, the ultrasonic pulse velocity (
V) can be calculated from Equation (1):
Depending on the size and the accessibility, one, two, or three transmission paths were measured in each element, performing three measurements per test. In the case of the indirect transmission arrangement, two measurements were done with transducers at different distances apart, at 20 cm and at 40 cm.
The values obtained for the columns in the platforms are fairly homogenous, with an average of 3800 m/s. The location in the center of the column presents a lower value. This is possibly related to the existence of the rainwater downpipe at the center of the column, as the original drawings show. The atrium arch, the exterior column of the administration body, and the beam on the sixth-floor show values greater than 4000 m/s, reaching 4620 m/s in the case of the beam (which can be also due to the presence of steel reinforcement). The column on the sixth floor showed unexpectedly low values. Damage was not observed in the area. The thicker plaster finish at the thinner column on the upper floors may justify the lower values. Similarly, the column on the roof floor also presents lower values. Here, an indirect transmission configuration was applied. The test may be capturing the velocities through the plaster instead of the concrete.
As a reference, a correlation between the ultrasonic pulse velocity and the quality of the concrete, suggested by Whitehurst for concrete with a density of approximately 2400 kg/m
3, is shown in
Table 1 [
28]. Based on this classification, the values obtained for the concrete in the Beira Railway station can be qualitatively assessed within the “good” class. Values obtained are typically around 4000 m/s and the values obtained below 3000 m/s are not considered representative, given the abovementioned characteristics of the locations.
The pulse velocity of the ultrasonic waves in concrete can also be related to the physical and elastic properties of the material. Assuming an elastic, homogeneous, and isotropic material, the correlation is as follows (Equation (2)):
where
Ed is the dynamic modulus,
υ is Poisson’s ratio,
is the density of the material, and
V is the previously calculated pulse velocity. The average value of pulse velocity obtained using the values for all locations is 4020 m/s. Assuming a common Poisson’s ratio for concrete of 0.2 [
29] and a density of 2400 kg/m
3, a dynamic modulus of the concrete of 34.9 GPa can be estimated.
4.2. Rebound Hammer Test
The Rebound Hammer (RH) test aims to determine the rebound number of hardened concrete using a spring-driven steel hammer. During the test, a mass propelled by a spring impacts a steel plunger in contact with the surface of the structure or specimen to be tested. The test result, expressed as the rebound number, is a measure of the rebound distance of the hammer [
30]. This test method can be used to assess the in-place hardness and uniformity of concrete, determine areas of poor quality or deterioration, and estimate in-place strength. Although the test is not intended primarily to determine the compressive strength of concrete, it can be used to estimate in situ compressive strength through a suitable correlation when combined with core testing. In the absence of in situ calibration, a lower bound of the compressive strength may be obtained using empirical correlations from the literature [
28].
The RH tests were performed on the face of exposed concrete elements, with no finishing, such as tiles or plaster. The apparatus used was a concrete test hammer 58-C0181/C from the manufacturer Controls. The hammer was held firmly perpendicular to the test surface of the element and the instrument was gradually pushed towards the concrete until the hammer impacted (
Figure 13a) [
27,
29]. After impact, constant pressure was applied to the device and the button on the side of the instrument body was pushed to lock the plunger in its retracted position, fixing the rebound number in the scale. Several aspects have to be controlled, such as (a) the position of the hammer relative to the vertical position, since this affects the results due to gravity; and (b) the surface roughness, which has to be ground, in case it is heavily textured, soft, or presents loose mortar, until it is smooth and free of loose material (
Figure 13b).
The highest values of rebound numbers were obtained for the columns on the platforms, which range between 46 and 49. Nevertheless, all the remaining values of rebound numbers are within a similar range, varying between 44 and 45. The test performed in the exterior part of the arch showed a notably lower value, which can be because the surface tested seems not to be concrete but a rendering. The average value of the rebound number obtained from the six locations tested, disregarding the value from the arch, is 46. The variation among the locations is low, as well as the variations within each location. The sample is limited but, overall, shows a uniform concrete used throughout the building. Moreover, all values are above 40 and most of them are close to 50, which is typically indicative of good, hard concrete. Note that the scale ranges between 20 and 55.
4.3. Concrete Cores
Besides the non-destructive campaign performed on-site, the extraction of concrete cores to carry out laboratory tests to characterize the materials from the building was also performed. The characterization consisted of the extraction of fifteen concrete cores from selected construction elements at the station. The cores were then tested in the laboratory under compression to obtain the concrete compressive strength. Carbonation depth tests were also performed on ten cores. Additionally, samples of the concrete paste were extracted to estimate the chloride and sulfate content.
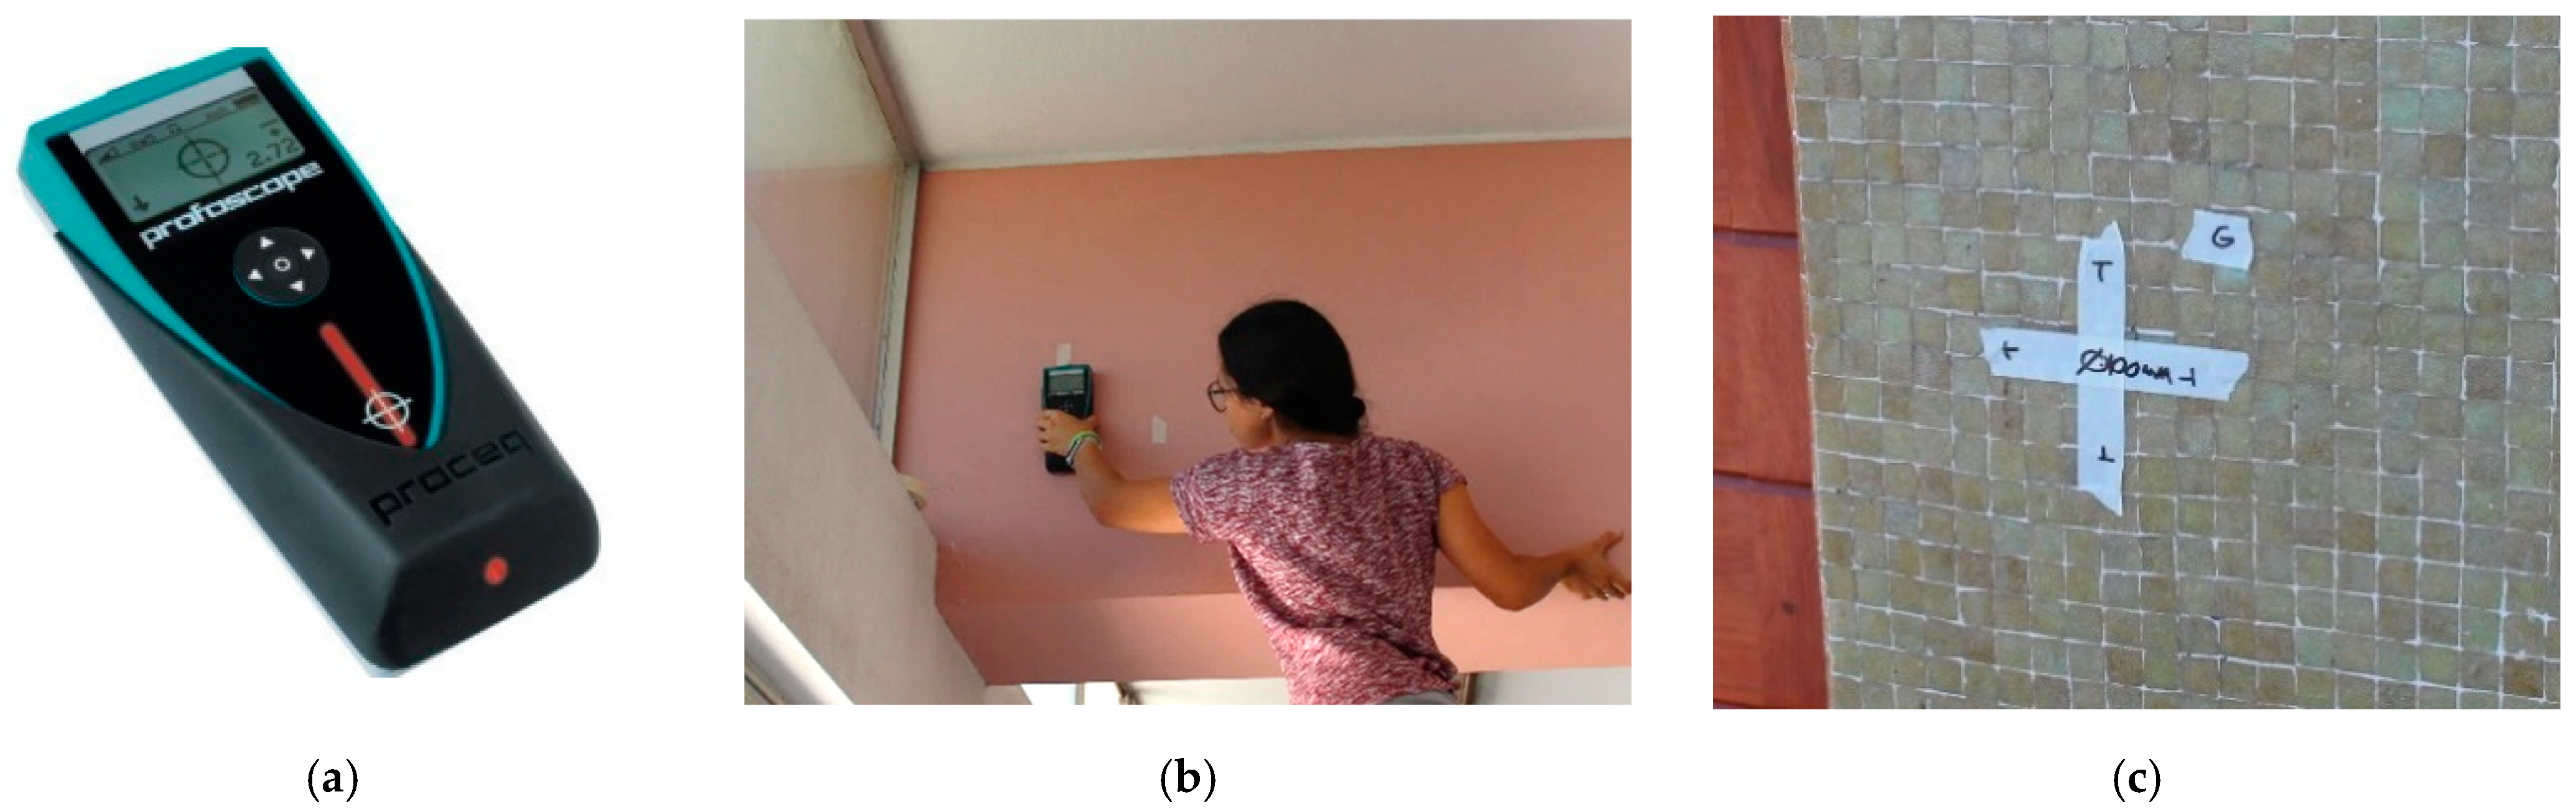
In order to determine the appropriate location for the extraction of cores, a PROCEQ Profoscope rebar detector (
Figure 14) was used. The compressive test specifications require concrete cores without reinforcing bars. The detector allowed us to locate the reinforcement bars and avoid them, so that intact concrete cores without reinforcement elements could be extracted.
4.3.1. Carbonation Test
Carbonation is a chemical process that causes a reduction in the alkalinity of the concrete and, consequently, allows the corrosion process to occur in the steel bars with subsequent damage to the concrete. Carbonation tests were performed on ten concrete cores extracted for laboratory testing. The tests included the extraction of the cores and the application of a phenolphthalein solution on the core’s surface, aiming at determining the carbonation depth in the concrete. The carbonation depth is determined based on the reaction of the phenolphthalein solution with the concrete (color of the surface), i.e., pink means non-carbonated concrete and grey means carbonated concrete.
Table 2 shows a summary of the carbonation depth obtained in each core. The results show that a significant part of the concrete that is left exposed in the exterior (platforms and roof) is carbonated, reaching a depth that may exceed the common reinforcement bar cover and thus leaving the steel unprotected and prone to corrosion. This agrees with the corrosion observed at those locations in the building, particularly at the platforms. It is noted that the building is located in an environment with high relative humidity and is close to the sea. On the other hand, the elements that were protected with either mortar or ceramic tiles are non-carbonated. This illustrates the need for the protection of those reinforced concrete elements that are exposed on the exterior, particularly in the platform area, where the corrosion of the steel elements was evident and widespread.
4.3.2. Laboratory Tests to Determine Concrete Mechanical Properties
The concrete cores extracted were tested in the laboratory to determine the mechanical properties of the concrete, namely the compressive strength. Fifteen rectified cylindrical concrete specimens were prepared from the cores. The height-to-diameter ratio (h/D) of the cylinders is 1. The diameter and height are 95 mm.
The average density is 2249 kg/m
3 with a 2% coefficient of variation (CoV). This value is in the lower range of concrete values that can reach up to 2400 kg/m
3. Considering the average density reported by the laboratory tests and the average value of pulse velocity obtained by the UPV test, the value for the dynamic modulus of the elasticity of the concrete is computed as 32.7 GPa using Equation (2). The dynamic elastic modulus estimated is typically higher than the tangent elastic modulus,
Ec [
31]. According to the Eurocode [
29], through the tangent elastic modulus, it is possible to calculate the secant elastic modulus,
Ecm, of the concrete using Equation (3):
The secant elastic modulus that can be estimated from the UPV tests is 31.1 GPa, a value that lies within the C20/25 (30.0 GPa) and 25/30 (31.5 GPa) classes of concrete [
29]. The characteristic cylinder compressive strength for these two classes of concrete is 20 and 25 MPa, respectively.
The mean compressive strength reported by the laboratory tests is 22 MPa with a 27% CoV. This value matches reasonably well the value estimated by the UPV test. The compressive strength of the specimens has been corrected based on the correction factors presented in ASTM C42/C42M [
32] because the h/D ratio is below 1.75.
The lowest values are observed on the roof floor (average value of 16 MPa). Moreover, the values of the elements from the platform area are lower, with a mean value of 21 MPa. This may indicate that the concrete applied in those areas, which are expected to sustain lower levels of load, might have been different from that applied in the elements of the administration building, or compaction is deficient. Another possibility is that the concrete in these elements is more deteriorated. It is noted that the carbonation tests showed that these elements are carbonated and thus are prone to corrosion.
The average compressive strength value of the concrete extracted from the structural elements of the administration body is 27 MPa. This value is in the higher range of standard grades of concrete. It is also noted that these elements do not show deterioration or evidence of corrosion (as illustrated by the carbonation tests). Therefore, the concrete elements on the administrative body, which are the elements sustaining the highest load, appear to be in a good state of conservation.
4.3.3. Chloride Content Testing
Under normal conditions, concrete provides protection that prevents the corrosion of the steel, mainly associated with the high pH of concrete and low electrical conductivity. However, during the lifetime of the reinforced concrete structure, external actions, such as the penetration of chlorides, can promote the electromechanical corrosion of the reinforcement bars, causing a reduction in the effective cross-section of the steel reinforcement bars and damage to the concrete. The penetration of chlorides is associated with environmental factors, such as the exposure of the building.
The building is located close to the sea and corrosion has been detected in the exposed concrete elements of the building. Therefore, samples of the concrete paste were collected and the chloride and sulfate contents were estimated. Concrete power was extracted at different depths in all locations where cores were extracted. The results show a low chloride content (below 0.05%) with an average value of 0.01%. This value is below common threshold concentration values, typically in the range of 0.05–0.1% by mass of cement [
33].
5. Climatic Analysis: Monitoring and Comfort Analysis
The environmental conditions of the building were recorded for one year, which provided a global view of the variations in temperature and humidity throughout the months. The monitoring is mainly intended to obtain a better understanding of the current comfort conditions in the building.
The analysis of the comfort conditions included the study of the climate characteristics of the city of Beira. A solar study of the building was conducted and related to the data obtained from the monitoring. After the analysis of the monitoring data obtained, a model was prepared, which includes information on the building’s geometry, construction, and materials. The thermal conditions could be simulated using this model, and the results obtained were compared with the monitoring data, which allowed us to validate the model. The final goal of this task was to provide information about the current comfort conditions of the building and to define measures that help to improve the energy efficiency of the building. For that purpose, different scenarios were simulated in the model (e.g., the addition of shades, replacement of windows, etc.). This strategy allowed for the quantitative evaluation of the efficiency of different measures to improve the energy behavior of the building.
5.1. Climate and Weather in Beira
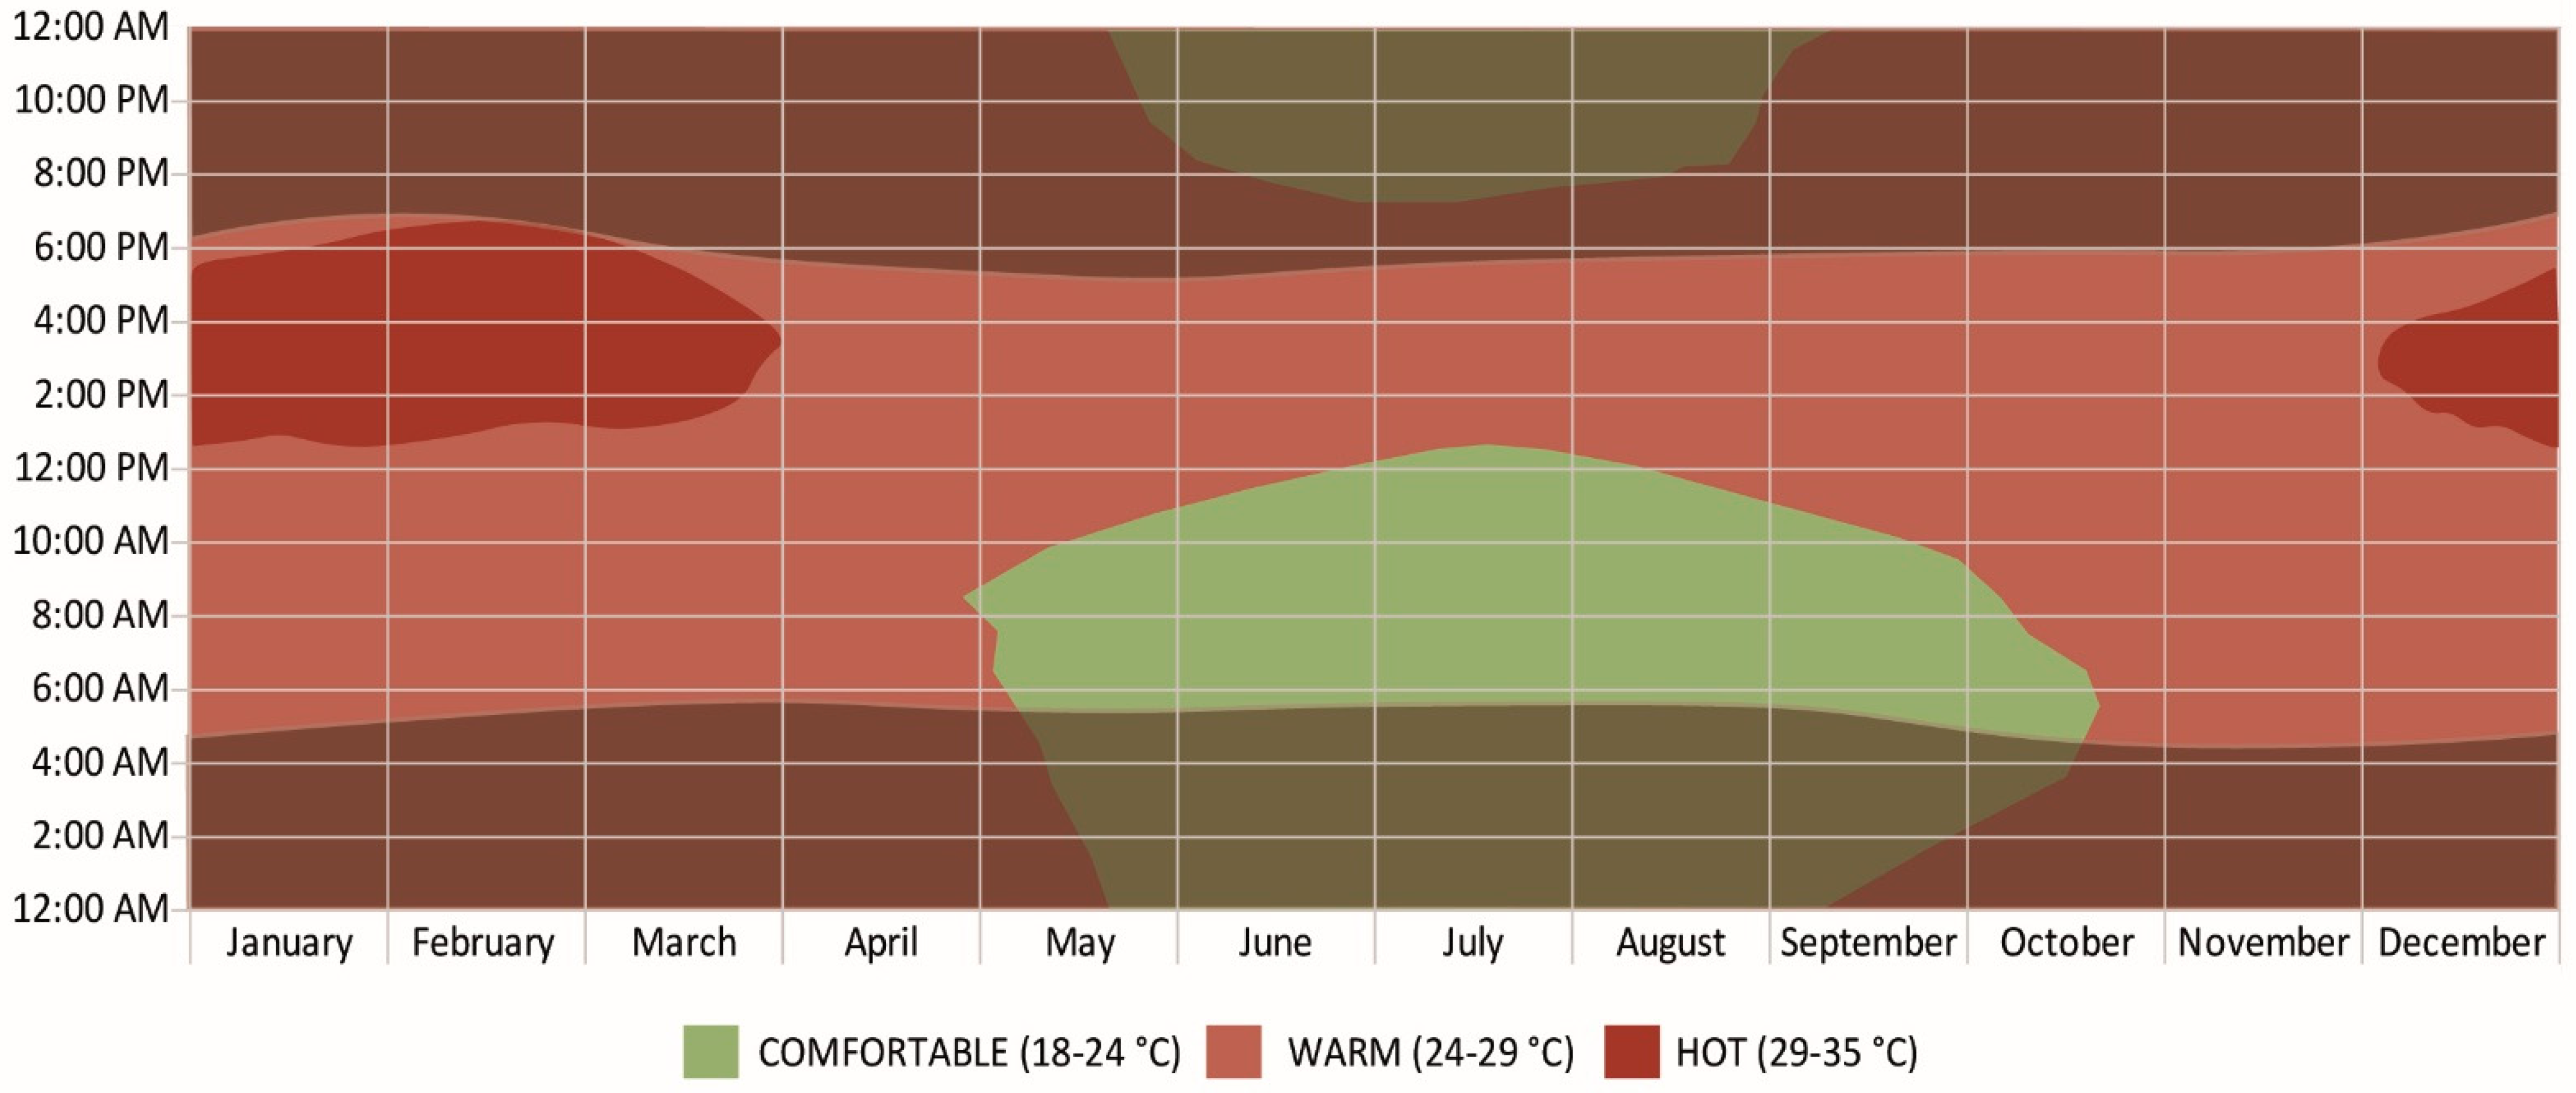
Regarding the climate and weather conditions of Beira, this city features a tropical savanna climate. During the course of the year, the temperature generally ranges from 20 to 31 °C and rarely drops below 18 °C or rises above 33 °C. The hot season lasts for 4.7 months, from 16 November to 5 April, with an average daily high temperature above 30 °C, and the cool season lasts for 2.6 months, from 6 June to 25 August, with an average daily maximum temperature below 26 °C [
34].
Figure 15 shows the characterization of the entire year of average temperatures, where it is possible to observe more clearly that the highest values are reached from December to March. These peak temperatures are reached during the afternoon, approximately between 1 and 6 PM.
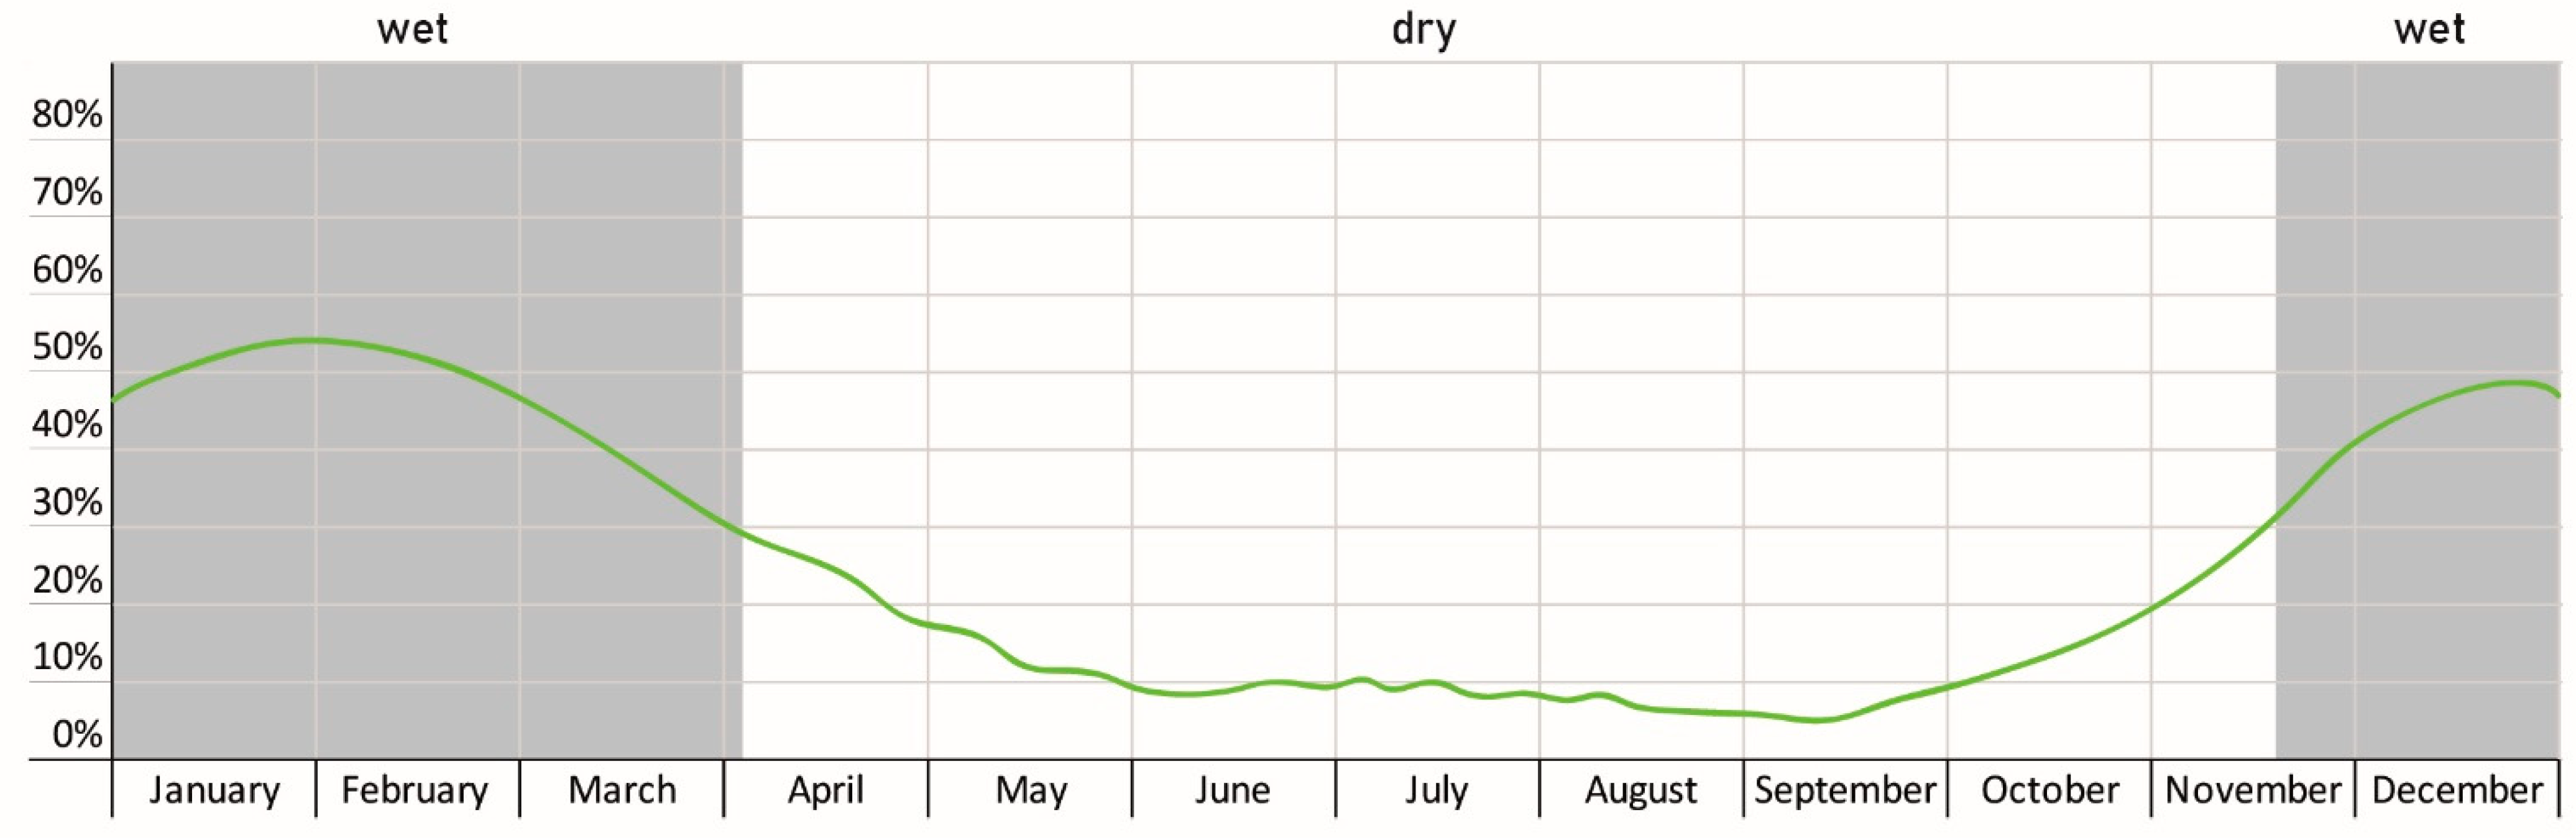
In terms of precipitation, the occurrence of wet days in Beira varies significantly throughout the year, considering a wet day as one with at least 1.0 mm of liquid or liquid-equivalent precipitation. The wetter season lasts 4.6 months, from 16 November to 4 April, with a greater than 29% probability of a given day being a wet day. The chance of a wet day peaks at 53% on 29 January. The drier season lasts 7.4 months, from 4 April to 16 November. The smallest chance of a wet day is 4% on 10 September [
34].
Figure 16 shows a graph with the probability of precipitation, in percentage, each day throughout the year in Beira.
5.2. Temperature and Humidity Monitoring
The temperature and relative humidity conditions were monitored in the building to obtain a better understanding of the current comfort conditions. The monitoring data allowed us to validate a model able to simulate the thermal conditions in the building by comparing the experimental with the numerical data. Five temperature and relative humidity (T&H) data loggers were placed in the building to gather readings of air temperature and relative air humidity. The different locations were considered representative of the different environmental conditions throughout the building. They were all unconditioned spaces, meaning that the temperature and humidity are not controlled. It is noted that none of the sensors was directly exposed to solar radiation. The sensors are standalone data loggers with a USB connection from Lascar electronics that are able to measure more than 16,000 readings with a temperature range from −35 to +80 °C and a relative humidity range from 0 to 100%, and a resolution of 0.5 °C (1 °F) and 0.5% rH. The sensors were set to take a reading every hour.
The first sensor was located in the main interior public space of the building, in the atrium (entrance hall). The main vaulted large space can be considered a semi-open space since the windows and doors are generally open. Moreover, in the current condition, many windows and doors are missing or broken. The data logger was placed on top of the restaurant slab. The second sensor was placed in the platforms area, on the exterior, outside the window of an office on the mezzanine floor of the administration body. This sensor is intended to capture the exterior environmental conditions of the building. It is noted that this exterior space is in the transition area between the platforms and the atrium, being covered by a lowered concrete slab and thus not directly exposed to sunlight. The other three sensors were placed in the administrative body. Two of them were located in the hallways, on the upper windows sill. They were placed on the second and sixth floors to capture possible changes in the environmental conditions of the building at different heights. The hallway can be again considered as a semi-open space, given the missing windows at the glazed façade. Finally, a fifth sensor was located on the sixth floor in the office area of the administrative body. This last location was considered representative of the environmental conditions of unconditioned enclosed spaces.
To better understand the variation of temperature and humidity in the administrative body, the sensors in this body were moved to different locations after 8 months. The sensor in the hallway of the second floor (sensor 3) was placed on the third floor, at the same position, and the sensor in the hallway of the sixth floor (sensor 4) was placed on the seventh floor, at the same position. The position of sensor 5 (in the office area) was also modified in order to analyze the comfort conditions in different interior office spaces of the administrative building.
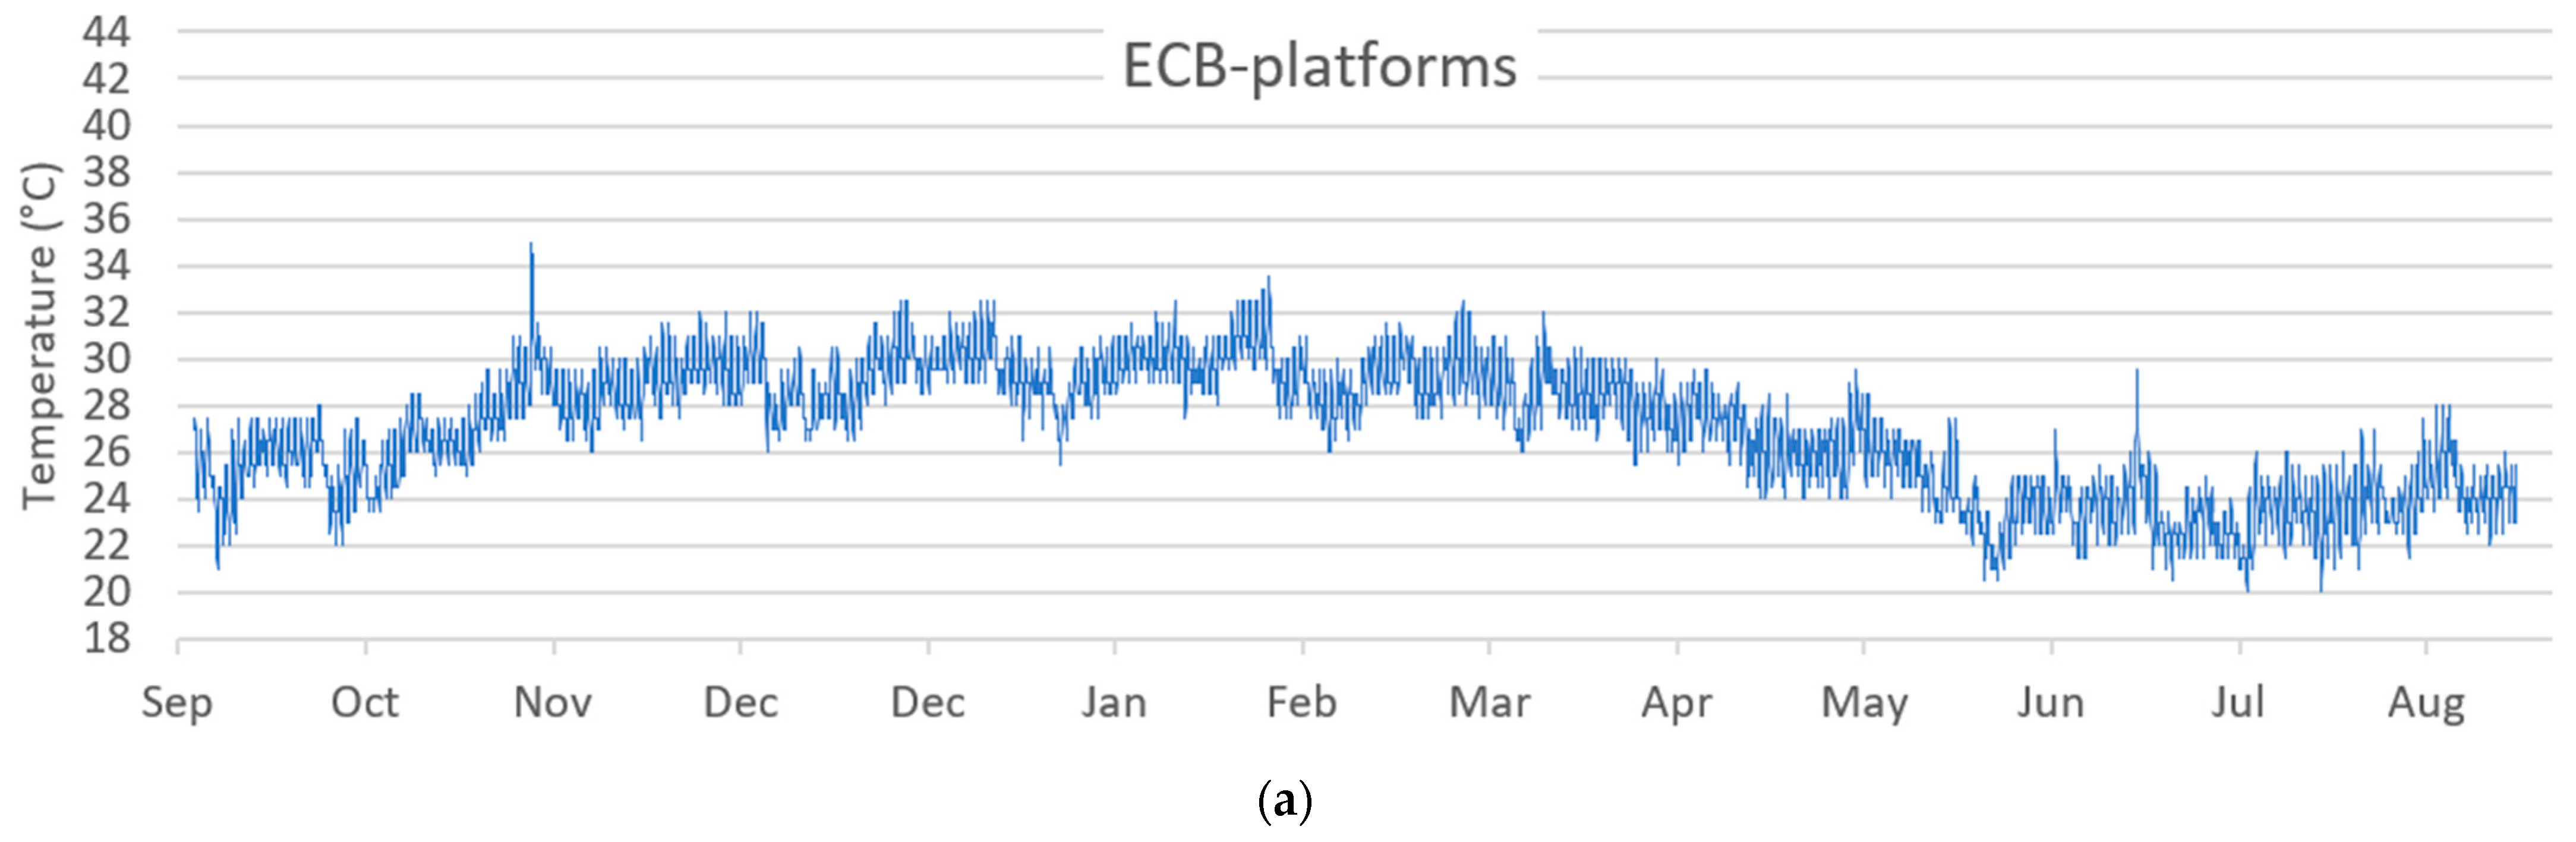
The results recorded from 4 September 2019 to 10 September 2020 show overall agreement with the general climate and weather information of Beira. The period that records the highest temperatures goes from November to March. From March to June, the temperatures decrease regularly, reaching minimum values in June and July. The overall trend can be observed clearly for the sensor located at the platforms, which provides a continuous reading of the temperature throughout the year (
Figure 17). For sensors 1 (
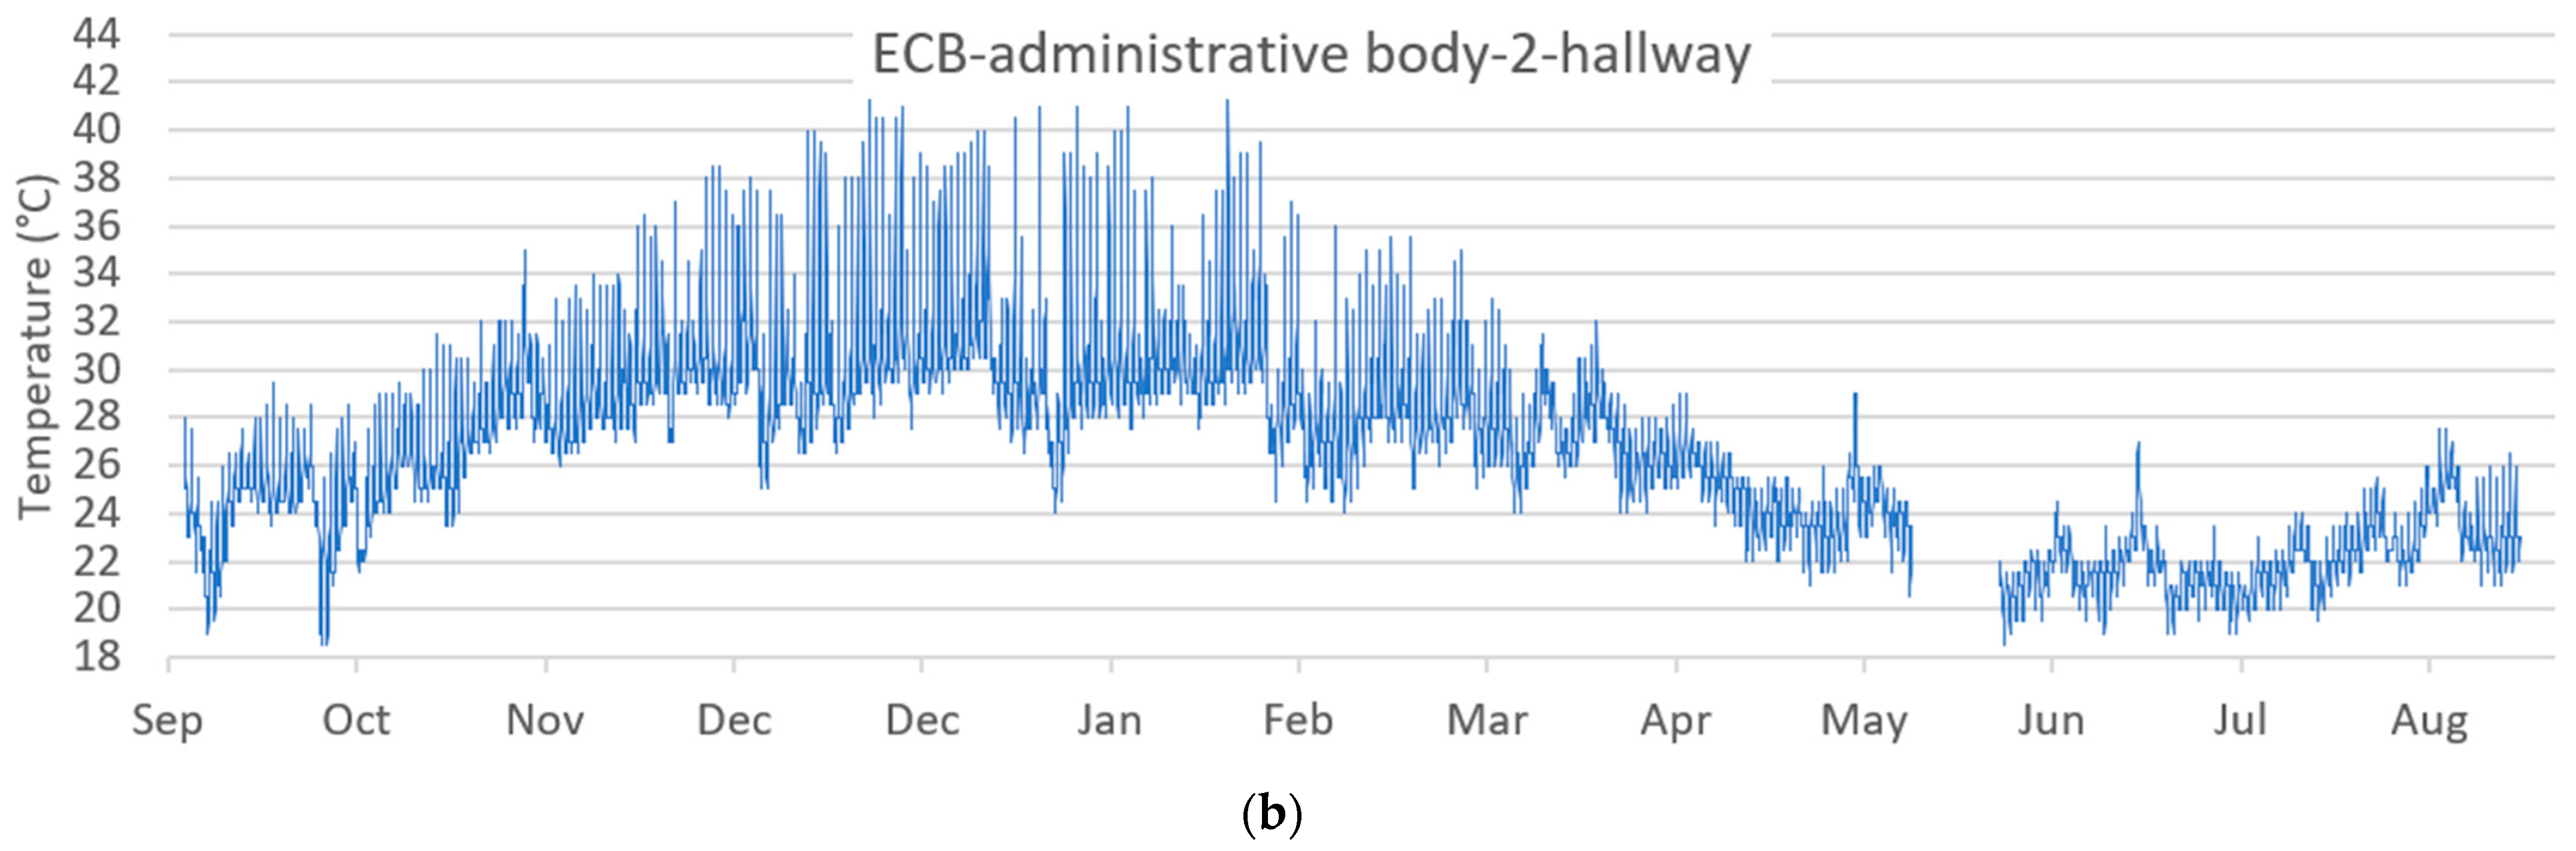
Figure 17a), 2, and 5 (located at the atrium, the platforms, and the interior of the administrative body, respectively), the daily variation of temperature throughout the year is regular, having a greater amplitude in the case of the platforms, which can be justified since this sensor is located in the exterior and is more subjected to the daily variations, while the other sensors are in interior spaces. The differences between maximum and minimum temperatures registered during the year are similar to the average ones. The average temperature varies from 18 °C in June to 32 °C in February, as registered by the sensor located on the exterior, in the platforms area. For the sensors located in the hallways of the administrative body, the daily variation of temperature is greater than 10 °C within a single day (
Figure 17b). However, the daily variation of temperature is not regular throughout the year, as it is for the other sensors. The results show that the greatest amplitudes occur during the months of highest temperatures, from December to February. Possibly, the location of the sensors adjacent to the glazed façade is responsible for the higher variations. Indeed, the months when the highest daily variations of temperature and humidity are recorded by the sensors of the hallway correspond to the months when that façade (southwest) is exposed to direct solar radiation for a longer time during the day. This is further explored in the solar study performed and explains why, for the other sensors, the daily amplitude of temperature is lower and more regular during the year.
Table 3 shows the monthly maximum values for the data recorded by the sensors. The maximum temperatures are registered by the sensors in the hallways of the administrative body, reaching 41.5 and 43.5 °C on the second and sixth floors, respectively. This happens in December, when, also, the greatest difference between the maximum values of the two sensors located on the sixth floor of the administrative building is registered. The sensor located in the office space records a maximum value of 31.5 °C and the sensor in the hallway records a value 12 °C higher at 43.5 °C.
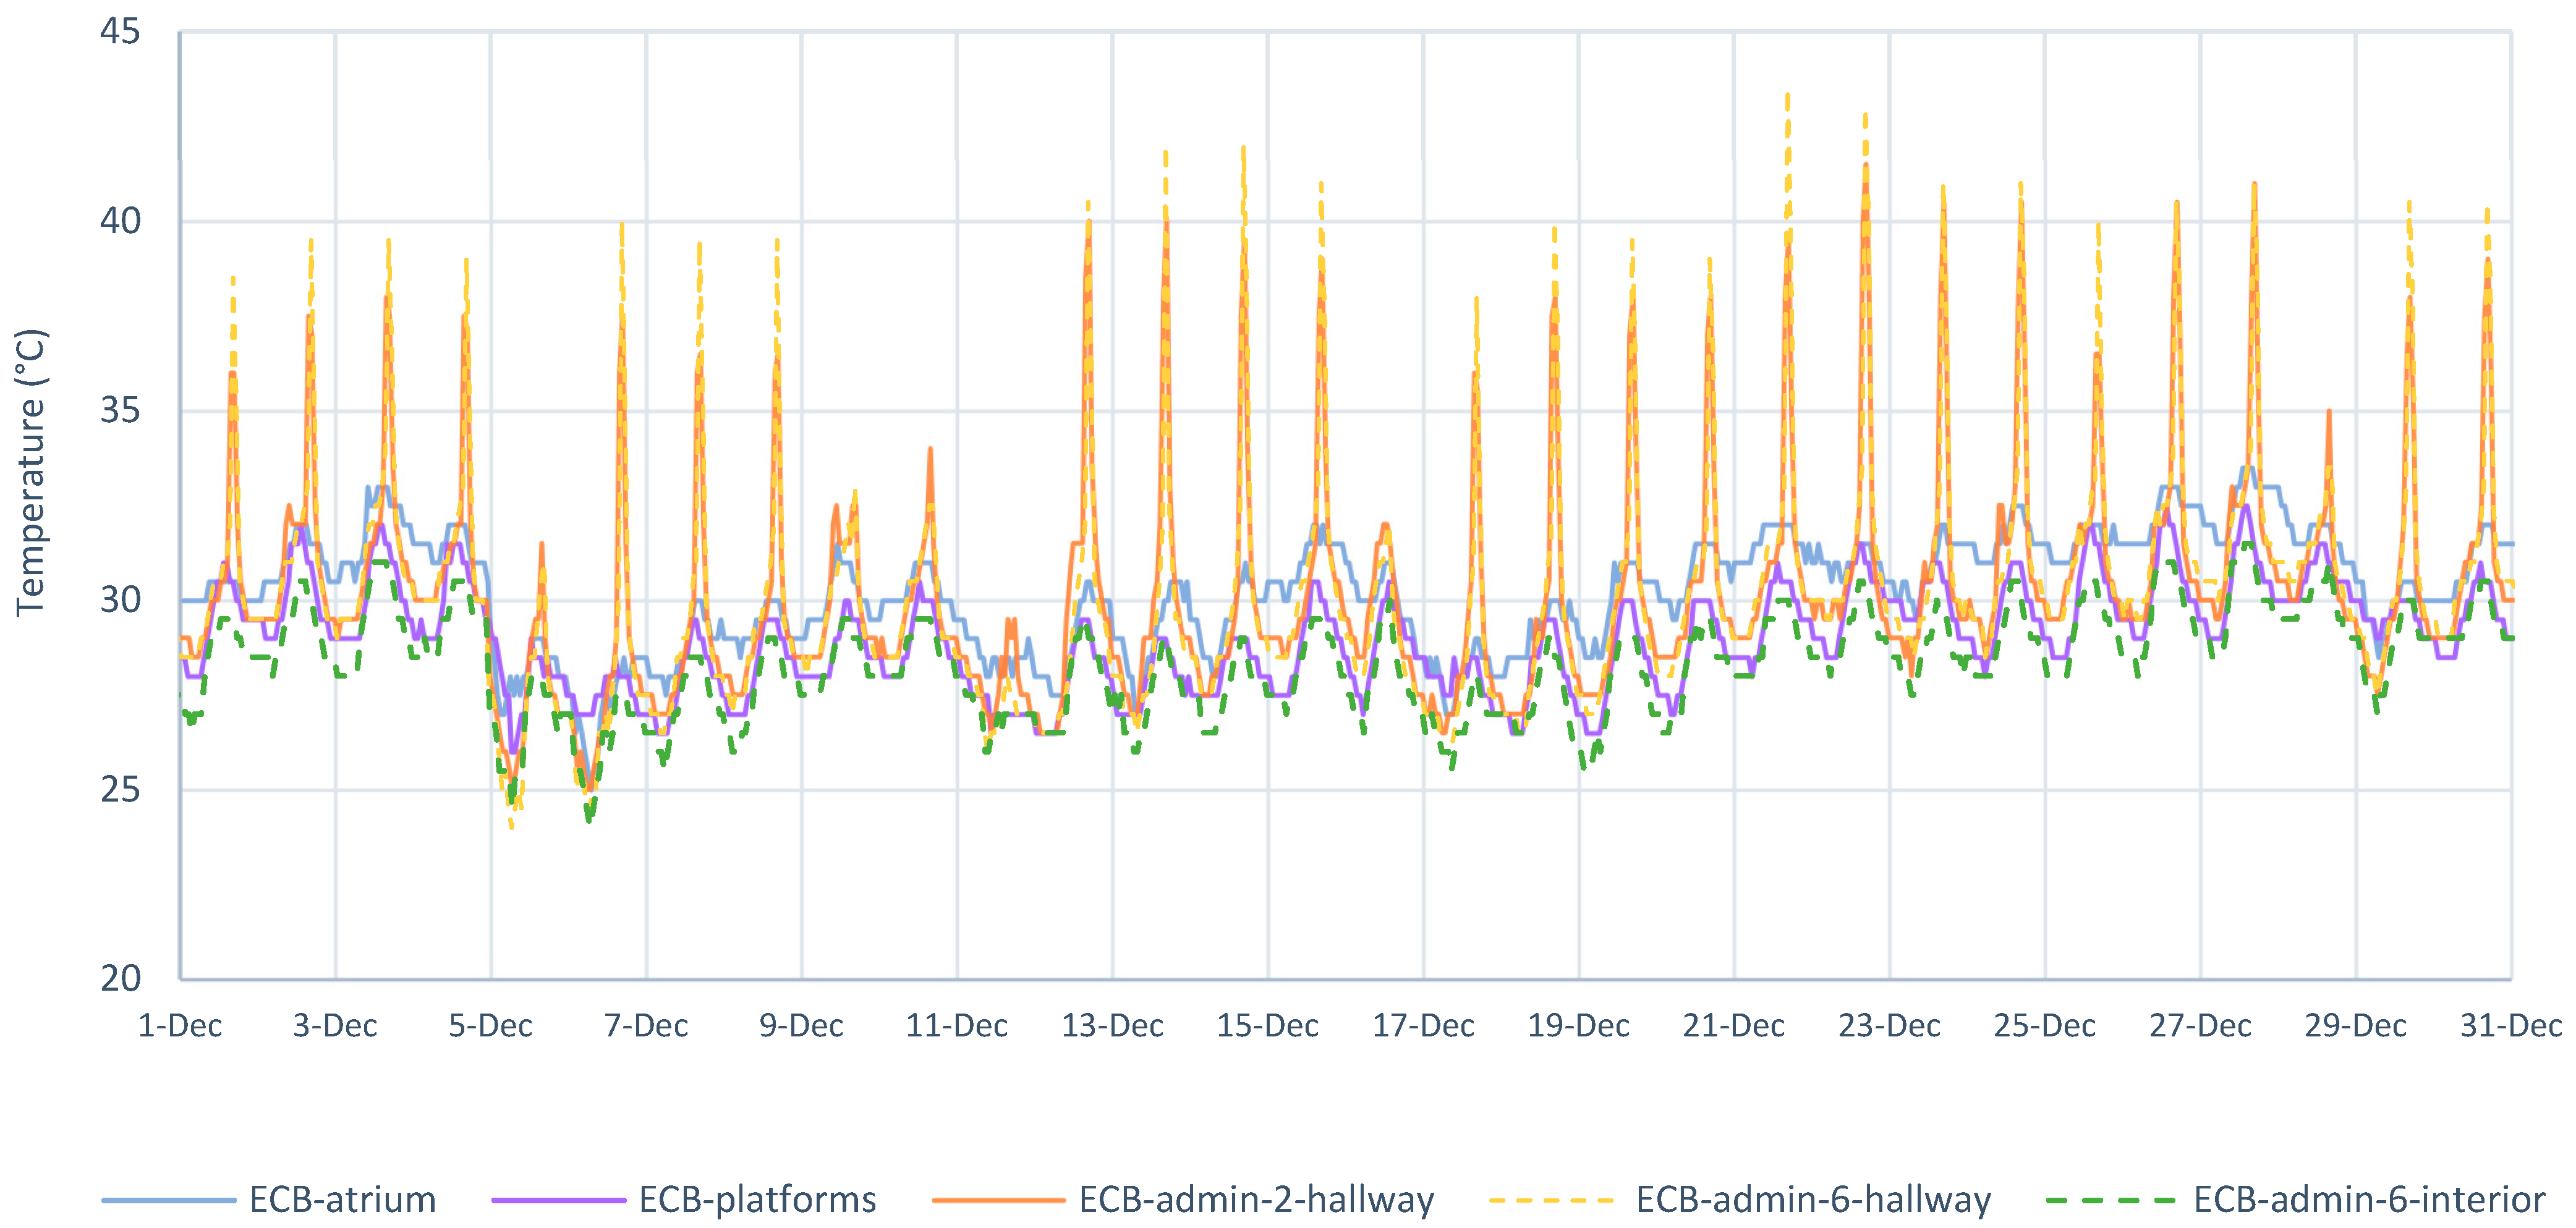
To better understand the thermal behavior in each area, a closer look at the temperature profile is shown in
Figure 18. December was analyzed since it presents the highest values of temperature and the highest differences between sensors. The two sensors close to the glazed façade reach maximum peaks of temperature 10 °C greater than the remaining ones. It is noted that these sensors are located in the shade. Thus, temperature variations can be greater in areas directly exposed to solar radiation. This is the case with the exterior masonry walls of the administration body, which show severe cracks in a random pattern. They are directly subjected to solar radiation and thus subjected to significant variations in temperature within a single day, likely over 20 °C. The thermal variations on the walls can, very likely, justify the widespread cracking observed, possibly combined with thermal shock in case of sudden intense rain.
The remaining three sensor locations show a more uniform temperature with maximum values typically exceeding 30 °C and daily variations of less than 5 °C. Thus, the temperature is generally too warm to guarantee thermal comfort conditions. The office on the sixth floor shows the lowest temperature values and the comfort conditions could be, possibly, improved by increasing ventilation (to reduce the possible greenhouse effect in the hallway) and air velocity.
Concerning the relative humidity measurements, a uniform pattern is registered during the whole cycle. An average value of 72% is registered by the sensor located on the exterior, in the platforms area. The humidity typically oscillated around this average value, between 60 and 80%, during the monitoring period. However, the sensors located in the hallways showed, again, more drastic variations in the humidity, showing minimum peaks below 30% at some specific times. These minimum values are coincidental in time with the maximum peaks of temperature, showing a significant gain in heat in the area close to the glazed façade at certain times of the day, around 16:00 (4:00 p.m.), and a subsequent loss of relative humidity.
5.3. Solar Analysis
A solar study has been conducted to understand how the sun affects the building and to identify the areas that receive solar radiation during the year, aiming to relate such information with the values of temperature and humidity obtained from the sensors. A three-dimensional model was created with the BIM methodology, which contains information about the location and the orientation. Considering this information, the software generates a pattern of shadows for each time and day of the year.
Firstly, the solar analysis allowed an understanding of how the sun interacts with the building and how it may have influenced its original design and construction solutions. The two longitudinal faces of the administrative building have different configurations, finishing materials, and shading systems.
Figure 19 shows the comparison between an original drawing of the project where the shadow of the building is included and one picture from the solar study for the day in which a similar shadow is generated. The shadows are not exactly the same, but both reflect a particular moment of the year when the southwest façade is exposed to the sun and the northeast façade remains in the shade. This is an extreme case that only takes place during the summer solstice and results in the most unfavorable conditions at the southwest façade. However, it may have led the architects to make decisions on the architectural solutions (e.g., the use of
brise-soleil fins to block direct sunlight exposure at the southwest façade).
Therefore, the main goal of the present analysis was to determine when the southwest main façade of the administrative body is directly exposed to solar radiation. The results can explain the variations and extreme values of temperature and humidity of the sensors located in the hallways.
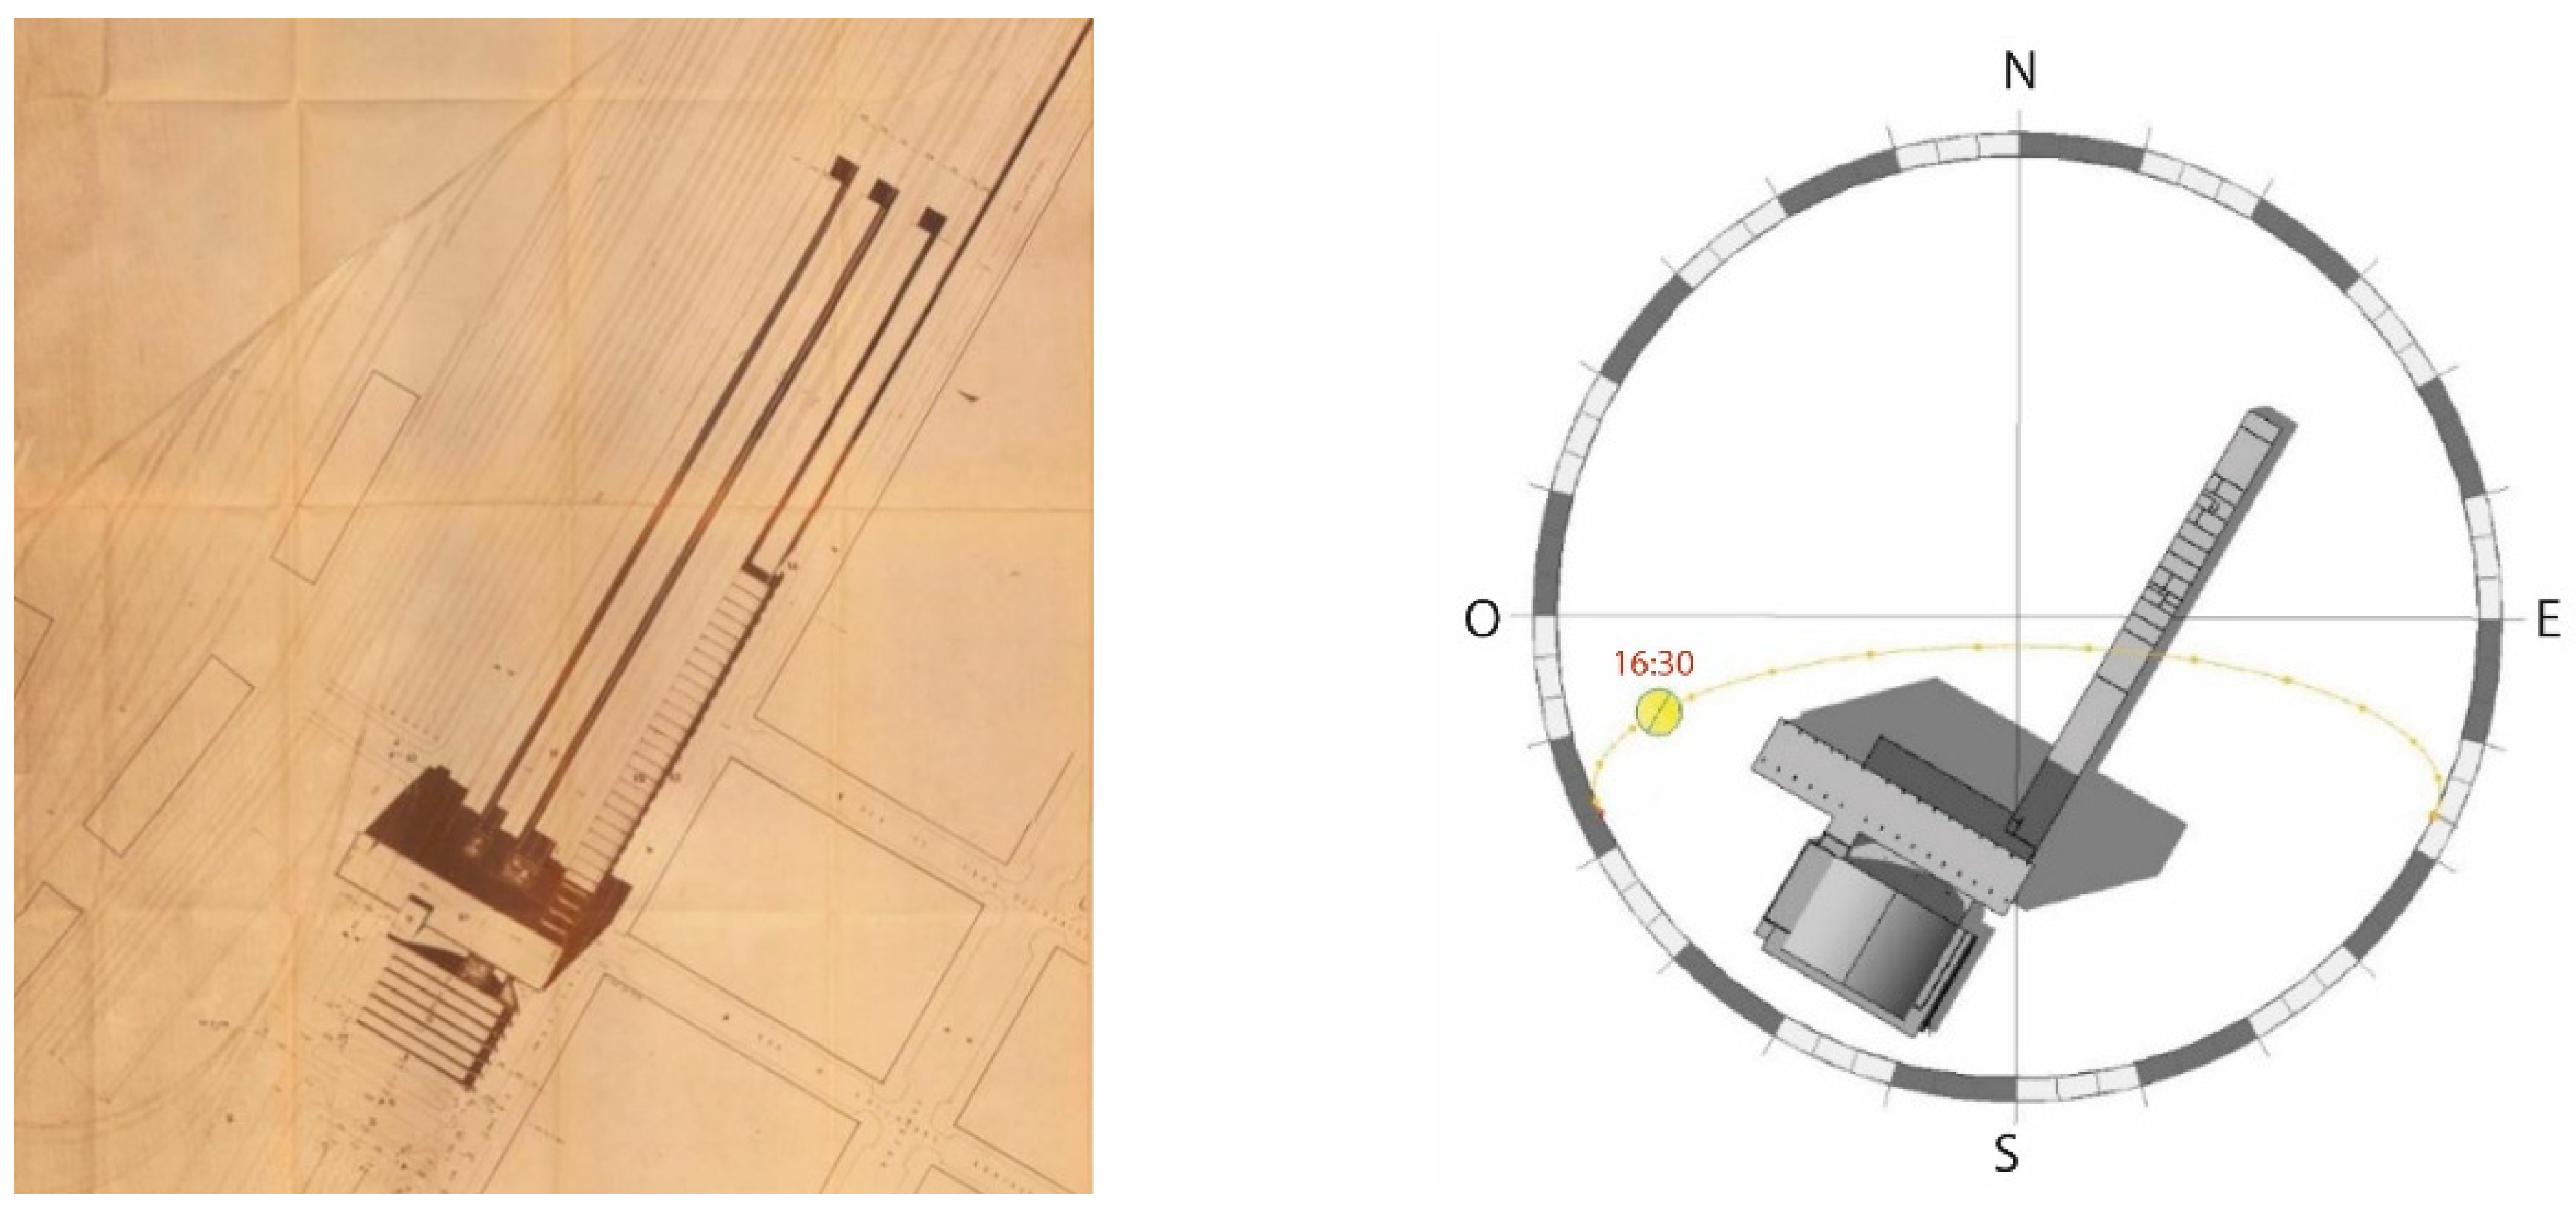
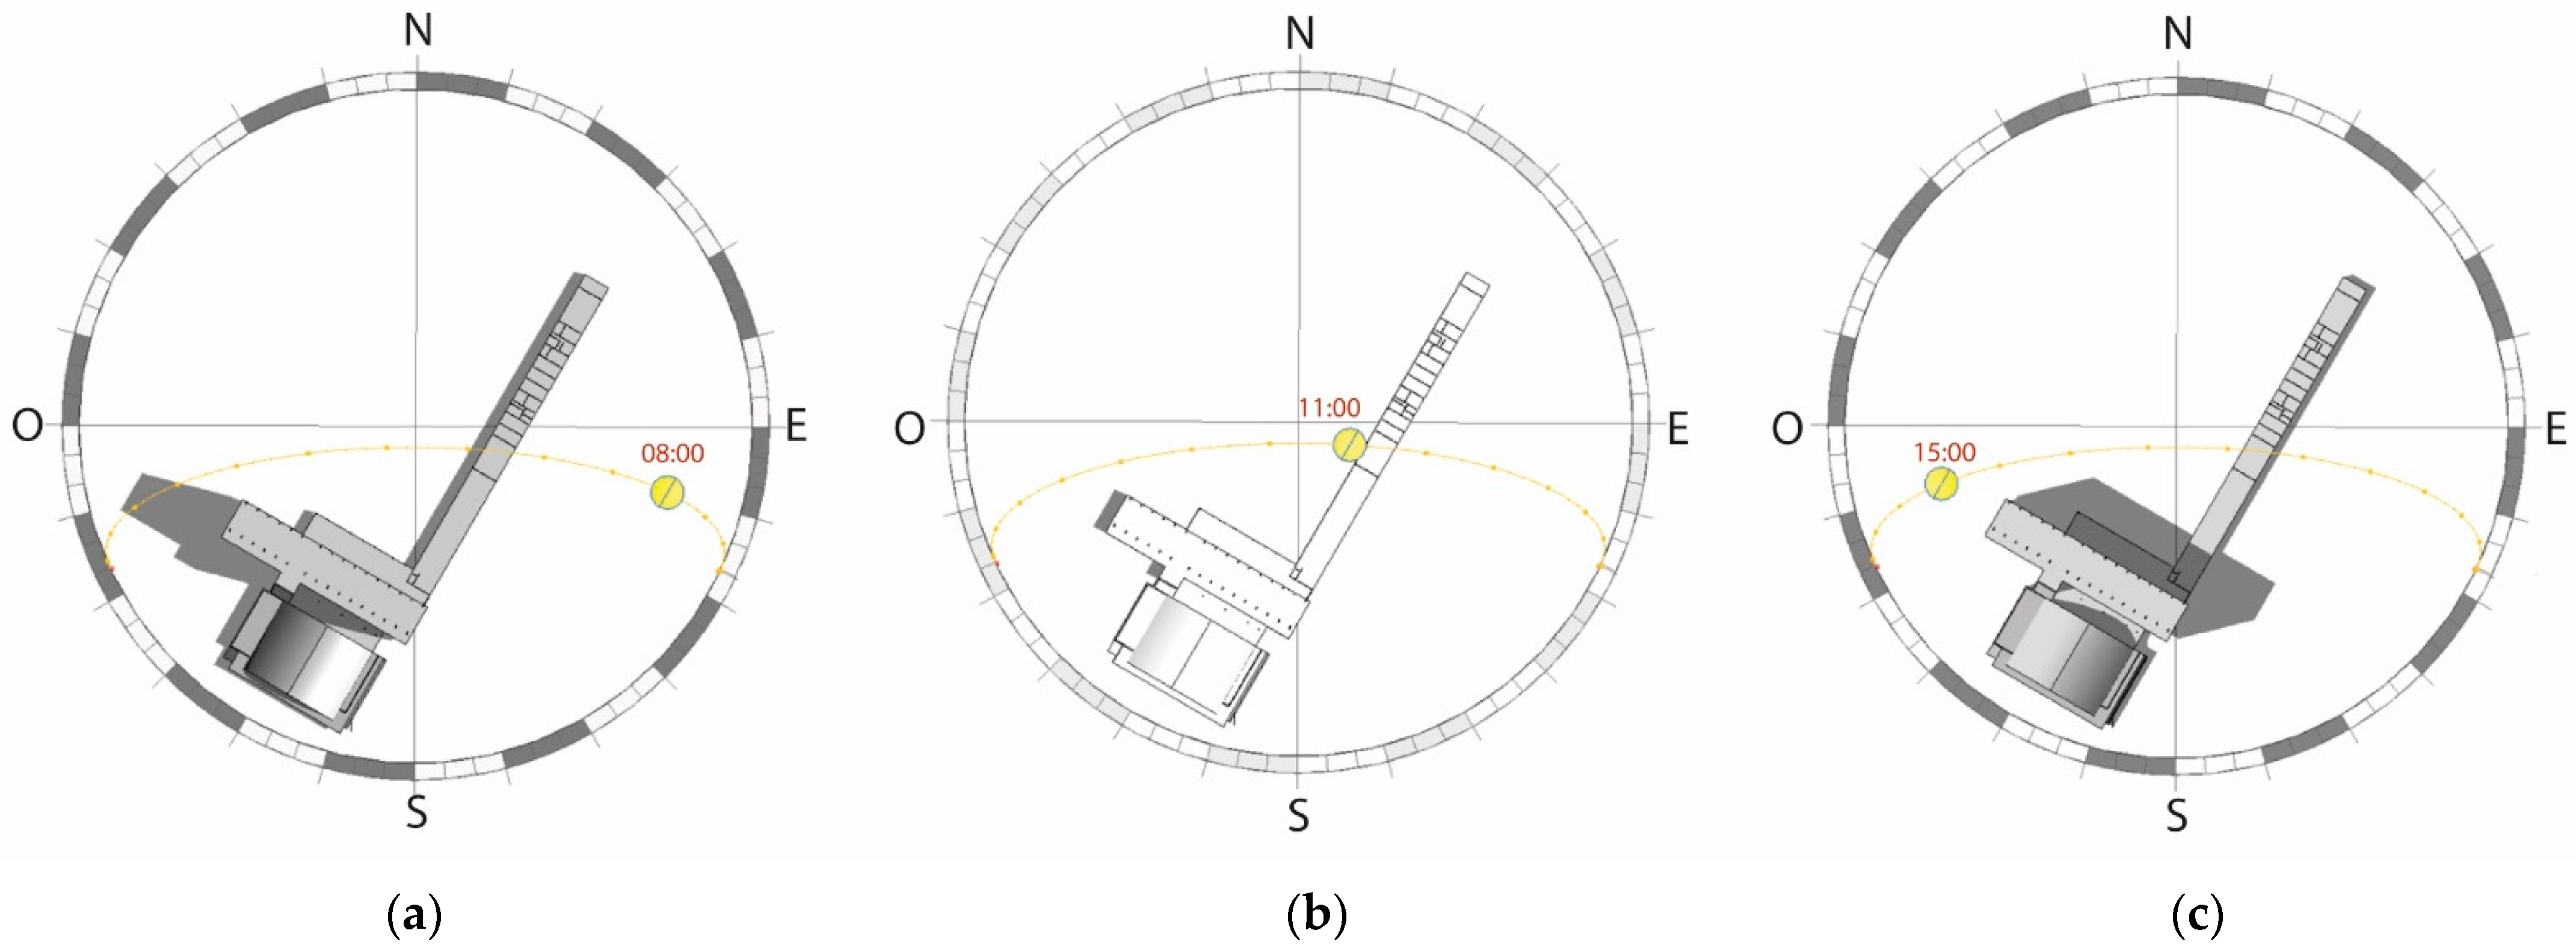
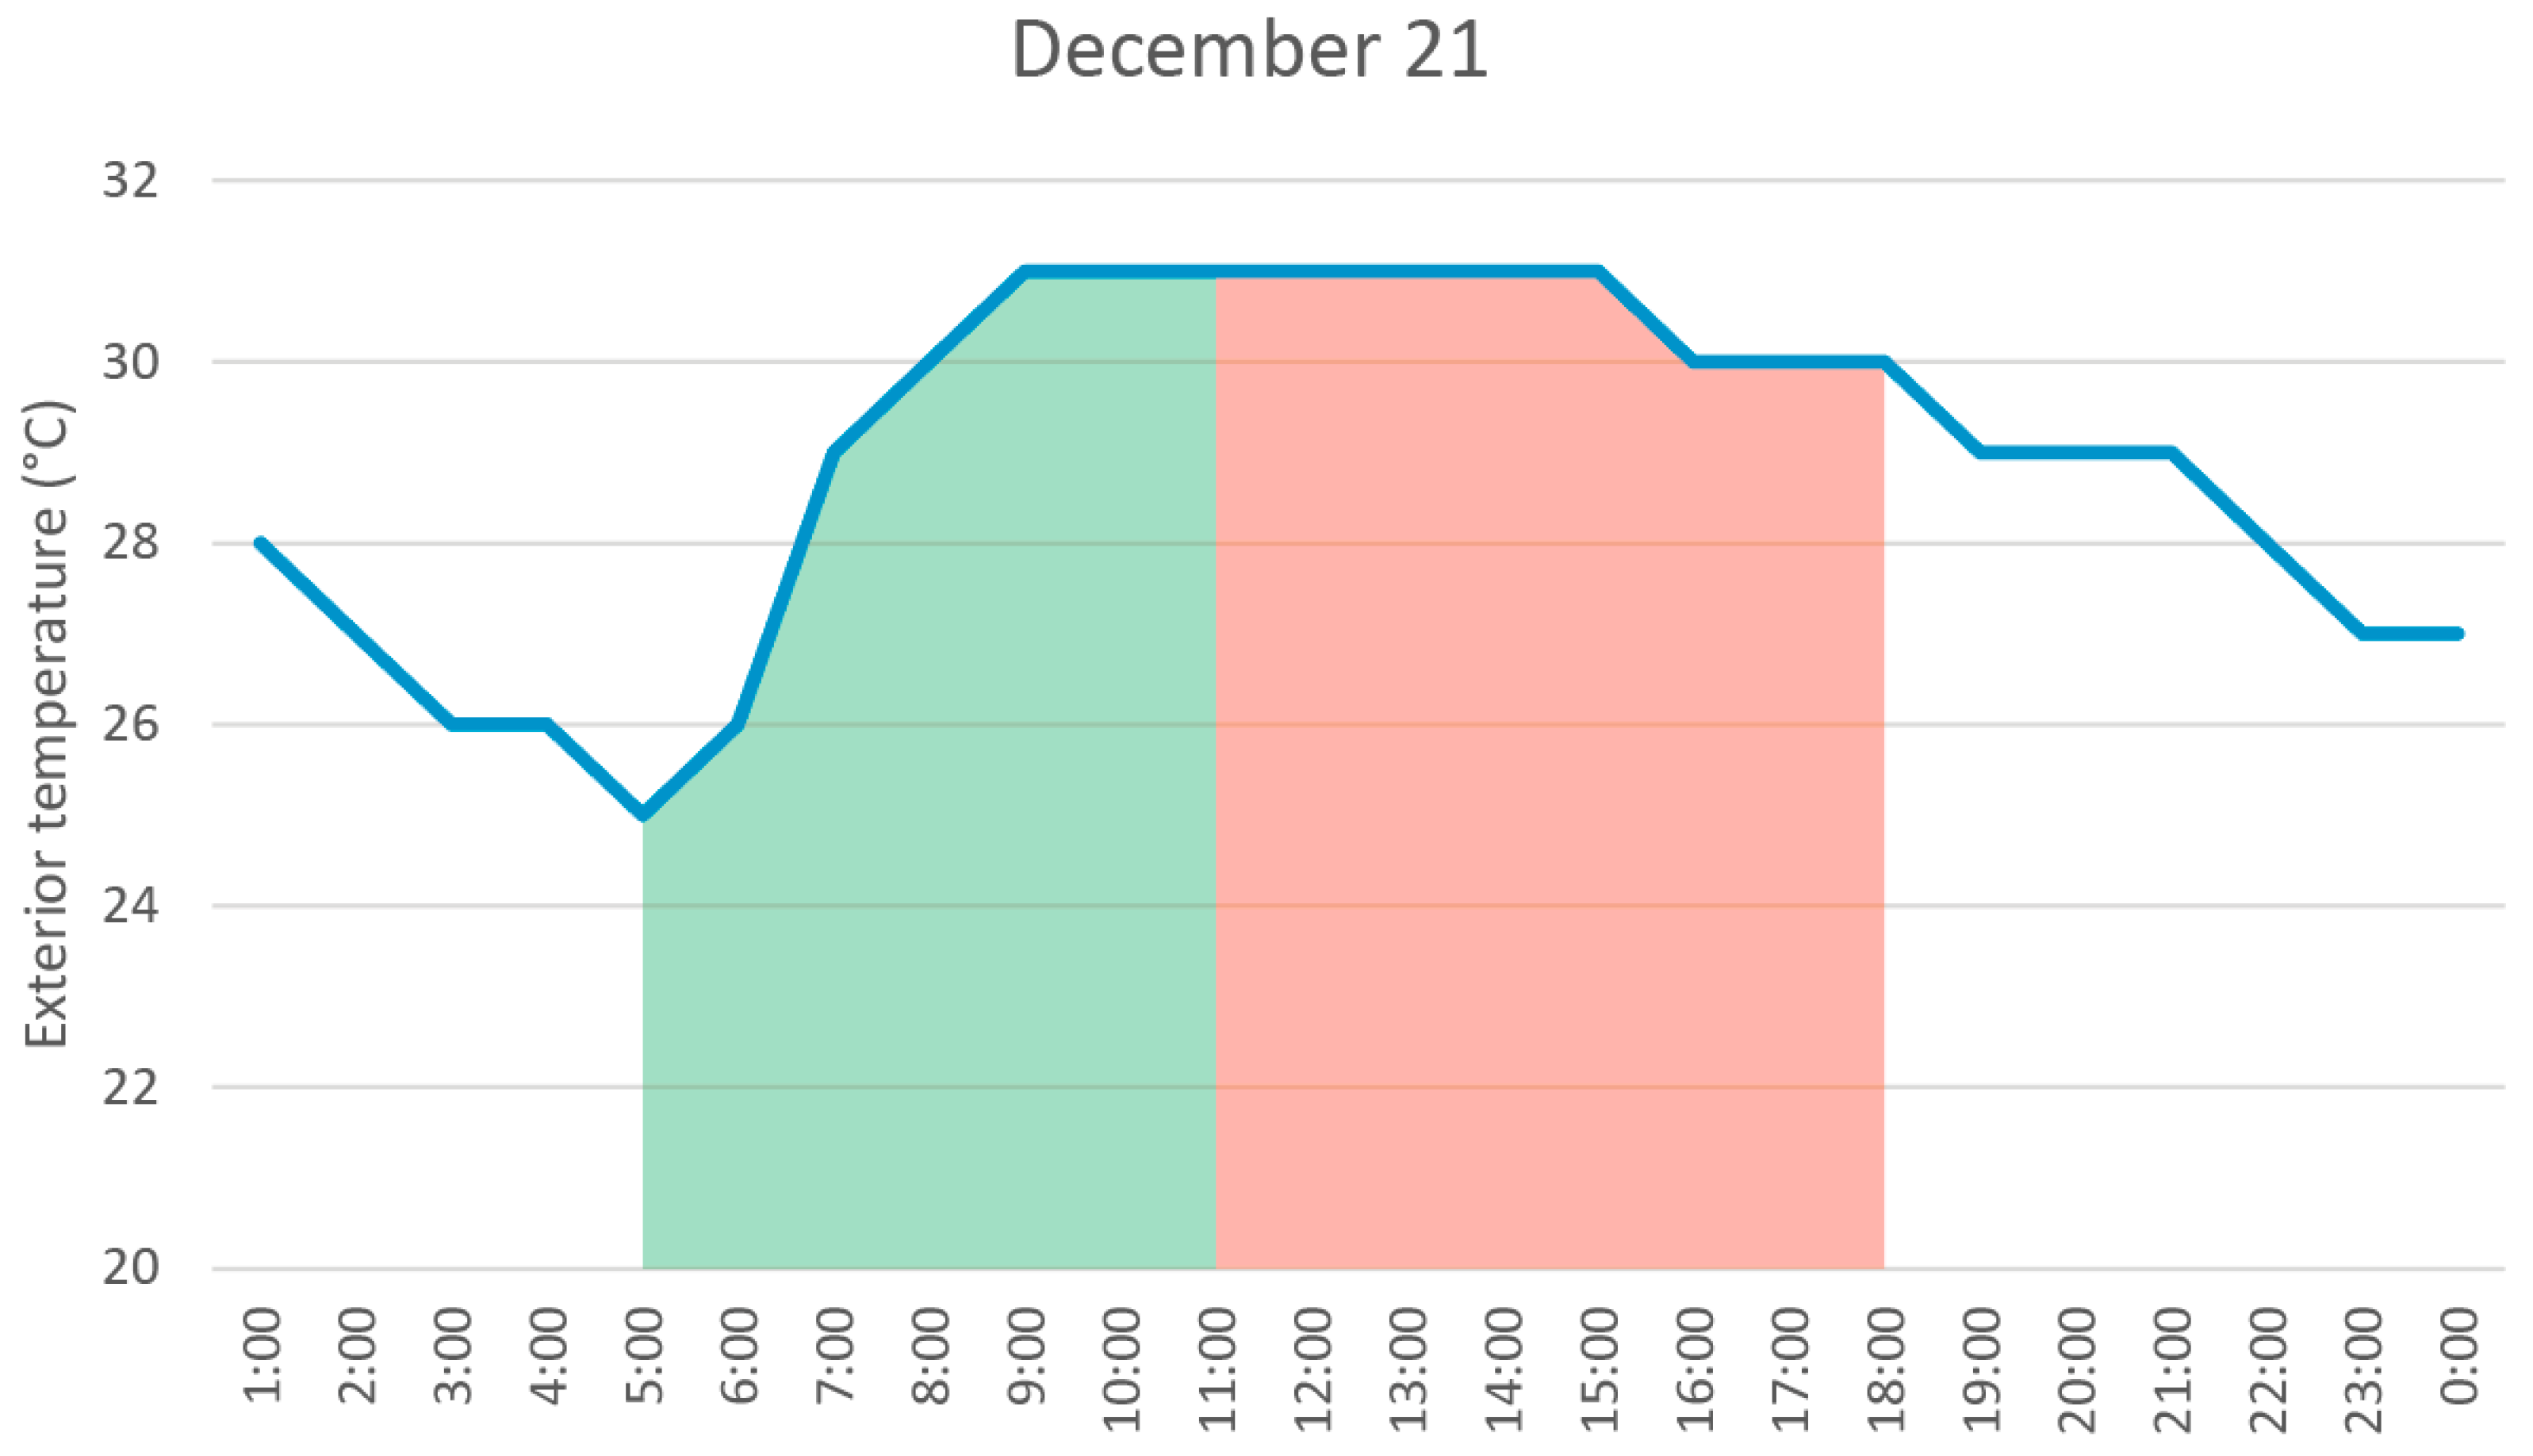
The variation in the length of a day in Beira throughout the year goes from the shortest day, 20 June, with 10 h and 56 min of daylight, to the longest day, 21 December, with 13 h and 20 min of daylight. This day corresponds to the day when the maximum value of temperature was registered by the temperature sensor in the sixth-floor hallway. From sunrise until 11:00, approximately (
Figure 20b), the northeast façade is exposed to the sun (
Figure 20a). From 11:00 until sunset, the southwest façade is exposed (
Figure 20c). The period of the exposure of each façade is presented in
Figure 21, together with the measured temperature of that day. The southwest façade is exposed for more hours during the period with higher temperatures. This period ranges from 11:00 to 18:00, which would justify that the maximum temperature values collected by the sensors are around 16:30.
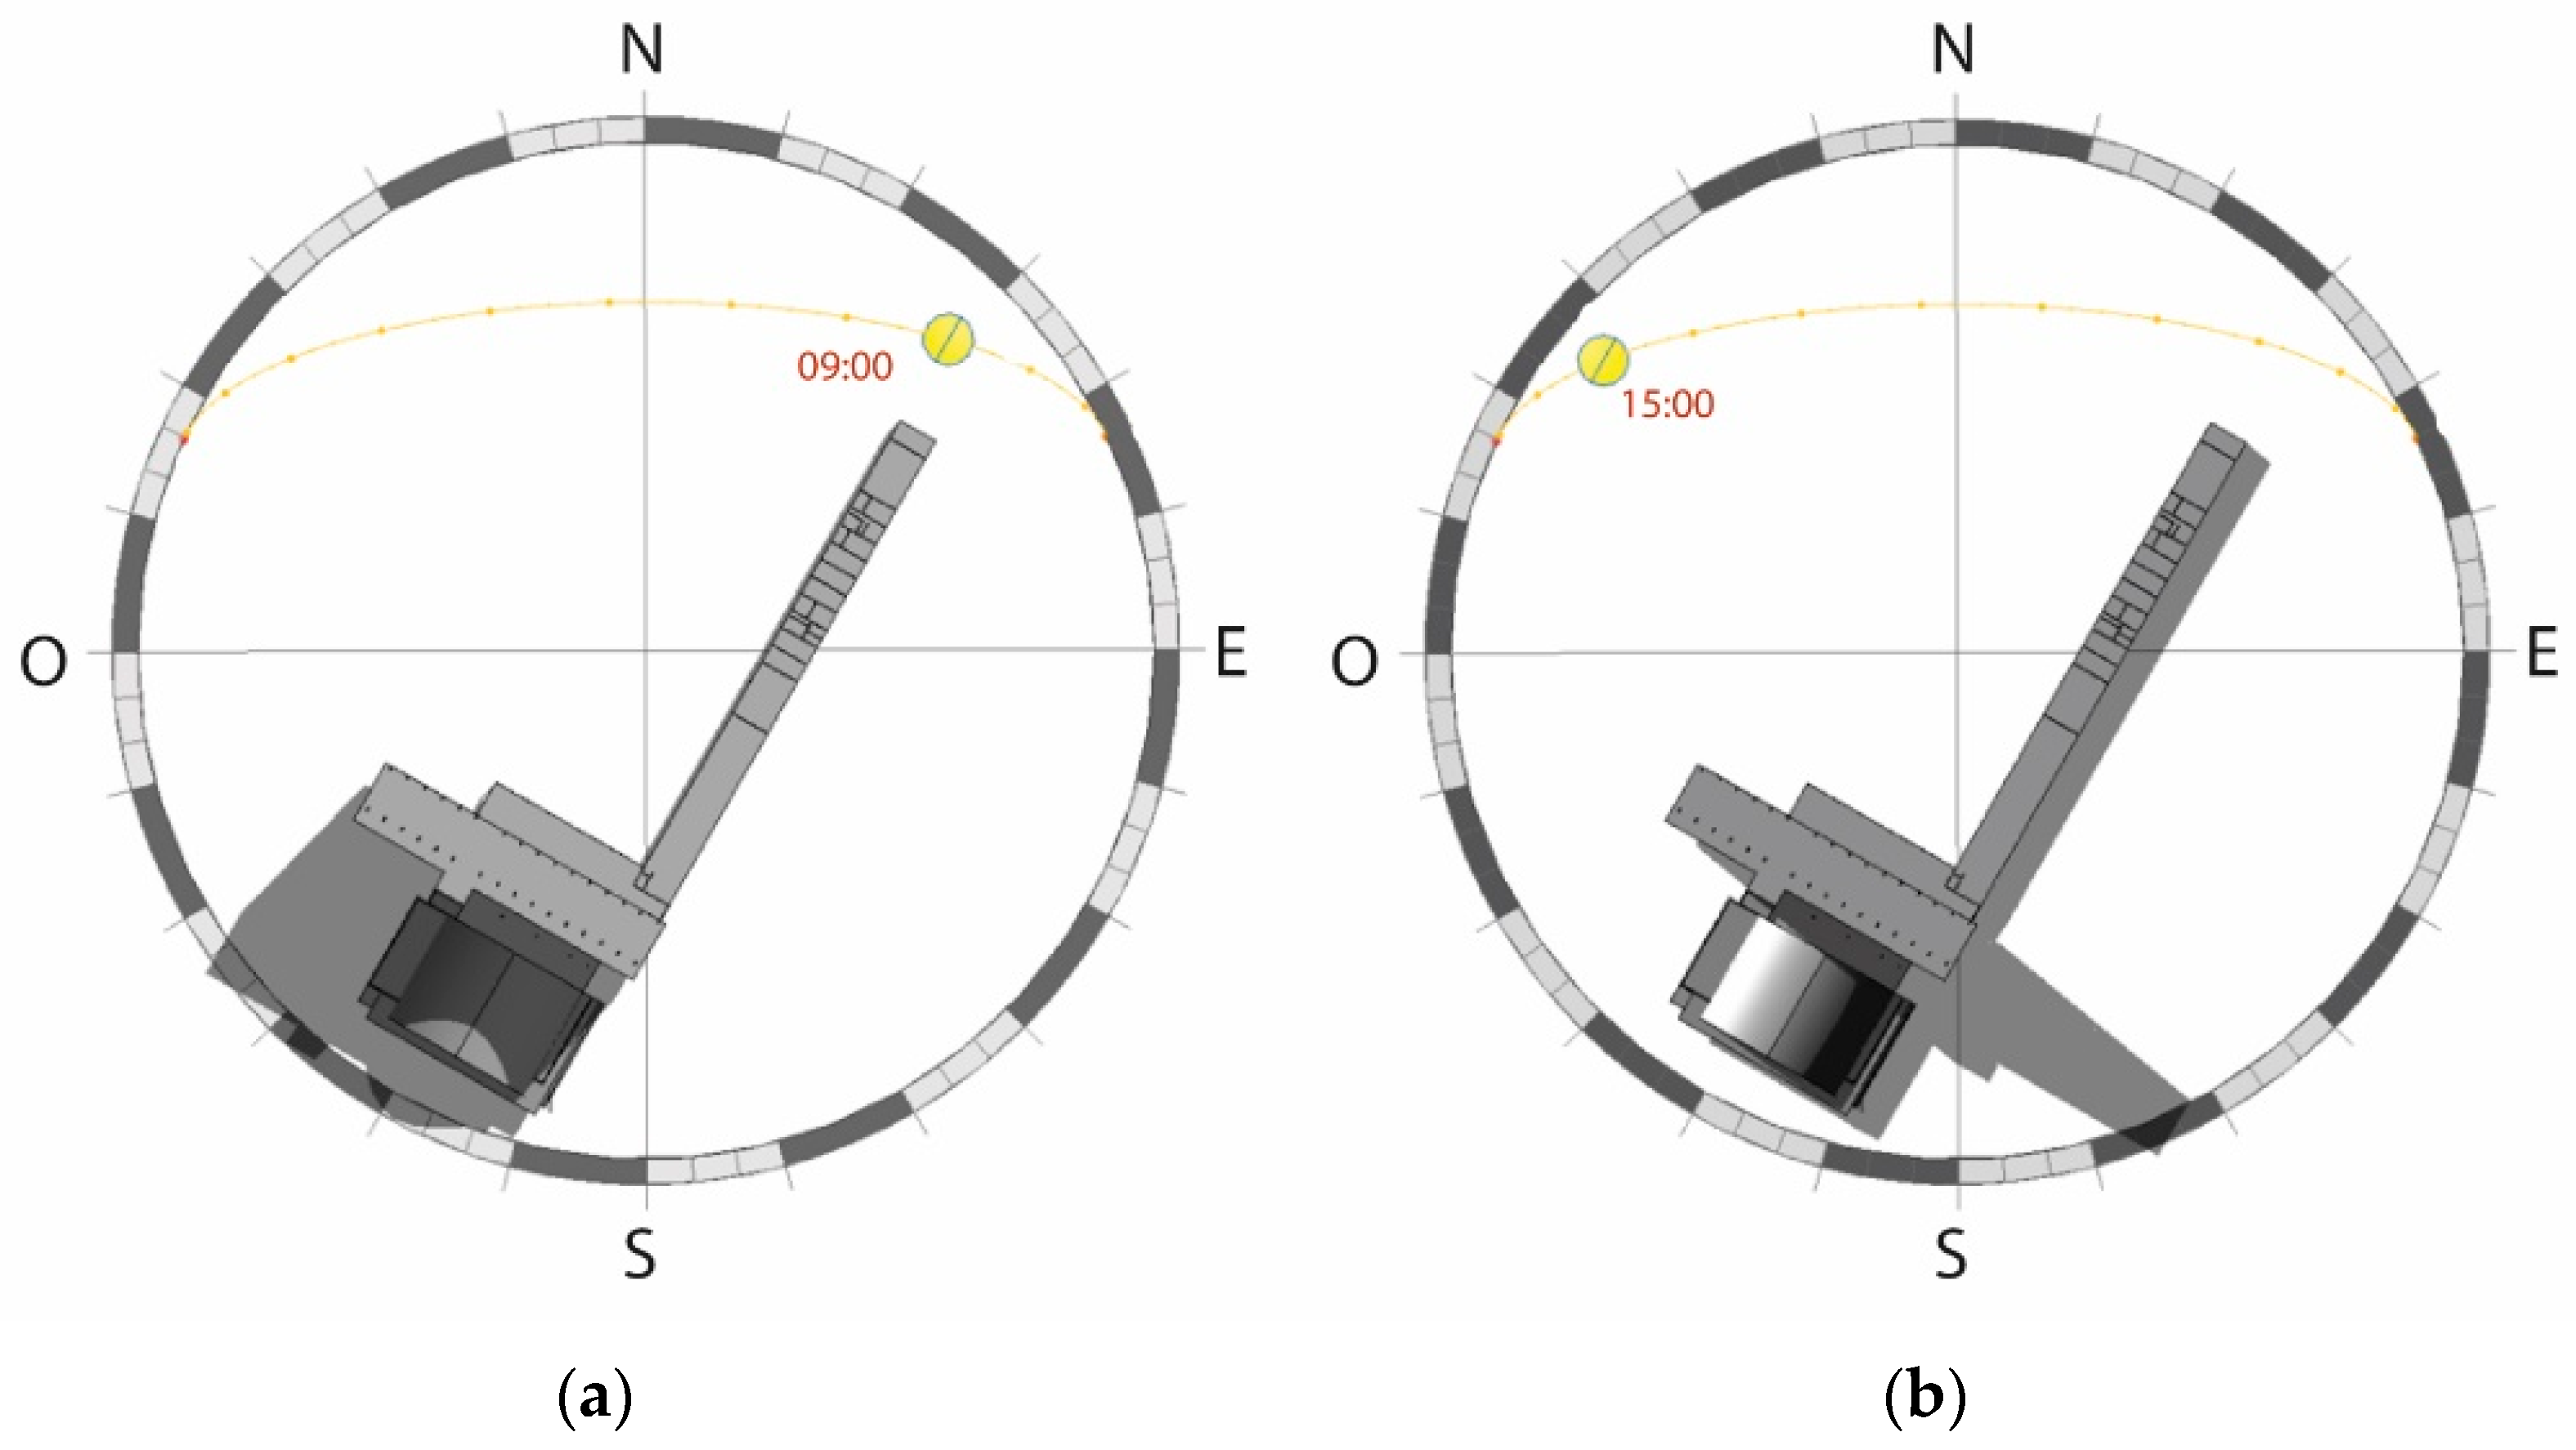
Figure 22 shows the shadows during the winter solstice (21 June) at 9:00 and 15:00. In this case, the southwest façade remains in the shade throughout the day, and the northeast façade is directly exposed to sunlight. However, this does not represent a problem for the spaces oriented to this façade, since the temperature for this period is the lowest of the year, with an average value of approximately 20 °C.
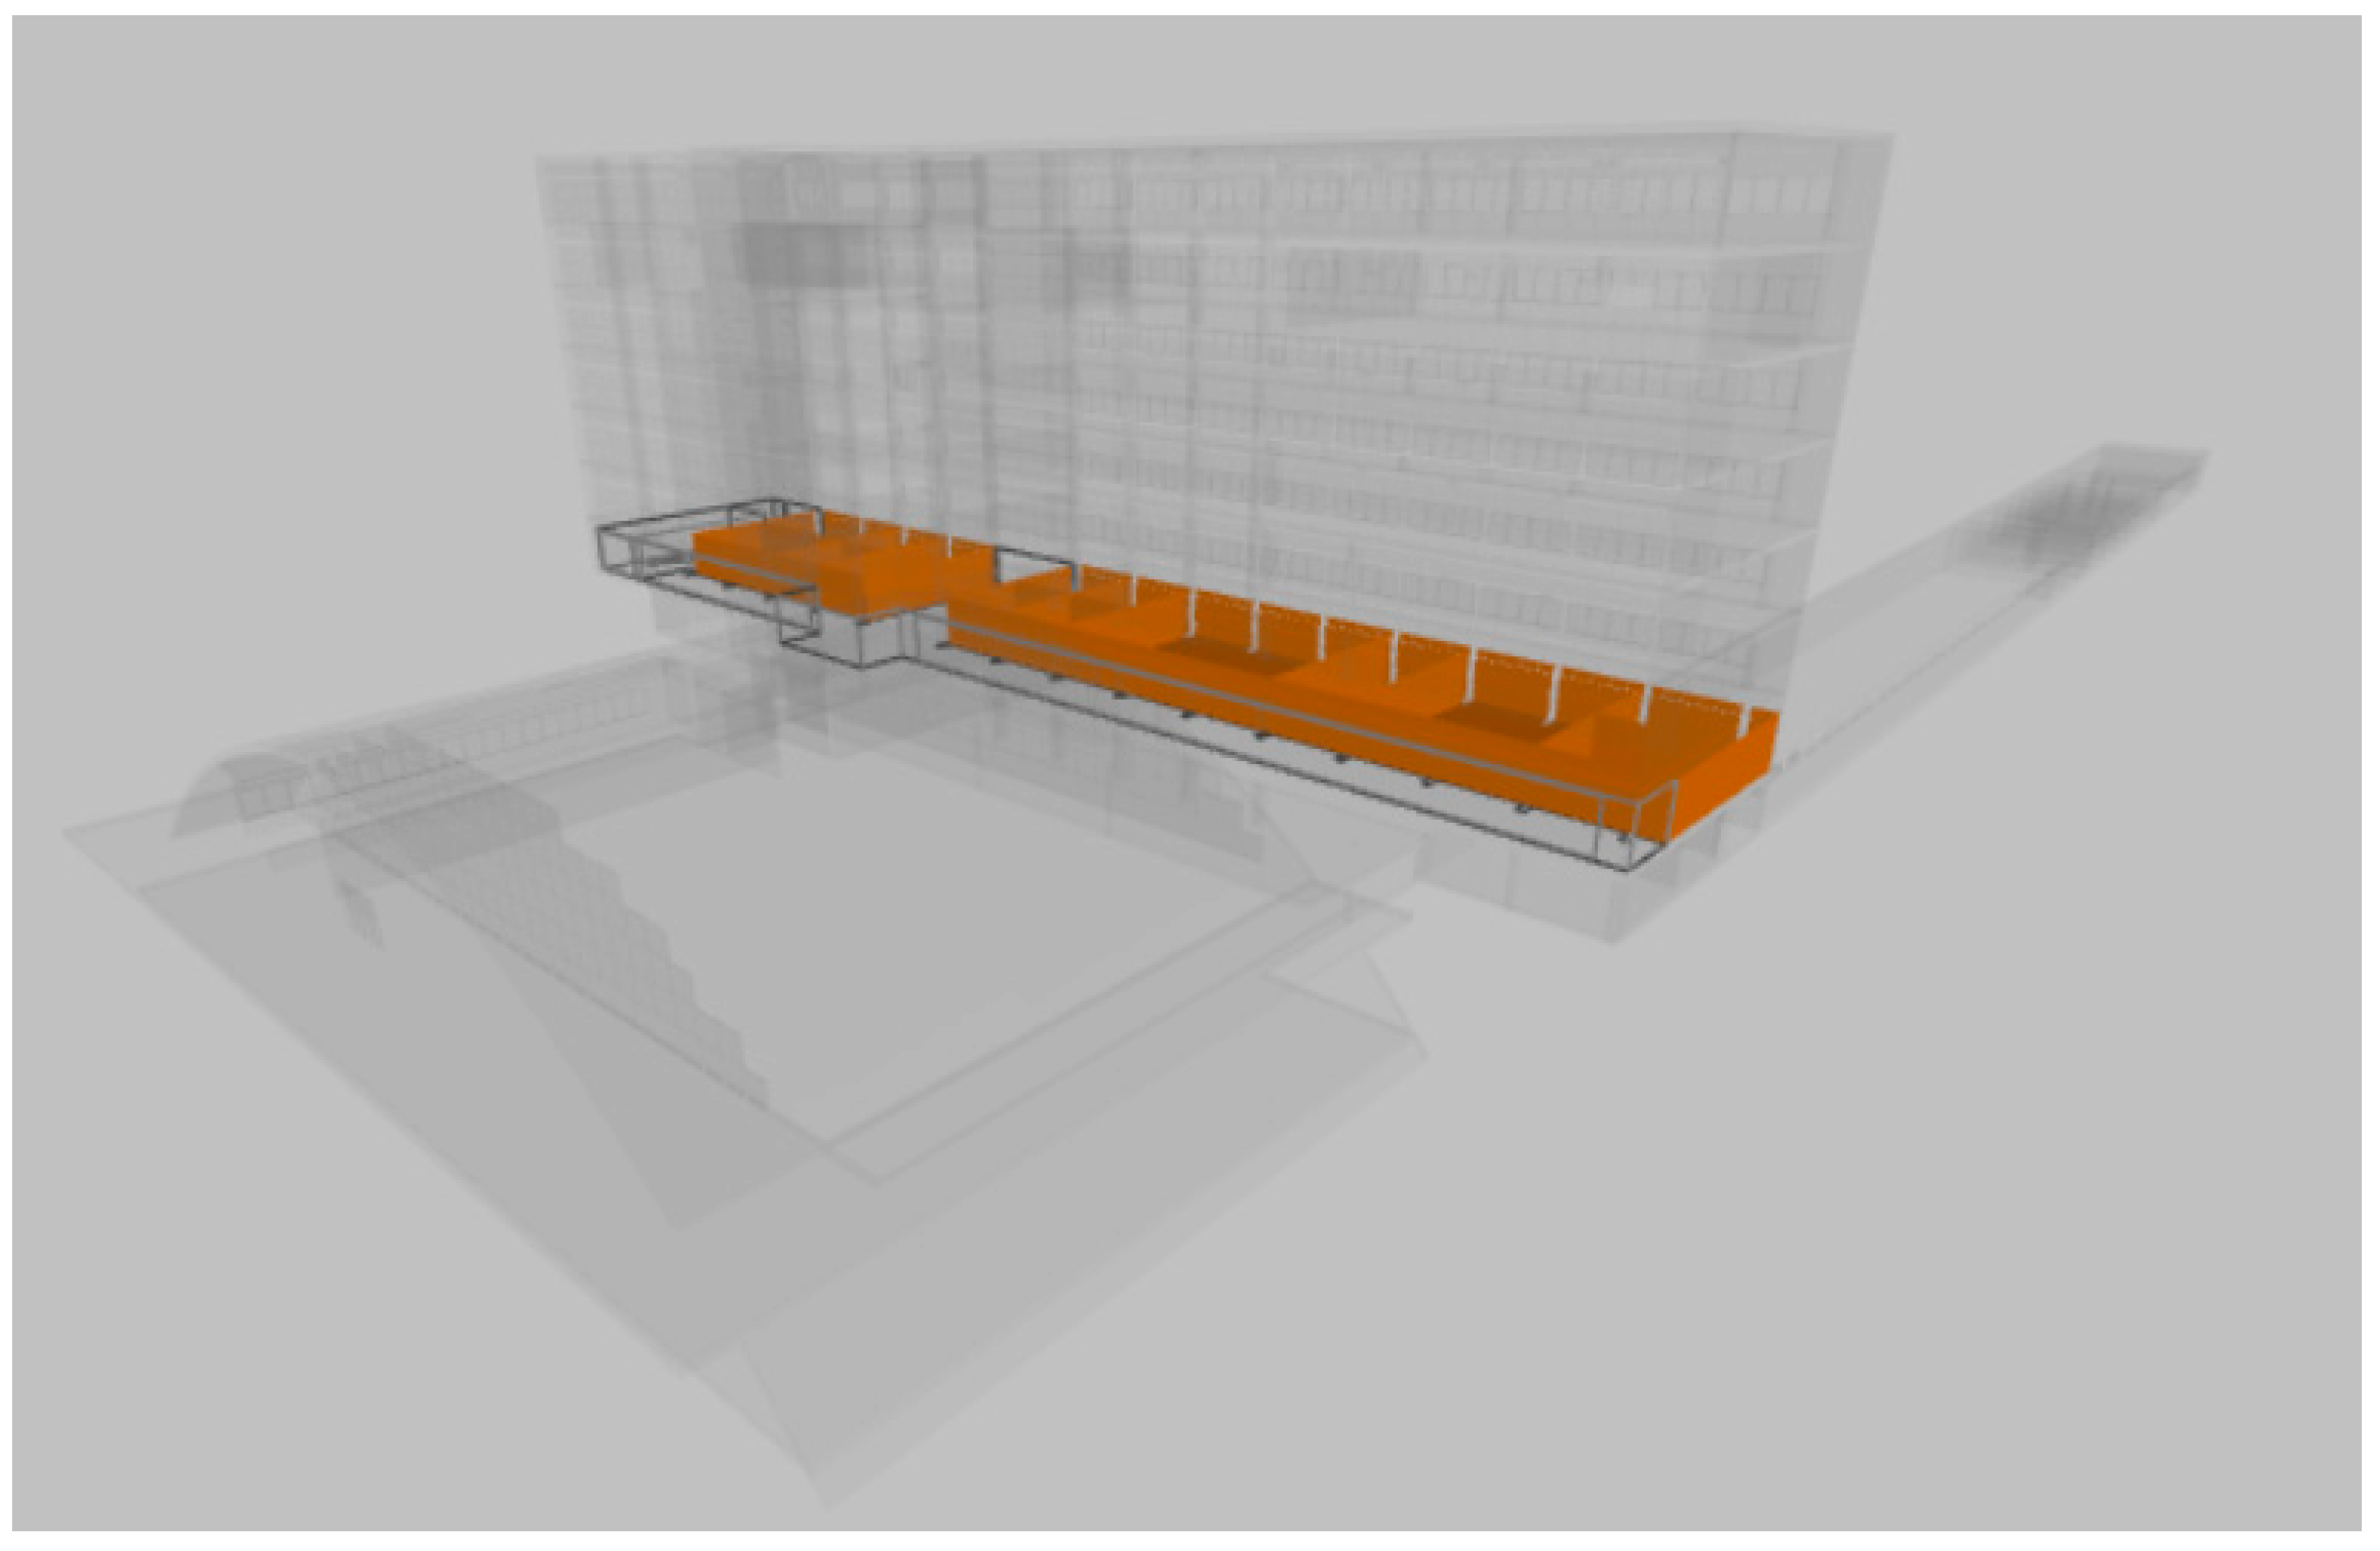
5.4. Comfort Conditions Simulation Model
Thermal comfort is a condition of the mind that expresses satisfaction with the thermal environment, and it can be assessed by objective and subjective evaluations [
36]. The internal comfort of the building depends on parameters related to materials and the use of the building. The objective of this analysis is to study the thermal comfort conditions of Beira Railway Station, as a naturally conditioned space (space where occupant-controlled openings primarily regulate the thermal conditions of the space).
For this purpose, the normative used is the ANSI/ASHRAE Standard 55-2020 [
36], which defines recommended values for variables such as ventilation, occupation, metabolic activity, lighting, and equipment for different uses and cases. In the case of the variables related to the definition of the building envelope, assumptions had to be made, since the exact definition of the construction elements is not precisely known. The model that was used for the solar study was also used for the comfort condition simulations (
Figure 23). The model not only includes information about the geometry but also includes information about the construction elements and uses. The model was exported directly to CYPETHERM EPlus, software that simulates buildings’ thermal conditions.
Once the geometry is included in the software, the next step is to define the climate conditions, namely the values for temperature, global solar radiation, and wind. This information is entered into the software with a weather file that is provided by EnergyPlus, which requires a specific format [
37]. Currently, weather data for more than 2100 locations across the world are available. However, there are just 55 locations available for Africa, 24 of them in Kenya. Since this file cannot be easily created due to the complex format and parameters necessary, it was preferable to use the file for a location with similar weather. The similarities are not only in terms of temperature per month but also in terms of solar irradiation, which limits the options to the places close to the Tropic of Capricorn. The data file from Madagascar was selected, namely from the city of Antananarivo.
The next step required the definition of the spaces to be studied, as well as their grouping according to zones and uses. The spaces that have more interest in this analysis are the spaces that have a more constant occupation and, thus, acceptable comfort conditions should be guaranteed. These spaces are mainly the offices of the administration body. However, the restaurant (i.e., eating spaces, excluding the kitchen), the cafeteria, and the bank in the atrium have also been included, as well as the hallways of the administration body, aiming to have information that can be compared with the data from the sensors. Each space type presents different values for the variables that have to be defined, such as the hours of use, occupation, ventilation, lighting, and equipment, which depend on the activity carried out inside.
Table 4 shows the adopted values, which have been defined based on the normative.
Finally, the properties of the building envelope are defined. Information about materials was obtained from the documents of the original project. In situ work was also necessary to take measurements and collect data about material finishes in each analyzed space. Detailed information about the construction elements is not available and assumptions were needed to define, for example, the walls as brick masonry, and the external wall layer definition was based on visual inspection.
5.4.1. Thermal Conditions
The results from the simulation of thermal conditions have to be compared with the acceptable thermal conditions. The limits of acceptable thermal conditions can be determined by the method included in the standard ASHRAE 55:2017,
Section 5.4., which is applicable for occupant-controlled, naturally conditioned spaces.
To apply this method, the following criteria must be met: (a) there is no mechanical cooling system installed; (b) no heating system is in operation; (c) metabolic rates range from 1.0 to 1.3 met (the metabolic rate, i.e., the human body heat or power production, of a relaxed seated person, is 1.0 met, or 58 W/m2); and (d) occupants are free to adapt their clothing to the indoor and/or outdoor thermal conditions within a range at least as wide as 0.5–1.0 clo (this measures clothing insulation, which has the same dimensions as the R-value used to describe insulation used in residential and commercial construction, 1.0 clo equals 0.155 K·m2·W−1. Typical insulation for trousers plus a long-sleeved shirt, long-sleeved sweater, or T-shirt is about 1.0 clo).
The methodology determines the allowable indoor operative temperatures from a graph provided in the normative, using the 80% acceptability limits. The main comfort problem in Beira is related to the maximum temperatures. Thus, the analysis focuses on how to guarantee a maximum temperature lower than the established limit. The maximum allowable indoor operative temperature values obtained for the climate conditions used for the analysis are included in
Table 5.
The results of the first analysis carried out are shown in
Table 6, indicating the monthly maximum values of temperature in each space considered for the analysis (a total of nine spaces were considered, belonging to the four different typologies shown in
Table 4). The maximum annual value for all the zones is similar, ranging from 29.4 to 32.9 °C. The maximum values are obtained for March and November, which are the months with higher outdoor mean temperatures (
Table 5). This is true for all the zones except for Z3 (hallway, floor 1) and Z4 (hallway, floor 6). For these two zones, the maximum values occur in December, which is consistent with the information collected by the sensors, justified by greater solar exposure of the southwest façade during this month. In general, the thermal conditions are not acceptable.
The values obtained from this analysis are not exactly equal to the data obtained from the sensors, but generally, variations lie within 10% (with the exception of October, which shows variations slightly higher but still lesser than 20%). Thus, the results are considered acceptable and the model is able to appropriately simulate reality. The pattern of values observed during the year can also be related easily to the values obtained from the sensors, as shown in
Table 7.
5.4.2. Sensitivity Analysis
In order to understand the model and how the variables affect the thermal conditions in the building, a sensitivity analysis was made by changing the values of variables related to the construction elements and the characterization of the spaces. The parameters that define the windows and the glazed façade have been modified, namely the heat transfer coefficient (U) and the solar heat gain coefficient (g). Moreover, the incorporation and subsequent modification of shading elements were considered. Regarding the definition of the spaces, the variables modified have been the occupation, the ventilation, and the thermal loads from the lighting and the equipment.
Firstly, an initial model is defined (M00), which represents the building without internal loads (occupation, ventilation, lighting, and equipment equal to 0) and with clear single glass in the windows with metal frames (U = 5.7 W/(m
2·K) and g = 0.8) [
36]. To show the results of the sensitivity analysis, two zones have been chosen, Z1 (offices, floor 1) and Z3 (hallway, floor 1).
Once the first model (M00) was defined and analyzed, several models were created, modifying one variable at a time to understand how that parameter influences the results. First, the variables related to the definition of the space were included one by one in models M01-M4. After that, the ventilation of M04 was doubled (M05) and the equipment went from medium to light (10.4 to 5.4 W/m
2) in M06. It is noted that this variation only affects Z1 since Z3 (hallways) does not have equipment. Then, the variables of the openings were modified, first taking M00 as a reference and then M04. The heat transfer coefficient was decreased from 5.7 (single glass) to 3.5 W/(m
2·K) (double glazing) [
36] and the solar heat gain coefficient was decreased to 0.2 [
38], which can be obtained with low-emissivity or solar control glass and with shading elements.
Table 8 shows a summary of the results. The maximum value of annual temperature is included, as well as the month when it occurs. The “T - T
Ref” column specifies the difference in maximum temperature with respect to the reference model indicated in the column “Variation”. For Z1, the maximum annual value is reached in March, except for the models with a lower solar heat gain coefficient (g). For Z3, the maximum value of temperature is reached in December, when this façade is exposed to solar radiation for more hours, except for the models with lower g, which occurs in November, which is the month with the highest exterior temperature (29.8 °C). In the last column of each zone, the values or the variation further stress the conclusions included in the previous paragraphs: (a) lighting and equipment have a significant negative influence; (b) when decreasing g, the maximum values of temperature can decrease significantly; (c) the variable U does not have an important role in the maximum temperature value.
5.4.3. Optimized Model
After the sensitivity analysis, an optimized model was created, modifying the variables to obtain a model that meets the comfort conditions defined in the standard ASHRAE 55:2017.
Table 9 and
Table 10 show (a) the values of the variables of the optimized model and (b) the values of the variables of the original model (in parentheses). Lighting is one of the values that has been modified more significantly. Artificial lighting was eliminated from the spaces that present large openings, as daylight should be sufficient to ensure adequate illumination levels in the working space during higher temperature hours. The use of artificial lighting in these spaces could be limited to the first and last hours of the day when natural light may not be enough and the temperature does not present maximum values. Artificial lighting could also be used if shading systems are included, which would decrease the thermal gains through the windows, as well as the amount of natural light.
Table 11 shows the maximum values of temperature obtained from the optimized model. The annual maximum temperature values now range from 27.9 to 28.7 °C. These maximum values are similar since the variables have been modified in order to not reach the maximum value (28.9 °C), trying to keep the modifications to a minimum with respect to the original model. In this case, the month that presents maximum temperatures is November, for most cases. It is noted that, by modifying the properties of the glass of the southwest façade, the direct solar radiation in December no longer has such a significant effect on the interior temperature in the hallways (Z3 and Z4). The month with higher temperatures has also changed for the offices of the administrative building (Z1 and Z2). For these spaces, the windows of the northeast façade and the lighting were modified.
Finally,
Table 12 shows the maximum allowable indoor operative temperature values based on the method of the standard ASHRAE 55:2017. These are compared to the values of zone Z1 (Offices floor 1) from the original and modified models. The difference in maximum temperature values between models is significant and the modification of the variables has allowed us to obtain the comfort conditions in those spaces.
6. Conclusions
This paper presented the works developed by the University of Minho in the Beira Central Station in Mozambique, an outstanding example of Portuguese 20th-century built heritage. The paper mainly focuses on the study of the current state of conservation of the building, namely damage and material characterization, as well as the comfort conditions. The assessment has aimed to better understand the building’s structural and thermal behavior, which is essential to inform decisions on retrofitting and conservation strategies, as part of the definition of a Conservation Management Plan (CMP) for the building.
In general, in terms of damage, after the extensive damage survey carried out, the following conclusions can be drawn:
The building condition is reasonable, despite the low level of maintenance of the building since construction and the impact of extreme natural events, namely cyclones.
Corrosion is widespread throughout the building, involving mostly non-structural elements, such as window frames, decorative metallic elements, air-conditioning supports, etc. The areas of the platforms and the command body also show visible corrosion on structural elements. Indeed, the concrete in these areas is left exposed and was found to be carbonated.
Reinforced concrete cracking and spalling is present but the severity is moderate and allows repair actions.
The chloride and sulfate content tests show low levels in all locations, below common thresholds.
The concrete characterization testing campaign included on-site and laboratory work. Despite the limited amount of data collected, the following conclusions could be drawn:
The adopted concrete seems of quality comparable to the regular concrete of today.
UPV tests showed overall uniform values for all structural elements and the velocity obtained can be associated with non-deteriorated elements of overall good quality.
The UPV results are supported by the RH tests, which also show high values and low variation among the locations tested, indicating an overall hard external layer of concrete.
The compressive strength tests carried out at the laboratory confirmed that the main structural elements of the administration body (beams and columns) present an appropriate compressive strength. Lower values were observed on the roof and platforms, where the elements are left exposed to the weather.
Regarding the state of conservation in terms of authenticity, several detrimental interventions were observed, including mostly the installation of new air-conditioning units, the inadequate renovation of toilets, new shopfronts in the atrium, the hanging of advertisement signs, and the sub-compartmentation and opening of new doors in the partition walls between the hallway and offices of the administration body.
The study performed for the comfort condition assessment shows that most of the spaces of the railway station have a mechanical cooling system since the high temperatures in summer (December to February) do not allow comfort conditions in naturally controlled spaces. The analysis resulted in the proposal of three main recommendations to improve the energy efficiency and the thermal comfort of the users, which include actions that can be easily implemented, as well as recovering some passive thermal control strategies already implemented in the building at the time of construction. Even if the limitations of the analysis are taken into account, such as the lack of specific information about the definition of the construction elements or the limited number of sensors placed during the monitoring campaign, the recommendations address significant problems by implementing easy tasks and do not suppose a great investment. The concluded recommendations are:
To reduce the use of artificial light when natural lighting use is possible. The analyses show how heat loads due to artificial lighting significantly affect thermal conditions.
To naturally ventilate the spaces by opening the windows or doors when the indoor temperatures are higher than the outdoor temperatures during some hours of the day. Night cooling (opening the windows and internal doors to allow cross ventilation) and the thermal mass of the building could also contribute to reducing indoor temperatures.
To use the shading system of the façade properly, which involves the repair and substitution of the missing pieces. The shades should be oriented in a way that they protect the hallways from direct solar radiation, mainly in summer during the afternoon. Someone responsible for operating the system in the summer months would be required. This recommendation is based on the high temperatures recorded by the sensors in the hallways of the administrative body, mainly during December, and the need to decrease the solar heat gain coefficient of the openings.
In summary, the assessment performed provides key information for the definition of a conservation strategy that guarantees the proper maintenance of the material, stops ongoing deterioration phenomena, and improves the energy efficiency and comfort conditions in the building. Such conclusions will support the definition of the CMP for Beira Central Station, which will provide specific conservation policies to guide the long-term management of this historic landmark in Mozambique.


