Article

Python-LMDI: A Tool for Index Decomposition Analysis of Building Carbon Emissions

1
School of Management Science and Real Estate, Chongqing University, Chongqing 400045, China
2
School of Science, Southwest University of Science and Technology, Mianyang 621010, China
3
School of Architecture and Urban Planning, Chongqing University, Chongqing 400045, China
4
Key Laboratory of New Technology for Construction of Cities in Mountain Area, Ministry of Education, Chongqing University, Chongqing 400045, China
5
Department of Earth System Science, Tsinghua University, Beijing 100084, China
*
Authors to whom correspondence should be addressed.
Buildings 2022, 12(1), 83; https://doi.org/10.3390/buildings12010083
Submission received: 16 December 2021 / Revised: 8 January 2022 / Accepted: 12 January 2022 / Published: 17 January 2022

Abstract

:
A timely analysis for carbon emission reduction in buildings is an effective global response to the crisis of climate change. The logarithmic mean Divisia index (LMDI) decomposition analysis approach has been extensively used to assess the carbon emission reduction potential of the buildings sector. In order to simplify the calculation process and to expand its application scope, a new open-source Python tool (PyLMDI) developed in this article is used to compute the results of LMDI decomposition analysis, including multiplicative and additive decomposition. Users can quickly obtain the decomposition result by initializing the input data through a simple class data structure. In addition, the carbon emissions from commercial buildings are used as a numerical example to demonstrate the function of PyLMDI. In summary, PyLMDI is a potential calculation tool for index decomposition analysis that can provide calculation guidance for carbon emission reduction in the buildings sector. The data and codes for the numerical example are also included.

1. Introduction

Buildings as major carbon emitters have attracted growing attention in recent decades [1]. According to the latest global status report for buildings and construction, carbon emissions from buildings were 11.7 gigatons in 2020, accounting for 36% of total global carbon emissions [2,3]. In addition, there is considerable evidence that as the demand for building terminal equipment and energy consumption continues to grow, the buildings sector will continue to be the source of a significant increase in carbon emissions in the future [4,5]. Therefore, a timely tapping of the emission reduction potential of the buildings is an important measure to achieve the goal of controlling the global temperature rise below 2 degrees. At the same time, to formulate realistic emission reduction targets as well as to track and evaluate performance, it is particularly important to accurately identify changes in the driving forces behind carbon emissions from buildings [6,7].
Index decomposition analysis (IDA) is an important technical method for quantitatively analyzing the impact of interest on aggregate indicators, especially the intensity or total amount of carbon emissions [8]. In 2004, Ang [9] compared various decomposition analysis methods and concluded that the logarithmic mean Divisia index (LMDI) was the ideal decomposition analysis approach. Subsequently, a study by [10] further introduced the theory of LMDI and provided practical guidance. Later, Xu and Ang [11] comprehensively reviewed the index decomposition analysis methods applied to carbon emissions in 2013 and found that LMDI was the most studied and widely applied method. Recently, Ang [12] again reviewed the history of LMDI and found that the LMDI approach was still dominant in many areas, and this situation was expected to become more evident over time. Motivated by this fact, Ma and his collaborators [13,14] focused on the energy and emission systems in the buildings sector, and their results confirmed that LMDI was an excellent decomposition analysis method. However, the existing literature on LMDI is too technical and professional and includes intricate calculation methods. Therefore, potential users face significant challenges, such as complex and time-consuming calculations, when analyzing specified problems using LMDI [15].
To bridge the above gap, in this study, we aim to solve the following two problems:
  • How to develop a simple and convenient tool for LMDI decomposition analysis;
  • How to use this tool to analyze carbon emissions from commercial buildings, using China and the US as examples.
To address these two issues, this is the first study to develop an open-source tool for calculating LMDI decomposition analysis based on Python, abbreviated as PyLMDI, available at https://github.com/xiwang2718/PyLMDI (accessed on 10 December 2021). PyLMDI can easily and quickly calculate the multiplicative and additive decomposition results of LMDI. On the basis of this, the carbon emissions from commercial buildings in China and the US are utilized as a numerical example to demonstrate how to perform an LMDI decomposition analysis with the developed PyLMDI.
The most advanced contribution of this study is the tool for LMDI decomposition analysis that has been developed. The decomposition results can be calculated by the tool once the decomposition model and data are given. To the best of our knowledge, although researchers have studied LMDI extensively, presently, there is no effective tool for calculating the decomposition result of LMDI. The developed PyLMDI tool in this study bridges this gap and is expected to extend the LMDI decomposition analysis method to other fields.
The remainder of this paper consists of the following four parts: In Section 2, we review the index decomposition analysis methods; in Section 3, we introduce the theory of LMDI and the development of PyLMDI; in Section 4, we present a numerical example; and finally, in Section 5, we summarize the contributions of this study.

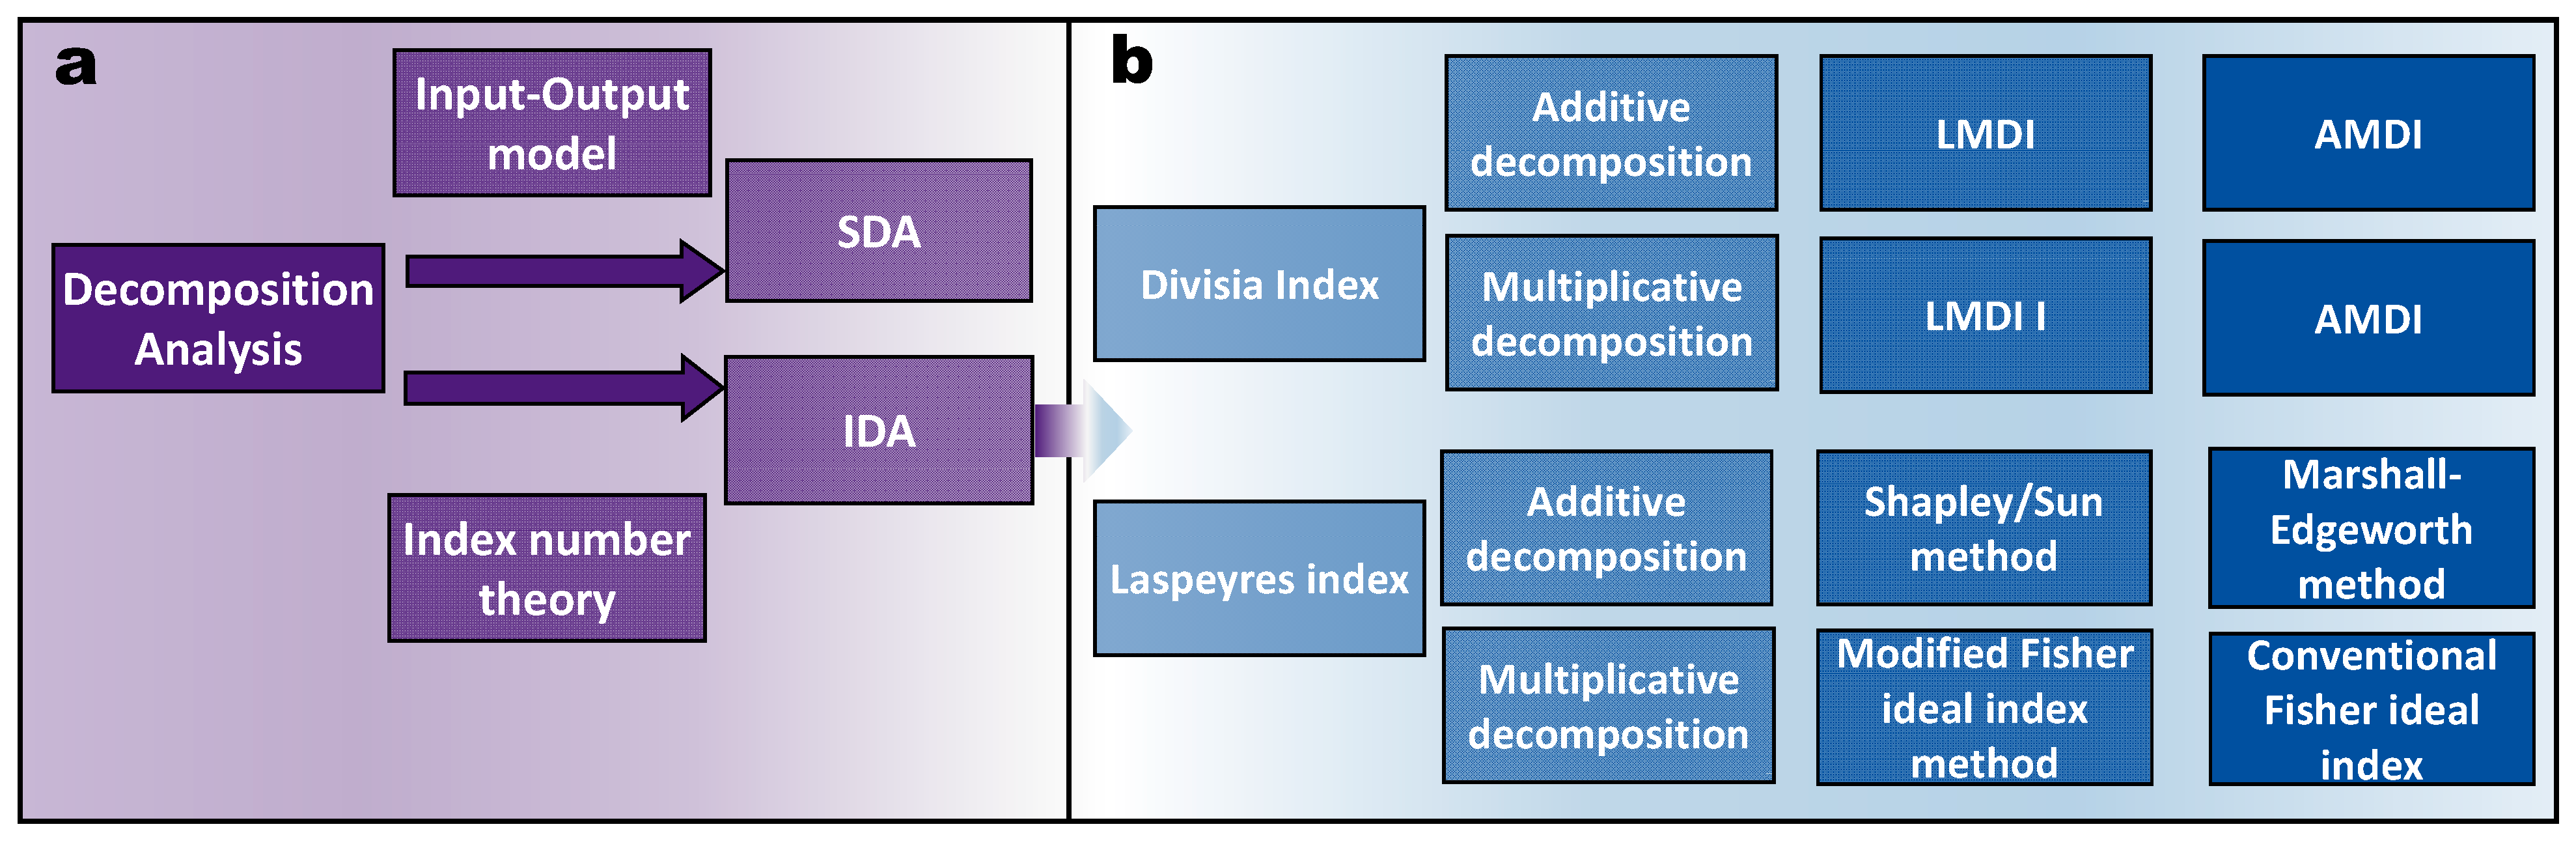
2. Literature Review

Decomposition analysis is an accounting or description technique, including IDA(Index decomposition analysis) and SDA(Structure decomposition analysis)which has been extensively utilized to better analyze and understand energy and emission systems [16,17]. Figure 1 summarizes the development process of decomposition analysis theory. It can be observed that the Divisia index and the Laspeyres index are the two main ideas in IDA, which can work well in both multiplication and addition decomposition [18,19,20]. Since 1990, researchers have focused on Divisia decomposition and proposed the arithmetic mean decomposition analysis method (AMDI) [21,22]. Later, Ang et al. further proposed the well-known logarithmic mean Divisia index (LMDI) decomposition analysis method [23]. In recent years, in order to improve the emission reduction contribution of the construction sector, LMDI has attracted the interest of researchers with its outstanding performance [24,25]. Table 1 lists the research results of LMDI on carbon emissions from buildings in China over the last five years, which includes the scope of the study and key drivers. These research trends suggest that LMDI is expected to continue to play an important role in the future of carbon emissions in the buildings sector.
Python, as one of the most promising programming languages, has inherited good features from other programming languages, such as C, Fortran, and Haskell, with simpler and more elegant syntax [45,46]. Therefore, it is recognized as a leader in open-source project development. At present, a large number of open-source tools, which are often used to analyze energy and emission systems, such as data processing [47], dynamic simulation [48,49,50], and system optimization [51,52], have been developed based on the Python language. These tools have greatly improved the productivity of scientists and engineers and are widely recognized and accepted in academia and industry [53,54]. However, to the best of our knowledge, no tools or frameworks for decomposition analysis are currently being designed and developed.
The above analysis shows that LMDI is the preferred decomposition analysis approach in terms of theoretical technology and application scope and has been widely recognized and cited in the field of carbon emissions from buildings. Nevertheless, to date, efforts have mainly focused on the application of LMDI but lacked discussion of its calculation method. Consequently, the computational cost and application difficulty of the LMDI decomposition technology have increased. Therefore, there is an urgent need to calculate the decomposition results of LMDI in a simpler way. In this study, we provide the following contributions: A tool for calculating LMDI decomposition results is designed and developed based on Python, which can significantly reduce the computational cost of LMDI. The developed PyLMDI can be easily applied to carbon emission reduction in many other fields.

3. PyLMDI: A Python Tool for LMDI Decomposition Analysis

In this section, first, an overview of LMDI theory, which includes multiplicative decomposition and addition factorization groups, is presented. Then, the calculation process of LMDI is further explained. Finally, based on the calculation process, a new tool for LMDI decomposition analysis is developed.

3.1. The LMDI Decomposition Analysis

In general, we assume that V is the aggregate of m sectors and can be represented by V = i = 1 m V i , where V i represents the target variable from the i-th department. In n-dimensional space, V i can be further defined as
V i = x 1 , i x 2 , i x n , i
which is used to describe the influence of n driving forces x j , i ( j = 1 , 2 , , n ) over time on the target variable V i .
In the time period [ 0 , T ] , the change of the target variable from V 0 = i = 1 m x 1 , i 0 x 2 , i 0 x n , i 0 to V T = i = 1 m x 1 , i T x 2 , i T x n , i T can be described in different modes, which include multiplicative decomposition:
D tot | 0 T = V T V 0 = D x 1 D x 2 D x n
and additive decomposition:
Δ V tot | 0 T = V T V 0 = Δ V x 1 + Δ V x 2 + + Δ V x n
The D tot and Δ V tot on the left side of Equations (2) and (3) represent the change of the target variable, and the terms on the right side of Equations (2) and (3) represent the influence of various related driving factors.
As mentioned above, the Divisia index decomposition analysis is the most commonly used decomposition method, which was proposed by the French mathematician Divisia in 1924 [55]. In the Divisia index decomposition analysis theory, all factors to be decomposed are treated as continuous differentiable functions related to time t . Then, by performing the differential operation on time, the influence of the change of each factor on the decomposition target variable is obtained.
According to the definition of Divisia index decomposition analysis, take the derivative of target variable with respect to time T , one obtains:
d V t d t = k = 1 n i = 1 m x 1 , i t x 2 , i t x k 1 , i t x k + 1 , i t x n , i t d x k , i t d t = k = 1 n i = 1 m V i t d ( ln x k , i t ) d t
Integrate both sides with respect to time, we have:
0 T d V t d t = V T V 0 = k = 1 n 0 T i = 1 m V i t d ( ln x k , i t ) d t
Consider simultaneously Equation (3) and Equation (5), the additive decomposition Equation (3) can be written as
Δ V x k | 0 T = 0 T i = 1 m V i t d ( ln x k , i t ) d t
In addition, divide both sides of Equation (5) by V T , and integrate again with respect to time, one obtains:
0 T 1 V t d V t d t = ln V T V 0 = k = 1 n 0 T i = 1 m ω i t d ( ln x k , i t ) d t
where ω i is the weight function and is represented by ω i = V i V [10]. Taking both sides of Equation (7) to the exponent, the multiplicative decomposition Equation (2) can be written as
D x k | 0 T = exp { 0 T i = 1 m ω i t d ( ln x k , i t ) d t }
It is difficult to directly calculate the additive decomposition (Equation (6)) and multiplicative decomposition (Equation (8)), resulting in a large number of approximation methods being studied in order to obtain a reasonable decomposition result. Then, Ang et al. [23] proposed a new logarithmic mean Divisia index decomposition analysis approach, which was abbreviated as LMDI for simplicity. The additive decomposition Equation (6) can be further expressed as
Δ V x k | 0 T = i = 1 m L ( V i T , V i 0 ) ln x k , i T x k , i 0
Similarly, the multiplicative decomposition Equation (8) can also be further transformed into
D x k | 0 T = exp { i = 1 m L ( V i T , V i 0 ) L ( V T , V 0 ) ln x k , i T x k , i 0 }
where L ( · ) is the logarithmic mean function. Suppose p and q represent the target variables at different periods, L ( · ) is defined as follows:
L ( p , q ) = p q ln ( p / q )

3.2. The PyLMDI Open-Source Tool

A reasonable model framework and algorithm design flow are important prerequisites for improving computational efficiency and broadening the scope of application [56,57]. Rearranging the LMDI theory introduced in the previous subsection, the calculation process of LMDI can be summarized by the following five steps:
Step 1: Input the original data of the target variable and related driving force factors and establish the LMDI decomposition identity.
Step 2: Determine the decomposition mode used for analysis.
Step 3: Calculate the change of target variable according to Equations (2) and (3).
Step 4: Calculate the influence of driving forces according to Equations (9) and (10).
Step 5: Output the decomposition results of the LMDI decomposition analysis.
Python is a popular programming language with advanced features such as open source, interpretive and object-oriented programming [58,59]. Python has been widely applied in scientific research [60,61,62], and more importantly, it can be run on all available operating systems. Combined with the above calculation steps, a new tool for calculating LMDI decomposition results was developed based on Python and abbreviated as PyLMDI.
In our research work, PyLMDI was developed to rely on a class data structure, with target variables ( V 0 and V T ) and driver variables ( X 0 = ( x 1 , i 0 , x 2 , i 0 , , x n , i 0 ) and X T = ( x 1 , i T , x 2 , i T , , x n , i T ) ) being input as the class parameters. The additive decomposition and multiplicative decomposition are also encapsulated as class methods and output their decomposition results. Figure 2 further illustrates the design principle of PyLMDI and provides an overview of the research flow of this study. Moreover, a demo file was produced to test the function of PyLMDI, using data from studies by Ang et al. [9,12]. In addition, a detailed instruction manual is attached to the PyLMDI project library, which guides all users to quickly start PyLMDI and run the code. All Python scripts and related files mentioned in our study are freely available from the GitHub repository (https://github.com/xiwang2718/PyLMDI, accessed on 10 December 2021), where anyone can view, download, and edit the source code.

4. The Numerical Example and Discussion

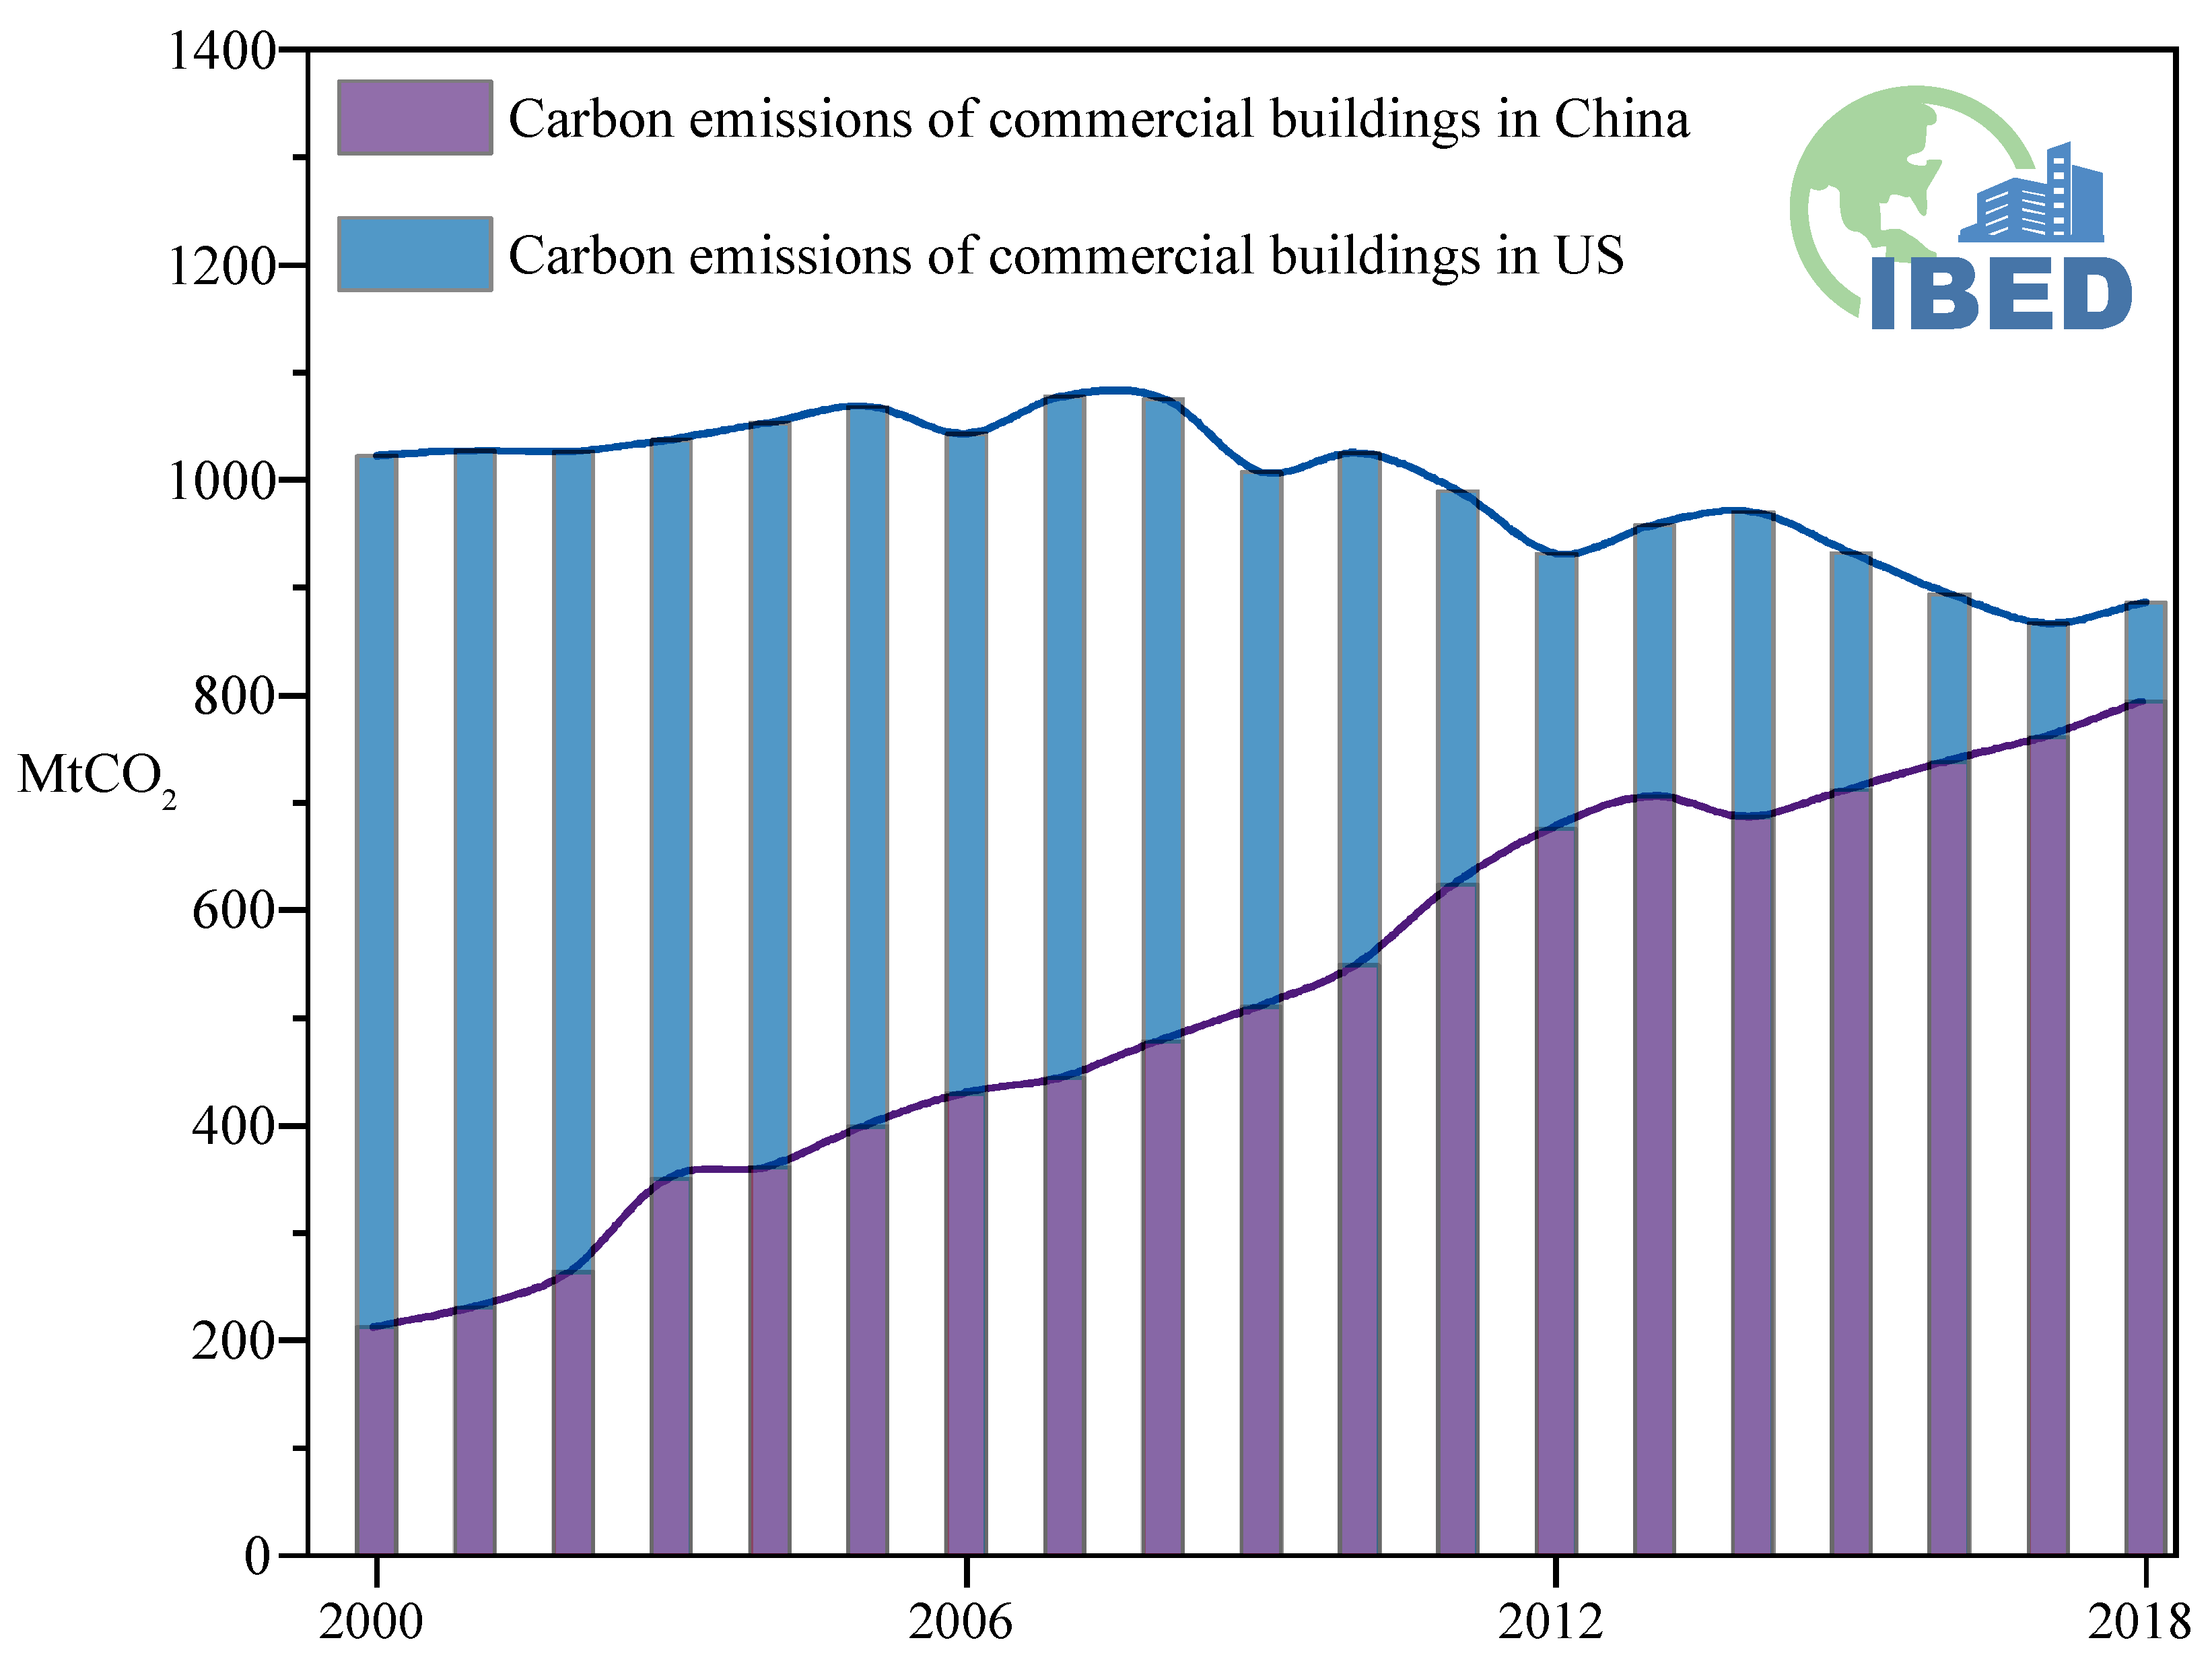
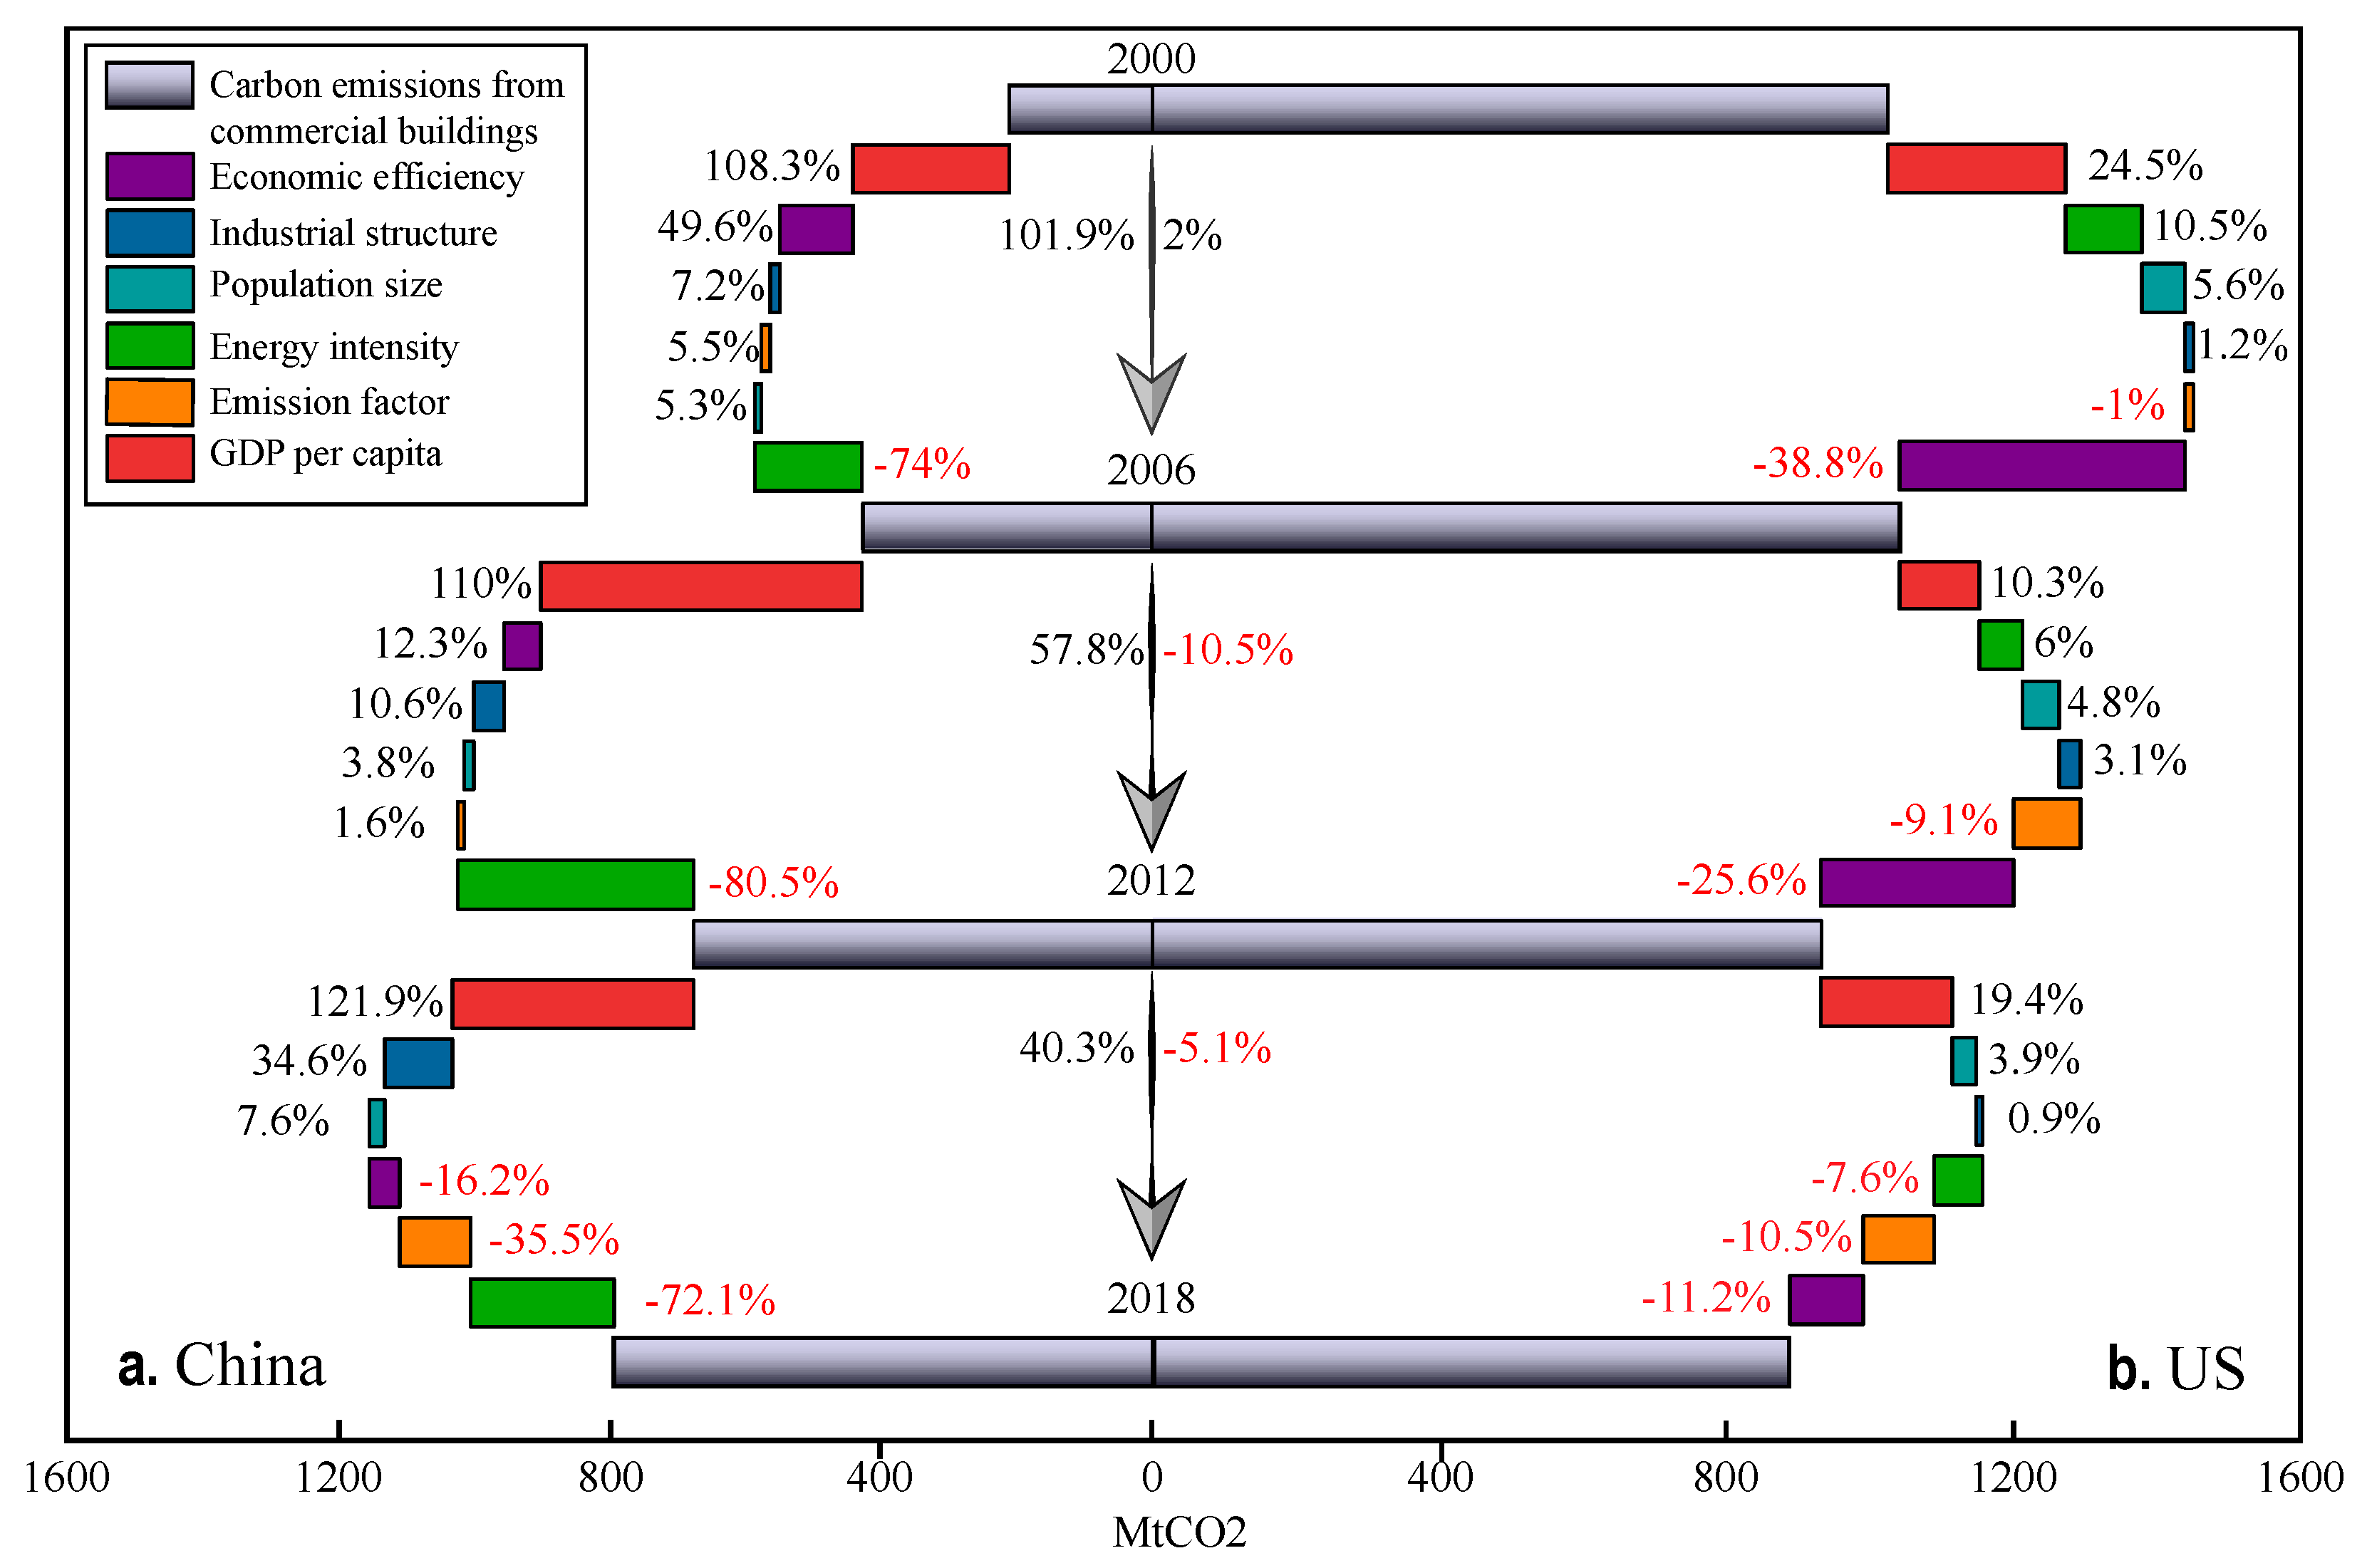
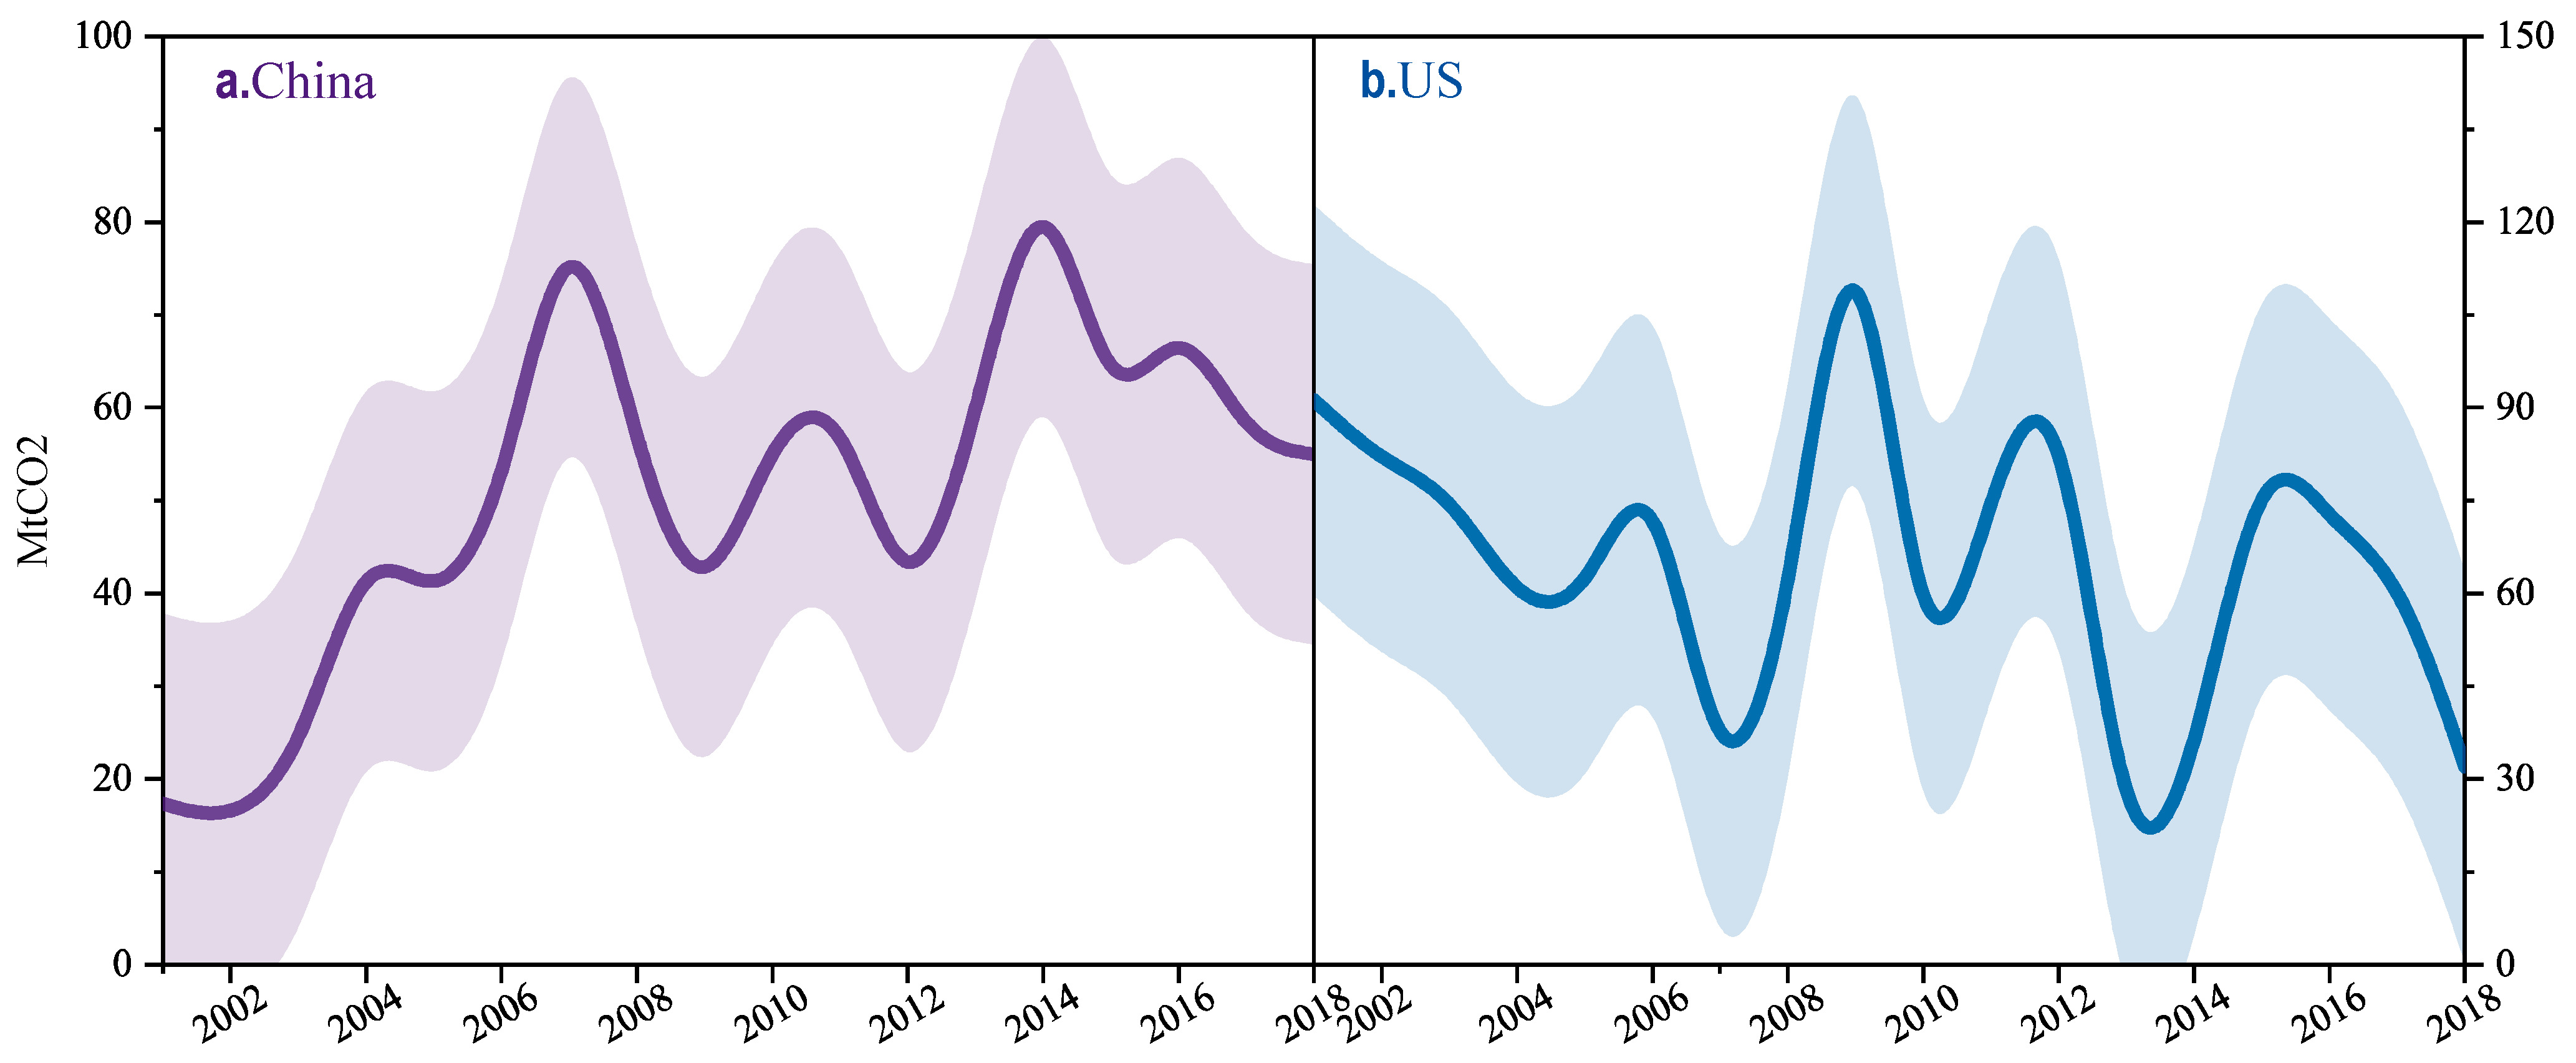
4.1. Historical Carbon Abatement in the Commercial Building Operation: China versus the US

Commercial buildings, an important component of the buildings sector, are also regarded as having more potential for carbon emission reduction than other sectors [63,64]. On the other hand, as the world’s top two carbon emitters, the efforts of China and the US to reduce carbon emissions can effectively contribute to the global response to climate change [65,66]. In this section, carbon emission models for China and the US can be established based on carbon emissions from commercial buildings (C), energy consumption (E), population size (P), public floor area (F), tertiary industry added value (Gs), and GDP (G). The developed PyLMDI was applied to calculate the degree of influence driving forces exerted on the carbon emissions from commercial buildings in different time periods. The raw data related to China’s commercial buildings were collected from IBED(International Building Emission Dataset) datasets, which have been extensively accepted by existing efforts [67,68,69], and the raw data related to China’s economy and population were collected from the China Statistical Yearbook. The raw data for the US were derived from the Energy Information Administration. Figure 3 illustrates the dynamic of carbon emissions in China and the US from 2000 to 2018.
According to the classic IPAT(Impact, population, affluence, technology) model [70,71], the carbon emission models for commercial buildings can be extended as follows:.
C = P g s i e K
where g = G P represents the Gross Domestic Product (GDP) per capita, s = G s G represents the industrial structure, e = E F represents the Energy intensity, i = F G s represents the economic efficiency, and K = C E represents the total emissions factor. By performing LMDI multiplication decomposition analysis on Equation (12), the contribution of each driving force to carbon emissions at different time periods can be obtained as shown below:
Δ C | 0 T = C T C 0 = Δ P + Δ g + Δ s + Δ i + Δ e + Δ K
In addition, according to the time span of the collected research data, in this study we adopt the analysis strategy of decomposition every six years. The developed PyLMDI was utilized to calculate the decomposition analysis results of the carbon emissions from commercial buildings. First, according to Equation (12), the observed data of carbon emissions and the driving forces at different moments are input. Then, we instantiate the corresponding PyLMDI classes for China and the US. Next, the additive decomposition class method is used to compute the results of all the items in Equation (13). Finally, the results of the LMDI decomposition analysis are output and visualized in Figure 4. The source code for the calculations is also available at https://github.com/xiwang2718/PyLMDI (accessed on 10 December 2021). The code is run through Spyder IDE (Python 3.8) on a Windows operating system.
Figure 4 shows the staged changes of different driving forces on the carbon emissions from commercial buildings in the past 20 years. As shown in Figure 4a, the most prominent positive driving force for changes in China’s carbon emissions is the GDP per capita. Additionally, the greatest negative contribution to carbon emissions from China’s commercial buildings is energy intensity, which also means energy intensity is the key driving force to promote carbon reduction from China’s commercial buildings. Regarding the US, Figure 4b shows that the per capita GDP also plays a significant, positive role in carbon emissions of commercial buildings in the US, and it should be pointed out that this influence is very different from that in China. In addition, industrial structure and economic efficiency are the major factors in reducing carbon emissions from the US’s commercial buildings.
After determining the contribution level of each influencing factor on carbon emissions in three different time periods, PyLMDI was again applied to calculate the year-by-year decomposition results over nearly 20 years, and then to assess their respective historical carbon emission reduction levels (Figure 5). To boost the interpretability of the results, two error bands are attached in Figure 5. (The error ranges for China and the US are 20.45 MtCO2 and 31.55 MtCO2, respectively). As illustrated in Figure 5a, the total carbon emission reduction in China’s commercial buildings has shown an increasing trend. The curve in Figure 5b shows a significant downward trend in the total amount of carbon reduction in the US. By comparing the carbon emission reduction levels of commercial buildings in China and the US, it is easy to find that there has been little difference between the total carbon emission reduction over the past nearly two decades. Specifically, China’s annual carbon emission reduction is 50.44 ± 20.45 MtCO2, while that in the US is 65.36 ± 31.55 MtCO2. Nonetheless, China and the US show considerable differences in their carbon emission reduction trends. Overall, China shows more carbon emission reduction potential than the US, and similar conclusions can be drawn from recent research efforts [69].

4.2. Discussion

In the previous subsection, LMDI was used to analyze the carbon emission reduction potential of commercial buildings in China and the U.S. All decomposition results were calculated via PyLMDI. In this subsection we further illustrate the reliability of the results by discussing the residual value of the decomposition results.
Theoretically, we assume that there is a residual term in the decomposition Equation (13), and it is expressed as Δ C res ; then, the residual term Δ C res can be defined as follows:
Δ C res = Δ C | 0 T ( Δ P + Δ g + Δ s + Δ i + Δ e + Δ K )
Substituting Equation (8) into Equation (14), one obtains:
Δ C res = Δ C | 0 T ( Δ P + Δ g + Δ s + Δ i + Δ e + Δ K ) = Δ C | 0 T L ( C T , C 0 ) ( ln P T P 0 + ln g T g 0 + ln s T s 0 + ln i T i 0 + ln e T e 0 + ln K T K 0 ) = Δ C | 0 T L ( C T , C 0 ) ln ( P T P 0 × g T g 0 × s T s 0 × i T i 0 × e T e 0 × K T K 0 ) = Δ C | 0 T L ( C T , C 0 ) C T C 0 L ( C T , C 0 ) = Δ C | 0 T Δ C | 0 T = 0
Therefore, Equation (13) is proven to be a constant equation, i.e., there is no decomposition residual term. In addition, the calculation results from PyLMDI also verify this conclusion numerically.

5. Conclusions

The logarithmic mean Divisia index (LMDI) is a mature decomposition analysis method. Recently, LMDI has been extensively recognized by researchers and applied in many fields. The trends suggest that it will continue to play an important role in energy consumption and emission decomposition analysis in the future, particularly in the buildings sector.
In this study, the theory and application of LMDI were introduced in detail. A new open-source tool, called PyLMDI, for calculating LMDI decomposition results was developed based on the Python programming language (available on https://github.com/xiwang2718/PyLMDI, accessed on 10 December 2021), which provided enough information for interested users to use the LMDI decomposition approach in the “black box” mode. In addition, the numerical example shows that PyLMDI is an efficient tool for analyzing carbon emission reductions from commercial buildings in China and the United States [72]. Overall, the PyLMDI tool developed in this study provides calculation guidance for carbon emission decomposition analysis in the buildings sector and other fields. Future studies should aim to update the tool based on other programming languages and software (such as R language), and also to develop tools for other new decomposition analysis methods such as the generalized Divisia index method [73,74].

Author Contributions

Conceptualization, M.M. and Z.M.; methodology, M.M.; software, X.X.; validation, X.X. and W.C.; formal analysis, X.X.; investigation, X.X.; resources, M.M.; data curation, X.X.; writing—original draft preparation, X.X.; writing—review and editing, M.M.; visualization, X.X. and M.M.; supervision, X.M. and Z.M.; project administration, Z.M.; funding acquisition, Z.M. and M.M. All authors have read and agreed to the published version of the manuscript.

Funding

This study was supported by the National Planning Office of Philosophy and Social Science Foundation of China (21CJY030 and 18BJL034), the Beijing Natural Science Foundation (8224085), the China Postdoctoral Science Foundation (2020M680020), the Shuimu Tsinghua Scholar Program of Tsinghua University (2019SM139), and the Fundamental Research Funds for the Central Universities of China (2020CDJSK03YJ07).

Institutional Review Board Statement

Not applicable.

Informed Consent Statement

Not applicable.

Data Availability Statement

Raw data available at https://www.researchgate.net/project/International-Building-Emission-Dataset-IBED (accessed on 10 December 2021).

Conflicts of Interest

The authors declare no conflict of interest.

References

  1. Zhou, N.; Khanna, N.; Feng, W.; Ke, J.; Levine, M. Scenarios of energy efficiency and CO2 emissions reduction potential in the buildings sector in China to year 2050. Nat. Energy 2018, 3, 978–984. [Google Scholar] [CrossRef]
  2. UNEP. 2021 Global Status Report for Buildings and Construction. Available online: https://globalabc.org/sites/default/files/2021-10/GABC_Buildings-GSR-2021_BOOK.pdf (accessed on 10 December 2021).
  3. Xiang, X.; Ma, X.; Ma, Z.; Ma, M. Operational Carbon Change in Commercial Buildings under the Carbon Neutral Goal: A LASSO-WOA Approach. Buildings 2022, 12, 54. [Google Scholar] [CrossRef]
  4. Yang, L.; Ma, Z.; Ma, M.; Xu, Y. Decarbonization, Environmental Regulation, and Economic Boom: An Indicator Assessment Based on the Industrial Waste. Front. Energy Res. 2022, 9, 838852. [Google Scholar]
  5. Lou, Y.; Ye, Y.; Yang, Y.; Zuo, W. Long-term carbon emission reduction potential of building retrofits with dynamically changing electricity emission factors. Build. Environ. 2021, 210, 108683. [Google Scholar] [CrossRef]
  6. Wu, W.; Ma, X.; Zhang, Y.; Li, W.; Wang, Y. A novel conformable fractional non-homogeneous grey model for forecasting carbon dioxide emissions of BRICS countries. Sci. Total Environ. 2020, 707, 135447. [Google Scholar] [CrossRef]
  7. Dong, K.; Hochman, G.; Timilsina, G.R. Do drivers of CO2 emission growth alter overtime and by the stage of economic development? Energy Policy 2020, 140, 111420. [Google Scholar] [CrossRef]
  8. Ang, B.W.Z.; Fang, Q. A survey of index decomposition analysis in energy and environmental studies. Energy 2000, 25, 1149–1176. [Google Scholar] [CrossRef]
  9. Ang, B.W. Decomposition analysis for policymaking in energy: Which is the preferred method? Energy Policy 2004, 32, 1131–1139. [Google Scholar] [CrossRef]
  10. Ang, B.W. The LMDI approach to decomposition analysis: A practical guide. Energy Policy 2005, 33, 867–871. [Google Scholar] [CrossRef]
  11. Xu, X.; Ang, B.W. Index decomposition analysis applied to CO2 emission studies. Ecol. Econ. 2013, 93, 313–329. [Google Scholar] [CrossRef]
  12. Ang, B.W. LMDI decomposition approach: A guide for implementation. Energy Policy 2015, 86, 233–238. [Google Scholar] [CrossRef]
  13. Ma, M.; Ma, X.; Cai, W.; Cai, W. Low carbon roadmap of residential building sector in China: Historical mitigation and prospective peak. Appl. Energy 2020, 273, 115247. [Google Scholar] [CrossRef]
  14. Li, K.; Ma, M.; Xiang, X.; Feng, W.; Ma, Z.; Cai, W.; Ma, X. Carbon reduction in commercial building operations: A provincial retrospection in China. Appl. Energy 2022, 306, 118098. [Google Scholar] [CrossRef]
  15. Kaltenegger, O. What drives total real unit energy costs globally? A novel LMDI decomposition approach. Appl. Energy 2020, 261, 114340. [Google Scholar] [CrossRef] [Green Version]
  16. Ang, B.W. Decomposition methodology in industrial energy demand analysis. Energy 1995, 20, 1081–1095. [Google Scholar] [CrossRef]
  17. Su, B.; Ang, B.W. Structural decomposition analysis applied to energy and emissions: Some methodological developments. Energy Econ. 2012, 34, 177–188. [Google Scholar] [CrossRef]
  18. Liu, N.; Ang, B.W. Factors shaping aggregate energy intensity trend for industry: Energy intensity versus product mix. Energy Econ. 2007, 29, 609–635. [Google Scholar] [CrossRef]
  19. Su, B.; Ang, B.W. Multiplicative decomposition of aggregate carbon intensity change using input–output analysis. Appl. Energy 2015, 154, 13–20. [Google Scholar] [CrossRef]
  20. Wang, H.; Ang, B.; Su, B. Assessing drivers of economy-wide energy use and emissions: IDA versus SDA. Energy Policy 2017, 107, 585–599. [Google Scholar] [CrossRef]
  21. Choi, K.-H.; Ang, B. Measuring thermal efficiency improvement in power generation: The Divisia decomposition approach. Energy 2002, 27, 447–455. [Google Scholar] [CrossRef]
  22. Boyd, G.A.; Hanson, D.A.; Sterner, T. Decomposition of changes in energy intensity: A comparison of the Divisia index and other methods. Energy Econ. 1988, 10, 309–312. [Google Scholar] [CrossRef]
  23. Ang, B.W.; Liu, N. Negative-value problems of the logarithmic mean Divisia index decomposition approach. Energy Policy 2007, 35, 739–742. [Google Scholar] [CrossRef]
  24. Jiang, R.; Li, R.; Wu, Q. Investigation for the decomposition of carbon emissions in the USA with CD function and LMDI methods. Sustainability 2019, 11, 334. [Google Scholar] [CrossRef] [Green Version]
  25. Alajmi, R.G. Factors that impact greenhouse gas emissions in Saudi Arabia: Decomposition analysis using LMDI. Energy Policy 2021, 156, 112454. [Google Scholar] [CrossRef]
  26. Gong, Y.; Song, D. Life cycle building carbon emissions assessment and driving factors decomposition analysis based on LMDI—A case study of Wuhan City in China. Sustainability 2015, 7, 16670–16686. [Google Scholar] [CrossRef] [Green Version]
  27. Lin, B.; Liu, H. CO2 emissions of China’s commercial and residential buildings: Evidence and reduction policy. Build. Environ. 2015, 92, 418–431. [Google Scholar] [CrossRef]
  28. Lin, B.; Liu, H. CO2 mitigation potential in China’s building construction industry: A comparison of energy performance. Build. Environ. 2015, 94, 239–251. [Google Scholar] [CrossRef]
  29. Liu, Z.; Wang, S.; Liu, J.; Liu, F.; Fu, X. Analysis of factors affecting CO2 emissions by civil buildings in China’s urban areas. Int. J. Low-Carbon Technol. 2015, 10, 460–463. [Google Scholar] [CrossRef] [Green Version]
  30. Yuan, B.; Ren, S.; Chen, X. The effects of urbanization, consumption ratio and consumption structure on residential indirect CO2 emissions in China: A regional comparative analysis. Appl. Energy 2015, 140, 94–106. [Google Scholar] [CrossRef]
  31. Lu, Y.; Cui, P.; Li, D. Carbon emissions and policies in China’s building and construction industry: Evidence from 1994 to 2012. Build. Environ. 2016, 95, 94–103. [Google Scholar] [CrossRef]
  32. Jiang, R.; Li, R. Decomposition and decoupling analysis of life-cycle carbon emission in China’s building sector. Sustainability 2017, 9, 793. [Google Scholar] [CrossRef] [Green Version]
  33. Wu, Y.; Chau, K.; Lu, W.; Shen, L.; Shuai, C.; Chen, J. Decoupling relationship between economic output and carbon emission in the Chinese construction industry. Environ. Impact Assess. Rev. 2018, 71, 60–69. [Google Scholar] [CrossRef]
  34. Wang, M.; Feng, C. Exploring the driving forces of energy-related CO2 emissions in China’s construction industry by utilizing production-theoretical decomposition analysis. J. Clean. Prod. 2018, 202, 710–719. [Google Scholar] [CrossRef]
  35. Lai, X.; Lu, C.; Liu, J. A synthesized factor analysis on energy consumption, economy growth, and carbon emission of construction industry in China. Environ. Sci. Pollut. Res. 2019, 26, 13896–13905. [Google Scholar] [CrossRef]
  36. Wu, P.; Song, Y.; Zhu, J.; Chang, R. Analyzing the influence factors of the carbon emissions from China’s building and construction industry from 2000 to 2015. J. Clean. Prod. 2019, 221, 552–566. [Google Scholar] [CrossRef]
  37. Wang, C.; Wu, K.; Zhang, X.; Wang, F.; Zhang, H.; Ye, Y.; Wu, Q.; Huang, G.; Wang, Y.; Wen, B. Features and drivers for energy-related carbon emissions in mega city: The case of Guangzhou, China based on an extended LMDI model. PloS ONE 2019, 14, e0210430. [Google Scholar] [CrossRef] [Green Version]
  38. Du, Q.; Lu, X.; Li, Y.; Wu, M.; Bai, L.; Yu, M. Carbon emissions in China’s construction industry: Calculations, factors and regions. Int. J. Environ. Res. Public Health 2018, 15, 1220. [Google Scholar] [CrossRef] [Green Version]
  39. He, J.; Yue, Q.; Li, Y.; Zhao, F.; Wang, H. Driving force analysis of carbon emissions in China’s building industry: 2000–2015. Sustain. Cities Soc. 2020, 60, 102268. [Google Scholar] [CrossRef]
  40. Liu, Z.; Yin, Y. LMDI model-based analysis of direct carbon emission accounting and influencing factors of China’s building industry. Proc. IOP Conf. Ser. Mater. Sci. Eng. 2020, 768, 052096. [Google Scholar] [CrossRef]
  41. Chen, X.; Shuai, C.; Wu, Y.; Zhang, Y. Analysis on the carbon emission peaks of China’s industrial, building, transport, and agricultural sectors. Sci. Total Environ. 2020, 709, 135768. [Google Scholar] [CrossRef]
  42. Li, D.; Huang, G.; Zhang, G.; Wang, J. Driving factors of total carbon emissions from the construction industry in Jiangsu Province, China. J. Clean. Prod. 2020, 276, 123179. [Google Scholar] [CrossRef]
  43. Sihui, Y.; Jing, L.; Mengjie, W. Study on Influencing Factors of Carbon Emission of Civil Buildings Based on Regional Differences. Proc. IOP Conf. Ser. Earth Environ. Sci. 2021, 647, 012194. [Google Scholar] [CrossRef]
  44. Zhao, J.; Liu, Q. Examining the Driving Factors of Urban Residential Carbon Intensity Using the LMDI Method: Evidence from China’s County-Level Cities. Int. J. Environ. Res. Public Health 2021, 18, 3929. [Google Scholar] [CrossRef]
  45. Milano, F. A Python-based software tool for power system analysis. In Proceedings of the 2013 IEEE Power & Energy Society General Meeting, Vancouver, BC, USA, 21–25 July 2013; pp. 1–5. [Google Scholar]
  46. Langtangen, H.P.; Barth, T.J.; Griebel, M. Python Scripting for Computational Science; Springer: Berlin/Heidelberg, Germany, 2008; Volume 3. [Google Scholar]
  47. Sánchez-Pérez, P.A.; Kurtz, S. California’s vision for reaching zero-carbon emissions. In Proceedings of the 2020 47th IEEE Photovoltaic Specialists Conference (PVSC), Calgary, AB, Canada, 15 June–21 August 2020; pp. 2570–2573. [Google Scholar]
  48. Milano, F. An open source power system analysis toolbox. IEEE Trans. Power Syst. 2005, 20, 1199–1206. [Google Scholar] [CrossRef]
  49. Murillo-Sánchez, C.E.; Zimmerman, R.D.; Anderson, C.L.; Thomas, R.J. Secure planning and operations of systems with stochastic sources, energy storage, and active demand. IEEE Trans. Smart Grid 2013, 4, 2220–2229. [Google Scholar] [CrossRef]
  50. Cole, S.; Belmans, R.J. Matdyn, a new matlab-based toolbox for power system dynamic simulation. IEEE Trans. Power Syst. 2010, 26, 1129–1136. [Google Scholar] [CrossRef]
  51. Langiu, M.; Shu, D.Y.; Baader, F.J.; Hering, D.; Bau, U.; Xhonneux, A.; Müller, D.; Bardow, A.; Mitsos, A.; Dahmen, M.J.C.; et al. COMANDO: A Next-Generation Open-Source Framework for Energy Systems Optimization; Elsevier: Amsterdam, The Netherlands, 2021; Volume 152, p. 107366. [Google Scholar]
  52. Schwarz, S.; Uerlich, S.A.; Monti, A. Pycity_Scheduling—A Python framework for the development and assessment of optimisation-based power scheduling algorithms for multi-energy systems in city districts. SoftwareX 2021, 16, 100839. [Google Scholar] [CrossRef]
  53. Maryasin, O.Y.; Lukashov, A.I. A python application for hourly electricity prices forecasting using neural networks. In Proceedings of the 2020 International Russian Automation Conference (RusAutoCon), Sochi, Russia, 6–12 September 2020; pp. 138–143. [Google Scholar]
  54. Thurner, L.; Scheidler, A.; Schäfer, F.; Menke, J.-H.; Dollichon, J.; Meier, F.; Meinecke, S.; Braun, M. Pandapower—An open-source python tool for convenient modeling, analysis, and optimization of electric power systems. IEEE Trans. Power Syst. 2018, 33, 6510–6521. [Google Scholar] [CrossRef] [Green Version]
  55. Boyd, G.; McDonald, J.F.; Ross, M.; Hansont, D.A. Separating the changing composition of US manufacturing production from energy efficiency improvements: A Divisia index approach. Energy J. 1987, 8, 77–96. [Google Scholar] [CrossRef]
  56. Xiang, X.; Ma, X.; Ma, M.; Wu, W.; Yu, L. Research and application of novel Euler polynomial-driven grey model for short-term PM10 forecasting. Grey Syst. Theory Appl. 2020, 11, 498–517. [Google Scholar] [CrossRef]
  57. Xiang, X.; Ma, X.; Fang, Y.; Wu, W.; Zhang, G. A novel hyperbolic time-delayed grey model with Grasshopper Optimization Algorithm and its applications. Ain Shams Eng. J. 2021, 12, 865–874. [Google Scholar] [CrossRef]
  58. Hörning, S.; Haese, B. RMWSPy (v 1.1): A Python code for spatial simulation and inversion for environmental applications. Environ. Model. Softw. 2021, 138, 104970. [Google Scholar] [CrossRef]
  59. Oliphant, T.E. Python for scientific computing. Comput. Sci. Eng. 2007, 9, 10–20. [Google Scholar] [CrossRef] [Green Version]
  60. Lu, H.; Ma, X.; Huang, K.; Azimi, M. Prediction of offshore wind farm power using a novel two-stage model combining kernel-based nonlinear extension of the Arps decline model with a multi-objective grey wolf optimizer. Renew. Sustain. Energy Rev. 2020, 127, 109856. [Google Scholar] [CrossRef]
  61. Ma, X.; Xie, M.; Suykens, J.A. A novel neural grey system model with Bayesian regularization and its applications. Neurocomputing 2021, 456, 61–75. [Google Scholar] [CrossRef]
  62. Yu, L.; Ma, X.; Wu, W.; Xiang, X.; Wang, Y.; Zeng, B. Application of a novel time-delayed power-driven grey model to forecast photovoltaic power generation in the Asia-Pacific region. Sustain. Energy Technol. Assess. 2021, 44, 100968. [Google Scholar] [CrossRef]
  63. Jing, R.; Xie, M.N.; Wang, F.X.; Chen, L.X. Fair P2P energy trading between residential and commercial multi-energy systems enabling integrated demand-side management. Appl. Energy 2020, 262, 114551. [Google Scholar] [CrossRef]
  64. Lu, M.; Lai, J. Review on carbon emissions of commercial buildings. Renew. Sustain. Energy Rev. 2020, 119, 109545. [Google Scholar] [CrossRef]
  65. Ma, M.; Pan, T.; Ma, Z. Examining the Driving Factors of Chinese Commercial Building Energy Consumption from 2000 to 2015: A STIRPAT Model Approach. J. Eng. Sci. Technol. Rev. 2017, 10, 28–38. [Google Scholar] [CrossRef]
  66. Zhao, Y.; Wang, S.; Zhang, Z.; Liu, Y.; Ahmad, A. Driving factors of carbon emissions embodied in China-US trade: A structural decomposition analysis. J. Clean. Prod. 2016, 131, 678–689. [Google Scholar] [CrossRef]
  67. Chen, M.; Ma, M.; Lin, Y.; Ma, Z.; Li, K. Carbon Kuznets curve in China’s building operations: Retrospective and prospective trajectories. Sci. Total Environ. 2022, 803, 150104. [Google Scholar] [CrossRef]
  68. Cai, W.; Wu, Y.; Zhong, Y.; Ren, H. China building energy consumption: Situation, challenges and corresponding measures. Energy Policy 2009, 37, 2054–2059. [Google Scholar] [CrossRef]
  69. Zhang, S.; Ma, M.; Li, K.; Ma, Z.; Feng, W.; Cai, W. Historical carbon abatement in the commercial building operation: China versus the US. Energy Econ. 2021, 105, 105712. [Google Scholar] [CrossRef]
  70. York, R.; Rosa, E.A.; Dietz, T. STIRPAT, IPAT and ImPACT: Analytic tools for unpacking the driving forces of environmental impacts. Ecol. Econ. 2003, 46, 351–365. [Google Scholar] [CrossRef]
  71. Ehrlich, P.R.; Holdren, J.P. Impact of population growth. Science 1971, 171, 1212–1217. [Google Scholar] [CrossRef] [PubMed]
  72. He, Y.; Xing, Y.; Zeng, X.; Ji, Y.; Hou, H.; Zhang, Y.; Zhu, Z.J. Factors influencing carbon emissions from China’s electricity industry: Analysis using the combination of LMDI and K-means clustering. Environ. Impact Assess. Rev. 2022, 93, 106724. [Google Scholar] [CrossRef]
  73. Vaninsky, A. Factorial decomposition of CO2 emissions: A generalized Divisia index approach. Energy Econ. 2014, 45, 389–400. [Google Scholar] [CrossRef]
  74. Shao, S.; Liu, J.; Geng, Y.; Miao, Z.; Yang, Y. Uncovering driving factors of carbon emissions from China’s mining sector. Appl. Energy 2016, 166, 220–238. [Google Scholar] [CrossRef]
Figure 1. (a) The difference and connection between SDA and IDA and (b) The classical index decomposition analysis method.
Buildings 12 00083 g001
Figure 2. Research flow chart and conceptual diagram illustrating the architecture of PyLMDI.
Buildings 12 00083 g002
Figure 3. Carbon emission dynamics of commercial buildings in China and the US from 2000 to 2018.
Buildings 12 00083 g003
Figure 4. The contribution level of various influencing factors to the changes in carbon emissions from commercial buildings in (a) China and (b) the US.
Buildings 12 00083 g004
Figure 5. Total carbon reduction: (a) commercial buildings in China; (b) commercial buildings in the US.
Buildings 12 00083 g005
Table 1. The application of LMDI decomposition analysis on building carbon emissions in China over the past five years.
SourceYear LocationScopeMajor Driver Forces
Gong et al. [26]2015Wuhan City in ChinaLife cycle building carbon emissionsIncreasing building area
Lin et al. [27]2015China Commercial and residential buildingsResidents’ income
Lin et al. [28]2015China Building construction industryEnergy intensity decline
Liu et al. [29]2015China’s urban areasCivil buildingsUrban population and per capita floor space
Yuan et al. [30]2015ChinaResidential building operationPopulation, energy intensity, consumption factors, urbanization effect
Lu et al. [31]2016ChinaMaterial consumption and on-site construction activitiesEmission factor, energy structure, energy intensity
Jiang et al. [32]2017China Life-cycle carbon emissions in China’s building sectorIndirect emission intensity effect and economic output effects
Wu et al. [33]201830 provinces in ChinaConstruction industryEconomic growth in most provinces of China
Wang et al. [34]2018China Direct and indirect CO2 emissions in construction industryIndustrial activity
Lai et al. [35]2019China Construction industryEnergy consumption
Wu et al. [36]2019Chinaconstruction stageunit cost constructed floor area
Building operationUrban development, floor space effect, and energy demand from appliance effect
Wang et al. [37]2019Guangzhou, ChinaResidential sectorAffluence effect of urban development
Du et al. [38]202030 provinces in ChinaConstruction industryDifferent in different provinces
Ma et al. [13]2020ChinaResidential buildingPer capita income
He et al. [39]2020China Rural residential buildings, urban residential buildings and public buildingsEconomic output effect and per capita iron and steel accumulation effect
Lin et al. [40]2020ChinaDirect carbon emissions of buildingsEnergy intensity, energy structure, economic output
Chen et al. [41]2020ChinaBuilding sectorEconomic output
Li et al. [42]2020Jiangsu province in ChinaConstruction industryArea factor and the output value intensity factor
Yang et al. [43]2021ChinaCivil buildingsPer capita building area effect
Zhao et al. [44]2021620 county-level cities in 30 Chinese provincesResidential sectorEnergy consumption per capita, urban sprawl, and land demand
Publisher’s Note: MDPI stays neutral with regard to jurisdictional claims in published maps and institutional affiliations.

