Next Article in Journal
A Comparative Study on the Life Cycle Assessment of New Zealand Residential Buildings
Previous Article in Journal
Water Consumption and Environmental Impact of Multifamily Residential Buildings: A Life Cycle Assessment Study
 
 
buildings-logo
Article Menu

Article Menu

Case Report

An Investigation on the Thermal Environment of Residential Courtyards in the Cold Area of Western Sichuan Plateau

College of Civil Engineering and Architecture, Southwest University of Science and Technology, Mianyang 621010, China
*
Author to whom correspondence should be addressed.
Buildings 2022, 12(1), 49; https://doi.org/10.3390/buildings12010049
Submission received: 30 November 2021 / Revised: 31 December 2021 / Accepted: 2 January 2022 / Published: 5 January 2022
(This article belongs to the Topic Sustainable Built Environment)

Abstract

:
Located on the east side of China’s Qinghai–Tibet Plateau is the Western Sichuan Plateau, the courtyard adopts a passive design to withstand the harsh climate in cold areas, and its internal thermal environment has a direct impact on the productivity and activities of the residents. This paper takes a plateau village (3500 m above sea level) beside the Sichuan–Tibet line as the research area, and selects four typical local courtyard layouts and an outdoor reference point for the measurement and comparison of the thermal environment. By comparing the measured parameters inside and outside the courtyard, and the correlation analysis, it was deduced as follows. (1) In the cold winter, traditional plateau residential courtyards can create a stable internal micro-climate, but the cold resistance of the courtyards is closely related to its layout. (2) Except for wind speed, other thermal environment parameters of the courtyard are all affected by solar radiation (3) The correlation analysis of the various environmental parameters and physiologically equivalent temperature (PET) showed that the correlation coefficient between the mean radiation temperature (Tmrt) and all courtyard PET values is <0.0001, showing a significant correlation. The indicators of mean temperature radiation are mainly affected by the temperature and the wind speed; furthermore, the temperature and solar radiation are positively correlated, which confirms that the solar radiation and wind speed within the courtyard are the main factors affecting the internal thermal environment in the courtyard. (4) Feedback the courtyard layout problems through the difference in the thermal environment parameters within different courtyards, and then determine some shortcomings in the current courtyard layout design. The inferences drawn from this work will provide a scientific basis for the design, layout, and construction of courtyards in other cold plateau areas.

1. Introduction

Rapid global socio-economic growth has resulted in many studies focused on the subject of how to meet the energy requirements of global urbanization. Furthermore, building-energy consumption accounts for a significant share of the total energy consumption. Therefore, within the context of advocating and encouraging sustainable development, the number of studies in the area of the design and development of efficient energy sources is increasing. Hence, the design strategy of residential courtyards can effectively improve the utilization of energy and help reduce energy consumption, which is an effective strategy in compliance with global sustainable development [
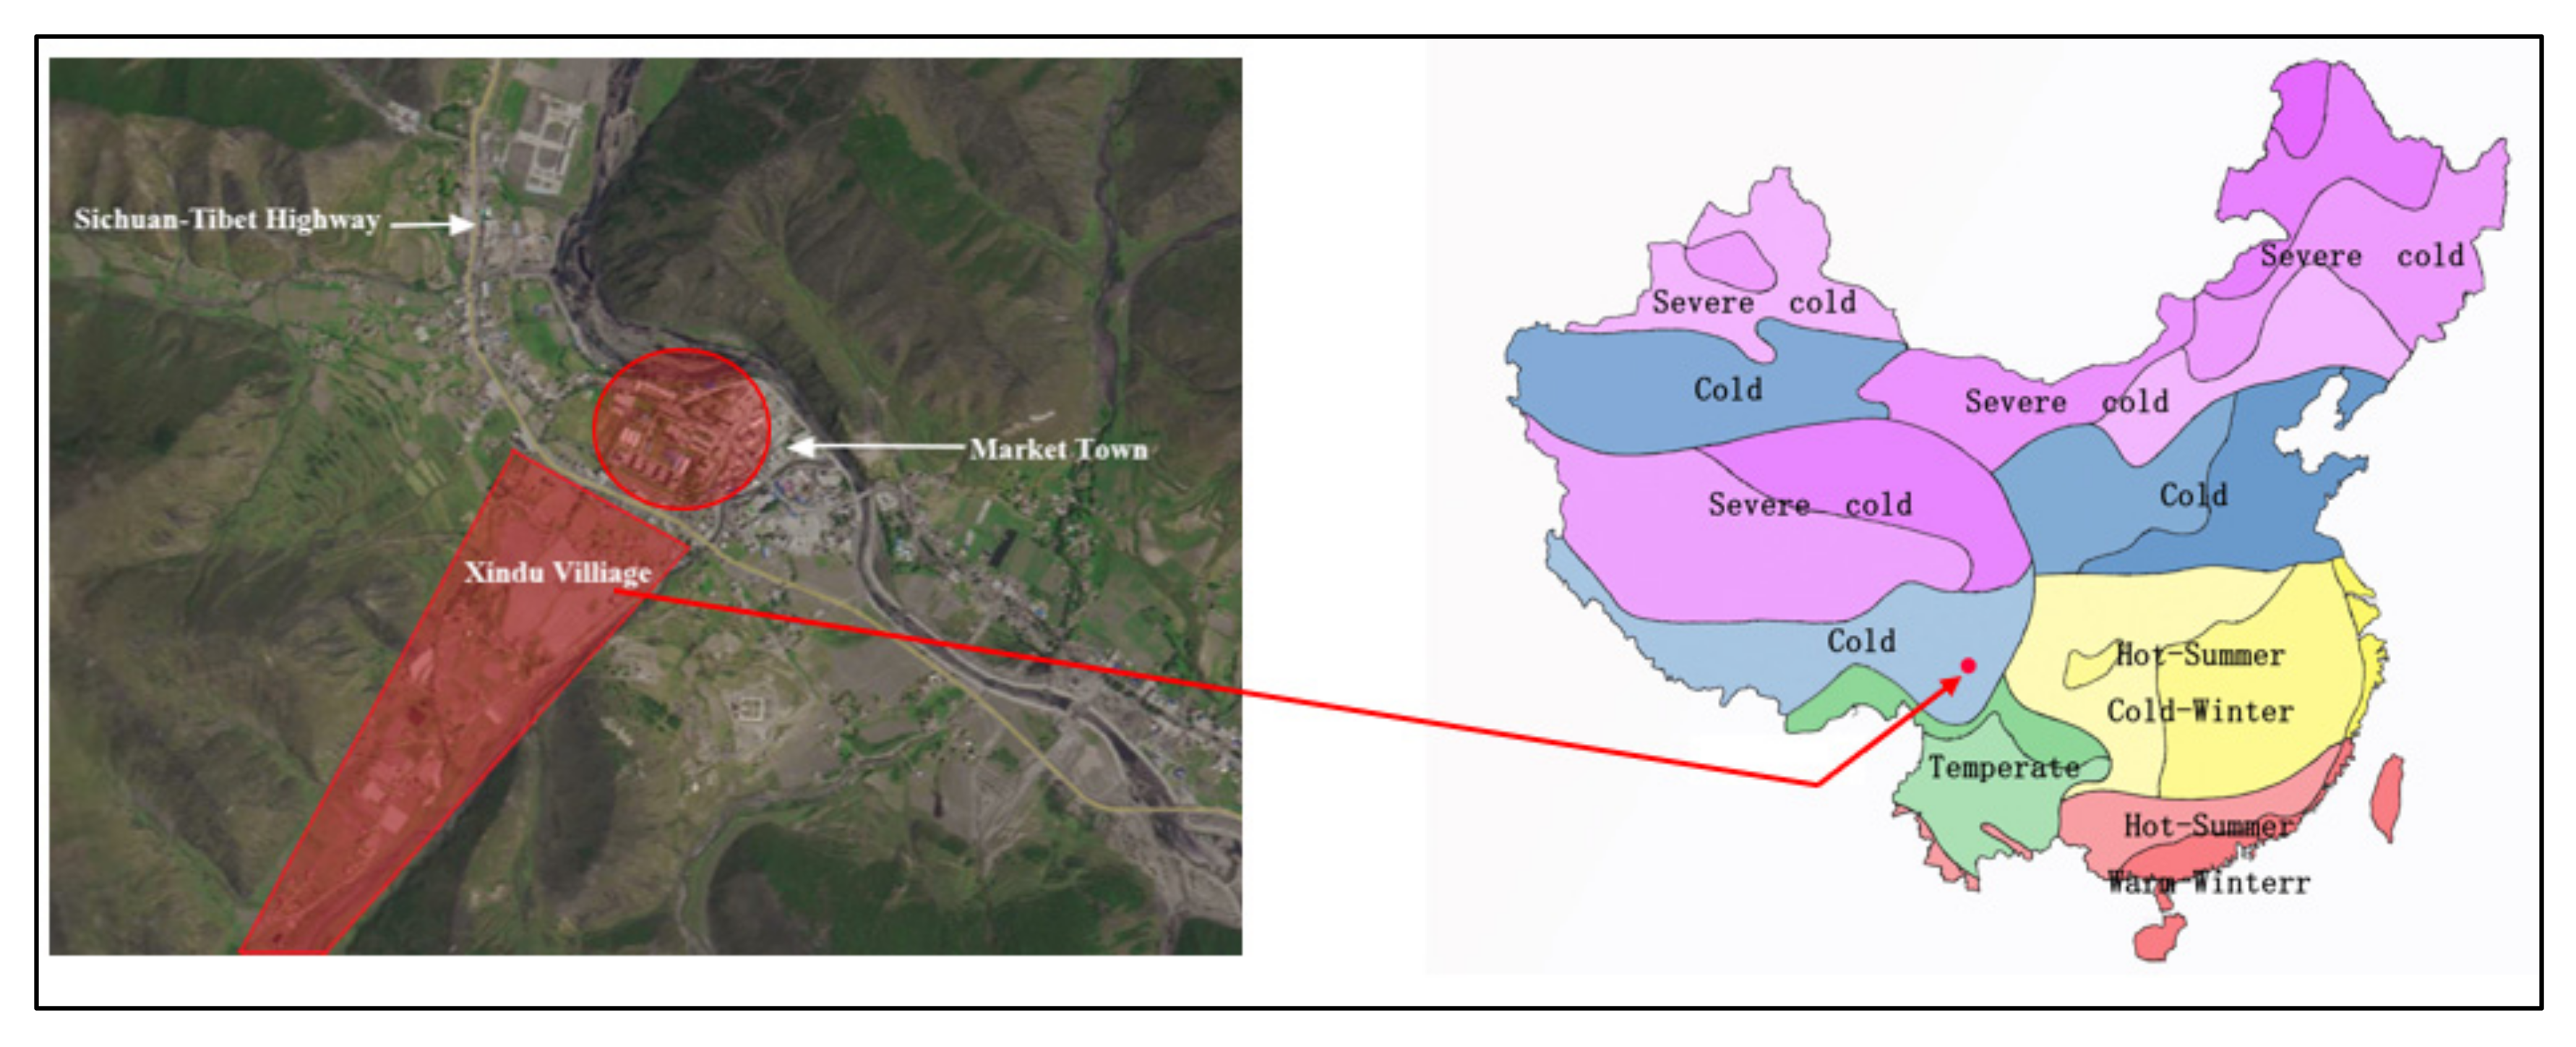
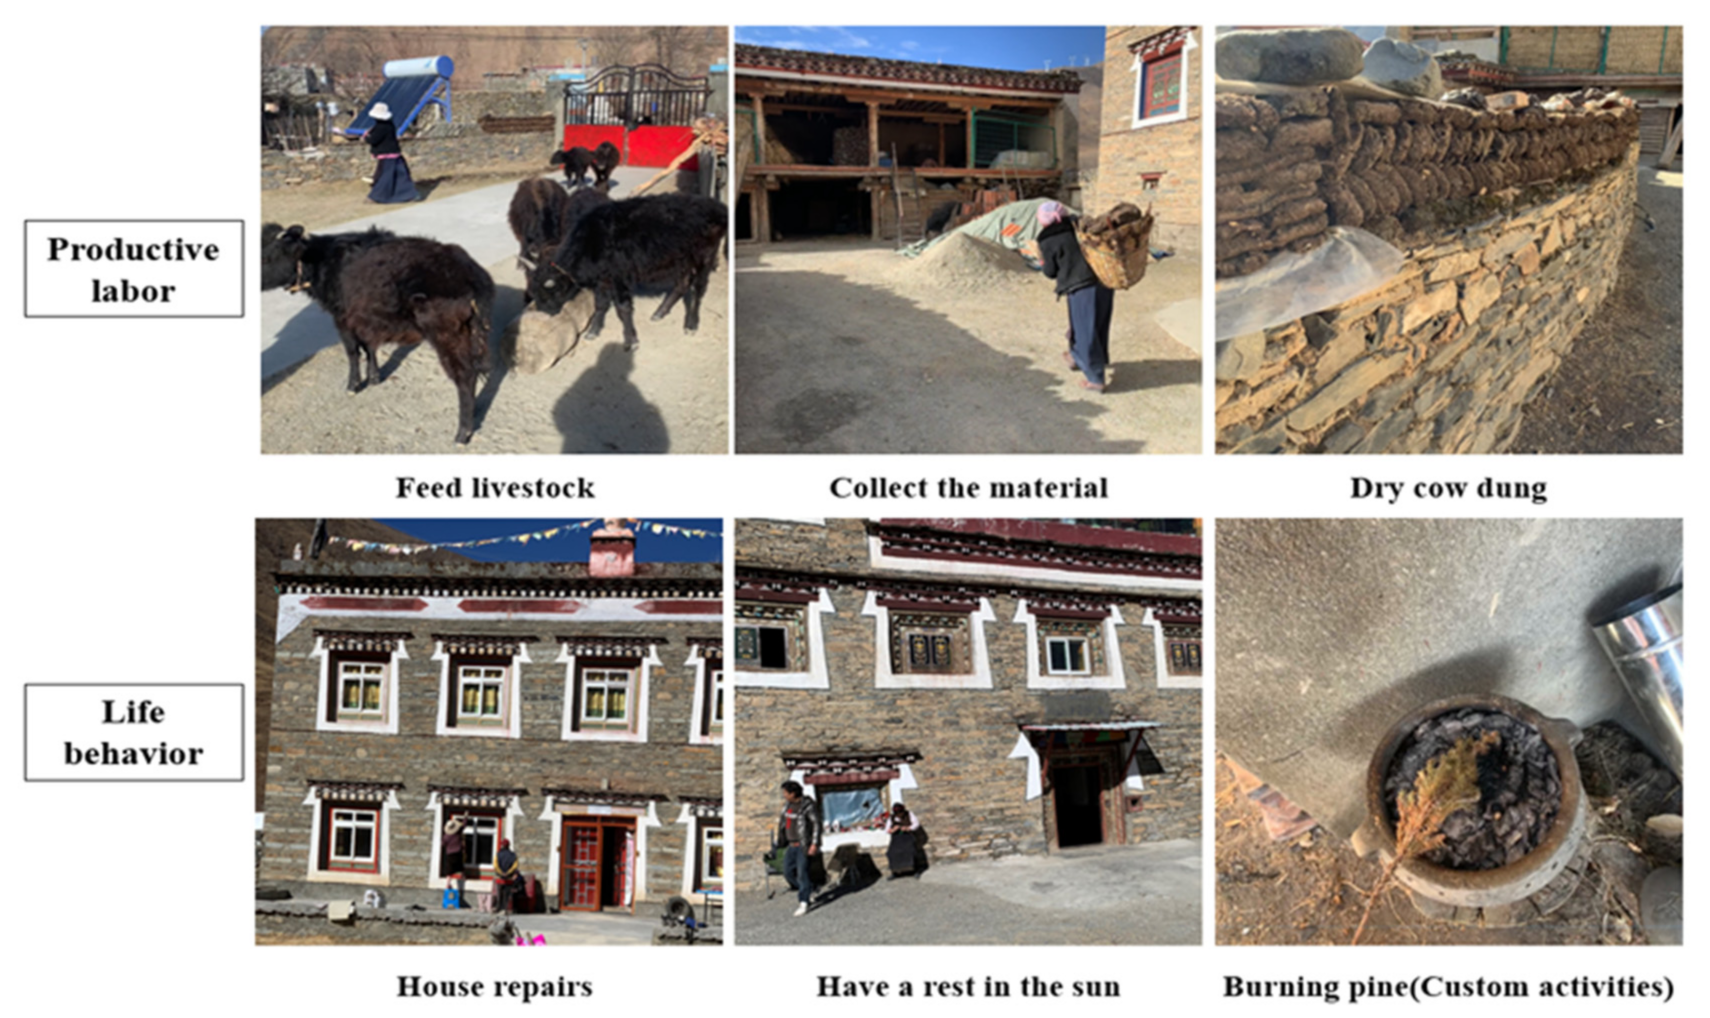
1]. China has a vast territory and a large population. The geographical and climatic characteristics of the different regions have influenced the building designs. China has the highest plateau in the world—Tibet Plateau, Western Sichuan is part of the Qinghai–Tibet Plateau, people living here build stone houses and passive courtyard designs to meet the needs of production and living. The stone blockhouses and passive courtyard designs allow local residents to adapt to the plateau climate without relying on air conditioning and other equipment. This climate informed the need for the designs to cater to the theme of the energy-saving era and the reduction in emissions. As an important transitional space for activities, the courtyard is often overlooked. However, the quality of the thermal environment created by the different courtyard layouts varies, and these easily overlooked details affect the daily activities of the residents. With the continuous development of building science, the methods of studying the thermal environment and microclimate characteristics of buildings are also constantly improving. Presently, they mainly include software simulation, on-site measurements, and satellite remote sensing. Among the three methods, the satellite remote sensing method is more suitable for studying large-scale environmental and climatic characteristic-like cities. Therefore, most of the current research on the built environment and climate are based on simulation and actual measurement. Although software simulation can save time and manpower, the authenticity of the simulation conditions is still questionable. Therefore, the measured data can reliably reflect the changes in the climatic environment and increase the accuracy and reliability of the conclusions drawn from the study.
Ratti used a computer to analyze the sky view coefficient, illumination, and shadow area of various architectural designs as early as 2003, and discovered that from an environmental perspective, in arid climates, the layout of the courtyard can result in the maximization of land usage, and this would lead to the creation of a comfortable environment and hidden space while reducing energy consumption, also providing residents with good lighting, natural ventilation, and heat [2]. Zahra Zamani summarized the thermal function and microclimate of a courtyard for many years. Findings showed that the influence of the components of a courtyard design on the thermal performance under climatic conditions includes three main aspects: sunlight, natural ventilation, and temperature and humidity [3].
Firstly, in terms of sunlight, Mohammad Taleghani compared five different housing designs and concluded that in the summer, when the temperature is hot, the layout of the courtyard can best meet people’s comfort requirements [4]. Eduardo Diz-Mellado established an adaptive model of courtyards in Spain by monitoring the thermal environment and the thermal comfort of two courtyards under two different thermal conditions in Spain, expanding the concept of thermal comfort research in semi-outdoor spaces [5]. Hassan Akbari selected ten indigenous courtyards in Iran’s hot and arid climate, and analyzed them with Autodesk Ecotect software, and concluded that the adaptability of courtyards in this area is better in the summer than in winter [6].
The second is the effect of courtyard ventilation on the internal thermal environment of the courtyard. Most studies on courtyard ventilation are related to the ventilation of the overall environment of the city and the indoor thermal environment. Yafeng Gao et al. conducted a field survey in a university to study the urban wind environment according to different building enclosure designs. Among them, the main influencing ventilation factor in courtyard design is the combined form of the building. Because the courtyard of the experiment site is not tightly enclosed, the wind direction and wind speed in the layout of the courtyard design are mainly affected by the gap [7]. Yanga Li and Xiaodong Liu et al. used CFD simulation methods to study the parallel courtyards on the campus. They simulated the internal wind environment of the courtyards under different ratios of height and width, and proved that the best aspect ratio of a single parallel courtyard is within the range of 1~2 [8]. Kindah Mouslia took Damascus’ courtyard building as the object and concluded that the actual opening of the courtyard has the greatest impact on the ventilation of the courtyard, especially in hot and dry climates [9]. Daniel Micallef used the CFD model and simulated that the ventilation rate of the internal openings of the enclosed courtyard increases with an increase in the height of the courtyard [10]. Studies on courtyard ventilation appear to be mostly focused on the reduction in temperature and the enhancement of the ventilation, while the research on courtyard wind environment in cold areas pays more attention to wind shielding to ensure the stability of the wind environment inside the courtyard, to achieve the optimal heating effect.
The most direct indicator of thermal environmental conditions is the temperature and humidity, which are also the salient factors affecting the thermal comfort of individuals. Different regional climates have a great influence on the temperature and humidity of the region. In addition, people in different climatic regions differ in their acceptance of what constitutes outdoor temperature. Furthermore, the availability of measuring instruments and their evaluation methods in various regions during research also play an important role [11]. For example, An Le and Bo Hong used the same meteorological measurement methods and questionnaires to compare the thermal comfort of the outdoor spaces in three representative cities in cold regions, and an acceptable temperature deviation [12]. Nazanin Nasrollahi used ENVI-met to simulate the thermal comfort performance under different configurations and combinations of traditional Iranian courtyards in hot and arid areas, and found that the most effective parameters affecting the thermal comfort of courtyards in this area are the mean radiation temperature and wind speed [13]. Xiaodong Xu et al. evaluated a courtyard building in China’s hot summer and cold winter area using fluid mechanics CFD, and simulated the design with the energy simulation software DesignBuilder, which confirmed that the adjustment of the courtyard layout and the combination of the aspect ratio, and the establishment of an ecological buffer zone will lead to the maximization of the benefits of coordinating courtyard microclimate in the winter and summer [14]. Wenheng Zheng conducted a field survey on the thermal environment characteristics of the traditional Chinese Hakka Tulou courtyard, and determined the advantages of the Tulou courtyard under the local climatic conditions. Moreover, he posited the shortcomings like insufficient lighting [15]. Besides the three aspects above, the unique climatic characteristics of the cold plateau areas are also pertinent factors affecting the thermal environment of the courtyard. For example, according to the thermal comfort survey conducted by Wei Yu et al. on the Qinghai–Tibet Plateau, the local residents built stone houses to withstand the extreme climate and adapted to the local climate by drinking butter-sweet tea and wearing thicker traditional Tibetan clothes [16]. Lili Zhang and others found that the locally-built stone houses can account for temperature differences of about 24 °C between indoor and outdoor during the day based on the summer thermal environment survey on the Northwest Sichuan plateau [17]. This shows that the locally built stone buildings can adapt effectively to the climate of the area. These studies have comprehensively demonstrated the harsh climatic characteristics of the cold plateau areas; however, these studies were focused on the indoor temperature, with rare research cases. Furthermore, there is a lack of publicly measured data on the thermal environment of the courtyard under cold plateau climatic conditions. The simulated research on the thermal environment of the courtyard by López-Cabeza, V. P. and others also proved that there is a certain deviation between the simulated outcomes and the actual parameters [18]. Therefore, given the harsh climatic conditions on the plateau, it is pertinent to conduct field surveys rather than simulation experiments to investigate the thermal environment of the local courtyard. This research will help in confirming the adaptability of the local courtyard design to the local climate conditions, and uncover the shortcomings in the layout of the courtyard and propose actionable insights on the appropriate courtyard design. Furthermore, it expands the research on the thermal environment of the courtyard under different climatic regional conditions and provides a reference for other climate response designs under similar geographical and climatic conditions.
This study uses two field measurement procedures and statistical data analysis to study the thermal environment of the courtyard in cold plateau areas. This method has been proven to be reliable in outdoor thermal environment research [19]. Due to the complexity of the cold plateau areas, the selection of experimental subjects and the data collection process will be elaborated in Section 2. 
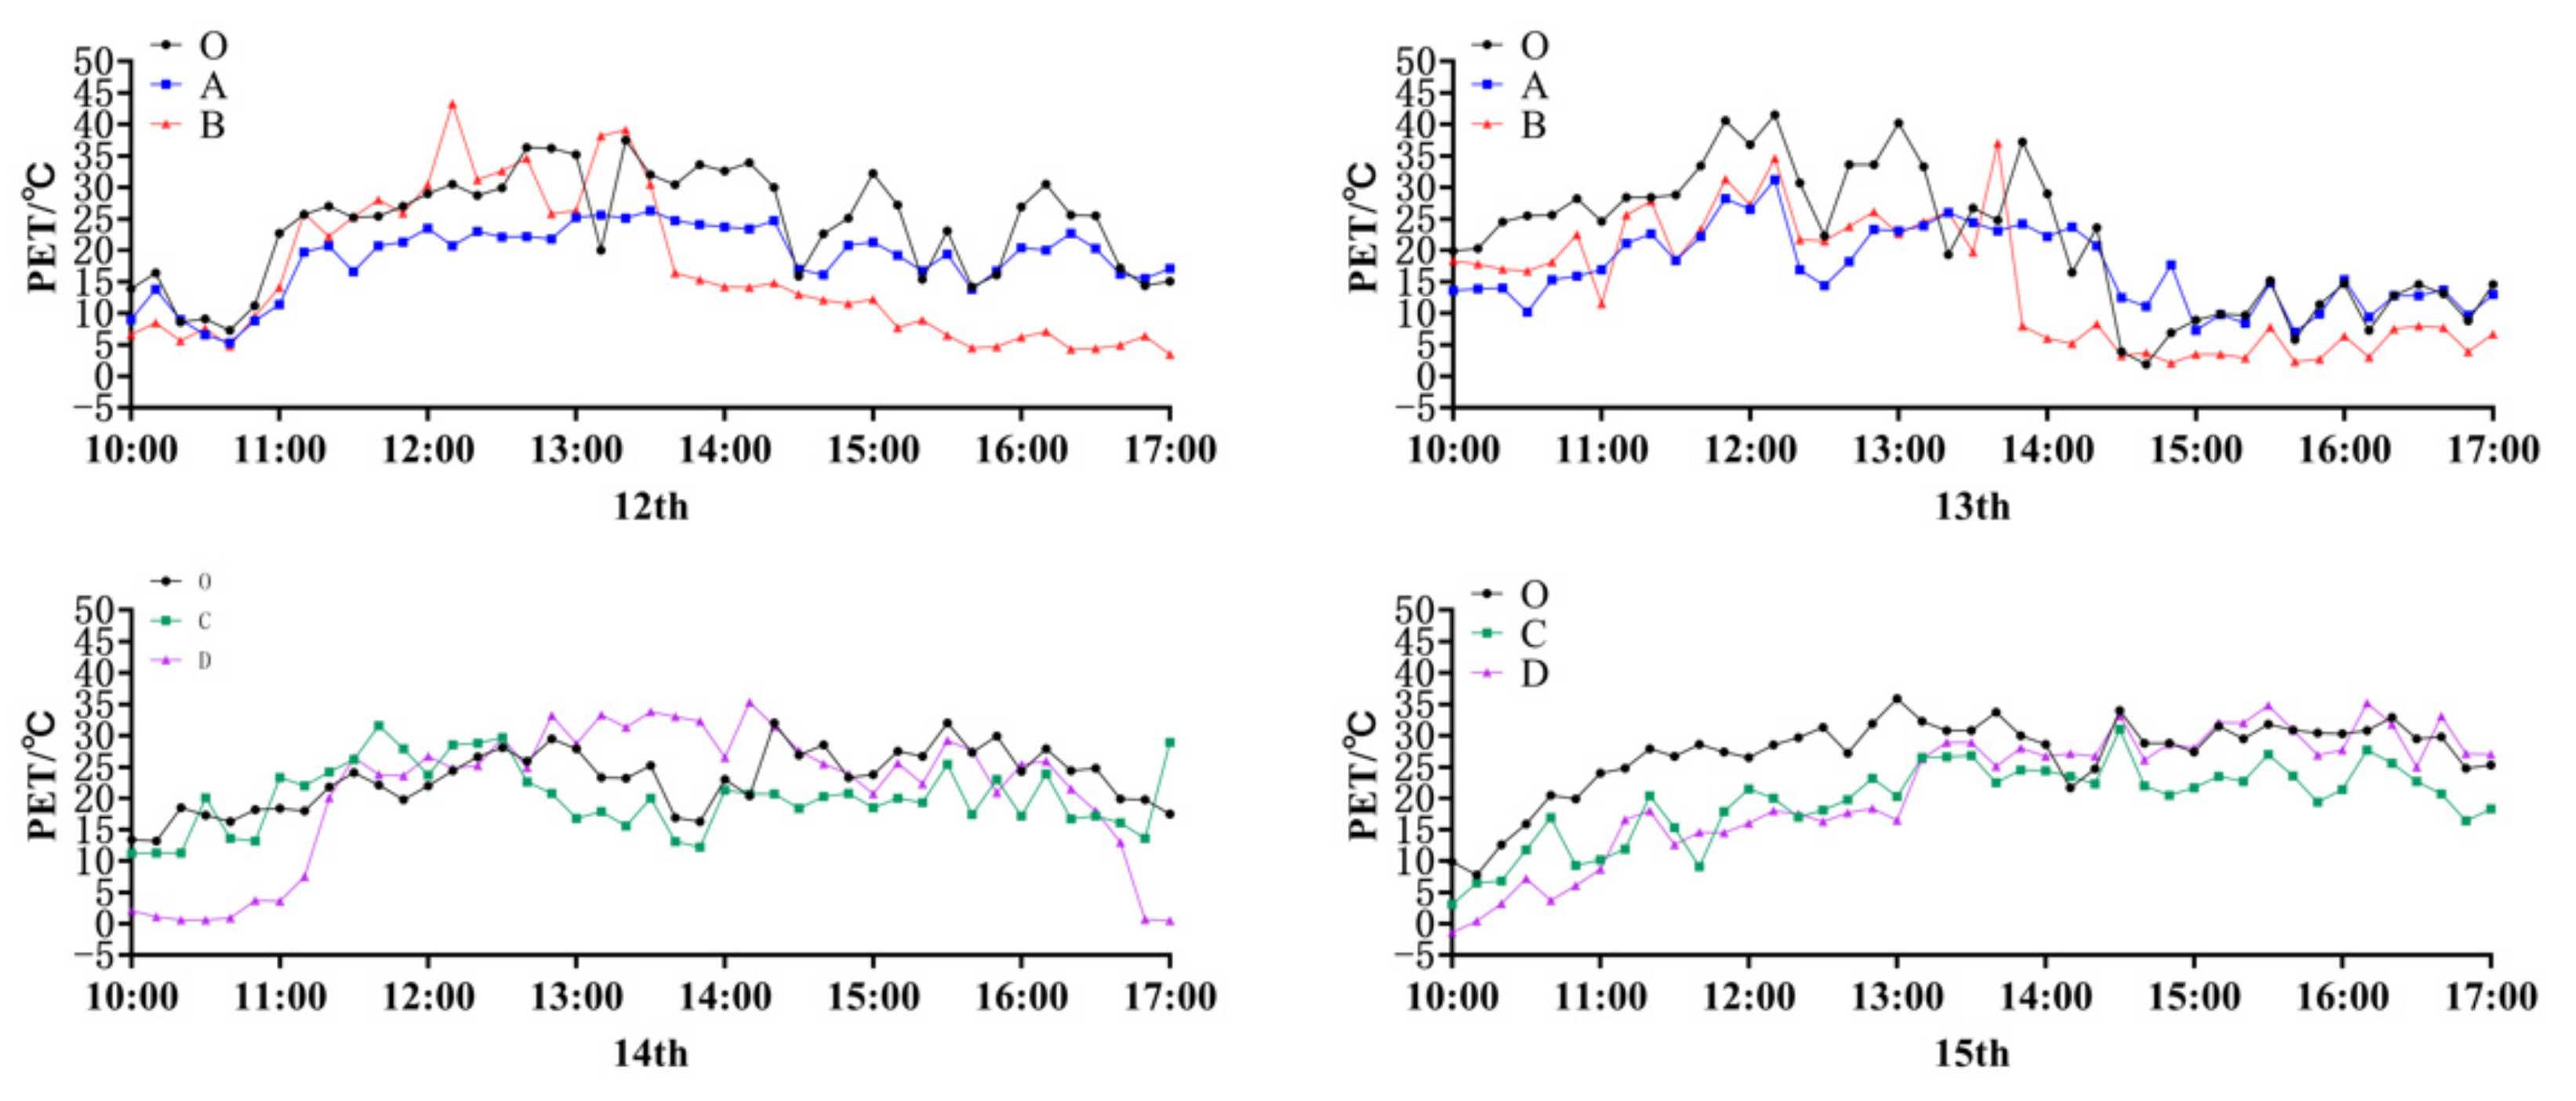
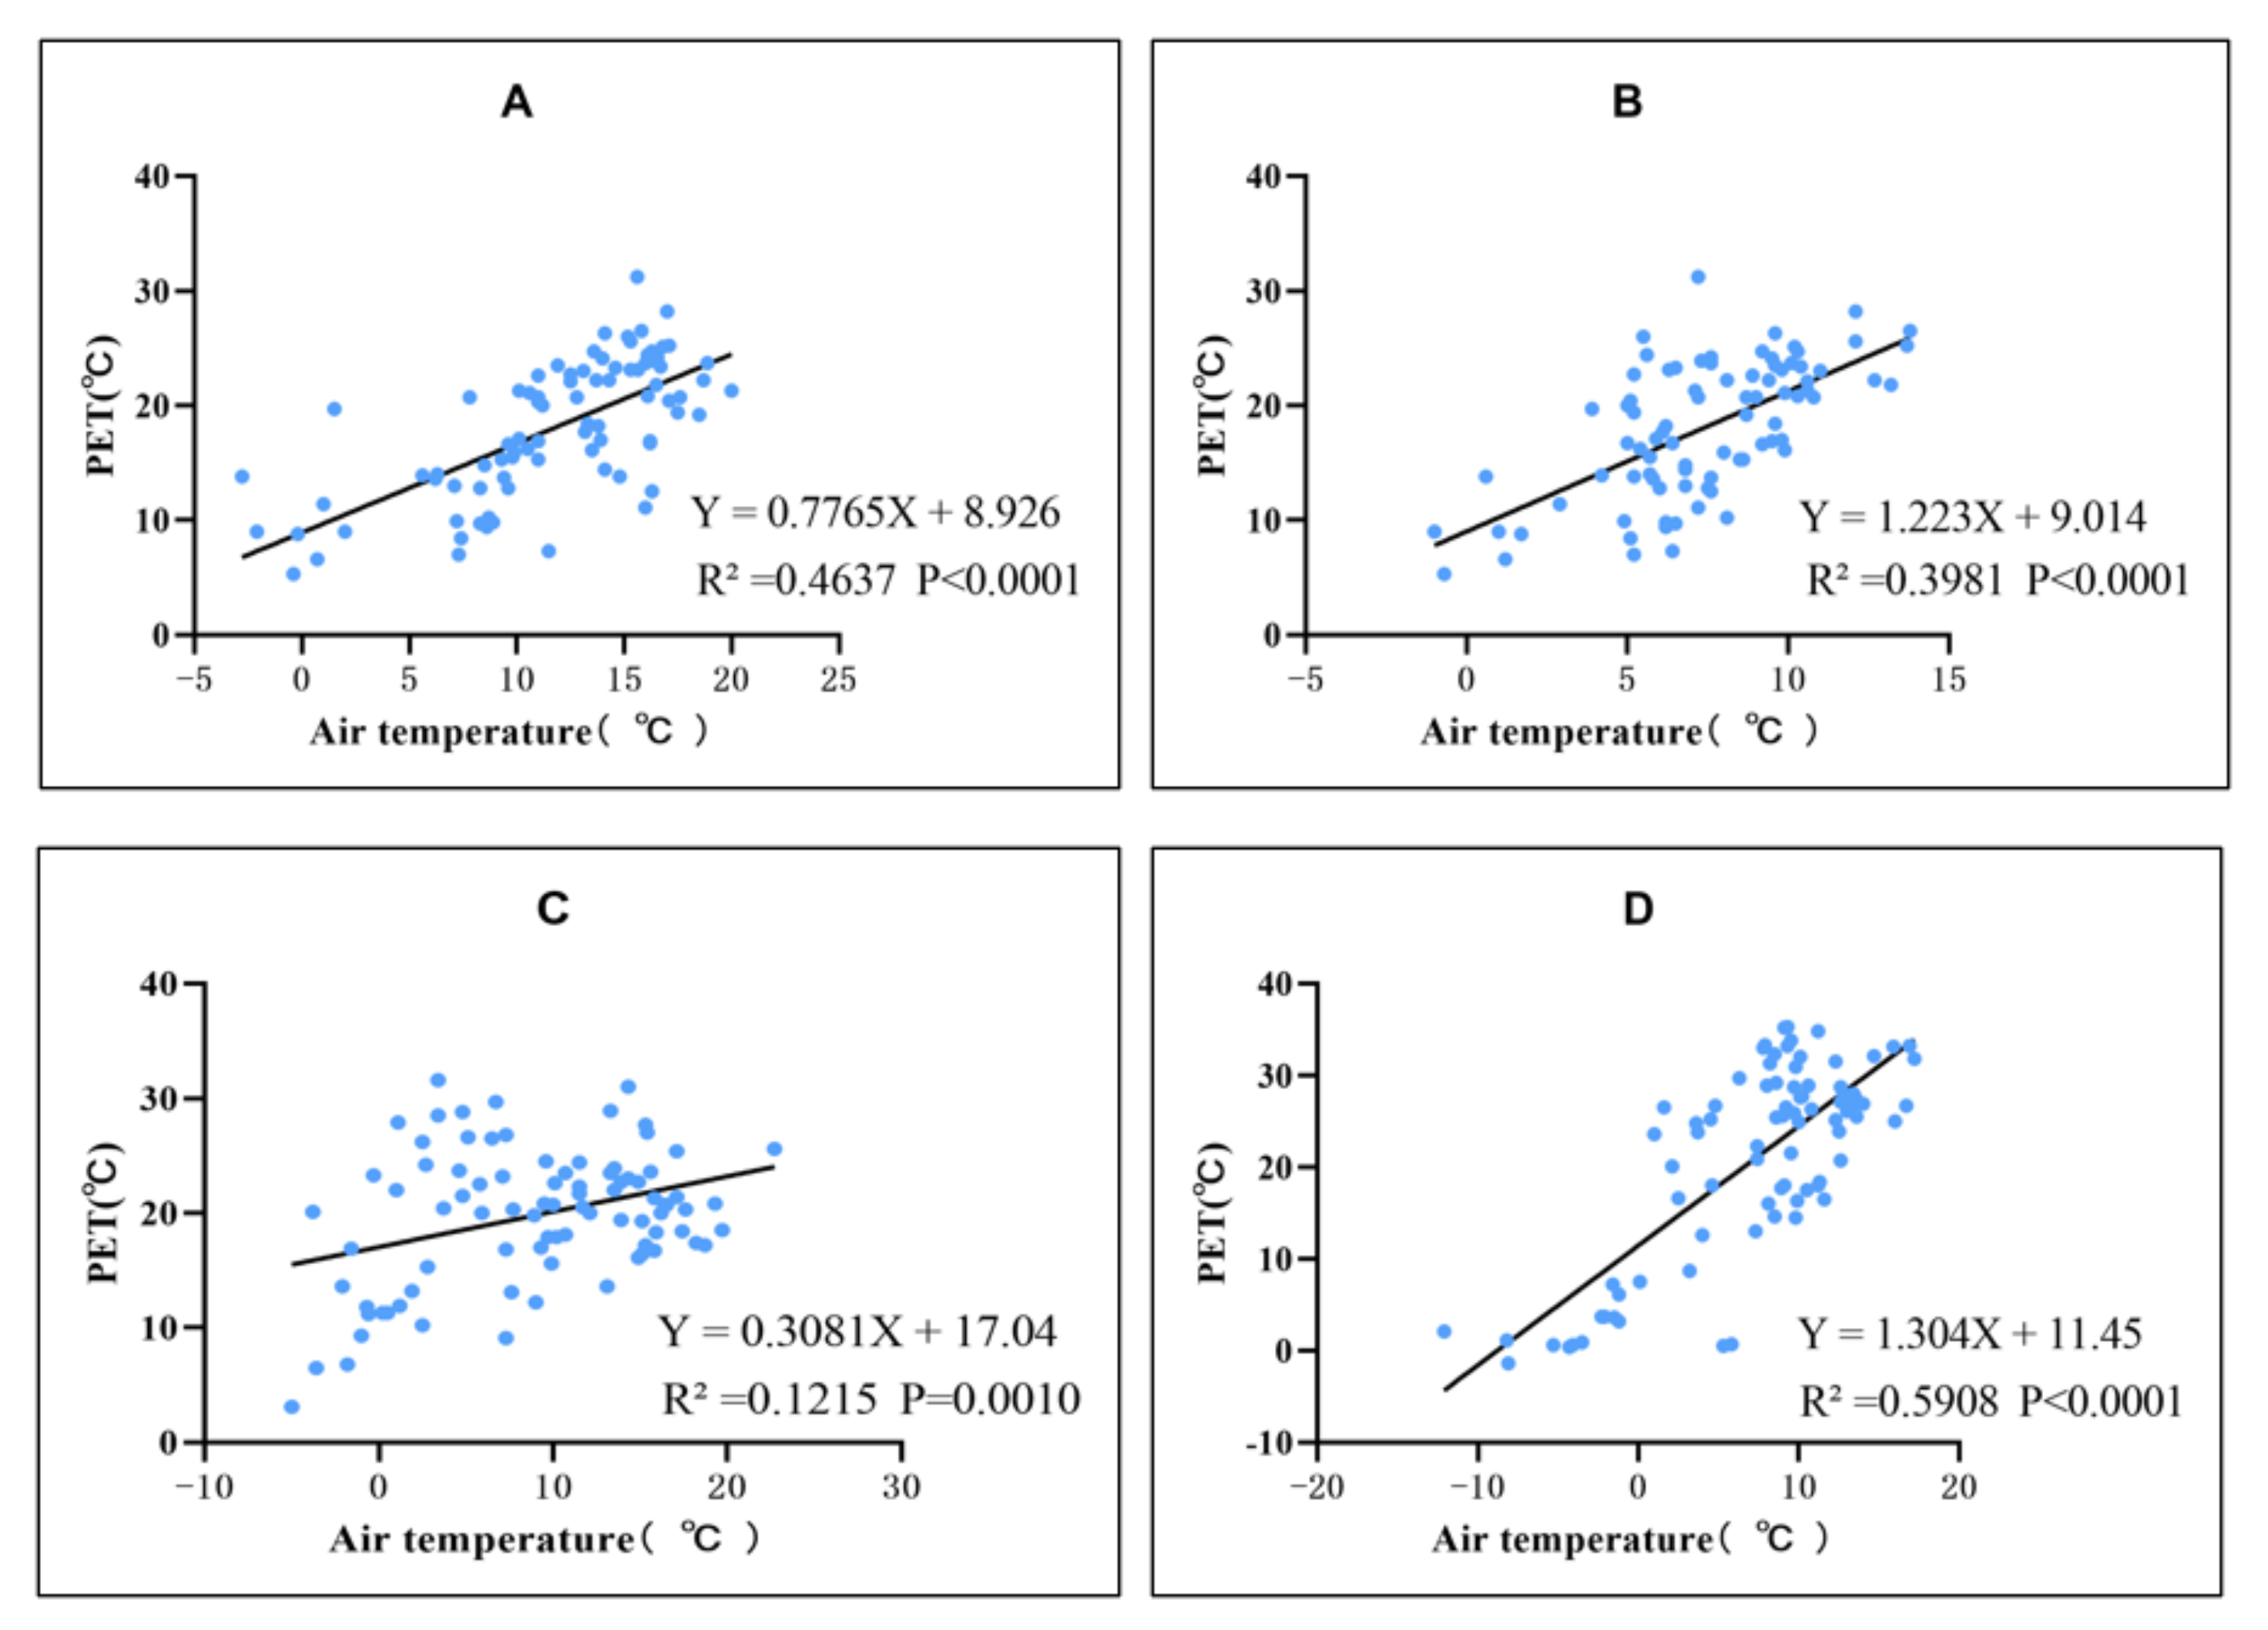
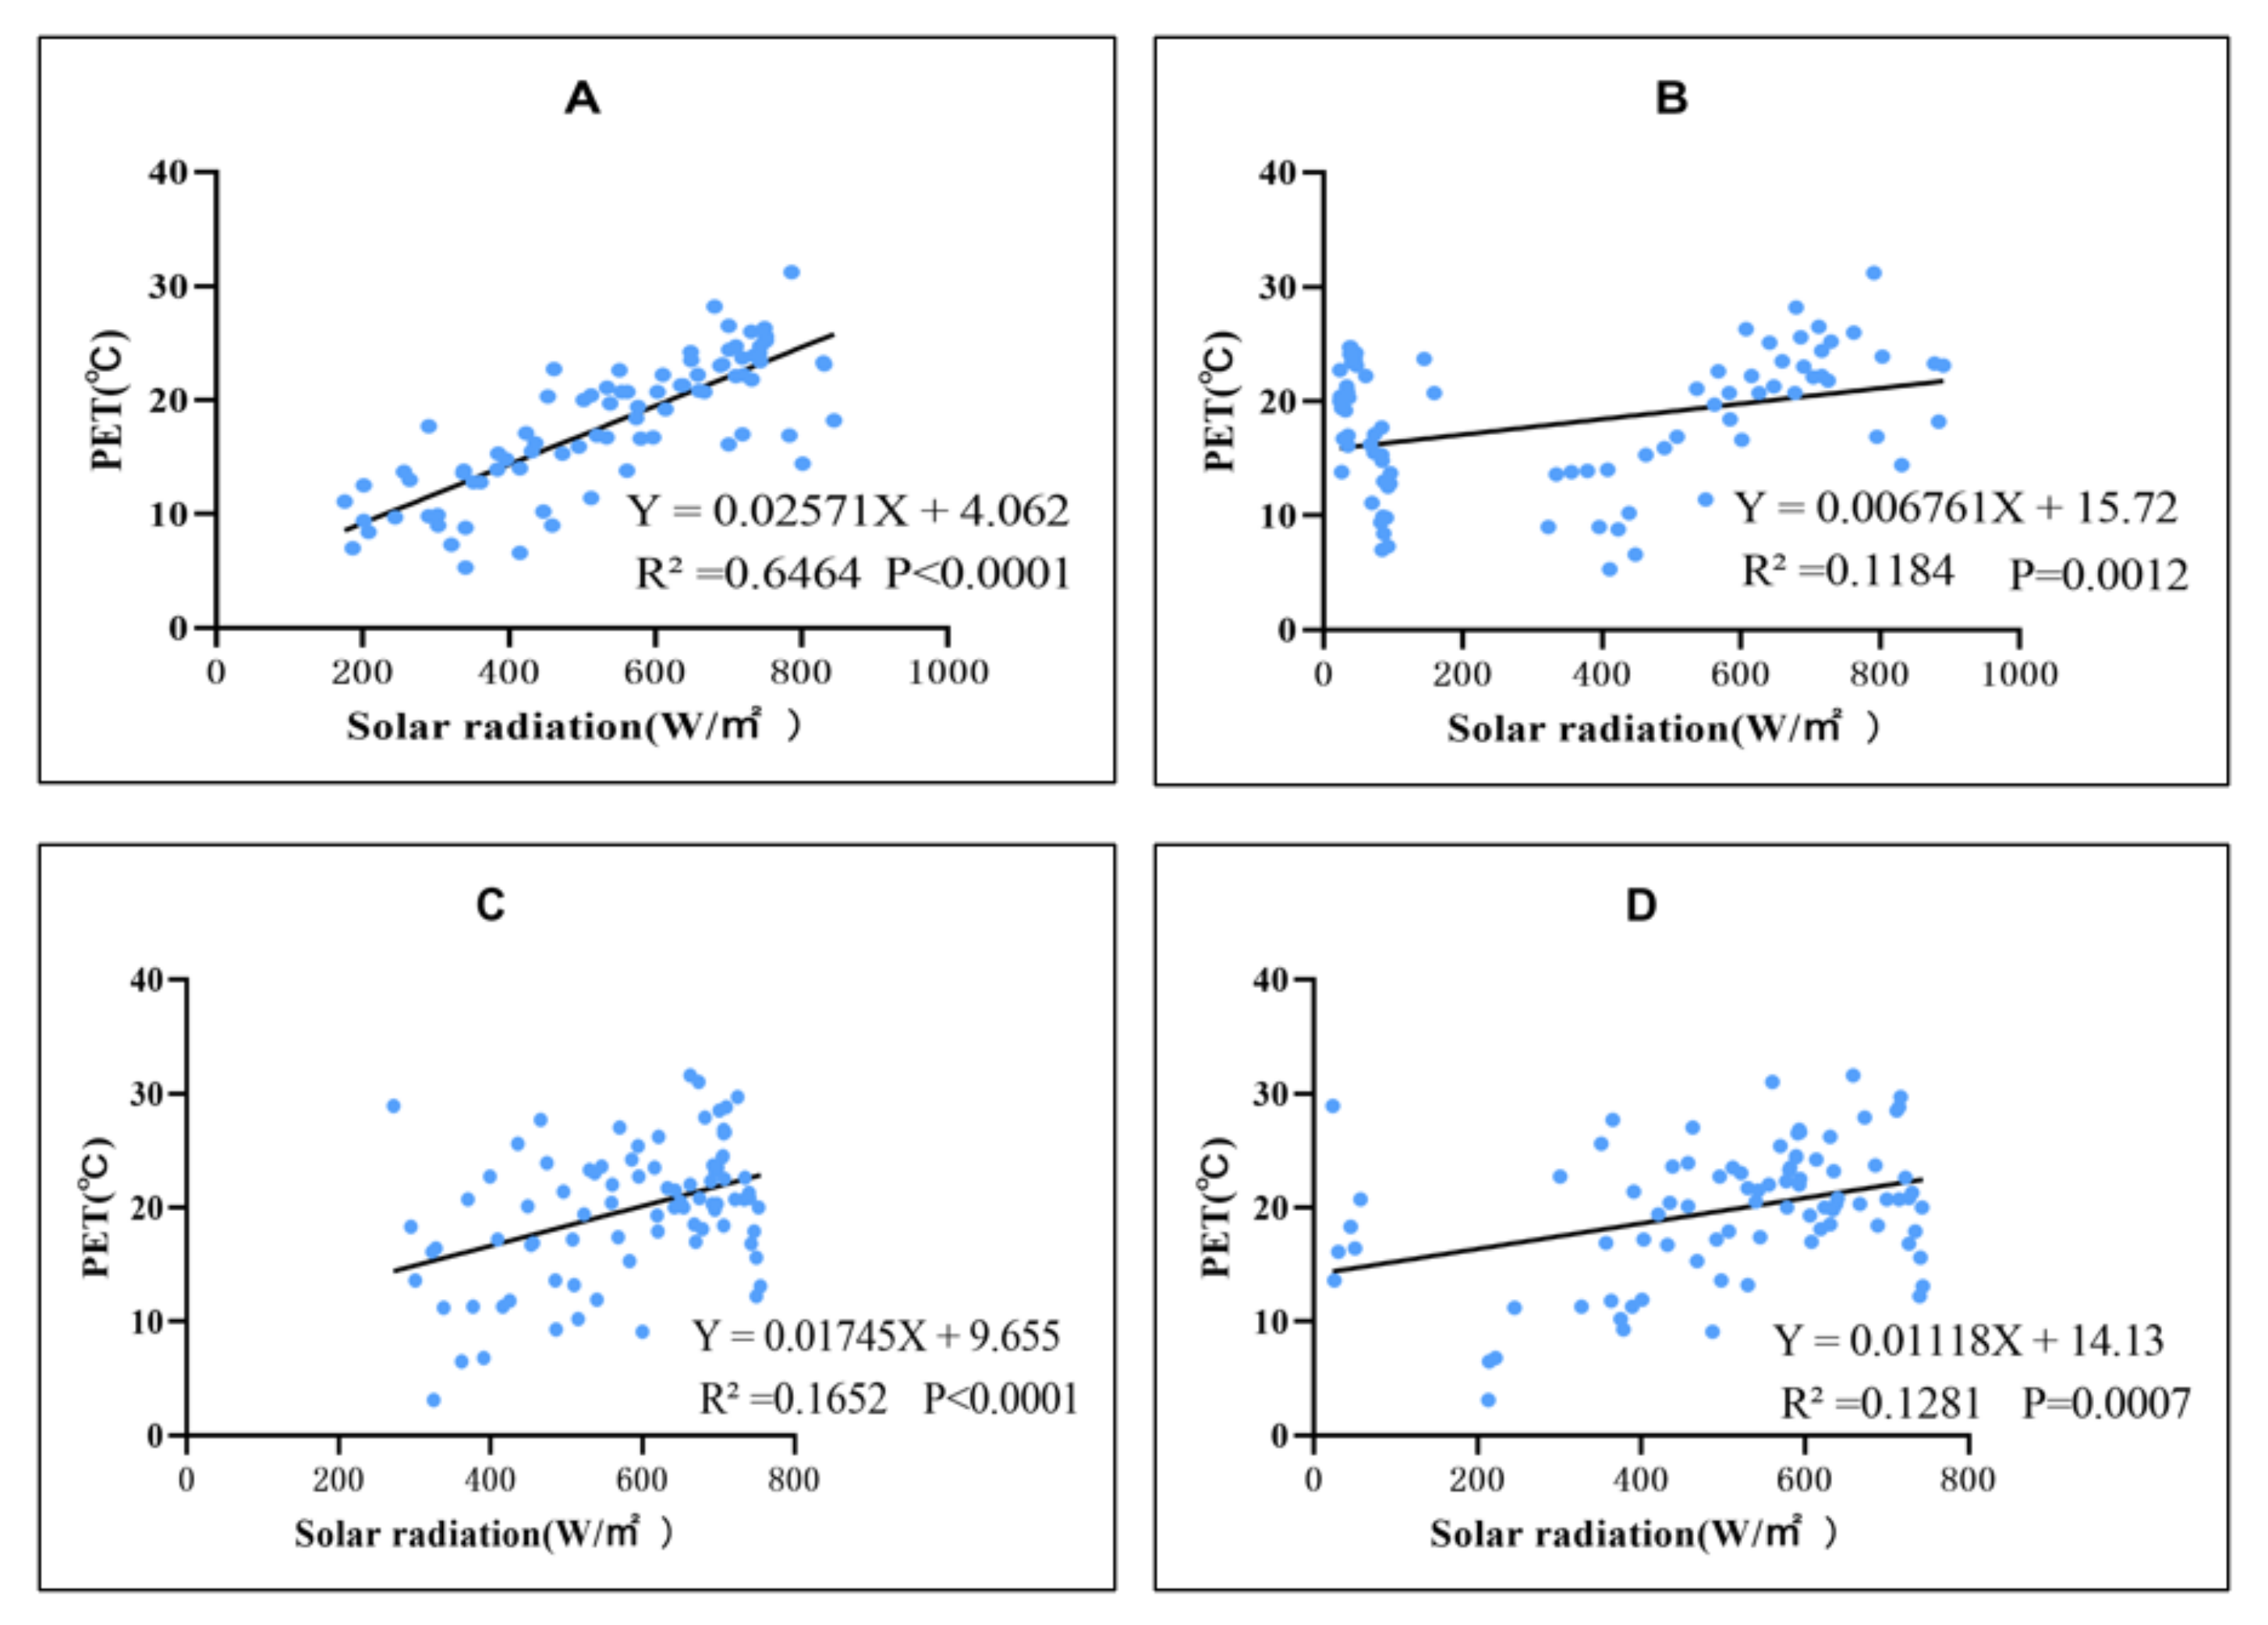
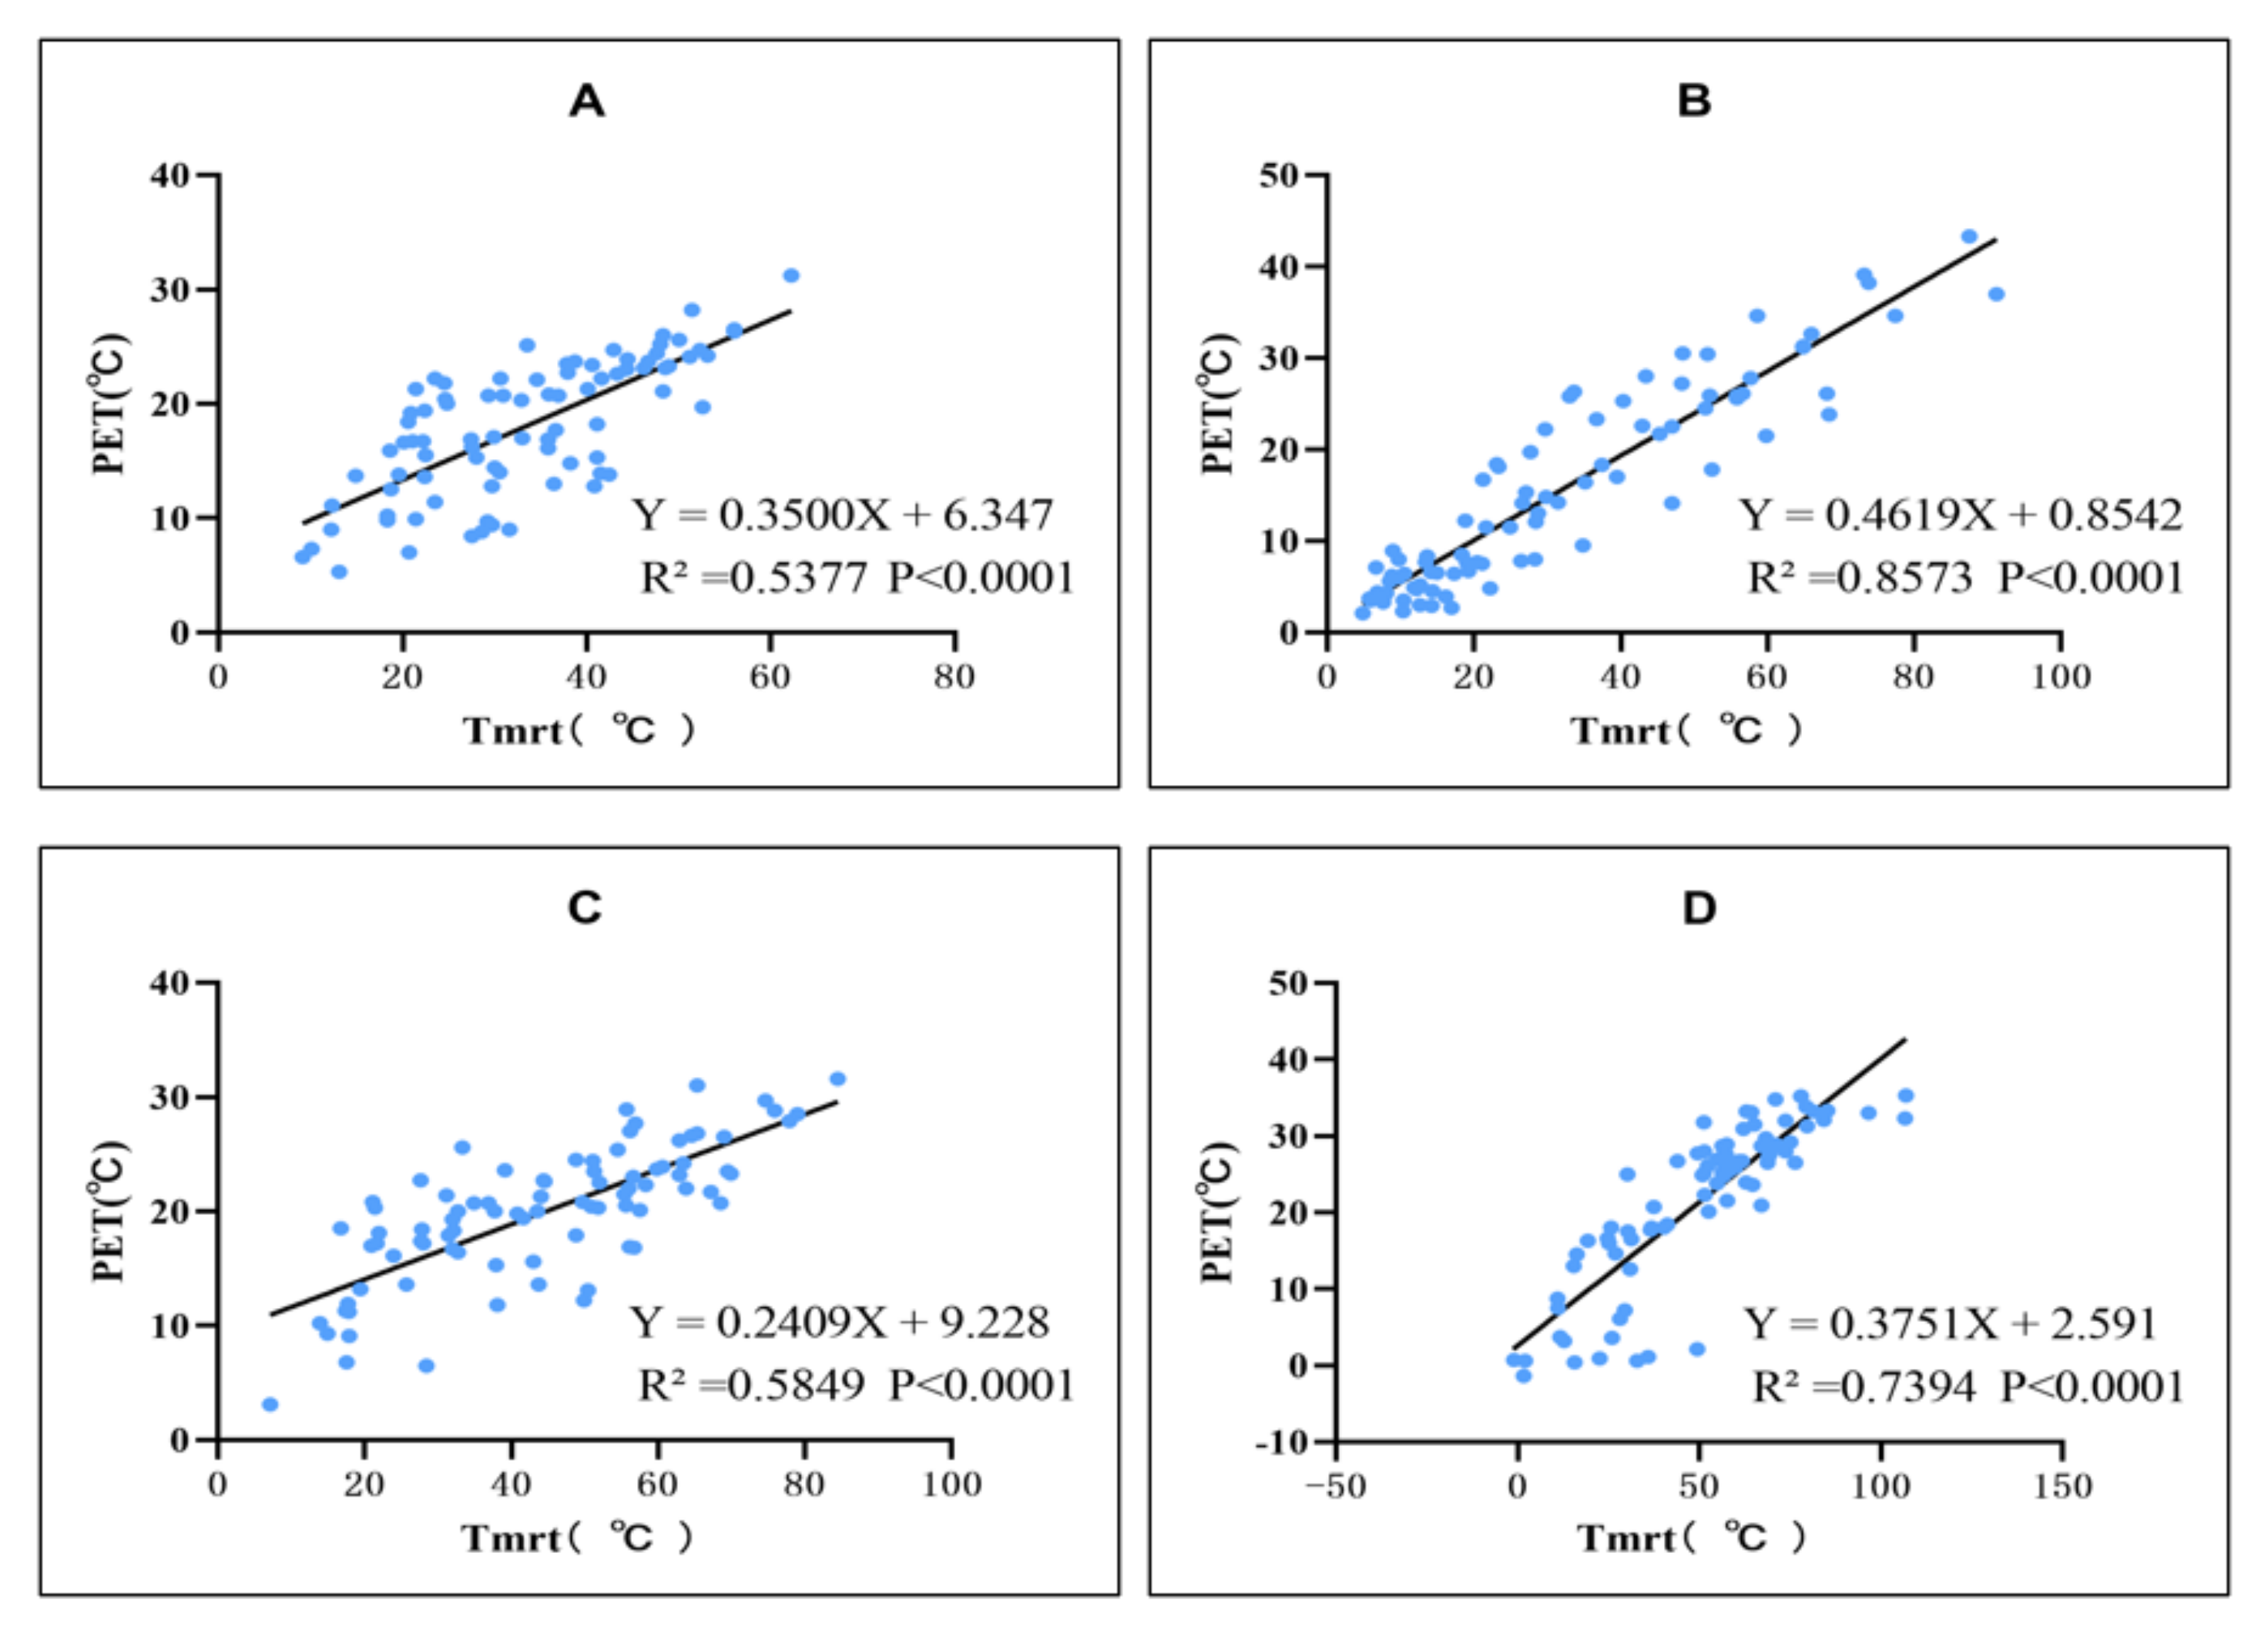
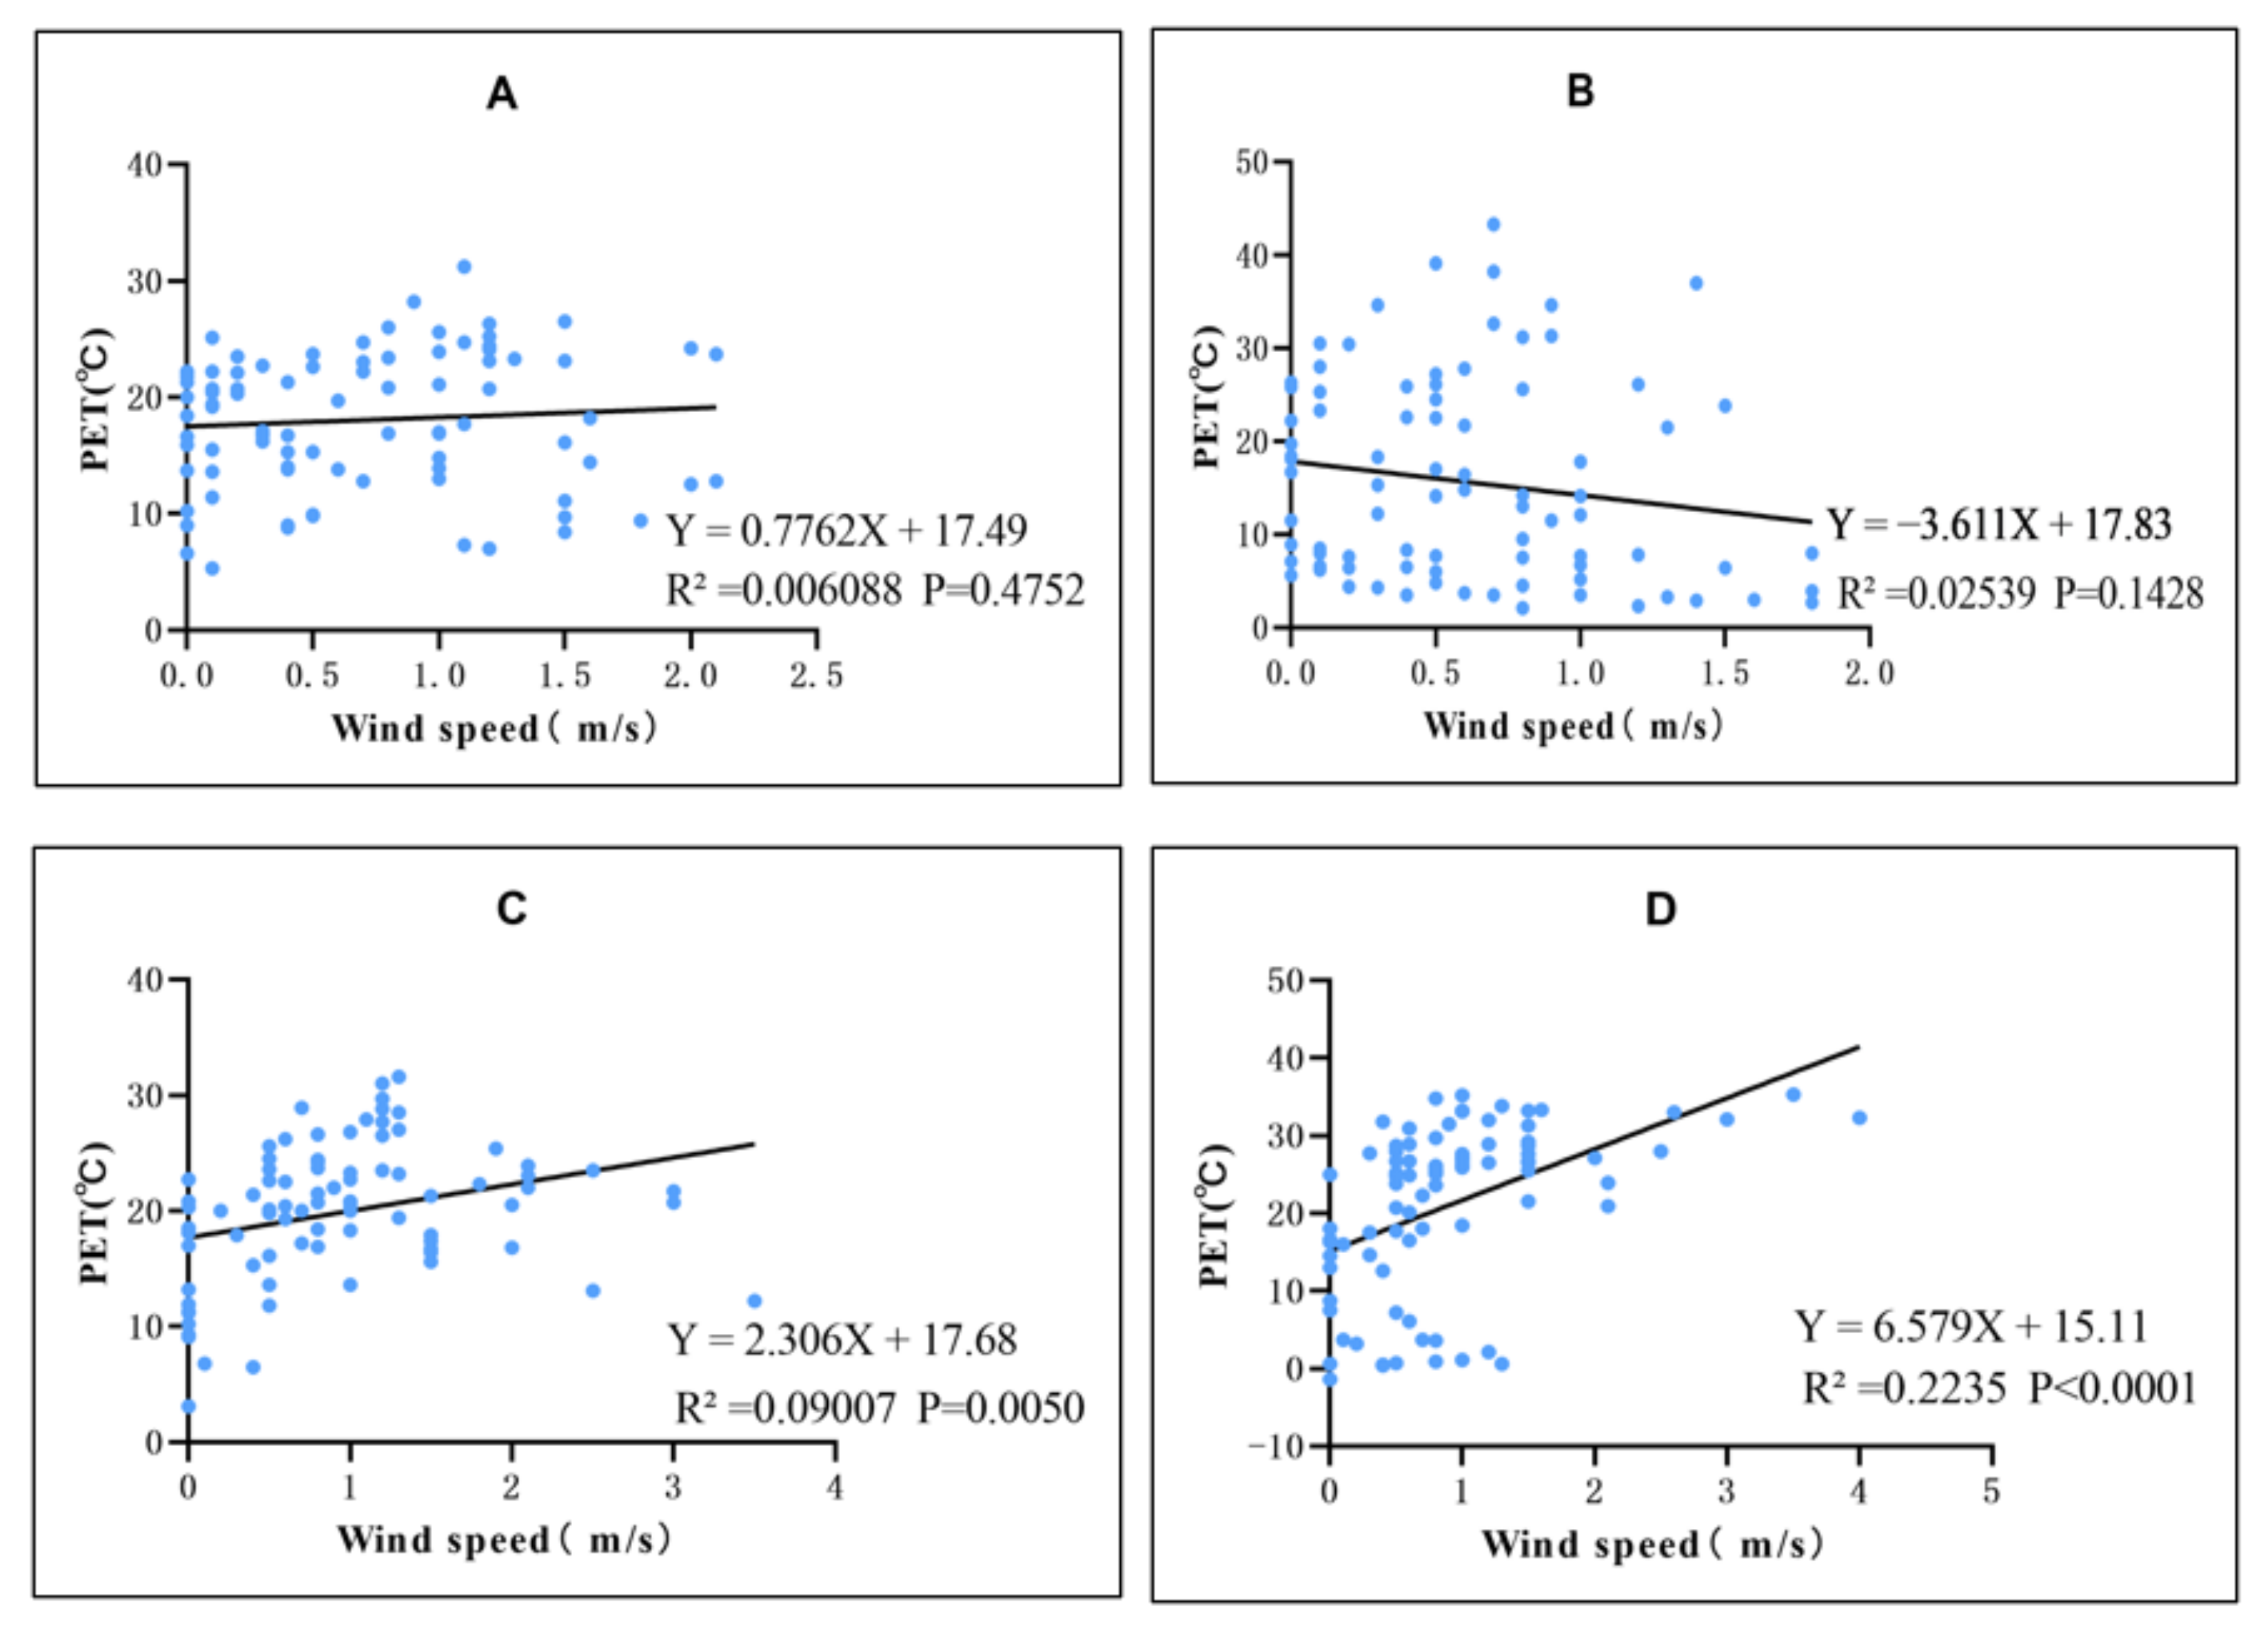
Section 3 presents the descriptive statistics and the calculation of the mean radiation temperature (Tmrt) and the thermal comfort index (PET). Furthermore, the correlation analysis between the PET and the related environmental parameters was computed. The numerical comparison analysis is fed back into the layout design, and the relationship between the layout and the related environmental parameters were discussed. The fourth section discusses the research results and compares them with existing research results, and finally, the fifth section provides the conclusions drawn some actionable recommendations.
The main contributions of this actual measurement research are as follows:
  • The comparison of measured parameter data and the feasibility of passive courtyard design as a climate response strategy in cold plateau areas was determined.
  • The salient environmental parameters affecting the thermal environment of traditional courtyards in cold plateau areas are determined using correlation analysis.
  • Actionable recommendations were proposed based on the influencing environmental factors and the layout of the courtyard design.

2. Research Objects and Methods

2.1. Location Conditions and Climate Characteristics

The western part of Sichuan Province is part of the Qinghai–Tibet Plateau, which belongs to the plateau area, and the geographical conditions are very complicated. The altitudes of various regions in the region fluctuate between 500 and 5000 m. Therefore, most of the towns and villages are under the terrain of high mountains and valleys, which are connected in series by highways. Most cities and villages in the western part of the province rely on the surrounding layout of the Sichuan–Tibet line. The distance between towns and villages and roads also differs. Villages a little farther from the highway have more traditional architectural styles, while towns closer to the highway are influenced by urbanization, and their architectural forms and lifestyles are more modern. The transformation of production methods and the use of modern electrical appliances have gradually reduced the functionality of the courtyard. However, compared with the cities and towns close to the highway, a considerable number of villages are located farther from the highway. A series of human activities such as raising livestock, storing fodder, planting fruits and vegetables, and entertainment and leisure in the courtyard make the yard still a valuable part of the villages. The mainstream architectural layout in the interior, and courtyard thermal environment is the main research object of this article.
The location of Xinduqiao Town is located at an average altitude of 3500 m. It is a typical plateau in the complex geographical environment of Western Sichuan. The town is a well-known accommodation spot on the Sichuan–Tibet Highway. There are numerous homestays along the road. The population is relatively concentrated and there are many villages of different sizes scattered in the town. The architectural styles of these villages are unified, and the courtyard features are clear; according to the determined architectural design zoning of China’s national climate classification, the town is located in a cold area. The selected actual measurement object, Xindu Village, belongs to Xinduqiao Town, but it is a certain distance from the Sichuan–Tibet Highway. The characteristics of the courtyards in the village are similar to those of the surrounding villages, and it retains the traditional production and lifestyle. Compared with other villages in the territory, Xindu Village has a larger number of households and buildings, and has certain advantages in quantitative research. In summary, the research object meets the research requirements of this thermal environment survey in terms of topography, climate, location, and courtyard characteristics (Figure 1).
Xinduqiao Town is located in Kangding City, Ganzi Prefecture, Sichuan Province. According to the data form the local Meteorological Bureau, the average change in temperature in the past three years was selected (Figure 2). The monthly average outdoor temperature in this area varies from −15 °C to 21 °C within a year. The highest monthly average temperature in the year is July (29.2 °C) and August (27.4 °C), the minimum average monthly temperature is in December (−8.7 °C) and January (−6 °C). The average temperature is below 10 °C for about half of the year, and the cold winter climate lasts for a long time; hence, this study on the thermal environment of the courtyard was conducted during the winter season. Based on the final date of the local weather forecast, this period was determined from 11 to 15 January 2021. The weather conditions during the actual measurement period were consecutive sunny days; extreme rainy and snowy days were excluded to ensure the feasibility and validity of data collection.

2.2. Resident Activities and Basic Characteristics of the Courtyard

Before the data collection, we conducted a pilot survey and interviews in the village to help understand the basic activities and habits of the residents. In daily activities, the courtyard activities are mainly concentrated in the daytime. This is due to the huge temperature difference between the day and night time on the plateau. The extremely low temperature in the evening means that people have to return to the house to keep warm. Therefore, the measurement of the thermal environment of the courtyard in this study was set in the daytime. The general routine of the residents is to get up at 8:00 a.m., wash in the house, eat breakfast and prepare, and usually start some courtyard activities after 9:00 a.m. After 4:30 p.m., the freely raised yaks are driven back into the yard, and the residents go indoors for dinner. Based on this pattern of behavior in the village, we set the measurement time between 9:00 a.m. and 5:00 p.m. during the day. There are two main courtyard activities during the day: production activities mainly include drying cow dung (as fuel), tidying up forage, feeding livestock, and renovating the land, while lifestyle activities mainly included drying clothes, burning pine and cypress (custom), rest and other human activities (Figure 3).
The picture and recording functions of the Omap satellite map were used to capture the positioning pictures and feature recording of Xindu Village, and the subsequent classification and analysis of the captured data. The results showed that there are 71 existing residential buildings in the village (not including religious sacrificial buildings).
Only one building has no courtyard, and the remaining residential buildings have courtyard walls. Based on the survey results and classification analysis, four representative courtyards were selected for the measurement of the thermal environment, and point O was set in the open and flat area in the center of the village as an outdoor benchmark comparison observation point. The main buildings in all the courtyards are stone blockhouses, and the auxiliary buildings vary based on the actual layout (Figure 4). Based on the basic layout characteristics of the village courtyard, all courtyards can be divided into four types. The courtyard features are as follows:
  • Courtyard A is a standard configuration. The main buildings and auxiliary living rooms are connected, and a vegetable garden is set in the courtyard. The courtyard area is about 500–700 square meters, accounting for 40% of the total number of houses in the village.
  • Courtyard B has a compact layout with a single main building. The main building is close to the annex. The courtyard area is about 70–100 square meters with no vegetable garden. This courtyard layout accounts for about 10% of the total number.
  • Courtyard C is a single-family and detached layout type. The layout of the courtyard features a separate layout for the main building. There is a vegetable garden inside the courtyard. There is no auxiliary residential building. A simple warehouse is built on the courtyard walls with wooden pillars. The area is similar to the residential design of yard A, ranging from 500 to 700 square meters, accounting for about 30% of the total number.
  • Courtyard D is the layout of the old and new buildings in the same courtyard. The courtyard includes two main unconnected buildings. A simple warehouse is arranged between the two buildings. The overall courtyard area is large and the layout is relatively loose. The area is generally 600~1000 square meters, and this accounts for about 15% of the total number.
Based on the classification of courtyard characteristics, this experiment selected four representative courtyards and an outdoor reference point for the comparison and analysis of the actual measurements. During the measurement, the influence of the reflectivity of different materials on the courtyard’s thermal environment, the internal architectural details, and the materials in the courtyard were organized and recorded (Table 1). Table 1 shows that the main building materials inside the courtyard are all stone masonry, which eliminates the influence of the building materials on the main building inside the courtyard in this actual measurement. (Reflectivity of main materials in the courtyard: Dry bare land 0.1–0.2, Dry lawn 0.15–0.25, Concrete floor 0.2.)

2.3. Experimental Process and Data Collection Method

After the initial survey, we began to collect data on selected experimental units. There are 5 test subjects in this test, including 4 courtyards and 1 outdoor spot. The reference point O is set on an open ground outdoors. Due to limited manpower, time constraints, limited equipment and instruments, this measurement used three experimenters who used three sets of instruments of the same model to simultaneously collect data on the required parameters for a total of 4 days. On January 12th and 13th, three experimenters used three test instruments to simultaneously collect the thermal environment parameters of courtyards A and B and outdoor point O. On January 14th and 15th, three experimenters used three test instruments to simultaneously collect data on the thermal environment parameters at the courtyards C and D and outdoor point O. Except for point O, which is an outdoor reference point for data collection for 4 consecutive days, the other points in the courtyard maintain data collection for 2 consecutive days (Table 2).
Given that the courtyard area in the cold Western Sichuan Plateau is generally on a large scale, it is impossible to accurately express the variation in the internal thermal environment of the entire courtyard based on one measuring point. Therefore, the mobile observation method was adopted in courtyards with more than 100 square meters in area. We used a laser range finder and tape measure to survey and map the courtyard of the four households to generate the floor plan of the measured object. The main building is taken as the reference point and 25 square meters was used as the basic unit to grid the courtyard area, and 6 measuring points were arranged for courtyards exceeding 100 square meters (courtyards A, C, and D) to accurately record the whole variations in the thermal environment inside the courtyard (Figure 5). During the flow observation process, the interval between each measuring point was ten minutes. After recording the data at each point, the instrument is moved to the next measurement point in clockwise order to ensure that one round of data collection can be performed on all the measurement points in the yard every hour. (For example, 8:00—A1, 8:10—A2, 8:20—A3, 8:30—A4, 8:40—A5, 8:50—A6, 9:00—A1…. Since B < 100 m2, only one observation point is set.)
This measurement was carried out without influencing the daily routine of the residents, and the instruments and equipment were supervised and recorded by personnel to prevent the interference of human activities and other factors with the proper functioning of the instruments. The height of the instrument is kept above 1.1 m, and there is no obstruction on the top and the periphery, to ensure the reliability and validity of the acquired data (Table 2). The thermal environment parameters collected include; air temperature, relative humidity, wind speed, solar radiation, and black bulb temperature. The instruments used in the institute conform to the ISO7726 standard [20]. Furthermore, the data recording interval is every 10 min. Except for the wind speed, which are manually handwritten, the other parameters are automatically recorded every ten minutes (Table 3). All instruments have been calibrated before the start of the measurement.

2.4. Data Processing Method

After completing all the data collection work, the acquired environmental parameter data were preliminarily processed using Excel, and the reference information such as SD and the average mean radiation temperature was calculated based on all the measured parameters. The average mean radiation temperature (Tmrt) is also a commonly used thermal environment parameter. Tmrt refers to the average temperature that the surface of the surrounding environment exerts on the human body, which can be used to evaluate the thermal comfort and in the calculation of the radiant heat loss from the human body and the surrounding environment [21]. The average radiant temperature can be calculated from the measured meteorological parameters, and the calculation formula is:
T m r t = T g + 273.15 4 + 1.10 × 10 8 V a 0.6 ( T g T a ε D 0.4 1 4 273
The abbreviations in the formular are: the average radiant temperature (Tmrt, °C); Globe temperature (Tg, °C); Air temperature (Ta, °C); Wind speed (Va, m/s); Absorption rate of the globe (ε = 0.95); Globe diameter (D, m); a standard globe with D = 0.15 m is used in this paper.
Furthermore, the average mean radiation temperature, the physiologically equivalent temperature (PET), is also a common indicator in the evaluation of the thermal environment. The Rayman software was used in evaluating the PET value based on the collected environmental parameters [22]. Given the behavioral activities of the residents in Figure 3, when calculating the PET value, we set the clothing insulation value to 1.5 clo and the activity state to 80 W (slow walking state). After obtaining the required thermal environmental data of all test points, GraphPad Prism software was used to visualize the numerical changes in each test point. After comparing the obtained data from each courtyard point with the reference point O, the thermal environment parameters with significant changes were extracted and imported into SPSS software to perform the correlation analysis with the PET value of each point to determine the main factors affecting the overall thermal environment inside the courtyard. Finally, the correlation coefficients between the environmental parameters of each courtyard and the PET value account for the differences in the parameters, and provide actionable suggestions for the design of courtyard layouts.

3. Result Analysis and Discussion

3.1. Data Description and Comparison Results

3.1.1. Air Temperature

To ensure the influence of changes in climatic conditions on the experimental data, each point inside the courtyard was tested for two consecutive days, and the outdoor comparison observation point O was observed for four consecutive days. Table 4 and Table 5 show a summary of the basic statistical data from the test, and Figure 6 summarizes the changes in the central location of each courtyard and the temperature above the comparison point. The figure shows a significant variation in temperature in this area within a day. The outdoor temperature difference at point O for four consecutive days was between 22 and 30 °C, and the outdoor temperature change curve is more turbulent, while the temperature change curve inside the courtyard was relatively gentle, which shows that under the cold climate conditions of the plateau, the courtyard can indeed create a relatively stable internal climatic environment.
During the measurement period, the overall temperature showed a gradual upward trend and then began to show different changes with the different combination characteristics of the courtyard, based on the data gathered on the 12th and 13th. The internal comprehensive average temperature of courtyard A was the highest. The average temperature of the two days tested differs from the average temperature of the outdoor reference point O by 5 °C. The change in temperature is always above the outdoor point O level, except during parts of the afternoon on the 13th, which was affected by clouds. The overall change range is basically the same as the O point. The temperature change trajectory of courtyard B showed a significant downward trend after 13:30. This is due to the compact layout design, which places the measuring point within the shadow of the annex building after 13:30. As the amount of sunlight decreases, the air temperature also decreases. The different sunshine time causes a large difference in temperature fluctuations between courtyards A, B, and reference point O. In the data descriptions on the 14th and 15th, the large courtyard area caused little difference in the internal temperature of courtyards C and D, and even the average temperature on the 14th was lower than 1.5 °C outside. Figure 6 shows that the temperature of courtyards C and D before 11:00 a.m. was slightly lower than the outdoor temperature. This is because the two courtyards are located close to the two mountains in the southwest, and because the amount of solar radiation in the morning was affected by the mountains on both sides, the temperature inside the courtyard is lower. This result is consistent with the conclusions of Kumar, R., whereby shading measures can effectively reduce the temperature, and it fully proves that the amount of sunshine directly affects the changes in temperature within the courtyard [23].

3.1.2. Relative Humidity

Table 6 and Table 7 summarize the descriptive statistics of relative humidity, and Figure 7 shows the changes in the relative humidity at various points. Generally, the relative humidity of all test points showed a gradual downward trend and gradually changed steadily after 15:00. The relative humidity inside the courtyards at C and D was lower than the outdoor value before 10 o’clock, mainly because the two courtyards were located close to the mountain on the east side, which caused the courtyard to remain in the shadow of the mountain before 10 o’clock. In the case of direct sunlight, the relative humidity was higher than that of the outdoor space during sunlight. Additionally, the relative humidity of the courtyard at B showed a gradual upward trend after 14:00. Furthermore, due to the compact courtyard layout, the measuring point was in the shadow of the building after 14:00, thus reducing the relative humidity without solar exposure.

3.1.3. Solar Radiation

Table 8 and Table 9 show the descriptive statistics of solar radiation at each measurement point, and Figure 8 shows the changes in the daily solar radiation at each measurement point. Under sunny weather conditions, the outdoor test point O showed a stable arc change trend, and the highest peak was maintained between 12:30 and 14:00 (the solar radiation in the afternoon of the 13th was affected by shards of clouds, so the solar radiation in the afternoon was lower than in other tests). The measurement points inside the courtyards are affected by the layout of the courtyard, the topography of the location, and the consequent different solar radiation changes. Courtyard A is located in an open geographical location, unaffected by surrounding mountains, with abundant sunshine exposure, and the changes in radiation are close to the change at point O; although courtyard B is located in a favorable location, it is affected by the compact layout, and it was blocked by the shadow of the annex building at 13:30, at which point, the solar radiation dropped sharply, and began to decline steadily after reaching 40 W/m2. Courtyard C is located in the shadow of the surrounding mountains before 9:30 in the morning; hence, it has a lower solar radiation when compared to the outdoor reference point O. Courtyard D is both before 10:30 and after 16:30. In the shadow of the surrounding mountains, the solar radiation is lower than the outdoor reference point. The overall solar radiation in all the courtyards does not differ significantly from that of the outdoors under direct sunlight, but the shadows inside the courtyards reduced the average solar radiation inside the courtyards significantly throughout the day.

3.1.4. Wind Speed

Table 10 and Table 11 provide the descriptive statistics of the wind speed at each test point. Figure 9 shows the wind speed statistics at each point. The figure depicts that the change curve of the wind speed at each measuring point is relatively tortuous. The average wind speed at the outer point O for four consecutive days was 1.5 m/s, which is generally higher than the average wind speed inside the courtyard, and this shows that that the courtyard wall can effectively resist the cold wind and create a relatively stable internal wind environment within the courtyard. Comparing the difference obtained by subtracting the average wind speed between the courtyard and outdoor points showed that the average wind speed at C and D is greater than that at A and B. This shows a gradual decline in the efficiency of the windshield with an increase in the yard area. The courtyard with the lowest average wind speed is courtyard B. The compact layout enclosed by the 3.5 m annex building and the main building creates a good courtyard wind environment. The areas of courtyards A and C are similar, but the average wind speed of the courtyard at C is higher than that of courtyard A, which may be closely related to the opening direction of the courtyard door and the prevailing wind direction in the area. The opening direction of courtyard gate A is 73° southeast (the height of the courtyard wall is 1.8 m), and the courtyard gate direction of point C is 235° southwest (the height of the courtyard wall is 1.5 m). The above wind speed data combined with the courtyard layout analysis show that the orientation of the courtyard door and the height of the courtyard wall may be important factors affecting the parameters of the thermal environment in the courtyard.

3.1.5. Tmrt (Mean Radiation Temperature)

During the measurement process, the temperature in the morning was extremely low due to the unique climate of the cold region. Before 10:00 in the morning, the black bulb temperature of some test points was below zero, exceeding the threshold of the instruments, and the average mean radiation temperature could not be calculated. Therefore, we took the value of the black bulb recorded at each point after ten o’clock in the morning to calculate the average mean radiation temperature. Table 12 and Table 13 show the descriptive statistics of the average solar radiation at each test site and the outdoor control site during the test period. Figure 10 shows the Tmrt comparison chart of each test site from 10:00 a.m. to 17:00.
The overall statistical results showed that the Tmrt of the outdoor control point O is slightly higher than that of the other test points, which may be related to the solar radiation received by the outdoor observation point, when other test points are in shadow, this difference in value becomes particularly significant. However, the average radiant temperature change at point O fluctuates significantly compared to the inside of the yard, and the Tmrt at individual time points is lower than the point inside the yard, which may be caused by the large change in outdoor wind speed. The average radiant temperature inside the courtyard is generally lower than the external point, which may be related to the reflectivity of the wall material around the test point. The direct solar radiation exchanges with the wall around the test point, causing the average radiant temperature inside the courtyard to be slightly lower than the unobstructed outdoor test point O.

3.1.6. PET (Physiologically Equivalent Temperature)

PET (Physiologically Equivalent Temperature) is used as a comprehensive index to evaluate the thermal environment, taking into account the effects of thermal environment parameters, various human activities, and thermal insulation conditions on human comfort, it can be used as a comprehensive evaluation of the thermal environment of this courtyard [22,24]. This paper uses Rayman model software to input the specified test parameters, including temperature, relative humidity, wind speed, water vapor pressure, Tmrt, clothing, activity status, etc., to calculate the PET value. The PET used in this calculation is based on the data collected after ten o’clock because the temperature of the black ball before ten o’clock is below 0 degrees Celsius, which exceeds the threshold. According to the tested subjects and climatic conditions, the clothing insulation value was set to 1.5 clo, and the active state is 80 W (slow walking state). Tzu-PingLin et al. studied the relationship between PET values and the thermal sensations in different outdoor environments, and established nine ranges of PET temperature, namely, extremely cold (<4 °C), cold (4~8 °C), cool (8~13 °C), slightly cool (13~18 °C), comfortable (18~23 °C), slightly warm (23~29 °C), warm (29~35 °C), hot (35~41 °C), and very hot (>41 °C) [25].
Table 14 and Table 15 provide the descriptive statistics for the PET calculated at each point, and Figure 11 shows the changes in PET. The results showed that the overall PET temperature is mainly affected by solar radiation. The PET at outdoor spots can be exposed to direct sunlight throughout the day because there are no buildings and mountains, so the PET value would fall within the slightly warm range. In courtyard B, the PET value gradually decreases after 1:30 in the afternoon, which is the same as the change in the trend of solar radiation. Similarly, the sunlight at C and D before 11:00 in the morning makes the PET value at the two points significantly lower than the value outdoors. This shows that in cold regions, solar radiation plays an important role in improving human comfort. The statistics in Table 14 and Table 15 show that the average PET values of courtyards A, C, and D are within the comfort zone of 18 °C to 23 °C, while courtyard B is at 15 °C, which further confirms the relationship between PET and solar radiation. Among the three courtyards A, C, and D, the SD deviation value of courtyard D is larger, indicating an unstable PET value. The SD values of the two points A and C are relatively stable. Figure 11 indicates that the changes in the PET value from point C to point A exhibits a continuous waveband variation, which may be due to the influence of the windy environment. Conversely, point A has the most stable PET value among the four layouts, indicating that besides solar radiation, the speed of the wind is the second factor that can affect the thermal perception of the human body.

3.2. Correlation Analysis

The analysis and comparison of the measured parameters give evidence to conclude that the internal and outdoor reference points of the different courtyards vary significantly under different conditions. To further explore which environmental parameters have a significant correlation with the PET, and determine the layout of the courtyard based on the factors that are related significantly related factors, it is necessary to conduct further inferential statistics in the form of regression analysis.
The environmental parameters analyzed with PET this time include the air temperature, the solar radiation, Tmrt, and the wind speed. Since the descriptive statistics showed that the air temperature and the relative humidity are negatively correlated, i.e., the higher the air temperature, the lower the relative humidity, only the air temperature was selected for the correlation analysis. Figure 12, Figure 13, Figure 14 and Figure 15, respectively, show the scatter plots depicting the relationships between PET and Tmrt, solar radiation, air temperature, and the wind speed at each courtyard measurement point, and the corresponding regression equations were obtained through linear regression. To accurately describe the statistical relationship between the PET and the environmental parameters at each yard measurement point, during the regression analysis, the environmental parameters and the PET of each yard measurement point were tested for significance. A p value that is close to zero is an indication of a statistically significant correlation between the PET and the indicated parameter. The p-value between the PET of each courtyard test point and each environmental parameter is marked after R2.

3.2.1. PET and Air Temperature

In Figure 12, the p-value of the correlation between the air temperature at points A, B, and D and the PET value is less than 0.001, which indicates a significant correlation. Both courtyards B and D received lower solar radiation and sunshine during the day than courtyards A and C, which shows that air temperature is a key factor affecting the thermal environment of courtyards in the absence of insufficient solar radiation. The R2 value of courtyard A and D is greater than that of courtyard B. This may be related to the enclosure and the area of the two courtyards. The more compact layout of courtyard B makes it easier for the building to obstruct the courtyard, thus complicating the internal thermal environment of courtyard B (the measurement point is in the shade during part of the duration, and also exposed to the sun). Therefore, under similar air temperature conditions, the solar radiation received by each measuring point is quite different, which affects the variation in the PET value at different measuring points under similar air temperature conditions. Hence, a weak correlation exists between the air temperature of courtyard B and the PET.

3.2.2. PET and Solar Radiation

In Figure 13, the p values between courtyards A and C are both less than 0.0001, which is close to 0, indicating that the amount of solar radiation received in the two courtyards is significantly correlated with the PET value. Given that the two are related, the R2 value of point A is 0.6464, which is significantly greater than that of point C (0.1652), which is related to the amount of sunshine received by point C. Point A has longer sunshine time due to its geographical advantage, the amount of solar radiation received is more, and point C is in the shadow of the mountain before 9:30 in the morning, which lowers the amount of sunlight received throughout the day when compared to point A. Courtyards B and D are partly in the shadow of the buildings and mountains, which results in the lower solar radiation of these two courtyards when compared to points A and C. Consequently, the correlation between their solar radiation and the PET are not significant, with a very low R2 value.

3.2.3. PET and mean Radiation Temperature

Figure 14 shows that the p-values of the correlation between the PET and the mean radiation temperature in all the courtyards is less than 0.0001, showing a significant correlation, especially in the sheltered courtyard at B measurement point, where R2 = 0.8573 is close to 1. During the test, the small courtyard area at B experienced a shorter sunshine exposure time than the other courtyards, which had a direct impact on the internal temperature of the courtyard, and the change in the temperature in the courtyard had a direct impact on the calculation of the radiant temperature. Therefore, the change trend between the PET and the mean radiation temperature is significant and closely related. The main basis for calculating the Tmrt comes from the temperature and wind speed in the parameters collected. The descriptive statistics of temperature have shown that the temperature change inside the courtyard is mainly controlled by the changes in the solar radiation, and the relatively stable wind environment inside courtyard B once again confirms that radiation from the sun is the main factor affecting the internal thermal environment of the courtyard.

3.2.4. PET and Wind Speed

In the relationship between PET and wind speed in each courtyard depicted in Figure 15, the p-value of courtyards A and B is significantly greater than 0.05, indicating that the correlation between the PET and the wind speed in the courtyard is not significant. This also confirms the relative stability of the wind environment at the center of the courtyards A and B is relatively stable, and the strong wind outside the courtyard has no obvious impact on the inside of the courtyard. The p-value of C and D indicate a certain relationship between the wind speed at the two points and the PET value. Table 10 shows that the average wind speed in courtyards C and D are generally greater than that of A and B. Among them, the p-value of point D (p < 0.001) is obviously related, which may be directly related to the size of the courtyard. The huge courtyard area makes the height of the courtyard wall at point D inadequate in withstanding strong external winds, and the overall thermal environment within the courtyard is affected by strong external winds. The p value of point C = 0.005, indicating that the wind speed has a certain correlation with the PET inside the courtyard at point C, while the courtyard at point A, which has an area similar to the height of the courtyard wall, has no effect. This may be related to the orientation of the courtyard gate C. The opening direction of courtyard C and the relatively low courtyard wall caused the “draught” phenomenon. Strong external wind invaded the courtyard and disturbed the internal wind environment, thus affecting the PET value in the courtyard. Given the high complexity and uncertainty in the windy environment, the correlation between all the wind speeds in the tested courtyard and the PET values are generally weak, with an overall performance R2 value lower than 0.3. However, the p-value can be used in the determination of which courtyard PET values are related to the wind speed.

4. Discussion

4.1. Air Temperature

Findings from this thermal environment survey showed that the temperature data in the courtyard are better than that of the data outside the courtyard. For example, the average temperature of courtyards A and B is higher than the outdoor comparison point O by 3~4 °C, which shows the positive impact of constructing stone courtyards. However, the overall temperature in the courtyard is still low, which is consistent with the conclusion drawn by Wei Yu and others on the thermal environment of the Qinghai–Tibet Plateau: The outdoor climatic conditions in the plateau area are relatively harsh; although, the design of the stone building was adapted to the climate to a reasonable extent, Nevertheless, there is still a need for improvement [16]. In Lili Zhang’s investigation of the thermal environment of plateau buildings in north-western Sichuan, stone buildings can account for about 24 °C difference between the indoor and outdoor environment, due to the semi open space of the courtyard, the open courtyard space is farther from achieving the same heating effect [17].

4.2. Solar Radiation

Evidence from this study shows that the compact and small-area courtyard layout design helps to form a stable internal thermal environment, and helps in the elimination of most of the influence of wind on the internal thermal environment of the courtyard. However, this layout also limits the amount of sunshine in the courtyard and significantly reduces the duration of sunshine exposure, thus having a significant negative impact on the overall thermal environment of the courtyard. Furthermore, the impact of the location of the yard on the amount of sunlight at the yard cannot be ignored. Part of the time is in the shadow of the mountain on the east side, and the observed values of the various environmental parameters even exceeded the threshold, which is very unfriendly to the thermal comfort of the human body living in the courtyard. This can be seen from the PET statistical change chart before 11:00 a.m. in Figure 11.
Contrary to the passive treatment measures of Subhashini in warm and humid climates, receiving sufficient sunlight is a necessary condition to improve the thermal comfort of the courtyard. Especially during the winter in cold regions, the yards that have been in the shadow of the buildings for a long time have obvious downward trends in various environmental parameters and the PET values. The measured results are very similar to the conclusions drawn by Enes Ya, Sa et al. [26], in their simulation. In the winter, the required thermal radiation effect under the shadow of the courtyard is greater than the effect of reducing radiation in the summer, and the duration in winter is longer in the plateaus. This is more prominent in cold regions. Additionally, during this investigation and survey, it was found that many courtyards also had shorter morning sunshine hours, especially the location of the entire settlement leaning to the southwest. The distance between the two surrounding high mountains decreases gradually decreases in the southwest, thus forming a high mountain valley. This topography makes the buildings and courtyards less sunny and, of course, colder. From the perspective of courtyard layout, the internal thermal environment of courtyard A is the best among the four courtyard designs. The relatively wide courtyard layout and the superior geographical location ensure sufficient solar radiation, which also ensures the relative stability of the overall thermal environment inside the courtyard.

4.3. Wind

Courtyards C and D are significantly affected by strong external winds in this survey, which may be attributed to the geographical location of the two courtyards. Figure 4, shows that the whole village becomes increasingly narrower from northeast to southwest, and the narrower the formation of the valley closer to the two mountains, the higher the wind speed. Courtyards C and D are closer to the depths of the gorge than courtyards A and B; hence, the influence of the wind environment inside the courtyard is more significant. The front door of courtyard C is SW235°, and is located exactly towards the prevailing wind direction in the gorge, so the average wind speed inside the courtyard is the highest. This is consistent with the findings of Yafeng Gao et al. [7], who studied the layout of campus buildings. In low-rise buildings, different opening orientations will affect the wind environment inside the enclosed building. Given the wind environment problem in the courtyard, the wind-shielding efficiency of the courtyard wall can be improved by adjusting the layout of the plane and the aspect ratios of the courtyard [14].

5. Conclusions and Suggestions

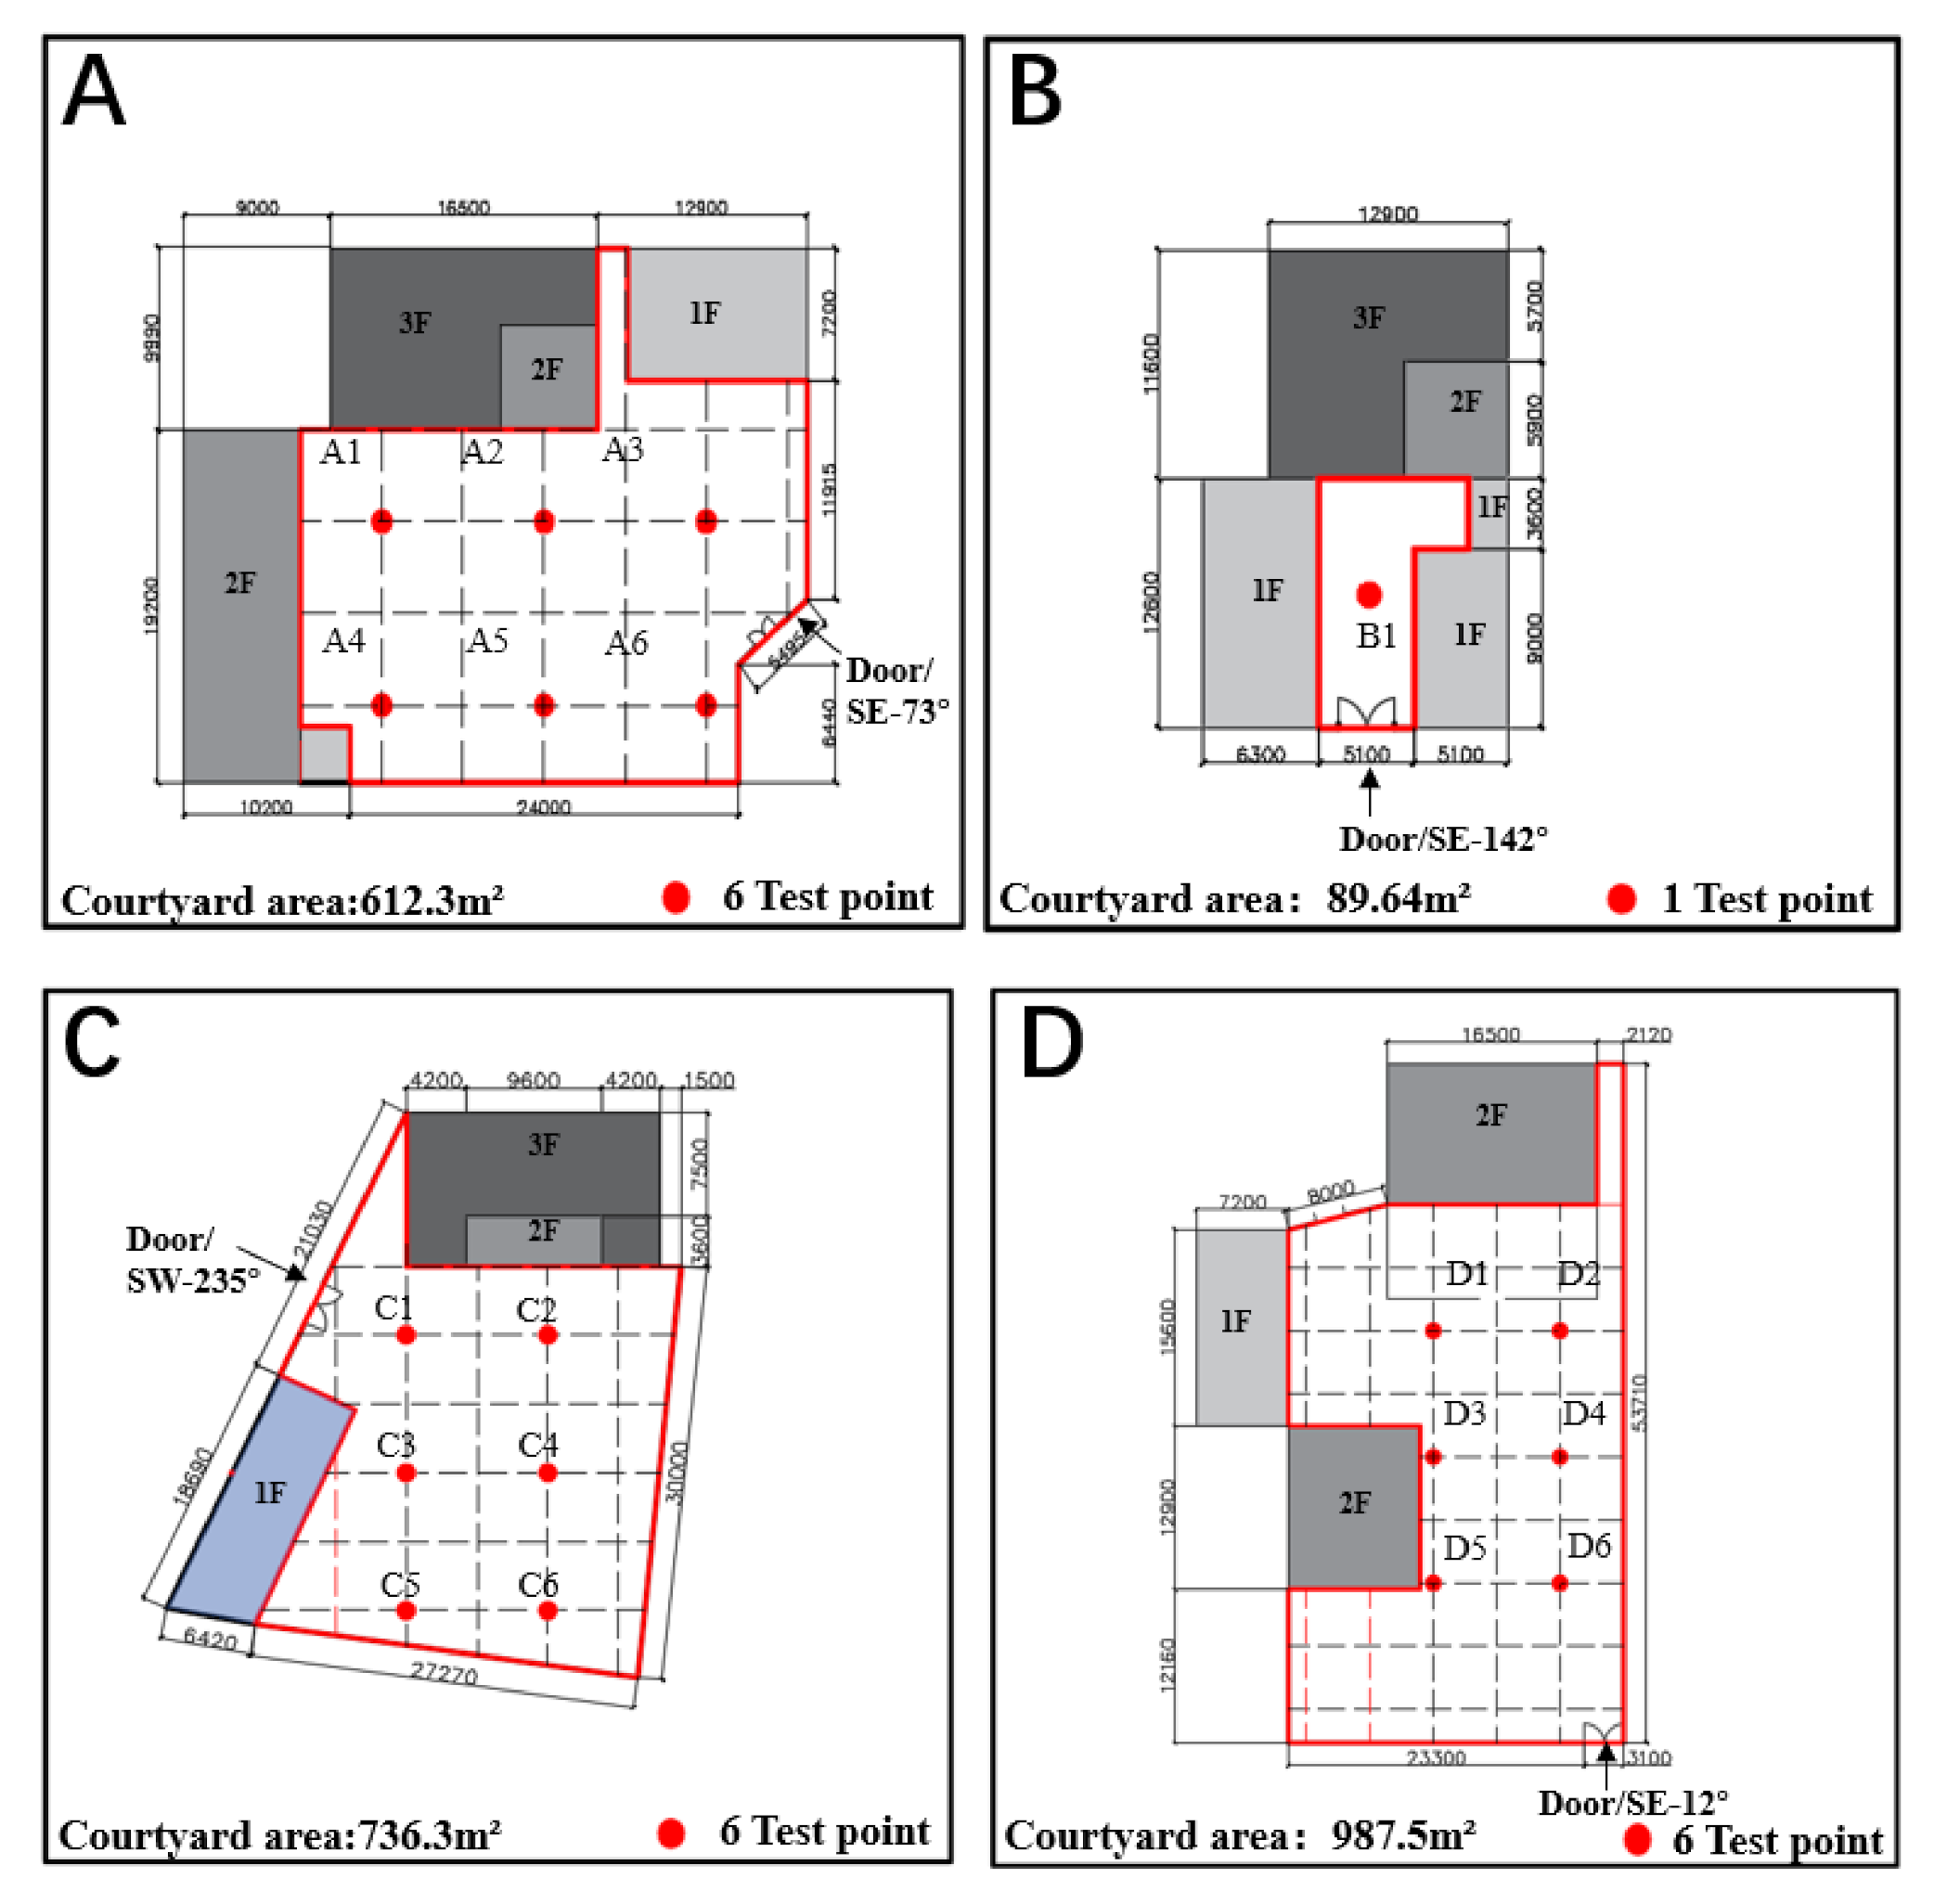
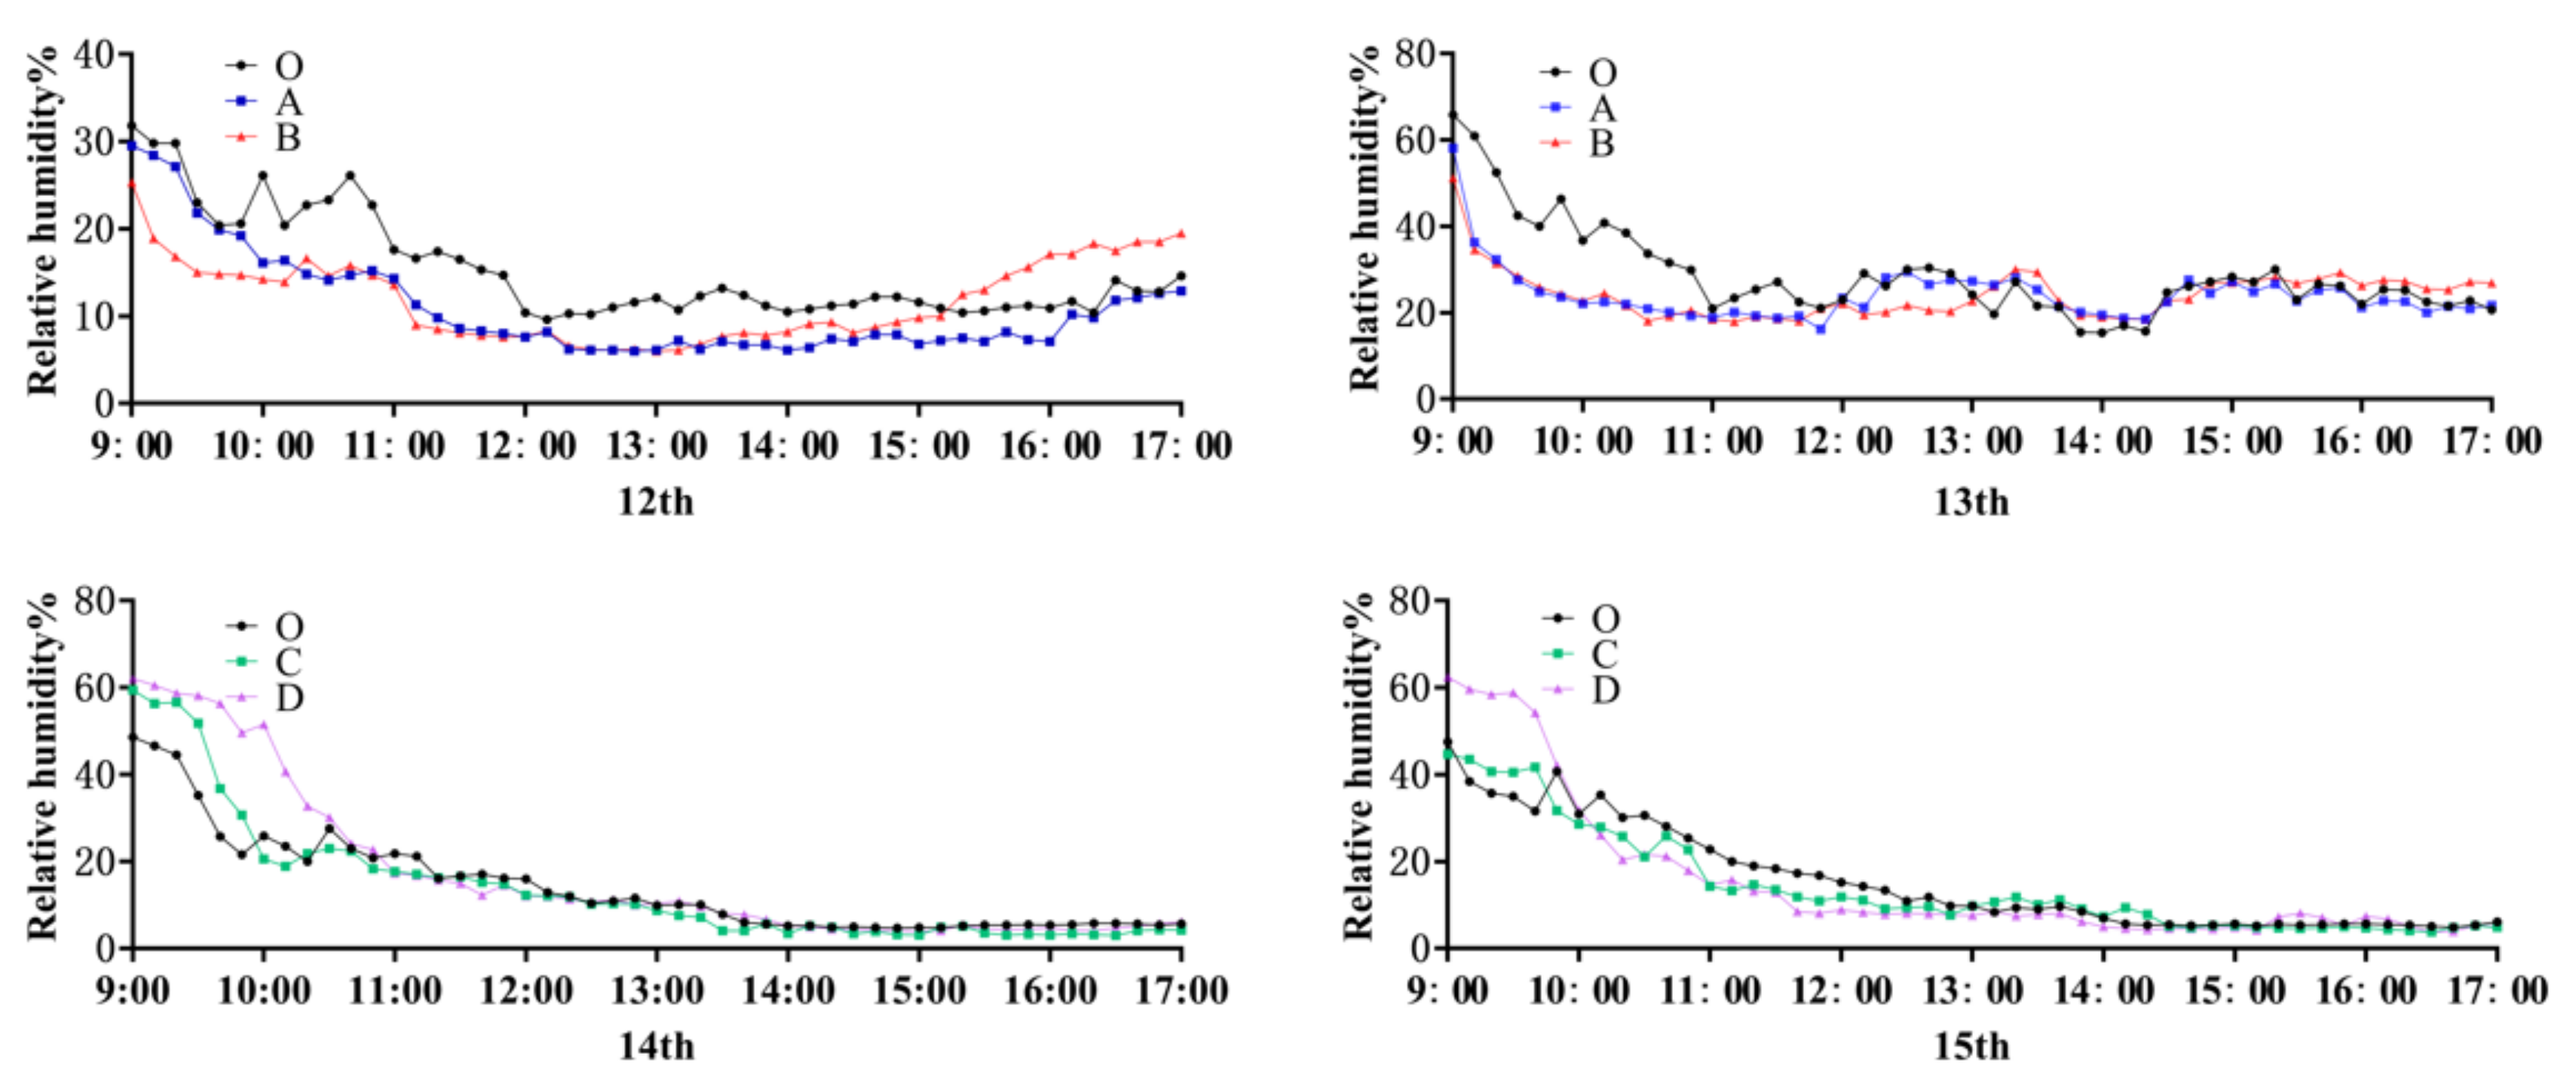
After surveying the thermal environment during winter in the cold regions of the Western Sichuan Plateau, it was found that: Under the terrain conditions of the plateau’s mountains and valleys, the traditional residential courtyards can adapt reasonably well to the local cold weather conditions in the winter, providing residents with a relatively stable internal microclimate. However, the layout of different courtyards also formed different courtyard thermal environment levels. Evidence from the analysis and the results obtained in this study provide empirical basis for the following conclusions:
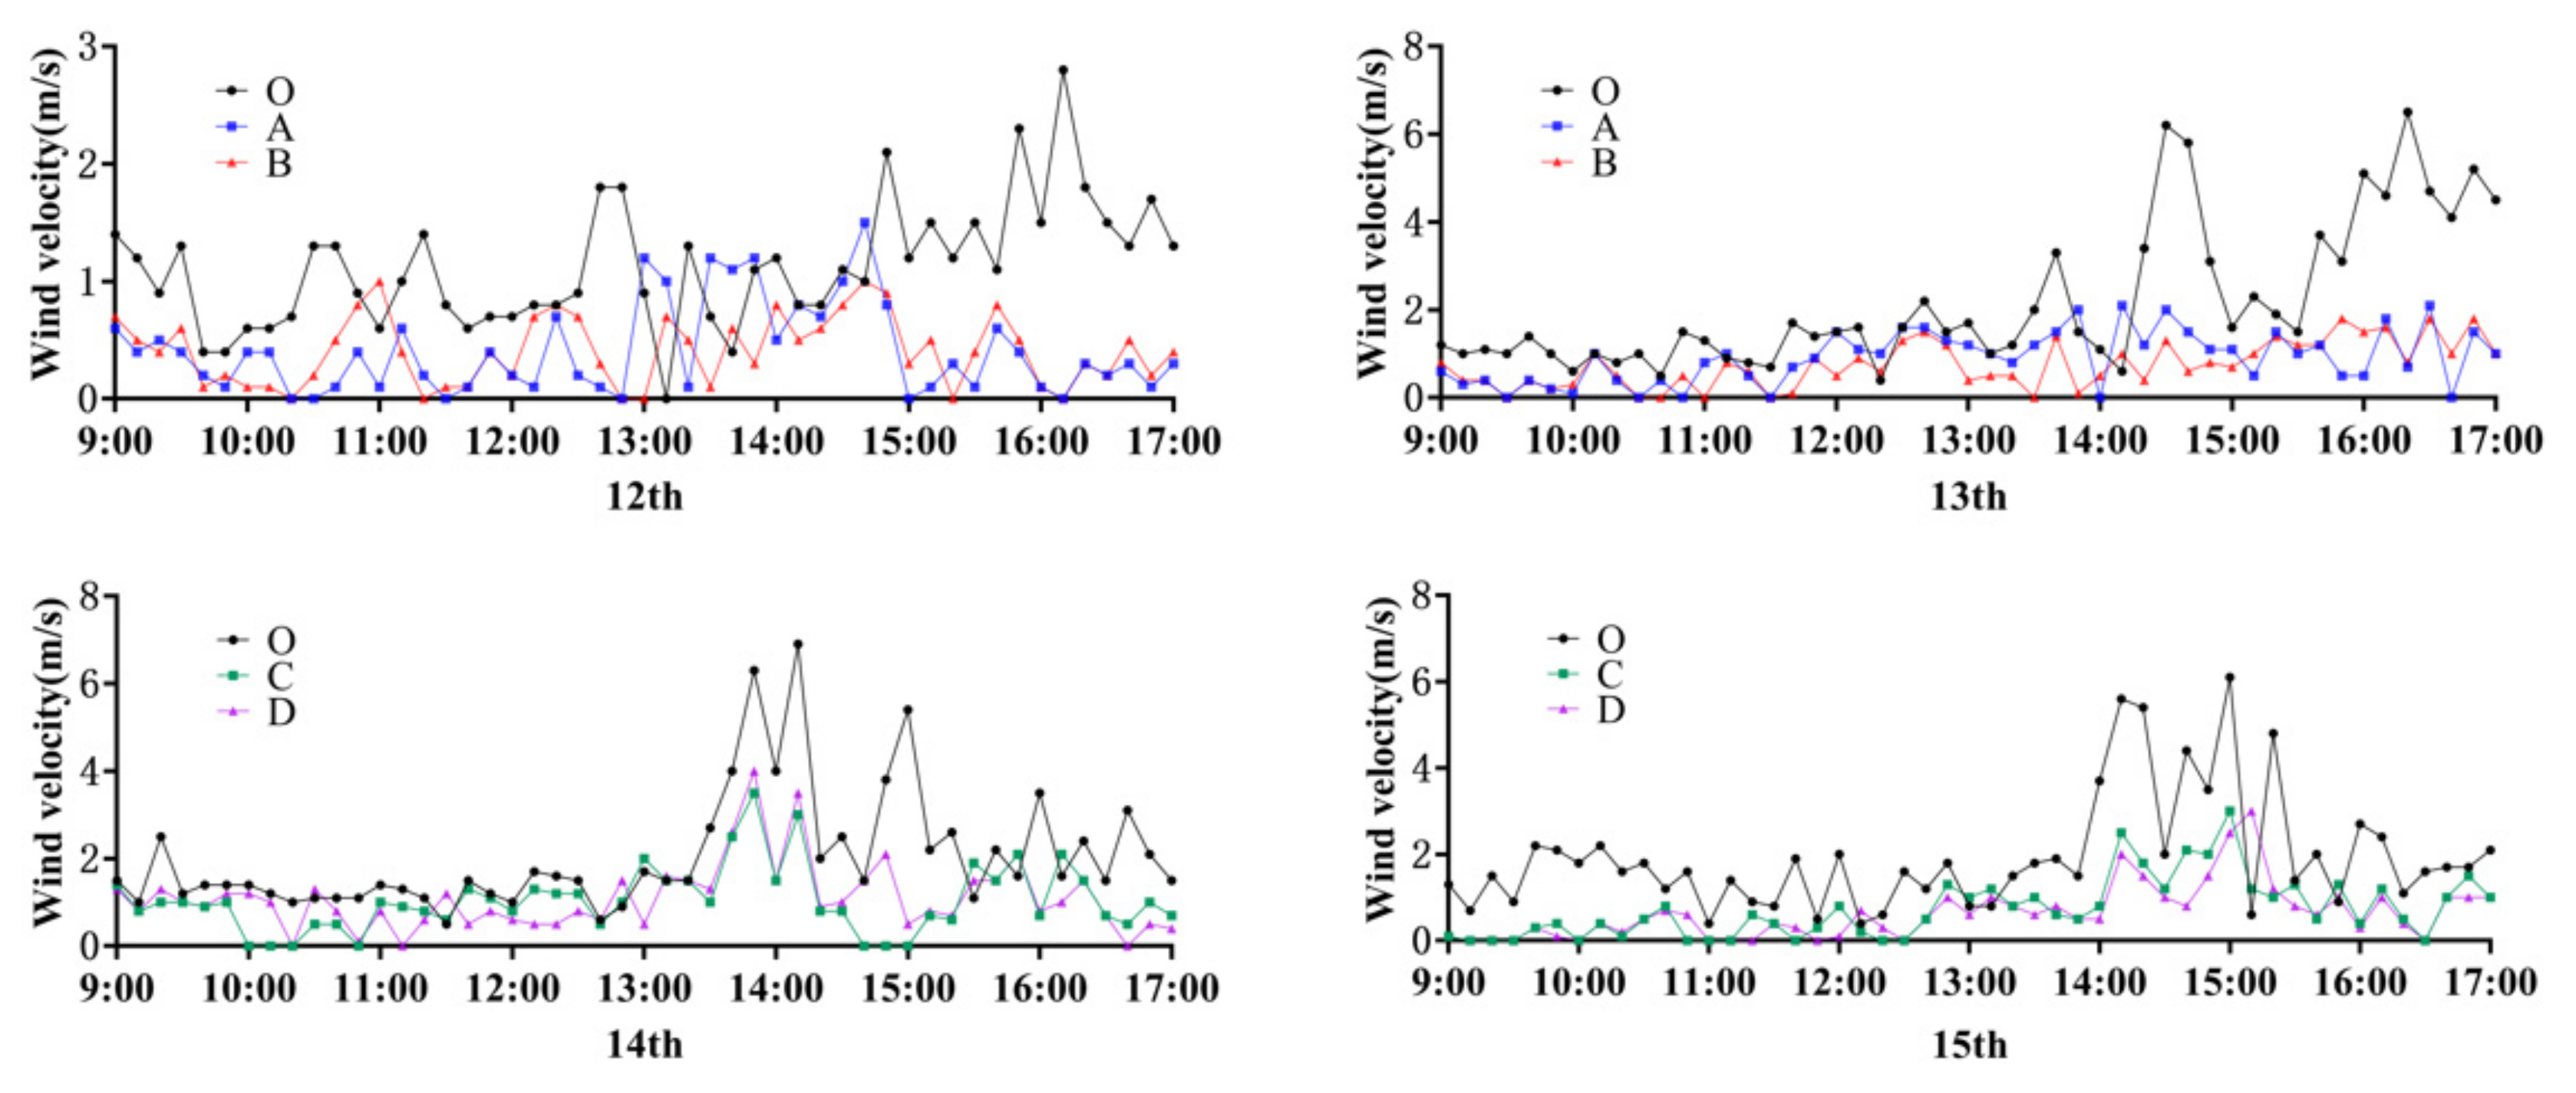
  • The amount of solar radiation and wind speed are the salient factors affecting the in-ternal thermal environment of the courtyards in the cold area of the Western Sichuan Plateau during winter.
  • The mountainous conditions on the plateau, significantly limit the amount of solar radiation received inside the courtyard, and reduce the thermal comfort inside the courtyard during winter. Compared with the more compact courtyard, the open courtyard layout receives more solar radiation, which results in a better overall thermal environment. Therefore, to the greatest possible extent, newly-built courtyards should be located in an open geographical location, and the shadow area formed by the buildings should be minimized based on the existing courtyard. All these measures can improve the thermal comfort of the residents in the courtyard.
  • Given the influence of the high mountain topography and valleys, the outdoor wind environment in the Western Sichuan Plateau is very bad, with obvious ‘canyon wind’ characteristics. When the opening of the courtyard gate aligns with the wind direction of the local canyon, the strong wind results in the disturbance of the microclimate within the courtyard. Furthermore, too large a courtyard area will reduce the wind-proof efficiency of the wall. Increasing the height of the existing courtyard wall or adjusting the direction of the courtyard door to maintain a vertical relationship with the wind direction of the canyon may improve the internal thermal environment of the existing courtyard.
This study on the thermal environment of courtyards has the following limitations: (1) Due to limited instruments and manpower, the field measurement experiment data collection was divided into two. Simultaneously carrying out these experiments might improve the reliability and validity of the results obtained in this study. (2) In computing the human thermal perception, the human body parameter was set to a constant value, which is not universal (80 W and 1.5 clo). Outdoor environmental parameters and influencing factors are more complex, and people in different regions also have significant differences in tolerance to thermal environments. For example, Xin Chen et al. concluded that the outdoor thermal comfort survey conducted in Harbin, an extremely cold region in China, indicated that the cold tolerance of people in this region is better than that of people in other regions [27]. (3) The actual measurement was only carried out on the courtyard’s thermal environment during winter. Incorporating the research in other seasons (such as summer) will enhance the reliability of the performance of the plateau courtyard thermal environment.
Research on human thermal comfort in plateau areas requires larger sample sizes in subsequent studies. In future research, the characteristic parameters of courtyard layout can be compared in more detail, such as the influence of the ratio of building and the height of the courtyard wall to the area of the courtyard areas, on the construction of the thermal environment, or the use of simulation software to change the value of the parameter condition of the courtyard, compare and optimize, and further explore the influence of various parameters on the thermal environment of the courtyard.

Author Contributions

Conceptualization, S.X. and B.C.; methodology, Z.H.; software, S.X.; validation, S.X., C.S. and Z.H.; formal analysis, S.X.; investigation, S.X., C.S. and Z.H; resources, B.C.; data curation, S.X.; writing—original draft preparation, S.X.; writing—review and editing, B.C. and Z.F; visualization, S.X.; supervision, B.C.; project administration, B.C.; funding acquisition, B.C. All authors have read and agreed to the published version of the manuscript.

Funding

This research was funded by the key R & D project in the field of social development in Sichuan Province in 2020. The project name: “Research on the Green Livable Performance Improvement Technology of the Northwest Sichuan Plateau Villages and Towns”, No. 2020YFS0308.

Institutional Review Board Statement

Not applicable.

Informed Consent Statement

Not applicable.

Data Availability Statement

Not applicable.

Conflicts of Interest

The authors declare no conflict of interest.

References

  1. Soflaei, F.; Shokouhian, M.; Zhu, W.Y. Socio-environmental sustainability in traditional courtyard houses of Iran and China. Renew. Sustain. Energy Rev. 2017, 69, 1147–1169. [Google Scholar] [CrossRef]
  2. Carlo Ratti, D.R. Koen Steemers Building form and environmental performance: Archetypes, analysis and an arid climate. Energy Build. 2003, 35, 49–59. [Google Scholar] [CrossRef]
  3. Zamani, Z.; Heidari, S.; Hanachi, P. Reviewing the thermal and microclimatic function of courtyards. Renew. Sustain. Energy Rev. 2018, 93, 580–595. [Google Scholar] [CrossRef]
  4. Taleghani, M.; Kleerekoper, L.; Tenpierik, M.; Van den Dobbelsteen, A. Outdoor thermal comfort within five different urban forms in the Netherlands. Build. Environ. 2015, 83, 65–78. [Google Scholar] [CrossRef]
  5. Diz-Mellado, E.; Lopez-Cabeza, V.P.; Rivera-Gomez, C.; Galan-Marin, C.; Rojas-Fernandez, J.; Nikolopoulou, M. Extending the adaptive thermal comfort models for courtyards. Build. Environ. 2021, 203, 80–94. [Google Scholar] [CrossRef]
  6. Akbari, H.; Cherati, S.M.; Monazam, N.H.; Noguchi, M. Effect of courtyards’ geometrical parameters on climate adaptability and shading performance in hot-arid climate of Yazd (Iran). Sustain. Energy Technol. Assess. 2021, 48, 594–606. [Google Scholar] [CrossRef]
  7. Gao, Y.F.; Yao, R.M.; Li, B.Z.; Turkbeyler, E.; Luo, Q.; Short, A. Field studies on the effect of built forms on urban wind environments. Renew. Energy 2012, 46, 148–154. [Google Scholar] [CrossRef]
  8. Yang, L.; Liu, X.D.; Qian, F.; Niu, S.N. Research on the wind environment and air quality of parallel courtyards in a university campus. Sustain. Cities Soc. 2020, 56, 102–119. [Google Scholar] [CrossRef]
  9. Mousli, K.; Semprini, G. Thermal Performances of Traditional Houses in Dry Hot Arid Climate and the Effect of Natural Ventilation on Thermal Comfort: A Case Study in Damascus. In Proceedings of the 6th International Building Physics Conference (Ibpc 2015), Torino, Italy, 14–17 June 2015; Volume 78, pp. 2893–2898. [Google Scholar] [CrossRef] [Green Version]
  10. Micallef, D.; Buhagiar, V.; Borg, S.P. Cross-ventilation of a room in a courtyard building. Energy Build. 2016, 133, 658–669. [Google Scholar] [CrossRef]
  11. Lai, D.; Lian, Z.; Liu, W.; Guo, C.; Liu, W.; Liu, K.; Chen, Q. A comprehensive review of thermal comfort studies in urban open spaces. Sci. Total Environ. 2020, 742, 70–92. [Google Scholar] [CrossRef]
  12. An, L.; Hong, B.; Cui, X.; Geng, Y.; Ma, X. Outdoor thermal comfort during winter in China’s cold regions: A comparative study. Sci. Total Environ. 2021, 768, 44–64. [Google Scholar] [CrossRef] [PubMed]
  13. Nasrollahi, N.; Hatami, M.; Khastar, S.R.; Taleghani, M. Numerical evaluation of thermal comfort in traditional courtyards to develop new microclimate design in a hot and dry climate. Sustain. Cities Soc. 2017, 35, 449–467. [Google Scholar] [CrossRef]
  14. Xu, X.; Luo, F.; Wang, W.; Hong, T.; Fu, X. Performance-Based Evaluation of Courtyard Design in China’s Cold-Winter Hot-Summer Climate Regions. Sustainability 2018, 10, 3950. [Google Scholar] [CrossRef] [Green Version]
  15. Zheng, W.; Li, B.; Cai, J.; Li, Y.; Qian, L. Microclimate characteristics in the famous dwellings: A case study of the Hakka Tulou in Hezhou, China. Urban Clim. 2021, 37, 100824. [Google Scholar] [CrossRef]
  16. Yu, W.; Li, B.Z.; Yao, R.M.; Wang, D.; Li, K.T. A study of thermal comfort in residential buildings on the Tibetan Plateau, China. Build. Environ. 2017, 119, 71–86. [Google Scholar] [CrossRef] [Green Version]
  17. Zhang, L.; Yu, Y.; Hou, J.; Meng, X.; Wang, Q. Field Research on The Summer Thermal Environment of Traditional Folk Tibetan-style Houses in Northwest Sichuan Plateau. Procedia Eng. 2017, 205, 438–445. [Google Scholar] [CrossRef]
  18. Lopez-Cabeza, V.P.; Galan-Marin, C.; Rivera-Gomez, C.; Roa-Fernandez, J. Courtyard microclimate ENVI-met outputs deviation from the experimental data. Build. Environ. 2018, 144, 129–141. [Google Scholar] [CrossRef]
  19. Huang, Z.F.; Cheng, B.; Gou, Z.H.; Zhang, F. Outdoor thermal comfort and adaptive behaviors in a university campus in China’s hot summer-cold winter climate region. Build. Environ. 2019, 165, 401–414. [Google Scholar] [CrossRef]
  20. ISO 7726-1998; Ergonomics of the Thermal Environment-Instruments for Measuring Physical Quantities. International Organization for Standardization: Geneva, Switzerland, 1998.
  21. Gou, Z.; Lau, S.S. Contextualizing green building rating systems: Case study of Hong Kong. Habitat Int. 2014, 44, 282–289. [Google Scholar] [CrossRef]
  22. Matzarakis, A.; Rutz, F.; Mayer, H. Modelling radiation fluxes in simple and complex environments: Basics of the RayMan model. Int. J. Biometeorol. 2010, 54, 131–139. [Google Scholar] [CrossRef] [PubMed] [Green Version]
  23. Kumar, R.; Garg, S.N.; Kaushik, S.C. Performance evaluation of multi-passive solar applications of a non air-conditioned building. Int. J. Environ. Technol. Manag. 2005, 5, 60–75. [Google Scholar] [CrossRef]
  24. Matzarakis, A.; Endler, C. Climate change and thermal bioclimate in cities: Impacts and options for adaptation in Freiburg, Germany. Int. J. Biometeorol. 2010, 54, 479–483. [Google Scholar] [CrossRef] [PubMed]
  25. Lin, T.P.; Matzarakis, A.; Hwang, R.L. Shading effect on long-term outdoor thermal comfort. Build. Environ. 2010, 45, 213–221. [Google Scholar] [CrossRef]
  26. Yasa, E.; Ok, V. Evaluation of the effects of courtyard building shapes on solar heat gains and energy efficiency according to different climatic regions. Energy Build. 2014, 73, 192–199. [Google Scholar] [CrossRef]
  27. Subhashini, S.; Thirumaran, K. A passive design solution to enhance thermal comfort in an educational building in the warm humid climatic zone of Madurai. J. Build. Eng. 2018, 18, 395–407. [Google Scholar] [CrossRef]
Figure 1. Chinese architectural design zoning and the location of experimental objects.
Buildings 12 00049 g001
Figure 2. Monthly change in average temperature in Ganzi from 2016 to 2018.
Buildings 12 00049 g002
Figure 3. Residents’ daily courtyard activities.
Buildings 12 00049 g003
Figure 4. Village survey situation, location of measurement points, and basic situation of courtyards.
Buildings 12 00049 g004
Figure 5. Four types of representative courtyards. ((AD) respectively represent the number of the courtyard under test).
Buildings 12 00049 g005
Figure 6. Comparison of air temperature changes in different courtyards.
Buildings 12 00049 g006
Figure 7. Comparison of relative humidity changes in different courtyards.
Buildings 12 00049 g007
Figure 8. Comparison of solar radiation changes in different courtyards.
Buildings 12 00049 g008
Figure 9. Comparison of wind speed changes in different courtyards.
Buildings 12 00049 g009
Figure 10. Comparison of Tmrt changes in different courtyards.
Buildings 12 00049 g010
Figure 11. Comparison of PET changes in different courtyards.
Buildings 12 00049 g011
Figure 12. The relationship between PET and air temperature in different courtyards. ((AD) respectively represent the number of the courtyard under test).
Buildings 12 00049 g012
Figure 13. The relationship between PET and solar radiation at different courtyards. ((AD) respectively represent the number of the courtyard under test).
Buildings 12 00049 g013
Figure 14. The relationship between PET and Tmrt in different courtyards. ((AD) respectively represent the number of the courtyard under test).
Buildings 12 00049 g014
Figure 15. The relationship between PET and wind speed in different courtyards. ((AD) respectively represent the number of the courtyard under test).
Buildings 12 00049 g015
Table 1. Construction materials and details of each measuring point.
Material/Height of Courtyard WallMaterial/Height of Main BuildingSurface MaterialAnnex Building MaterialCourtyard Door Orientation
AStone masonry/1.8 mStone masonry/9.8 mDry bare landBrick and concreteSE73°
BCement ancillary building/3.5 mStone masonry/9.3 mConcreteBrick and concreteSE142°
CGray brickwork/1.5 mStone masonry/9.3 mDry bare land/SW235°
DStone masonry/1.5 mStone masonry(2)/8.4 m/6.2 mDry bare land and Dry lawn/SE12°
O
(Point of contrast)
//Dry bare land and Dry lawn//
Table 2. Measurement date, time, and on-site photos.
PointDateDurationOn Site
A12~13Two days Buildings 12 00049 i001
B12~13Two days Buildings 12 00049 i002
C14~15Two days Buildings 12 00049 i003
D14~15Two days Buildings 12 00049 i004
O12~15Four days Buildings 12 00049 i005
Table 3. The measurement instrument set and accuracy.
Test Instrument NameMeasured ParameterModelRangeAccuracyManufacturer
Temperature and humidity autometerAir temperatureMicrologproII−40 to 80 °C±0.3 °CFOURTEC
Relative humidity 5–95%±2%
Solar radiation meterSolar radiationJTR050–2000 W/m2±5%JANTYTECH
Globe temperature probeGlobe temperatureTesto 4800~120 °C±0.1 °CTesto
Hand-held anemometerWind speedTesto 410-10.4~20 m/s±0.2 m/sTesto
Table 4. Descriptive statistics of temperature at each test point on the 12th and 13th (°C).
OAB
MeanMinMaxSDMeanMinMaxSDMeanMinMaxSD
122.9−11.912.86.89−10.2208.56.2−913.74.8
136.7−6.116.55.510.7−318.85.26.6−513.83.1
Table 5. Descriptive statistics of temperature at each test point on the 14th and 15th (°C).
OCD
MeanMinMaxSDMeanMinMaxSDMeanMinMaxSD
145.25−11.8136.66.7−14.419.79.63.16−16.813.68.8
156.14−9.618.68.86.5−1122.78.56.26−15.517.29.5
Table 6. Descriptive statistics of relative humidity at each test point on the 12th and 13th (%).
OAB
MeanMinMaxSDMeanMinMaxSDMeanMinMaxSD
1215.39.631.8611629.5612.0625.34.7
1328.615.465.810.624.116.258.16.324.317.951.25.7
Table 7. Descriptive statistics of relative humidity at each test point on the 14th and 15th (%).
OCD
MeanMinMaxSDMeanMinMaxSDMeanMinMaxSD
1414.24.748.611.414.1359.414.917.3462.118.1
1515.44.947.511.914.23.844.711.915.23.862.416.7
Table 8. Descriptive statistics of solar radiation at each test point on the 12th and 13th (W/m2).
OAB
MeanMinMaxSDMeanMinMaxSDMeanMinMaxSD
12470.288682172.7539.165751185.430123729274.3
13414.087784203.7463.281844222.6349.546891293.1
Table 9. Descriptive statistics of solar radiation at each test point on the 12th and 13th (W/m2).
OCD
MeanMinMaxSDMeanMinMaxSDMeanMinMaxSD
14473.897658159.5536.218755216.0503.510744252.5
15523.9103709172.9455.920668185.5402.714638203.8
Table 10. Descriptive statistics of wind speed at each test point on the 12th and 13th (m/s).
OAB
MeanMinMaxSDMeanMinMaxSDMeanMinMaxSD
121.102.80.520.401.50.380.4010.29
132.20.46.51.650.902.10.600.801.80.53
Table 11. Descriptive statistics of wind speed at each test point on the 14th and 15th (m/s).
OCD
MeanMinMaxSDMeanMinMaxSDMeanMinMaxSD
1420.56.91.36103.50.751040.77
151.90.46.11.340.7030.700.6030.64
Table 12. Descriptive statistics of Tmrt at each test point on the 12th and 13th (°C).
OAB
MeanMinMaxSDMeanMinMaxSDMeanMinMaxSD
1264.628.2102.417.4532.39.15611.4831.45.98721.26
1360.725.1101.520.2034.510.162.213.0032.64.891.222.39
Table 13. Descriptive statistics of Tmrt at each test point on the 14th and 15th (°C).
OCD
MeanMinMaxSDMeanMinMaxSDMeanMinMaxSD
1470.343.999.911.0045.516.784.519.9453.9−1.3106.926.60
1573.953.3101.811.7542.57.169.517.1944.81.684.321.05
Table 14. PET descriptive statistics at each test point on the 12th and 13th (°C).
OAB
MeanMinMaxSDMeanMinMaxSDMeanMinMaxSD
1224.27.3037.508.318.95.326.35.316.483.543.311.48
1321.71.941.510.917.2731.26.2114.782.13710.1
Table 15. PET descriptive statistics at each test point on the 14th and 15th (°C).
OCD
MeanMinMaxSDMeanMinMaxSDMeanMinMaxSD
1423.0313.2324.820.1111.231.65.420.70.535.311.3
1527.17.8356.119.53.1316.3221.4−1.435.29.9
Publisher’s Note: MDPI stays neutral with regard to jurisdictional claims in published maps and institutional affiliations.

