Evaluating the Connection between Thermal Comfort and Productivity in Buildings: A Systematic Literature Review


Abstract
:1. Introduction
2. Materials and Methods
2.1. Analysis of the Objectives and Defining the Research Questions (RQs)
- (a)
- Currently, people spend up to 87% of their time in indoor environments, be it in residential or commercial buildings, and another 6% in their vehicles, and thus are continually being exposed to the indoor environment [45]. According to Wong et al. (2007) [46], the acceptance of an environment by its occupants depends on environmental parameters, namely thermal comfort, indoor air quality (IAQ), sound, and visual comfort, which are identified to determine indoor environmental quality.
- (b)
- Different levels of activity require specific environmental conditions for people, in order to attain thermal comfort. Throughout all these years of research, it is generally agreed upon that there must be an ideal temperature or, more precisely, an ideal temperature range for performance. Thermal comfort strongly influences the occupants’ productivity. The occupants who report complaints of thermal discomfort reported low productivity [21,47,48]. Seppänen and Fisk (2006) [37] studied the connection between temperature and productivity and showed that maximum performance was observed at 21.6 °C. On the other hand, the theory of adaptative comfort by De Dear and Brager (1998) [49] suggests that ideal productivity can be reached on a wider scale of indoor temperatures. Based on this premise, RQ2 is devised:
- (c)
- Productivity is related to individuals’ performance with regards to their objectives. So far, there is no standard for measuring productivity and it is not easy to measure the thermal effect on human performance at the workplace because there are many variables related to specific tasks in specific contexts which cannot be adequately recorded [50]. RQ3 is devised based on this reference:
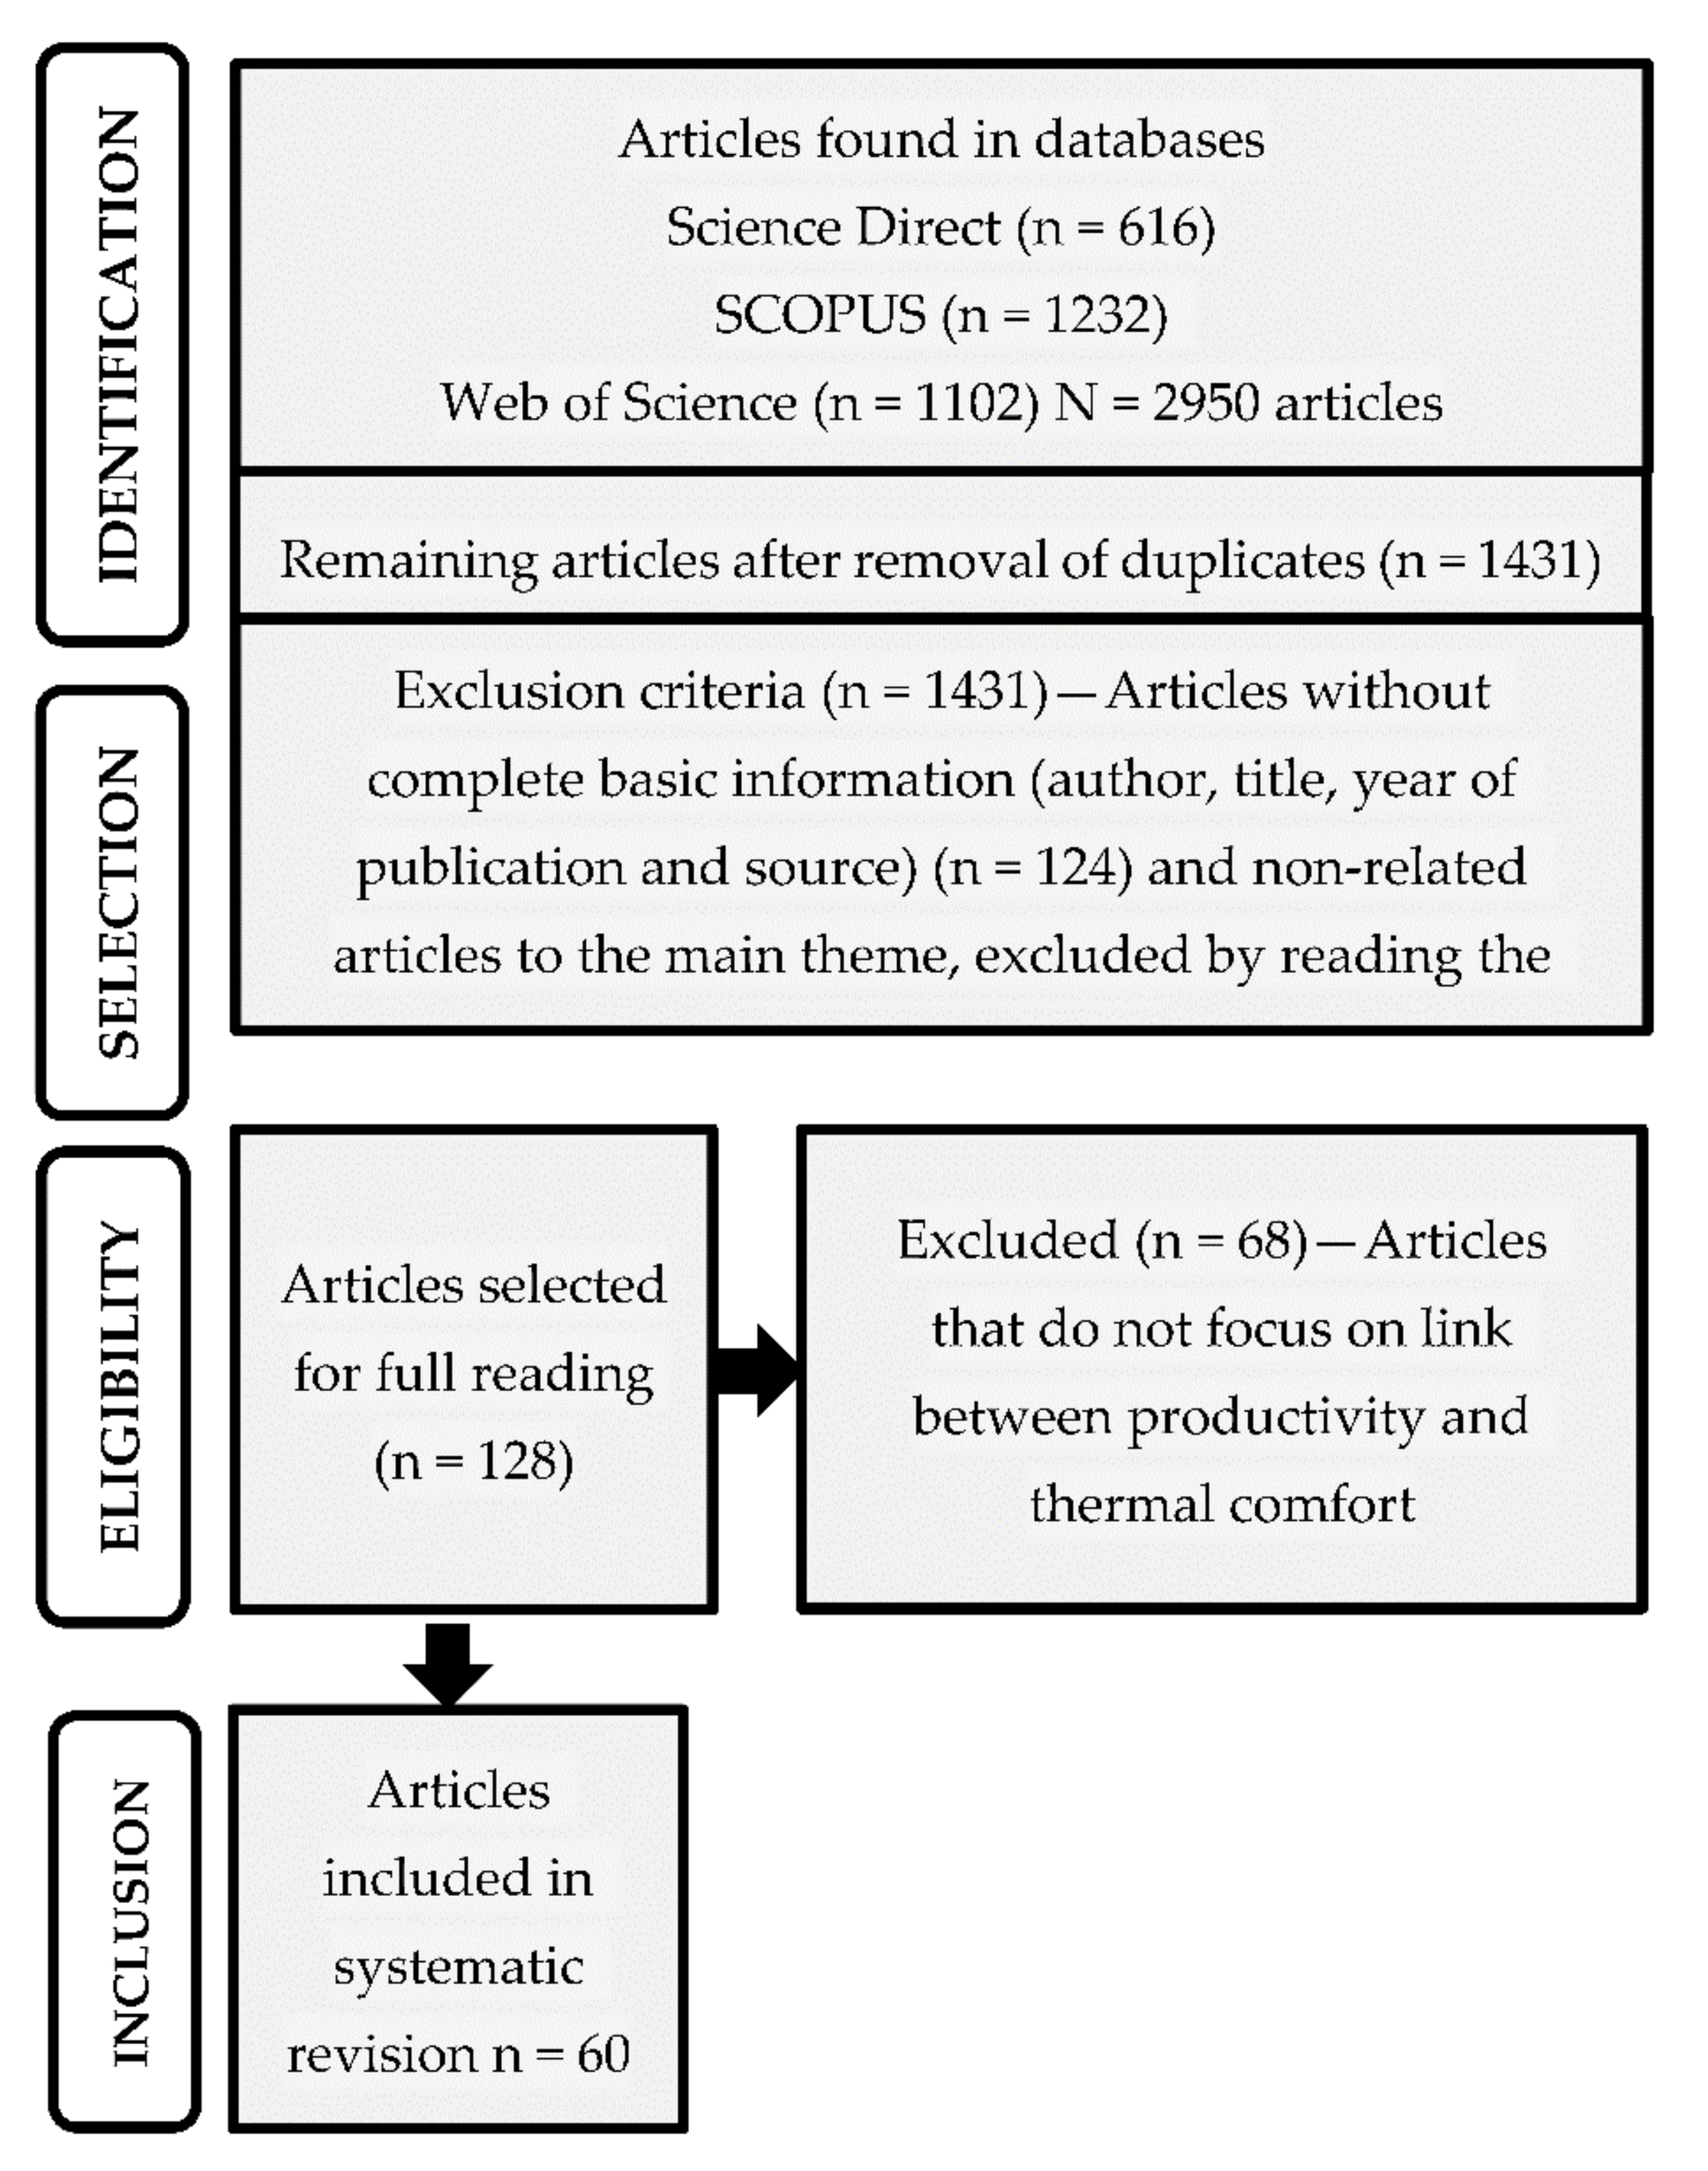
2.2. Systematic Literature Review: Selecting and Forming Articles Database
2.2.1. Search Strategy
2.2.2. Inclusion and Exclusion Criteria
3. Results
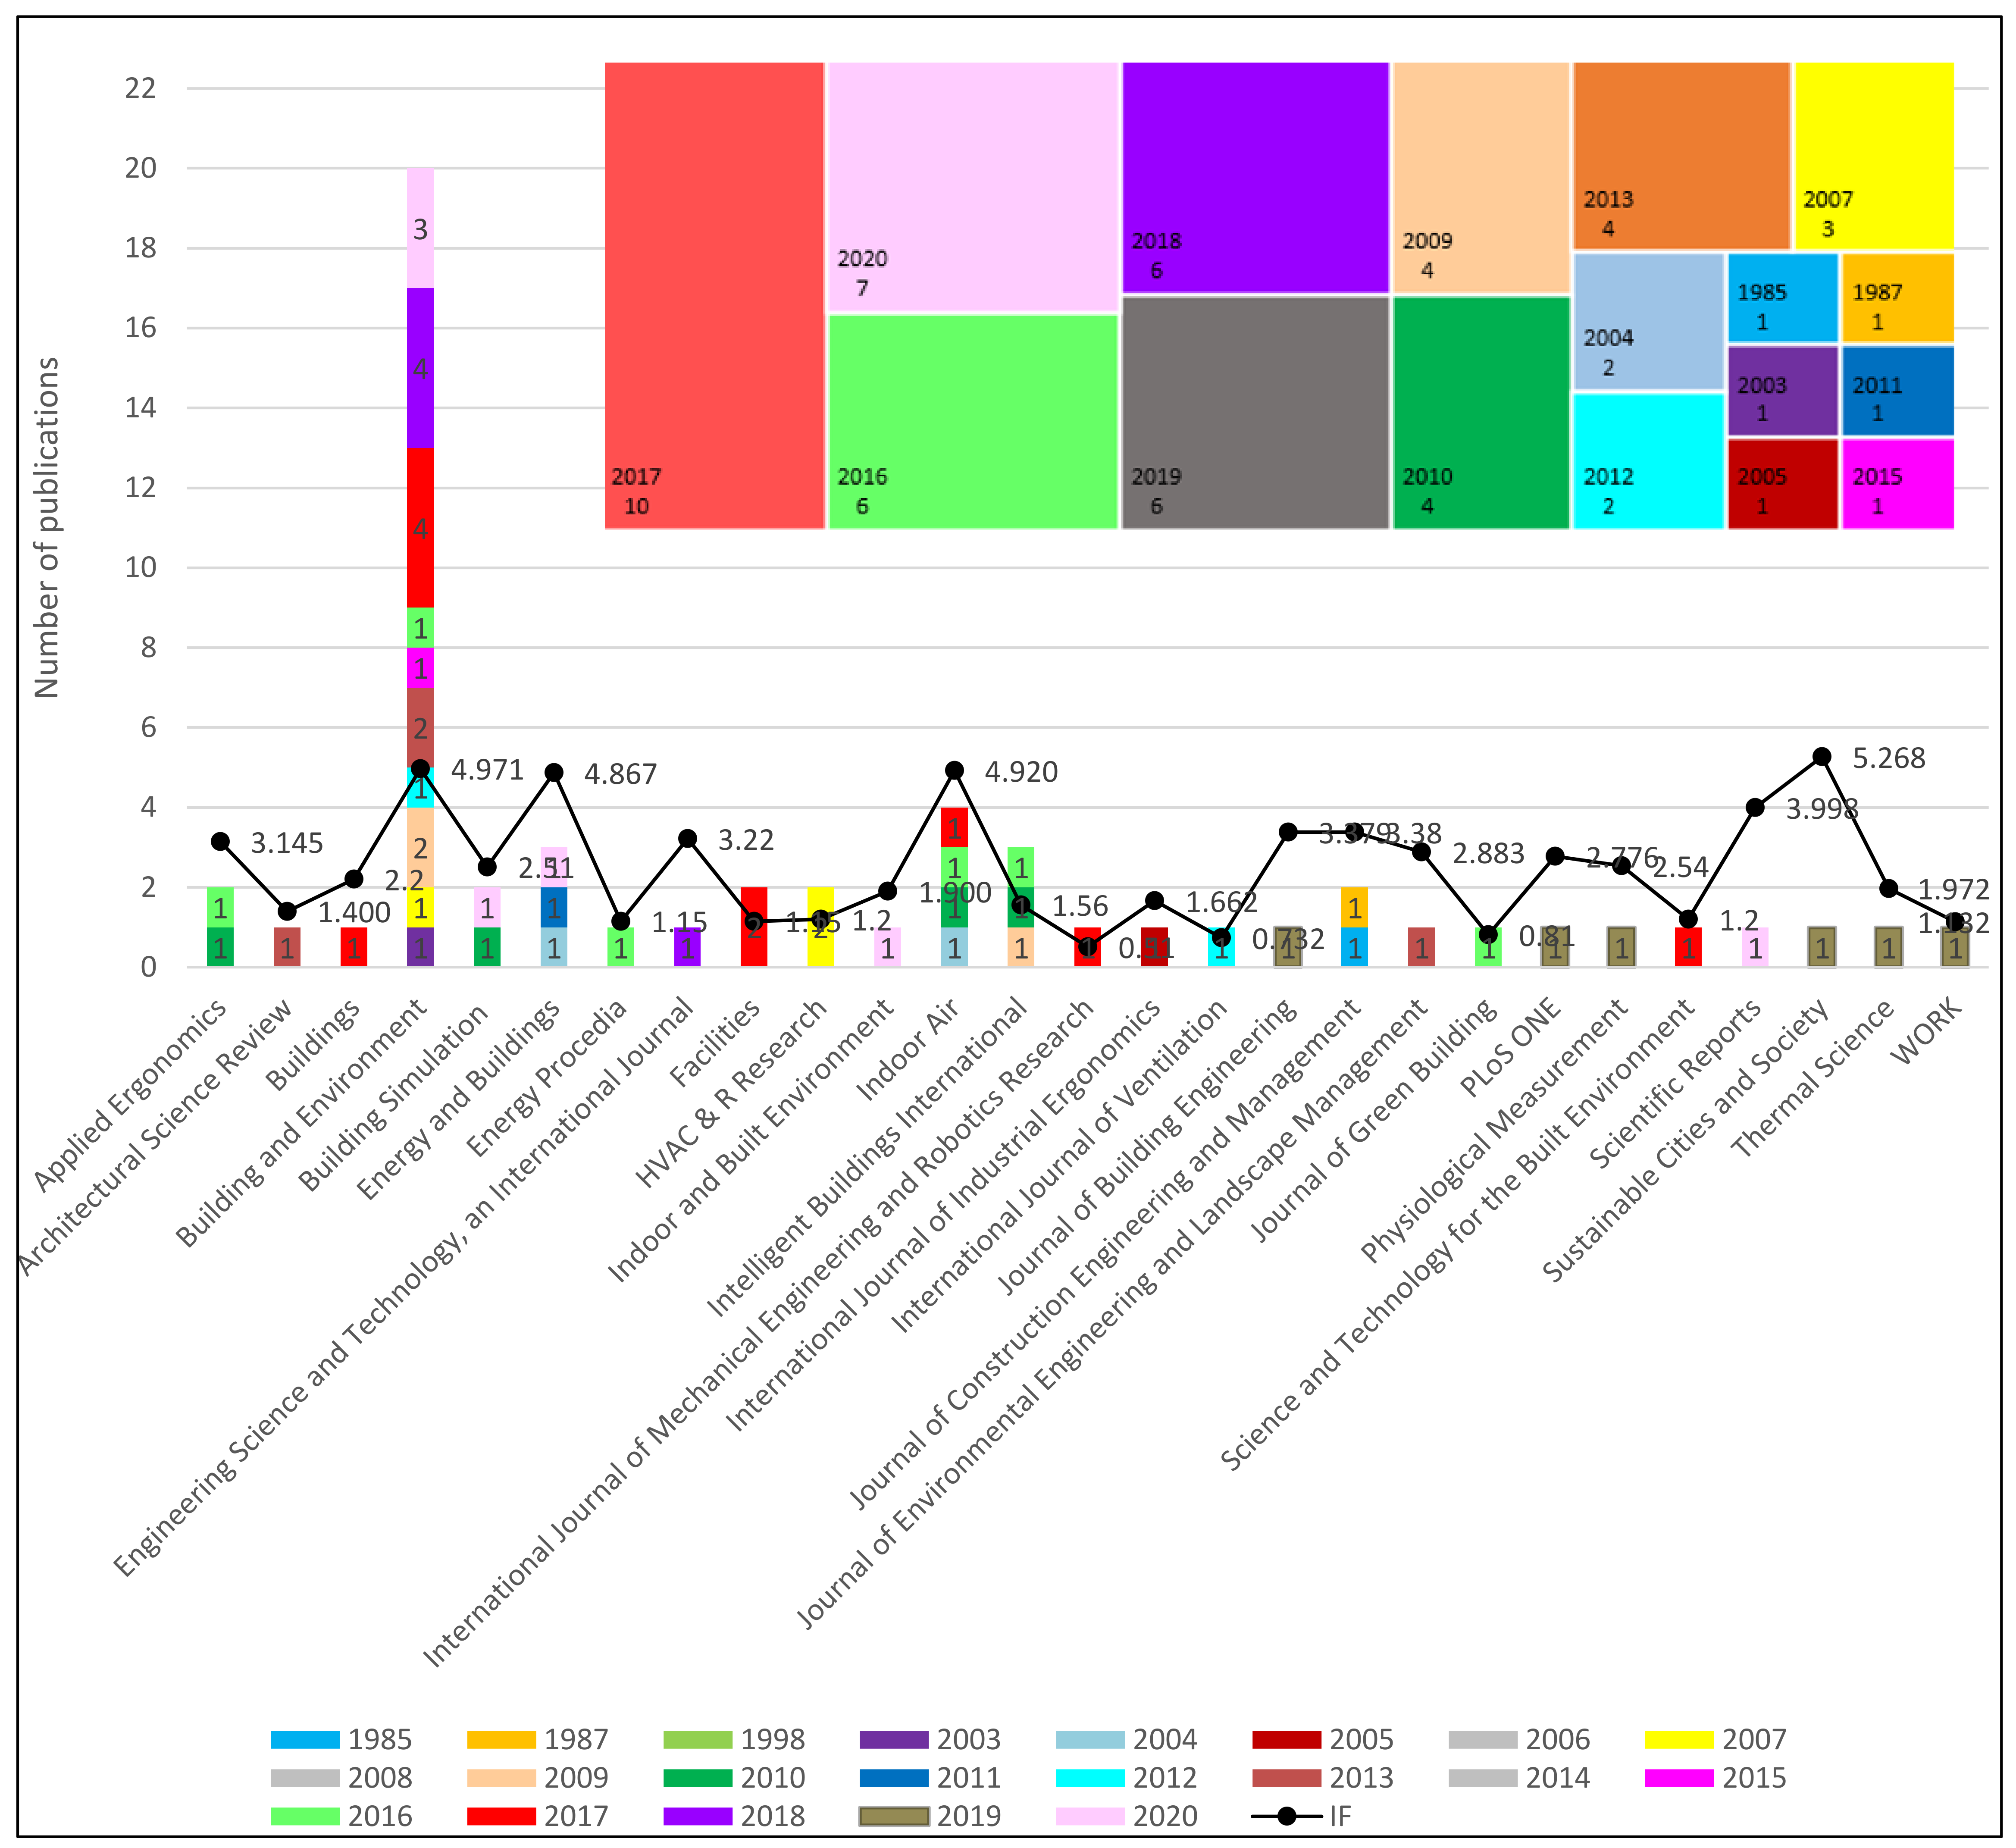
3.1. General View of the Selected Studies
3.2. Review Papers
3.3. Ways of Assessing Productivity
4. Discussion
5. Future Trends and Gap Researches
- (a)
- there are still very few studies that provide us with ways of calculating productivity,
- (b)
- there are few articles that discuss all the IEQ and personal factors which are necessary to calculate productivity.
6. Conclusions
Author Contributions
Funding
Institutional Review Board Statement
Informed Consent Statement
Data Availability Statement
Conflicts of Interest
References
- Gani, A.Z.; Zamberi, M.M.; Teni, M.H.M. A Review of Ergonomics towards Productivity. Int. J. Sup. Chain. Mgt. 2018, 7, 306. [Google Scholar]
- Bellia, L.; d’Ambrosio Alfano, F.R.; Fragliasso, F.; Palella, B.I.; Riccio, G. On the interaction between lighting and thermal comfort: An integrated approach to IEQ. Energy Build. 2021, 231, 110570. [Google Scholar] [CrossRef]
- Roelofsen, P. The impact of office environments on employee performance: The design of the workplace as a strategy for productivity enhancement. J. Facil. Manag. 2002, 1, 247–264. [Google Scholar] [CrossRef]
- Lorsch, H.G.; Ossama, A.A. The impact of the building indoor environment on occupant productivity-part 1: Recent studies, measures, and costs. ASHRAE Trans. 1994, 100, 741–749. [Google Scholar]
- Broadbent, D. Decision and Stress; Academic Press: New York, NY, USA, 1971. [Google Scholar]
- Clausen, G.; Wyon, D.P. The combined effects of many different indoor environmental factors on acceptability and office work performance. HVAC&R Res. 2008, 14, 103–113. [Google Scholar]
- Cui, W.; Cao, G.; Ouyang, Q.; Zhu, Y. Influence of dynamic environment with different airflows on human performance. Build. Environ 2013, 62, 124–132. [Google Scholar] [CrossRef]
- Hygge, S.; Knez, I. Effects of noise, heat and indoor lighting on cognitive performance and self-reported affect. J. Environ. Psychol. 2001, 21, 291–299. [Google Scholar] [CrossRef]
- Lan, L.; Lian, X.Z.; Pan, L. The effects of air temperature on office workers’ well-being, workload, and productivity-evaluated with subjective ratings. Appl. Ergon. 2010, 42, 29–36. [Google Scholar] [CrossRef]
- Witterseh, T.; Wyon, D.P.; Clausen, G. The effects of moderate heat stress and open-plan office noise distraction on SBS symptoms and on the performance of office work. Indoor Air 2004, 14, 30–40. [Google Scholar] [CrossRef]
- De Giuli, V.; Da Pos, O.; De Carli, M. Indoor environmental quality and pupil perception in Italian primary schools. Build. Environ. 2012, 56, 335–345. [Google Scholar] [CrossRef]
- Al Horr, Y.; Arif, M.; Katafygiotou, M.; Mazroei, A.; Kaushik, A.; Elsarrag, E. Impact of indoor environmental quality on occupant well-being and comfort: A review of the literature. Int. J. Sustain. Built Environ. 2016, 5, 1–11. [Google Scholar] [CrossRef]
- Roskams, M.; Haynes, B. Predictive analytics in facilities management: A pilot study for exploring environmental comfort using wireless sensors. J. Facil. Manag. 2019, 17, 356–370. [Google Scholar] [CrossRef]
- Lamb, S.; Kwok, K.C.S. A longitudinal investigation of work environment stressors on the performance and wellbeing of office workers. Appl. Ergon. 2016, 52, 104–111. [Google Scholar] [CrossRef]
- Fisk, W.J.; Rosenfeld, A.H. Estimates of improved productivity and health from better indoor environments. Indoor Air. 1997, 7, 158–172. [Google Scholar] [CrossRef]
- Mui, K.W.; Tsang, T.W.; Wong, L.T. Bayesian updates for indoor thermal comfort models. J. Build. Eng. 2019, 29, 101117. [Google Scholar] [CrossRef]
- Fanger, P.O. Thermal Comfort: Analysis and Application in Environmental Engineering; Danish Technical Press: Copenhagen, Denmark, 1970. [Google Scholar]
- ASHRAE. Thermal Environmental Conditions for Human Occupancy; ANSI/ASHARE Standard 55-2017; American Society of Heating, Refrigerating and Air Conditioning Engineers, Inc.: Atlanta, GA, USA, 2017. [Google Scholar]
- Kosonen, R.; Tan, F. Assessment of productivity loss in air-conditioned buildings using PMV index. Energy Build. 2004, 36, 987–993. [Google Scholar] [CrossRef]
- Lorsch, H.G.; Abdou, O.A. The Impact of the Building Indoor Environment on Occupant Productivity. ASHRAE Trans. Symp. 1994, 100, 895–901. [Google Scholar]
- Akimoto, T.; Tanabe, S.; Yanai, T.; Sasaki, M. Thermal comfort and productivity-Evaluation of workplace environment in a task conditioned office. Build. Environ. 2010, 45, 45–50. [Google Scholar] [CrossRef]
- Berglund, L.; Gonzales, R.; Gagge, A. Predicting human performance decrement from thermal discomfort and effective temperature. In Proceedings of the Fifth International Conference on Indoor Air Quality and Climate, Toronto, ON, Canada, 29 July–3 August 1990; Volume 1, pp. 215–220. [Google Scholar]
- Clements-Croome, D. Influence of social organization and environmental factors and well-being in the office workplace. In Proceedings of the International Conference CLIMA 2000 World Congress, Naples, Italy, 15–18 September 2001. [Google Scholar]
- Sensharma, N.P.; Woods, J.E.; Goodwin, A.K. Relationship between the indoor environment and productivity: A literature review. ASHRAE Trans. 1998, 104, 686–701. [Google Scholar]
- Nico, M.A.; Liuzzi, S.; Stefanizzi, P. Evaluation of thermal comfort in university classrooms through objective approach and subjective preference analysis. Appl. Ergon. 2015, 48, 111–120. [Google Scholar] [CrossRef]
- Ossama, A.A.; Gamal, M.E.K.; Amal, A.A. Correlation between indoor environmental quality and productivity in buildings. In Proceedings of the 19th of IAPS, Cairo, Egypt; 2006. [Google Scholar]
- Parsons, K. Human Thermal Environments: The Effects of Hot, Moderate, and Cold Environments on Human Health, Comfort, and Performance, 3rd ed.; Taylor & Francis: London, UK, 2014. [Google Scholar]
- Bailey, R.W. Human Performance Engineering: A Guide for System Designers; Bell Telephone Laboratories, Incorporated: New York, NY, USA, 1982. [Google Scholar]
- Wickens, C.D.; Hollands, J.G. Engineering Psychology and Human Performance, 3rd ed.; Prentice-Hall Inc.: Hoboken, NJ, USA, 2000. [Google Scholar]
- Parsons, K.C. Human Thermal Environments: The Effects of Hot, Moderate and Cold Environments on Human Health, Comfort and Performance; The Principles and the Practice; Taylor & Francis: London, UK, 1993. [Google Scholar]
- Oseland, N. Environmental Factors Affecting Office Worker Performance: A Review of Evidence; CIBSE: London, UK, 1999. [Google Scholar]
- Ilgen, D.R.; Schneider, J. Performance Measurement: A Multi-Discipline View. In International Review of Industrial and Organizational Psychology; Cooper, C.L., Roberson, S.L., Eds.; John Wiley and Sons: Chichester, UK, 1991; pp. 71–108. [Google Scholar]
- Oseland, N.; Bartlett, P. Improving Office Productivity. In A Guide for Business and Facilities Managers; Longman: London, UK, 1999. [Google Scholar]
- Heerwagen, J. Green Buildings, organizational success and occupant productivity. Build. Res. Inf. 2000, 28, 353–367. [Google Scholar] [CrossRef]
- Feige, A.; Wallbaum, H.; Janser, M.; Windlinger, L. Impact of sustainable office buildings on occupant’s comfort and productivity. J. Corp. Real Estate 2013, 15, 7–34. [Google Scholar] [CrossRef]
- Candas, V.; Dufour, A. Thermal comfort: Multisensory interactions? J. Physiol. Anthropol. 2005, 24, 33–36. [Google Scholar] [CrossRef] [PubMed] [Green Version]
- Seppänen, O.; Fisk, W.J. Some Quantitative Relations Between Indoor Environmental Quality and Work Performance or Health. Int. J. HVAC R Res. 2006, 12, 957–973. [Google Scholar] [CrossRef] [Green Version]
- Hoque, S.; Weil, B. The Relationship between comfort perceptions and academic performance in university classroom buildings. J. Green Build. 2016, 11, 108–117. [Google Scholar] [CrossRef]
- Zhang, F.; de Dear, R. University students’ cognitive performance under temperature cycles induced by direct load control events. Indoor Air 2017, 27, 78–93. [Google Scholar] [CrossRef] [Green Version]
- Bajc, T.S.; Banjac, M.J.; Todorović, M.N.; Stevanović, Ž.Ž. Experimental and Statistical Survey on Local Thermal Comfort Impact on Working Productivity loss in University Classrooms. Therm. Sci. 2019, 23, 379–392. [Google Scholar] [CrossRef]
- Wang, D.; Xu, Y.; Liu, Y.; Wang, Y.; Jiang, J.; Wang, X.; Liu, J. Experimental investigation of the effect of indoor air temperature on students’ learning performance under the summer conditions in China. Build. Environ. 2018, 140, 140–152. [Google Scholar] [CrossRef]
- Valančius, R.; Jurelionis, A. Influence of indoor air temperature variation on office work performance. J. Environ. Eng. Landsc. Manag. 2013, 21, 19–25. [Google Scholar] [CrossRef]
- Nematchoua, M.K.; Ricciardi, P.; Orosa, J.A.; Asadi, S.; Choudhary, R. Influence of Indoor Environmental Quality on the Self-estimated Performance of Office Workers in the Tropical Wet and Hot Climate of Cameroon. J. Build. Eng. 2019, 21, 141–148. [Google Scholar] [CrossRef]
- Tarantini, M.; Pernigotto, G.; Gasparella, A. A co-citation analysis on thermal comfort and productivity aspects in production and office buildings. Buildings 2017, 7, 36. [Google Scholar] [CrossRef] [Green Version]
- Klepeis, N.E.; Nelson, W.C.; Ott, W.R.; Robinson, J.; Tsang, A.M.; Switzer, P.; Behar, J.V.; Hern, S.; Engelmann, W. The National Human Activity Pattern Survey (NHAPS): A Resource for Assessing Exposure to Environmental Pollutants. J. Expos. Anal. Environ. Epidem. 2021, 11, 231–252. [Google Scholar] [CrossRef] [Green Version]
- Wong, L.T.; Mui, K.W.; Hui, P.S. A multivariate-logistic model for acceptance of indoor environmental quality (IEQ) in offices. Build. Environ. 2008, 43, 1–6. [Google Scholar] [CrossRef]
- Roelofsen, P. Healthy ageing: Differences between elderly and non-elderly in temperature sensation and dissatisfied. Intell. Build. Int. 2017, 9, 123–136. [Google Scholar] [CrossRef]
- Lan, L.; Wargocki, P.; Lian, Z. Quantitative measurement of productivity loss due to thermal discomfort. Energy Build. Int. 2011, 43, 1057–1062. [Google Scholar] [CrossRef]
- De Dear, R.J.; Brager, G.S. Developing an adaptive model of thermal comfort and preference. ASHRAE Trans. 1998, 104, 145–167. [Google Scholar]
- Zhang, F.; de Dear, R.; Hancock, P. Effects of moderate thermal environments on cognitive performance: A multidisciplinary review. Appl. Energy 2019, 236, 760–777. [Google Scholar] [CrossRef]
- Moher, D.; Liberati, A.; Tetzlaff, J.; Altman, D.G. Preferred reporting items for systematic reviews and meta-analyses: The PRISMA statement. Int. J. Surg. 2010, 8, 336–341. [Google Scholar] [CrossRef] [Green Version]
- Broday, E.E.; Xavier, A.A.P. A systematic literature review on thermal response votes (Tsv) and predicted mean vote (pmv). In Proceedings of the Occupational Safety and Hygiene VI—Selected contributions from the International Symposium Occupational Safety and Hygiene (SHO 2018), Guimarães, Portugal, 26–27 March 2018; pp. 13–17. [Google Scholar]
- Marchenko, A.; Temeljotov-Salaj, A. A Systematic Literature Review of Non-Invasive Indoor Thermal Discomfort Detection. Appl. Sci. 2020, 10, 4085. [Google Scholar] [CrossRef]
- Merabet, G.H.; Essaaidi, M.; Ben Haddou, M.; Qolomany, B.; Qadir, J.; Anan, M.; Al-Fuqaha, A.; Abid, M.R.; Benhaddou, D. Intelligent building control systems for thermal comfort and energy-efficiency: A systematic review of artificial intelligence-assisted techniques. Renew. Sustain. Energy Rev. 2021, 144, 110969. [Google Scholar] [CrossRef]
- Mohamed, S.; Srinavin, K. Forecasting labor productivity changes in construction using the PMV index. Int. J. Ind. Ergon. 2005, 35, 345–351. [Google Scholar] [CrossRef]
- Jin, Q.; Overend, M.; Thompson, P. Towards productivity indicators for performance-based façade design in commercial buildings. Build. Environ. 2012, 57, 271–281. [Google Scholar] [CrossRef]
- Roelofsen, P. A computer model for the assessment of employee performance loss as a function of thermal discomfort or degree of heat stress. Intell. Build. Int. 2016, 8, 195–214. [Google Scholar] [CrossRef]
- Rasheed, E.O.; Byrd, H. Can self-evaluation measure the effect of IEQ on productivity? A review of literature. Facilities 2017, 35, 601–621. [Google Scholar] [CrossRef] [Green Version]
- Mujan, I.; Anđelković, A.; Munćan, V.; Kljajić, M.; Ružić, D. Influence of Indoor Environmental Quality on human Health and Productivity—A Review. J. Clean. Prod. 2019, 217, 646–657. [Google Scholar] [CrossRef]
- Balzer, W.K.; Sulsky, L.M. Performance Appraisal Effectiveness. In Psychology in Organizations: Integrating Science and Practice; Murphy, K.R., Saal, F.E., Eds.; Erlbaum: Hillsdale, NJ, USA, 1990; pp. 133–156. [Google Scholar]
- Banks, C.G.; Murphy, K.R. Toward Narrowing the Research-Practice Gap in Performance Appraisal. Pers. Psychol. 1985, 38, 335–345. [Google Scholar] [CrossRef]
- Kaushik, A.; Arif, M.; Tumula, P.; Ebohon, O.J. Effect of thermal comfort on occupant productivity in office buildings: Response surface analysis. Build. Environ. 2020, 180, 107021. [Google Scholar] [CrossRef]
- Ngarmpornprasert, S.; Koetsinchai, W. The effect of air-conditioning on worker productivity in office buildings: A case study in Thailand. Build. Simul. 2010, 3, 165–177. [Google Scholar] [CrossRef]
- Chang, T.Y.; Kajackaite, A. Battle for the thermostat: Gender and the effect of temperature on cognitive performance. PLoS ONE 2019, 14, 0216362. [Google Scholar] [CrossRef]
- Andargie, M.S.; Azar, E. An applied framework to evaluate the impact of indoor office environmental factors on occupants’ comfort and working conditions. Sustain. Cities Soc. 2019, 46, 101447. [Google Scholar] [CrossRef]
- Maula, H.; Hongisto, V.; Östman, L.; Haapakangas, A.; Koskela, H.; Hyönä, J. The effect of slightly warm temperature on work performance and comfort in open-plan offices—A laboratory study. Indoor Air 2016, 26, 286–297. [Google Scholar] [CrossRef]
- Mallawaarachchi, H.; De Silva, L.; Rameezdeen, R. Modelling the relationship between green built environment and occupants’ productivity. Facilities 2017, 35, 170–187. [Google Scholar] [CrossRef]
- Schellen, L.; van Marken Lichtenbelt, W.D.; Loomans, M.G.L.C.; Toftum, J.; De Wit, M.H. Differences between young adults and elderly in thermal comfort, productivity, and thermal physiology in response to a moderate temperature drift and a steady-state condition. Indoor Air 2010, 20, 273–283. [Google Scholar] [CrossRef]
- Kekäläinen, P.; Niemelä, R.; Tuomainen, M.; Kemppilä, S.; Palonen, J.; Riuttala, H.; Reijula, K. Effect of reduced summer indoor temperature on symptoms, perceived work environment and productivity in office work: An intervention study. Intell. Build. Int. 2010, 2, 251–266. [Google Scholar]
- Tanabe, S.; Nishihara, N.; Haneda, M. Indoor Temperature, Productivity, and Fatigue in Office Tasks. HVAC R Res. 2007, 13, 623–633. [Google Scholar] [CrossRef]
- Srinavin, K.; Mohamed, S. Thermal environment and construction workers’ productivity: Some evidence from Thailand. Build. Environ. 2003, 38, 339–345. [Google Scholar] [CrossRef]
- Kang, S.; Ou, D.; Ming Mack, C. The impact of indoor environmental quality on work productivity in university open-plan research offices. Build. Environ. 2017, 124, 78–89. [Google Scholar] [CrossRef]
- Wang, D.; Song, C.; Wang, Y.; Xu, Y.; Liu, Y.; Liu, J. Experimental investigation of the potential influence of indoor air velocity on students’ learning performance in summer conditions. Energy Build. 2020, 219, 110015. [Google Scholar] [CrossRef]
- Fahed, A.K.; Ozkaymak, M.; Ahmed, S. Impacts of heat exposure on workers’ health and performance at steel plant in Turkey. Eng. Sci. Technol. Int. J. 2018, 21, 745–752. [Google Scholar] [CrossRef]
- Liu, W.; Zhong, W.; Wargocki, P. Performance, acute health symptoms and physiological responses during exposure to high air temperature and carbon dioxide concentration. Build Environ. 2017, 114, 96–105. [Google Scholar] [CrossRef] [Green Version]
- Sarbu, I.; Pacurar, C. Experimental and numerical research to assess indoor environment quality and schoolwork performance in university classrooms. Build. Environ. 2015, 93, 141–154. [Google Scholar] [CrossRef]
- Sun, C.; Han, Y.; Luo, L.; Sun, H. Effects of air temperature on cognitive work performance of acclimatized people in severely cold region in China. Indoor Built Environ. 2020, 1–22. [Google Scholar] [CrossRef]
- Wu, J.; Hou, Z.; Shen, J.; Lian, Z. Quantitative effect on work performance considering interactions among multiple indoor environmental factors. Build. Environ. 2020, 185, 107286. [Google Scholar] [CrossRef]
- Tanabe, S.; Iwahashi, Y.; Tsushima, S.; Nishihara, N. Thermal comfort and productivity in offices under mandatory electricity savings after the Great East Japan earthquake. Archit. Sci. Rev. 2013, 56, 4–13. [Google Scholar] [CrossRef]
- Elnaklah, R.; Fosas, D.; Natarajan, S. Indoor environment quality and work performance in “green” office buildings in the Middle East. Build. Simul. 2020, 13, 1043–1062. [Google Scholar] [CrossRef]
- Tse, W.L.; So, A.T.P. The importance of human productivity to air-conditioning control in office environments. HVAC R Res. 2007, 1, 3–21. [Google Scholar] [CrossRef]
- Sadick, A.-M.; Kpamma, Z.E.; Agyefi-Mensah, S. Impact of indoor environmental quality on job satisfaction and self-reported productivity of university employees in a tropical African climate. Build. Environ. 2020, 181. [Google Scholar] [CrossRef]
- Lipczynska, A.; Schiavon, S.; Graham, L.T. Thermal comfort and self-reported productivity in an office with ceiling fans in the tropics. Build. Environ. 2018, 135, 202–212. [Google Scholar] [CrossRef] [Green Version]
- De Brito, F.B.R.; Da Silva, L.B.; De Souza, E.L.; Barros, T.S.R. Study of globe temperature relative to air temperature during cognitive activities in information technology laboratories. Work 2019, 1, 393–410. [Google Scholar] [CrossRef]
- D’Oca, S.; Pisello, A.L.; De Simone, M.; Barthelmes, V.M.; Hong, T.; Corgnati, S.P. Human-building interaction at work: Findings from an interdisciplinary cross-country survey in Italy. Build. Environ. 2018, 132, 147–159. [Google Scholar] [CrossRef] [Green Version]
- Hong, T.; Kim, J.; Lee, M. Integrated task performance score for the building occupants based on the CO2 concentration and indoor climate factors changes. Appl. Energy 2018, 228, 1707–1713. [Google Scholar] [CrossRef]
- Shan, X.; Zhou, J.; Chang, V.W.C.; Yang, E.H. Comparing mixing and displacement ventilation in tutorial rooms: Students’ thermal comfort, sick building syndromes, and short-term performance. Build. Environ. 2016, 102, 128–137. [Google Scholar] [CrossRef]
- Kaczmarczyk, J.; Melikov, A.; Fanger, P.O. Human response to personalized ventilation and mixing ventilation. Indoor Air 2004, 8, 17–29. [Google Scholar] [CrossRef] [PubMed]
- Bogdan, A.; Łuczak, A.; Chludzińska, M.; Zwolinska, M. The effect of personalized ventilation on work productivity. Int. J. Vent. 2012, 11, 91–102. [Google Scholar] [CrossRef]
- Tsutsumi, H.; Tanabe, S.; Harigaya, J.; Iguchi, Y.; Nakamura, G. Effect of humidity on human comfort and productivity after step changes from warm and humid environment. Build. Environ. 2007, 42, 4034–4042. [Google Scholar] [CrossRef]
- Bogdan, A.; Chludzińska, M.; Koelblen, B.; Ogłodzinski, K.; Młynarczyk, M. Sensitivity of personalized ventilation air terminal device geometry with regard to a human thermal sensation. Sci. Technol. Built Environ. 2017, 23, 1105–1112. [Google Scholar] [CrossRef]
- Vilcekova, S.; Meciarova, L.; Burdova, E.K.; Katunska, J.; Kosicanova, D.; Doroudiani, S. Indoor environmental quality of classrooms and occupants’ comfort in a special education school in Slovak Republic. Build. Environ. 2017, 120, 29–40. [Google Scholar] [CrossRef]
- Geng, Y.; Ji, W.; Lin, B.; Zhu, Y. The impact of thermal environment on occupant IEQ perception and productivity. Build. Environ. 2017, 121, 158–167. [Google Scholar] [CrossRef]
- Asere, L.; Mols, T.; Blumberga, A. Assessment of indoor air quality in renovated buildings of Liepaja municipality. Energy Procedia 2016, 91, 907–915. [Google Scholar] [CrossRef] [Green Version]
- Tanabe, S.; Kobayashi, K.; Kiyota, O.; Nishihara, N.; Haneda, M. The effect of indoor thermal environment on productivity by a year-long survey of a call centre. Intell. Build. Int. 2009, 1, 184–194. [Google Scholar] [CrossRef]
- Suzianti, A.; Suradi, J.; Nurtjahyo, B.; Brakumara, Y. Analysis of teh indoor environment quality’s impacts on human performance. Int. J. Mech. Eng. Robot. Res. 2017, 6. [Google Scholar] [CrossRef]
- Barbic, F.; Minonzio, M.; Cairo, B.; Shiffer, D.; Dipasquale, A.; Cerina, L.; Vatteroni, A.; Urechie, V.; Verzeletti, P.; Badilini, F. Effects of different classroom temperatures on cardiac autonomic control and cognitive performances in undergraduate students. Physiol. Meas 2019, 40, 054005. [Google Scholar] [CrossRef]
- Zhao, J.; Zhu, N.; Lu, S. Productivity model in hot and humid environment based on heat tolerance time analysis. Build. Environ. 2009, 44, 2202–2207. [Google Scholar] [CrossRef]
- Wong, L.T.; Mui, K.W. Efficiency assessment of indoor environmental policy for airconditioned offices in Hong Kong. Appl. Energy 2009, 86, 1933–1938. [Google Scholar] [CrossRef]
- Jiang, J.; Wang, D.; Liu, Y.; Xu, Y.; Liu, J. A study on pupils’ learning performance and thermal comfort of primary schools in China. Build. Environ. 2018, 134, 102–113. [Google Scholar] [CrossRef]
- Koteswara Rao, K.; Lakshmi Kumar, T.V.; Kulkarni, A.; Hoi Ho, C.; Mahendranath, B.; Desamsetti, S.; Patwardhan, S.; Dandi, A.R.; Barbosa, H. Sudhir Sabade Projections of heat stress and associated work performance over India in response to global warming. Sci. Rep. 2020, 10. [Google Scholar] [CrossRef]
- Koehn, E.; Brown, G. Climatic effects on construction. J. Constr. Eng. Manag. 1985, 111, 129–137. [Google Scholar] [CrossRef]
- Thomas, H.R.; Yakoumis, I. Factor model of construction productivity. J. Constr. Eng. Manag. ASCE 1987, 113, 623–639. [Google Scholar] [CrossRef]
- Jensen, K.L.; Toftum, J.; Friis-Hansen, P. A bayesian network approach to the evaluation of building design and its consequences for employee performance and operational costs. Build. Environ. 2009, 44, 456–462. [Google Scholar] [CrossRef]
- Wyon, D.P. Indoor environmental effects on productivity. In AQ 96 Paths to Better Building Environments; Kevin, Y., Ed.; ASHRAE: Atlanta, GA, USA, 1996. [Google Scholar]
- Onyeizu, E. Can Architecture Increase Productivity? A Case of Green Buildings. Ph.D. Thesis, The University of Auckland, Auckland, New Zealand, 2014. [Google Scholar]
- Byrd, H.; Rasheed, E.O. The Productivity Paradox in Green Buildings. Sustainability 2016, 8, 347. [Google Scholar] [CrossRef] [Green Version]
- Leaman, A.; Bordass, B. Productivity in buildings: The ‘killer’ variables. Build. Res. Inf. 1999, 27, 4–19. [Google Scholar] [CrossRef]
- Haynes, B. An evaluation of office productivity measurement. J. Corp. Real Estate 2007, 9, 144–154. [Google Scholar] [CrossRef]
- Haynes, B.P. The impact of office layout on productivity. J. Facil. Manag. 2008, 6, 189–201. [Google Scholar] [CrossRef] [Green Version]
- LaBar, G. Why employees are sick of indoor air. Occup. Hazards 1992, 54, 32–36. [Google Scholar]
- Frontczak, M.; Wargocki, P. Literature survey on how different factors influence human comfort in indoor environments. Build. Environ. 2011, 46, 922–937. [Google Scholar] [CrossRef]
- Alajmi, A.F.; Baddar, F.A.; Bourisli, R.I. Thermal comfort assessment of an office building served by under-floor air distribution under-floor air distribution (UFAD) system—A case study. Build. Environ. 2015, 85, 153–159. [Google Scholar] [CrossRef]
- Andargie, M.S.; Touchie, M.; O’Brien, W. A review of factors affecting occupant comfort in multi-unit residential buildings. Build. Environ. 2019, 160, 106182. [Google Scholar] [CrossRef]
- Haynes, B.; Suckley, L.; Nunnington, N. Workplace productivity and office type: An evaluation of office occupier differences based on age and gender. J. Corp. Real Estate 2017, 19, 111–138. [Google Scholar] [CrossRef]
- Byrne, N.M.; Hills, A.P.; Hunter, G.R.; Weinsier, R.L.; Schutz, Y. Metabolic equivalent: One size does not fit all. J. Appl. Physiol. 2005, 99, 1112–1119. [Google Scholar] [CrossRef] [Green Version]
- Knapton, S. Women Shiver at Work in ‘Sexist’ Air Conditioning. The Telegraph. 2015. Available online: https://www.telegraph.co.uk/science/women-shiver-at-work-in-sexist-air-conditioning/ (accessed on 26 May 2021).
- Pager, T. Can an Office Temperature Be ‘Sexist’? Women, and Science, Say So. The New York Times. Available online: https://www.nytimes.com/nyregion/office-temperature-sexist-nixoncuomo.htm (accessed on 26 May 2021).
- Clements-Croome, D.E. (Ed.) Indoor environment and productivity. In Creating the Productive, Work, 2nd ed.; Taylor & Francis: London, UK, 2006; pp. 25–54. [Google Scholar]
- Wang, H.; Hu, S. Experimental study on thermal sensation of people in moderate activities. Build. Environ. 2016, 100, 127–134. [Google Scholar] [CrossRef]
- Yau, Y.H.; Chew, B.T. Adaptive thermal comfort model for air-conditioned hospitals in Malaysia. Build. Serv. Eng. Res. Technol. 2014, 35, 117–138. [Google Scholar] [CrossRef]
- Broday, E.E.; de Paula Xavier, A.A. A Method for Predicting the Actual Percentage of Dissatisfied (APD) through a Simple Proposition of Thermal Comfort Zones in a Working Environment. Work 2020, 67, 599–609. [Google Scholar] [CrossRef]


| Inclusion Criteria | Exclusion Criteria |
|---|---|
| a. Studies published in English | a. Studies published in other languages |
| b. Relevant to terms in the research | b. Articles with no link to research terms |
| c. Relevant studies published until 2020 | c. Studies with no bibliographical information such as date/type of publication, volume and number of editions were excluded. |
| d. Published studies with the potential to answer at least one research question | d. Duplicated studies |
| Title, Abstract, Keywords | Science Direct | Scopus | Web of Science |
|---|---|---|---|
| “Thermal Comfort” AND “Predicted Mean Vote” | 351 | 683 | 546 |
| “Thermal Comfort” AND “Predicted Percentage of Dissatisfied” | 67 | 137 | 115 |
| “Thermal Comfort” AND “Productivity” | 138 | 316 | 400 |
| “Predicted Mean Vote” AND “Predicted Percentage of Dissatisfied” | 47 | 102 | 82 |
| “Predicted Mean Vote” AND “Productivity” | 11 | 34 | 32 |
| “Predicted Percentage of Dissatisfied Users” AND “Productivity” | 2 | 6 | 5 |
| Total | 616 | 1232 | 1102 |
| Ref. | Year | Title | Journal/Impact Factor | Number of Citations | Main Goal |
|---|---|---|---|---|---|
| [20] | 2004 | Assessment of productivity loss in air-conditioned buildings using PMV index | Energy and Buildings/4.867 | 235 | Reports on the assessment of productivity loss in air-conditioned office buildings using PMV index. |
| [55] | 2005 | Forecasting labor productivity changes in construction using the PMV index | International Journal of Industrial Ergonomics/1.662 | 59 | Briefly describes and points out the main deficiencies of three models for predicting a productivity/established thermal environment. |
| [56] | 2012 | Towards productivity indicators for performance-based façade design in commercial buildings | Building and Environment/4.971 | 35 | Presents the grounds for establishing links between occupant productivity and combined effects of four IEQ key aspects related to façade, that is, thermal comfort, auditory comfort, visual comfort and air quality, in occupant productivity. |
| [57] | 2016 | A computer model for the assessment of employee performance loss as a function of thermal discomfort or degree of heat stress | Intelligent Buildings International/1.56 | 21 | Presents an overview of different researches and researchers’ attempts to derive a mathematical link between performance loss and employees’ thermal (dis)comfort shown in the sensation of average temperature. |
| [58] | 2017 | Can self-evaluation measure the effect of IEQ on productivity? A review of literature | Facilities/1.150 | 10 | Examines self-evaluation reliability as a method for measuring the effect(s) IEQ on office workers’ productivity. |
| [44] | 2017 | A co-citation analysis on thermal comfort and productivity aspects in production and office buildings | Buildings | 12 | The link between thermal comfort and productivity in workplaces is reviewed and analyzed through a co-citation analysis–that is, a factorial analysis applied to mutual citations of the more relevant contributions. |
| [59] | 2019 | Influence of indoor environmental quality on human health and productivity-A review | Journal of Cleaner Production/7.246 | 56 | Reviews the state of art in literature and establishes a connection between the factors which influence health and productivity in any indoor environment, be it residential or commercial. |
| Ref. | Performance/Productivity Assessment |
|---|---|
| [7,14,40,62,63,64,65,66,67,68,69,70,71,72] | Subjective assessment. |
| [38,43,73,74,75] | Physiological/subjective assessment. |
| [76,77] | Subjective/experimental assessment. |
| [39,78,79] | Physiological/subjective/self-reported assessment. |
| [41] | Body measurements/physiological measurements/subjective assessment/objective (performance and learning tests). |
| [80] | Subjective/Absenteeism/Presenteeism Assessment. |
| [81] | Decrease in productivity/financial loss. |
| [82,83] | Subjective assessment/self-reported productivity. |
| [9,76,84] | Physiological/subjective/objective assessment (tests). |
| [85,86,87,88,89,90,91,92,93,94] | Subjective/objective assessment (tests). |
| [42,95,96] | Objective assessment (performance tests). |
| [48,82,97,98] | Physiological/objective assessment (performance tests). |
| [99] | Subjective assessment/estimated decrease in productivity. |
| [100] | Body measurements/subjective assessment. |
| [101] | Field measurements. |
| [102] | Physical measurements. |
| [103,104] | Data analysis. |
| Ref. | IEQ Factors Used in Research |
|---|---|
| [7] | Conditions for temperature, with constant mechanical wind (CMW) and simulated natural wind (SNW). |
| [9,39,41,43,64,66,68,70,77,95,97,98,100] | Air temperature. |
| [74] | Different levels of WBGT (wet-bulb globe temperature) using PMV productivity model. |
| [78] | Unique temperature experimental factors, relative humidity and fresh air (100% outdoor air). |
| [80] | Air temperature and relative humidity, mean radiant temperature and air velocity. |
| [76] | Measurement of weather parameters for evaluating PMV and PPD indexes. |
| [81] | Performance of two control methods–conventional setting check point and control based on predicted mean vote (PMV). |
| [41] | Velocity, thermal comfort. |
| [62] | Thermal comfort. |
| [63] | Air temperature, air velocity, relative humidity and time of day. |
| [84] | Global temperature compared to air temperature. |
| [85] | Indoor temperature, indoor air quality, both natural and artificial light. |
| [86] | Both concentrations of CO2 and IAQ are considered. |
| [87] | Thermal/ventilation sensation. |
| [65] | Indoor temperature, humidity, air quality, natural and artificial light and sound levels. |
| [88] | Customized ventilation (PVS), controlling the placement of air terminal device and rate of air flow. |
| [79] | Temperature, light and ventilation rate. |
| [42] | Air temperature, related humidity, operative temperature and air velocity (PMV scale) standard. |
| [67] | Effects of critical factors of the built environment on the occupants of commercial buildings with green certification. |
| [38] | Temperature, humidity and air velocity. |
| [40] | Predicted mean vote, CO2, personal factor. |
| [89] | Condition of air supply, supply temperature and environment temperature. |
| [90] | Relative humidity. |
| [96] | IEQ effect (thermal, light and color layout). |
| [69,75] | Indoor parameters (temperature and air quality). |
| [91] | Customized ventilation. |
| [93] | Perceptions of thermal comfort, indoor air quality, light and acoustic environment. Simulated office tasks were carried out to assess productivity. |
| [71,94] | Microclimate conditions. |
| [99] | Thermal energy use, CO2 emissions from the use of electricity and productivity loss due to thermal discomfort. |
| [83] | Thermal satisfaction/self-reported productivity. |
| [14,72,82,92] | Indoor environmental quality (IEQ). |
| [48] | Temperature, ventilation rate, sound level. |
| [101] | Thermal stress/temperature. |
| [102,103] | Temperature and relative humidity. |
| [104] | Subjective data of thermal sensation and objective measurements. |
| Ref. | Year | Description | Productivity Calculation | Eq. |
|---|---|---|---|---|
| [102] | 1985 | Equation (1) where Pc is productivity factor for cool and cold related to productivity with air temperature (Ta) and relative humidity (Rh), to be used in cold climate and applicable from −29 to 10 °C. | Pc = 0.0144 · Ta − 0.00313 · Rh − 0.000107 · (Ta)2 − 0.000029 · (Rh)2 − 0.0000357 · (Ta · Rh) + 0.647. | (1) |
| Equation (2) Pw is productivity factor for heating or hot, Ta air temperature in degrees Fahrenheit, and Rh is relative humidity, expressed in percentages, to be used in hot climates and is applicable from 21 to 49 °C. | Pw = 0.0517 · Ta + 0.0173 · Rh − 0.00032 · (Ta)2 − 0.0000985 · (Rh)2 − 0.0000911 · (Rh) − 1.459. | (2) | ||
| [103] | 1987 | Equation (3) where PR is the relation of predicted daily performance (real/expected), Ta is air temperature at 13 h expressed in percentage. Equation (3) is limited and to deduct climate effects, one needs to acknowledge that predicted crew efficiency is inversely related to PR, as shown in Equation (4). | PR = 9.448 + 0.0518 · Ta − 2.819 · ln(Ta) + 3.89 × 10−37 · | (3) |
| Predict efficiency (E) = 1/PR. | (4) | |||
| [71] | 2003 | Use the Toftum e Friis-Hansen (2009) model where RP = relative performance, tsv = average thermal sensation according to ASHRAE seven-point scale (ASHRAE 1997). | RP = 0.9945 – 0.0123 · tsv – 0.0069 · tsv2. | |
| [99] | 2003 | The percentage of productivity loss D of an office employee can be expressed by the combination of productivity losses in reasoning tasks Tk and typing tasks Tp with a reasoning rate for general tasks α, where Tk and Tp measured in laboratory environments were correlated to the occupant’s preferred average thermal sensation vote γ1 varying between −0.21 and 1.28. | D = α · Tk + (1 − α) · Tp, | (5) |
| Tk = 1.5928 · γ15 − 1.5526 · γ14 − 10.401 · γ13 + 19.226 · γ12 + 13.389 · γ1 + 1.8763 | (6) | |||
| Tp = −60.543 · γ16 + 198.41 · γ15 − 183.75 · γ14 − 8.1178 · γ13 + 50.24 · γ12 + 32.123 · γ1 + 4.8988 | (7) | |||
| [19] | 2004 | Using the mathematical expression of productivity loss, y = c0 (PMV) + c1 (PMV) 2 + c2 (PMV) 3 + c3 (PMV) 4 + ⋯ + cn (PMV)n, Equations (8) and (9) are derived to typing and reasoning tasks respectively. Kosonen and Tan (2004) published two connections for typing performance loss and thought due to the average temperature sensation based on the research by Wyon et al. (1975), where: P = performance loss (%); P ≥ 0 tsv = average thermal sensation according to seven-point scale ASHRAE (ASHRAE 1997). | y = − 0.543 · + 198.41 · − 183.75 · − 8.1178 · + 50.24 · + 32.123 · + 4.8988. | (8) |
| y = 1.5928 · − 1.5526 · − 10.401 · + 19.226 × 2 + 13.389 · + 1.8763. Typing P = 4.8988 + 32.123 · tsv + 50.24 · tsv2 − 8.1178 · tsv3 −183.75 · tsv4 + 198.41 · tsv5 −60.543 · tsv6 Reasoning P = 1.8763 + 13.389 + 19.226 · tsv2 −10.401 · tsv3 − 1.5526 · tsv4 + 1.5928 · tsv5 | (9) | |||
| [55] | 2005 | Three different mathematical regression models represented by Equations (10)–(12) to predict productivity for light, moderate and heavy construction tasks respectively (Srinavin, 2002). The tree equations are applicable to temperature range from 5 to 45 °C. | PL = 102 − 0.80 · PMV − 1.84 · (PMV)2 | (10) |
| PM = 102 + 1.19 · PMV − 2.17 · (PMV)2. | (11) | |||
| PH = 83 + 21.64 · PMV − 9.53 · (PMV)2 + 0.91 · (PMV)3. | (12) | |||
| [81] | 2007 | The yearly average productivity loss of an office occu-pant is determined by Equation (13) where is the yearly average productivity loss of a j occupant where j goes from 1 to 19, representing all the office occupants. The proportion of a mechanical task and the proportion of a purely mental task are associated to degree i, denoted by and respectively is the PMV for the occupant in an instant of time t in one month m. The duration of time T1 and T2 represents commercial time. | (13) | |
| [70] | 2007 | Normal performance was calculated from Equation (14), where = number of correct answers during session i for the subject; A = average number of correct answers from subject A throughout all the sessions. | (14) | |
| [104] | 2009 | Jensen, Toftum and Friis-Hansen (2009) relation where RP = relative performance; tsv = average thermal sensation, according to the seven-point scale AHRAE (ASHRAE 1997). | RP = 0.9945 − 0.0123 · tsv − 0.0069 · tsv2 | |
| [98] | 2009 | Performance loss Equations by work category for the situation WBGT ≥ 34. According to the research by Zhao, Zhu e Lu (2009), the concept of ‘heat tolerance time’ is important only in the case of WBGT ≥ 34 where Thht = heat tolerance time (h), Pwbgt = performance (%); t ≤ Thtt. | Heavy work load Thtt = 0.0519 · WBGT3 − 5.6694 · WBGT2 + 206.04 · WBGT − 2490.3 (h) Pwbgt = −0.5963 · t2 + 0.9115 · t − 0.0676 · WBGT + 2.44 (%). Average work load Thtt = 0.1508 · WBGT3 − 16.0601 · WBGT2 + 608.11 · WBGT − 7411.8 (h) Pwbgt = −0.364 · t 2 + 0.7476 · t − 0.05301 · WBGT + 2.09 (%). Light work load Thtt = 0.0869 · WBGT3 − 9.3769 · WBGT2 + 336.24 · WBGT − 4004.5 (h) Pwbgt = −0.286 · t2 + 0.6256 · t − 0.07 · WBGT + 2.94 (%). | |
| [63] | 2010 | Percentage in change in productivity of a topic under implementation of each task was calculated from Equa-tion (15) where: productivity change of a task j done by subject : amount of work done by subject i for task j: subject’s i average performance for task j. | × 100 i: subject 1. subject 2. subject 3 and subject 4 j: typing task. calculation task. review task. simple reaction task and reaction to color stimuli k: experiment number | (15) |
| [76] | 2015 | Correlation between school performance ηt, K and indoor air temperature Equation (16). Using the average of results obtained by all students in each of the 12 tests P, Gaussiana correlation between performance ηt, P and air temperature ti, Equation (17). was deducted. The correlation to estimate partial performance ηRH depending on relative humidity RHi was obtained in a similar way Equation (18). | ηt. K = 88.1·exp (− | (16) |
| ηt. P = 93.5·exp (− | (17) | |||
| ηRH = 90.33·exp (− | (18) | |||
| [74] | 2018 | Productivity loss was estimated using the Kjellstrom et al. (2009) method. To determine the conditions for thermal comfort, Equation (19) represents the percentage of productivity from heavy work load where PH means the value of productivity for heavy work load. | PH = 83 + 21.64 · PMV − 9.53 · (PMV)2 + 0.91 · (PMV)3 | (19) |
| [86] | 2018 | The performance of tasks by the occupants of the build-ing was divided into six tasks. In this case, standardi-zation of values corresponding to each attribute was carried out using Equation (20), where SA is the stand-ardized value for and is each attribute. | SA = ()/ ( − ) | (20) |
| [84] | 2019 | Mathematical model using the linear model (GLM) to examine the behavior of (tg − ta) and trm in cognitive performance (Dt index–overall performance as a function of time) of students Equation (21), where: 1. Probability distribution of Y (Dt), Y ∼ N (σ2); 2. The function which connects the expected value Y (Dt) with a linear combination of the explanatory variant. | E (Dt) = β0 + β1 · Ttrm + β2 · tg – ta | (21) |
| [64] | 2019 | Ordinary least square regression (OLS) to map the link between temperature and performance, Equation (22): where i refers to an individual, j refers to an experimental session, Tempj is the room temperature during session j and X ij is a vector of observable characteristics of the individual and the session which can influence performance. The dependent variable Yij is a measure of the individual’s performance i in the mathematical task, verbal task, CRT, and a measure of total amount of attempted answers. | (22) | |
| [40] | 2019 | The relation between productivity, CO2 concentration and personal factors, combined, where Z represents productivity, x represents PMV and y represents CO2 concentration; coefficients a, b, c, d, e, f, g, h, i, j and k are obtained by means of a software. | Productivity = f (PMV. CO2) | (23) |
| Z = a + b · x + c · + d · + e · + f · + g · y + h · + i · + j · + k · | (24) | |||
| [101] | 2020 | Equation for estimating performance decline at work can be written as Equation (25): | P (%) = 2 × (Thermal stress. °C) − 50 | (25) |
| [78] | 2020 | Absolute performance can be calculated based on precision (% of correct answers) and speed (time taken to answer) the tasks in Equation (26). The performance index of all individuals in each condition was calculated (PIi). Relative performance of each condition was obtained according to Equation (27), where: RP–relative performance; PIi–Absolute performance in each condition; PImax–Performance maximum in all conditions. | PI = (precision of 0.5 speed 0.5) 2 = speed precision | (26) |
| RP = PIi/PImax × 100 | (27) |
Publisher’s Note: MDPI stays neutral with regard to jurisdictional claims in published maps and institutional affiliations. |
© 2021 by the authors. Licensee MDPI, Basel, Switzerland. This article is an open access article distributed under the terms and conditions of the Creative Commons Attribution (CC BY) license (https://creativecommons.org/licenses/by/4.0/).
Share and Cite
Bueno, A.M.; de Paula Xavier, A.A.; Broday, E.E. Evaluating the Connection between Thermal Comfort and Productivity in Buildings: A Systematic Literature Review. Buildings 2021, 11, 244. https://doi.org/10.3390/buildings11060244
Bueno AM, de Paula Xavier AA, Broday EE. Evaluating the Connection between Thermal Comfort and Productivity in Buildings: A Systematic Literature Review. Buildings. 2021; 11(6):244. https://doi.org/10.3390/buildings11060244
Chicago/Turabian StyleBueno, Ana Maria, Antonio Augusto de Paula Xavier, and Evandro Eduardo Broday. 2021. "Evaluating the Connection between Thermal Comfort and Productivity in Buildings: A Systematic Literature Review" Buildings 11, no. 6: 244. https://doi.org/10.3390/buildings11060244