Review

Overview on the Nonlinear Static Procedures and Performance-Based Approach on Modern Unreinforced Masonry Buildings with Structural Irregularity

by
Abide Aşıkoğlu
*,
Graça Vasconcelos
and
Paulo B. Lourenço
ISISE, Department of Civil Engineering, University of Minho, 4800-058 Azurém, Guimarães, Portugal
*
Author to whom correspondence should be addressed.
Buildings 2021, 11(4), 147; https://doi.org/10.3390/buildings11040147
Submission received: 13 February 2021 / Revised: 16 March 2021 / Accepted: 23 March 2021 / Published: 1 April 2021
(This article belongs to the Special Issue Seismic Performance Assessment of Buildings)

Abstract

:
Performance-based design plays a significant role in the structural and earthquake engineering community to ensure both safety and economic feasibility. Its application to masonry building design/assessment is limited and requires straightforward rules considering the characteristics of masonry behavior. Nonlinear static procedures mainly cover regular frame system structures, and their application to both regular and irregular masonry buildings require further investigation. The present paper addresses two major issues: (i) the definition of irregularity in masonry buildings, and (ii) the applicability of classical nonlinear static procedures to irregular masonry buildings. It is observed that the irregularity definition is not comprehensive and has different descriptions among the seismic codes as well as among researchers, particularly in the case of masonry buildings. The lack of global language may result in the misuse of the procedures, while adjustments may be essential due to irregularity effects. Therefore, irregularity indices given by different codes and research studies are discussed. Furthermore, an overview of nonlinear static procedures implemented within the framework of the performance-based approach and improvements proposed for its application in masonry buildings is presented.

1. Introduction

Masonry construction is the oldest structural system, which, in fact, can be considered as the base for built heritage. Masonry has been used in different types of structures over centuries, mainly due to the easy accessibility of the material at its location. Yet, most of the traditional masonry structures were designed based on vertical loads only. Indeed, this led to the construction of massive walls to ensure both vertical and lateral stability. The earliest versions of building codes for masonry buildings covered empirical design rules based on this approach. However, designing a masonry structure in such a way leads to enormous dimensions that are not compatible neither with aesthetical and architectural contexts nor with economic sources. This is particularly relevant in the case of construction in regions with high seismic hazards. This is among the main reasons why masonry, as a structural material, has been replaced by other materials, such as reinforced concrete and steel. However, unreinforced masonry buildings, as isolated or in aggregates (with rigid or flexible diaphragm), are largely found in many countries in the world with both low and high seismicity [1,2,3], which justify the improvement of European and American seismic codes concerning masonry structures [4].
More recently, seismic design philosophies have been evolved to performance-based design (PBD) approaches, namely, in the case of masonry buildings. It aims at designing structures with acceptable damage levels under certain seismic intensity and, therefore, to avoid conservative design. Therefore, seismic performance levels, associated with a certain level of damage exhibited by the structures, which are commonly identified through deformations, must be defined [5]. The application of the performance-based design/assessment to masonry structures is not straightforward, but it has been successful in frame systems, such as reinforced concrete and steel constructions [5,6,7,8,9]. For instance, to achieve earthquake-resistant masonry buildings according to Eurocodes, general rules for masonry design [10] and seismic design [11] need to be integrated. The main issue here is that rules defined in the seismic design code, particularly the application of the performance-based approach, are not comprehensive for masonry structures. Furthermore, PBD and nonlinear static procedures (NSPs) were mainly developed for regular frame systems. It should be mentioned that regular configurations are not representative of real building stock because new buildings usually impose complex geometry due to architectural and functional concerns. Among the main issues with complex geometry is the presence of irregular structural configurations which show undesired torsional effects under seismic actions [12]. This causes additional difficulties in the application of the nonlinear static procedures in the case of masonry buildings.
NSPs aim at simulating the dynamic response of structures by simply using the pushover capacity of a multi-degree-of-freedom structure and its equivalent single-degree-of-freedom system. There are different modeling approaches available in the literature to perform nonlinear static analysis of masonry structures. An extensive literature review on the methodologies applied to the seismic assessment of masonry buildings is presented by D’Altri et al. (2019) [13]. According to [13], numerical strategies available for masonry structures can be categorized as four main groups based on the modeling approach: (i) block-based model,: this uses block elements aiming at considering the real masonry arrangement (units and mortar); (ii) continuum model,: a representative model is taken into account as a continuum deformable body with homogenous material behavior; (iii) macro-element model: the discretization of the model is carried out by panel elements, so-called macro-elements; and (iv) geometry-based model: the description of the model is based on the geometry of the structure only. Several studies have shown that results of the nonlinear static analysis are highly dependent on the numerical procedure adopted to simulate the structure [14,15,16,17,18,19,20,21,22,23,24,25,26,27]. Here, the performance-based applications are studied, regardless of the numerical modeling and simulations in the present paper.
In this context, the present paper intends to overview structural irregularity descriptions and indices derived for masonry structures and available NSP applicable to masonry in the literature. The main purpose is to point out the complexity of structural irregularities and their influence on the procedures adopted to achieve performance limits. To exemplify, two case studies are selected from the literature aiming at illustrating the application of different NSPs to evaluate the accuracy of the methods in structures with different irregularity levels. Finally, some improvements proposed by several researchers are addressed.

2. Description of Structural Irregularities: Is It Comprehensive Enough for Masonry Buildings?

It is widely recognized that geometrical configuration has an important role in the global behavior of structures. Past seismic events have demonstrated that buildings with structural irregularity suffer more damage than their regular counterparts [28,29]. Geometric irregularities can result in complex load patterns resulting in concentrated inelastic behavior at critical points, such as corners (Figure 1). A uniform load distribution among vertical resisting elements with similar stiffness is achieved by symmetrically designed plans once the center of mass, where the resultant force is imposed, coincides with the center of rigidity. Thus, regular structures are less likely to suffer significant torsional effects. Otherwise, the eccentricity results in undesired behavior, which is mainly controlled by a combination of lateral and torsional responses [30]. For instance, abrupt changes in the plan, such as the presence of setbacks, discontinuities in the in-plan stiffness of the floors due to openings or variable slab thickness, contribute to the torsional damage [31]. In this sense, most seismic codes cover designing rules mainly based on regular structures and impose certain penalties on structural irregularities. Yet, complex geometry usually results from space limitations and from architectural, economical and/or functional concerns. Irregularities in the geometry of structural systems are mostly inevitable, particularly in the case of masonry buildings. Even if such a building satisfies global regularity requirements, it may not be possible to achieve elevation once the masonry walls are composed of openings with different numbers, sizes, and alignments [28]. Furthermore, it is important to note that loadbearing masonry walls serve as both structural and architectural components which require a multidisciplinary approach and strict collaboration between engineer and architects during the design process. Additionally, masonry buildings are mainly found as aggregates which result in a high level of structural irregularities due, for example, to the misaligned of the floors between adjacent buildings [1,2,3].
Design codes classify the buildings as regular and irregular, and the irregularity is categorized into two types, in plan and in elevation. In general terms, the definition is based on the distribution of mass, stiffness and strength. However, the criteria given for the definition of irregularity are not sufficient to capture a variety of cases, such as irregularity due to progressive damage, or a combination of both plan, and vertical irregularities [32]. It should be noted that the definition of structural irregularity differs in different codes, as listed in Table A1 and Table A2 in Appendix A. It appears that some of the codes describe irregularity mostly for framed-system structures, and very limited explanations are given for masonry buildings, as is the case of Turkish Earthquake Code (TEC) 2019 [33]. The ASCE standard presents more comprehensive and relatable definitions to masonry buildings.
Despite the rules given to define irregularity in the codes, it is noticed that the concept of irregularity has a wide definition spectrum among researchers. Considering masonry buildings, for instance, Abrams (1997) [34] studied a building with structural irregularity due to the different sizes and locations of openings in the walls. This results in varying stiffness and strength for two parallel shear walls, with various pier dimensions and aspect ratios, as seen in Figure 2a. Bairrão and Silva (2009) [35] classified their building as irregular in plan owing to the occurrence of a setback in one corner (Figure 2b). On the other hand, Giordano et al. (2008) [30] described the studied building as asymmetric in plan in both horizontal directions based on two features: (i) the position of the longitudinal inner wall that is not barycentric in the X direction; (ii) the lack of the second-last transverse wall in the Y direction (Figure 2c). The building shown in Figure 2d is also considered as irregular, as it has a setback in one corner, resulting in an asymmetric plan with irregularly distributed openings [36]. Another example of an irregular building (in plan) was studied by Lagomarsino et al. (2018) [37], with different diaphragm stiffness, window opening sizes and distribution of the openings on the outer walls (Figure 2e). Accordingly, it is seen that there is a need for introducing and improving irregularity indexes for masonry buildings into the current codes to attain straightforward and uniform definitions among the structural engineering community. It is important to underline that some definitions considered as a plan irregularity are attributed to structural irregularities in elevation or vice versa. The main reason for this is the influence of the stiffness of vertical elements on the location of the center of rigidity. Thus, it may be necessary to identify and include structural irregularities that might have a coupled influence in these cases.
To this end, Parisi and Augenti (2013) [28] and Berti et al. (2017) [39] developed studies to define irregularities of in-plane masonry walls in quantitative terms, and the details are given in Figure 3 and Figure 4. They propose indices for geometry irregularity to obtain its typology and severity as listed in Table 1. The irregularities given by Parisi and Augenti (2013) [28] are classified into four categories: (i) horizontal irregularities, (ii) vertical irregularities, (iii) offset irregularities and (iv) variable opening numbers. It is noted that horizontal, vertical and offset irregularities are formulated based on openings in the same story level, while the last one considers the difference among openings between the stories. Hence, the regularity of a wall is indicated by the index i = 0, while an index within the range of 0 < i ≤1 represents different levels of irregularity. On the other hand, Berti et al. (2017) [39] characterize the most common irregularity types into six main groups based on the dimensions and alignments of openings, (i) horizontal and (ii) vertical alignments of openings, (iii) irregularity in opening width, (iv) irregularity in height, (v) global index as a combination of irregularities and (vi) the presence of non-rectangular openings.
The differences found in the definition of structural irregularity in masonry buildings described previously reflects the difficulty in obtaining a uniform, straightforward and comprehensive description of it. Some attempts have been presented by different researchers, but it is considered that further research and descriptions are essential. The rules to define the irregularity of a masonry building should include a systematic approach to the different types of irregularity and provide indices to characterize the level of irregularity. In addition, it is considered that more details need to be identified when defining structural irregularity based on the geometry, stiffness and mass of vertical and horizontal structural elements to avoid any design/assessment errors. For instance, eccentricity of building is associated with the difference between the center of mass and the center of rigidity at the same floor level, which must be also characterized among different stories. In this case, the response of such a building is debatable, since the earthquake loads are attributed to the center of mass at each level.

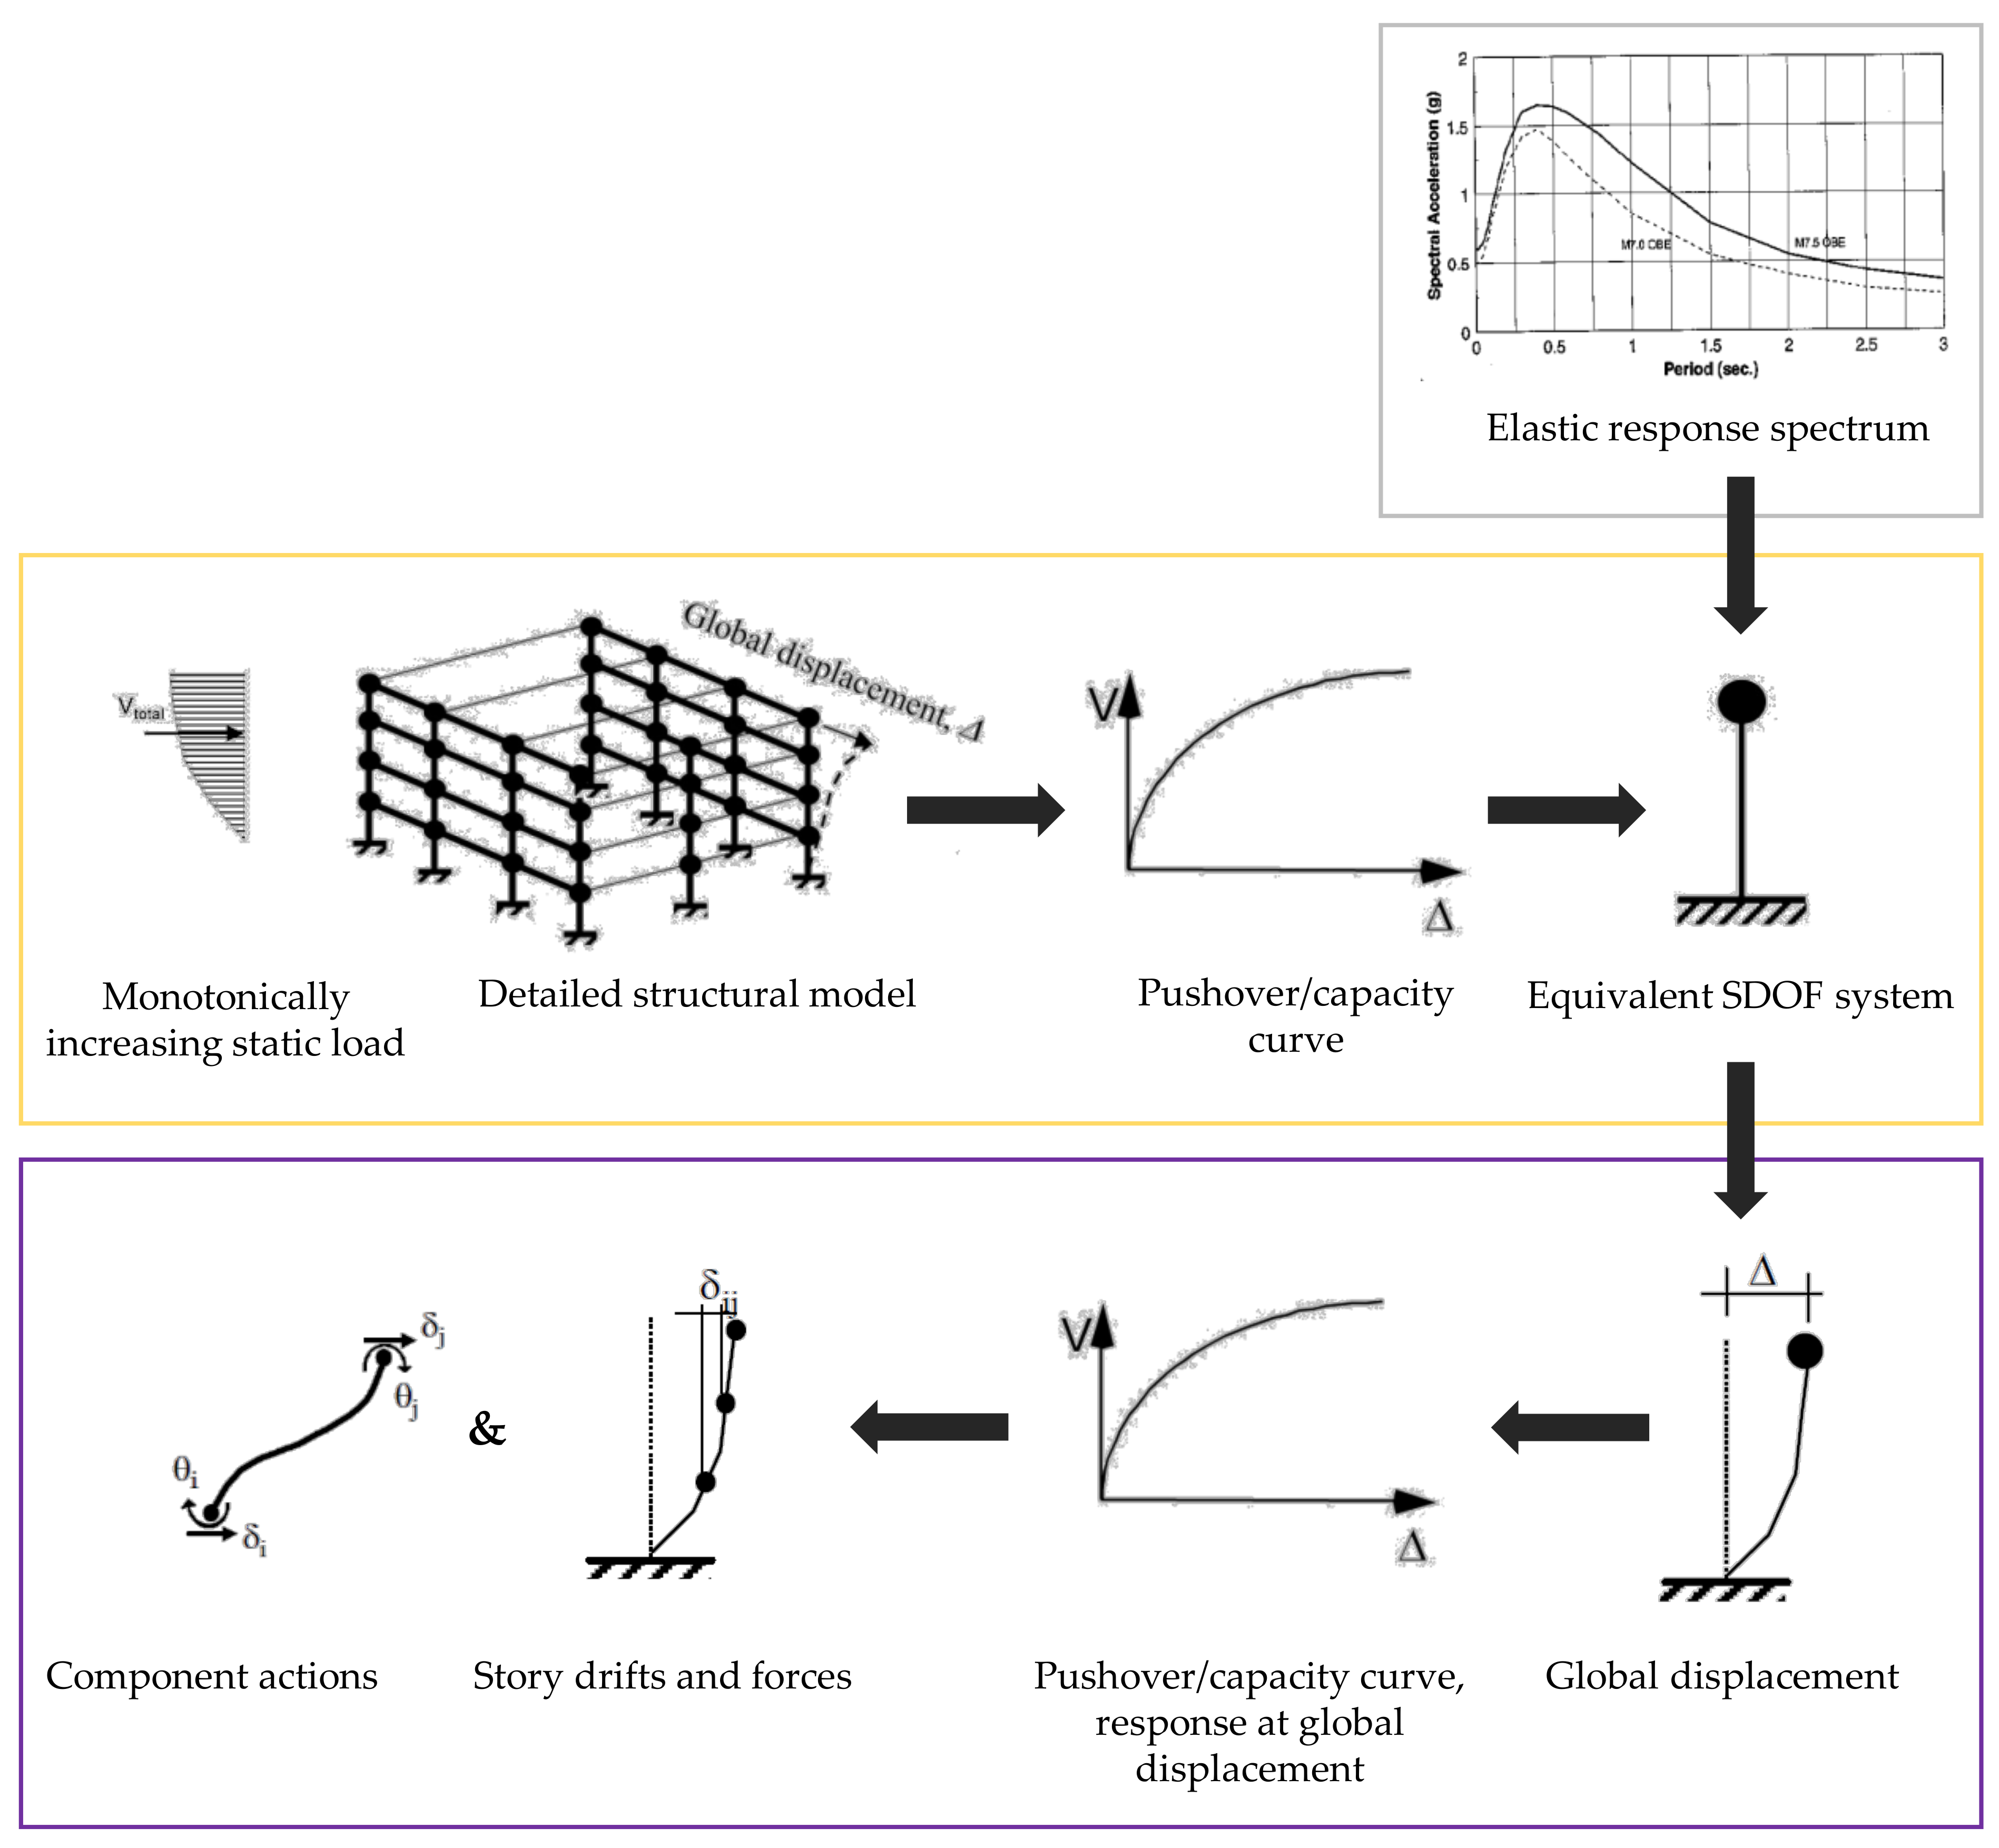
3. Performance-Based Approach as a Design/Assessment Tool

The performance-based approach for the seismic assessment/design of a building is based on the comparison between the seismic demand and the seismic capacity in terms of deformation. Such a procedure is implemented in a simplified manner by considering certain assumptions to reduce computational and analysis efforts. The damage states can be defined qualitatively based on visual inspection as in the case of the macro-seismic post-earthquake assessment [40]. However, when seismic performance-based assessment is intended to be applied, it is necessary to define the performance level associated with a certain damage level that can develop in a building for a certain seismic hazard level in a quantitative manner. The performance level of a structure can be represented through a deformation level defined as a limit state, such as fully operational, operational, life safety and near collapse. According to [41], three design criteria are associated with the performance level and severity of an earthquake. Accordingly, the performance objective is chosen to ensure a low seismic risk for a given structure when submitted to a certain seismic action.
Although nonlinear dynamic analysis is widely recognized as the most accurate analysis method, nonlinear static procedures (NSP) have become the most practical method to assess and design structures [32] in which nonlinear static analysis play a central role. The main reason for this is that the seismic response of a structure highly depends on the dynamic motion and, therefore, a set of analyses with different levels of intensities is needed. Furthermore, nonlinear dynamic analysis requires the selection and scaling of seismic input and definition of hysteretic models [42]. On the other hand, nonlinear static analysis, namely, pushover analysis, provides fundamental information about the seismic performance of buildings by simply pushing the structure with an incremental lateral load until collapse. The pushover curve is an important tool to attain the seismic behavior and identify damage limit states. Essentially, NSP assumes that the seismic demand of a multi-degree-of-freedom (MDOF) system can be computed using an equivalent single-degree-of-freedom (SDOF) model of the same system. The procedure is composed of two main steps: (1) performing pushover analysis and (2) the application of a nonlinear static procedure, as depicted in Figure 5. Once the capacity of a building is attained by incremental static loading, it is converted from the MDOF to an equivalent SDOF system by using the response spectrum as a function of the site and seismic motion-specific parameters. Next, the target global displacement is calculated within the framework of a selected nonlinear static procedure. Afterward, the global building response is analyzed at the given displacement demand, which is calculated as the target displacement for the equivalent SDOF system. Accordingly, story drifts, internal forces and, therefore, component actions resulting due to target displacement are used to examine the seismic performance.
It should be stressed that there are several concerns about the application of NSPs. The maximum displacement demand is highly dependent on the empirical formulations, and, therefore, different results for the same nonlinear static response are observed. One important issue is associated with the difficulty to obtain clear stiffness and strength, which should reflect progressive damage [43]. In addition, the application of NSPs brings more uncertainty, as in some cases, the response of an MDOF system is not well represented by an SDOF counterpart, such as in the case of irregular buildings. Indeed, NSPs were developed for structures with seismic responses dominated by translational modes, i.e., regular buildings. Thus far, the N2 method [44], which is included in Eurocode 8; the Capacity Spectrum Method [45]; and the Displacement Coefficient Method [46] are the most preferred methods for regular structures [32]. Nevertheless, it is required to overcome the issue of torsional effects on the seismic response by using improved methodologies. Significant research has been carried out and has proposed methods that focus on (i) adaptive pushover algorithms and (ii) consideration of higher modes. Therefore, NSPs can be categorized into two groups, namely, classical and extended; see Figure 6. It is observed that classical procedures are associated with regular buildings, while extended versions intend to be applied in buildings in which the predominance of higher mode or torsional effects needs to be addressed.

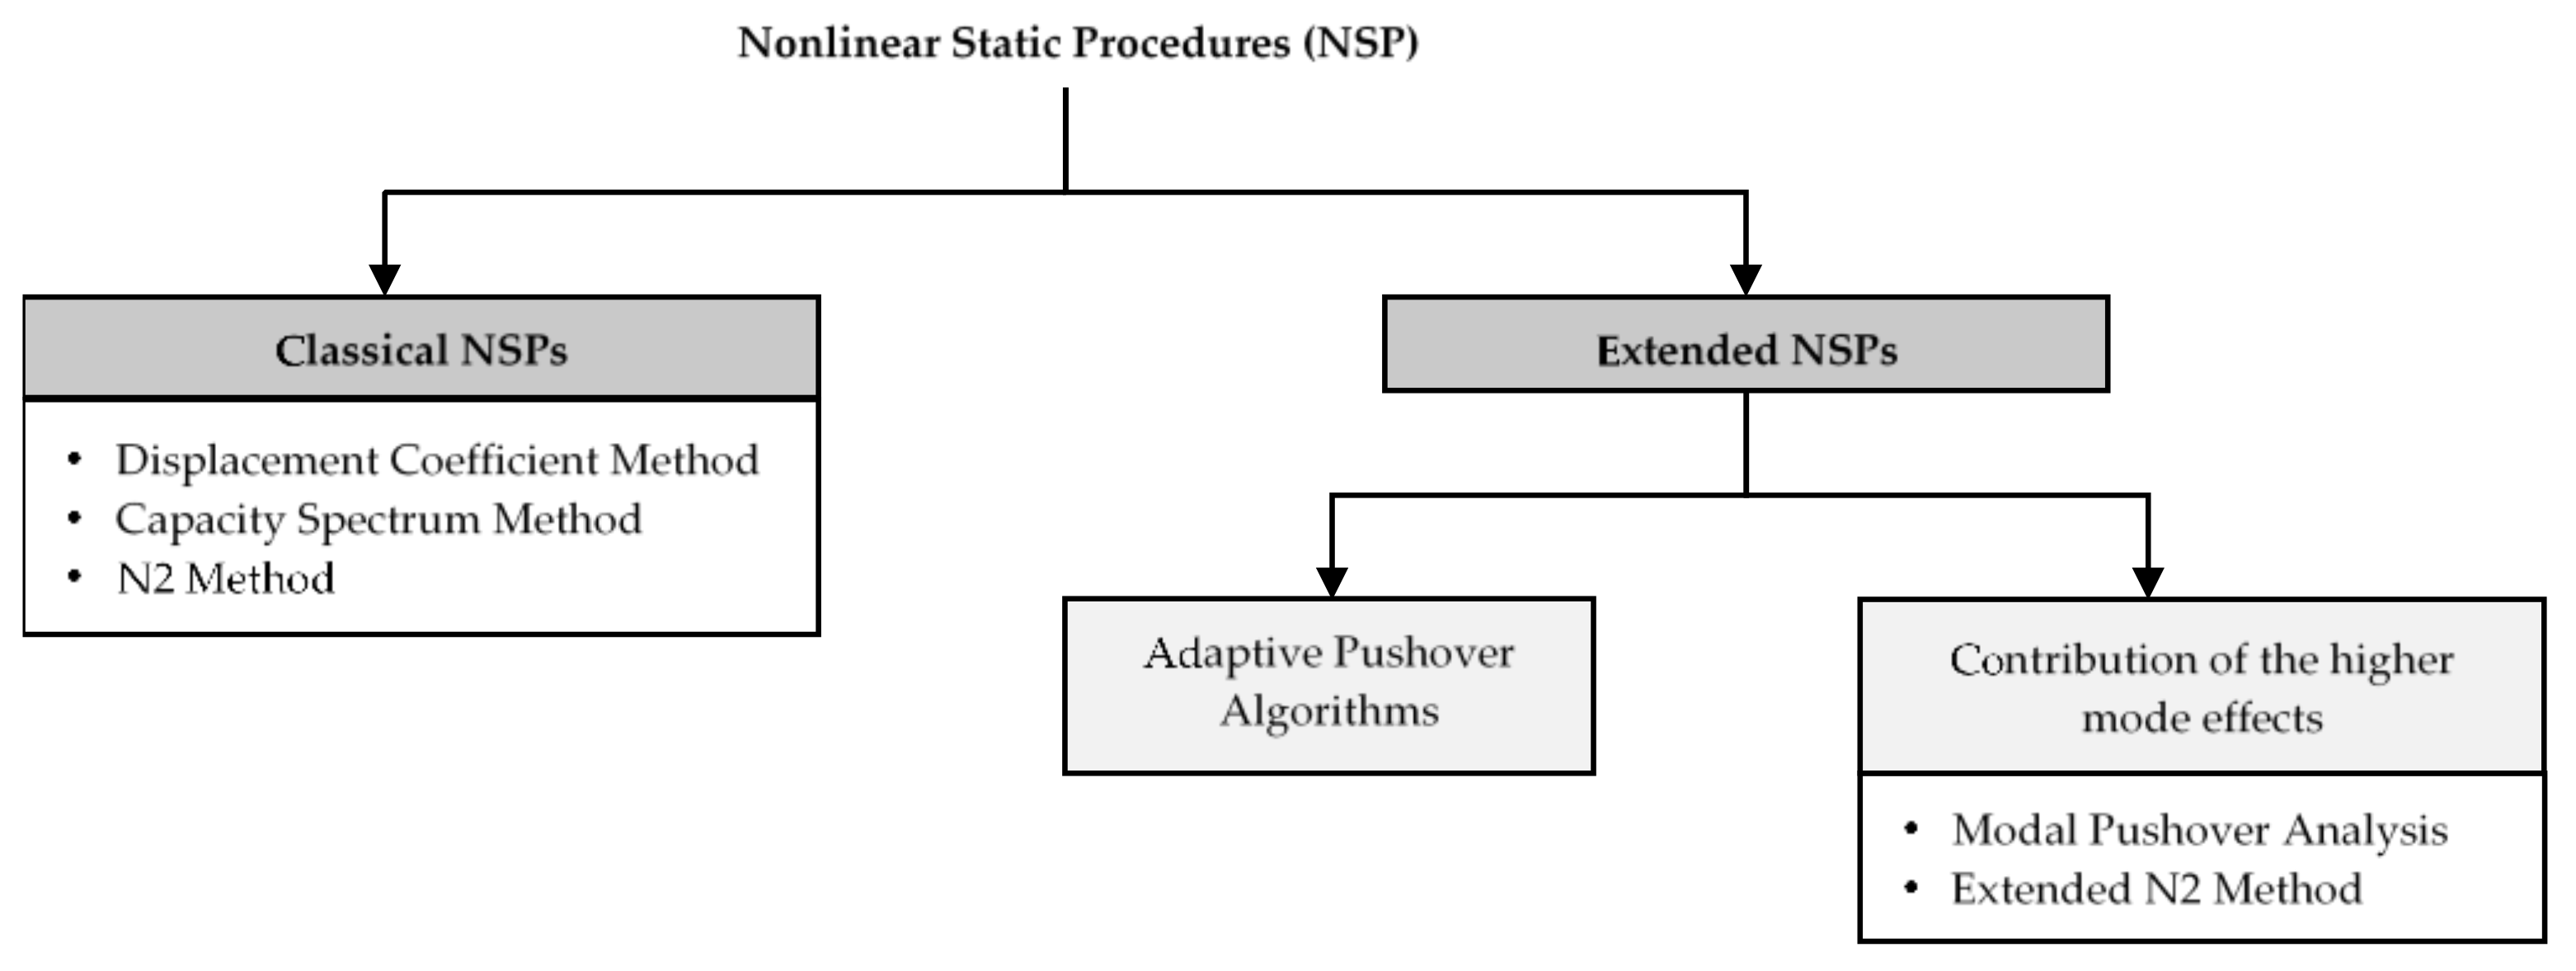
3.1. Classical Nonlinear Static Procedures

The global deformation demand on a structure is computed based on an equivalent SDOF system, which is obtained from the pushover response of an MDOF system. In classical NSPs, the generation of the pushover curve is carried out by using a similar approach, as depicted in Figure 7. However, the technique used to evaluate the maximum displacement demand differs. For instance, the Coefficient Method takes into account the modification of base shear and roof displacement relation, while the capacity spectrum and N2 method use diagrams relating spectral acceleration and spectral displacement.

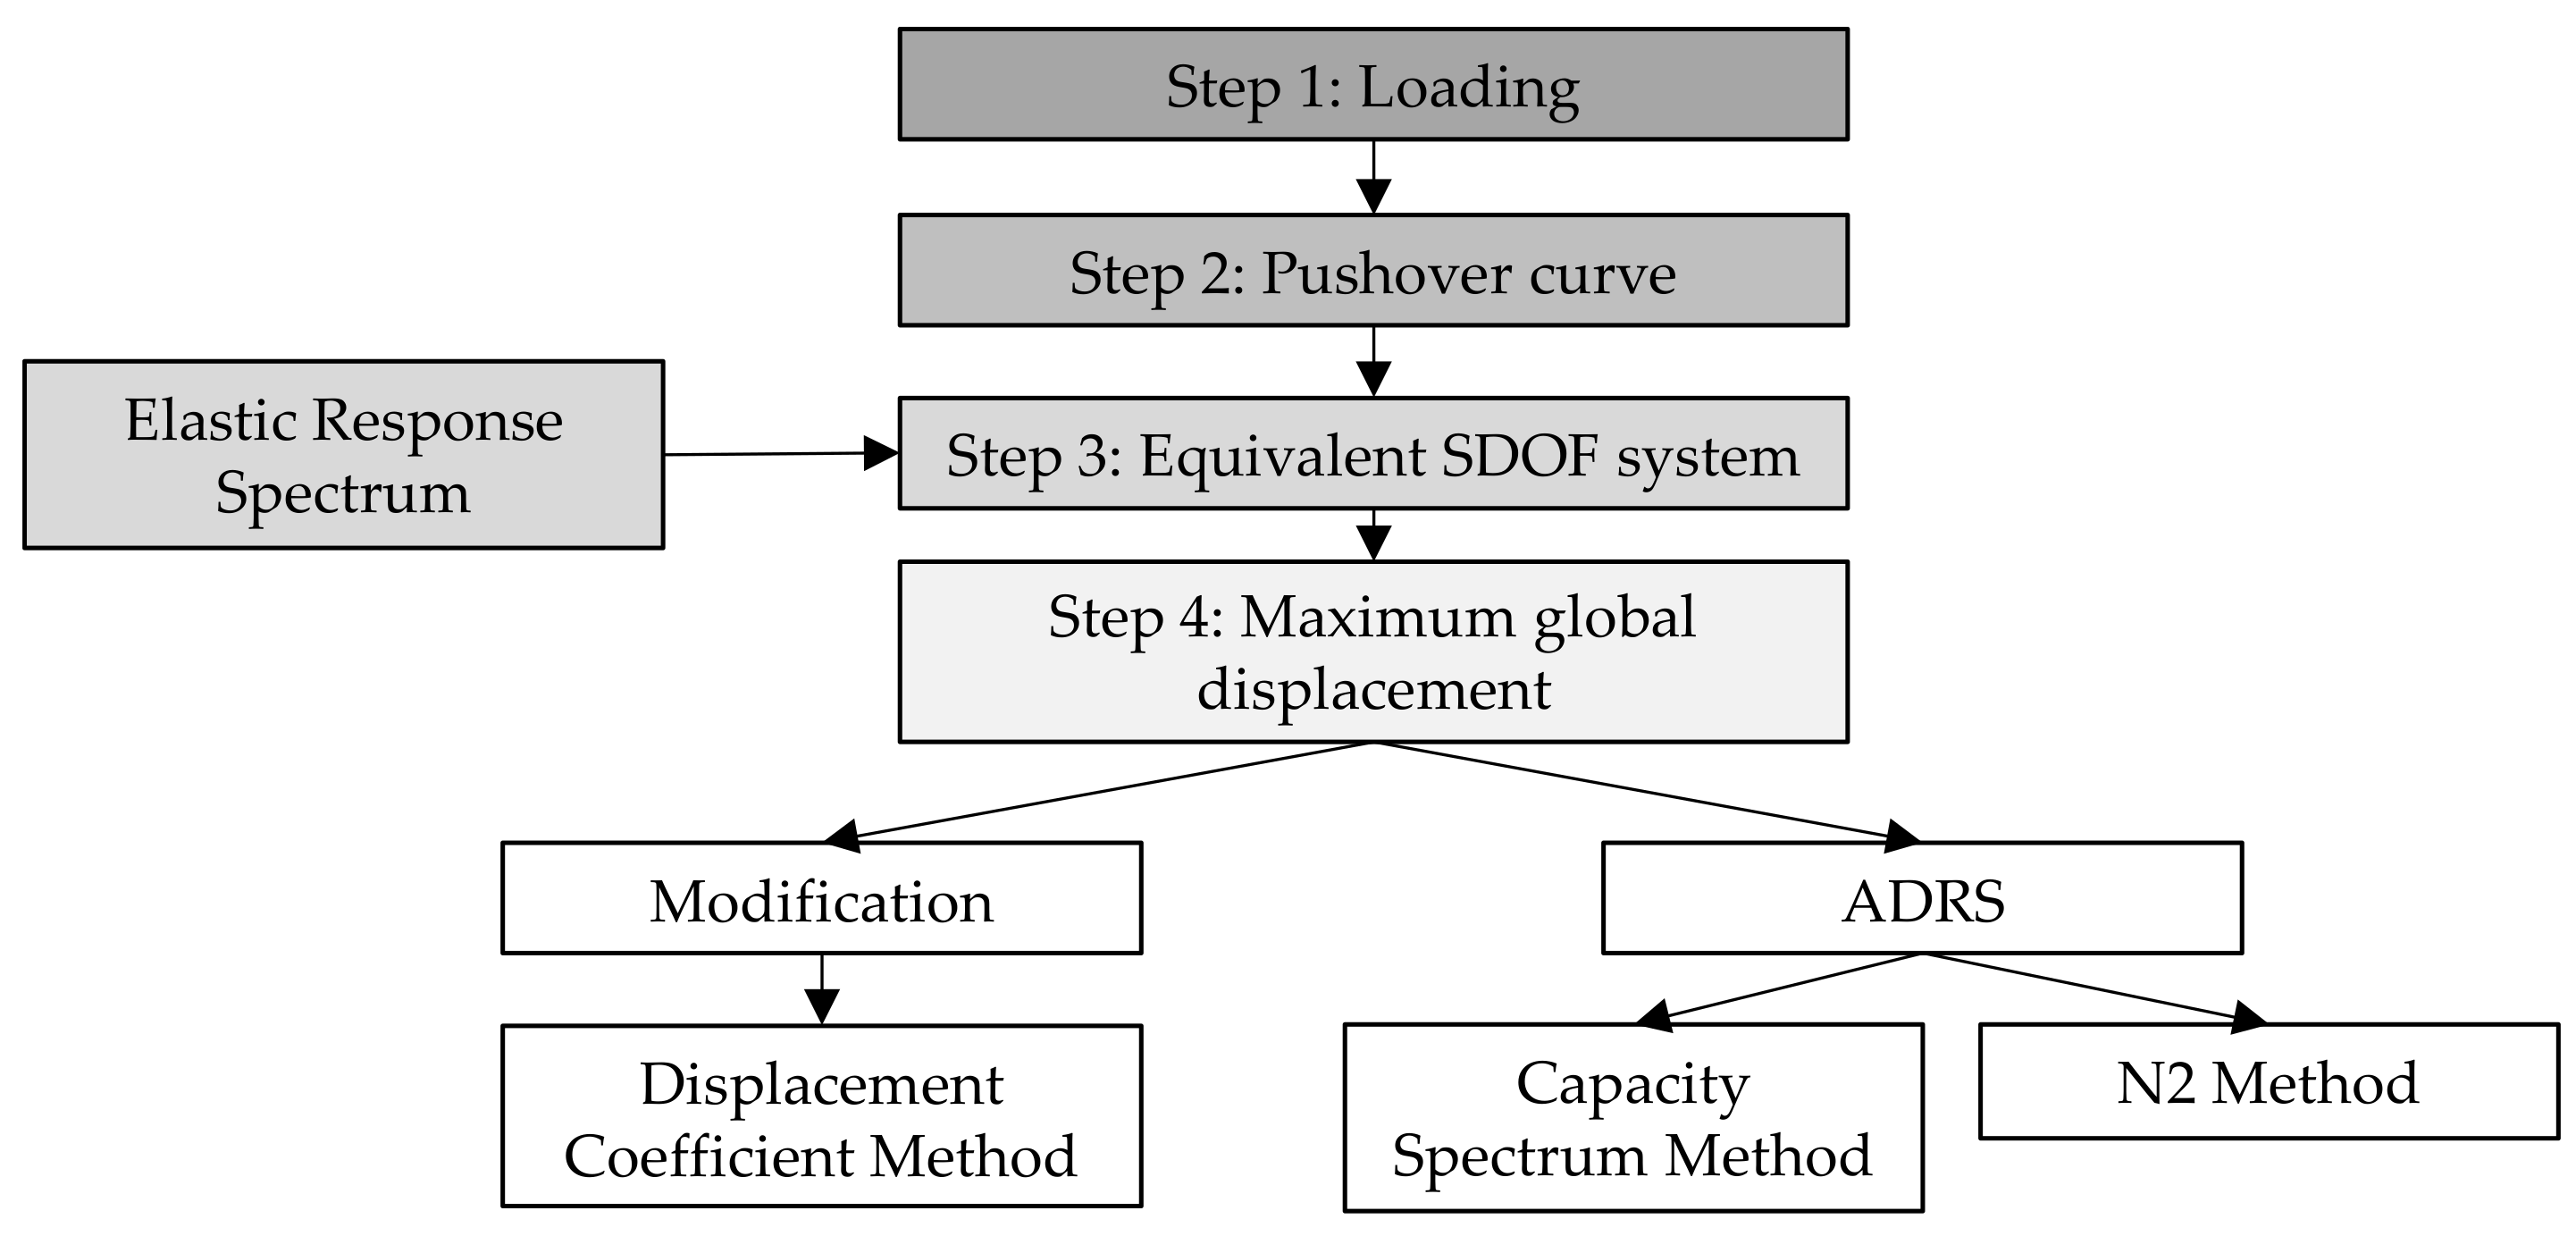
3.1.1. Displacement Coefficient Method

The Displacement Coefficient Method (DCM) is considered a primary nonlinear static procedure that was introduced in FEMA 356 [46]. This method requires the modification of the linear elastic response of the equivalent SDOF system to predict the maximum global displacement, so-called target displacement. A set of coefficients are used to adjust the response. The procedure is illustrated in Figure 8 and summarized as follows.
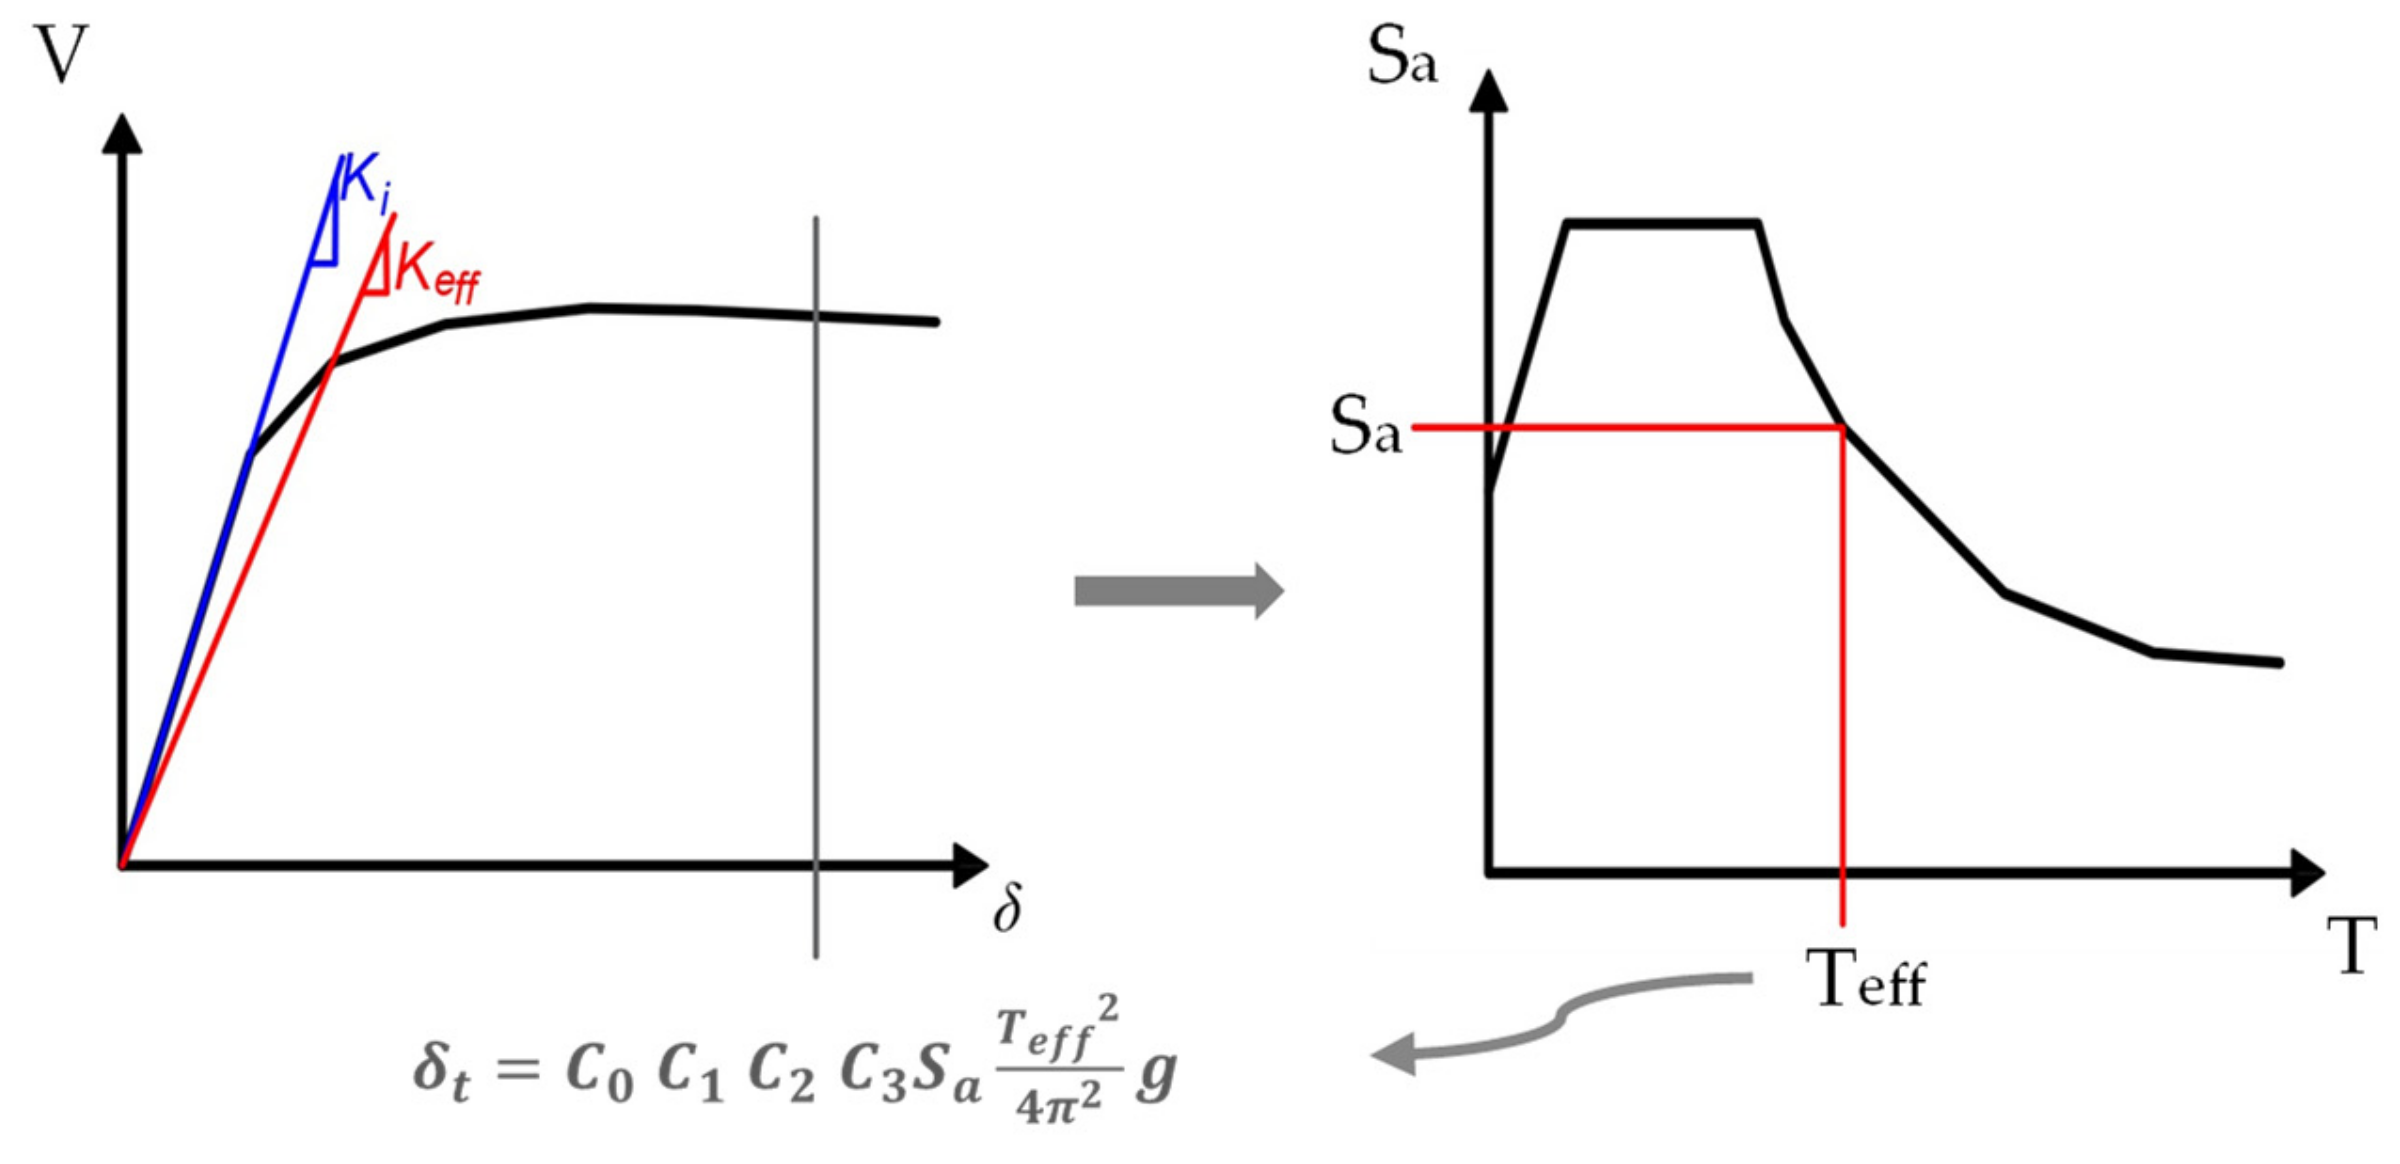
  • A pushover curve, which is an idealization of force-deformation relation, is obtained through numerical analysis.
  • On the pushover curve, an effective period (Teff) is calculated as a function of the initial period (Ti). In this way, stiffness loss observed during the transition from elastic to inelastic response is taken into account. Thus, an equivalent SDOF system is assumed to have the same elastic stiffness that corresponds to the effective period of the MDOF system obtained previously.
  • A maximum acceleration response of the SDOF system is obtained as a function of an effective period on an elastic response spectrum that is representative of the seismic ground motion.
  • The maximum global displacement demand is evaluated in terms of spectral displacement that is directly associated with the spectral acceleration through Equation (1).
    S d = C 0 C 1 C 2 C 3 T e f f 2 4 π 2 · S a T e f f
    where:
    • C0 converts the SDOF spectral displacement to MDOF roof displacement (elastic); it can be considered as the first mode participation factor or an appropriate value given in Table 2.
    • C1 is the factor that relates the expected maximum inelastic displacement to elastic displacement.
    • C2 represents the effects of pinched hysteretic shape, stiffness degradation and strength deterioration. The values given in Table 2 are associated with different performance limit states.
    • C3 adjusts for second-order geometric nonlinearity (P-Δ) effects.
    • Sa(Teff) is the spectral acceleration at the effective period.
Suggestions by [46] for the values of the coefficients are displayed in Table 2.

3.1.2. Capacity Spectrum Method of Equivalent Linearization

The Capacity Spectrum Method (CSM) was proposed by Freeman et al. (1975) [45] as a rapid assessment method. It represents the global force–displacement capacity graphically, which enables a comparison with the representative response spectrum. CSM assumes that the maximum inelastic deformation of a nonlinear SDOF system can be estimated from the maximum deformation of a linear elastic SDOF system which has a higher period and a higher damping ratio than the initial values of a nonlinear system. In brief, the procedure involves the following:
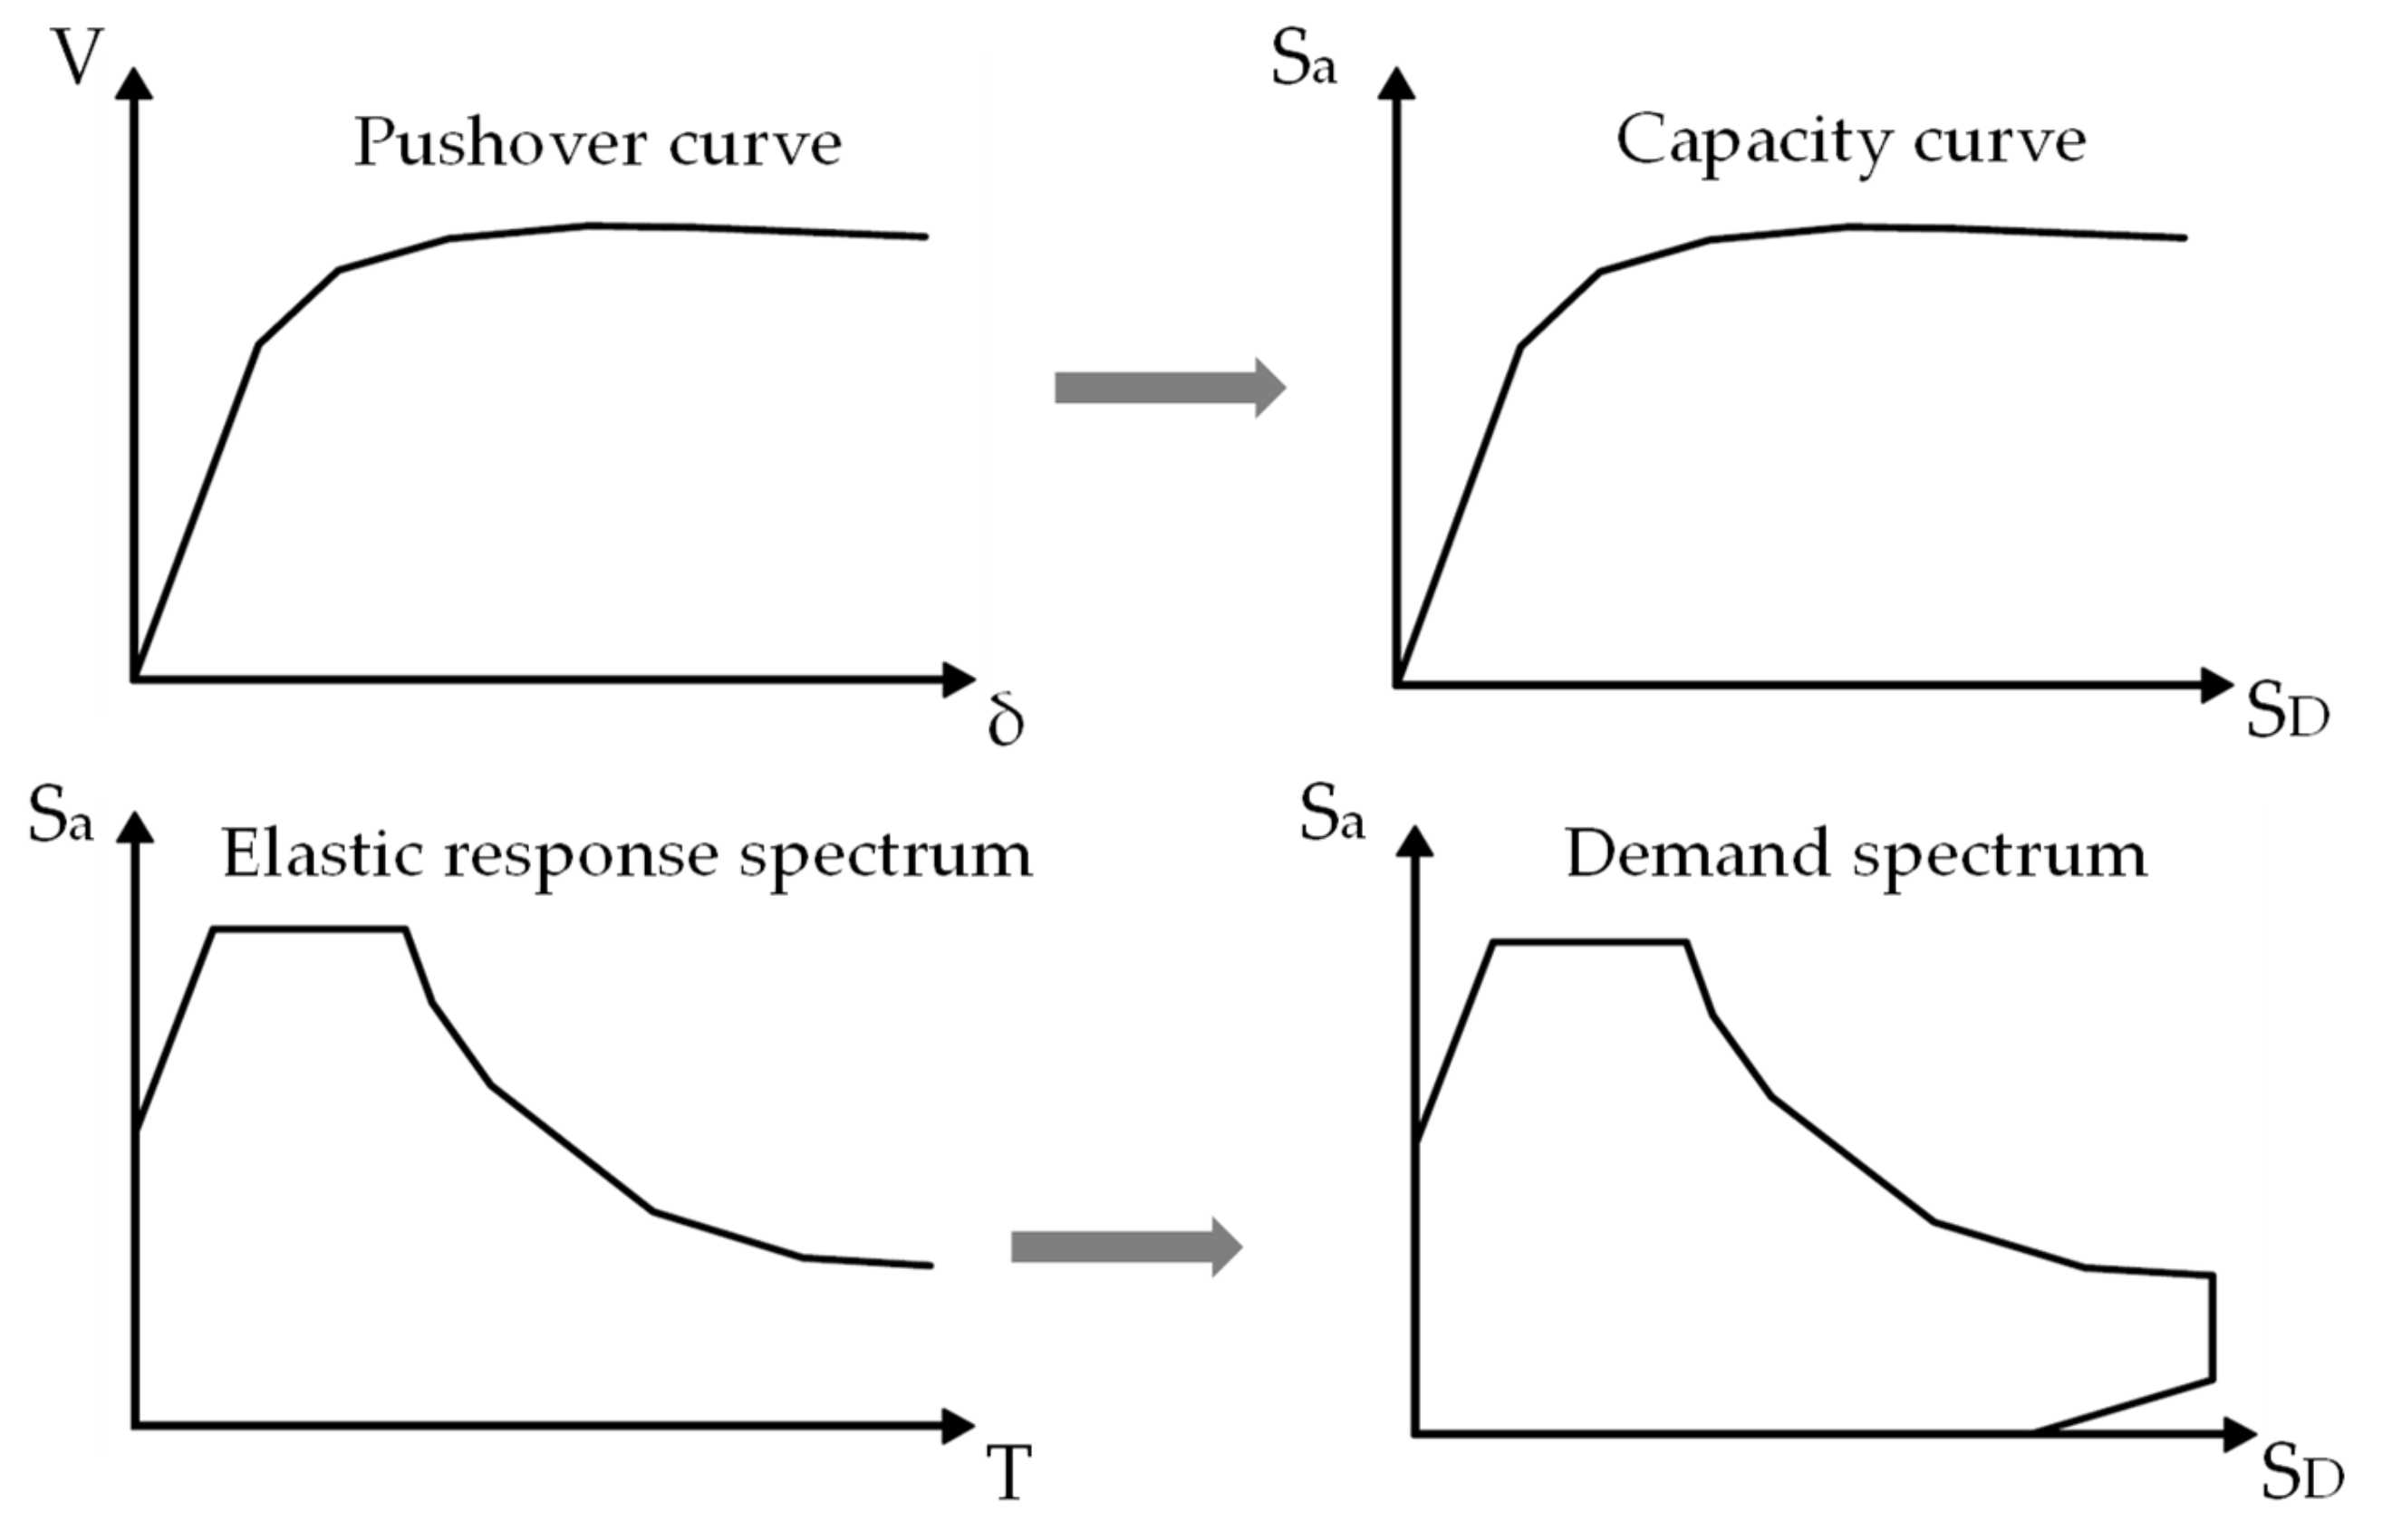
  • Definition of the structural response based on the force–deformation diagram, i.e., pushover curve.
  • The pushover curve is transformed into a capacity curve that is a function of spectral acceleration and spectral displacement of an SDOF system by using the modal properties of the structure. This format of the graph is termed as the acceleration–displacement response spectrum (ADRS).
  • The elastic response spectrum of representative seismic ground motion is converted into the ADRS format (Figure 9). This enables the drawing and comparison of both seismic capacity and demand curves on the same coordinate system.
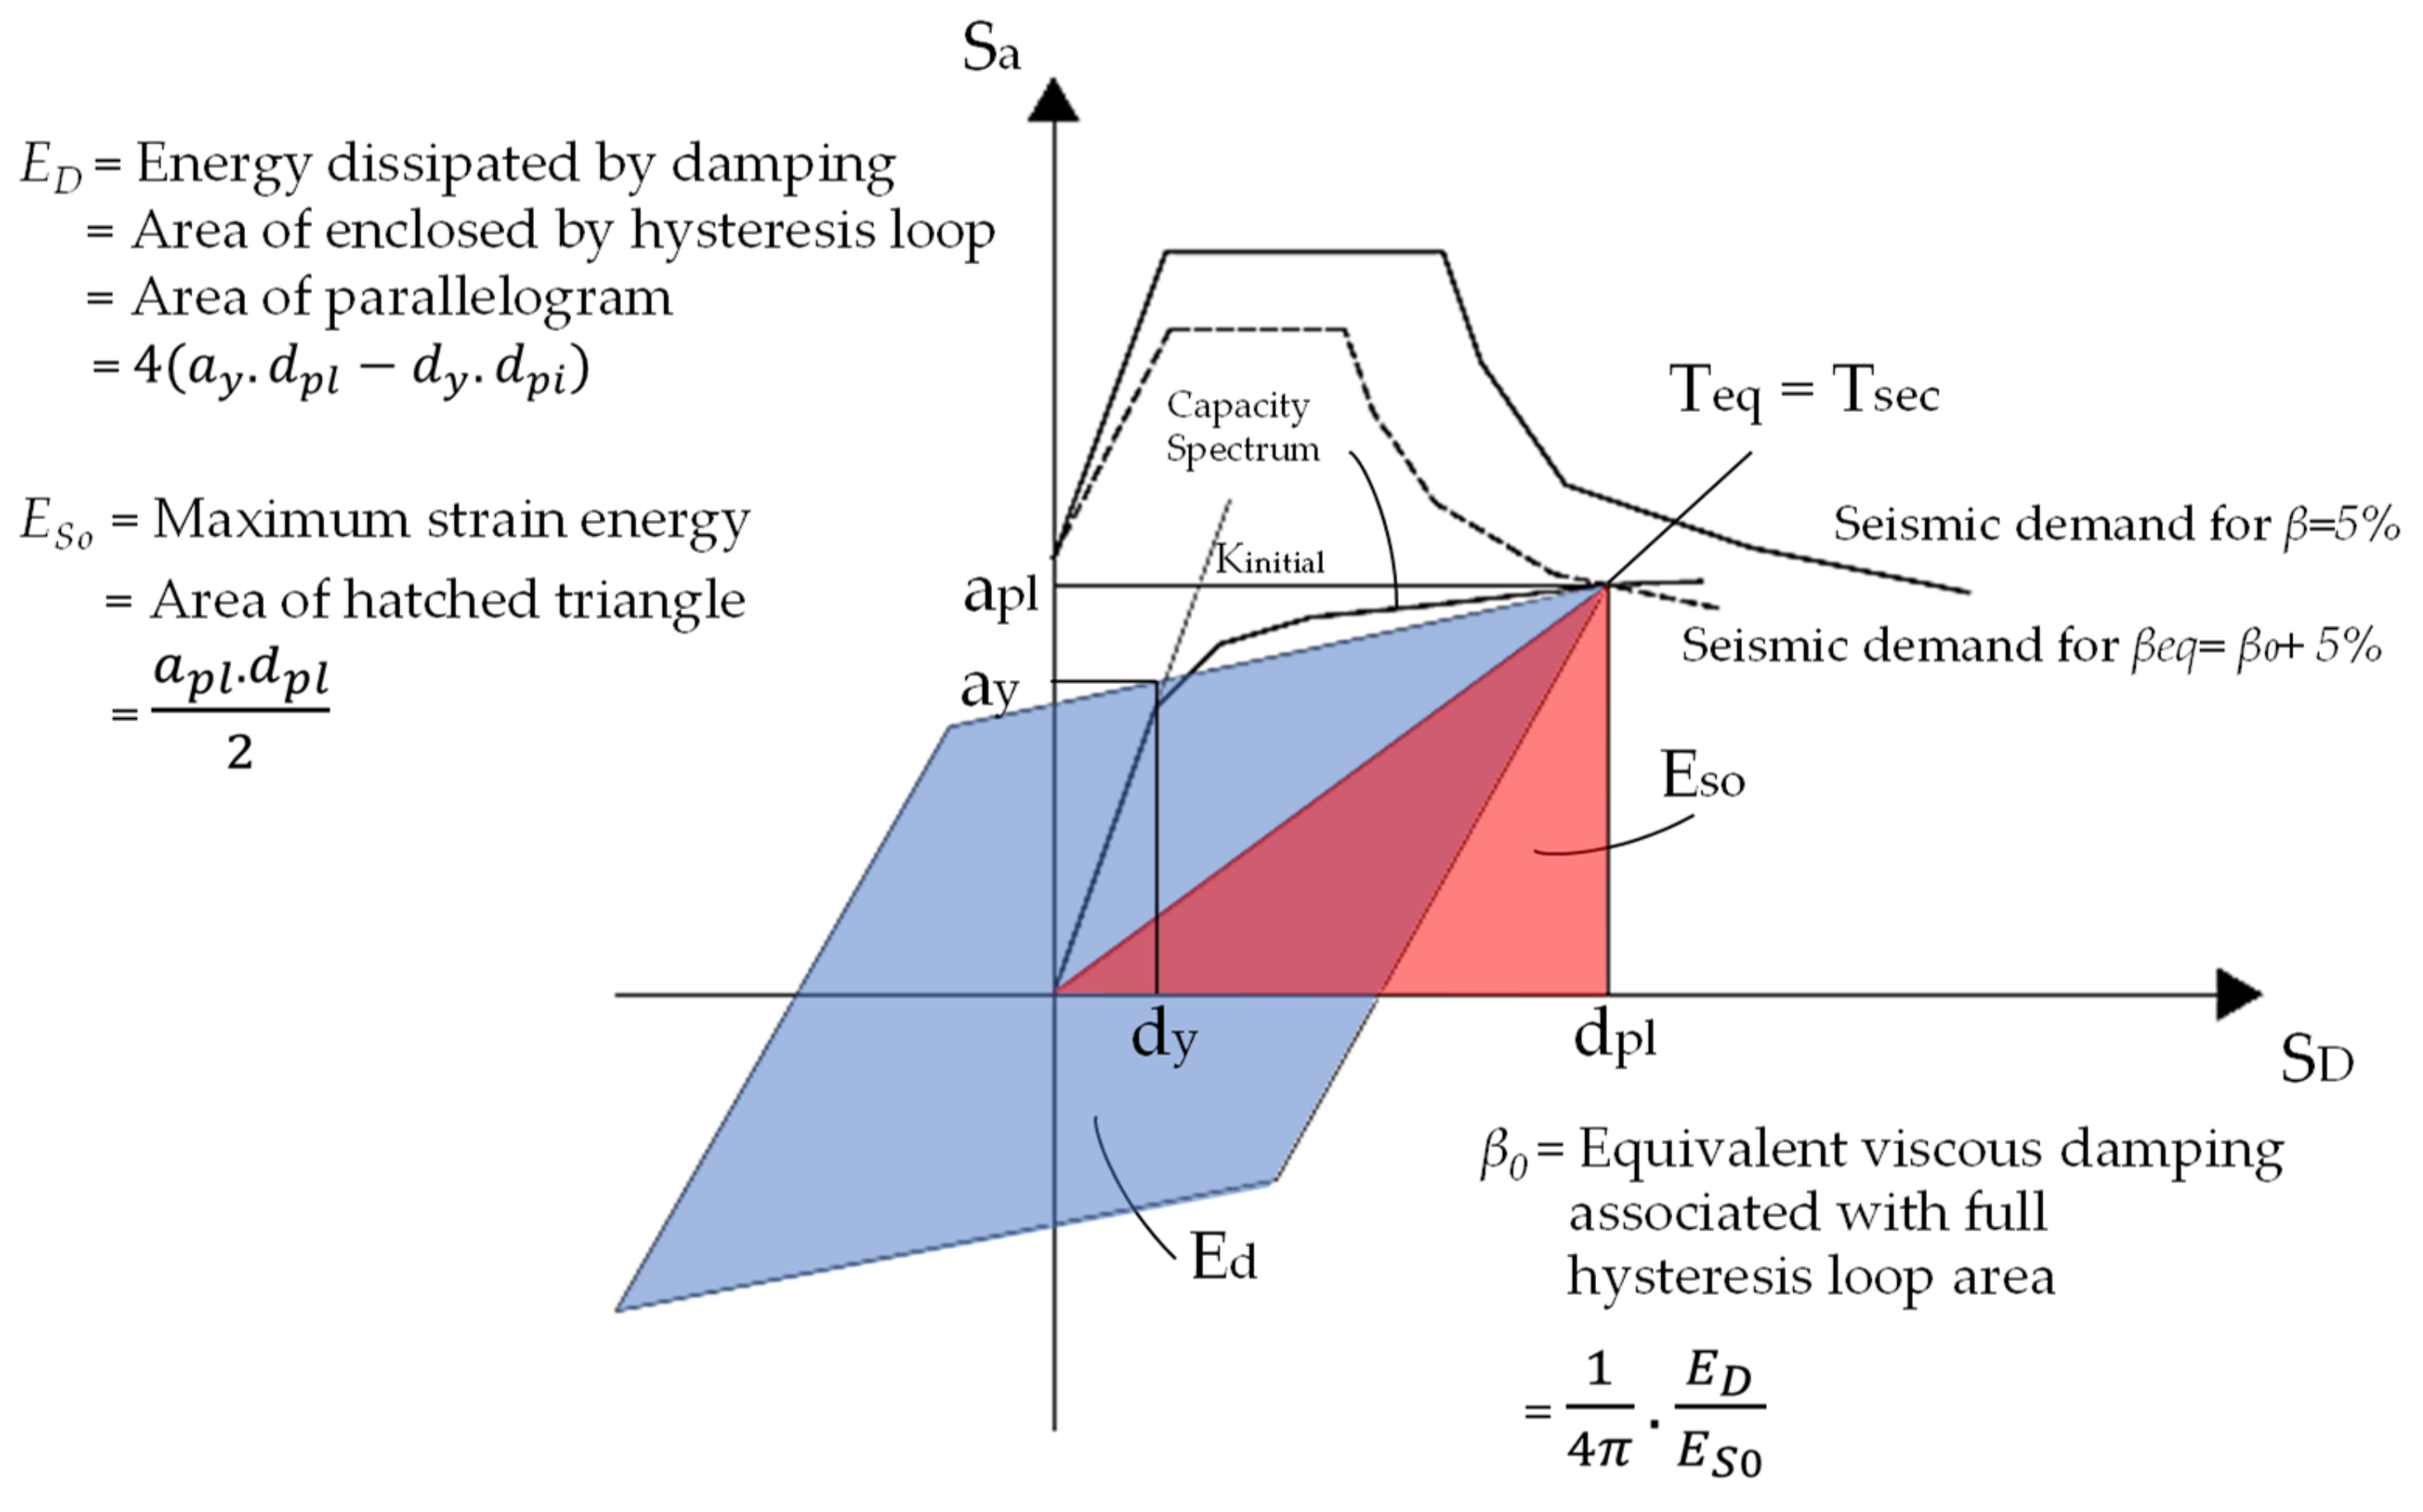
  • As seen in Figure 9, the secant modulus is used to attain an equivalent inelastic period, and the inelastic displacement demand of the structure is estimated through the intersection of the capacity and overdamped demand curve.
  • In order to obtain the overdamped response spectrum, equivalent viscous damping is needed. Two different approaches can be used to estimate the value as follows:
    • Analytical expression proposed in [47], according to Equation (2).
β e q = β e l + α 1 1 μ ρ
where:
  • βel is the elastic viscous damping, which is generally considered 5%.
  • ρ is a factor, and values of 1.5 and 2.0 are suggested by [48] for buildings with box behavior and existing buildings without box behavior, respectively. This is dependent on the hysteretic behavior of the structure.
  • α is the factor representing the asymptote of the hysteretic damping, and values of 25 and 20 are suggested by [48] for buildings with and without box behavior, respectively. This is also dependent on the hysteretic behavior of the structure.
  • μ is the ductility.
    b.
    Cyclic pushover curve as a function of displacement (Figure 9).
    β e q = 0.05 + 1 4 π · E D E S 0

3.1.3. N2 Method

The N2 method was proposed by Fajfar and Fischinger (1988) [44], and it was later improved by Fajfar (2000) [6]. It is a combination of two different mathematical procedures. The pushover analysis of an MDOF system is combined with the response spectrum of an equivalent SDOF system. This method is composed of steps such as the following:
  • Eigenvalue analysis to obtain modal properties of the MDOF system structure.
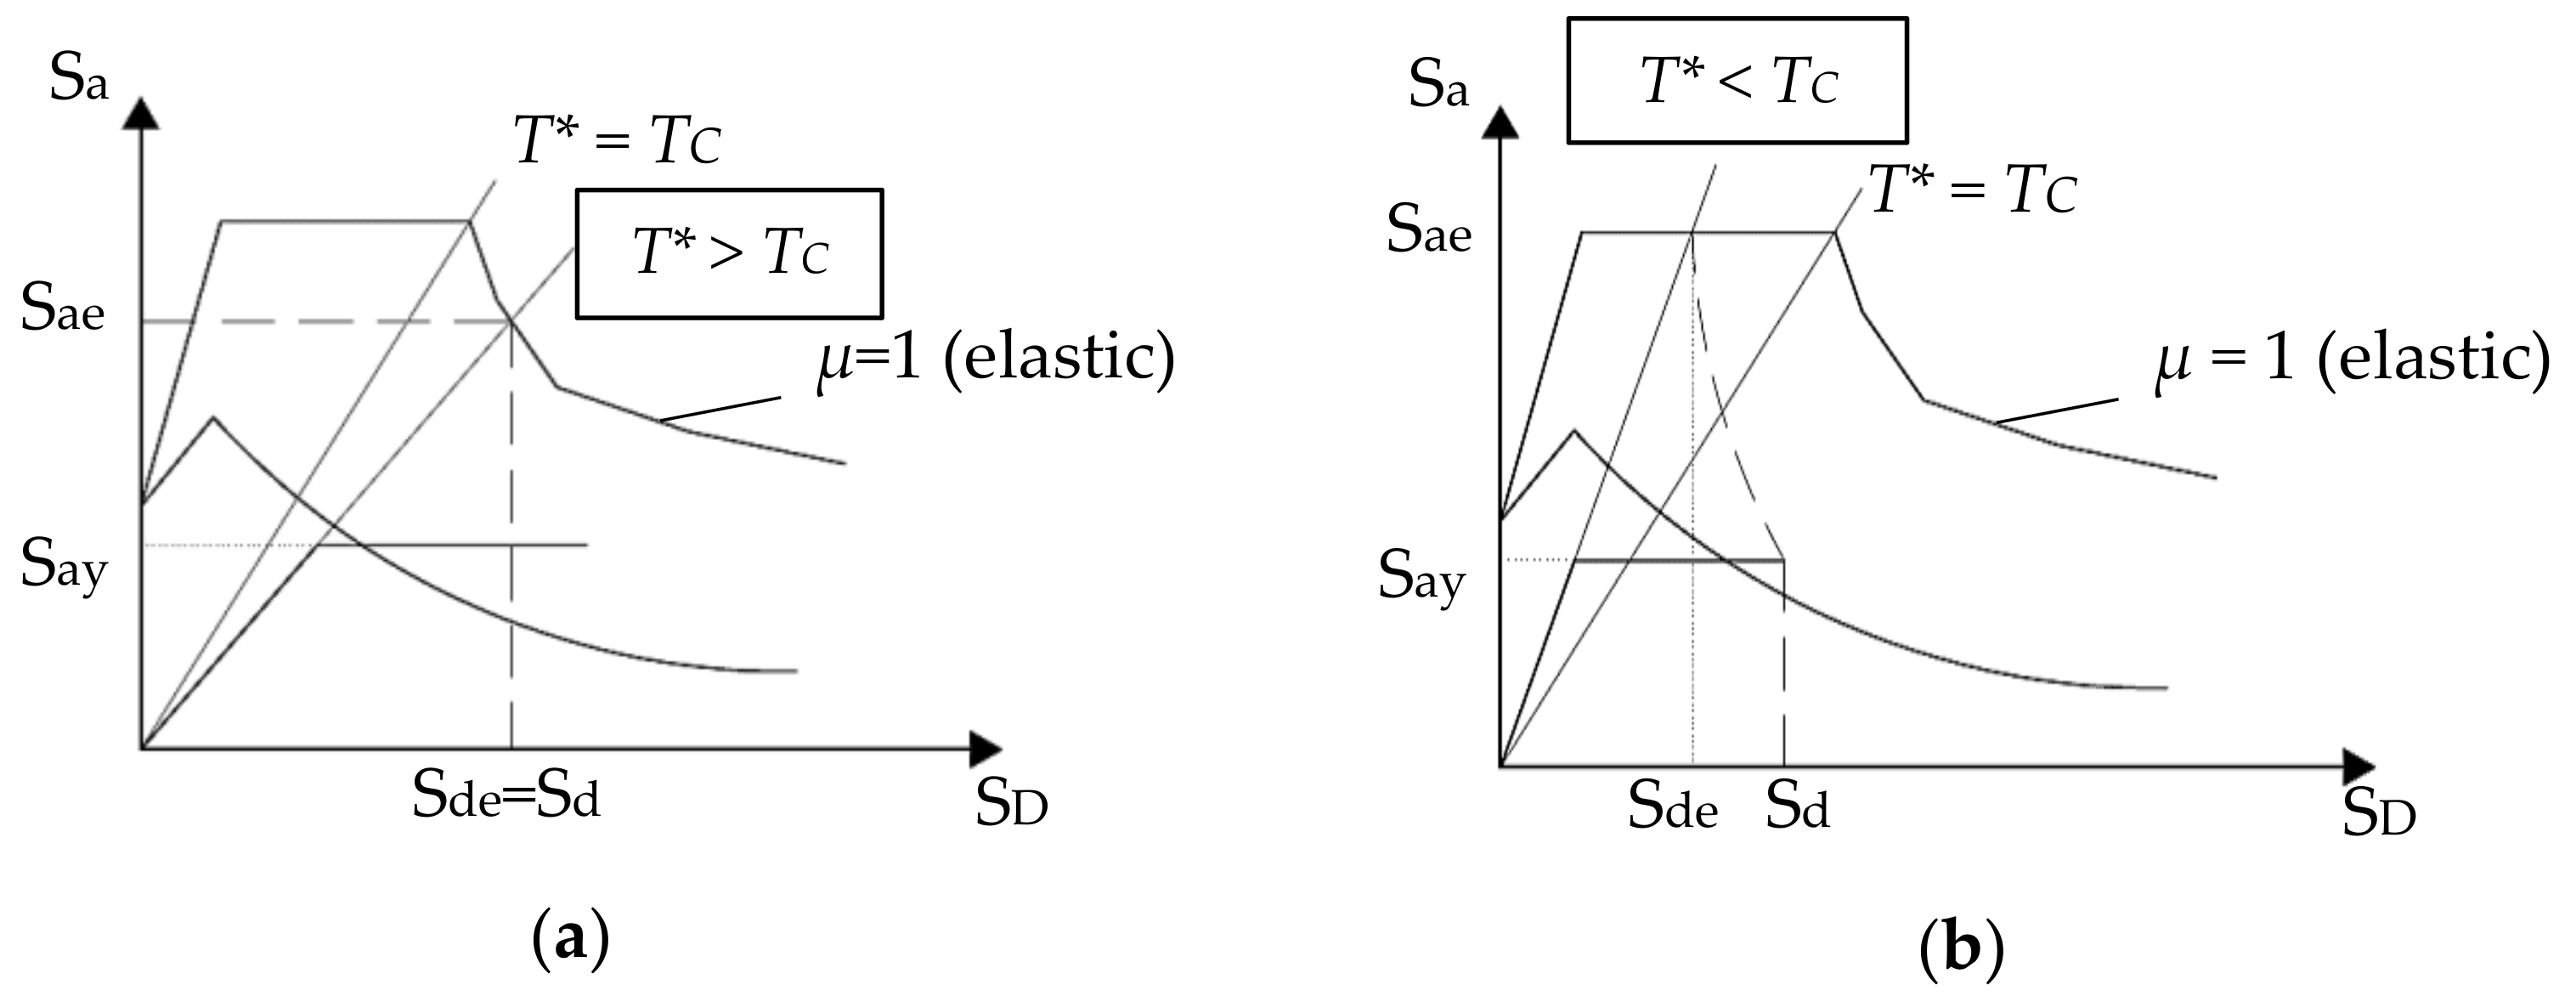
  • The representative seismic action is defined in the form of an elastic acceleration spectrum as a function of the natural period of the structure (T), converted to ADRS format (Figure 10).
  • The inelastic spectrum for constant ductility is determined by using the relations given in Equations (4) and (5).
    S a = S a e R μ
    S d = μ R μ S d e = μ R μ T 2 4 π 2 S a e = μ T 2 4 π 2 S a
    where μ is the ductility factor, and Rμ is the reduction factor due to hysteretic energy dissipation. It is important to mention that Rμ is different from the reduction factor R, which is used to modify the response of a building by taking into account both energy dissipation and overstrength.
  • The mode proportional pushover analysis is performed, and a capacity curve is obtained. The first mode shape of the vibration is assumed, and lateral loads are applied proportional to the 1st mode shape. Note that the displacement profile is assumed to be the initial first mode shape throughout the procedure.
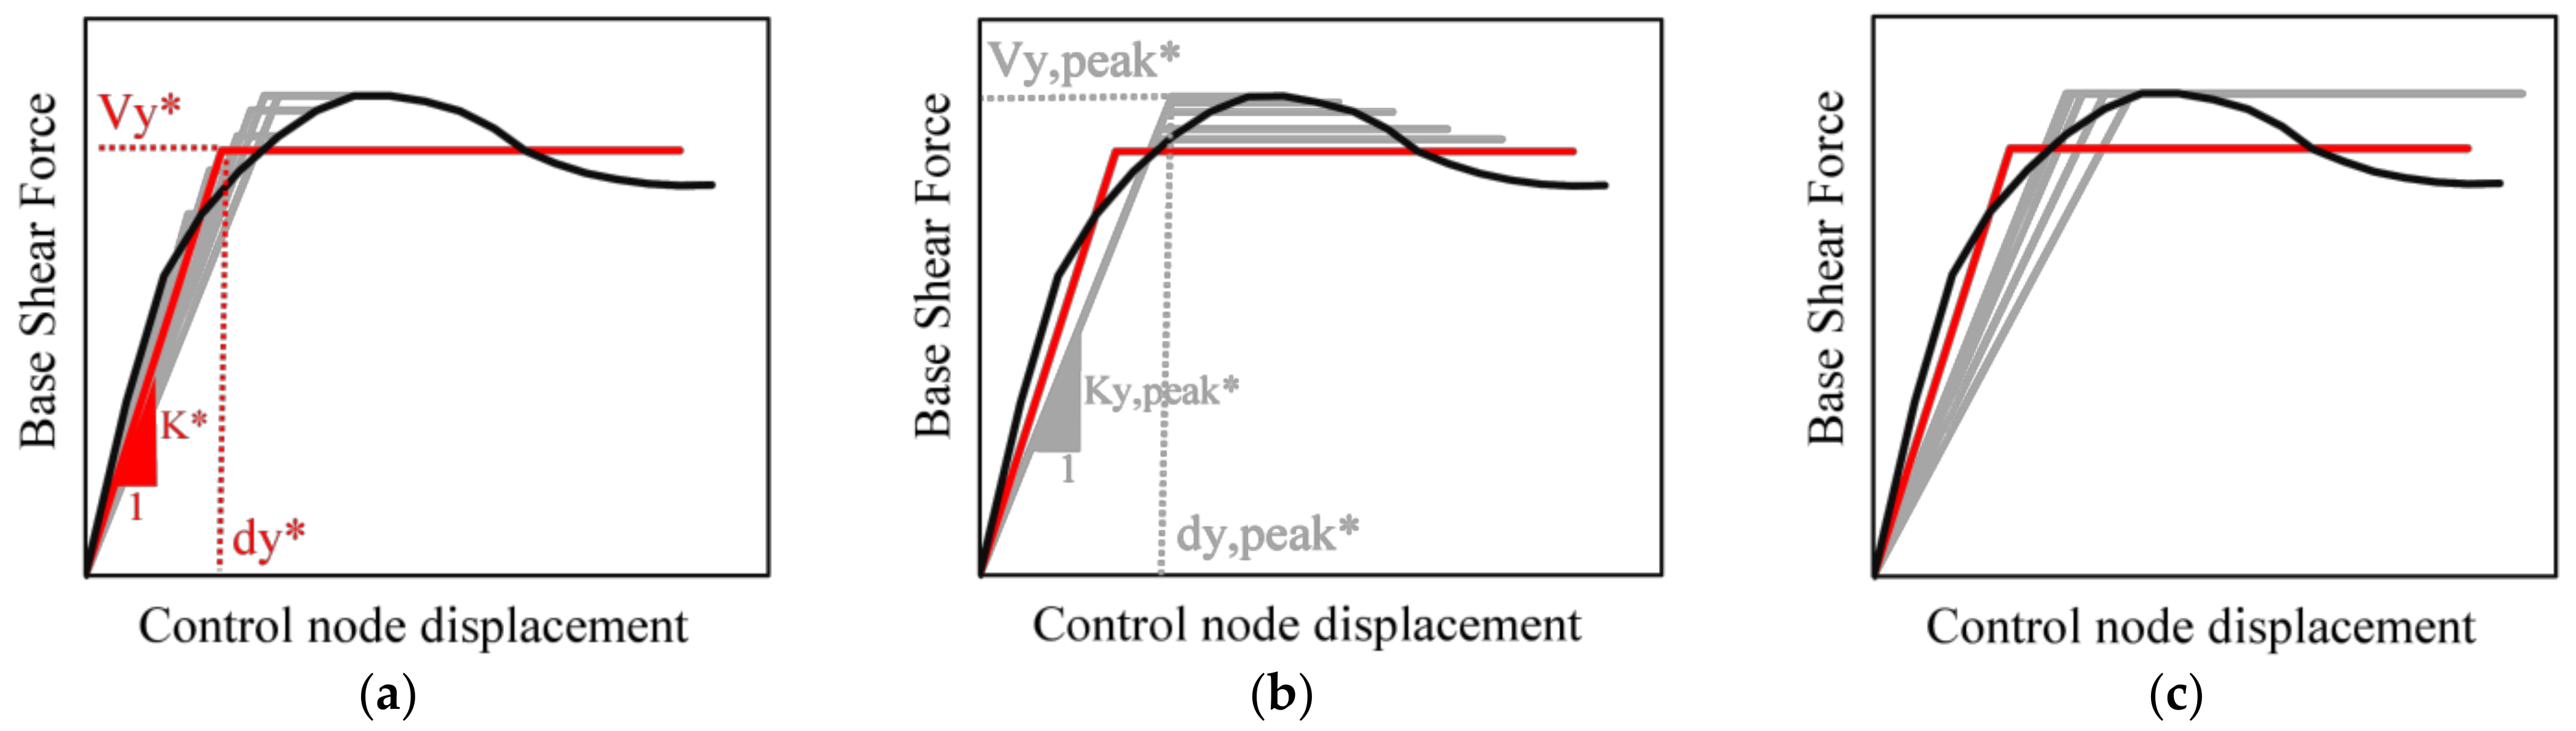
  • The capacity curve of the MDOF system is then converted into a bilinear diagram, which represents the capacity of an equivalent SDOF system.
  • Seismic demand of the equivalent SDOF system is attained graphically from the demand versus capacity diagram given in ADRS format, as depicted in Figure 10. Alternatively, Equation (6) is used to compute the displacement demand.
S d = S d e R μ R μ 1 T C T + 1     i f   T * < T C   S d = S d e     i f   T * > T C

3.2. Extended Nonlinear Static Procedures

3.2.1. Modal Pushover Analyses

Mode proportional pushover analyses are improved versions of classical pushover analysis in terms of higher modes, and there are several approaches. Mainly, this method is based on structural dynamics theory and considers the contribution of one or more than one mode of vibration. Multi-modal pushover analysis (MMP) is the first attempt to take into account more than one eigenmode that is proposed by Paret et al. (1996) [49]. The analysis of each mode is carried out individually, and then, the capacity of the structure concerning each modal shape is compared with seismic demand by using CSM. Modal pushover analysis (MPA) is developed by Chopra and Goel (2002) [50] for regular buildings and then improved for the building with asymmetric plans, which is called Modified Modal Pushover Analysis (MMPA) [51]. The former method assumes that the response of a building is governed by the first vibration mode being purely translational and, therefore, the analysis assumes a mode proportional loading pattern. On the other hand, in the latter approach, a set of pushover analyses considering several mode shapes is applied, and each mode is considered individually by imposing modal force distribution related to each mode. Then, quadratic combination rules, namely, Square-Root-of-Sum-of-Squares (SRSS) or Complete-Quadratic-Combination (CQC), are used to obtain the total demand of the inelastic structural system. It is important to notice that the use of quadratic combination rules is limited to the linear response. In the case of asymmetrically planned buildings, this drawback is overcome by an alternative approach performing pushover analysis based on the fundamental mode and consideration of several control points, since rotation on the structure results in different displacements.

3.2.2. Extended N2 Method

The extended N2 method is an improved version of the classic N2 method, and it takes into account higher mode effects on the nonlinear response in case the fundamental vibration mode of the building is not dominated by a single mode. The extended N2 method, proposed by Fajfar et al. (2005) [52] and further improved for both plan and elevation irregularities by Kreslin and Fajfar (2012) [8], is generally composed of pushover and response spectrum analyses in which the results are combined based on the SRSS rule. Pushover analysis mainly covers the fundamental mode shape in translation, and the contribution of the higher mode effects is accounted for by applying correction factors. The key assumption here is that higher mode effects are calculated within the linear range, and nonlinear displacement demands are updated with elastic displacement demand obtained by means of response spectrum analysis. In other words, the ratio of maximum inelastic and elastic displacements obtained from the pushover and response spectrum analysis, respectively, is considered as a correction factor. The procedure is summarized as follows:
  • Perform the basic N2 method and determine the displacement demand at the center of mass (CM) at the roof level. Neglect the higher mode effects at the roof level.
  • Perform the eigenvalue analysis and consider all the relevant modes. Use the SRSS rule to combine the results for both orthogonal directions. Next, obtain displacements and drifts at each level and normalize the results with respect to target displacement being equal to the roof displacement at CM.
  • Apply a set of correction factors to take into account both in-plan and elevation irregularities. Displacements are used for in plan, while the drifts are considered for the elevation to evaluate the correction factors for each horizontal direction. These factors are location dependent. In the presence of both in-plan and elevation irregularity, the correction factors are obtained individually and then multiplied to attain the final value.
    • Application of the correction factor for displacements due to in-plan irregularity:
      Firstly, the normalized roof displacement is calculated by dividing the roof displacement at a specific location by the displacement at the roof level at CM. Then, the correction factor applied to displacements is computed as the ratio between the normalized roof displacements obtained by elastic modal analysis and pushover analysis. The correction factor is equal to this ratio if the normalized displacement obtained by modal analysis is higher than 1.0. Otherwise, the value of the coefficient is assumed as 1.0.
    • Application of the correction factor for drifts due to vertical irregularity:
      Similarly, the correction factor applied to drifts in each horizontal direction is calculated as the ratio of elastic to inelastic normalized story drifts. The reduction factor is not considered if the ratio is lower than 1.0.

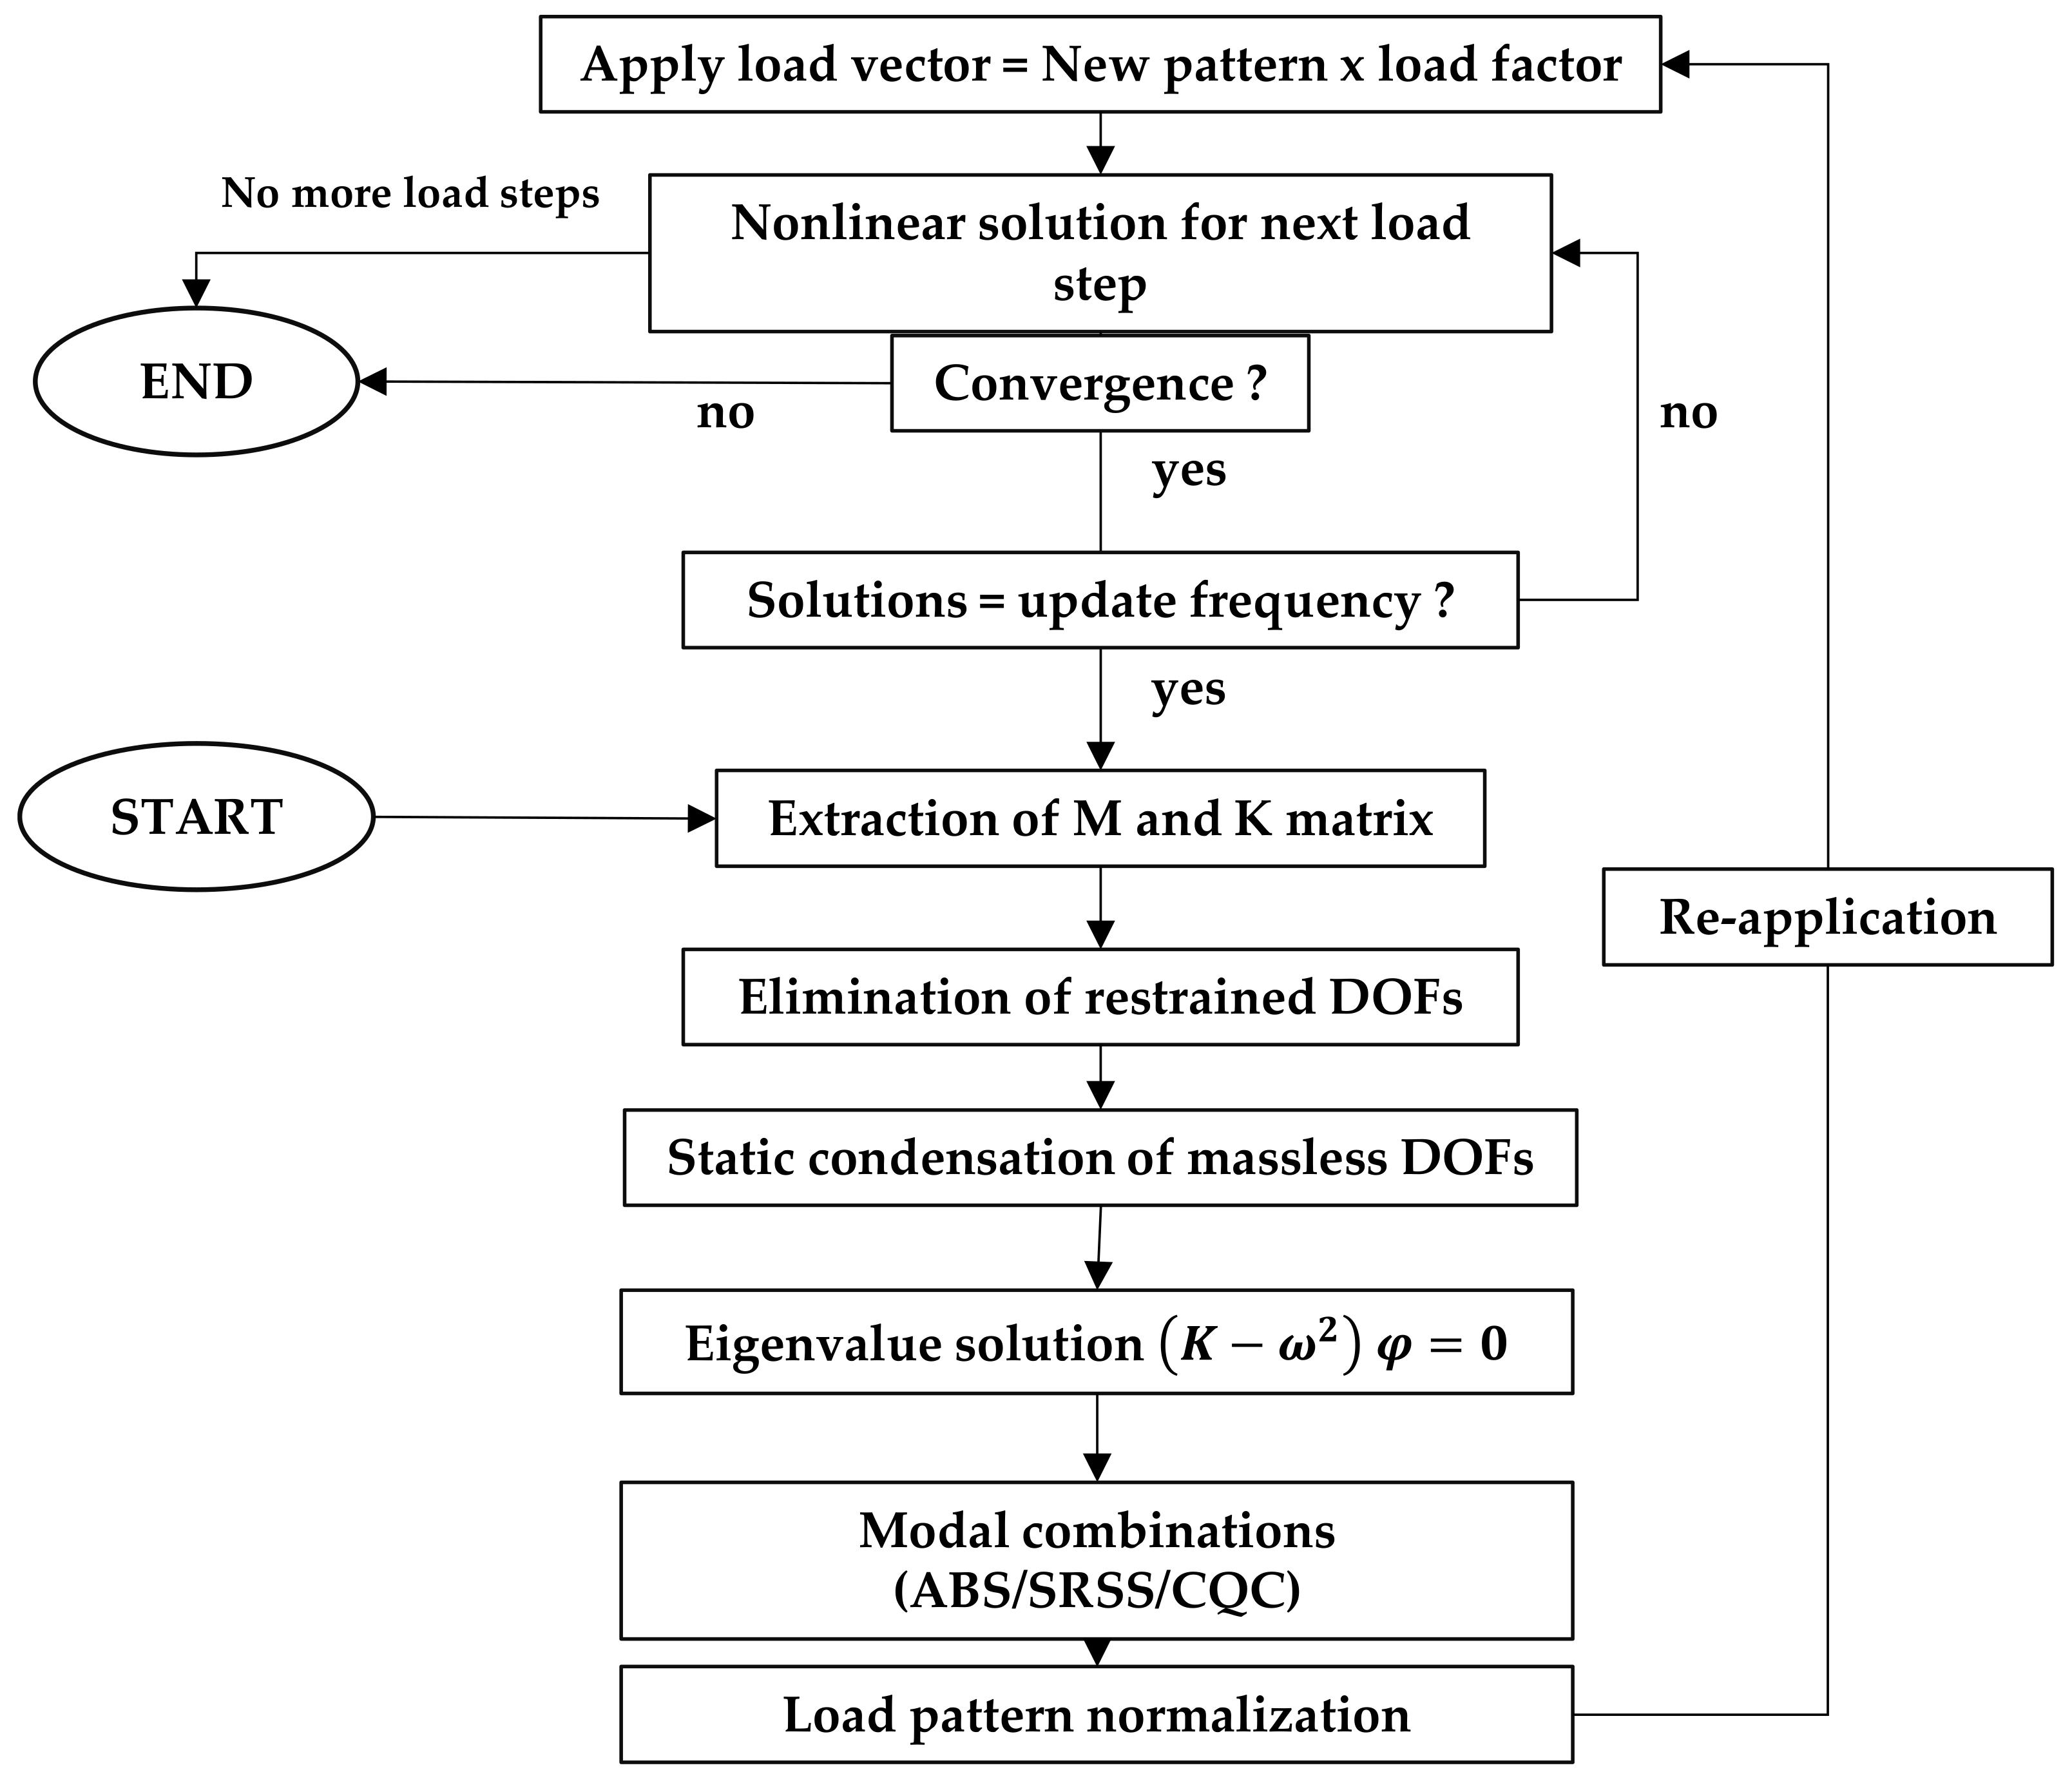
3.2.3. Adaptive Pushover Method

Adaptive pushover analysis might be the most advanced nonlinear static procedure. The analysis can be either forced or displacement based. In the present paper, the focus is given to the displacement-based adaptive pushover analysis (DAP). The major improvements that have been implemented herein are that this method accounts for stiffness degradation, redistribution of the inertial forces and enables higher modes to be considered [53]. Thus, it requires an algorithm that has four main stages: (i) carry out eigenvalue analysis using the stiffness matrix at the end of the previous step; (ii) calculate the new displacement from the modal analysis and compute normalized scaling vector; (iii) update and apply the new displacement pattern to the structure; (iv) calculate the new response of the structure and new stiffness matrix due to progressive damage [54]. To demonstrate this, the flow chart of the adaptive pushover analysis is given in Figure 11. The steps can be summarized as follows:
  • Perform an eigenvalue analysis before the next incremental displacement.
  • Based on the modal response, the displacement profile for the current step is calculated by using Equation (7).
    D i j = Γ j ϕ i j S D j
    where:
    • i is the story number.
    • j is the mode number.
    • ϕj is the modal participation factor for the jth mode.
    • Φi,j is the mass normalized mode shape value for the ith story and the jth mode.
    • SD(j) is the spectral displacement of the jth mode.
  • To keep top displacement proportional to the load factor, displacements obtained by the previous step are normalized (Equation (8)).
    D ¯ i = D i m a x D i
  • Update the load factor λ, and calculate the displacement vector (Equations (9) and (10)),
    u i , n = u i , n 1 + Δ λ · D ¯ i · u i , 0   incremental   loading
    u i , n = λ · D ¯ i · u i , 0   total   loading  
    where:
    • Δλ is the load increment factor.
    • ui,0 is the nominal displacement in a story i
    • n is the pushover step.
  • Apply the updated displacement to the model and solve the system of equations.
  • Calculate updated stiffness matrix after loading is applied.
  • Return to the first step of the loop to proceed with the next step.

4. Applications on Masonry Buildings

It is noticed that the application of nonlinear static procedures to masonry buildings is limited and not common as in reinforced concrete structures. In regard to the modal pushover analysis, it is noticed that it has been particularly applied to high-rise masonry structures, such as chimneys and towers [55,56,57]. The application of adaptive pushover analysis seems to be limited to framed system structures [58,59,60]. Nevertheless, there are few cases in which the loading pattern was derived based on the damage accumulation obtained from experimental campaigns carried out on masonry buildings. The dynamic properties (modal response) of the building were also obtained at the end of each step [61]. According to Galasco et al. (2006) [62], adaptive pushover analysis leads to unreliable results if it is performed on masonry buildings without box behavior (mainly with timber floors) due to the lack of redistribution of the forces. It is noted that this issue is not evident in reinforced concrete buildings, which have rigid diaphragms ensuring the load redistribution. Based on results available in the literature, there is also no evidence showing that performing adaptive pushover analysis on masonry buildings with a rigid diaphragm is reasonable or not, and further research on this topic is needed. It is important to notice that the application of these procedures in existing masonry buildings, particularly without box behavior, has limitations due to localized behavior. To overcome this issue, a multi-scale approach was proposed by Lagomarsino et al. (2015) [48].
In addition to the characteristics of masonry buildings, the direction of the seismic action is also a key parameter. Analysis performed in several directions can provide an insight into the least favorable direction that is not evident by simply calculating the eccentricity between CM and CR. This can be considerably relevant due to the high nonlinearity of masonry. In this respect, the concept of capacity dominium was introduced by [63], and an example of its application is found in [14].
Aiming at illustrating the application of NSPs to different types of masonry buildings in more detail, it was decided to present and discuss the results from two different cases studied by [38,64]. It is noticed that, in both cases, extensive research was performed to validate different procedures by comparing static with dynamic responses of masonry buildings. The first case points out the application of traditional procedures, such as the CSM, CM and N2 methods, to masonry buildings with different features, while in the second case study, a comparison between the classical N2 and extended N2 methods is performed. In this section, a discussion is carried out about the limitations in Section 4.2 and improvements in Section 4.3.

4.1. Case Studies Available in the Literature

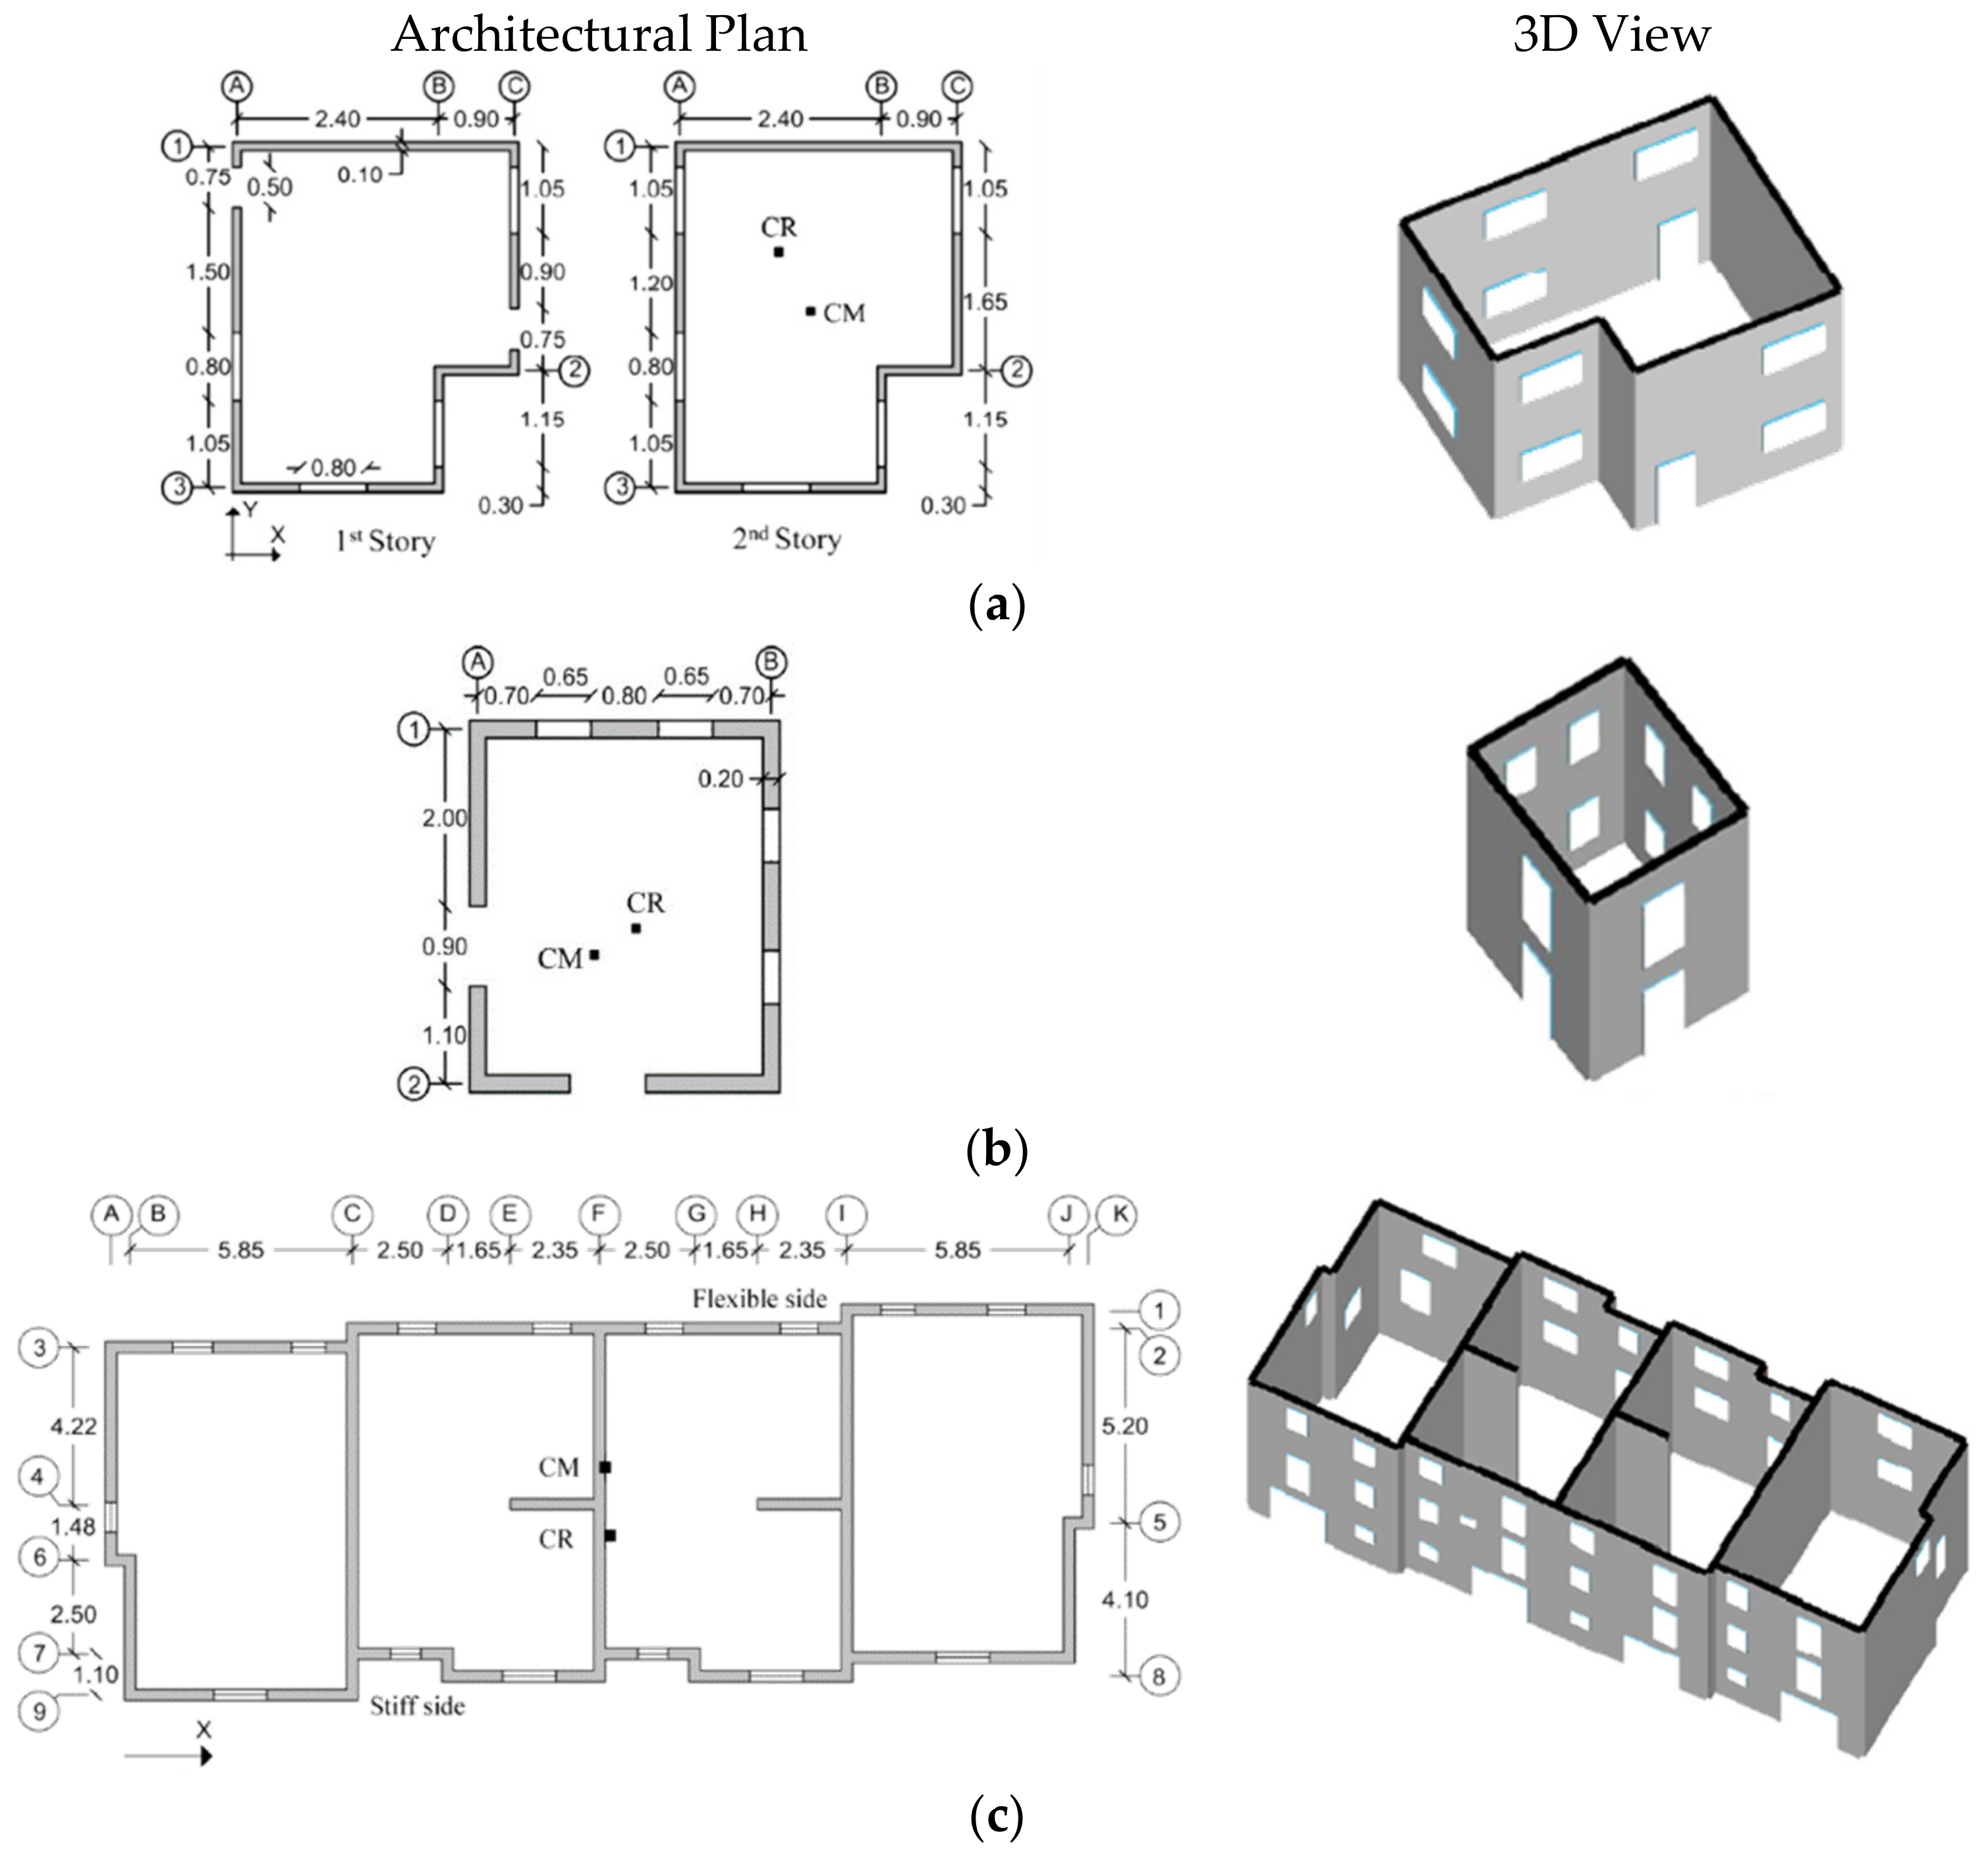
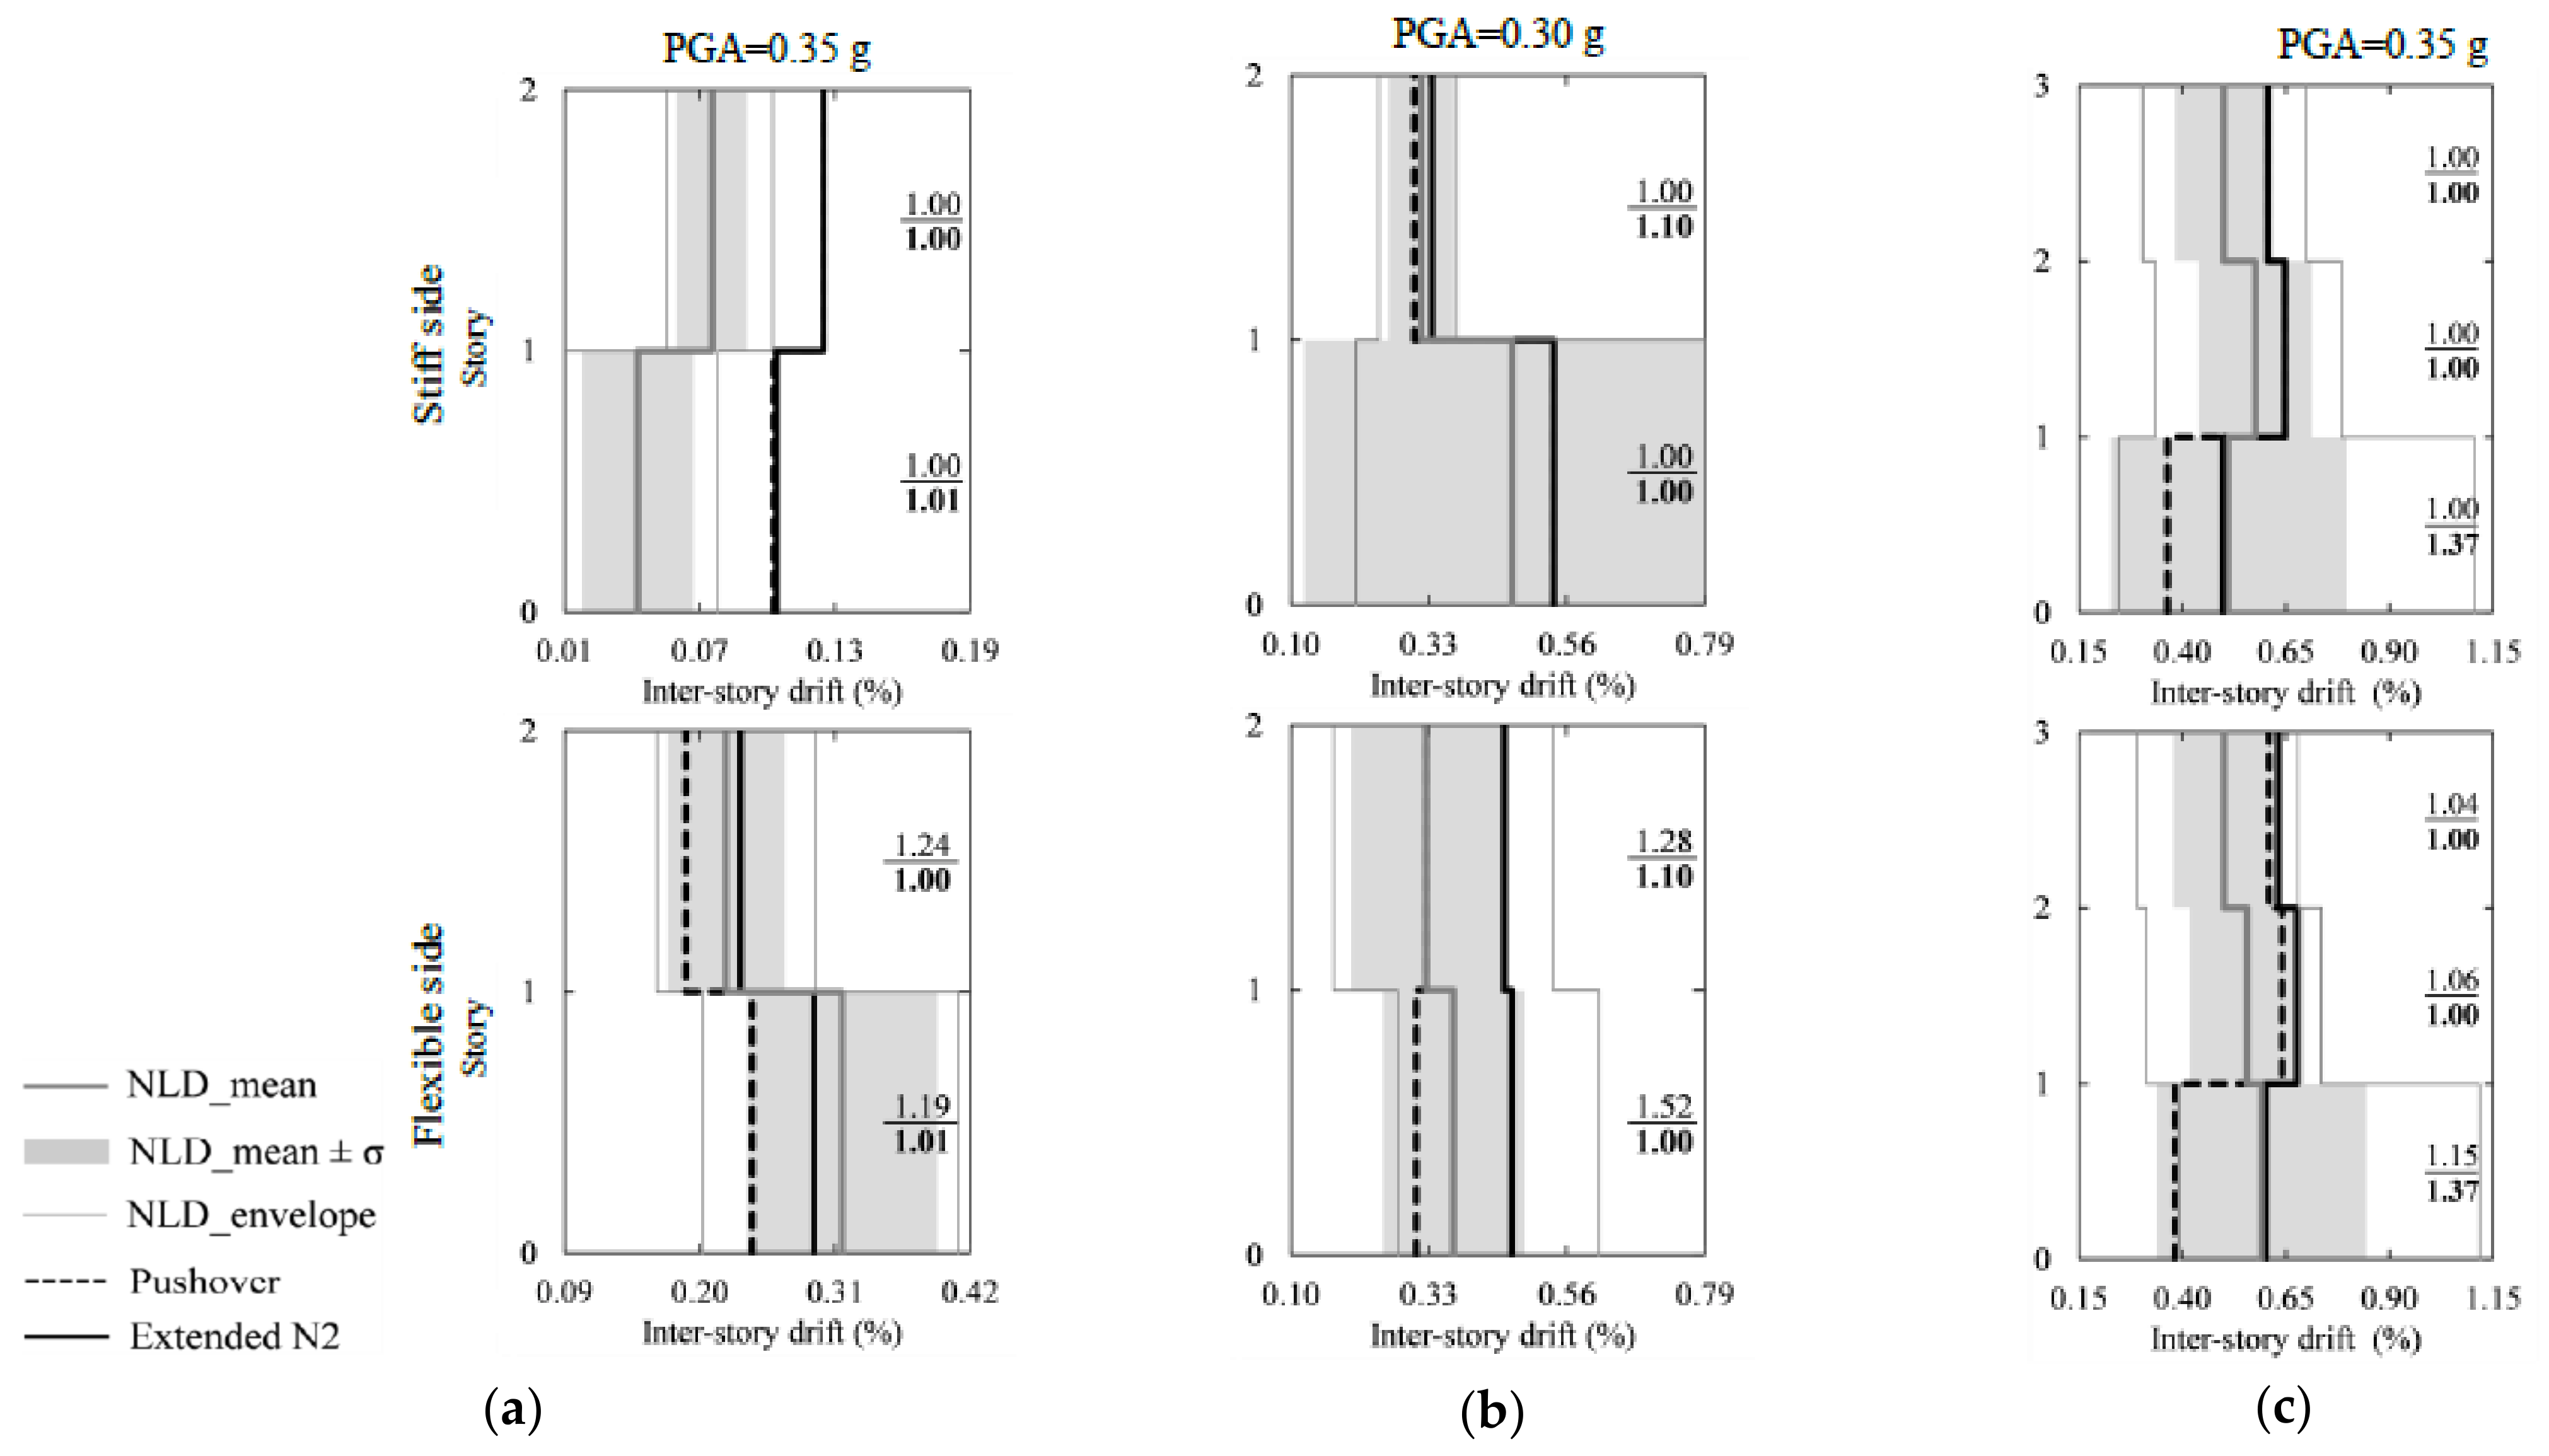
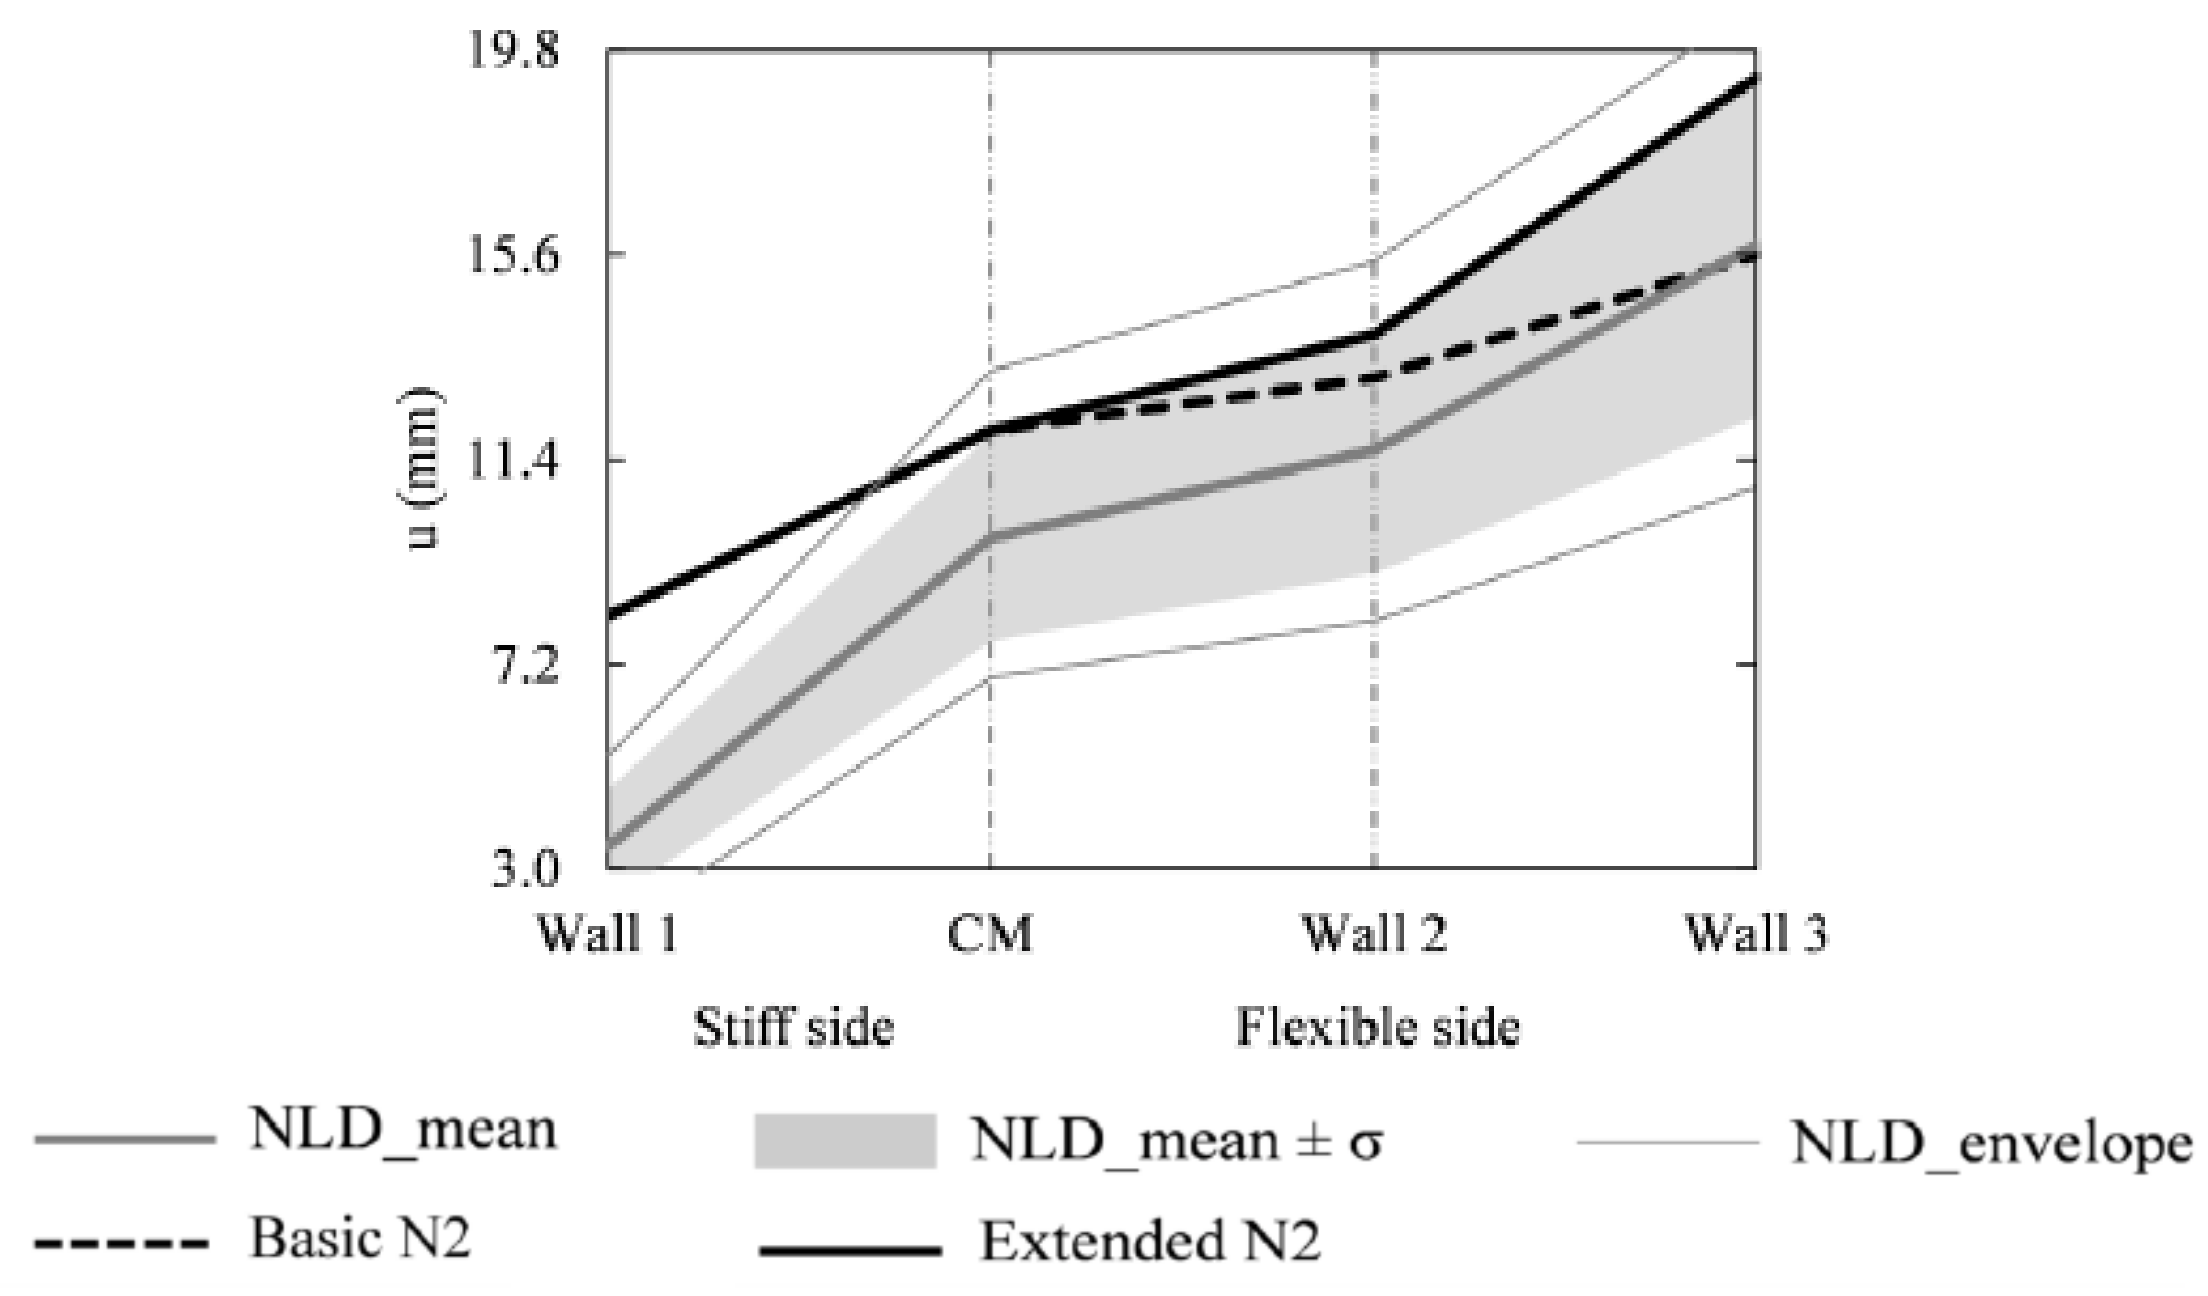
4.1.1. Case Study 1: Marino et al. (2019)

This study aimed at understanding the nonlinear static procedures and improving their application for the seismic performance assessment of irregular unreinforced masonry buildings. Representative Italian URM buildings with three and four stories, with different irregularity levels in geometry and diaphragm characteristics, were analyzed. A reference model with both in-plan and elevation regularities was compared with others where a set of irregularities was introduced. Buildings with an irregular structural system were developed with (i) in-plan irregularity (in which the classification is made by authors as addressed in Section 2) by simply introducing a change in the distribution, number, or size of the openings at the floor level; (ii) both in-plan and elevation irregularities in which a partial floor area was added above the top level; (iii) a decrease in diaphragm stiffness from rigid to intermediate and flexible (Figure 12). Additionally, the influence of constructive details, such as the tie-rods and ring-beams, on the seismic response was studied. As described in Table 3, 13 numerical models were prepared and analyzed through an equivalent beam-based macro-element approach implemented in TREMURI [65]; see Figure 12.
The work addresses three main issues related to the application of nonlinear static procedures, such as (i) the selection of the load pattern for the obtainment of the pushover curve; (ii) the identification of the damage levels based on deformation; (iii) the calculation of the target displacement and intensity measures. Thus, the work was divided into two main parts: (i) the first part deals with the nonlinear dynamic analyses to achieve an insight into the seismic response of the selected models and to serve as a reference; (ii) the second part is focused on the pushover analyses and on the application of basic nonlinear static procedures to attain the target displacement. Incremental dynamic analysis (IDA) was performed for each model in one direction (Y) by considering ten different seismic inputs. The Y direction was selected for analysis, because in this direction, the response was highly influenced by the torsional effects. Furthermore, it was necessary to avoid the coupled effect resulting from two components applied simultaneously for comparison with pushover analyses results [38]. After the obtainment of the capacity plot, a multiscale approach developed by Lagomarsino et al. (2015) [48] was used to identify the damage limits (DL) of each building. The pushover analyses were performed by firstly considering different load patterns to compare the nonlinear static responses and to select the most accurate loading protocol, for instance, uniform (mass proportional), inversely triangular (mass and height proportional), first mode shape, the SRSS combination of the first modes of each wall and the CQC combination of the first modes of each wall. The SRSS+ combination was only applied to the building with elevation irregularity. Based on the results obtained, it was suggested to use a loading pattern derived by combining load patterns proportional to the relevant first mode of each wall by using the SRSS method. Next, obtained pushover curves were transformed into a capacity curve representing an SDOF system. Accordingly, nonlinear seismic demands for each model, load pattern and damage limits were calculated by using the N2 method, Coefficient Method and Capacity Spectrum Method. Moreover, results obtained from a proposal for improving the N2 method [38,66] were also analyzed. This proposal is based on a new procedure to obtain the bilinear curve equivalent to the capacity curve and will be discussed in more detail in Section 4.3. Intensity measures (IM), which were selected as PGA, were calculated aiming at the development of the Incremental Static Analysis (ISA) curve. It is noticed that the different procedures are compared in terms of PGA rather than displacement demands directly. According to [66], PGA provides more insightful results than spectral displacement within the framework of the IDA and ISA comparison. The displacement demands at certain damage limits are considered to obtain the relevant IM to compare different procedures [66].
For the sake of simplicity, only the DL4 that represents the ultimate displacement demand is discussed here. The comparison of the results among the typology of the buildings is performed in terms of the intensity measure ratio (static over dynamic); see Figure 13. It is found that CSM is the most conservative method, and the reason for this may be associated with the use of the secant stiffness. CM provides a good prediction, but it is very demanding, as the procedure requires an iterative approach. On the contrary, the N2 method seems to be the least suitable for the given case studies. This may be attributed to the disregarding of the strength degradation and change in the damping, which is inevitable in masonry buildings. Moreover, it is important to note that the prediction of the response of the buildings with both in-plan and elevation irregularities is significantly poor, except for the CSM. Likewise, the N2 method, which is mainly recommend in EC8 and NTC, presents unconservative results, even in the case of buildings with in-plan regularity. The comparison of the results obtained from the N2 adaptive method and the new proposal made by the author is discussed in Section 4.3 for the sake of content flow.

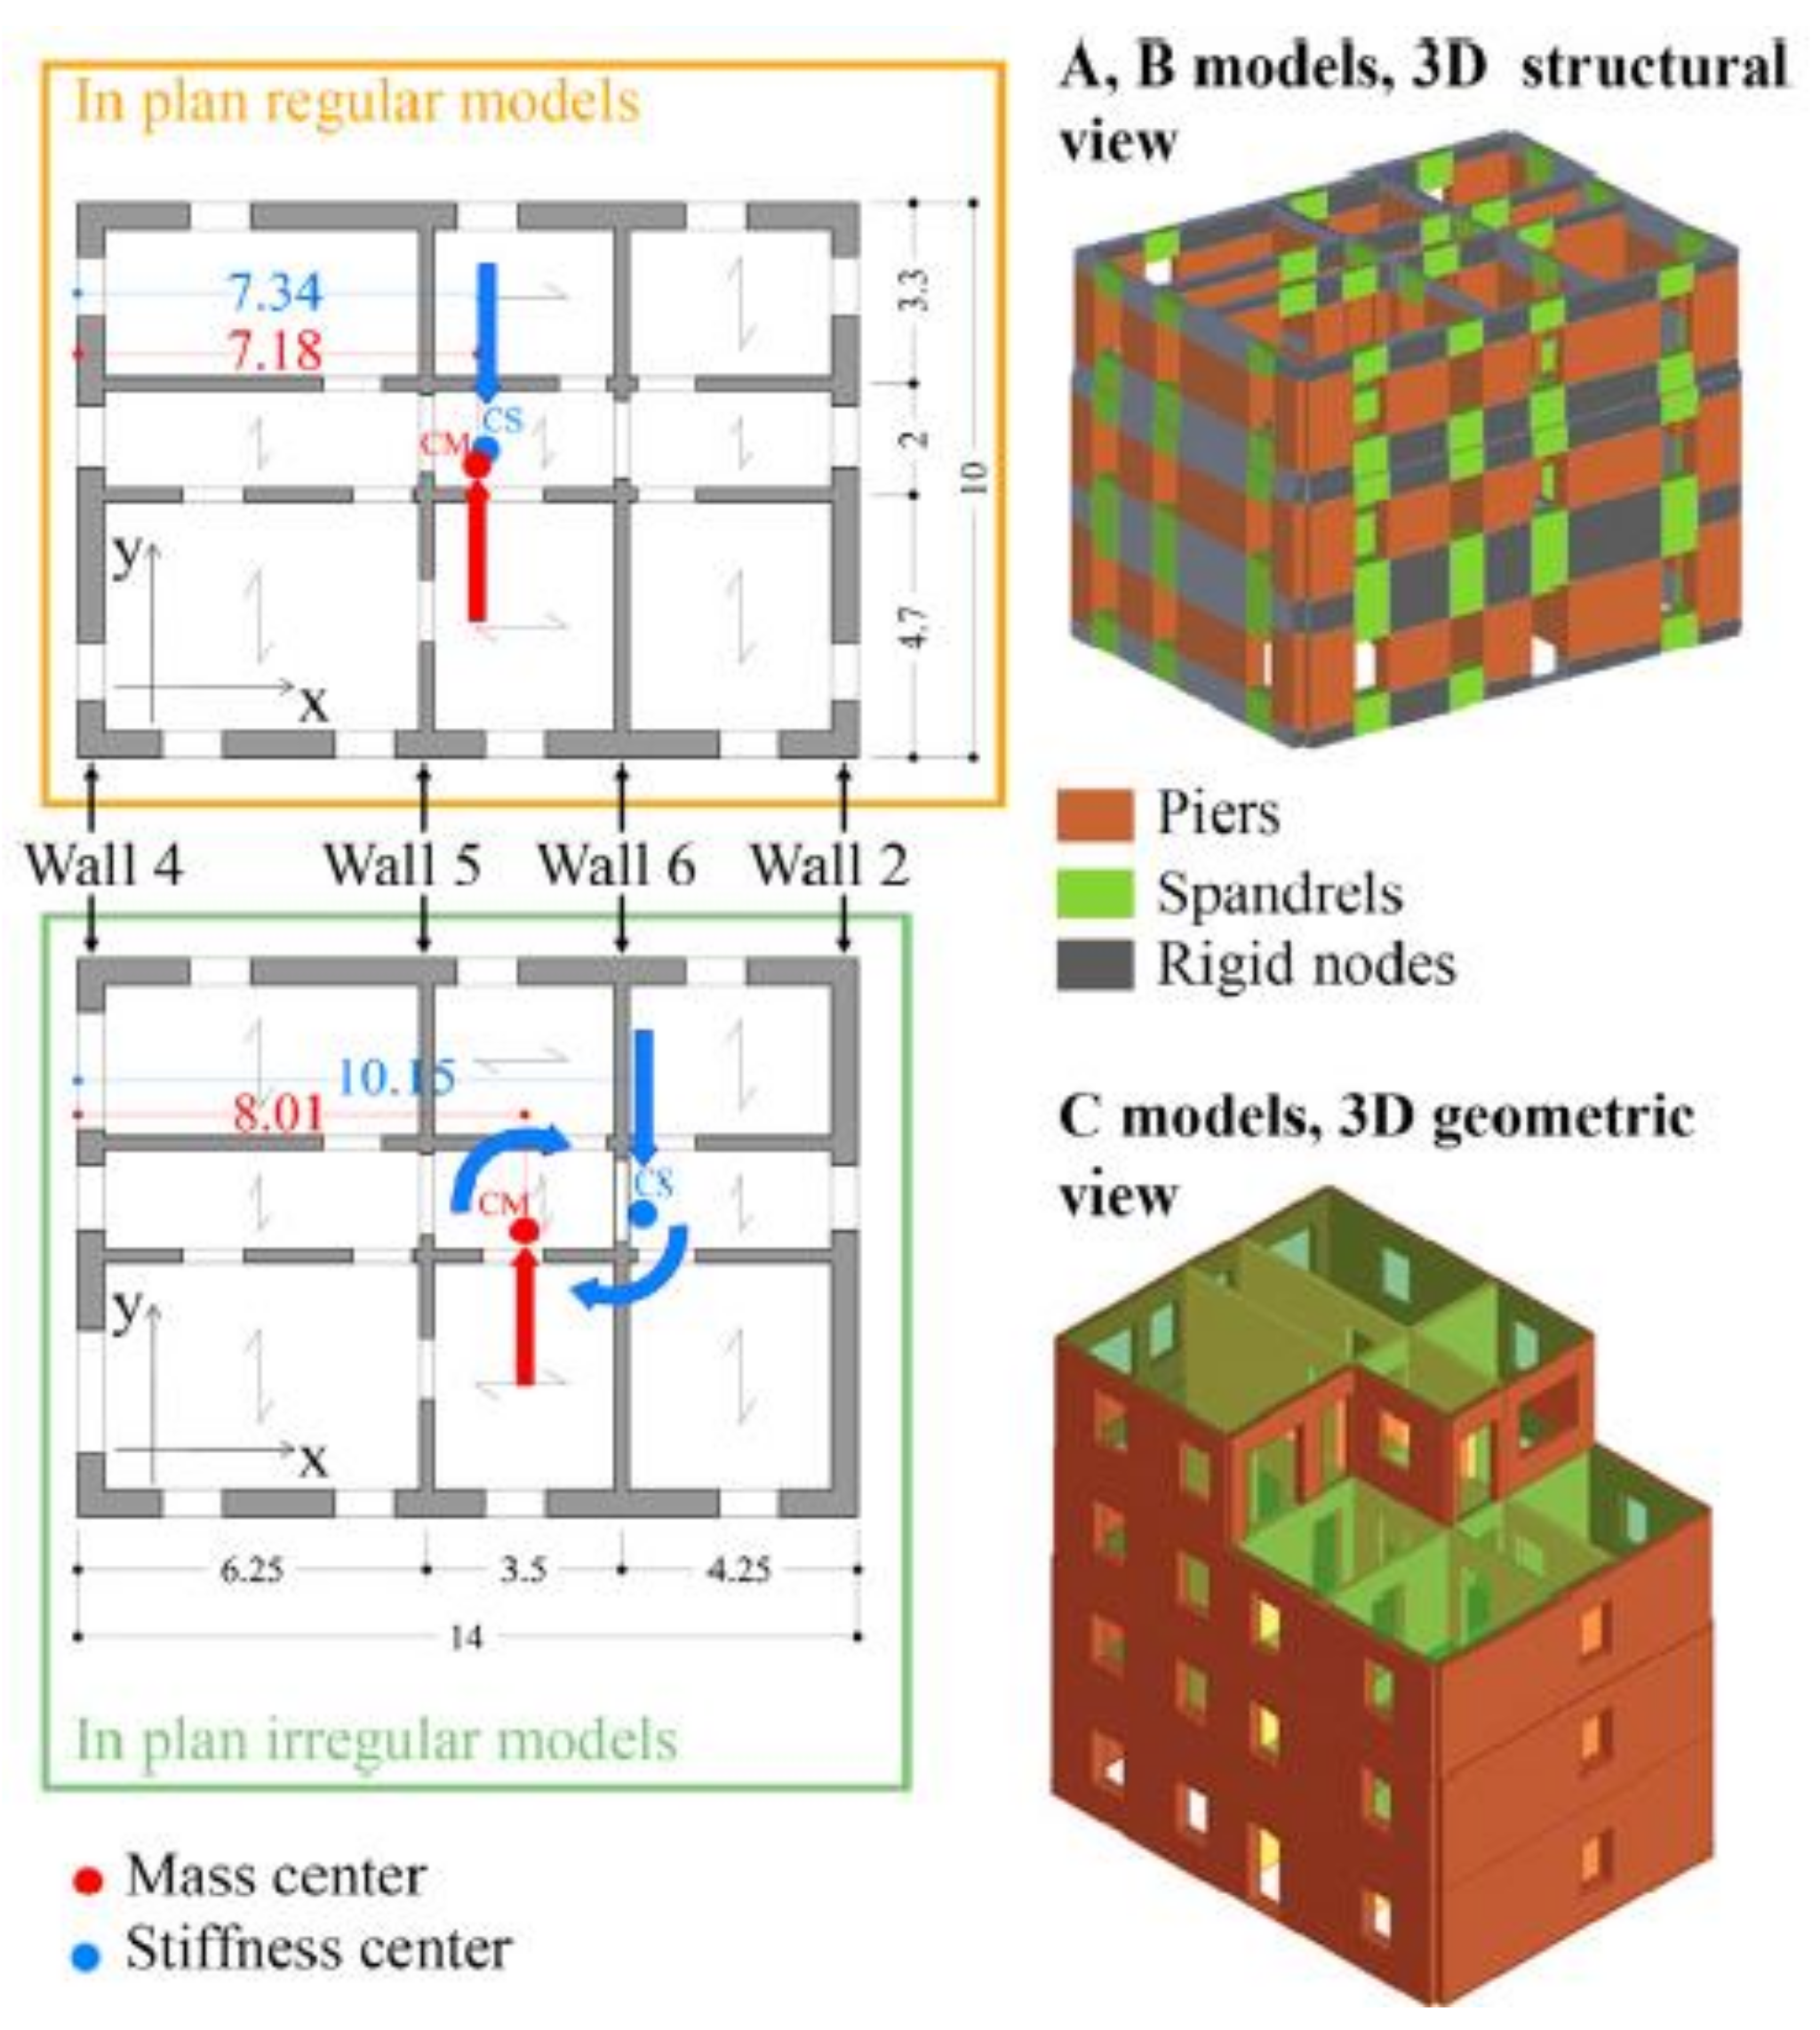
4.1.2. Case Study 2: Azizi (2018)

This case study refers to the assessment of the performance of the extended N2 method in URM buildings (concrete block masonry buildings) with in-plan and elevation irregularities, and rigid diaphragms by performing a set of nonlinear dynamic and pushover analyses. The numerical analyses were performed through the structural component model available in TREMURI software [65]. Three different models with different structural layouts were analyzed, namely, COM and CLM isolated buildings with different levels of irregularity and ACM buildings integrated in an aggregate; see Figure 14. The nonlinear dynamic analyses were executed by considering artificial accelerograms derived based on the EC8 elastic response spectrum, considering seven pairs for the COM and CLM buildings and four pairs for ACM buildings (Figure 14). A set of pushover analyses was also carried out based on a load protocol proportional to the mass and proportional to the shape of main translational mode. The results of the dynamic analysis were taken into account as reference values to compare and choose the most reliable pushover-obtained demands. Accordingly, it was found that the capacity curves obtained from mass proportional pushover analyses were similar to those found from nonlinear dynamic analyses (NLD) and, therefore, were chosen to evaluate the extended N2 method.
In this study, response spectrum analyses (RS) were preferred to attain elastic seismic demand and, therefore, to calculate correction factors that are functions of elastic and inelastic displacement demands. The first four- and five-mode shapes were considered and combined by using the SRSS rule for COM and ACM models, respectively. The CQC rule was applied for CLM buildings taking into account the first five-mode shapes. According to the alteration suggested by Azizi (2018) [64], the combination of RS results for each direction was disregarded. In this sense, elastic displacements in both horizontal directions were found individually at various locations, such as the center of mass (CM), stiff and flexible sides (the side closer to the center of rigidity (CR) is named as a stiff side).
To examine the higher mode effects on the masonry response due to in-plan and elevation irregularities, two different procedures were applied to achieve target displacement by using the extended N2 method as follows.
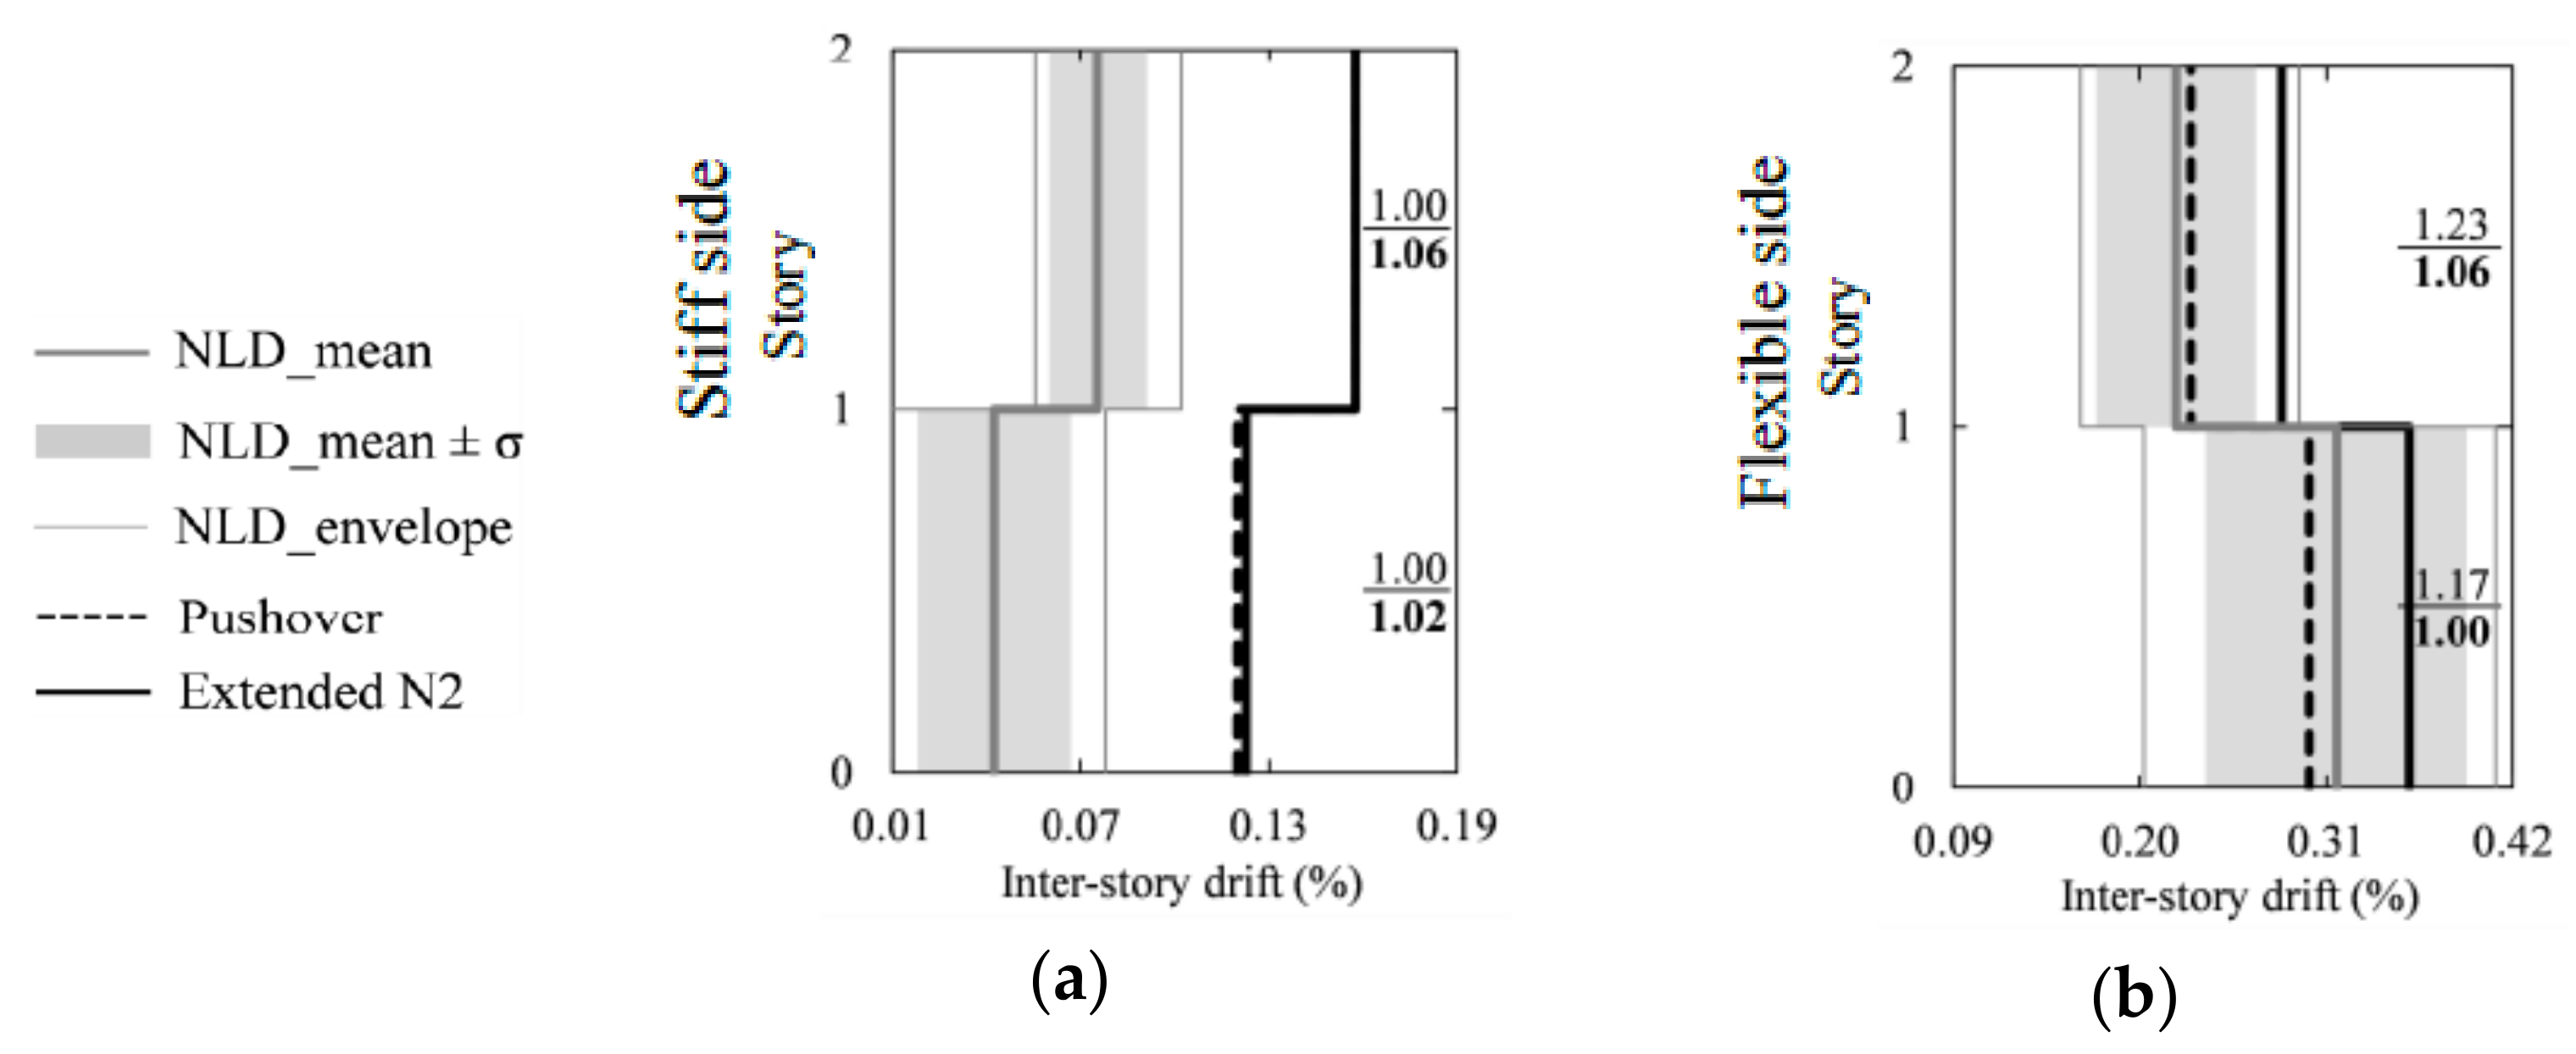
  • First approach: The target displacement was computed by considering the mean value of NLD analyses instead of the basic N2 method. Next, pushover analysis was performed until the target displacement value was equal to that obtained from NLD analysis. The response computed in the previous step was updated employing a correction factor considering both torsional and elevation effects (extended N2 method). This method was applied to all models, namely, COM, CLM and ACM.
  • Second approach: The target displacement was calculated by the basic N2 method, and then updated using a correction factor to take into account the effects of in-plan and elevation irregularities on the response (extended N2 method). This approach was utilized for COM buildings only.
The results are compared in terms of absolute roof displacement and inter-story drifts at both flexible and stiff sides of the buildings. The absolute roof displacement is used for indicating in-plan irregularity, while inter-story drift values are considered to calculate in-elevation irregularity. The results show that the extended N2 method is conservative and provides accurate displacement demands which are similar to NLD results at the flexible sides of the models (Figure 15). On the contrary, inter-story drift ratios, which are used as indicators of the higher mode effects in elevation, differ among the procedures (Figure 16). Correction factors are given in the figures indicating the factors for in-plan (upper number) and in-elevation (lower number) irregularities. Overall, the seismic demands calculated using the extended N2 method slightly overestimate displacements in the flexible sides of the buildings.
The second approach demonstrates that the basic N2 method shows a minor error (%2) for the flexible side, while the extended N2 method overestimates the average target displacement achieved by several NLD analyses by nearly 23%, as depicted in Figure 17. On the other hand, both the pushover analysis and extended N2 method considerably overestimate the displacement in the stiff sides of the buildings (Figure 18). Accordingly, it is suggested that the second procedure, including the combination of the basic and extended N2 methods, is adequate and provides reasonable demands within the present cases. Regardless of the applied approach, it is important to stress that the response revealed to be highly location-dependent due to the torsional behavior is present, as expected. This means that different control points used to compute capacity curves (stiff and flexible sides) result in different displacement values throughout the structure (both in plan and elevation). Consequently, such variation leads to a significant difference in the target displacement obtained.

4.2. Limitations of NSPs in Masonry Buildings

The nonlinear static procedures have been successfully used in framed structural systems, such as reinforced concrete and steel. However, there is relatively limited research on the application of the performance-based approach to masonry structures and, in particular, to irregular masonry buildings. In fact, within the case studies presented in the previous section, several limitations can be identified.
  • The selection of load patterns is important, and the structural response is highly influenced by the presence of irregularities. According to [38], neither uniform nor triangular load patterns are suitable for buildings with elevation irregularities. The main reason for this is that the damage is concentrated at the top level as a result of dynamic behavior, but in pushover analysis with a uniform or triangular load pattern, a reduction in internal forces is recorded, as the applied force is a function of mass and height. Therefore, in the case of irregularity, it may be expected to have a reduction in mass, which will lead to a reduction in force. In addition, the mode proportional load pattern is only feasible if the response is governed by the so-called box behavior.
  • Another important aspect is the identification of damage levels and the corresponding limit states. According to the codes, the definition of limit states is based on drift values associated with the failure mechanism at the building scale, which can be unconservative [36,38,67,68]. To overcome this issue, a multiscale approach, combining global and microelement scale behavior, was suggested by [48], particularly for buildings with an intermediate or flexible diaphragm.
  • A considerable difference in displacements is found due to the selection of bilinearization methods, and, therefore, the accuracy of NSP is highly dependent on the bilinearization method [38,64].
  • It should be mentioned that although IDA and ISA consider different levels of intensity, the major differences found between them are mostly justified by inherent differences found in the static and dynamic behavior of masonry buildings.

4.3. Improvements Proposed

In this section, adjustments of NSPs to masonry buildings proposed by several researchers are presented and discussed. It is noticed that improvements are generally suggested for classical and extended N2 methods to make them more feasible for masonry buildings. Proposals made by different researchers are summarized and listed in Table 4.
Azizi (2018) [64] proposed two major alterations to application of the extended N2 method to masonry buildings: (i) disregarding the superposition principle by the SRSS to the results obtained from pushover analysis and response spectrum analysis; (ii) the application of location-dependent correction factors. The former alteration is justified by the different distribution of the mass and stiffness throughout the masonry building both in plan and elevation regarding framed systems that have lumped mass and stiffness at the floor levels. The second alteration proposes the use of correction factors obtained for each floor, since the in-plan mass and stiffness distribution differ among the floor levels.
Graziotti et al. (2014) [69] pointed out that the application of the classical N2 method to masonry buildings has drawbacks, because the maximum displacement is underestimated for high-ductility buildings, and overestimation is observed for low ductility systems. To overcome this, they propose the introduction of an exponential correction factor β to the regular N2 formulation. The calculation of the strength reduction factor (R) requires an iterative procedure since it is a function of ductility, which is updated by introducing the exponential correction factor (Table 4). The proposed correction factor β is a function of the hysteretic dissipation of the system and the formulation given in Equation (11).
β = 9.37 ζ h y s t + 3.36 > 1   for   R     2 β = 1   for   R   <   2
The main objective of using a correction factor is to improve the relationship between strength reduction factor R, ductility μ and the period to corner period ratio (T/Tc). From this improvement, higher accuracy in the estimation of displacement demand for short-period masonry buildings is achieved. The authors noted that a constant value of β equal to 1.8 ensures sufficient agreement for all the structures, in particular if there is no cyclic behavior information available.
Guerrini et al. (2017) [70] pointed out that the application of the classical N2 method may not be accurate in masonry buildings. The main reason for this is that code NSPs only take into account the structural period and ductility. Nevertheless, it is stressed that demand is highly dependent on the hysteretic behavior of an equivalent SDOF system. In fact, an SDOF system with a short period demands higher displacement due to low dissipation capacity, and, therefore, the use of code NSPs may underestimate the inelastic displacement demand for short period structures. With this aim, Guerrini et al. (2017) [70] derived an improved formulation in which hysteretic energy dissipation is introduced to the relation between elastic and inelastic displacement demands, as given in Table 4. The parameters ahyst, b, c and Thyst are adopted based on the hysteretic dissipation range, assuming that these depend on the dominant resisting mechanisms, namely, flexure or shear (Table 5). However, if there is no available information regarding to the hysteretic dissipation, i.e., cyclic pushover analysis, it is suggested to consider geometrical and mechanical properties, such as axial load and aspect ratio of piers, for the selection of the parameters required.
Recently, further research was developed by Marino (2018) [66] to improve the classical N2 method used in Eurocode 8 and NTC 2018. The author proposes (a) an adaptive N2 method by considering an adaptive bilinear diagram (N2 adaptive), (b) an improved N2 method by the combination of the adaptive N2 method with a new formulation to calculate the target displacement (new proposal). An adaptive bilinear idealization was proposed to take into account strength and stiffness reduction to achieve a more precise prediction of the target displacement. The main reason for this is that the classical N2 method is limited to one equivalent bilinear system considering a constant effective period T*. Thus, the inelastic displacement demand is evaluated based on the elastic range and only updated by R. Figure 19 depicts an example of the procedure to obtain bilinear curves by different approaches. For instance, based on the pre-peak phase, as given in Figure 19a, Vy* is equal to the shear force obtained at each step of the pushover curve until the maximum force is achieved. Accordingly, the stiffness at each loading step is obtained by considering the area under the pushover curve and bilinear approximation. Once the system exceeds the peak base shear capacity, instead of the stiffness remaining constant (Figure 19b), the author proposes the use of constant yield strength equal to the maximum base shear strength in the post-peak, and to update the stiffness by using the equivalence of the energy (Figure 19c). In this way, stiffness degradation is taken into account. Indeed, the accuracy of the prediction by adopting adaptive bilinear curves improves considerably, and results are closer to the dynamic ones, as illustrated in Figure 13.
The new formulation for the calculation of the target displacement intends to take into account issues related to hysteretic behavior [66]. Within this framework, the proposed formulation is an improved version of the N2 method, where d y * is the displacement corresponding to the yielding point of the equivalent bilinear curve, while the coefficient a is the ductility demand (Table 4). Moreover, a coefficient b is introduced to take into account the dissipative capacity and strength degradation of the system. The new equation is applicable for systems with T* > TC and a coefficient c equal to or greater than 1. It is noticed that the new proposal provides a better prediction than the classical N2 method (Figure 13), but it is interesting to note that the new proposal underestimates slightly more than the adaptive N2 method.

5. Discussion

Based on the literature review carried out in the present paper, it is noticed that several aspects of PBD for masonry buildings have not yet been clarified. It is found that structural irregularities have various definitions given by different codes, and, therefore, there is not a systematic and uniform procedure for their characterization. In particular, for masonry buildings, a comprehensive description is needed in the design codes (Eurocode 8, NTC 2018, TEC 2019 and ASCE 7-16). Exceptionally, only a few research studies have been carried out to provide quantitative metrics to identify the irregularities for masonry buildings in elevation. Indeed, particular attention should be given to irregularities in elevation, since there is almost no such classification made for masonry buildings in the standards. Defining the correct irregularities plays a crucial role, because structural irregularities play an important role in the structural behavior and accuracy of the performance-based assessment procedure. Hence, NSPs have been improved so that the effects of irregularities on the response can be included. The proposed improvements are mainly limited to existing code formulations, namely, the N2, CSM or DCM methods, which were developed for regular frame systems. Some authors have intended to make some changes to the basic N2 method to improve its applicability to masonry buildings [66]. Indeed, there is still a research gap concerning the applicability of NSPs, in particular to irregular masonry buildings, and only a few works are available in the literature. This shows, to a great extent, that further studies are needed.

6. Conclusions

The present paper provides an overview of nonlinear static procedures for the seismic performance-based assessment and design of masonry buildings and, in particular, of irregular masonry buildings. It is observed that a great amount of work is devoted to the evaluation of the seismic vulnerability of regular buildings, regardless of construction type. It is not surprising that nonlinear static procedures have been developed for symmetric and regular buildings due to the fact that the design codes discourage irregularities in the load-bearing systems. The characterization of regularity is indeed straightforward for frame systems as provided by different seismic design codes, but such classifications may not always be applicable in the case of masonry buildings. The development of quantitative definitions for masonry buildings is needed, since the structural system also serves as an architectural component, and it can be characterized by geometrical complexity (dimensions and distribution of openings in masonry façades). Under this perspective, some researchers proposed quantitative indicators to characterize irregularities based on the geometry and alignment of the openings located in the load-bearing walls. These aspects are important to define the eccentricity at each floor level, which is not commonly taken into account. Considering the influence of the irregularity of building on seismic behavior, it is important to assess the reliability of the existing nonlinear static procedures for the seismic performance-based assessment/design of masonry buildings. Indeed, the reliability of the extended NSPs applied to irregular masonry buildings remains uncertain and requires further research. It is strongly believed that the seismic performance evaluation of an irregular masonry building supported with a systematic irregularity classification and reliable NSPs will ensure higher accuracy in the design and assessment of masonry buildings.

Author Contributions

Conceptualization, A.A., G.V. and P.B.L.; investigation, A.A.; writing—original draft preparation, A.A.; writing—review and editing, G.V. and P.B.L.; visualization, A.A.; supervision, G.V. and P.B.L.; project administration, G.V. and P.B.L.; funding acquisition, A.A., G.V. and P.B.L. All authors have read and agreed to the published version of the manuscript.

Funding

This research was funded by the Portuguese Foundation for Science and Technology FCT, grant number SFRH/BD/143949/2019 and PTDC/ECI-EGC/29010/2017.

Institutional Review Board Statement

Not applicable.

Informed Consent Statement

Not applicable.

Data Availability Statement

The data presented in this study are openly available in Universidade do Minho Repository, http://hdl.handle.net/1822/55845 (accessed on 13 February 2021). The data presented in this study are available in article [37] Lagomarsino, S.; Camilletti, D.; Cattari, S.; Marino, S. Seismic Assessment of Existing Irregular Masonry Buildings by Non-linear Static and Dynamic Analyses. Eurocode-Compliant Seism. Anal. Design of R/C Build. 2018, 46, 123–151, doi:10.1007/978-3-319-75741-4_5.

Acknowledgments

The first author acknowledges the financial support from the Portuguese Foundation for Science and Technology (FCT) through the Ph.D. Grant SFRH/BD/143949/2019. This work is financed by national funds through FCT, in the scope of the research project “Experimental and Numerical Pushover Analysis of Masonry Buildings” (PUMA) (PTDC/ECI-EGC/29010/2017).

Conflicts of Interest

The authors declare no conflict of interest. The funders had no role in the design of the study; in the collection, analyses, or interpretation of data; in the writing of the manuscript, or in the decision to publish the results.

Abbreviations

ADRSAcceleration–displacement response spectrum
CMCenter of mass
CQCComplete-Quadratic-Combination
CRCenter of rigidity
CSMCapacity spectrum method
DAPDisplacement-based adaptive pushover analysis
DCMDisplacement coefficient method
DLDamage limit
IDAIncremental dynamic analysis
IMIntensity measure
ISAIncremental static analysis
MDOFMulti-degree-of-freedom
MMPMulti-modal pushover analysis
MMPAModified modal pushover analysis
MPAModal pushover analysis
NLDNonlinear dynamic analysis
NSPNonlinear static procedures
PBDPerformance based design
PGAPeak ground acceleration
RSResponse spectrum
SDOFSingle-degree-of-freedom
SRSSSquare-root-of-sum-of-square

Appendix A

Table A1. Horizontal irregularity indexes are given by different design codes. Figures from [72].
Irregularity TypeEC 8 [11]TEC 2019 [33]ASCE/SEI 7-16 [72]NTC 2018 [71]
TorsionalN.A>1.2>1.2
>1.4 (extreme)
N.A
Buildings 11 00147 i001 Δ m a x Δ a v g [72]
Setback>0.05>0.2>0.15>0.05
Buildings 11 00147 i002[72]
X P X ,   Y P Y ; A s e t A t     EC 8 ,   NTC   2018
Diaphragm discontinuityN.A> 1 3 >0.5N.A
Buildings 11 00147 i003or Buildings 11 00147 i004[72]
A o p e n X * Y
Out-of-plane offsetN.AN.AQLNot allowed
Buildings 11 00147 i005[72]
Nonparallel systemN.AN.AQLN.A
Buildings 11 00147 i006[72]
Plan shape regularity< 4.0N.AN.A< 4.0
L m a x L m i n
where Lmax is larger, Lmin is smaller dimensions of the plan
N.A: not available; no definition is mentioned. QL: qualitative.
Table A2. Vertical irregularity indexes given by different design codes. Figures from [72].
Irregularity TypeEC 8 [11]TEC 2019 [33]ASCE/SEI 7-16 [72]NTC 2018 [71]
Soft story (lateral stiffness)QL>2.0 *a < 0.7 or b < 0.8 3
Extreme:
a < 0.6 or b < 0.7 3
Reduction:
a < 30 ϕ%
Increase:
a < 10 ϕ%
Buildings 11 00147 i007 Buildings 11 00147 i008
K i K i + 1 = a             o r           K i ( K i + 1 + K i + 2 + K i + 3 ) = b
* TEC 2019 considers inter-story drift Δd as a parameter instead of Str.
Δ d i Δ d i + 1 or Δ d i Δ d i 1
ϕ NTC 2018 consider reduction or increase from one level to its above.
( M i   M i + 1 ) M i = a
Weak story (lateral strength)<20 ϕ%<0.80 *<0.8
<0.65 (extreme)
N.A
Buildings 11 00147 i009
* TEC 2019 considers effective shear area Ae as a parameter instead of Str.
ϕ Eurocode 8 considers the difference in shear area between two adjacent stories, specifically defined for masonry.
( A i   A i + 1 ) A i
Weight (Mass)<20 *%N.A>1.5<25%
Buildings 11 00147 i010
* Eurocode 8 and NTC 2018 consider the difference in mass between two adjacent stories.
( M i   M i + 1 ) M i
Geometrica ≤ 0.20
b ≤ 0.20
c ≤ 0.50
d1 ≤ 0.30
d2 ≤ 0.10
N.A>1.3<30% at the first level
<10% at other levels
ASCE/SEI 7-16 (Figure from [72])
Buildings 11 00147 i011
Eurocode 8 (Figures given below from [11])
Buildings 11 00147 i012
a = ( L 1 L 2 ) L 1
Buildings 11 00147 i013
b = ( L 3 L 1 ) L
Buildings 11 00147 i014
c = ( L 3 L 1 ) L
Buildings 11 00147 i015
d 1 = L L 2 L
d 2 = ( L 1 L 2 ) L
NTC 2018 [71]
Setbacks are considered in terms of the plan area. The difference between the levels should be;
In-plane discontinuity of lateral force resisting elements (figures from [72])QLQL>1.0QL
Buildings 11 00147 i016
Buildings 11 00147 i017 Buildings 11 00147 i018
Perpendicular walls, walls with offset
N.A: not available; no definition is mentioned. QL: qualitative.

Appendix B. Nomenclature

Symbols in Figure 3 and Table 1Symbols in Figure 4 and Table 1
DInter-story height h ¯ j Regularized opening height at j-th story
GCentroid X ¯ G , i Regularized horizontal alignment at i-th vertical alignment
HaHeight of the higher opening X ¯ G , i + 1 Subsequent regularized horizontal alignment at i-th vertical alignment
HbHeight of the lower opening X ¯ G , i 1 Preceding regularized horizontal alignment at i-th vertical alignment
HmaxMaximum height of the opening X G , i j Centroid ordinate of an opening at i-th level j-th opening
HminMinimum height of the opening Y ¯ G , j Regularized vertical alignment at j-th story
iIrregularity index b ¯ i Regularized opening width at i-th vertical alignment
LmaxMaximum opening lengthbijOpening width
LminMinimum opening lengthHTotal height of the wall
LwOverall length of the wallhijOpening height
tfThickness of the slabLTotal length of the wall
XGDistance of the centroid GYG,ijCentroid ordinate of an opening
Δ0Distance between the upper edges of the two openingsΔHjInter-story height
ΔHaDistance between upper opening edge
ΔHbDistance between lower opening edge
ΔLTotal irregularity, distances between right and left opening edges
ΔHTotal irregularity, difference between maximum and minimum height
NminMinimum number of openings per story
NmaxMaximum number of openings per story

References

  1. Battaglia, L.; Ferreira, T.M.; Lourenço, P.B. Seismic fragility assessment of masonry building aggregates: A case study in the old city Centre of Seixal, Portugal. Earthq. Eng. Struct. Dyn. 2021, 50, 1358–1377. [Google Scholar] [CrossRef]
  2. Valente, M.; Milani, G.; Grande, E.; Formisano, A. Historical masonry building aggregates: Advanced numerical insight for an effective seismic assessment on two row housing compounds. Eng. Struct. 2019, 190, 360–379. [Google Scholar] [CrossRef]
  3. Formisano, A.; Florio, G.; Landolfo, R.; Mazzolani, F.M. Numerical calibration of an easy method for seismic behaviour assessment on large scale of masonry building aggregates. Adv. Eng. Softw. 2015, 80, 116–138. [Google Scholar] [CrossRef] [Green Version]
  4. Lourenço, P.; Marques, R. Design of masonry structures (General rules): Highlights of the new European masonry code. In Brick and Block Masonry-From Historical to Sustainable Masonry, Proceedings of the 17th International Brick/Block Masonry Conference, Kraków, Poland, 5–8 July 2020; CRC Press: Boca Raton, FL, USA, 2020; p. 3. [Google Scholar]
  5. Priestley, M.J.N.; Calvi, G.M.; Kowalsky, M.J. Displacement-Based Seismic Design of Structures; IUSS Press: Pavia, Italy, 2007; ISBN 978-88-6198-0006. [Google Scholar]
  6. Fajfar, P. A Nonlinear Analysis Method for Performance-Based Seismic Design. Earthq. Spectra 2000, 16, 573–592. [Google Scholar] [CrossRef]
  7. Fajfar, P.; Marušić, D.; Perus, I. Torsional effects in the pushover-based seismic analysis of buildings. J. Earthq. Eng. 2005, 9, 831–854. [Google Scholar] [CrossRef]
  8. Kreslin, M.; Fajfar, P. The extended N2 method considering higher mode effects in both plan and elevation. Bull. Earthq. Eng. 2012, 10, 695–715. [Google Scholar] [CrossRef]
  9. Silva, V.; Crowley, H.; Pinho, R.; Varum, H. Extending displacement-based earthquake loss assessment (DBELA) for the computation of fragility curves. Eng. Struct. 2013, 56, 343–356. [Google Scholar] [CrossRef] [Green Version]
  10. Eurocode 6. Eurocode 6–Design of Masonry Structures–Part 1-1: General Rules for Reinforced and Unreinforced Masonry Structures; European Committee for Standardization: Brussels, Belgium, 2018. [Google Scholar]
  11. Eurocode 8. EN 1998-1: Design of Structures for Earthquake Resistance–Part 1: General Rules, Seismic Actions and Rules for Buildings; European Committee for Standardization: Brussels, Belgium, 2004. [Google Scholar]
  12. De Stefano, M.; Pintucchi, B. A review of research on seismic behaviour of irregular building structures since 2002. Bull. Earthq. Eng. 2007, 6, 285–308. [Google Scholar] [CrossRef] [Green Version]
  13. D’Altri, A.; Sarhosis, V.; Milani, G.; Rots, J.; Cattari, S.; Lagomarsino, S.; Sacco, E.; Tralli, A.; Castellazzi, G.; De Miranda, S. A Review of Numerical Models for Masonry Structures; Numerical Modeling of Masonry and Historical Structures; Woodhead Publishing Series in Civil and Structural Engineering; Woodhead Publishing: Cambridge, UK, 2019; pp. 3–53. ISBN 9780081024393. [Google Scholar]
  14. Aşıkoğlu, A.; Vasconcelos, G.; Lourenço, P.B.; Pantò, B. Pushover analysis of unreinforced irregular masonry buildings: Lessons from different modeling approaches. Eng. Struct. 2020, 218, 110830. [Google Scholar] [CrossRef]
  15. Silva, L.C.; Lourenço, P.B.; Milani, G. Numerical homogenization-based seismic assessment of an English-bond masonry prototype: Structural level application. Earthq. Eng. Struct. Dyn. 2020, 49, 841–862. [Google Scholar] [CrossRef]
  16. Lourenço, P.B.; Silva, L.C. computational applications in masonry structures: From the meso-scale to the super-large/super-complex. Int. J. Multiscale Comput. Eng. 2020, 18, 1–30. [Google Scholar] [CrossRef]
  17. Abbati, S.D.; D’Altri, A.M.; Ottonelli, D.; Castellazzi, G.; Cattari, S.; de Miranda, S.; Lagomarsino, S. Seismic assessment of interacting structural units in complex historic masonry constructions by nonlinear static analyses. Comput. Struct. 2019, 213, 51–71. [Google Scholar] [CrossRef]
  18. Shehu, R. Implementation of Pushover Analysis for Seismic Assessment of Masonry Towers: Issues and Practical Recommendations. Buildings 2021, 11, 71. [Google Scholar] [CrossRef]
  19. Clementi, F. Failure Analysis of Apennine Masonry Churches Severely Damaged during the 2016 Central Italy Seismic Sequence. Buildings 2021, 11, 58. [Google Scholar] [CrossRef]
  20. Saloustros, S.; Pelà, L.; Roca, P. Nonlinear Numerical Modeling of Complex Masonry Heritage Structures Considering History-Related Phenomena in Staged Construction Analysis and Material Uncertainty in Seismic Assessment. J. Perform. Constr. Facil. 2020, 34, 04020096. [Google Scholar] [CrossRef]
  21. Croce, P.; Landi, F.; Formichi, P. Probabilistic Seismic Assessment of Existing Masonry Buildings. Buildings 2019, 9, 237. [Google Scholar] [CrossRef] [Green Version]
  22. Rodrigues, H.; Šipoš, T.K. Masonry Buildings: Research and Practice. Buildings 2019, 9, 162. [Google Scholar] [CrossRef] [Green Version]
  23. Simões, A. Evaluation of the Seismic Vulnerability of the Unreinforced Masonry Buildings Constructed in the Transition between the 19 th and 20 th Centuries in Lisbon, Portugal. Ph.D. Thesis, Universidade de Lisboa Instituto Superior Tecnico, Lisbon, Portugal, 2018. [Google Scholar]
  24. Cundari, G.; Milani, G.; Failla, G. Seismic vulnerability evaluation of historical masonry churches: Proposal for a general and comprehensive numerical approach to cross-check results. Eng. Fail. Anal. 2017, 82, 208–228. [Google Scholar] [CrossRef]
  25. Tiberti, S.; Acito, M.; Milani, G. Comprehensive FE numerical insight into Finale Emilia Castle behavior under 2012 Emilia Romagna seismic sequence: Damage causes and seismic vulnerability mitigation hypothesis. Eng. Struct. 2016, 117, 397–421. [Google Scholar] [CrossRef]
  26. Parisse, F.; Cattari, S.; Marques, R.; Lourenço, P.; Magenes, G.; Beyer, K.; Calderoni, B.; Camata, G.; Cordasco, E.; Erberik, M.; et al. Benchmarking the seismic assessment of unreinforced masonry buildings from a blind prediction test. Structures 2021, 31, 982–1005. [Google Scholar] [CrossRef]
  27. Asteris, P.; Chronopoulos, M.; Chrysostomou, C.; Varum, H.; Plevris, V.; Kyriakides, N.; Silva, V. Seismic vulnerability assessment of historical masonry structural systems. Eng. Struct. 2014, 62–63, 118–134. [Google Scholar] [CrossRef]
  28. Parisi, F.; Augenti, N. Seismic capacity of irregular unreinforced masonry walls with openings. Earthq. Eng. Struct. Dyn. 2013, 42, 101–121. [Google Scholar] [CrossRef]
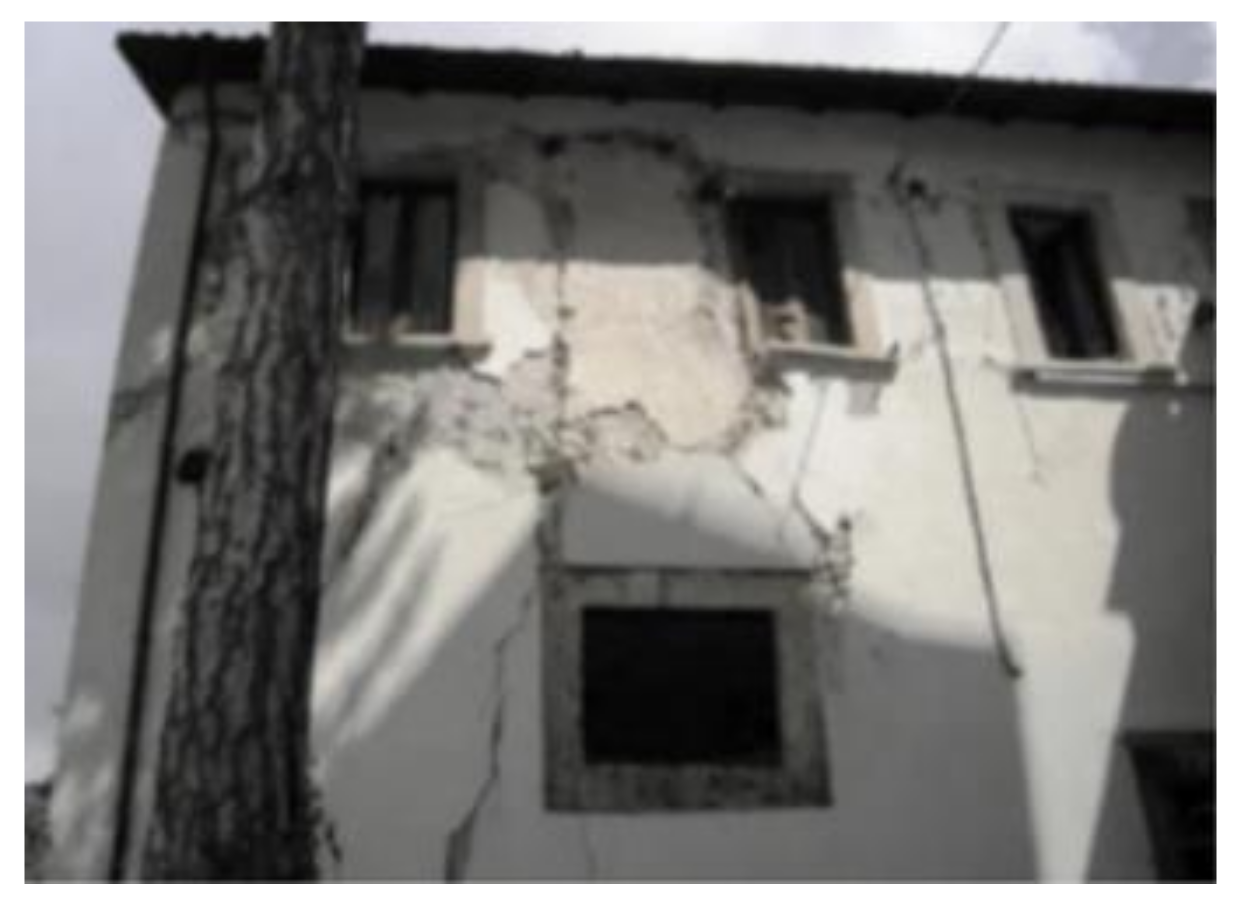
  29. Augenti, N.; Parisi, F. Learning from Construction Failures due to the 2009 L’Aquila, Italy, Earthquake. J. Perform. Constr. Facil. 2010, 24, 536–555. [Google Scholar] [CrossRef]
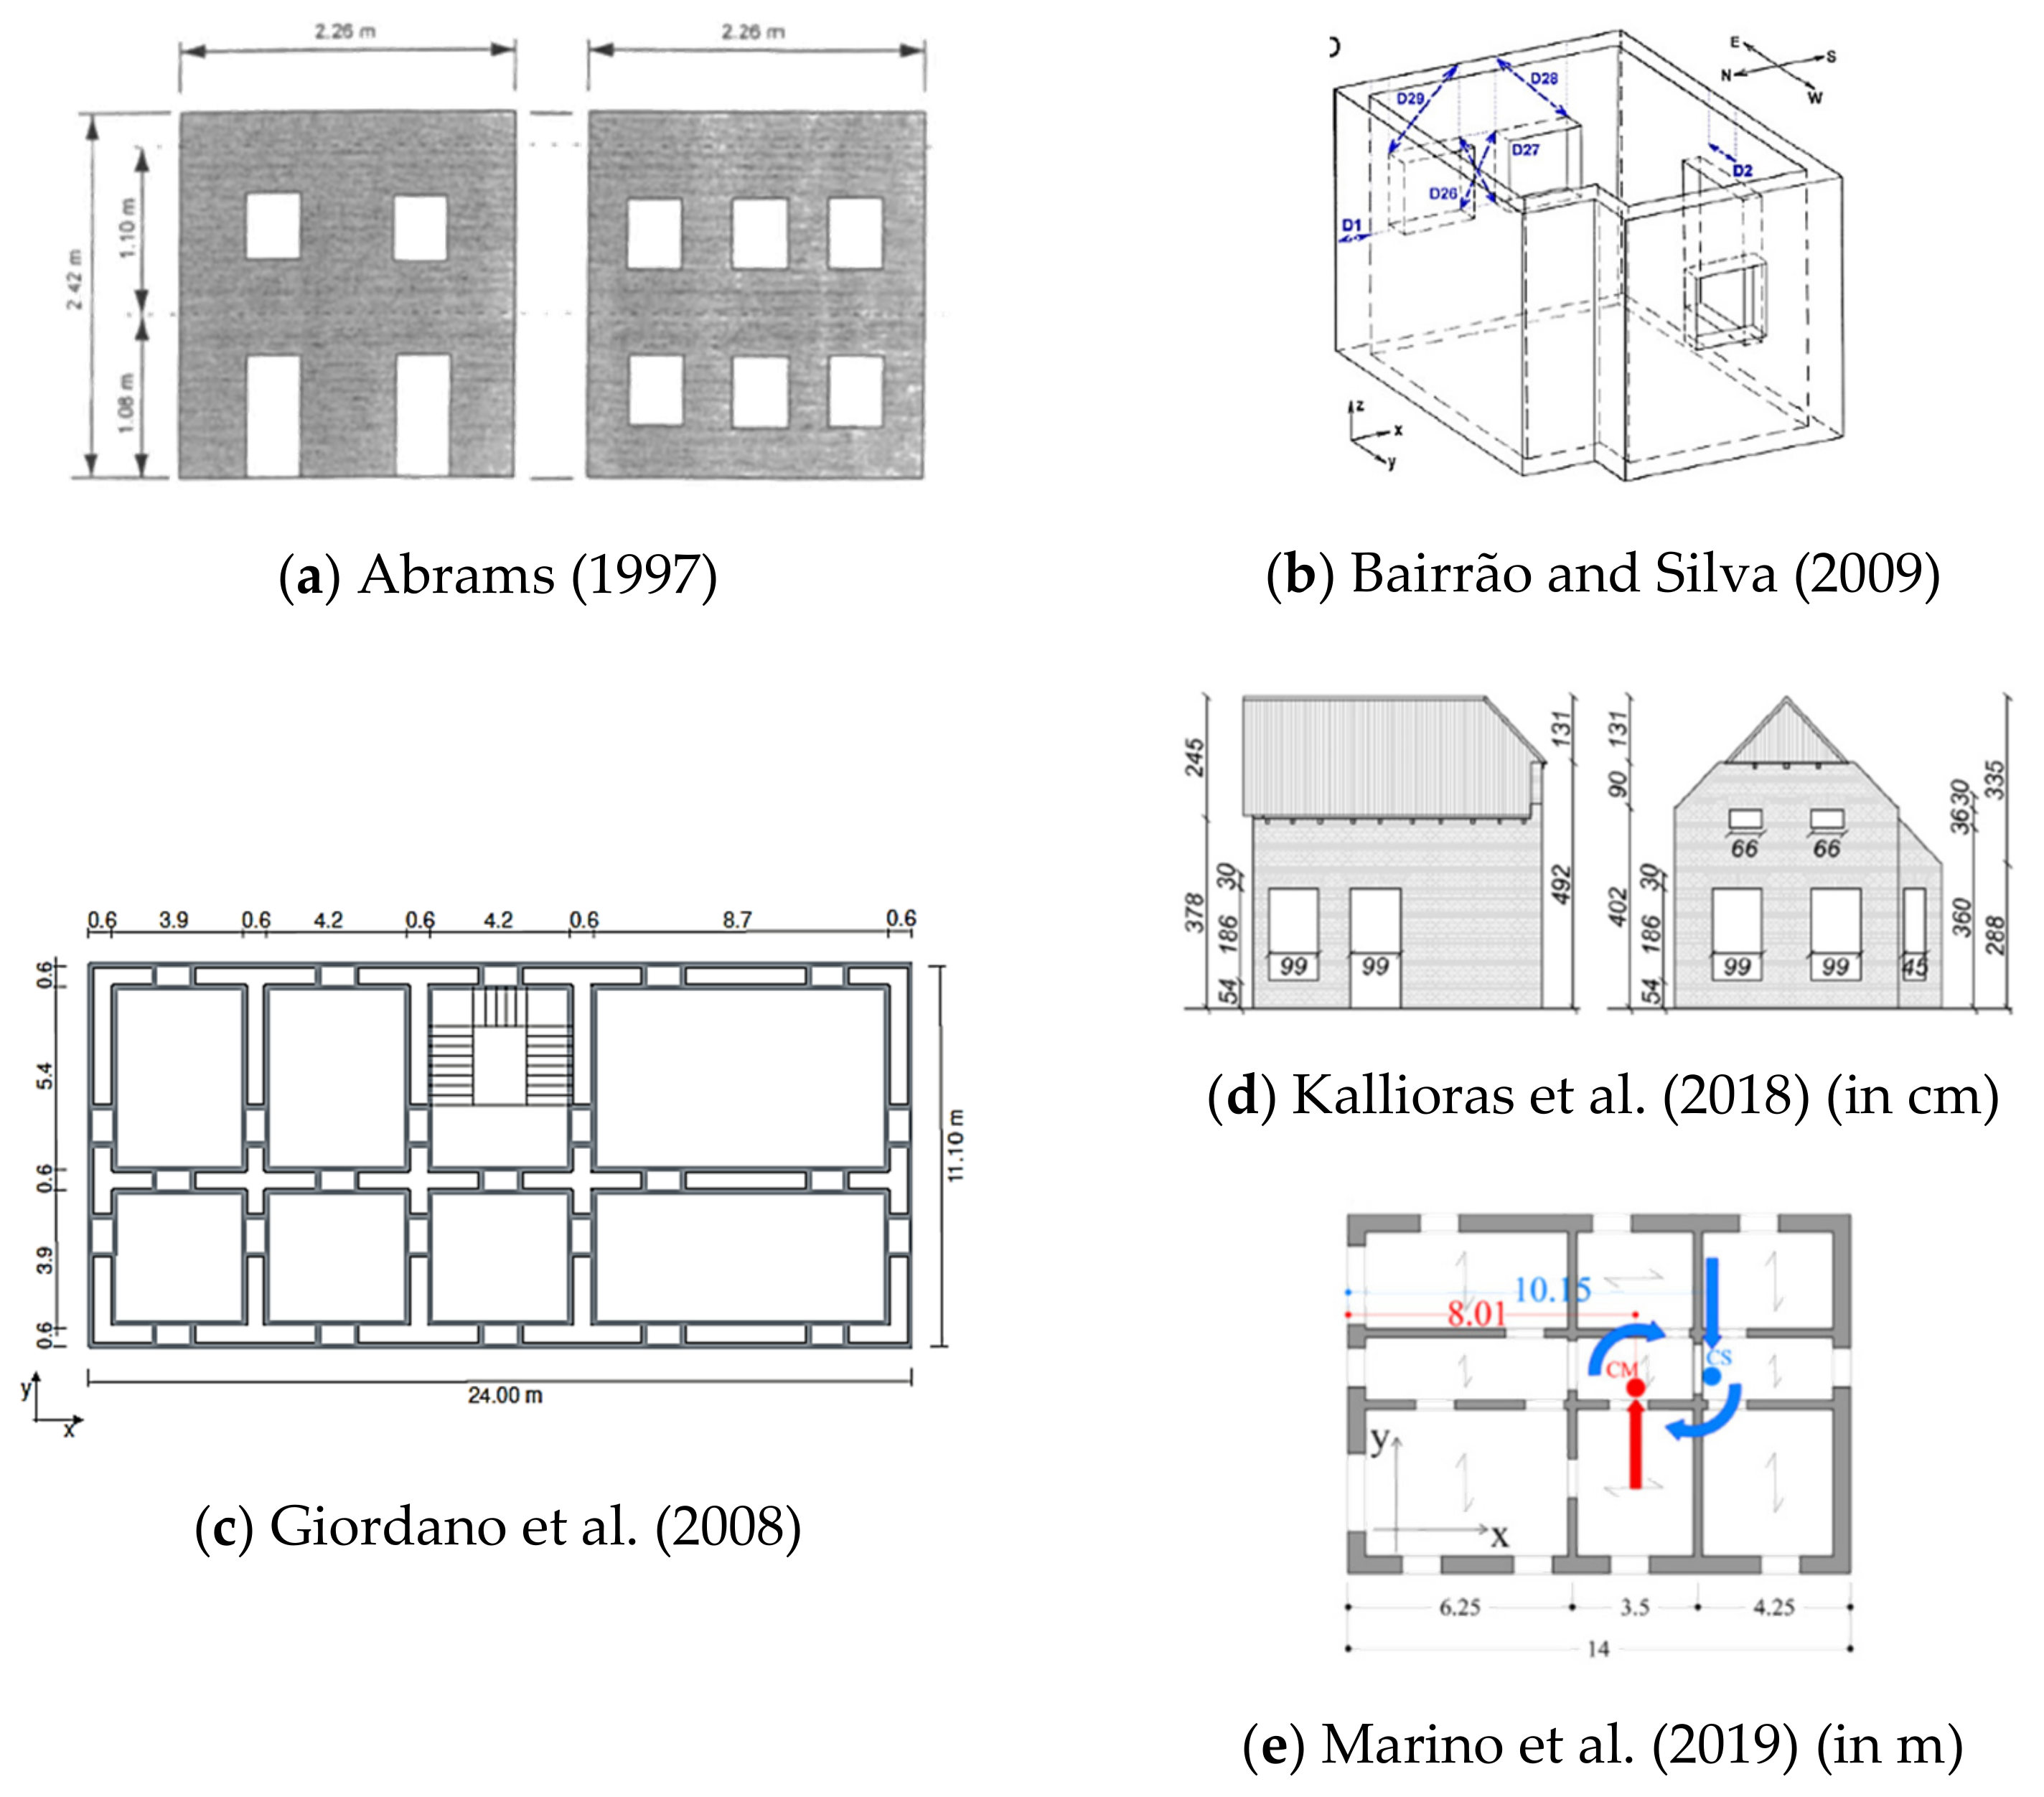
  30. Giordano, A.; Guadagnuolo, M.; Faella, G. Pushover analysis of plan irregular masonry buildings. In Proceedings of the 14th World Conference on Earthquake Engineering, Beijing, China, 12–17 October 2008. [Google Scholar]
  31. Drysdale, R.G.; Hamid, A.A. Masonry Structures Behavior and Design, 3rd ed.; The Masonry Society: Englewood Cliffs, NJ, USA, 2008. [Google Scholar]
  32. De Stefano, M.; Mariani, V. Pushover analysis for plan irregular building structures. In Perspectives on European Earthquake Engineering and Seismology Geotechnical, Geological and Earthquake Engineering; Springer: Berlin/Heidelberg, Germany, 2014; pp. 8–11. [Google Scholar]
  33. TEC. Turkish Earthquake Code: Specifications for Building Design under Earthquake Effects; Official Newspaper No 30364; TEC: Ankara, Turkey, 2019. [Google Scholar]
  34. Abrams, D.P. Response of Unreinforced Masonry Buildings. J. Earthq. Eng. 1997, 1, 257–273. [Google Scholar] [CrossRef]
  35. Bairrão, R.; Silva, M.F. Shaking table tests of two different reinforcement techniques using polymeric grids on an asymmetric limestone full-scaled structure. Eng. Struct. 2009, 31, 1321–1330. [Google Scholar] [CrossRef]
  36. Kallioras, S.; Guerrini, G.; Tomassetti, U.; Marchesi, B.; Penna, A.; Graziotti, F.; Magenes, G. Experimental seismic performance of a full-scale unreinforced clay-masonry building with flexible timber diaphragms. Eng. Struct. 2018, 161, 231–249. [Google Scholar] [CrossRef]
  37. Lagomarsino, S.; Camilletti, D.; Cattari, S.; Marino, S. Seismic Assessment of Existing Irregular Masonry Buildings by Nonlinear Static and Dynamic Analyses. Eurocode Compliant Seism. Anal. Des. R/C Build. 2018, 46, 123–151. [Google Scholar] [CrossRef]
  38. Marino, S.; Cattari, S.; Lagomarsino, S. Are the nonlinear static procedures feasible for the seismic assessment of irregular existing masonry buildings? Eng. Struct. 2019, 200, 109700. [Google Scholar] [CrossRef]
  39. Berti, M.; Salvatori, L.; Orlando, M.; Spinelli, P. Unreinforced masonry walls with irregular opening layouts: Reliability of equivalent-frame modelling for seismic vulnerability assessment. Bull. Earthq. Eng. 2017, 15, 1213–1239. [Google Scholar] [CrossRef]
  40. Grünthal, G. European Macroseismic Scale; European Seismological Commission: Luxembourg, 1998. [Google Scholar]
  41. SEAOC. Performance Based Seismic Engineering of Buildings; Vision 2000; Structural Engineers Association of California: Sacramento, CA, USA, 1995. [Google Scholar]
  42. Bilgin, H.; Hysenlliu, M. Comparison of near and far-fault ground motion effects on low and mid-rise masonry buildings. J. Build. Eng. 2020, 30, 101248. [Google Scholar] [CrossRef]
  43. FEMA 440. Improvement of Nonlinear Static Seismic Analysis Procedures; Department of Homeland Security Federal Emergency Management Agency: Washington, DC, USA, 2005. [Google Scholar]
  44. Fajfar, P.; Fischinger, M. N2—A Method for Nonlinear seismic analysis of regular buildings. In Proceedings of the Ninth World Conference Earthquake Engineering, Tokyo, Japan, 2–6 August 1988. [Google Scholar]
  45. Freeman, S.; Nicoletti, J.; Tyrell, J. Evaluation of existing buildings for seismic risk—A case study of Puget Sound Naval Shipyard. In Proceedings of the U.S. National Conference on Earthquake, Bremerton, WA, USA, 18–20 June 1975; pp. 113–122. [Google Scholar]
  46. FEMA 356. Prestandard and Commentary for the Seismic Rehabilitation of Buildings; Department of Homeland Security Federal Emergency Management Agency: Washington, DC, USA, 2000. [Google Scholar]
  47. Calvi, G.M. A Displacement-Based Approach for Vulnerability Evaluation of Classes of Buildings. J. Earthq. Eng. 1999, 3, 411–438. [Google Scholar] [CrossRef]
  48. Lagomarsino, S.; Cattari, S. PERPETUATE guidelines for seismic performance-based assessment of cultural heritage masonry structures. Bull. Earthq. Eng. 2015, 13, 13–47. [Google Scholar] [CrossRef]
  49. Paret, T.; Sasaki, K.; Elibeck, D.; Freeman, S. Approximate inelastic procedures to identify failure mechanism from higher modes effects. In Proceedings of the 11th World Conference Earthquake Engineering, Acapulco, Mexico, 23–28 June 1996. [Google Scholar]
  50. Chopra, A.K.; Goel, R.K. A modal pushover analysis procedure for estimating seismic demands for buildings. Earthq. Eng. Struct. Dyn. 2002, 31, 561–582. [Google Scholar] [CrossRef] [Green Version]
  51. Chopra, A.K.; Goel, R.K. A modal pushover analysis procedure to estimate seismic demands for unsymmetric-plan buildings. Earthq. Eng. Struct. Dyn. 2004, 33, 903–927. [Google Scholar] [CrossRef] [Green Version]
  52. Fajfar, P.; Kilar, V.; Marusic, D.; Perus, I.; Magliulo, G. The extension of the N2 method to asymmetric buildings. In Proceedings of the 4th European Workshop on the Seismic Behaviour of Irregular and Complex Structures, Thessaloniki, Greece, 26–27 August 2005. [Google Scholar]
  53. Antoniou, S. Advanced Inelastic Static Analysis for Seismic Assessment of Structures. PhD. Thesis, Imperial College London (University of London), London, UK, 2002. [Google Scholar]
  54. Papanikolaou, V.K.; Elnashai, A.S. Evaluation of conventional and adaptive pushover analysis I: Methodology. J. Earthq. Eng. 2005, 9, 923–941. [Google Scholar] [CrossRef]
  55. Minghini, F.; Bertolesi, E.; Del Grosso, A.; Milani, G.; Tralli, A. Modal pushover and response history analyses of a masonry chimney before and after shortening. Eng. Struct. 2016, 110, 307–324. [Google Scholar] [CrossRef]
  56. Minghini, F.; Milani, G.; Tralli, A. Seismic risk assessment of a 50m high masonry chimney using advanced analysis techniques. Eng. Struct. 2014, 69, 255–270. [Google Scholar] [CrossRef]
  57. Peña, F.; Lourenço, P.B.; Mendes, N.; Oliveira, D.V. Numerical models for the seismic assessment of an old masonry tower. Eng. Struct. 2010, 32, 1466–1478. [Google Scholar] [CrossRef] [Green Version]
  58. Ferracuti, B.; Pinho, R.; Savoia, M.; Francia, R. Verification of displacement-based adaptive pushover through multi-ground motion incremental dynamic analyses. Eng. Struct. 2009, 31, 1789–1799. [Google Scholar] [CrossRef]
  59. Silva, V.; Crowley, H.; Varum, H.; Pinho, R.; Sousa, L. Investigation of the characteristics of Portuguese regular moment-frame RC buildings and development of a vulnerability model. Bull. Earthq. Eng. 2015, 13, 1455–1490. [Google Scholar] [CrossRef]
  60. Antoniou, S.; Rovithakis, A.; Pinho, R. Development and Verification of a Fully Adaptive Pushover Procedure. In Proceedings of the 12th European Conference Earthquake Engineering, London, UK, 9–13 September 2002. [Google Scholar]
  61. Yi, T.; Moon, F.L.; Leon, R.T.; Kahn, L.F. Lateral Load Tests on a Two-Story Unreinforced Masonry Building. J. Struct. Eng. 2006, 132, 643–652. [Google Scholar] [CrossRef]
  62. Galasco, A.; Lagomarsino, S.; Penna, A. On the use of pushover analysis for existing masonry buildings. In Proceedings of the 1st European Conference on Earthquake and Seismology, Geneva, Switzerland, 3–8 September 2006. [Google Scholar]
  63. Caliò, I.; Cannizzaro, F.; D’Amore, E.; Marletta, M.; Pantò, B. A new discrete-element approach for the assessment of the seismic resistance of composite reinforced concrete-masonry buildings. Fourth Huntsville Gamma Ray Burst Symp. 2008, 1020, 832–839. [Google Scholar] [CrossRef]
  64. Azizi, H. Analytical and Empirical Seismic Fragility Analysis of Irregular URM Buildings with Box Behavior. Ph.D. Thesis, University of Minho, Guimarães, Portugal, 2018. [Google Scholar]
  65. Lagomarsino, S.; Penna, A.; Galasco, A.; Cattari, S. TREMURI Program: Seismic Analyses of 3D Masonry Buildings, Release 2.0; University of Genoa: Genoa, Italy, 2012. [Google Scholar]
  66. Marino, S. Nonlinear Static Procedures for the Seismic Assessment of Irregular URM Buildings. Ph.D. Thesis, University of Genoa, Genoa, Italy, 2018. [Google Scholar]
  67. Kallioras, S.; Correia, A.A.; Graziotti, F.; Penna, A.; Magenes, G. Collapse shake-table testing of a clay-URM building with chimneys. Bull. Earthq. Eng. 2020, 18, 1009–1048. [Google Scholar] [CrossRef]
  68. Graziotti, F.; Tomassetti, U.; Kallioras, S.; Penna, A.; Magenes, G. Shaking table test on a full scale URM cavity wall building. Bull. Earthq. Eng. 2017, 15, 5329–5364. [Google Scholar] [CrossRef]
  69. Graziotti, F.; Penna, A.; Bossi, E.; Magenes, G. Evaluation of displacement demand for unreinforced masonry buildings by equivalent SDOF systems. In Proceedings of the 9th International Conference on Structural Dynamics, EURODYN 2014, Porto, Portugal, 30 June–2 July 2014; pp. 365–372. [Google Scholar]
  70. Guerrini, G.; Graziotti, F.; Penna, A.; Magenes, G. Improved evaluation of inelastic displacement demands for short-period masonry structures. Earthq. Eng. Struct. Dyn. 2017, 46, 1411–1430. [Google Scholar] [CrossRef]
  71. NTC. Norme Tecniche per le Costruzioni; DM 17/1/2018; Gazzetta Ufficiale della Repubblica Italiana n. 42 del 20 febbraio 2018; NTC: Roma, Italy, 2018. [Google Scholar]
  72. ASCE/SEI 7-16. Minimum Design Loads and Associated Criteria for Buildings and Other Structures; American Society of Civil Engineers: Reston, VA, USA, 2017. [Google Scholar]
Figure 1. Damage concentrated at the irregularities on masonry buildings [28].
Buildings 11 00147 g001
Figure 2. Structural layouts described as irregular by different researchers, (a) Abrams (1997) [34], (b) Bairrão and Silva (2009) [35], (c) Giordano et al. (2008) [30], (d) Kallioras et al. (2018) [36], (e) Marino et al. (2019) [38].
Buildings 11 00147 g002
Figure 3. Classification of wall irregularities according to Parisi and Augenti (2013) [28]: (a) horizontal, (b) vertical, (c) offset and (d) variable opening number irregularity (figures adapted from [28]).
Buildings 11 00147 g003
Figure 4. Types of irregularities given in Berti et al. (2017) [39]: (a) horizontal misalignment, (b) vertical misalignment, (c) irregularity in width and (d) irregularity in height (figures adapted from [39]).
Buildings 11 00147 g004aBuildings 11 00147 g004b
Figure 5. Schematic representation of nonlinear static procedures and performance-based assessment (adapted from [43]).
Buildings 11 00147 g005
Figure 6. Classification of nonlinear static procedures.
Buildings 11 00147 g006
Figure 7. Main stages of classical nonlinear static procedures (NSPs).
Buildings 11 00147 g007
Figure 8. Schematic representation of the Displacement Coefficient Method procedure [43].
Buildings 11 00147 g008
Figure 9. Schematic representation of the Capacity Spectrum Method [43].
Buildings 11 00147 g009aBuildings 11 00147 g009b
Figure 10. Graphical representation of N2 method and estimation of displacement demand for (a) low- and (b) high-period structures. Adapted from [6].
Buildings 11 00147 g010
Figure 11. Flow chart of the adaptive pushover method adapted from [54].
Buildings 11 00147 g011
Figure 12. Geometric properties of models (in meters) [38].
Buildings 11 00147 g012
Figure 13. Comparison of the different procedures in terms of IMst/IMdyn ratio found for DL4 [38].
Buildings 11 00147 g013
Figure 14. Plan configurations and 3D views of models studied by [64]: (a) COM building, (b) CLM building and (c) ACM building.
Buildings 11 00147 g014
Figure 15. First approach, absolute roof displacements at the highest seismic load in X direction obtained from different methods: (a) COM (0.35 × g), (b) CLM (0.30 × g) and (c) ACM (0.35 × g) [64].
Buildings 11 00147 g015
Figure 16. The first approach, inter-story drifts at the highest seismic load in X direction obtained from different methods: (a) COM, (b) CLM and (c) ACM. [64].
Buildings 11 00147 g016
Figure 17. The second approach, absolute roof displacements at the highest seismic load in X direction obtained from different methods for COM building (0.35 × g) [64].
Buildings 11 00147 g017
Figure 18. The second approach, inter-story drifts at the highest seismic load in X direction obtained from different methods for COM building (0.35 × g): (a) stiff side and (b) flexible side. Correction factors are given for in-plan (upper number) and in-elevation (lower number) irregularities [64].
Buildings 11 00147 g018
Figure 19. Examples of equivalent bilinear adapted from [66]: in red, the equivalent bilinear as proposed in NTC 2018 [71]; in grey, proposed adaptive bilinear; (a) before the peak; (b) after the peak; (c) post-peak phase; final proposal for the equivalent bilinear.
Buildings 11 00147 g019
Table 1. Irregularities described for masonry buildings by different authors (nomenclature for symbols is given in Appendix B).
DefinitionIndex
AuthorsParisi and Augenti (2013) [28]1—Horizontal Irregularity i H = Δ H 2 H m e d = H m a x H m i n H m a x + H m i n = Δ H a + Δ H b H m a x + H m i n
The openings have different heights at the same story while equal lengths among the stories.
2—Vertical Irregularity i V = Δ L 2 L m e d = L m a x L m i n L m a x + L m i n = Δ L r + Δ L l L m a x + L m i n
The openings have the same height at the same story while different lengths among the stories.
3—Offset Irregularity i o = Δ o D t f H b
The wall has horizontal and/or vertical offsets between openings of equal or different sizes.
4—Variable openings number irregularity i N =   1 N m i n N m a x ; i D = 1 2 x G L w
The wall has a different number of openings per story.
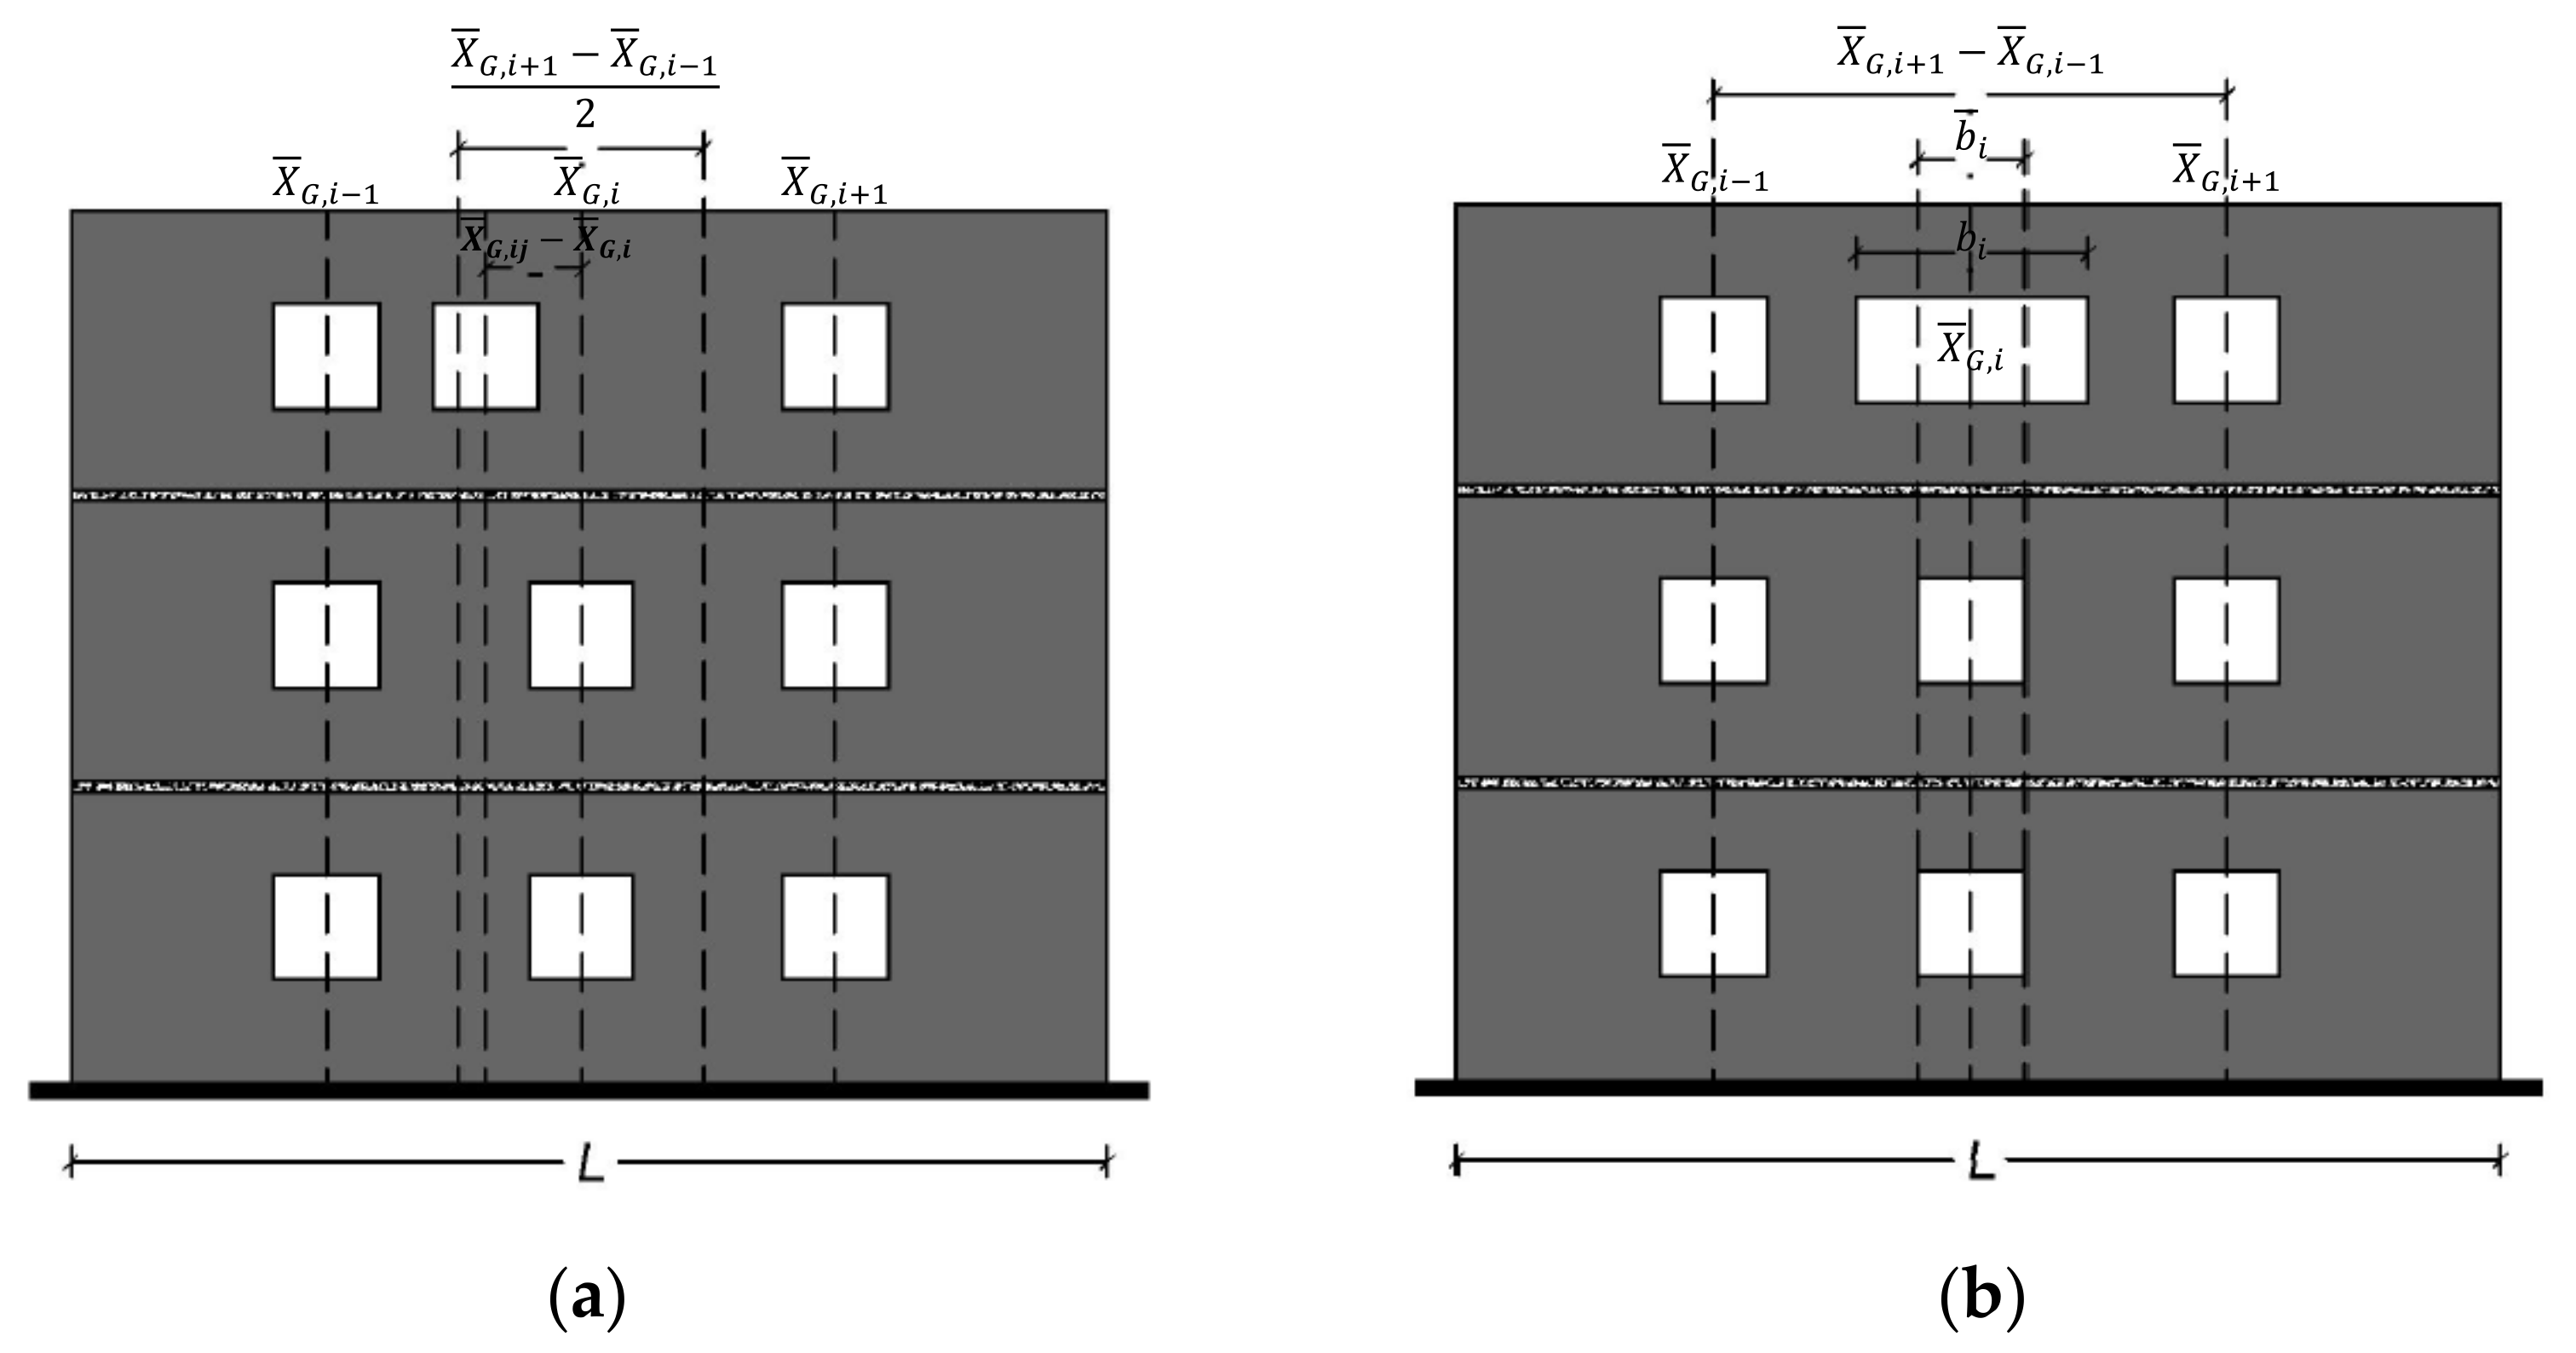
Berti et al. (2017) [39]1—Horizontal misalignment I X , i j = 2 X G , i j X ¯ G , i X ¯ G , i + 1 X ¯ G , i 1
The centroid abscissa of an opening XG,ij differs from the vertical alignment of the i-th vertical opening array XG,i.
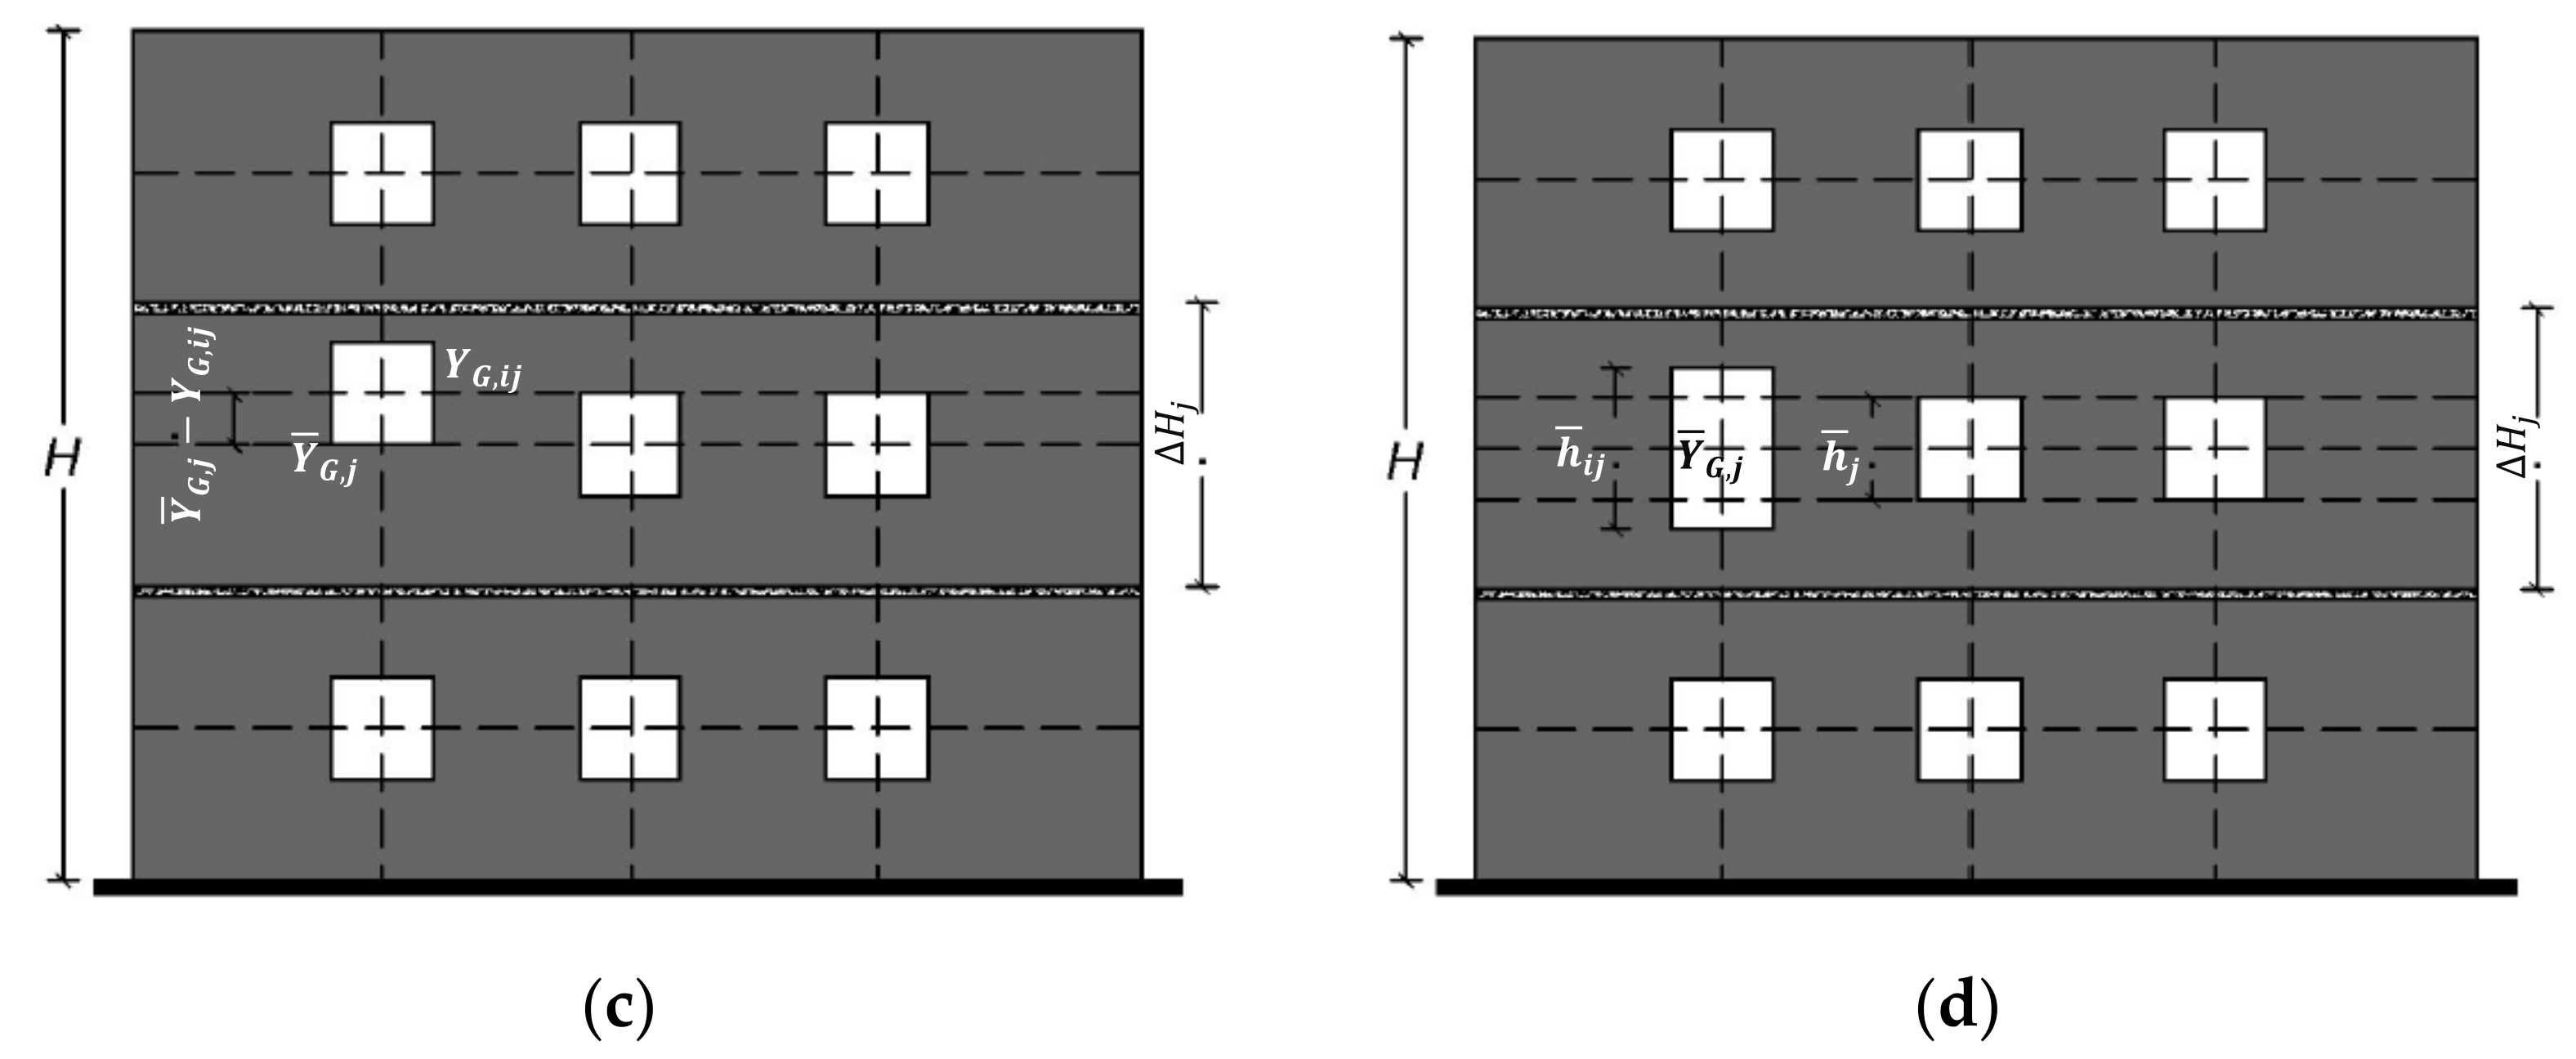
2—Vertical misalignment I Y , i j = Y G , i j Y ¯ G , i Δ H j
The centroid ordinate of an opening YG,ij differs from the horizontal alignment of the j-th story YG,j
3—Irregularity in width I W , i j = b i j b ¯ i X ¯ G , i + 1 X ¯ G , i 1
The opening width bij differs from the average one of the i-th vertical opening alignment bi.
4—Irregularity in height I H , i j = h i j h ¯ j Δ H j
The opening height hij differs from the average one in the j-th story hj.
5—Global index I = I ˜ I X , i j ,   I Y , i j ,   I W , i j ,   I H , i j
Global irregularity measure in which the combination of irregularity indexes is obtained.
Table 2. Values suggested for coefficients in Equation (1) [46].
Coef.Number of StoriesShear Buildings 2Other Buildings
Triangular Load PatternUniform Load PatternAny Load Pattern
C0 111.001.001.00
21.201.151.20
31.201.201.30
51.301.201.40
10+1.301.201.50
C1 C 1 = 1.0                                                       f o r           T e f f T s 1.0 + R 1 T s T e f f R                             f o r           T e f f < T s  
where Ts is the characteristic period of the response spectrum
However, it should be less than
C 1 =           1.5                   f o r       T e f f < 0.1   s 1.0                   f o r       T e f f T s
and higher than 1.0.
Coef. T< 0.1 s 5T > Tss 5
Structural Performance LevelFraming Type 1 3Framing Type 2 4Framing Type 1 3Framing Type 2 4
C2Immediate Occupancy1.01.01.01.0
Life Safety1.31.01.11.0
Collapse Prevention1.51.01.21.0
C3 C 3 = 1.0 + α R 1 3 / 2 T e f f
where α is the ratio of post-yield stiffness to effective elastic stiffness, and R is the strength ratio.
1 Linear interpolation are used to calculate intermediate values. 2 Buildings in which, for all stories, inter-story drift decreases with increasing height. 3 Structure in which more than 30% of the story shear at any level is resisted by any combination of the following components, elements or frames: ordinary moment-resisting frames, concentrically braced frames, frames with partially restrained connections, tension-only braces, unreinforced masonry walls, shear-critical, piers and spandrels of reinforced concrete or masonry. 4 All frames not assigned to Framing Type 1. 5 Linear interpolation is used to calculate the intermediate values of T.
Table 3. Acronyms and main characteristics of the buildings [38].
Building Diaphragm StiffnessIn-Plan RegularityElevation RegularityConstructive Details
Ar,rigRigidYesYesTie-rods
Br,rigRigidYesYesRing-beams
Airr,rigRigidNoYesTie-rods
Birr,rigRigidNoYesRing-beams
Cirr,rigRigidNoNoTie-rods
Ar,intIntermediateYesYesTie-rods
Br,intIntermediateYesYesRing-beams
Airr,intIntermediateNoYesTie-rods
Birr,intIntermediateNoYesRing-beams
Cirr,intIntermediateNoNoTie-rods
Ar,flexFlexibleYesYesTie-rods
Airr,flexFlexibleNoYesTie-rods
Cirr,flexFlexibleNoNoTie-rods
Table 4. NSP formulations to estimate maximum displacement proposed by different sources.
ReferenceImprovements Proposed
Graziotti et al. (2014) [69] R = μ 1 · T T C β + 1 where
μ = R 1 β · T C T + 1
d m a x = d e R R 1 β T C T + 1
Guerrini et al. (2017) [70] d m a x = d e R R 1 c T T h y s t + a h y s t T T c b + R               if R > 1
d m a x = d e if R < 1
where μ R = R 1 c T T h y s t + a h y s t T T c b + R and
C R = μ R R
Marino et al. (2019) [38] d m a x * = d e , max * R R c = d e , max * R c 1             where
d y * = d e , max * R
c = 1 ln a · l n 1 + a 1 b T C T * 1
Table 5. Calibrated parameters for the proposed formulation given in [70].
Caseahyst (-)b (-)c (-)Thyst (s)
Mainly FD * 13% ≤ ξhyst < 15%0.72.32.10.055
Intermediate 15% ≤ ξhyst ≤ 18%0.22.32.10.030
Mainly SD * 18% < ξhyst ≤ 20%0.02.32.10.022
* FD, flexure-dominated; SD, shear-dominated.
Publisher’s Note: MDPI stays neutral with regard to jurisdictional claims in published maps and institutional affiliations.

