
Floor Acceleration Demands in a Twelve-Storey RC Shear Wall Building


1
Faculty of Technical Sciences, University of Novi Sad, Trg Dositeja Obradovića 6, 21000 Novi Sad, Serbia
2
Department of Civil, Environmental, Land, Building Engineering and Chemistry (DICATECh), Polytechnic University of Bari, Via E. Orabona 4, 70126 Bari, Italy
*
Author to whom correspondence should be addressed.
Buildings 2021, 11(2), 38; https://doi.org/10.3390/buildings11020038
Submission received: 17 December 2020
/
Revised: 13 January 2021
/
Accepted: 21 January 2021
/
Published: 25 January 2021
(This article belongs to the Collection Structural Dynamics and Analysis of Civil Structures and Engineering Materials)
Abstract
:The seismic response of acceleration-sensitive non-structural components in buildings has attracted the attention of a significant number of researchers over the past decade. This paper provides the results which improve the state-of-knowledge of the influences that higher vibration modes of structures and nonlinearity of non-structural components have on floor acceleration demands. In order to study these influences, a response-history analysis of a code-designed twelve-storey reinforced concrete building consisting of uncoupled ductile cantilever shear walls was conducted. The obtained absolute floor accelerations were used as a seismic input for linear elastic and nonlinear non-structural components represented by simple single-degree-of-freedom systems, and the main observations and findings related to the studied influences along the building height are presented and discussed. Additionally, the accuracy of the method for the direct determination of peak floor accelerations and floor response (acceleration) spectra recently co-developed by the first author was once again investigated and validated. A brief summary of the method is provided in the paper, along with the main steps in its application. Being relatively simple and sufficiently accurate, the method (in its simplified form) has been recently incorporated into the draft of the new generation of Eurocode 8.
1. Introduction
Seismic response of acceleration-sensitive non-structural components (NSCs) in buildings, often referred to as secondary systems or equipment, attracted the attention of a significant number of researchers over the past decade. Extensive research efforts resulted in journal papers that improve the state-of-knowledge (e.g., [1,2,3,4,5,6,7,8,9,10,11,12]) and represent an important addition to the studies reported in the past, whose brief overview was provided in [13]. In practice, floor acceleration demands are expressed through peak floor accelerations (PFAs) and floor response (acceleration) spectra (FRS). Generally, due to the fact that an “accurate” determination of PFAs and FRS involves time-consuming response-history analysis (RHA), in the first parametric studies conducted in the past, only a small number of input parameters was varied, which resulted in limited outcomes. Over time, parametric studies became more robust and complex, which significantly improved the understanding of floor acceleration demands and served as a solid basis for the development of approximate procedures and code-oriented formulas. However, some questions still need to be resolved, and the influences of higher vibration modes of structures and nonlinearity of NSCs represent the most important ones. Therefore, they were the main focus of the study presented in this paper.
In an early study, Kelly [14] investigated PFAs and FRS in twelve linear elastic and nonlinear buildings with different numbers of storeys by performing RHA. It was observed that higher modes influenced the response and that nonlinear structural behaviour significantly reduced the peak values of FRS related only to the fundamental mode. Hadjian [15] conducted a study of floor accelerations at lower storeys in cantilever and relatively rigid structures in order to examine the effectiveness of the application of the conventional modal combination methods. It was shown that the application of the Square Root of Sum of Squares (SRSS) combination rule may lead to an underestimation of accelerations at lower storeys due to the effects of higher modes. Rodriguez et al. [16] conducted a parametric nonlinear RHA on cantilever wall buildings with three, six and twelve storeys. The analysis showed that maximum PFAs almost always occurred at the top floor and that structural nonlinearity reduced them.
While the influence of structural nonlinearity was widely analysed in the past, up until this moment only a few studies took into account nonlinear behaviour of NSCs. Viti et al. [17] presented a computational scheme for the development of non-linear floor response spectra, which turned out to be reduced compared to the linear elastic ones. Adam and Fotiu [18] considered the response of bilinear elastic-plastic single-degree-of-freedom (SDOF) NSCs attached to a planar bilinear elastic-plastic multi-degree-of-freedom (MDOF) building. Villaverde [19] proposed an approximate method for the estimation of the response of NSCs in buildings by considering both structural and NSC nonlinear behaviour. Chaudhuri and Villaverde [20] conducted an extensive parametric study which took into account linear and nonlinear SDOF NSCs attached to flexible and rigid code-designed spatial steel moment-resisting frame buildings. Tamura et al. [21] confirmed that nonlinear behaviour of SDOF NSCs leads to significant reductions in the required yield strength. In the code-oriented version of the method for the direct determination of FRS proposed by Vukobratović and Fajfar [22], it was shown that the NSC nonlinear response reduces FRS values. Obando and Lopez-Garcia [23] examined the behaviour of nonlinear (elastic-perfectly plastic) SDOF NSCs with different ductility demands and damping mounted on linear elastic MDOF concrete and steel structures in terms of inelastic displacement ratios (IDRs). Anajafi et al. [24] developed inelastic floor spectra for the design of NSCs sensitive to accelerations. Kazantazi et al. [25] proposed an approximate formula for the estimation of strength reduction factors for light nonlinear NSCs.
The influences of higher (structural) modes and nonlinearity of NSCs on PFAs and FRS were examined in this paper, within a code-designed twelve-storey reinforced concrete (RC) building consisting of uncoupled ductile cantilever shear walls. In addition, the accuracy of the method for the direct generation of PFAs and FRS previously proposed by Vukobratović and Fajfar [22] was once again investigated. The proposed methodology provides a practical solution, which conforms to code-based approaches and is able to take into account the contribution of higher modes in the PFA and FRS estimates (when it comes to PFAs, it represents an alternative to methodologies presented in e.g., [26,27]).
The properties of the considered structure are given in Section 2. Description of the adopted structural and NSC models, input parameters for the RHA, and a brief summary of the direct method and its step-by-step application are provided in Section 3. The obtained results and corresponding comments are presented in Section 4. The main conclusions of the study are provided in Section 5.
2. Description of the Analysed Structure
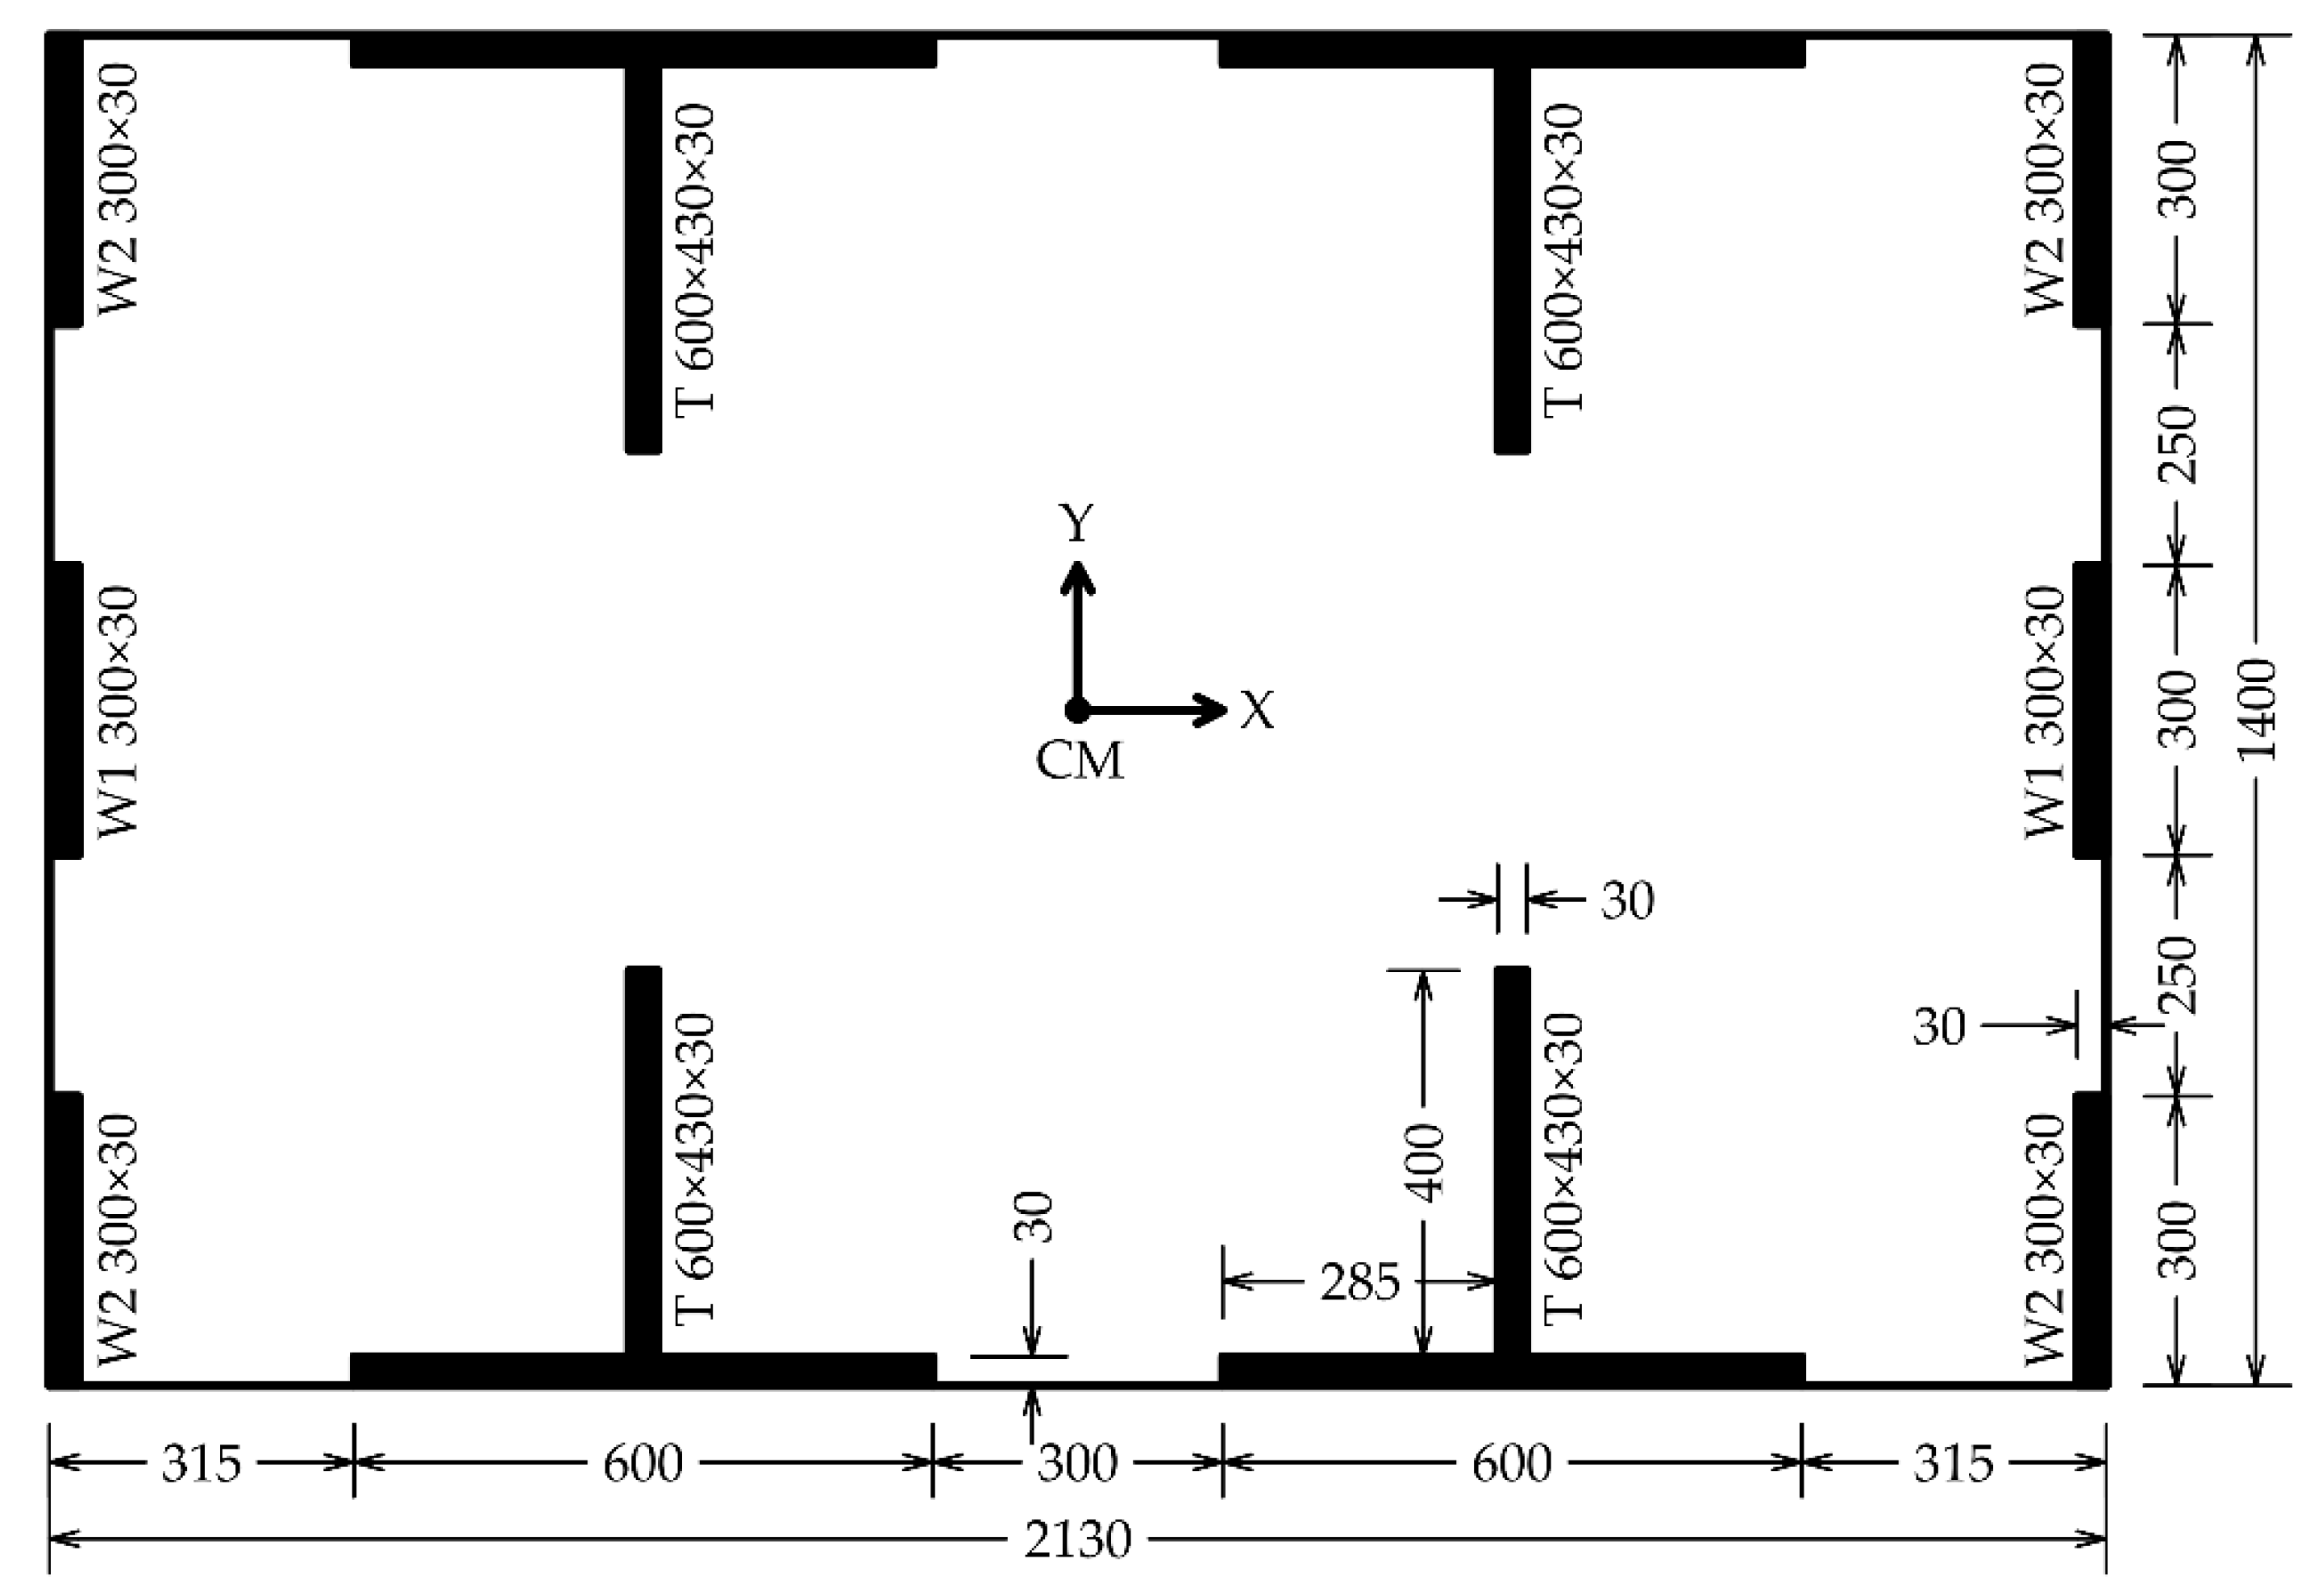
A spatial twelve-storey RC building was considered in the analysis. It was symmetrical in plan, and regular both in plan and elevation, as shown in Figure 1. According to the Part 1 of Eurocode 8 [28], the structural type of the building is an uncoupled wall system. Walls were denoted as W1, W2 and T. Even though the dimensions of walls W1 and W2 were the same, axial loads in them were different. A constant storey height was equal to 300 cm. Concrete C30/37 (Eurocode 2, Part 1-1 [29]) and steel B500B were used, with the moduli of elasticity equal to 33 and 200 GPa, respectively, and characteristic compressive and yield strengths equal to 30 and 500 MPa, respectively.
A high ductility class (DCH) was chosen in the seismic design [28]. At each floor, a 40 cm thick RC flat slab was considered, and permanent and variable loads amounted to 12.0 and 3.0 kN/m2, respectively. Snow was not taken into account. Seismic action was defined through a design spectrum obtained from an elastic spectrum and a behaviour factor q. Type 1 elastic spectrum for soil type C was taken into account (soil factor S = 1.15, TB = 0.20 s, TC = 0.60 s and TD = 2.0 s) with the design ground acceleration ag = 0.25 g (peak ground acceleration PGA amounted to 0.29 g). For the chosen ductility class, the q factor was determined as the product of a basic value of behaviour factor q0 (equal to 4.0) and an overstrength factor αu/α1 (equal to 1.1), and it amounted to 4.4 for both principal (X and Y) directions. The reinforcement data was omitted on purpose, in order to keep the scope of the paper in an acceptable range. However, note that the authors will gladly provide all reinforcement data to interested readers.
3. Analysis Overview
Values of floor acceleration demands were obtained from the RHA and code-oriented version of the method for the direct generation of PFAs and FRS previously developed by Vukobratović and Fajfar [22]. In both cases, the results for the Y direction were presented. It should be noted that they were obtained based on an assumption that the mass of NSC is at least a hundred times smaller than the structural mass, which justifies an uncoupled analysis of the structure and NSC (see e.g., ASCE 4-98 [30]).
The most important parameters related to the properties of the adopted structural and NSC models and seismic input, along with the brief description of the direct method and its step-by-step application for the considered building, are provided in the following text.
3.1. Properties of the Considered Structural and NSC Models
3.1.1. Structural Model
The spatial mathematical structural model consisted of beam-column elements assigned to each wall at each floor, and of floor slabs which were modelled as rigid diaphragms, according to the provisions of Eurocode 8 [28] and the actual slab thickness. Reduced values of bending and shear stiffness were considered in the analysis, and they amounted to the half of the corresponding stiffness of the uncracked cross-sections. At the first eleven floors, the masses amounted to 378 t, and the mass moments of inertia amounted to 20,465 tm2, whereas at the top floor, the mass amounted to 392 t, and the mass moment of inertia amounted to 21,223 tm2. Thus, the total weight of the structure was equal to 45,500 kN. Masses and mass moments of inertia were applied at the mass centres (CM), which were assumed to be in the centres of gravity at each floor, as shown in Figure 1. Being irrelevant for the study presented in this paper, accidental torsional effects were neglected.
Selected results of the modal analysis are shown in Table 1, and they correspond to the first nine modes, in which more than 90% of the mass was employed in both translational directions (MX and MY denote effective mass ratios in X and Y directions, respectively). From the presented results, it can be seen that the first, fourth, and seventh modes were translational in the X direction; that the second, fifth, and eight modes were translational in the Y direction; and that the third, sixth, and ninth modes were torsional, as indicated in the first column of Table 1.
Since in this paper only the Y direction is considered, from this point on, the second, fifth and eight modes will be referred to as the first (fundamental), second and third modes, respectively. This assumption is due to a similar dynamic behaviour of the case study building in X and Y directions, as shown in Table 1, which allowed us to hypothesize similar responses in both main directions. Having that defined, note that 5% Rayleigh damping was assumed with the respect to the first two modes.
A lumped plasticity approach was used, with plastic hinges assigned to both ends of each beam-column element. Behaviour of each plastic hinge was described by an ideal elasto-plastic behaviour, defined through a moment-rotation relationship. The interaction between axial force and bending moment was not taken into account, and elastic axial, shear and torsional response of each beam-column element was assumed. Yield moments My in plastic hinges were determined from the analysis of cross-sections by considering the value of axial load and adopted reinforcement. The My values ranged from 1280 to 4610 kNm in the case of the walls W1 and W2, whereas in the case of the T walls, they ranged from 3045 to 12,020 kNm for flange in compression, and from 11,400 to 34,850 kNm for flange in tension. Yield rotations θy were determined in the applied software automatically, and the plastic parts of the ultimate rotations θum,pl were determined according to Equation (A3) provided in the Part 3 of Eurocode 8 [31] by considering the mean value of the concrete compressive strength equal to 38 MPa. The θum,pl values ranged from 0.020 to 0.022 rad in the case of the walls W1 and W2, and from 0.018 to 0.023 rad in the case of the T walls. It turned out that the θum,pl values were irrelevant for this study This was due to the fact that the applied seismic input produced the response which was far from the limit state near collapse (NC), i.e., the achieved ductility had a low value, far lower than the one corresponding to the NC limit state.
3.1.2. NSC Model
A simple SDOF oscillator was assumed for the NSC model by taking into account linear elastic and nonlinear behaviour, represented through an ideal elasto-plastic relationship. Oscillators with periods of vibration between 0 and 4.0 s were chosen to represent a wide range of NSCs. Thus, the mass and stiffness properties were selected accordingly. Several damping values were considered, and they were equal to 1, 3, 5 and 7%. In the case of nonlinear behaviour, a force and deformation at yield were chosen with the respect to the target ductility, which amounted to 1.5 and 2.0.
3.2. Seismic Inputs for the RHA and Direct Method
In the case of the RHA, the seismic input consisted of 30 ground motion records (with the mean PGA of 0.43 g), chosen so that their mean elastic spectrum for 5% damping corresponded to the target Eurocode 8 Type 1 elastic spectrum for soil type B (soil factor S = 1.20, TB = 0.15 s, TC = 0.50 s and TD = 2.0 s) with the design ground acceleration ag of 0.29 g. The mean and target spectra were fitted between 0.10 and 2.0 s by considering Eurocode 8 provisions in the following manner: no value on the mean spectrum was less than 90% of the corresponding value on the target spectrum. The detailed data of the selected records was provided in [13].
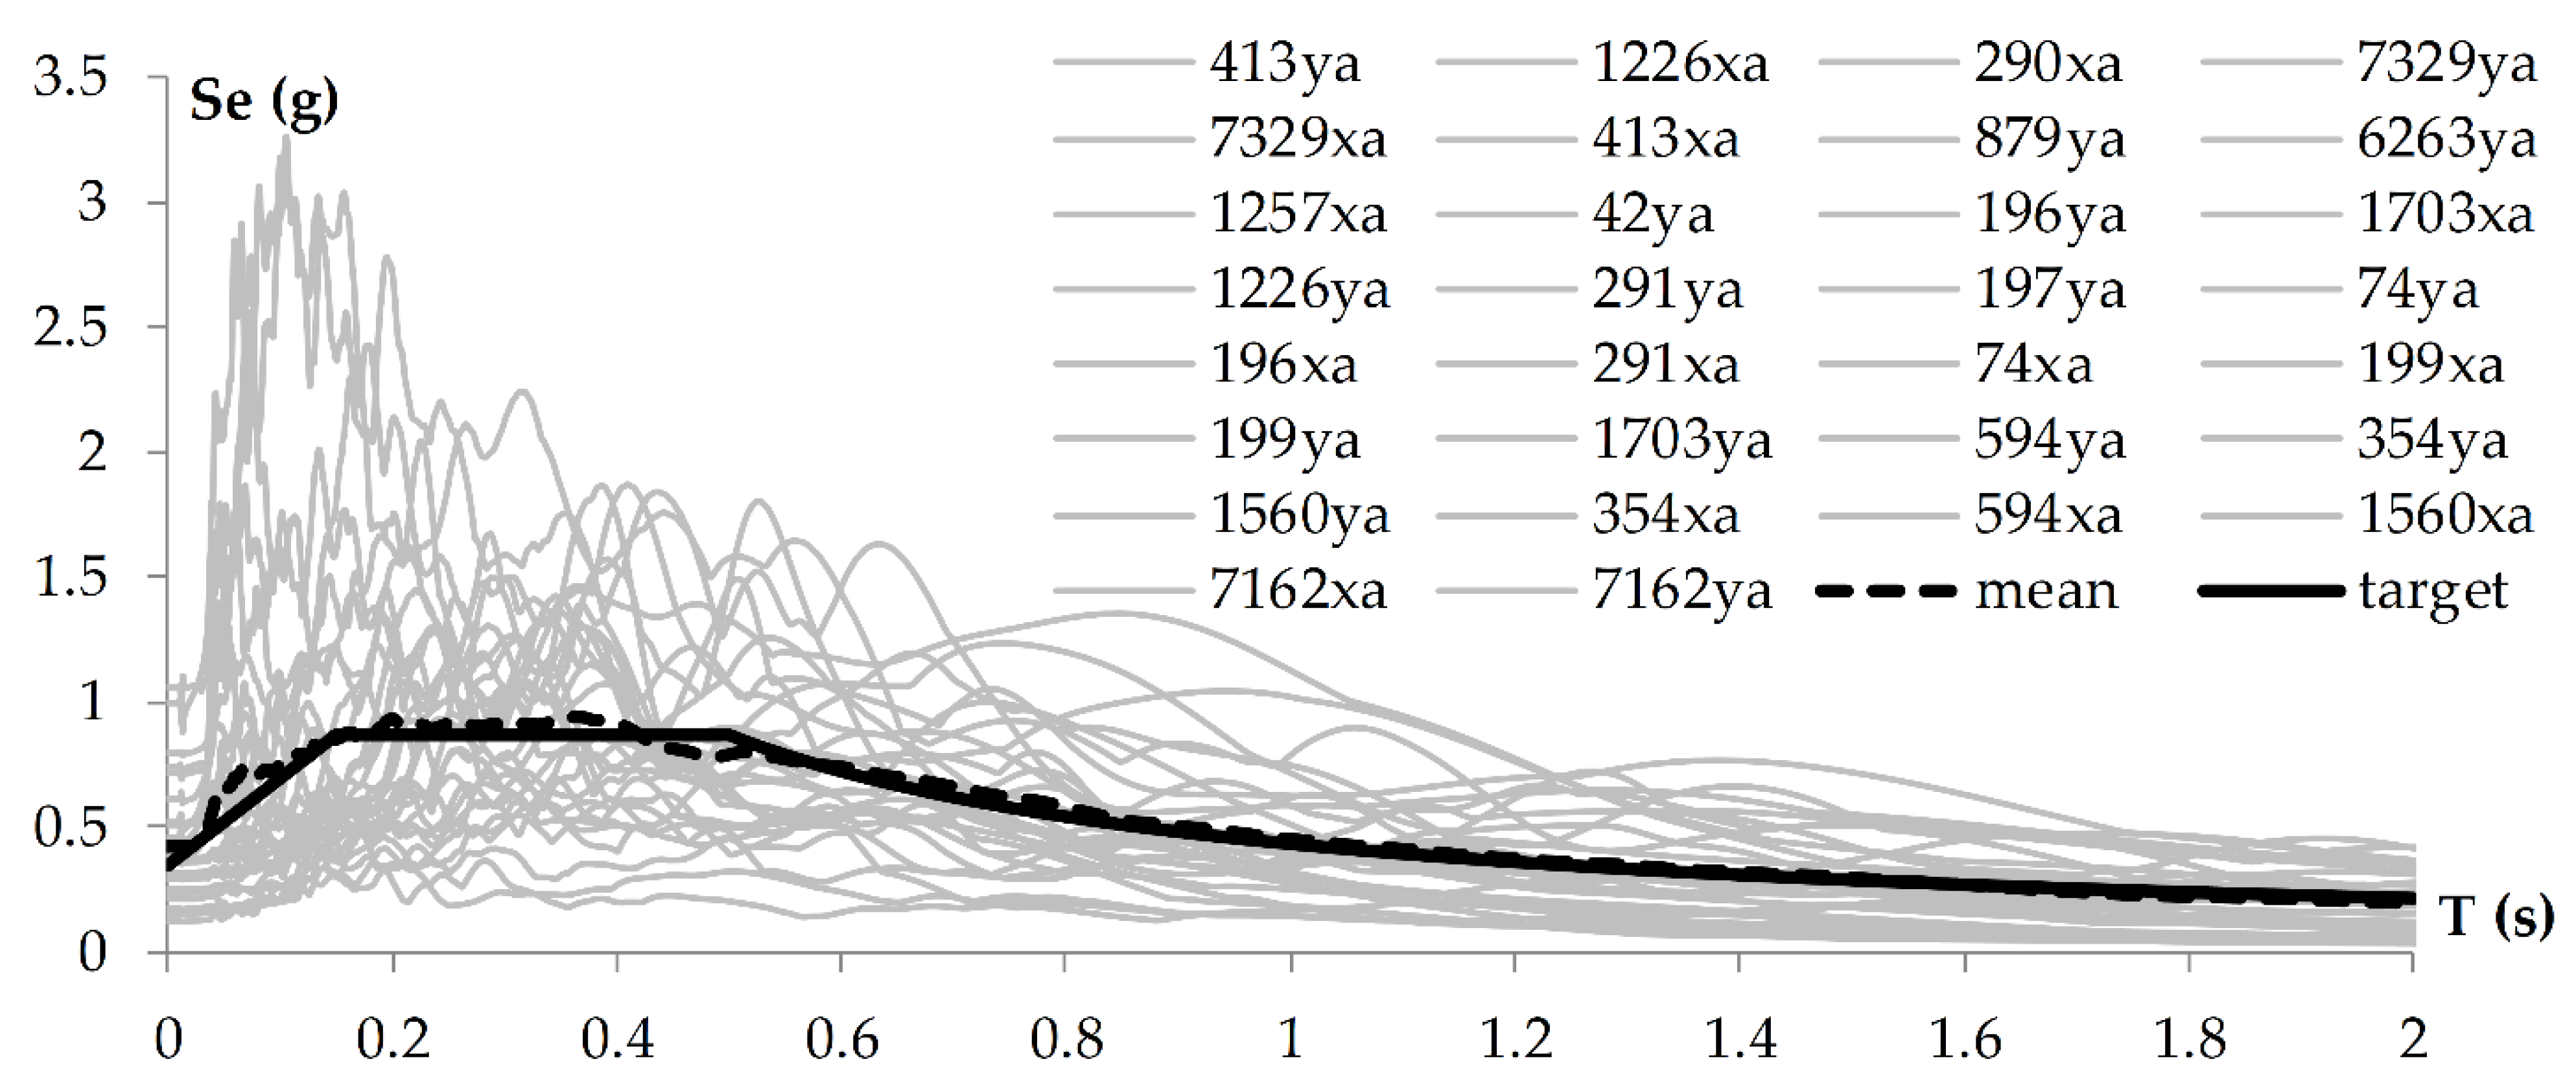
Obviously, the seismic input used for the design (see Section 2), was slightly different than the one used in the RHA and direct method. Namely, the target spectrum described above was chosen so that the spectral acceleration which corresponded to the fundamental mode was equal to the one from the elastic spectrum used for the design, whereas the spectral accelerations which corresponded to higher modes were slightly larger. This way, the higher mode effects studied in this paper were more pronounced and obvious. The elastic acceleration spectra of individual records (solid thin grey lines), their mean spectrum (dashed black line) and the Eurocode 8 target spectrum (solid black line), shown in Figure 2, were calculated by considering 5% damping. The applied records were taken from the European Strong-Motion Database (Ambraseys et al. [32]). In Figure 2, their labels represent waveform codes, and “xa” and “ya” denote accelerations in global x and y directions, respectively.
Newmark’s integration method was used in the case of the RHA, by taking into account coefficients γ and β equal to 0.5 and 0.25, respectively, i.e., acceleration was taken to be a constant within each time step. The size of the time step was 0.005 s in all cases. In the direct method, both the target and mean spectra were applied, as indicated in the following text.
3.3. A Brief Summary of the Method for the Direct Determination of PFAs and FRS
Only a brief summary of the applied direct method is provided herein, whereas its complete description can be found in [22]. The application of the method consists of the following steps:
- Initial calculations in terms of the elastic modal analysis have to be conducted, in order to determine the following dynamic properties of the structure: natural periods Tp,i, mode shapes ϕij and modal participation factors Γi (i denotes the mode and j denotes the floor).
- In the case of nonlinear structural behaviour, the method needs to be used in conjunction with the N2 method, as integrated into Eurocode 8 (for more details on the N2 method see Fajfar [33,34]). It is therefore assumed that nonlinear behaviour applies only to the fundamental mode. A mode shape {ϕ1} is represented by the inelastic deformation shape, and all higher modes are treated as linear elastic. Nonlinear structural behaviour is taken into account through a ductility dependent reduction factor Rµ proposed by Vidic et al. [35]:
In Equation (1), T*p represents the effective natural period which can be determined directly from the N2 method, and TC is the characteristic period of ground motion. In the direct method, Equation (1) applies only to the fundamental mode, whereas for all higher modes (i > 1), which are considered to be linear elastic, Rµ is equal to 1.0. In the case of positive post-yield stiffness, Rµ from Equation (1) should be divided by (1 + α(µ − 1)), where α is the ratio between post-yield and elastic stiffness.
- 3.
- FRS at considered floors and for individual modes taken into account should be determined as:
By distinguishing resonance regions corresponding to FRS peak zones and off-resonance regions (zones different from the previous ones), FRS values in the latter are determined from Equation (2). FRS plateau in the resonance region is determined from Equation (3) as the product of the peak floor acceleration PFAij given by Equation (4), and an empirical amplification factor (AMP) for the considered mode AMPi given by Equation (5) (note that the third line was proposed by Sullivan et al. [36]), in which the NSC damping ξs is expressed in % of critical damping. Note that Se is a value in the elastic acceleration spectrum which represents the seismic demand. Moreover, Sep,i = Se(Tp,i,ξp,i) applies to the ith mode of the structure (ξp,i denotes the damping value of the structure for the ith mode), whereas Se = Se(Ts,ξs) applies to the NSC. In the case that nonlinear structural behaviour is taken into account, T*p needs to be used in the direct method instead of Tp,1. The inelastic deformation shape, normalized to 1.0 at the control point (usually at the roof level) has to be used in Equations (2) and (4) instead of the fundamental mode shape {ϕ1}. Γ1 should also be determined from the inelastic deformation shape. Along with the value of T*p, the inelastic mode shape {ϕ1} and the corresponding Γ1 value can also be determined from the N2 method. In the case of a simple planar structural model with concentrated masses or a model which can be considered as such (e.g., the one analysed herein), Γi can be determined from Equation (6), where mj is the mass at the jth floor.
In the version of the method proposed by Vukobratović and Fajfar [22], nonlinear behaviour of NSCs was taken into account approximately by increasing their damping, i.e., by using lower values of Ses in Equation (2). A study reported in [22] indicated that FRS values obtained for linear elastic NSCs with 10 and 20% damping approximately corresponded to floor response spectra for nonlinear NSCs when their ductility demands, μs, were 1.5 and 2.0, respectively, and their actual NSC damping was 1%. The adopted approach leads to somewhat conservative results in the case of higher ductility demand and/or higher damping (for latter see Section 4.2).
- 4.
- The resulting FRS should be determined by combining the FRS values obtained for individual modes. In the range of the periods of NSCs from Ts = 0 up to and including the end of the plateau of the resonance region of the fundamental mode (Ts = Tp,1), the SRSS or Complete Quadratic Combination (CQC) modal combination rules are used. In the post-resonance region of the fundamental mode, the algebraic sum (ALGSUM) should be applied, with the relevant signs of individual modes taken into account. The upper limit of the resulting floor spectrum calculated from the ALGSUM is represented by the plateau obtained for the resonance region of the fundamental mode by using the SRSS or CQC rules.
For the considered direction of a structure, the number of modes that needs to be taken into account in the method should correspond to the engagement of at least 90% of the total mass, which is in compliance with Eurocode 8 provisions.
It should also be noted that the direct method equations are not intended to cover the ground floor, where displacements are equal to zero. However, based on physics, the PFA at the ground floor is equal to the PGA, and FRS is equal to the ground motion spectrum corresponding to the NSC damping. Thus, setting a lower limit for the resulting PFAs and FRS overcomes the shortcoming of the method at the ground floor. According to Hadjian [15], the modification of the acceleration profile, in terms of setting the PGA as the lower limit for PFAs at lower floors, was used in the past and was chosen as a solution for the direct method as well. As a reasonable approximation, a lower limit should be applied only to the lowest 1/4 of the building [37] (e.g., to the two lowest floors in an eight-storey building), and at least to the first floor in the case of buildings with less than four storeys. Therefore, in the applicable storeys, in the whole period range, the elastic ground response spectrum used as the input corresponding to the assumed NSC damping ξs should be set as the lower limit for the resulting FRS. In the case of nonlinear NSCs, the equivalent ξs should be used (10 and 20% for μs of 1.5 and 2.0, respectively), regardless of the actual ξs value. Consequently, the input PGA value represents the lower limit for the resulting PFAs.
3.4. A Step-by-Step Application of the Direct Method
All steps of the application of the direct method are presented in the following text. It should be noted that PFAs and FRS were determined at mass centres (CM). In the direct method, only the first three modes were generally considered (more than 90% of the mass was engaged in them, see Table 1), with the exception of Section 4.1 (the determination of PFAs) in which both three and all modes were considered, due to the reasons discussed below.
3.4.1. Elastic Modal Analysis
Natural periods (Tp,i), mode shapes (ϕij) and modal participation factors (Γi) for the first three modes are presented in Table 2, in which mode shapes were normalized to 1.0 at the top floor.
3.4.2. Pushover Analysis of the Structure
A pushover-based N2 method (as provided in Eurocode 8) was used to take into account the structural nonlinear behaviour in the direct method. According to Eurocode 8, at least two vertical distributions of lateral loads should be applied. Since initial calculations showed that the relevant response, with regard to the seismic demand for the considered (Y) direction, was obtained through the application of the lateral load pattern related to the fundamental mode shape, in the following text only the results which correspond to it are presented.
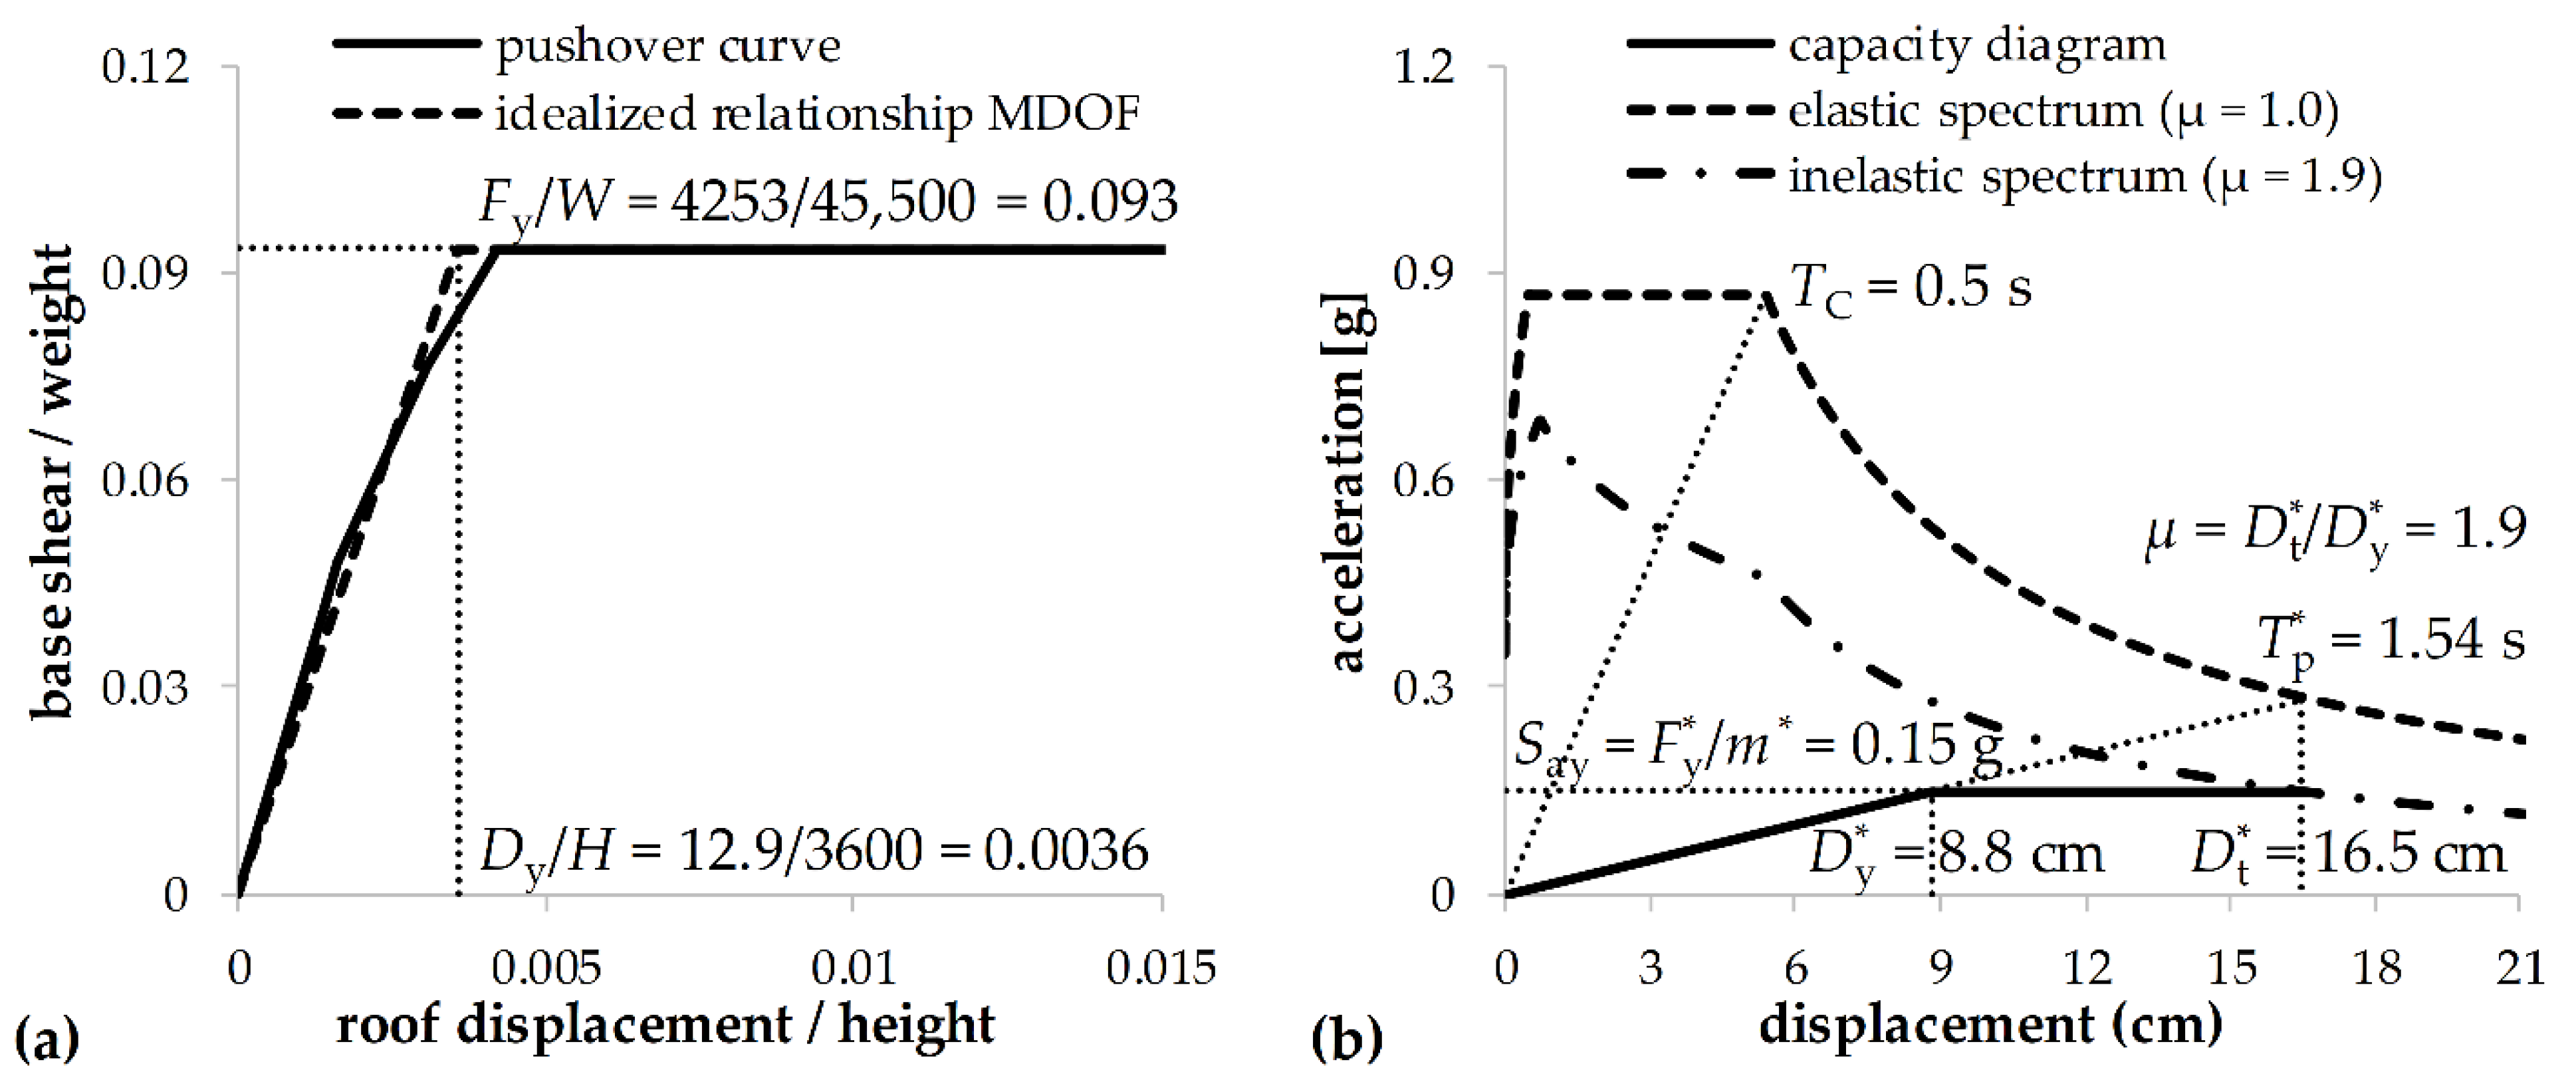
Calculated and idealized pushover curves are shown in Figure 3a. Note that the base shear force was normalized by the total weight of the structure, W, and that the roof displacement was normalized by the height of the structure, H. The mass of the equivalent SDOF system (m*) and transformation factor Γ amounted to 1990 t and 1.47, respectively. It can be seen from Table 2 that Γ was equal to the modal participation factor Γ1 from the elastic modal analysis. This equality was achieved because lateral loads were based on the fundamental mode, and the mode shape at the top floor was normalized to 1.0. As mentioned above, in the direct method the inelastic displacement shape should be used, along with the corresponding value of Γ1 determined below. The yield force (F*y), yield displacement (D*y) and period (T*p,1 = T*p) of the idealized SDOF system amounted to 2893 kN, 8.8 cm and 1.54 s, respectively. The capacity diagram and the demand spectrum are shown in Figure 3b, from which it can be seen that the seismic demand for the equivalent SDOF system (D*t) amounted to 16.5 cm, whereas the demand for the MDOF system, in terms of the target roof displacement, amounted to Dt = Γ · D*t = 24.3 cm. Since T*p > TC, Rµ = µ = 1.9 (see Equation (1)). The vector of inelastic deformation shape obtained for the target displacement Dt, determined as the ratio of floor displacements and Dt, is given in the last column of Table 2, and the corresponding value of Γ1 amounts to 1.47. The differences in Γ values obtained for the assumed (linear elastic) and calculated (inelastic) displacement shapes are usually negligible, as is the case here, where they turned out to be equal. It should be noted that in the next step of the application of the direct method (the determination of PFAs and FRS), besides the values of inelastic deformation shape {ϕ1} and corresponding Γ1, the T*p,1 value should be used instead of Tp,1 in relevant equations.
3.4.3. Determination of PFAs and FRS
The values of peak floor accelerations for the considered modes were obtained from Equation (4) and are provided in Table 3 along with the values of Sep,i and Rµ for each mode. By considering the obtained PFA values, which represent the FRS values for infinitely stiff NSCs (Ts = 0), FRS for the considered modes were determined from Equations (2) and (3) by using the amplification factors from Equation (5).
3.4.4. Resulting PFAs and FRS
Resulting values of PFAs were obtained by the SRSS combination rule, and they are given in the last column of Table 3. For comparison, an additional combination approach was used, as presented in Section 4.1. Note that the bolded combined values in Table 3 are the ones smaller than the direct method’s input PGA of 0.35 g, which in the method represents the lower limit for the resulting PFAs at lowest floors, as discussed in Section 3.3. The resulting PFA values at the 9th and 10th floors, which actually correspond to the RHA results shown below, confirm that the lower limit should be applied only at the lowest floors. This issue will be further discussed in the following text.
When it comes to FRS, the combination approach discussed in Step 4 of Section 3.3 was used, i.e., in the range of the periods of NSCs from Ts = 0 up to and including the end of the plateau of the resonance region of the fundamental mode (Ts = Tp,1), the SRSS combination rule was used. In the post-resonance region of the fundamental mode, the ALGSUM was applied, with the relevant signs of individual modes taken into account. The upper limit of the resulting FRS calculated from the ALGSUM was represented by the plateau obtained for the resonance region of the fundamental mode by using the SRSS rule. Finally, at the lowest three floors (see Section 3.3) in the whole period range, the elastic ground response spectrum used as input was set as the lower limit for the resulting FRS. In the following section, the obtained RHA and direct values of PFAs and FRS were compared.
4. Results and Discussion
4.1. Peak Floor Accelerations
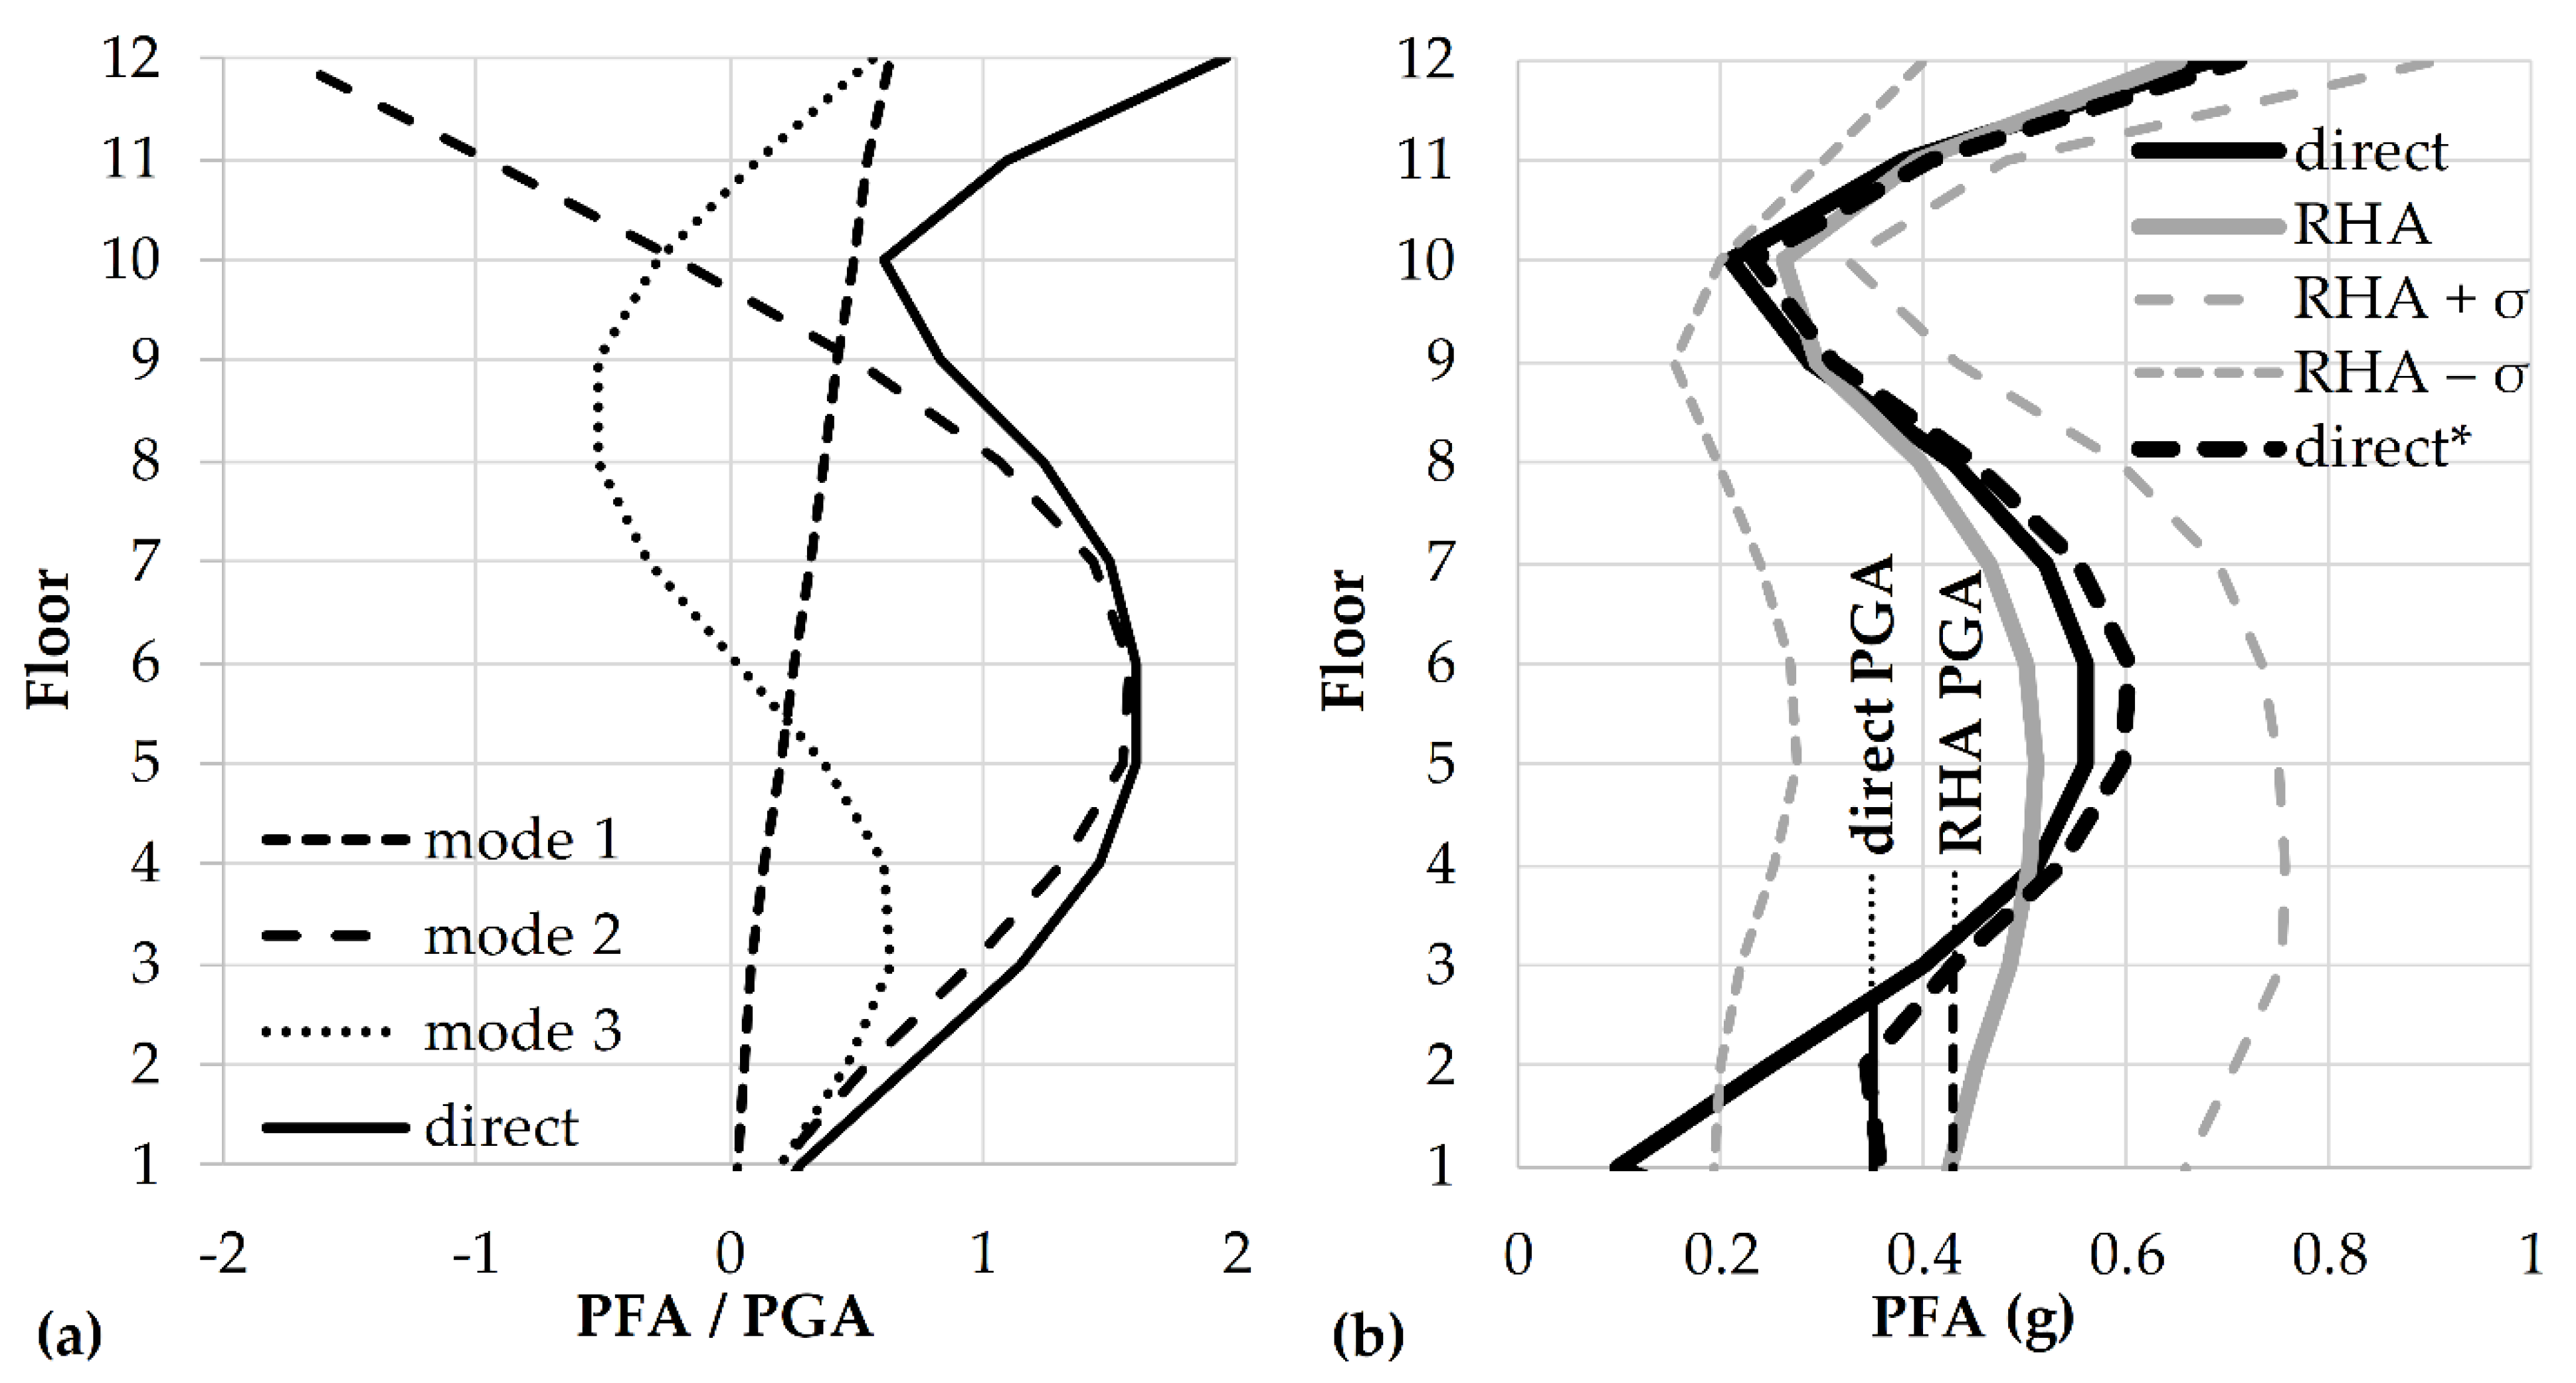
The direct PFAs shown in Table 3, both individual (denoted as “mode 1”, “mode 2” and “mode 3”) and combined by the SRSS rule (denoted as “direct”), are presented in Figure 4a. Note that they were normalized to the PGA of the direct input, equal to 0.35 g. Even though the direct PFAs are approximate, they provide a fairly accurate picture of the influence of the considered individual modes along the height. By looking at the size of the normalized PFAs, it is obvious that the second mode dominates the response along the building height. Among the considered modes, at floors 2nd to 8th, 11th and 12th, the largest values of PFAs come from the second mode, at the 9th floor all modes produce similar PFAs, whereas at the 10th floor the fundamental mode dominates the response. These observations are also confirmed by the size of FRS peaks shown in Section 4.2. When it comes to the 1st floor, the influences of the second and third modes are the same. Nevertheless, it will be seen from the results shown in Section 4.2 that the 1st floor is rather specific when it comes to the influence of individual modes.
In Figure 4b, the direct, mean, mean plus and mean minus standard deviation values of the PFAs obtained from the direct method and RHA are presented (denoted as “direct”, “RHA”, “RHA + σ” and “RHA − σ”, respectively). As it can be seen, they were not normalized because the PGA values of the mean (0.43 g) and target (0.35 g) spectra were different. The PGA values of the target and mean spectra are also marked in Figure 4b, denoted as “direct PGA” and “RHA PGA”, respectively.
The RHA results presented in Figure 4b confirm the fact that higher modes strongly influenced the PFAs along the height and very clearly indicate that at the two lowest floors, the value of PFA was controlled by the input PGA. As a matter of fact, it turned out that at the 1st floor, the PFA and PGA values were completely equal. It can also be seen that the PFA values between the 8th and 11th floors were lower than the PGA. It should be noted that such an occurrence is not solely related to cantilever structures, but can take place in frames as well (see e.g., Pinkawa et al. [38]). Regardless of a slightly different modelling approach, the obtained distribution of PFAs along the height is very similar to the one obtained by Rodriguez et al. [16] in a twelve-storey cantilever building, in which the nonlinear response at the base of the walls was represented by the Takeda hysteretic behaviour. Namely, as stated in Section 3.1.1, for the analysis presented in this paper, the nonlinear response was not allowed only at the base, but along the whole building height, and the simple elasto-plastic behaviour was assumed in plastic hinges instead of some hysteretic behaviour which might be more appropriate for cast-in-place concrete walls. The agreement of the obtained RHA results with the ones reported by Rodriguez et al. [16], to a certain extent, justifies the adopted modelling approach. This is particularly true when it comes to the elasto-plastic behaviour in plastic hinges, adopted for the sake of simplicity, and due to the fact that preliminary analyses showed that the applied seismic input resulted in a moderate ductility demand.
A comparison of the “direct” and “RHA” results shown in Figure 4b generally indicates a very good agreement between the PFA values obtained by the two applied approaches from the 4th to the 12th floor, with some slight non-conservatism at the 10th floor. Nevertheless, at the 10th floor the direct PFA was still larger than the “RHA − σ” value. At the lowest three floors, the direct method led to non-conservative results, especially when the lower limit for PFAs (equal to the “direct PGA”) was not applied. For some time now, it is a well-known fact that when it comes to absolute accelerations, the SRSS combination rule can produce unrealistic results when applied to higher modes at lower floors. As previously noted by Hadjian [15], at lower floors of cantilever structures the SRSS rule can lead to PFAs that are smaller than the PGA, which is an unexpected result due to the fact that the base acceleration should be equal to the PGA. The presented results confirm this fact. The reasons for the aforementioned shortcoming of the SRSS rule application were outlined in [15] and will not be further discussed here. Furthermore, besides the drawback of the SRSS rule, the direct method led to non-conservative results at the lowest floors also because the input PGA values used for the direct and RHA approaches were different, and because not all modes were taken into account (which is a common approach used in approximate direct procedures).
In order to support the facts regarding the direct PFAs obtained at lower floors, the direct method was once again applied by minimizing or excluding the unfavourable influences of the above mentioned factors: (1) the mean spectrum was used as the seismic input instead of the target spectrum (the ductility demand in the fundamental mode remained the same), (2) all modes were taken into account, and (3) the SRSS rule was replaced by Gupta’s method coupled with the Missing Mass method. These methods are commonly used for the analysis of structures in the nuclear industry (see e.g., USNRC 1.92 [39]), where the influence of higher modes cannot be neglected. A complete overview of both combination methods, along with the practical guidelines for their application, was provided in [13]. The obtained results are shown in Figure 4b, and they are denoted as “direct*”.
It can be seen from Figure 4b that at the lowest floors, the “direct*” results represent a significant improvement compared to the “direct” ones, i.e., their agreement with the PFAs obtained from the RHA is much better. From the 4th up to the 9th floor, a slight conservatism is incorporated in the “direct*” approach, leading to the PFAs that are still significantly lower than the “RHA + σ” values, which means that they can be considered as acceptable. Between the 10th and 12th floors the “direct*” PFAs are in a very good agreement with the RHA values, and the above discussed non-conservatism of the “direct” PFA at the 10th floor is somewhat reduced.
Overall, it can be stated that the “direct*” approach leads to a better estimation of the RHA PFAs in comparison to the “direct” one, especially at lower floors. Nevertheless, unless the lower limit equal to the PGA is applied, the obtained results at the first three floors are not satisfactory. In other words, the forming of the envelope of the “direct*” PFAs and “RHA PGA” at the two lowest floors would lead to an acceptable result. On the other hand, a quite similar result would be obtained if only the “error” in the seismic input was eliminated from the “direct” results and the lower limit for PFAs equal to “RHA PGA” was taken into account. By considering this fact, it can be concluded that the current formulation of the direct method, which incorporates (1) the application of a limited number of modes, (2) simple combination rules and (3) setting the lower limit for PFA (and FRS) values at lower floors, is appropriate for practical application.
4.2. Floor Response Spectra
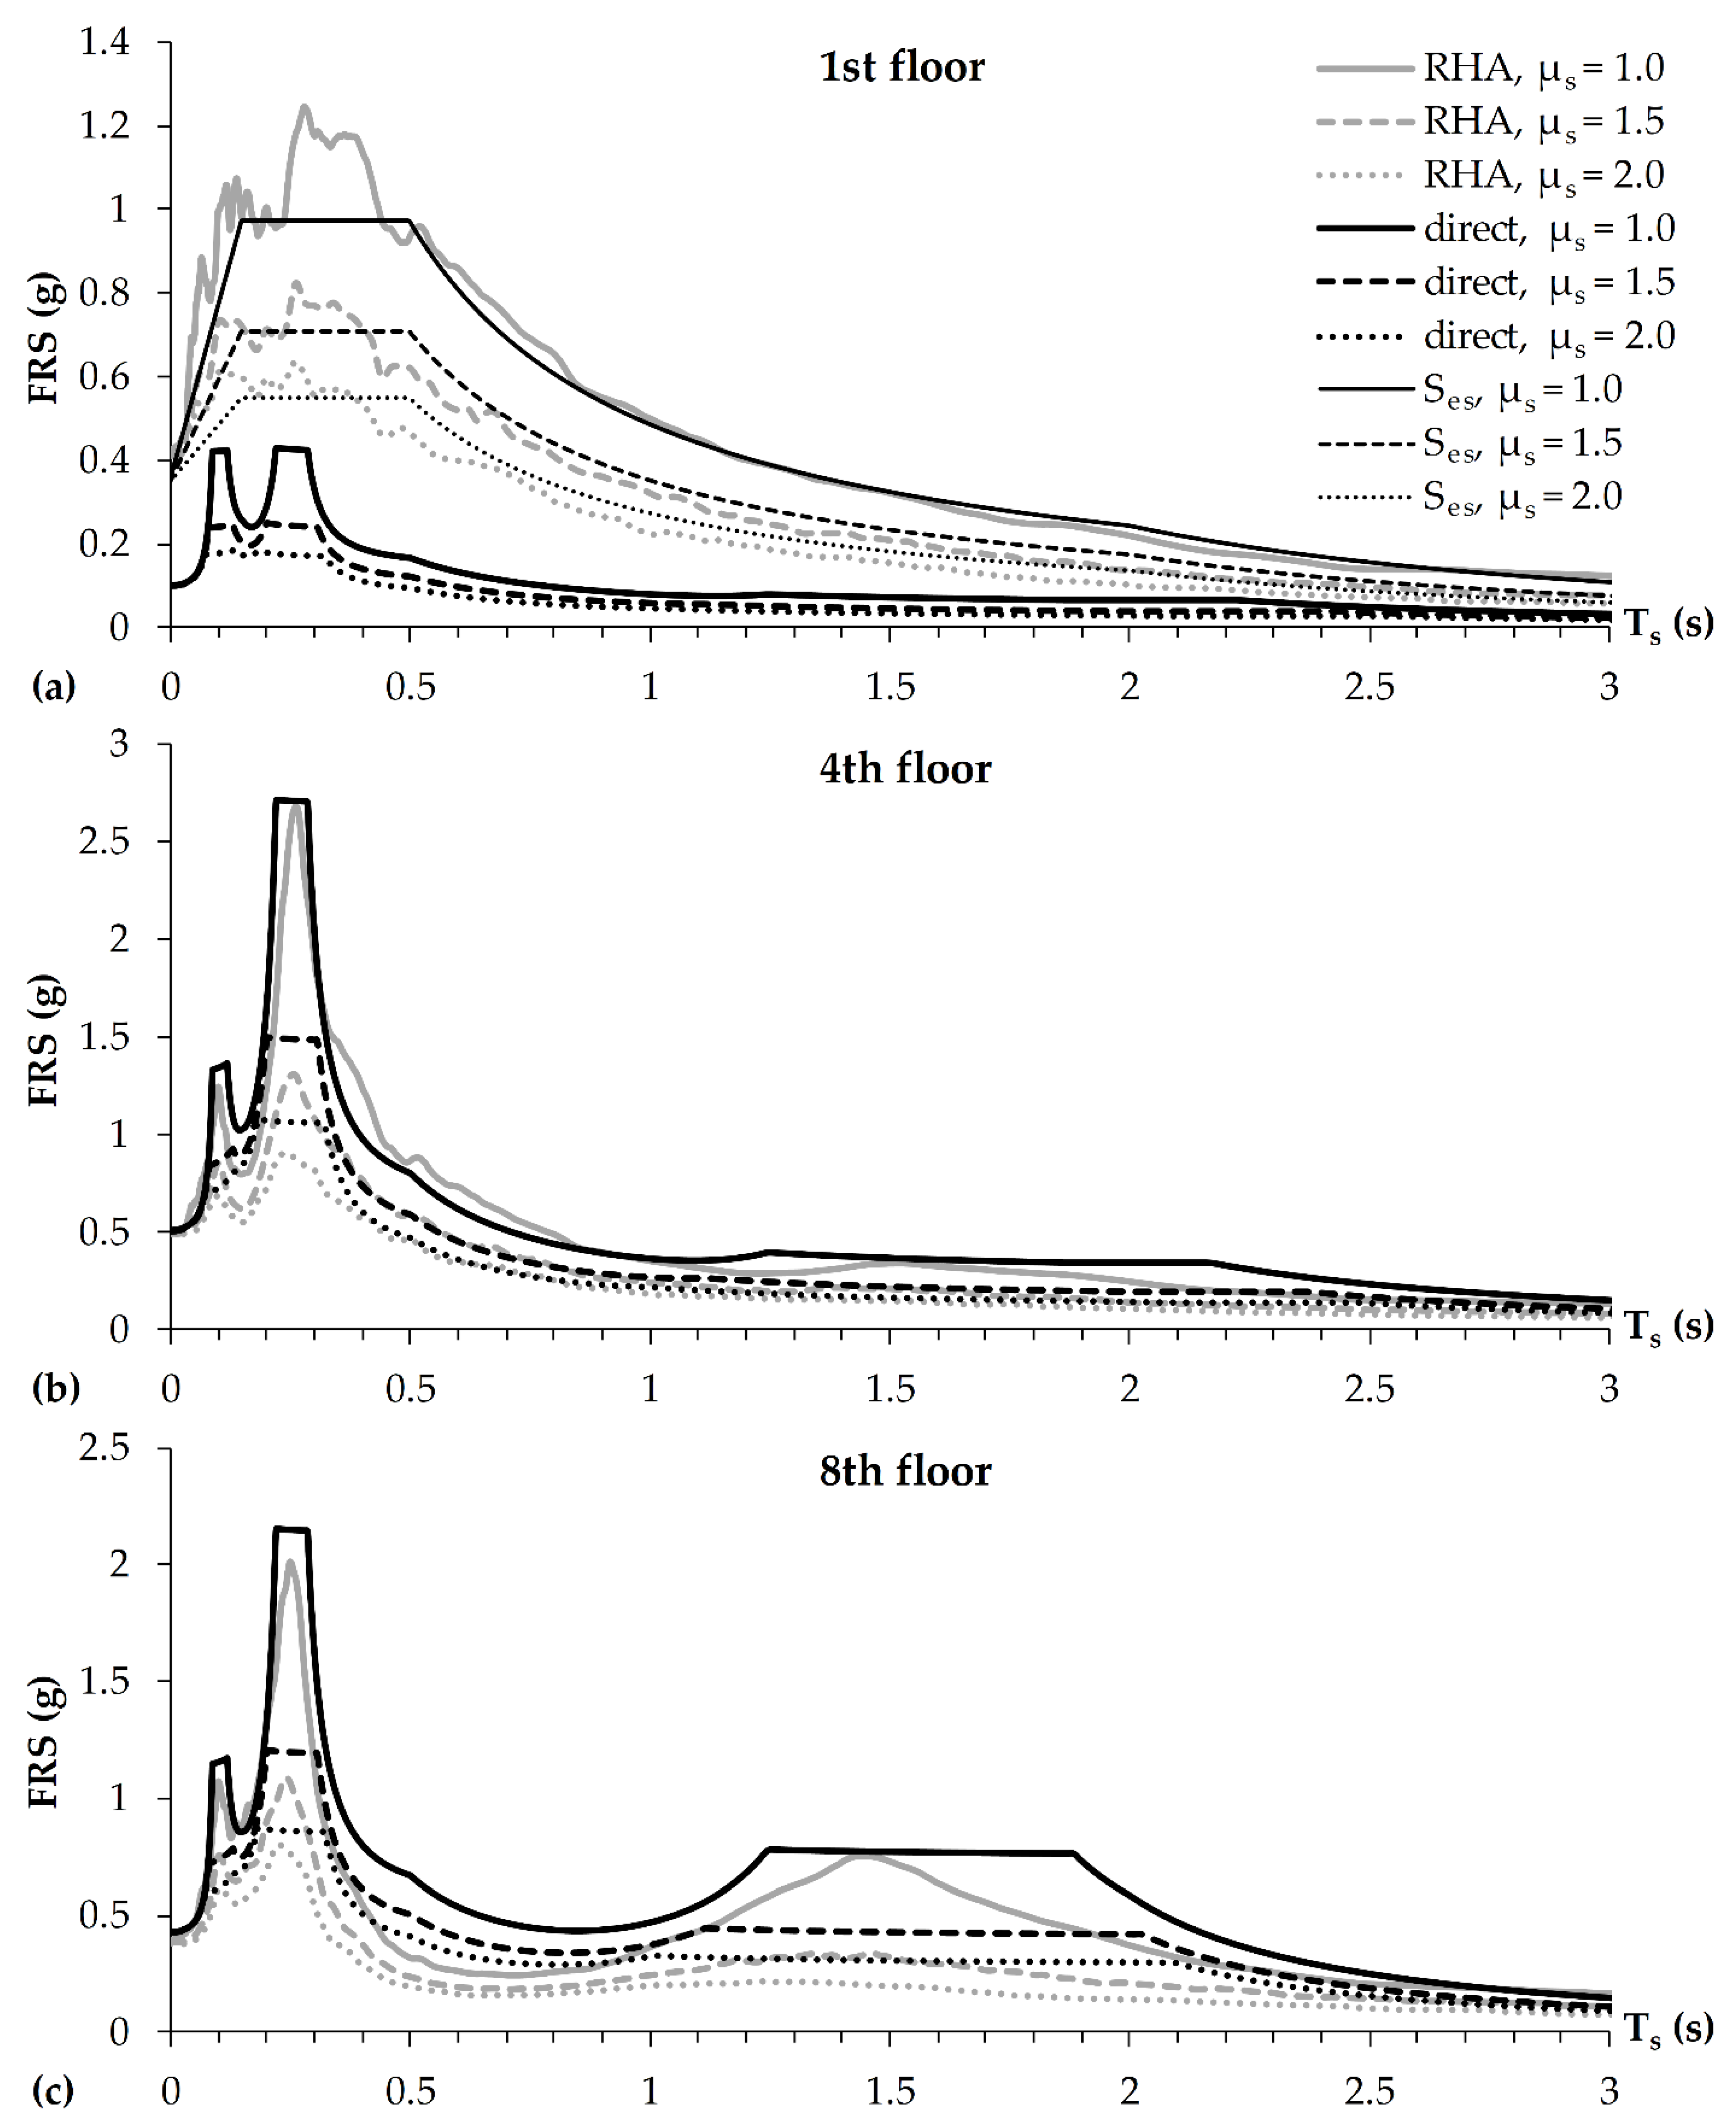
FRS obtained from the RHA and direct method are shown in Figure 5 and Figure 6 for characteristic floors. Both the RHA and direct results apply to the NSC damping ξs = 3% and to linear elastic (μs = 1.0) and nonlinear NSCs with ductility demands, μs, of 1.5 and 2.0. The results obtained from the RHA are denoted as “RHA, μs = 1.0”, “RHA, μs = 1.5” and “RHA, μs = 2.0”, and the corresponding results obtained from the direct method are denoted as “direct, μs = 1.0”, “direct, μs = 1.5” and “direct, μs = 2.0”. Besides FRS, in Figure 5, the input elastic ground response Eurocode 8 spectra used in the direct method for NSCs with ξs equal to 3, 10 and 20% corresponding to μs of 1.0, 1.5 and 2.0, respectively, are also shown at the 1st floor and are denoted as “Ses, μs = 1.0”, “Ses, μs = 1.5” and “Ses, μs = 2.0”, respectively. Note that in Figure 5 and Figure 6, the scales on the y axes are not unified, i.e., they are chosen so that the best visibility of the results is achieved.
Note that application of the Eurocode 8 spectra for the direct method input introduced a certain “error” in its results due to the fact that there is a difference between the mean spectrum of the selected ground motions and the Eurocode 8 spectrum used as the target. In other words, the accuracy of the direct method would be better if the mean spectra of the selected ground motions were used for the structure and NSCs as the input for the method. This was not done here since the method is intended for practical applications, in which engineers most commonly deal with code-defined spectra, instead of with mean spectra corresponding to a particular set of ground motions.
In Figure 5 the results obtained for the 1st, 4th and 8th floors are presented. The results obtained for the 1st floor confirm the findings and observations from the previous section in which the PFAs were studied, i.e., the direct method formulas produced FRS values too low for both the linear elastic and nonlinear NSCs. Again, the main reasons for this lie in the difference between the applied direct and RHA inputs, the fact that only three modes were taken into account, and the problems related to the application of the SRSS rule at lower floors. Setting of the elastic ground response spectrum used as the input for the lower limit of the FRS values produced very good results for the linear elastic and nonlinear NSCs. The differences between the RHA results and Ses values in the whole period range strongly resemble the differences between the mean and target spectra plotted in Figure 2. In other words, the non-conservatism of the Ses values, most pronounced in the case of the linear elastic NSCs, is a consequence of the difference between the applied inputs in the RHA and direct method and can therefore be considered as justified. By looking at the shape of the RHA FRS, the fact that the 1st floor is rather specific, which was outlined above, becomes quite obvious.
The results obtained for the 2nd floor were not shown here, but they were similar to the ones obtained for the 1st floor. Namely, when it comes to the RHA, the peaks related to higher modes were clearly visible, whereas the direct results improved in comparison to the 1st floor, i.e., the direct FRS values were larger and closer to the RHA and Ses values.
The results obtained for the 3rd floor (not presented here) showed similar trends to the ones obtained for the 4th floor, presented in Figure 5. From the RHA FRS peaks obtained at the 4th floor, it can be seen that the second mode dominated the response, followed by the third and first modes (respectively), for both linear elastic and nonlinear NSCs. It should be noted that, even though not strongly accentuated, the peaks related to the first mode can be observed in the case of the NSCs with ductility demands (μs) equal to 1.0 and 1.5 (the latter is not so obvious due to the figure size), whereas in the case when μs = 2.0, the peak cannot be seen. With the exception of very low values of Ts, the reduction of the FRS obtained for the nonlinear NSCs (comparing to the linear elastic ones) is quite obvious, especially in the resonance regions, and it increases with the increase of the ductility demand. This observation confirms findings of Vukobratović and Fajfar [22]. It can also be seen that even a small ductility demand of μs = 1.5 led to the significant reduction of the FRS peaks. The results of the direct method are in a very good agreement with the RHA results in all considered cases. In the case of the linear elastic NSCs, the direct FRS provided an excellent estimate of the spectral peaks for all modes, whereas in the case of the nonlinear NSCs, a slight conservatism can be observed in the resonance region of the second mode.
Practically, all observations related to the 4th floor also apply to the 5th, 6th and 7th floors (for which the results are not shown here), despite the fact that the direct PFAs overestimated the RHA ones (note that the PFA is not the only parameter that influences FRS). Even though similar can be said for the 8th floor as well, the obtained results are shown in Figure 5 because at the 8th floor the influence of the first mode starts to increase, and the influences of the higher modes start to reduce. In short, the peaks of the RHA FRS related to the first mode are now visible for all values of μs, noting that in the case of μs = 2.0 the peak is not strongly pronounced. Nonlinear behaviour of NSCs led to the beneficial reduction of FRS values in the same manner as commented above. The accuracy of the direct FRS again turned out to be very good in the whole period range.
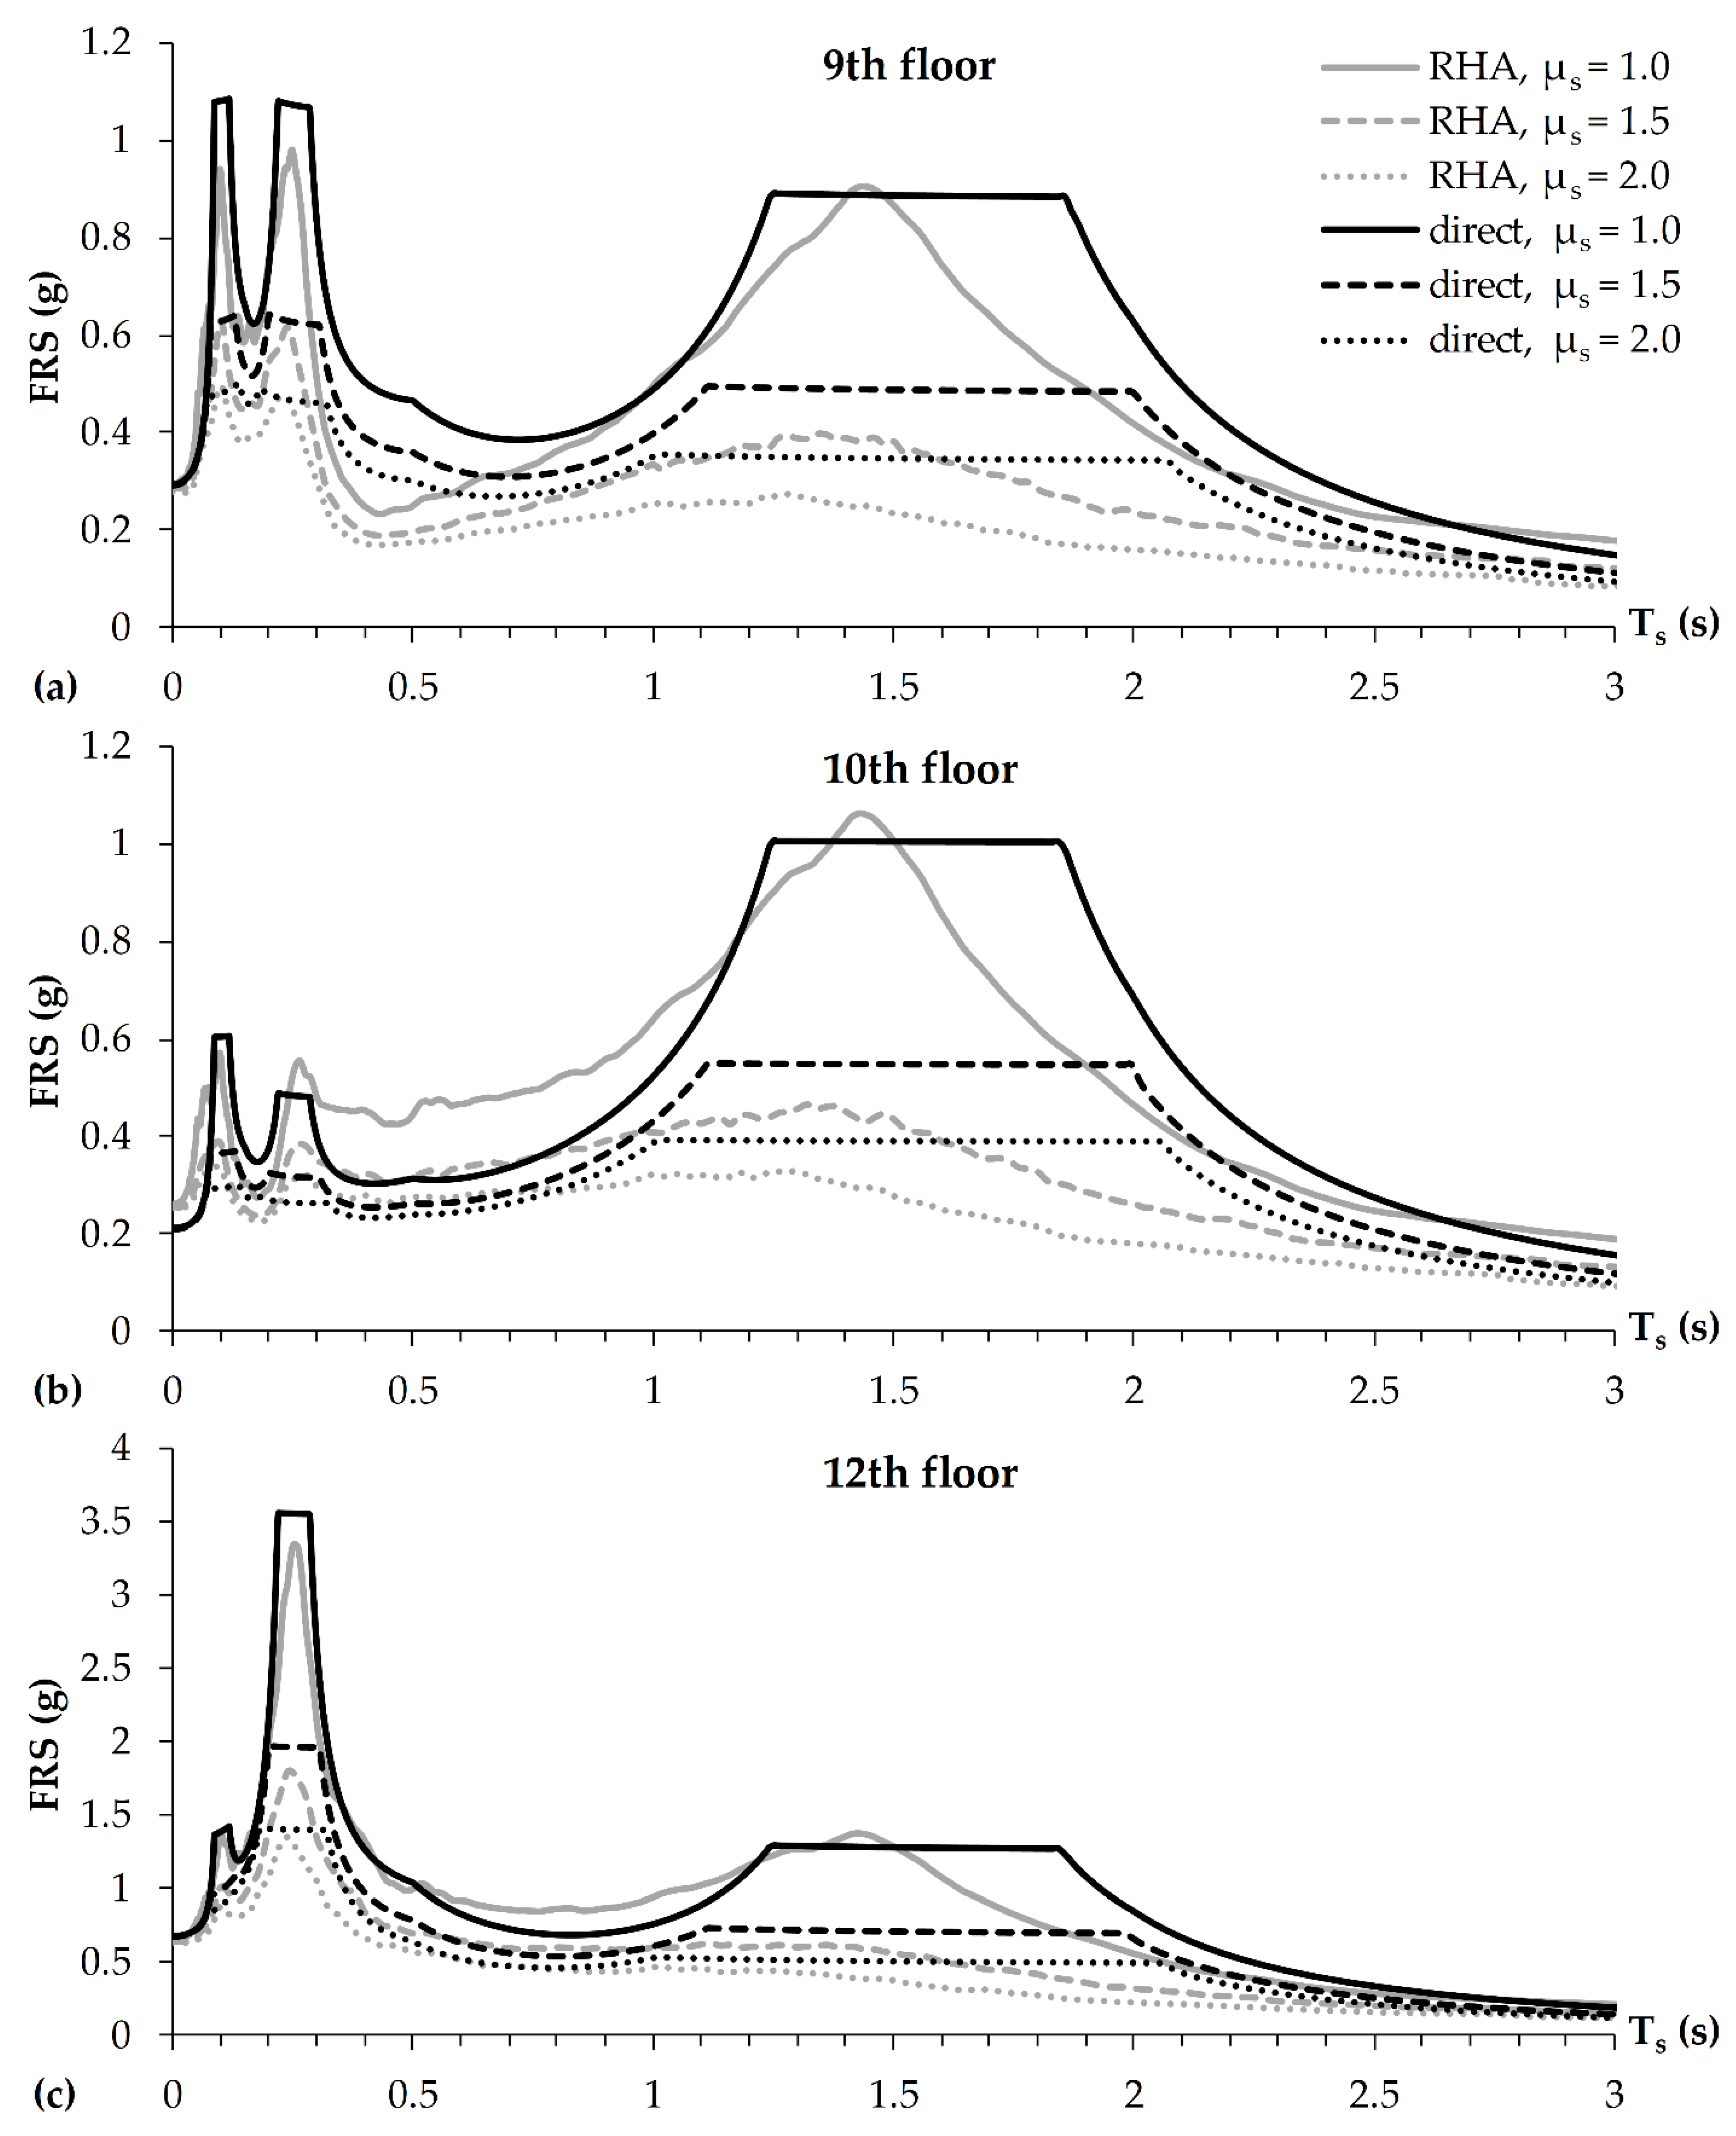
The results obtained for the 9th, 10th and 12th floors are shown in Figure 6. The sizes of the RHA FRS peaks obtained in the case of the 9th floor indicate that all modes have similar influence. In the case of the nonlinear NSCs, in an absolute manner, the peak reduction was the largest in the case of the first mode, whereas it was similar in the case of the second and third modes. The applied direct method provided a good estimate of the FRS in all cases, with somewhat larger conservatism in the resonance region of the first mode for the nonlinear NSCs, and in the region between resonances of the first two modes for both linear elastic and nonlinear NSCs.
The only floor at which the first mode dominated the response was the 10th floor, for which the results are presented in Figure 6. From the RHA FRS, it can be seen that in the case of the linear elastic NSCs, the size of the peak related to the first mode was approximately two times larger than the peaks related to the higher modes. In the case of the nonlinear NSCs with μs = 1.5, this difference was significantly smaller, whereas in the case when μs = 2.0, the peak values obtained for all modes were similar. When it comes to higher floors, the direct method produced the weakest results right on the 10th floor, especially in the period range between the resonances of the first and second modes, in which obvious non-conservatism is present in all considered cases.
The 11th floor (the results are not shown here) represented a “transition” between the 10th and 12th floors, in the true sense of the word. The influence of the first mode reduced, the influence of the second mode increased, and the influence of the third mode practically vanished. For all considered NSC ductility demands, the direct method led to results of a very good accuracy in the whole period range.
Finally, by judging the size of the RHA FRS peaks at the 12th floor (shown in Figure 6), it is obvious that the second mode is the most significant one, and that the influences of the first and third modes are similar. The obtained RHA results show similar trends as the ones obtained for the 8th floor, with noticeably larger FRS values in the whole period range. The results obtained from the direct method provided a very good estimate of the FRS in all cases, with slight non-conservatism present in the region between resonances of the first two modes for the linear elastic NSCs and negligible non-conservatism for the nonlinear NSCs with μs = 1.5.
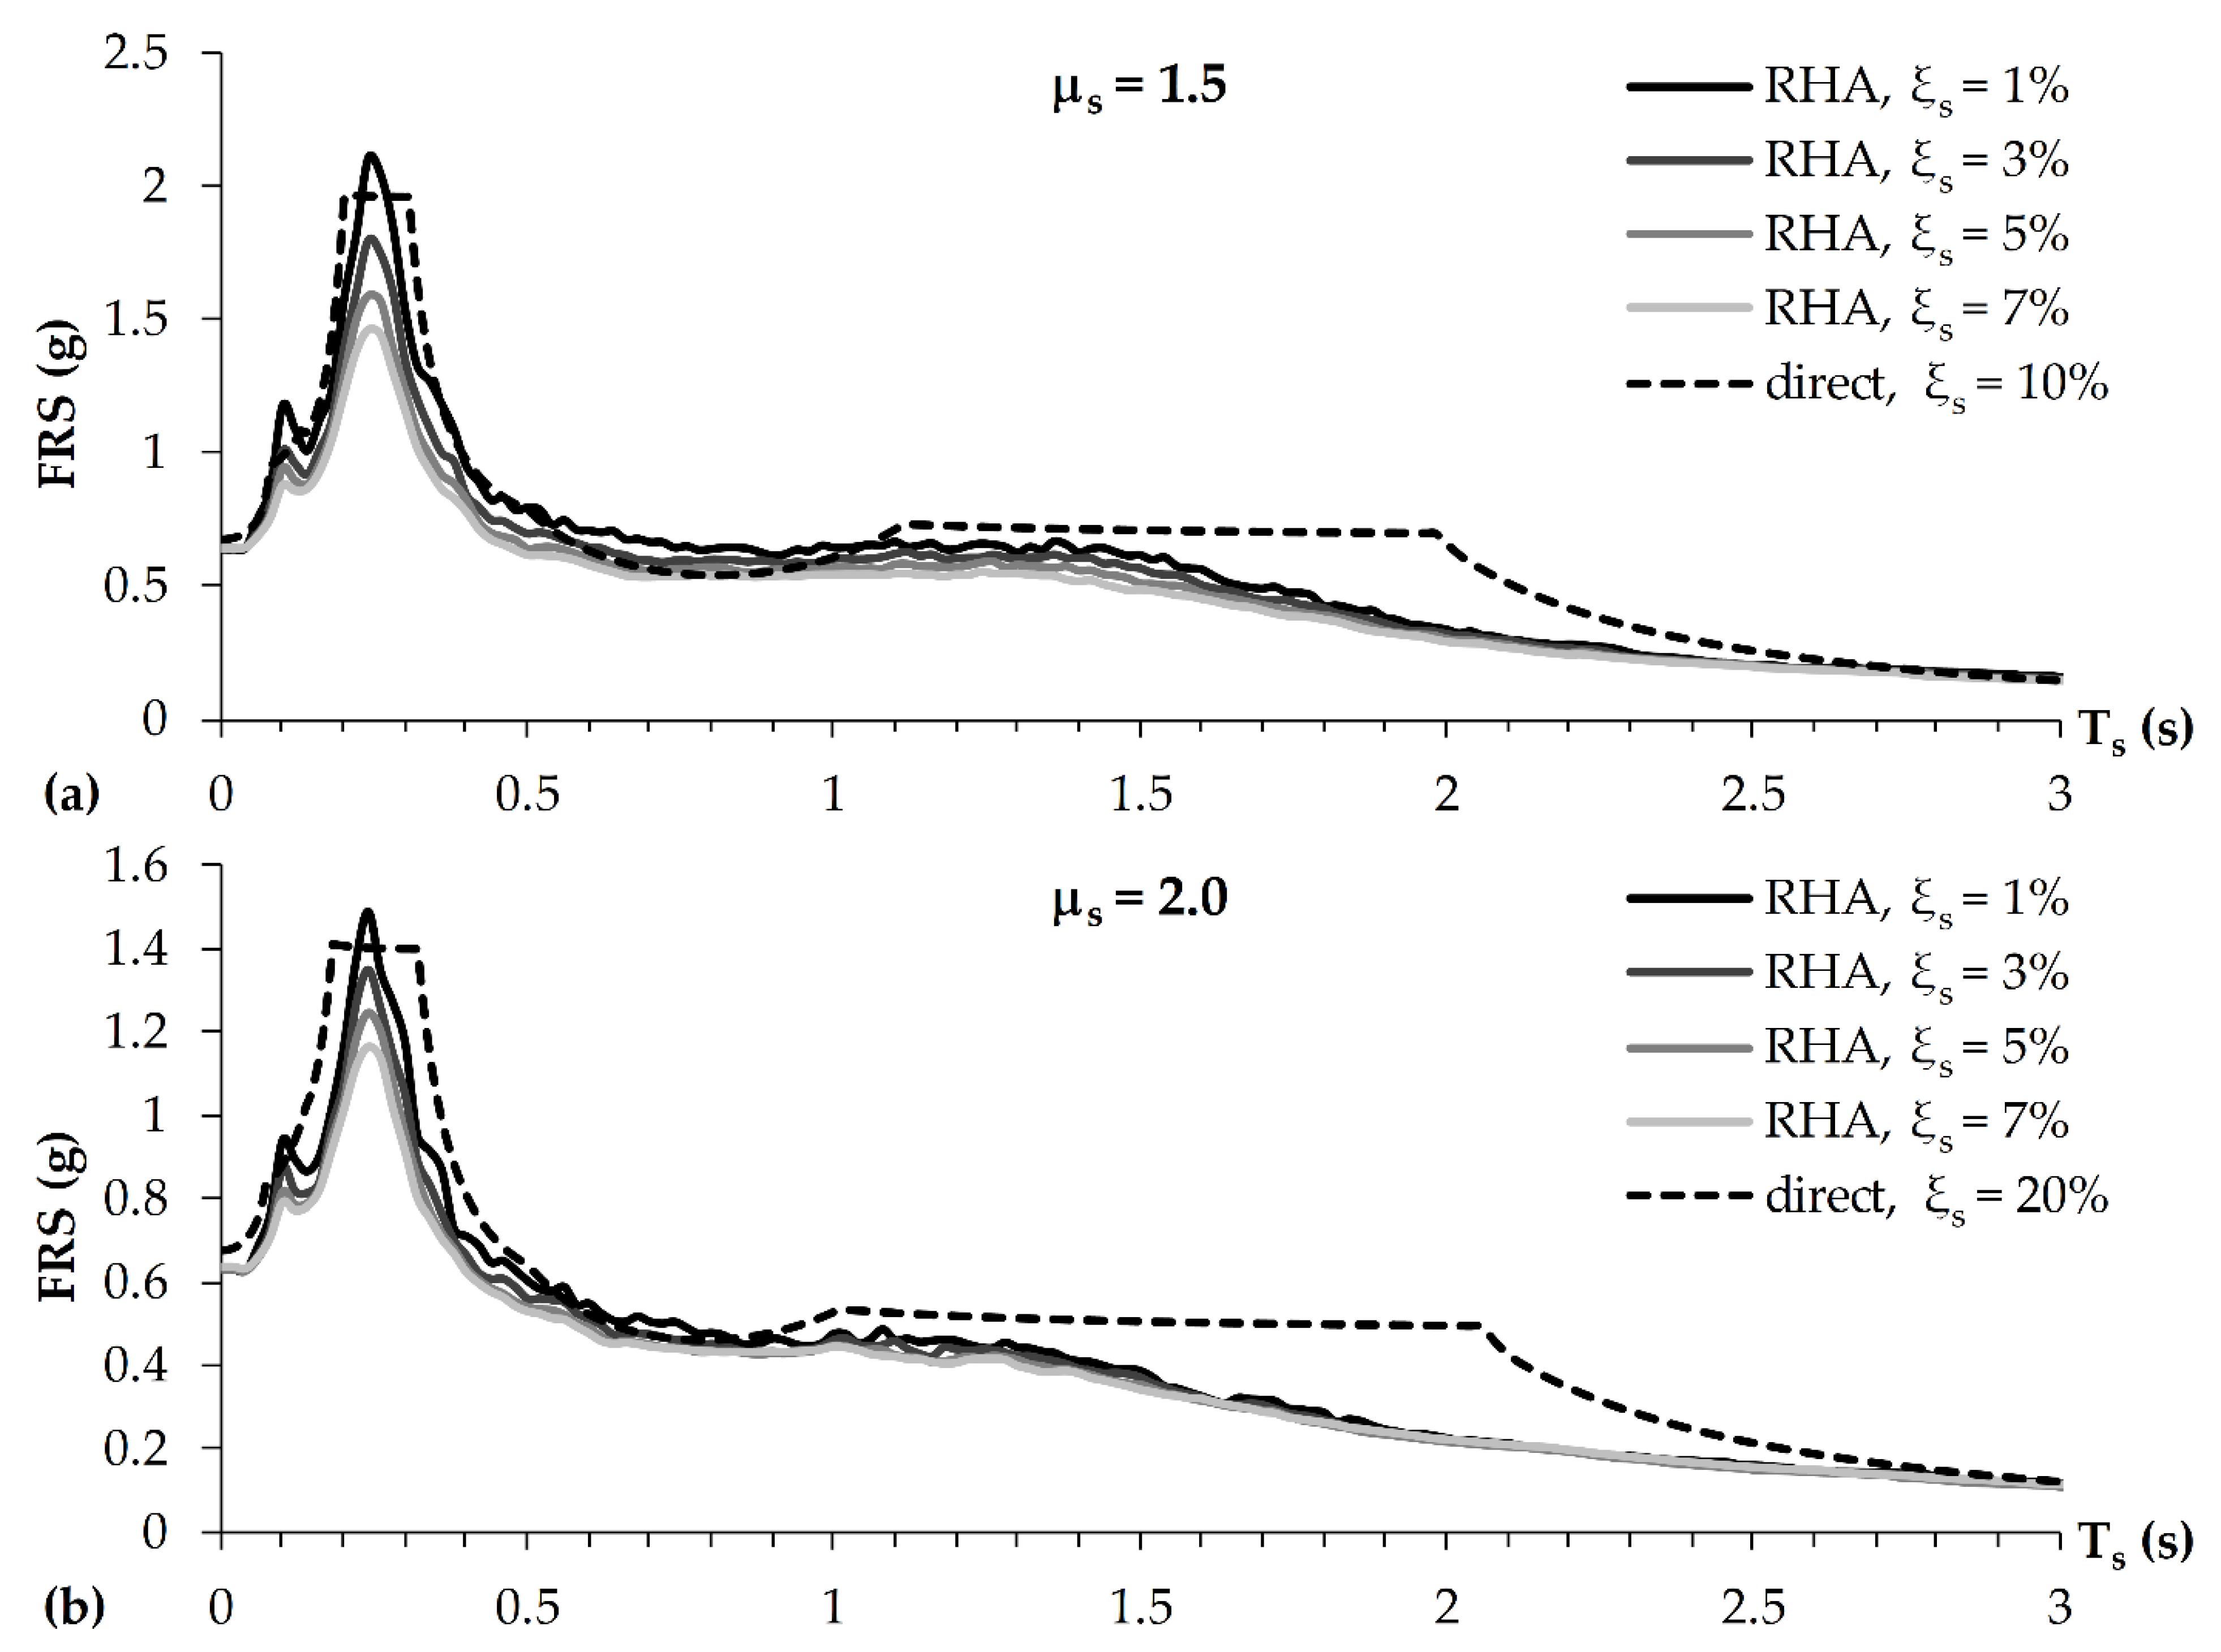
As mentioned in Section 3.3, the consideration of the nonlinear NSC behaviour through an equivalent (increased) damping adopted in the direct method is sometimes conservative. Selection of the equivalent damping values of 10 and 20% for the μs equal to 1.5 and 2.0 (respectively) was based on the results obtained for the actual NSC damping of 1% (see [22]). Practically, this means that an increase in actual damping values leads to an increased conservatism in the direct FRS. However, the level of conservatism can generally be characterized as acceptable. In order to support such a claim, the RHA FRS for the nonlinear NSCs with μs equal to 1.5 and 2.0 and damping values ξs equal to 1, 3, 5 and 7% obtained at the 12th floor are compared with the corresponding direct FRS. The results are shown in Figure 7, in which the notation follows the logic of the previous ones.
For the NSCs with μs = 1.5, the RHA results presented in Figure 7 indicate that an increase in actual damping led to the reduction of the FRS values mainly in the resonance regions of higher modes (especially the second one). This is even more obvious in the case of the NSCs with μs = 2.0, which confirms the well-known fact that an increase in the ductility demand reduces the influence of the actual damping. In the terms of accuracy, the direct method provided similar results for both considered ductility demands. It turns out that for ξs of 1%, the direct FRS slightly underestimate the peaks of RHA FRS related to higher modes and that there is some negligible non-conservatism in the period range between the resonance regions of the first and second modes for both considered ductility demands. The direct method provided somewhat conservative results in the period range corresponding to the second half of the plateau of the first mode resonance region, which is more obvious when μs = 2.0. With the exception of this conservatism, for both NSC ductility demands, the direct FRS are in a very good agreement with the RHA FRS obtained for ξs equal to 3%, as previously presented in Figure 6. As a matter of fact, the same actually applies to ξs of 5 and 7% as well, with some additional conservatism in the resonance region of the second mode (note that this additional conservatism is negligible in the rest of the period range).
The results presented in Figure 7 support the previous recommendation by Vukobratović and Fajfar [22], which states that, in the cases of nonlinear NSCs with ductility demands equal to 1.5 and 2.0, a good estimation of the RHA FRS values can be obtained by using the equivalent ξs values equal to 10 and 20% (respectively) in the direct method. Even though in the case of FRS values related to ξs ≠ 1% such assumption generally leads to conservative results, it may be regarded as acceptable, primarily due to the fact that in most practical cases it is hardly possible to make a reliable estimation of the NSC damping and ductility. While the damping values of common NSCs in nuclear power plants are provided in [40], there is a lack of practical guidelines for NSCs in ordinary buildings, for which ξs = 5% is usually chosen in practice. Some recent studies (see e.g., [41]) indicate that ξs values smaller than 5% should be used, which was taken into account in the study presented in this paper.
5. Conclusions
Results of the response-history analysis conducted on a code-designed twelve-storey reinforced concrete building consisting of uncoupled ductile cantilever shear walls were used for the investigation of the influences that higher structural vibration modes and nonlinearity of non-structural components have on floor acceleration demands. The applied seismic input consisted of thirty ground motion records, which were chosen to fit the target Eurocode 8 spectrum. Based on the assumption that the mass of non-structural components is at least a hundred times smaller than the structural mass, the absolute floor accelerations obtained from the building’s response were used as the seismic input for linear elastic and nonlinear non-structural components represented by single-degree-of-freedom systems.
The higher mode effects and the influence of nonlinear behaviour of non-structural components along the building height were examined on peak floor accelerations and floor response spectra, for whose direct determination the first author of this paper has recently co-developed a relatively simple code-oriented method. The application of the method was presented in a step-by-step manner, its accuracy was once again investigated and, in particular, the influence of the first three modes in one main direction was considered (second, fifth and eight modes, with reference to the dynamic behaviour in Y direction).
The distribution of peak floor accelerations indicated a strong influence of higher vibration modes (especially the second one) along the building height. As in some previous studies, it was observed that at the lowest floors, the input peak ground acceleration dictates the acceleration demands, while at higher storeys, peak floor accelerations can even be lower than it. It should be noted that the latter observation is not solely related to cantilevers but applies to high frames as well. Therefore, it can be treated as a general observation.
The study of floor response spectra led to the same observations regarding the mode influence. Very interesting results were obtained at the 1st floor, where floor spectra practically corresponded to the input ground motion spectra. It was observed from the size of spectral peaks that the second mode dominated the response along the height, i.e., the peaks related to the second mode were the largest at floors 2nd to 8th, 11th and 12th. The size of peaks obtained at the 9th floor indicated a similar influence of all modes, and it turned out that the only floor at which the fundamental mode dominated the response was the 10th floor. Interestingly, the lowest seismic demands were observed right at the 9th and 10th floors. The obtained results indicate that the ignorance of the influence of higher modes can lead to a serious underestimation of seismic demands in the case of non-structural components sensitive to accelerations.
With the exception of very low values of periods, the nonlinear behaviour of non-structural components, even with a low ductility demand of 1.5, led to a beneficial reduction of floor response spectra, especially in the resonance regions. As expected, the reduction increased with the increase in the ductility demand (in this paper, the ductility demand of 2.0 was also investigated). It was also shown that the increase in the ductility demand reduced the influence of the actual damping of the component. It is interesting to note that only at the 10th floor, where the response was dominated by the fundamental mode, it was observed that the ductility demand increase tended to eliminate the differences in the sizes of spectral peaks corresponding to individual modes. Namely, at this floor, the response contribution arising from the second mode is negligible compared to the one corresponding to the first mode. It should also be noted that a reliable estimation of the damping and ductility demand of non-structural components is not straightforward. The presented results obtained for different damping values and ductility demands provide a useful insight into the differences which may occur in practice.
For the building and range of non-structural components considered in this paper, the accuracy of the method for the direct determination of peak floor accelerations and floor response spectra, previously co-developed by the first author, turned out to be very good along the building height. Since the direct method (in its simplified form) has been recently incorporated into the draft of the new generation of Eurocode 8, this paper may serve as a useful guide for its future applications.
Author Contributions
Conceptualization, V.V. and S.R.; methodology, V.V. and S.R.; validation, V.V. and S.R.; investigation, V.V. and S.R.; writing—original draft preparation, V.V.; writing—review and editing, S.R. All authors have read and agreed to the published version of the manuscript.
Funding
The research presented in this article was partially funded by the Italian Department of Civil Protection in the framework of the national project DPC-ReLUIS 2019-2021.
Institutional Review Board Statement
Not applicable.
Informed Consent Statement
Not applicable.
Data Availability Statement
The data presented in this study are available on request from the corresponding author.
Acknowledgments
The research of the first author has been supported by the Ministry of Education, Science and Technological Development through the project no. 451-03-68/2020-14/200156: “Innovative scientific and artistic research from the FTS activity domain”.
Conflicts of Interest
The authors declare no conflict of interest.
References
- Petrone, C.; Magliulo, G.; Manfredi, G. Seismic demand on light acceleration-sensitive nonstructural components in European reinforced concrete buildings. Earthq. Eng. Struct. Dyn. 2015, 44, 1203–1217. [Google Scholar] [CrossRef]
- Petrone, C.; Magliulo, G.; Manfredi, G. Floor response spectra in RC frame structures designed according to Eurocode 8. Bull. Earthq. Eng. 2016, 14, 747–767. [Google Scholar] [CrossRef]
- Vukobratović, V.; Fajfar, P. A method for the direct determination of approximate floor response spectra for SDOF inelastic structures. Bull. Earthq. Eng. 2015, 13, 1405–1424. [Google Scholar] [CrossRef]
- Vukobratović, V.; Fajfar, P. A method for the direct estimation of floor acceleration spectra for elastic and inelastic MDOF structures. Earthq. Eng. Struct. Dyn. 2016, 45, 2495–2511. [Google Scholar] [CrossRef]
- Lucchini, A.; Franchin, P.; Mollaioli, F. Uniform hazard floor acceleration spectra for linear structures. Earthq. Eng. Struct. Dyn. 2017, 46, 1121–1140. [Google Scholar] [CrossRef]
- Kothari, P.; Parulekar, Y.M.; Reddy, G.R.; Gopalakrishnan, N. In-structure response spectra considering nonlinearity of RCC structures: Experiments and analysis. Nucl. Eng. Des. 2017, 322, 379–396. [Google Scholar] [CrossRef]
- Anajafi, H.; Medina, R.A. Evaluation of ASCE 7 equations for designing acceleration-sensitive nonstructural components using data from instrumented buildings. Earthq. Eng. Struct. Dyn. 2018, 47, 1075–1094. [Google Scholar] [CrossRef]
- Surana, M.; Singh, Y.; Lang, D.H. Floor Spectra of Inelastic RC Frame Buildings Considering Ground Motion Characteristics. J. Earthq. Eng. 2018, 22, 488–519. [Google Scholar] [CrossRef]
- Filiatrault, A.; Perrone, D.; Merino, R.J.; Calvi, G.M. Performance-based seismic design of nonstructural building elements. J. Earthq. Eng. 2018, 1–33. [Google Scholar] [CrossRef]
- Merino, R.J.; Perrone, D.; Filiatrault, A. Consistent floor response spectra for performance-based seismic design of non-structural elements. Earthq. Eng. Struct. Dyn. 2020, 49, 261–284. [Google Scholar] [CrossRef]
- Kazantzi, A.K.; Vamvatsikos, D.; Miranda, E. Evaluation of seismic acceleration demands on building nonstructural elements. ASCE J. Struct. Eng. 2020, 146, 1–15. [Google Scholar] [CrossRef]
- Gabbianelli, G.; Perrone, D.; Brunesi, E.; Monteiro, R. Seismic acceleration and displacement demand profiles of non-structural elements in hospital buildings. Buildings 2020, 10, 243. [Google Scholar] [CrossRef]
- Vukobratović, V. The Influence of Nonlinear Seismic Response of Structures on the Floor Acceleration Spectra. Ph.D. Thesis, University of Ljubljana, Ljubljana, Slovenia, 2015. Available online: http://drugg.fgg.uni-lj.si/5153/ (accessed on 10 November 2020).
- Kelly, T.E. Floor response of yielding structures. Bull. N. Z. Natl. Soc. Earth Eng. 1978, 11, 255–272. Available online: http://www.nzsee.org.nz/db/Bulletin/Archive/11(4)0255.pdf (accessed on 10 November 2020).
- Hadjian, A.H. Seismic response of structures by the response spectrum method. Nucl. Eng. Des. 1981, 66, 179–201. [Google Scholar] [CrossRef]
- Rodriguez, M.E.; Restrepo, J.I.; Carr, A.J. Earthquake-induced floor horizontal accelerations in buildings. Earthq. Eng. Struct. Dyn. 2002, 31, 693–718. [Google Scholar] [CrossRef]
- Viti, G.; Olivieri, M.; Travi, S. Development of non-linear floor response spectra. Nucl. Eng. Des. 1981, 64, 33–38. [Google Scholar] [CrossRef]
- Adam, C.; Fotiu, P.A. Dynamic analysis of inelastic primary-secondary systems. Eng. Struct. 2000, 22, 58–71. [Google Scholar] [CrossRef]
- Villaverde, R. Simple method to estimate the seismic nonlinear response of nonstructural components in buildings. Eng. Struct. 2006, 28, 1209–1221. [Google Scholar] [CrossRef]
- Chaudhuri, S.R.; Villaverde, R. Effect of building nonlinearity on seismic response of nonstructural components: A parametric study. ASCE J. Struct. Eng. 2008, 134, 661–670. [Google Scholar] [CrossRef]
- Tamura, I.; Matsuura, S.; Shimazu, R. Yield strength reduction factor of nonlinear SDOF systems on the supporting structures. In Proceedings of the ASME 2016 Pressure Vessels and Piping Conference (PVP 2016), Vancouver, BC, Canada, 17–21 July 2016. [Google Scholar] [CrossRef]
- Vukobratović, V.; Fajfar, P. Code-oriented floor acceleration spectra for building structures. Bull. Earthq. Eng. 2017, 15, 3013–3026. [Google Scholar] [CrossRef]
- Obando, J.C.; Lopez-Garcia, D. Inelastic displacement ratios for nonstructural components subjected to floor accelerations. J. Earthq. Eng. 2018, 22, 569–594. [Google Scholar] [CrossRef]
- Anajafi, H.; Medina, R.A.; Santini-Bell, E. Inelastic floor spectra for designing anchored acceleration-sensitive nonstructural components. Bull. Earthq. Eng. 2020, 18, 2115–2147. [Google Scholar] [CrossRef]
- Kazantzi, A.K.; Miranda, E.; Vamvatsikos, D. Strength-reduction factors for the design of light nonstructural elements in buildings. Earthq. Eng. Struct. Dyn. 2020, 49, 1329–1343. [Google Scholar] [CrossRef]
- Taghavi, S.; Miranda, E. Response spectrum method for estimation of peak floor acceleration demand. In Proceedings of the ATC and SEI Conference on Improving the Seismic Performance of Existing Buildings and Other Structures, San Francisco, CA, USA, 9–11 December 2009. [Google Scholar] [CrossRef] [Green Version]
- Pozzi, M.; Der Kiureghian, A. Response spectrum analysis for floor acceleration. Earthq. Eng. Struct. Dyn. 2015, 44, 2111–2127. [Google Scholar] [CrossRef]
- Eurocode 8. Design of structures for earthquake resistance—Part 1: General rules, seismic actions and rules for buildings. In European Standard EN 1998-1; European Committee for Standardization: Brussels, Belgium, 2004.
- Eurocode 2. Design of concrete structures—Part 1-1: General rules and rules for buildings. In European Standard EN 1992-1-1; European Committee for Standardization: Brussels, Belgium, 2004.
- ASCE 4-98. Seismic Analysis of Safety-Related Nuclear Structures and Commentary; American Society of Civil Engineers: Reston, VA, USA, 2000.
- Eurocode 8. Design of structures for earthquake resistance—Part 3: Assessment and retrofitting of buildings. In European Standard EN 1998-3; European Committee for Standardization: Brussels, Belgium, 2005.
- Ambraseys, N.; Smit, P.; Sigbjörnsson, R.; Suhadolc, P.; Margaris, B. Internet-Site for European Strong-Motion Data; European Commission, Research-Directorate General, Environment and Climate Programme: Brussels, Belgium, 2002; Available online: http://isesd.hi.is/ (accessed on 26 November 2020).
- Fajfar, P. Capacity spectrum method based on inelastic demand spectra. Earthq. Eng. Struct. Dyn. 1999, 28, 979–993. [Google Scholar] [CrossRef]
- Fajfar, P. A nonlinear analysis method for performance based seismic design. Earthq. Spectr. 2000, 16, 573–592. [Google Scholar] [CrossRef]
- Vidic, T.; Fajfar, P.; Fischinger, M. Consistent inelastic design spectra: Strength and displacement. Earthq. Eng. Struct. Dyn. 1994, 23, 507–521. [Google Scholar] [CrossRef]
- Sullivan, T.J.; Calvi, P.M.; Nascimbene, R. Towards improved floor spectra estimates for seismic design. Earthq. Struct. 2013, 4, 109–132. [Google Scholar] [CrossRef]
- Fajfar, P.; (University of Ljubljana, Ljubljana, Slovenia); Vukobratović, V.; (University of Novi Sad, Novi Sad, Serbia). Personal communication, 2018.
- Pinkawa, M.; Hoffmeister, B.; Feldmann, M. A critical review of current approaches on the determination of seismic force demands on nonstructural components. In Proceedings of the 9th International Conference on Structural Dynamics (EURODYN 2014), Porto, Portugal, 30 June–2 July 2014. [Google Scholar]
- U.S. Nuclear Regulatory Commission. Combining modal responses and spatial components in seismic response analysis. In Regulatory Guide 1.92; U.S. Nuclear Regulatory Commission: Washington, DC, USA, 2006. [Google Scholar]
- U.S. Nuclear Regulatory Commission. Damping values for seismic design of nuclear power plants. In Regulatory Guide 1.61; U.S. Nuclear Regulatory Commission: Washington, DC, USA, 2007. [Google Scholar]
- Phipps, M.; Gillengerten, J.; Lizundia, B.; Medina, R.; Miranda, E.; Pekelnicky, R. Improved seismic design of nonstructural components and systems (ATC-120). In Proceedings of the SEAOC 2017 Convention, San Diego, CA, USA, 13–15 September 2017. [Google Scholar]
Figure 1.
Plan of the considered twelve-storey RC building (dimensions in cm).

Figure 2.
Elastic acceleration spectra of individual records, their mean spectrum and the target Eurocode 8 spectrum (all obtained for 5% damping).
Figure 2.
Elastic acceleration spectra of individual records, their mean spectrum and the target Eurocode 8 spectrum (all obtained for 5% damping).

Figure 3.
Results of the N2 method: (a) calculated and idealized pushover curves (MDOF system) and (b) capacity diagram, demand spectrum and displacement demand (SDOF system).
Figure 3.
Results of the N2 method: (a) calculated and idealized pushover curves (MDOF system) and (b) capacity diagram, demand spectrum and displacement demand (SDOF system).

Figure 4.
(a) PFAs from the direct method and (b) a comparison of the PFAs from the direct method and RHA.
Figure 4.
(a) PFAs from the direct method and (b) a comparison of the PFAs from the direct method and RHA.

Figure 5.
A comparison of FRS from the RHA and direct method for the 1st (a), 4th (b) and 8th (c) floors and input elastic ground response spectra used in the direct method (shown only at the 1st floor).
Figure 5.
A comparison of FRS from the RHA and direct method for the 1st (a), 4th (b) and 8th (c) floors and input elastic ground response spectra used in the direct method (shown only at the 1st floor).

Figure 6.
A comparison of FRS from the RHA and direct method for the 9th (a), 10th (b) and 12th (c) floors.
Figure 6.
A comparison of FRS from the RHA and direct method for the 9th (a), 10th (b) and 12th (c) floors.

Figure 7.
A comparison of FRS from the RHA and direct method obtained at the 12th floor for the nonlinear non-structural components (NSCs) with μs = 1.5 (a) and μs = 2.0 (b), and various damping values.
Figure 7.
A comparison of FRS from the RHA and direct method obtained at the 12th floor for the nonlinear non-structural components (NSCs) with μs = 1.5 (a) and μs = 2.0 (b), and various damping values.


Table 1.
Periods of vibration (T) and effective mass ratios (MX and MY) for the first nine modes.
| Mode | T (s) | MX (%) | MY (%) |
|---|---|---|---|
| 1X | 1.52 | 64.5 | 0 |
| 2Y | 1.45 | 0 | 64.6 |
| 3torsion | 1.21 | 0 | 0 |
| 4X | 0.26 | 20.6 | 0 |
| 5Y | 0.25 | 0 | 20.6 |
| 6torsion | 0.21 | 0 | 0 |
| 7X | 0.10 | 7.2 | 0 |
| 8Y | 0.10 | 0 | 7.0 |
| 9torsion | 0.08 | 0 | 0 |
Table 2.
Periods of vibration (Tp,i), mode shapes (ϕij) and modal participation factors (Γi).
| Mode (i) | 1 (elastic) | 2 (elastic) | 3 (elastic) | 1 (nonlinear) |
|---|---|---|---|---|
| Tp,i (s) | 1.45 | 0.25 | 0.10 | 1.54 |
| ϕi1 | 0.01 | −0.11 | 0.36 | 0.04 |
| ϕi2 | 0.05 | −0.32 | 0.82 | 0.10 |
| ϕi3 | 0.10 | −0.55 | 1.11 | 0.16 |
| ϕi4 | 0.17 | −0.76 | 1.06 | 0.24 |
| ϕi5 | 0.25 | −0.89 | 0.66 | 0.32 |
| ϕi6 | 0.34 | −0.91 | 0.05 | 0.41 |
| ϕi7 | 0.44 | −0.82 | −0.55 | 0.51 |
| ϕi8 | 0.55 | −0.60 | −0.92 | 0.60 |
| ϕi9 | 0.66 | −0.28 | −0.91 | 0.70 |
| ϕi10 | 0.77 | 0.11 | −0.50 | 0.80 |
| ϕi11 | 0.89 | 0.55 | 0.20 | 0.90 |
| ϕi12 | 1.0 | 1.0 | 1.0 | 1.0 |
| Γi | 1.47 | −0.70 | 0.35 | 1.47 |
Table 3.
Values in the elastic acceleration spectrum (Sep,i), reduction factors (Rµ) for each mode, and individual and combined values of peak floor accelerations (PFAs) at each floor.
Table 3.
Values in the elastic acceleration spectrum (Sep,i), reduction factors (Rµ) for each mode, and individual and combined values of peak floor accelerations (PFAs) at each floor.
| Mode (i) | 1 | 2 | 3 | SRSS Comb. |
|---|---|---|---|---|
| Sep,i (g) | 0.28 | 0.87 | 0.57 | - |
| Rµ | 1.9 | 1.0 | 1.0 | - |
| PFAi1 (g) | 0.01 | 0.07 | 0.07 | 0.10 |
| PFAi2 (g) | 0.02 | 0.19 | 0.16 | 0.25 |
| PFAi3 (g) | 0.03 | 0.33 | 0.22 | 0.40 |
| PFAi4 (g) | 0.05 | 0.46 | 0.21 | 0.51 |
| PFAi5 (g) | 0.07 | 0.54 | 0.13 | 0.56 |
| PFAi6 (g) | 0.09 | 0.55 | 0.01 | 0.56 |
| PFAi7 (g) | 0.11 | 0.50 | −0.11 | 0.52 |
| PFAi8 (g) | 0.13 | 0.37 | −0.18 | 0.43 |
| PFAi9 (g) | 0.15 | 0.17 | −0.18 | 0.29 |
| PFAi10 (g) | 0.17 | −0.07 | −0.10 | 0.21 |
| PFAi11 (g) | 0.19 | −0.33 | 0.04 | 0.38 |
| PFAi12 (g) | 0.22 | −0.61 | 0.20 | 0.68 |
Publisher’s Note: MDPI stays neutral with regard to jurisdictional claims in published maps and institutional affiliations. |
© 2021 by the authors. Licensee MDPI, Basel, Switzerland. This article is an open access article distributed under the terms and conditions of the Creative Commons Attribution (CC BY) license (http://creativecommons.org/licenses/by/4.0/).
Share and Cite
MDPI and ACS Style
Vukobratović, V.; Ruggieri, S. Floor Acceleration Demands in a Twelve-Storey RC Shear Wall Building. Buildings 2021, 11, 38. https://doi.org/10.3390/buildings11020038
AMA Style
Vukobratović V, Ruggieri S. Floor Acceleration Demands in a Twelve-Storey RC Shear Wall Building. Buildings. 2021; 11(2):38. https://doi.org/10.3390/buildings11020038
Chicago/Turabian StyleVukobratović, Vladimir, and Sergio Ruggieri. 2021. "Floor Acceleration Demands in a Twelve-Storey RC Shear Wall Building" Buildings 11, no. 2: 38. https://doi.org/10.3390/buildings11020038
Note that from the first issue of 2016, this journal uses article numbers instead of page numbers. See further details here.