
Numerical Simulation of Single-Point Mount PZT-Interface for Admittance-Based Anchor Force Monitoring


 ,
, 
 and
and
Abstract
:1. Introduction
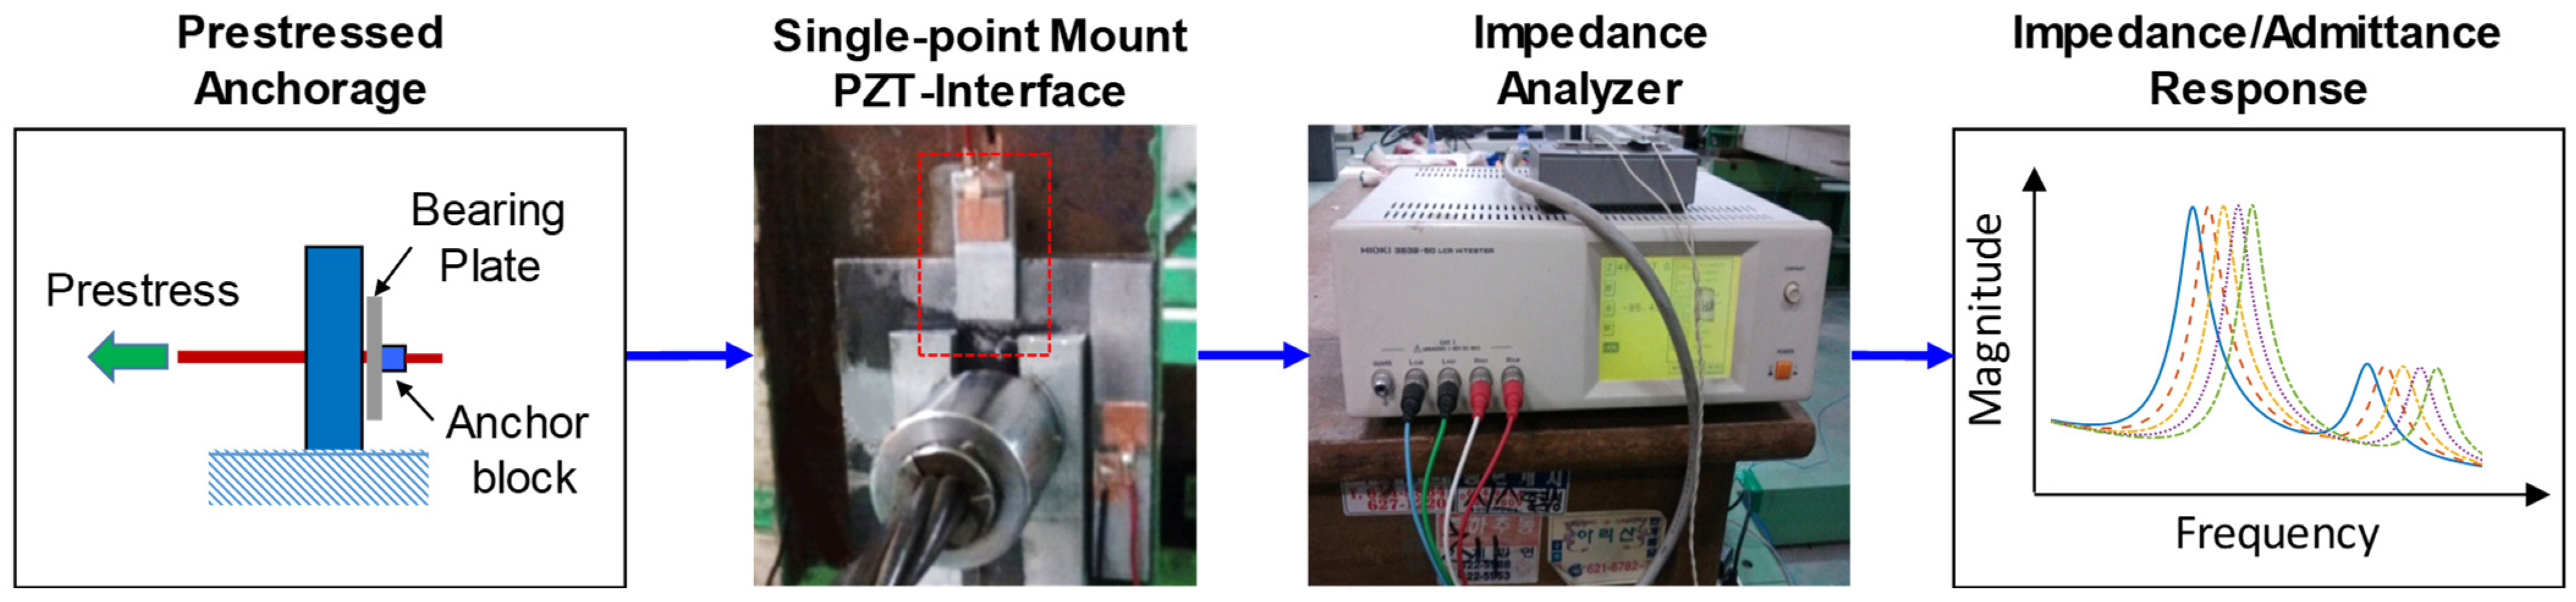
2. Admittance-Based Anchor Force Monitoring Method
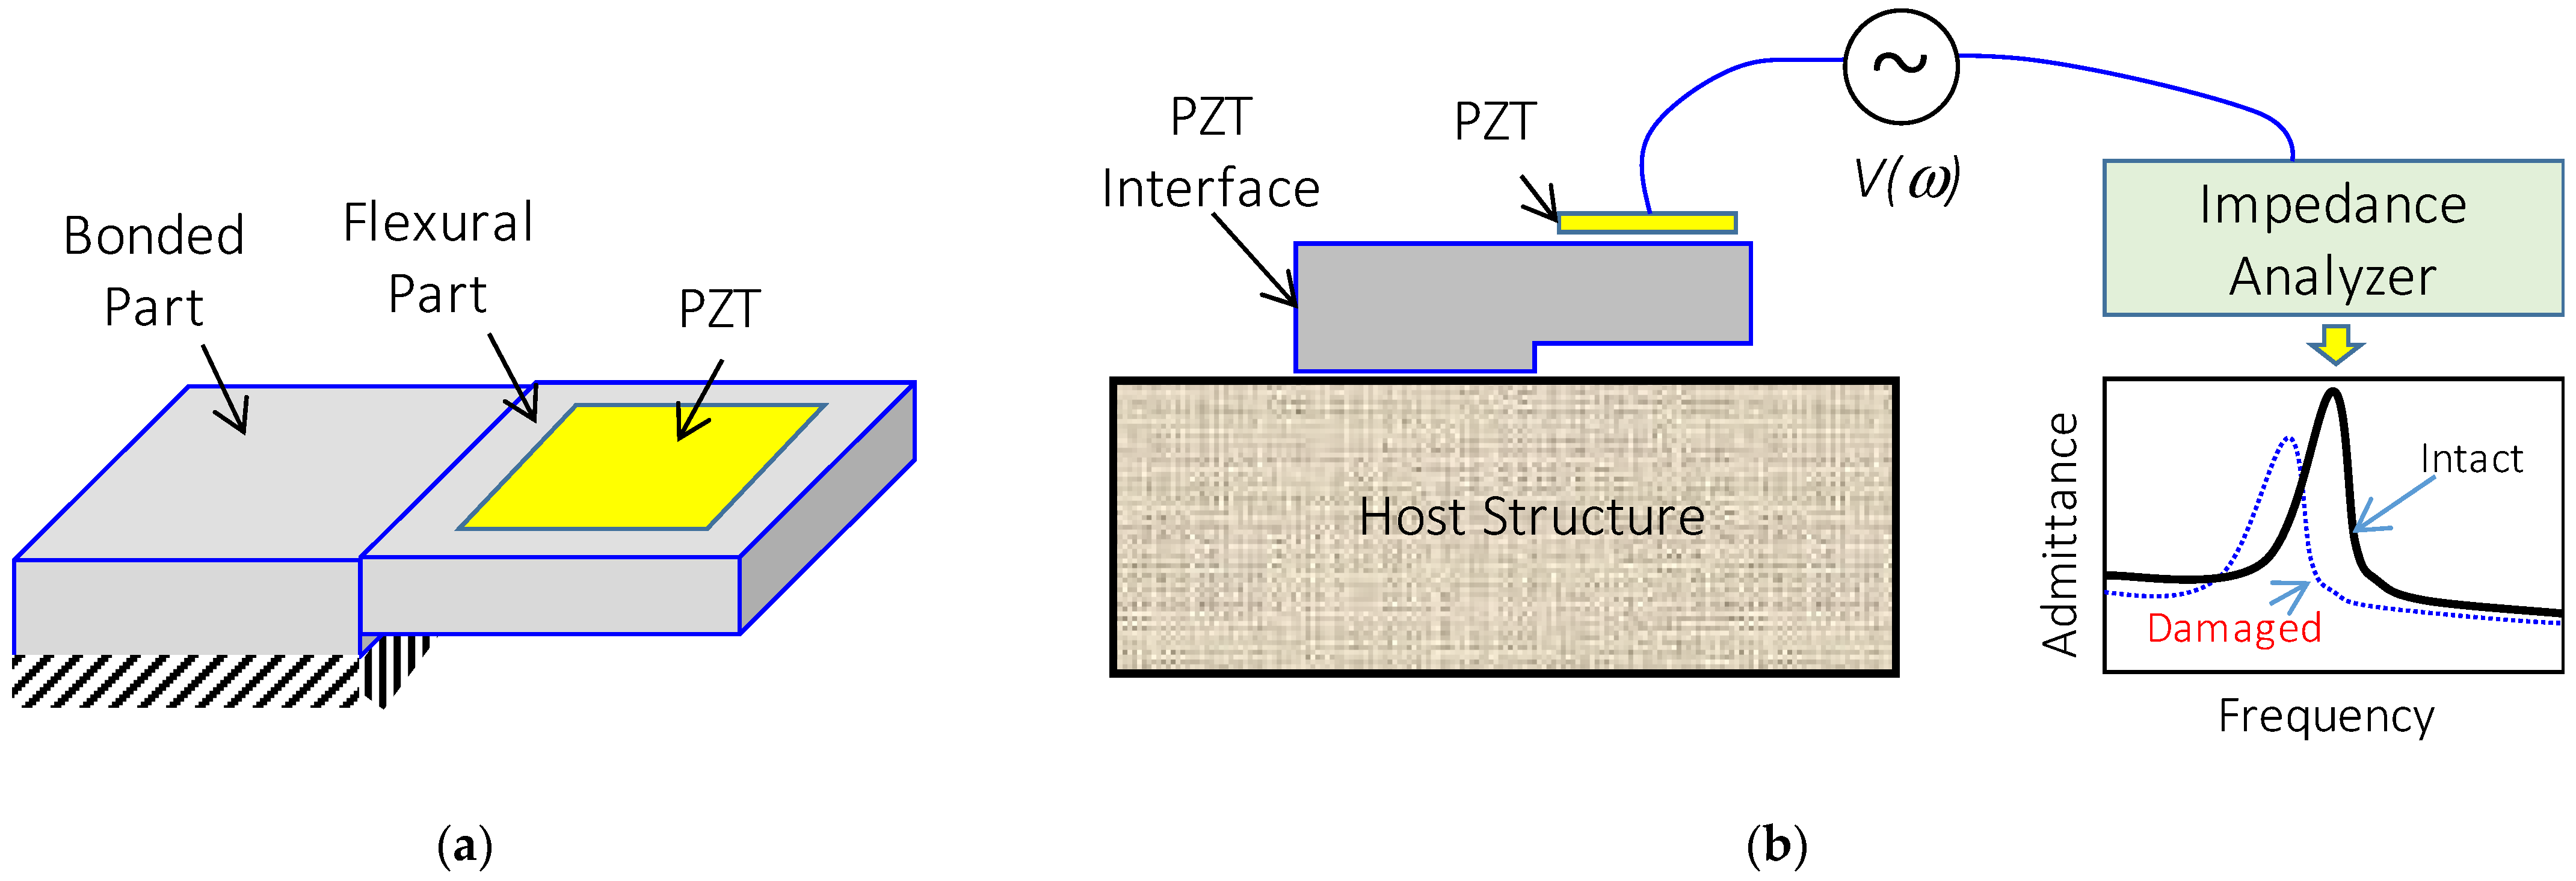
2.1. Prototype of Single-Point Mount PZT Interface
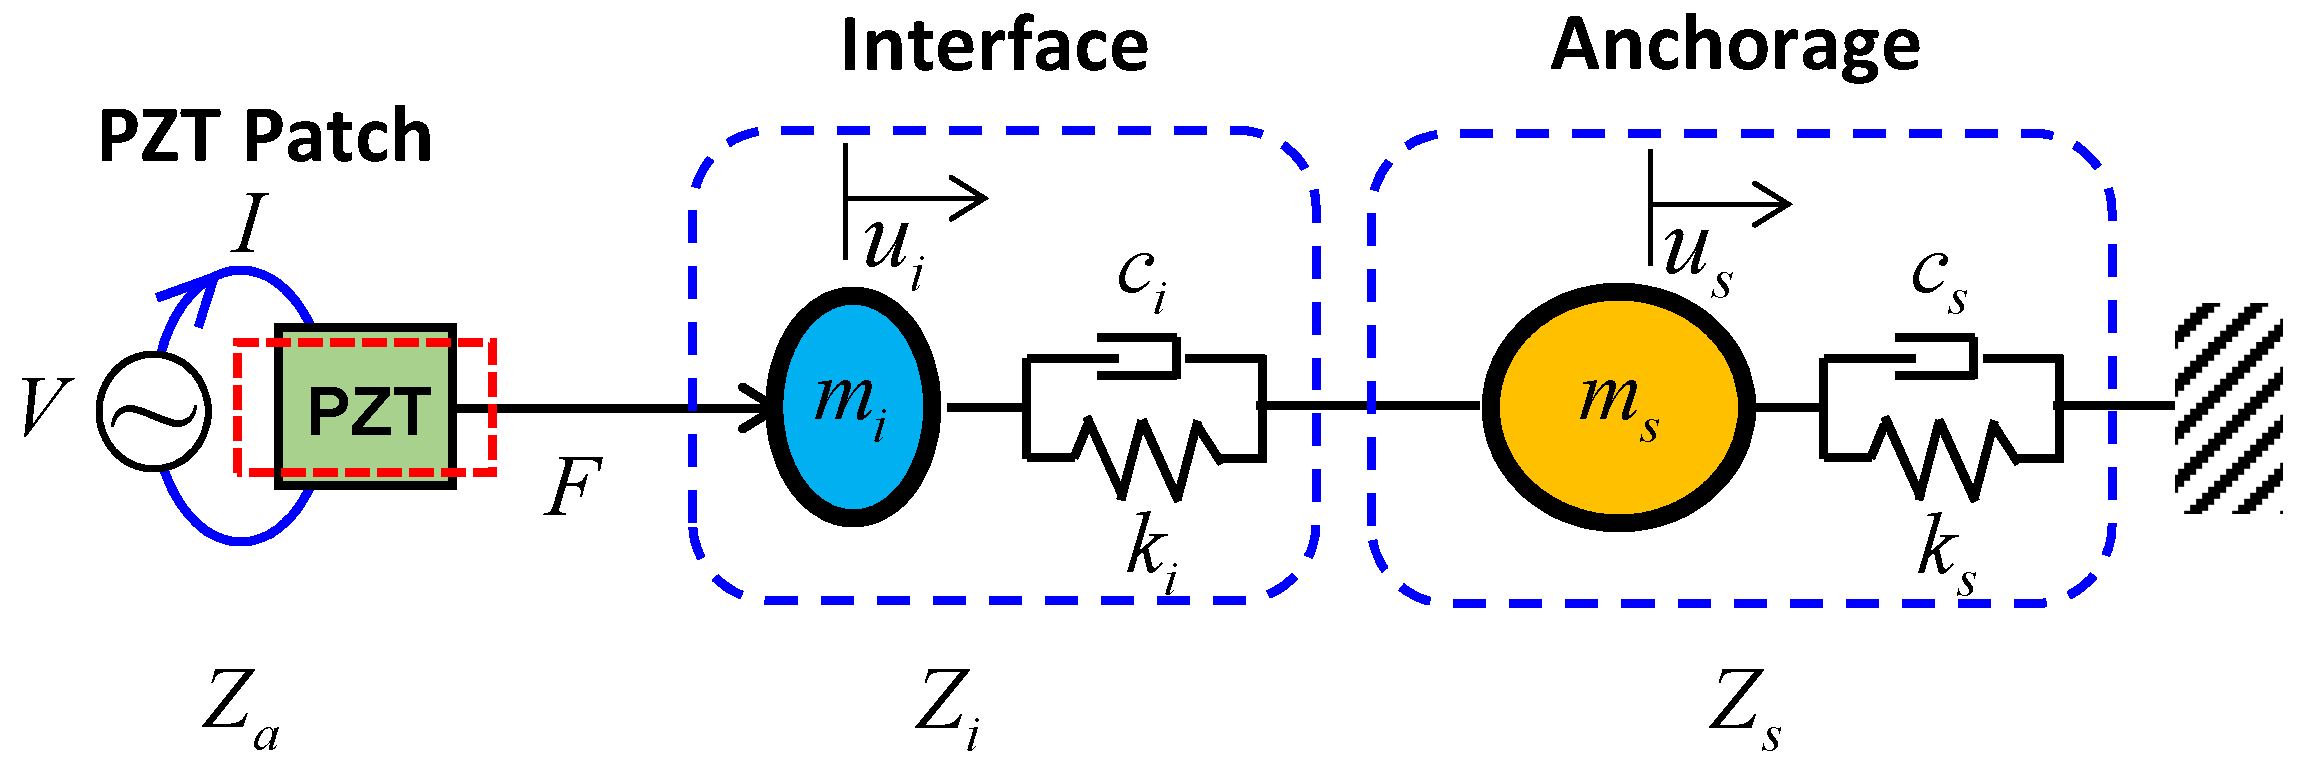
2.2. Admittance Signature of Single-Point Mount PZT Interface
2.3. Anchor Force Monitoring Approach Using Admittance Signature
3. Numerical Simulation
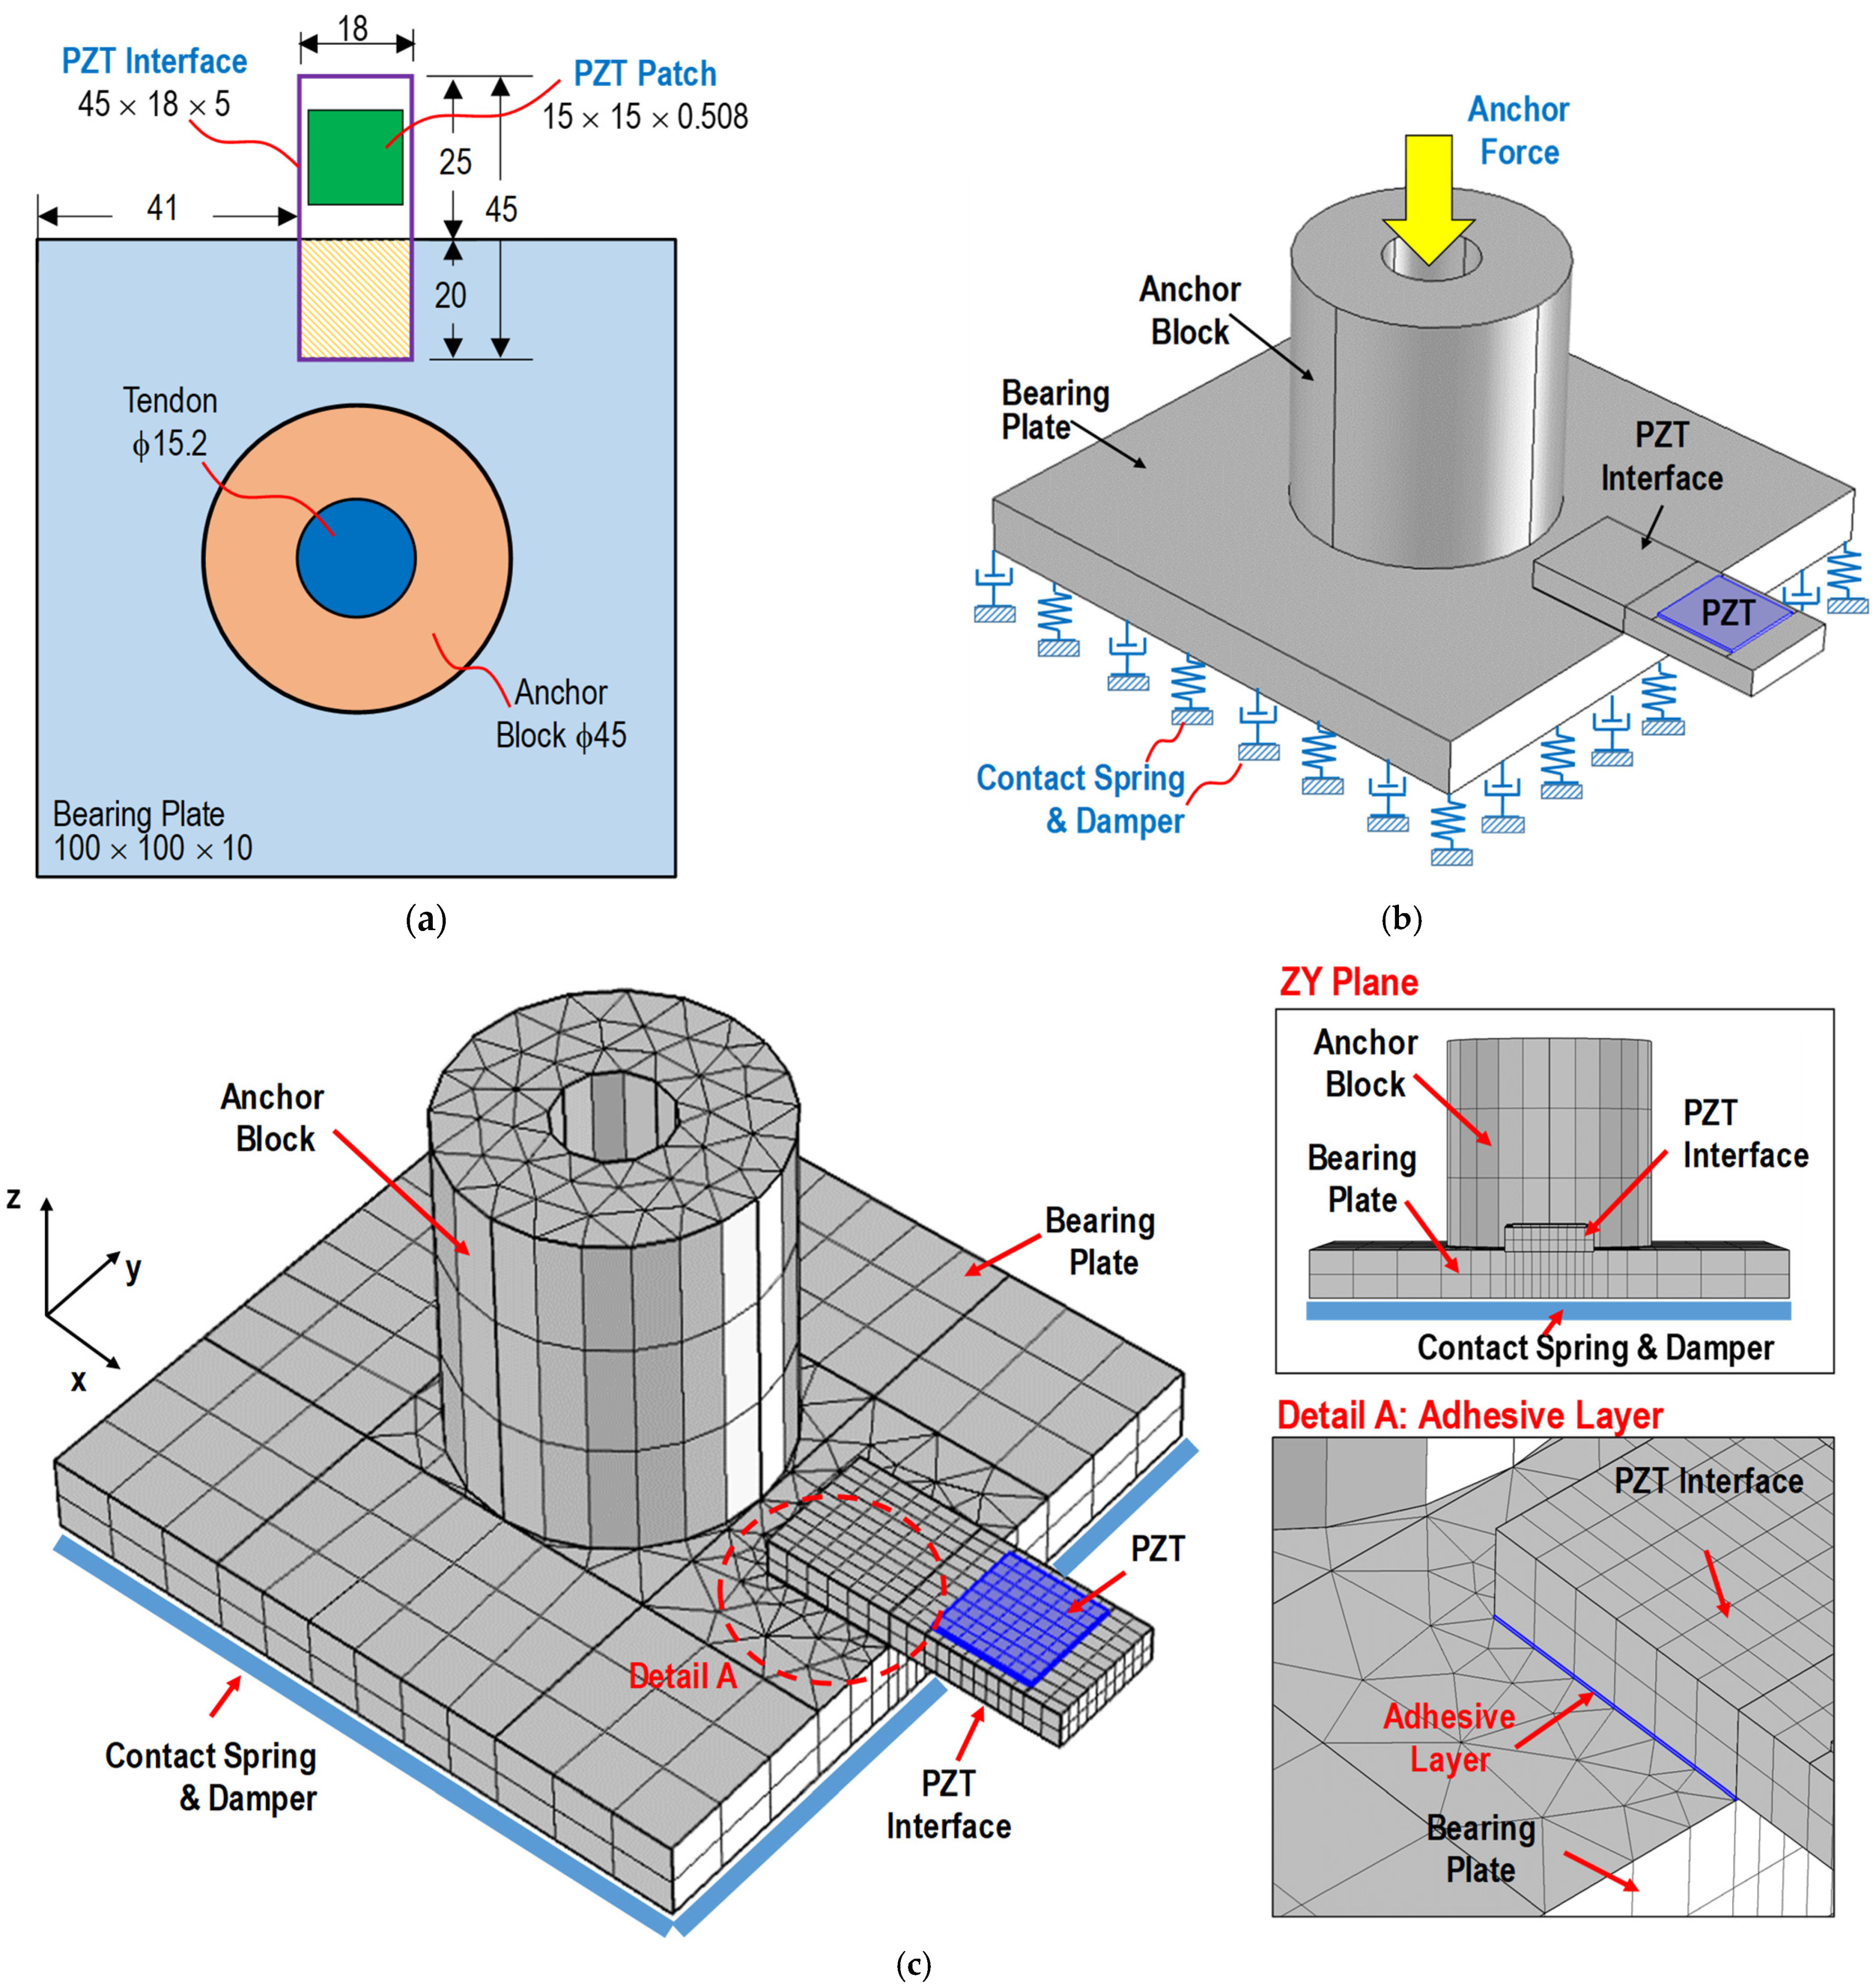
3.1. Finite Element Model of Single-Point Mount PZT Interface on Prestressed Anchorage
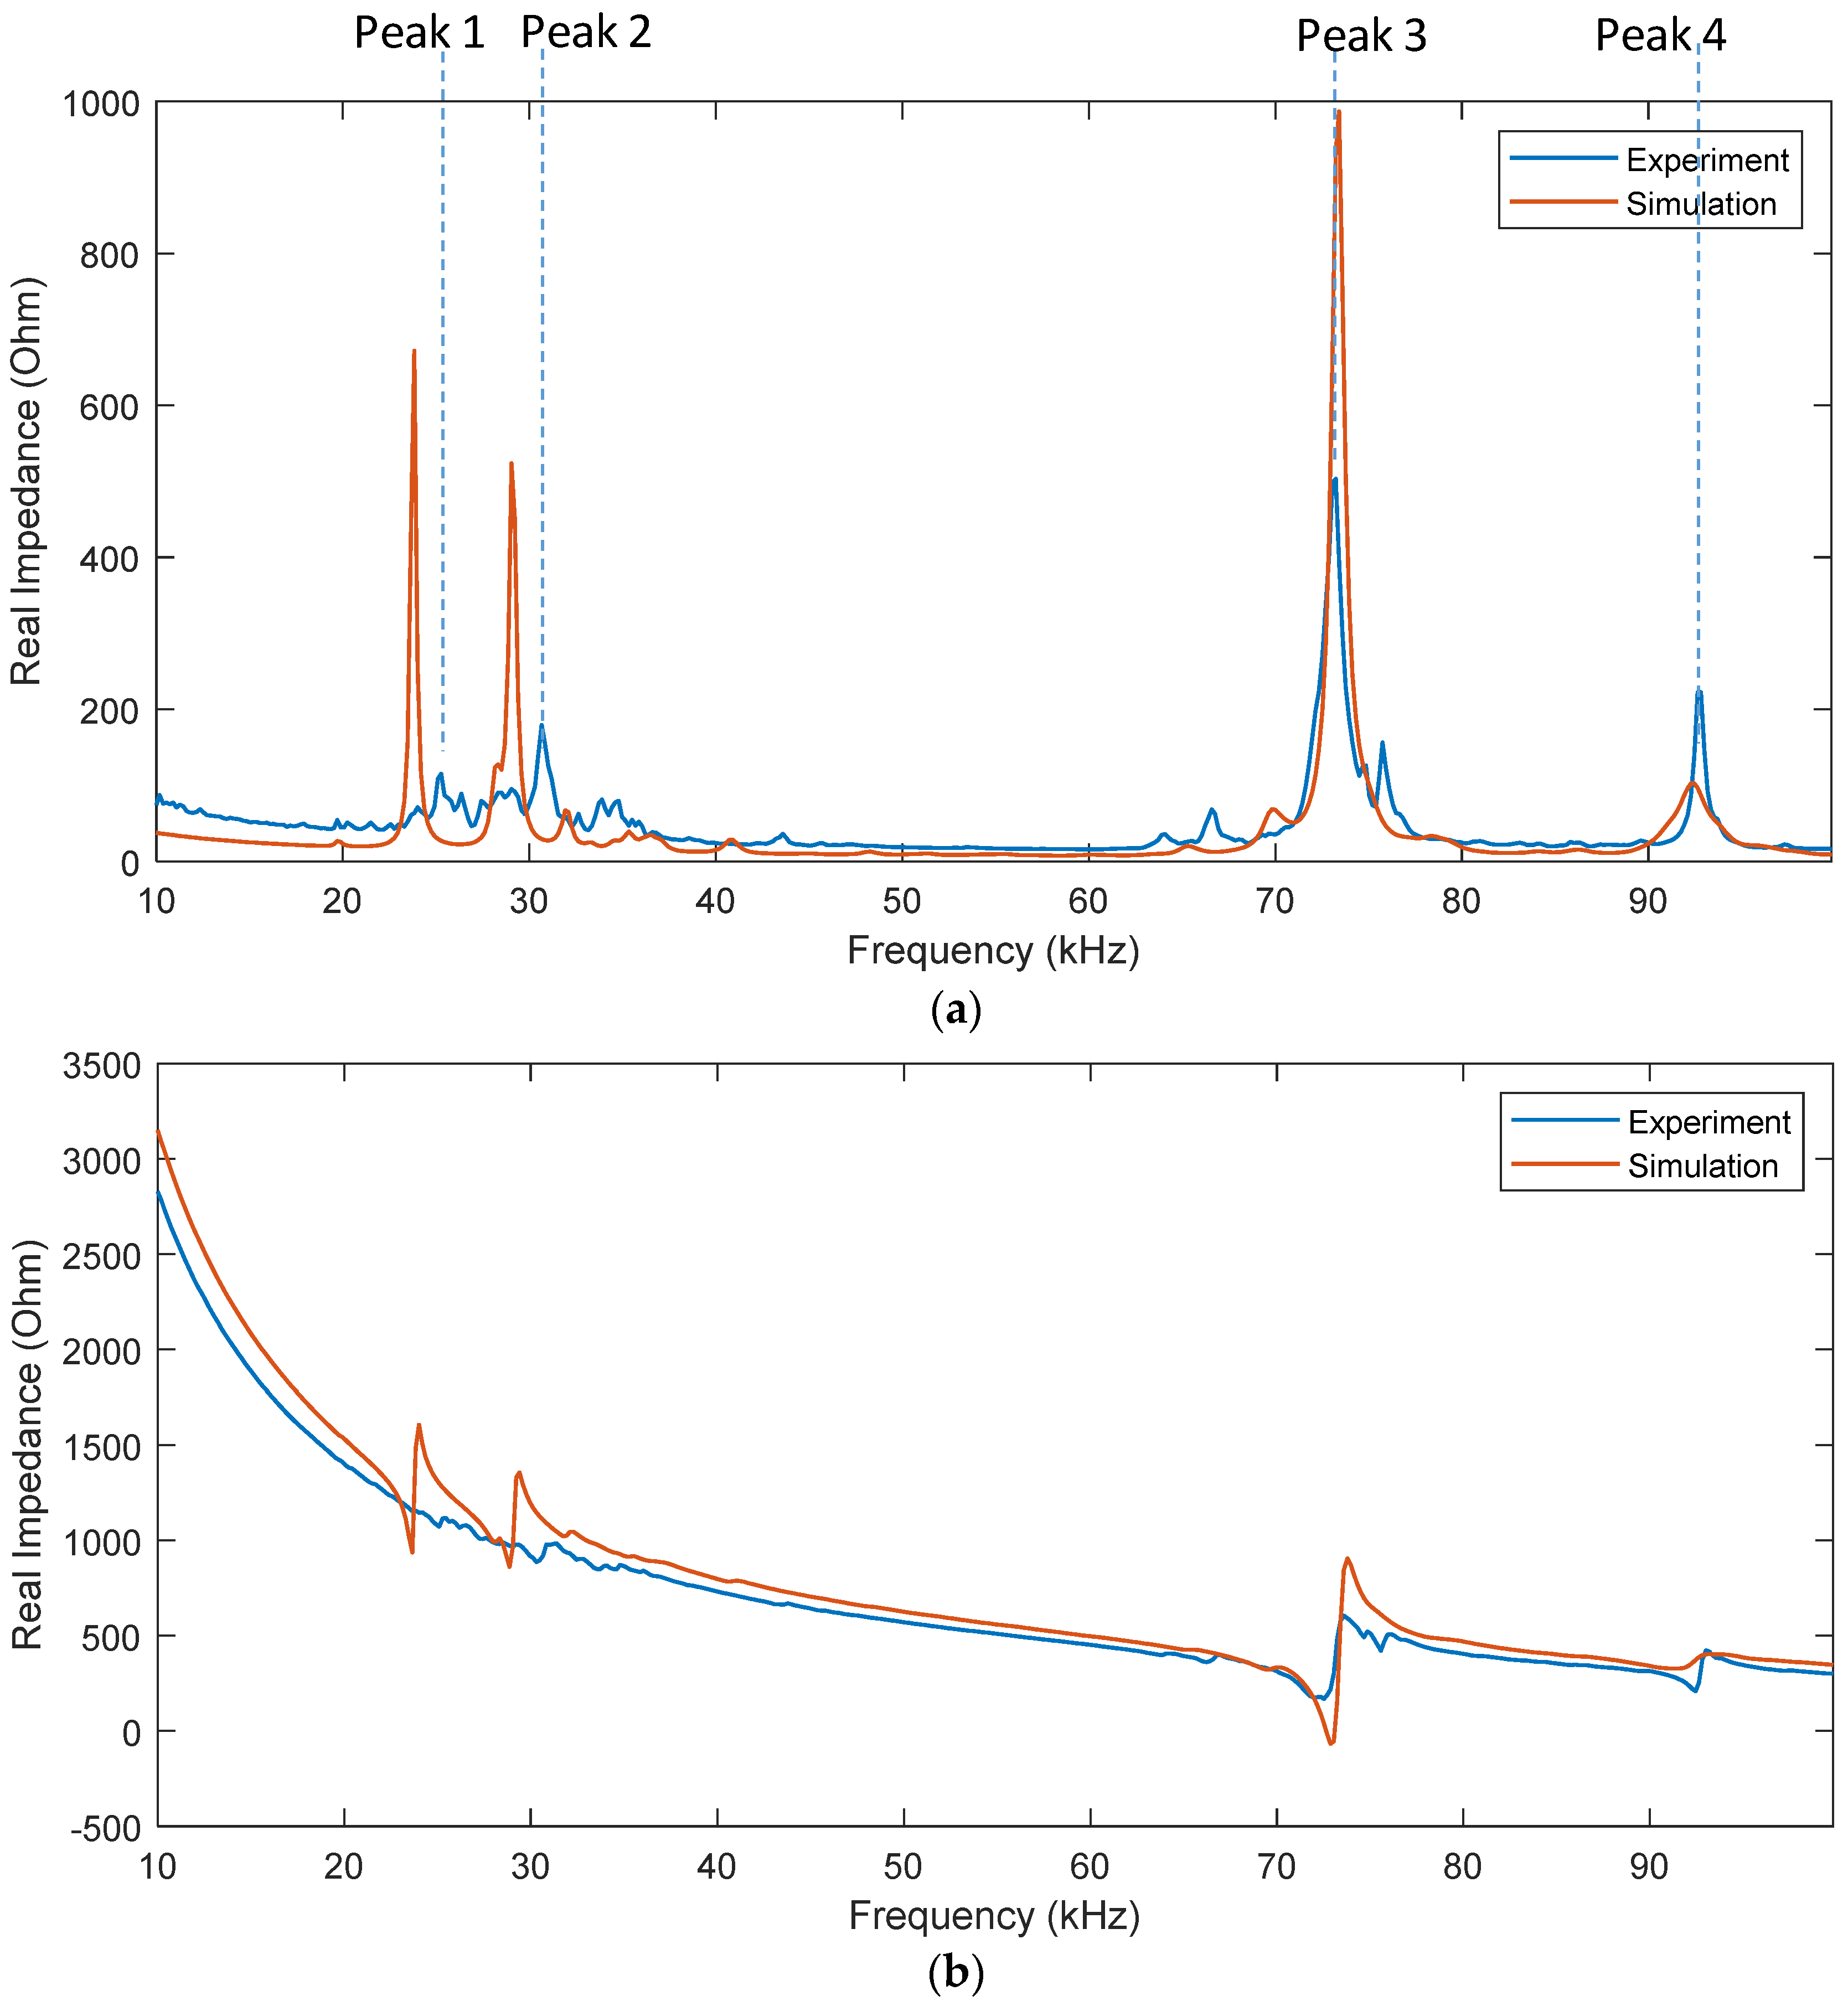
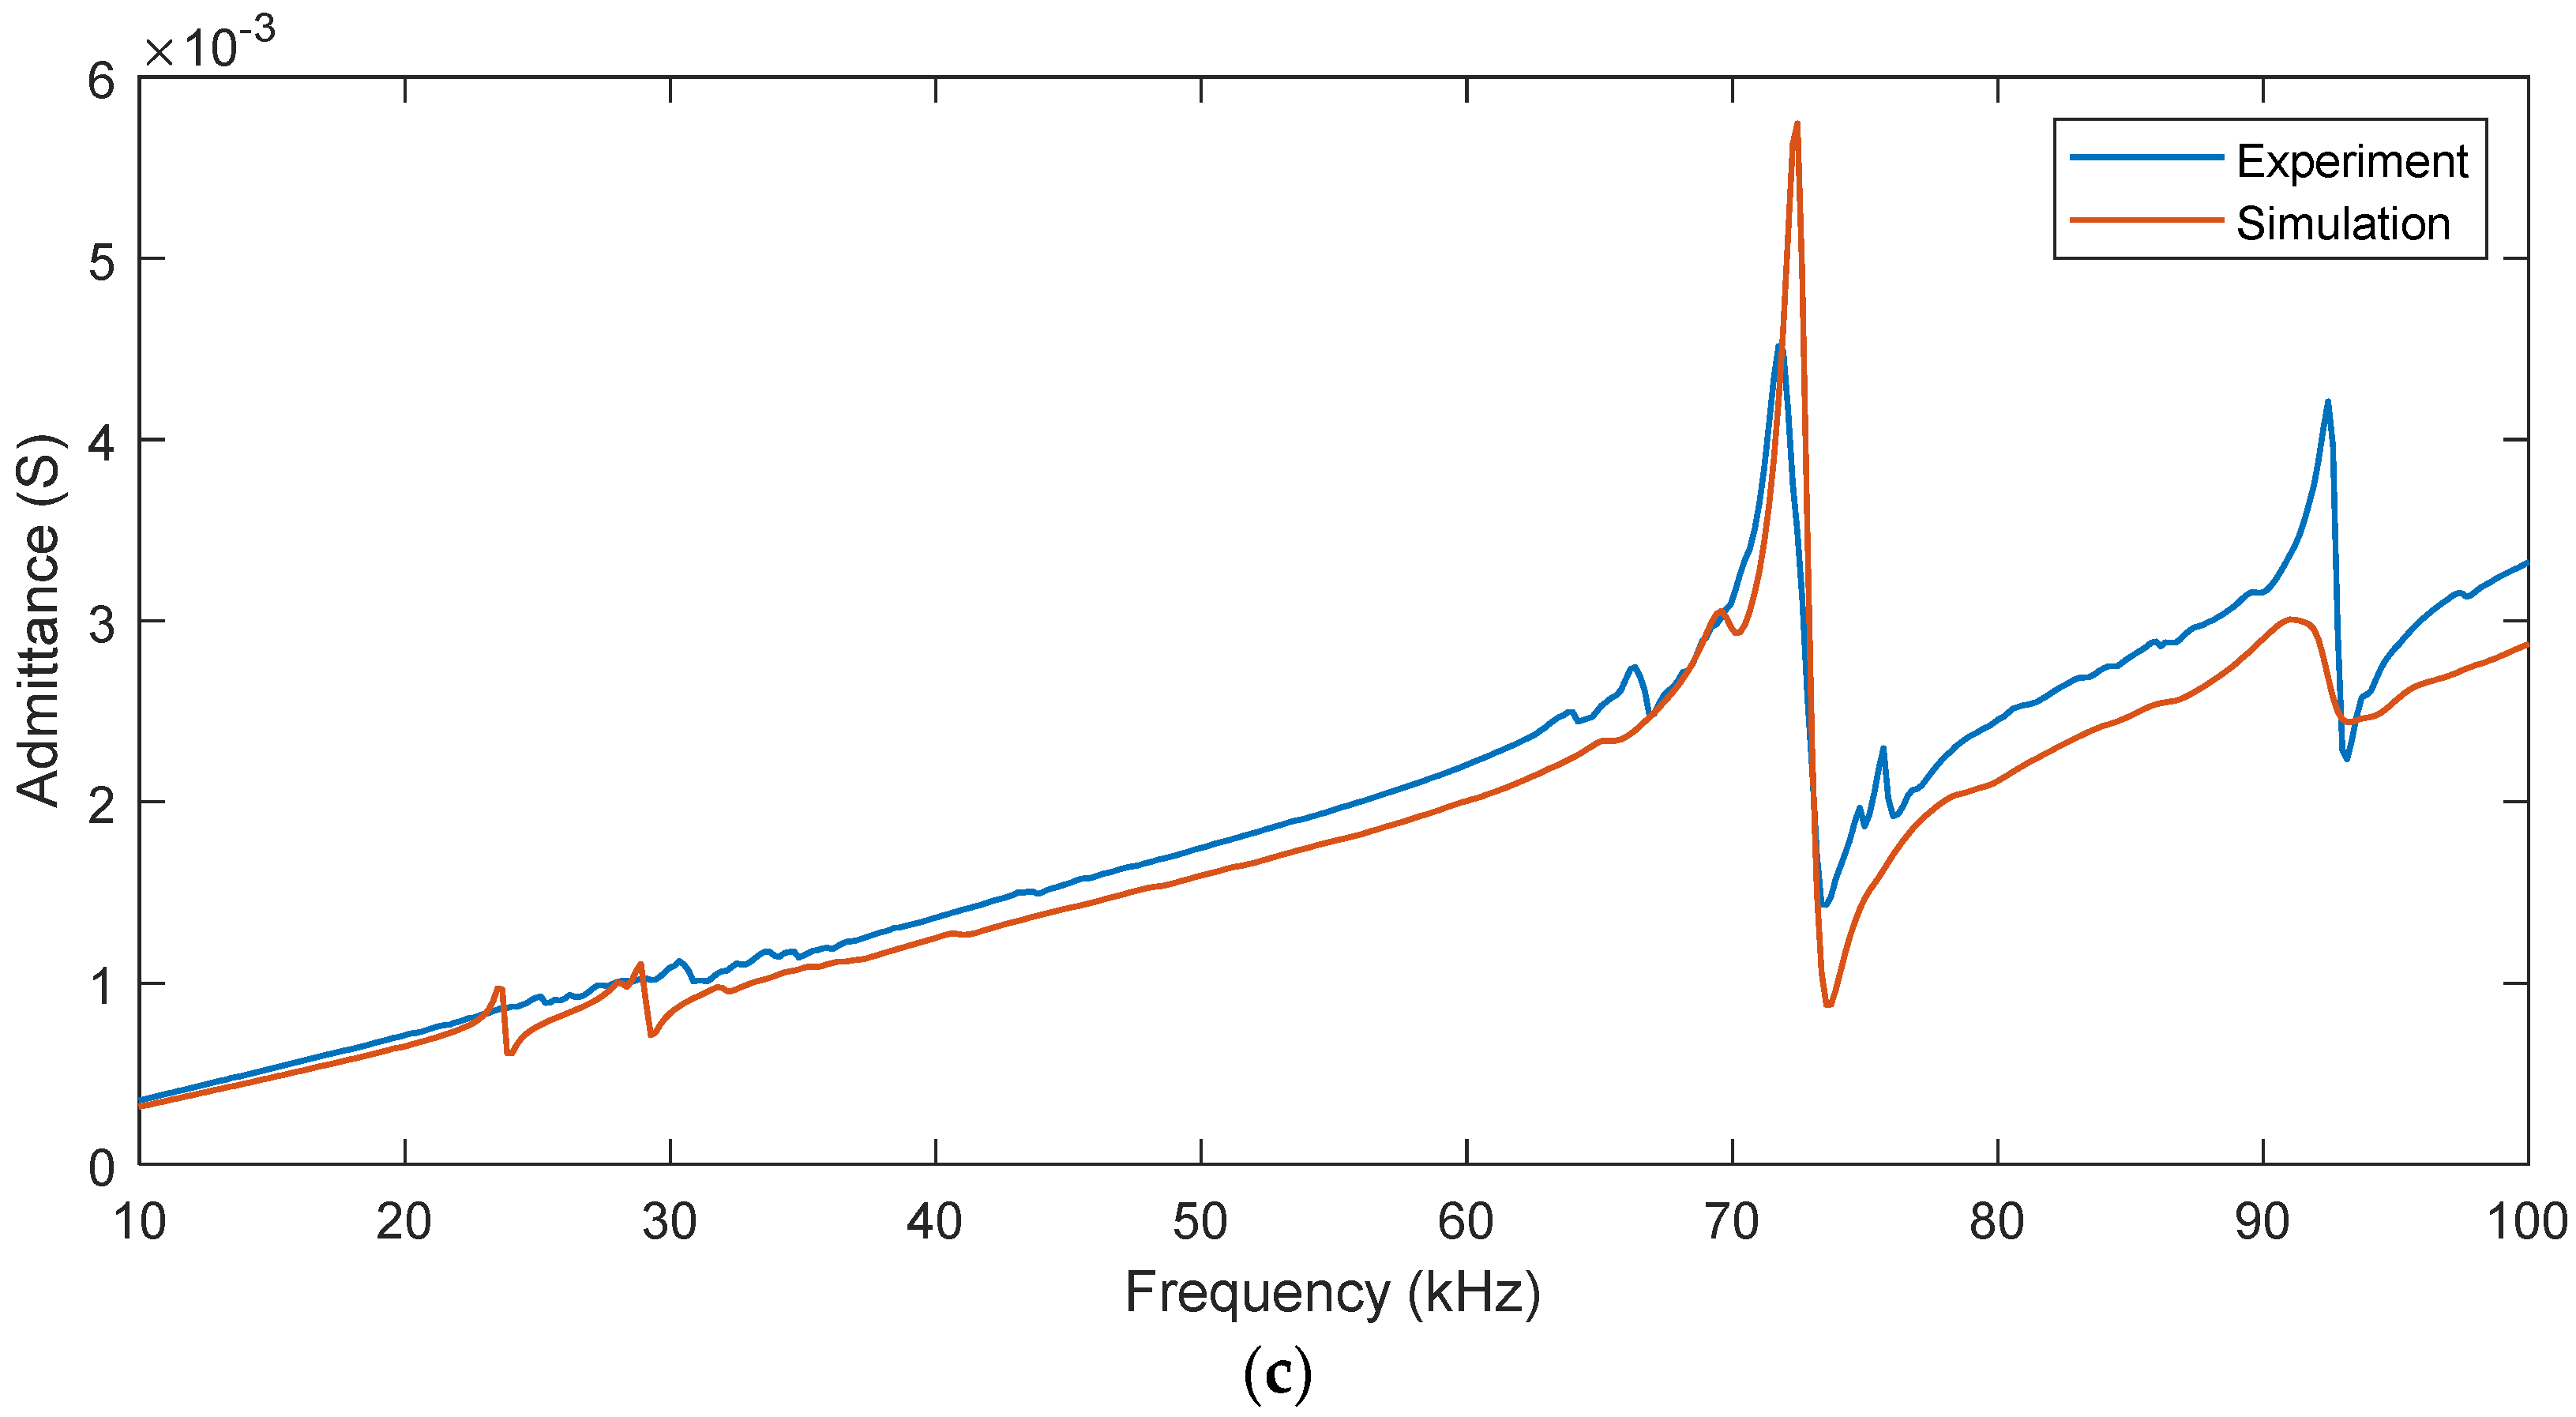
3.2. Numerical Admittance Response vs. Experimental Result
4. Dynamic Characteristics and Numerical Feasibility Verification
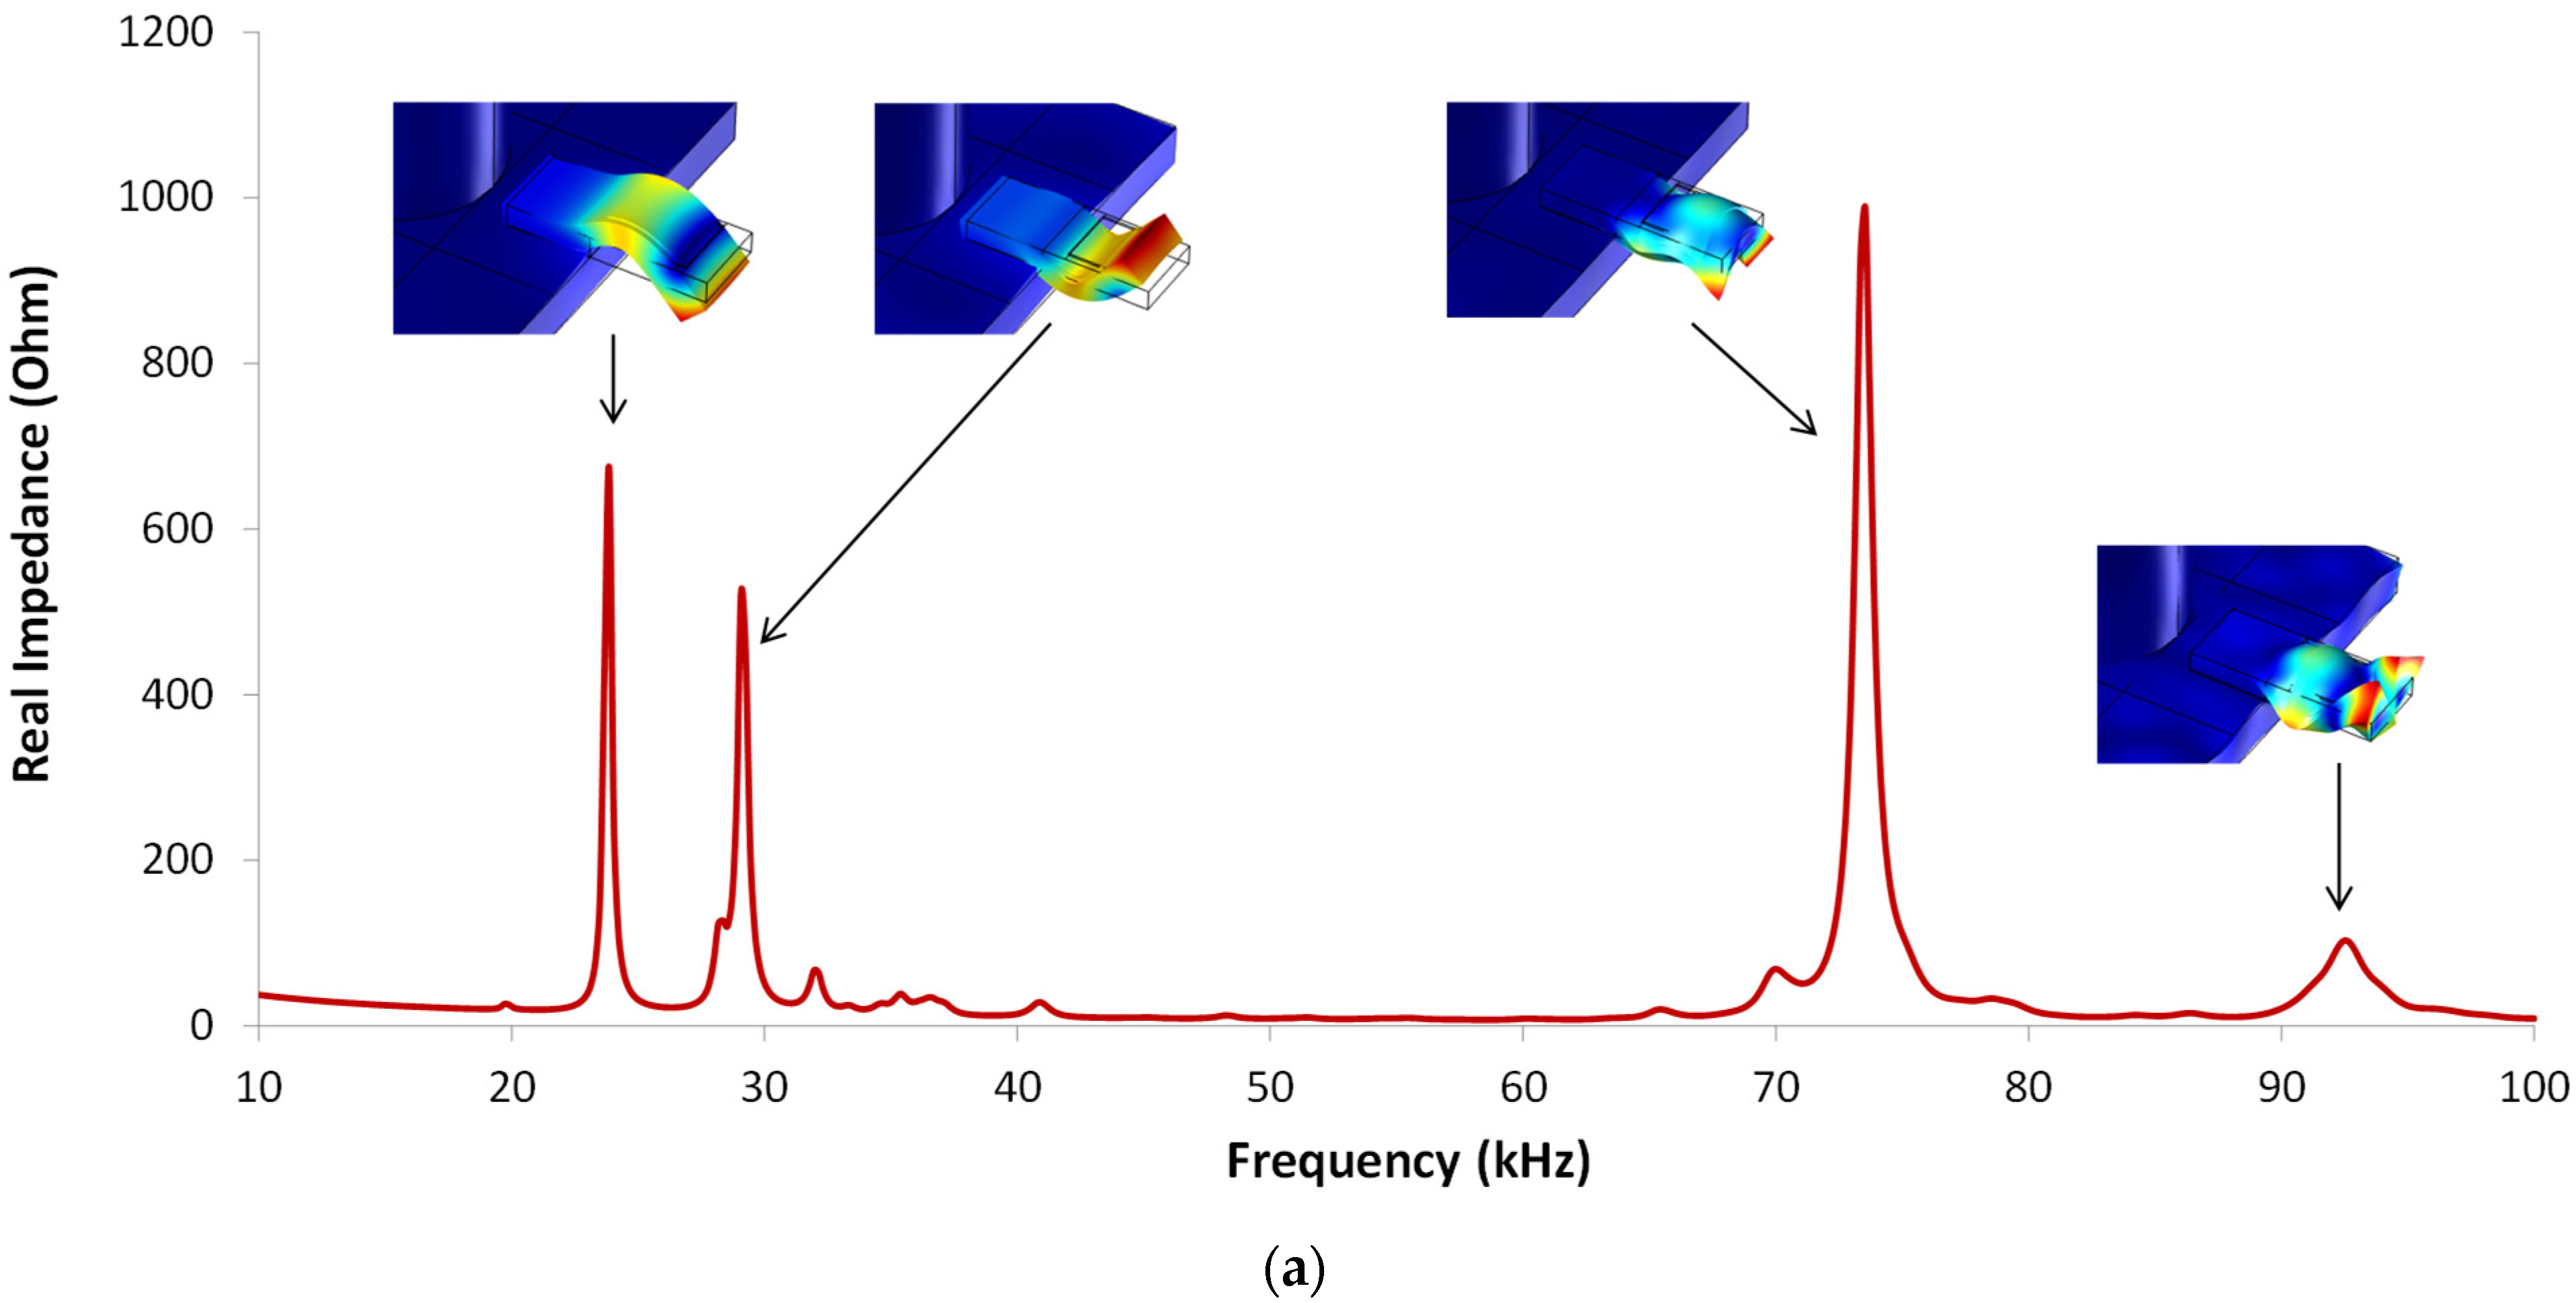
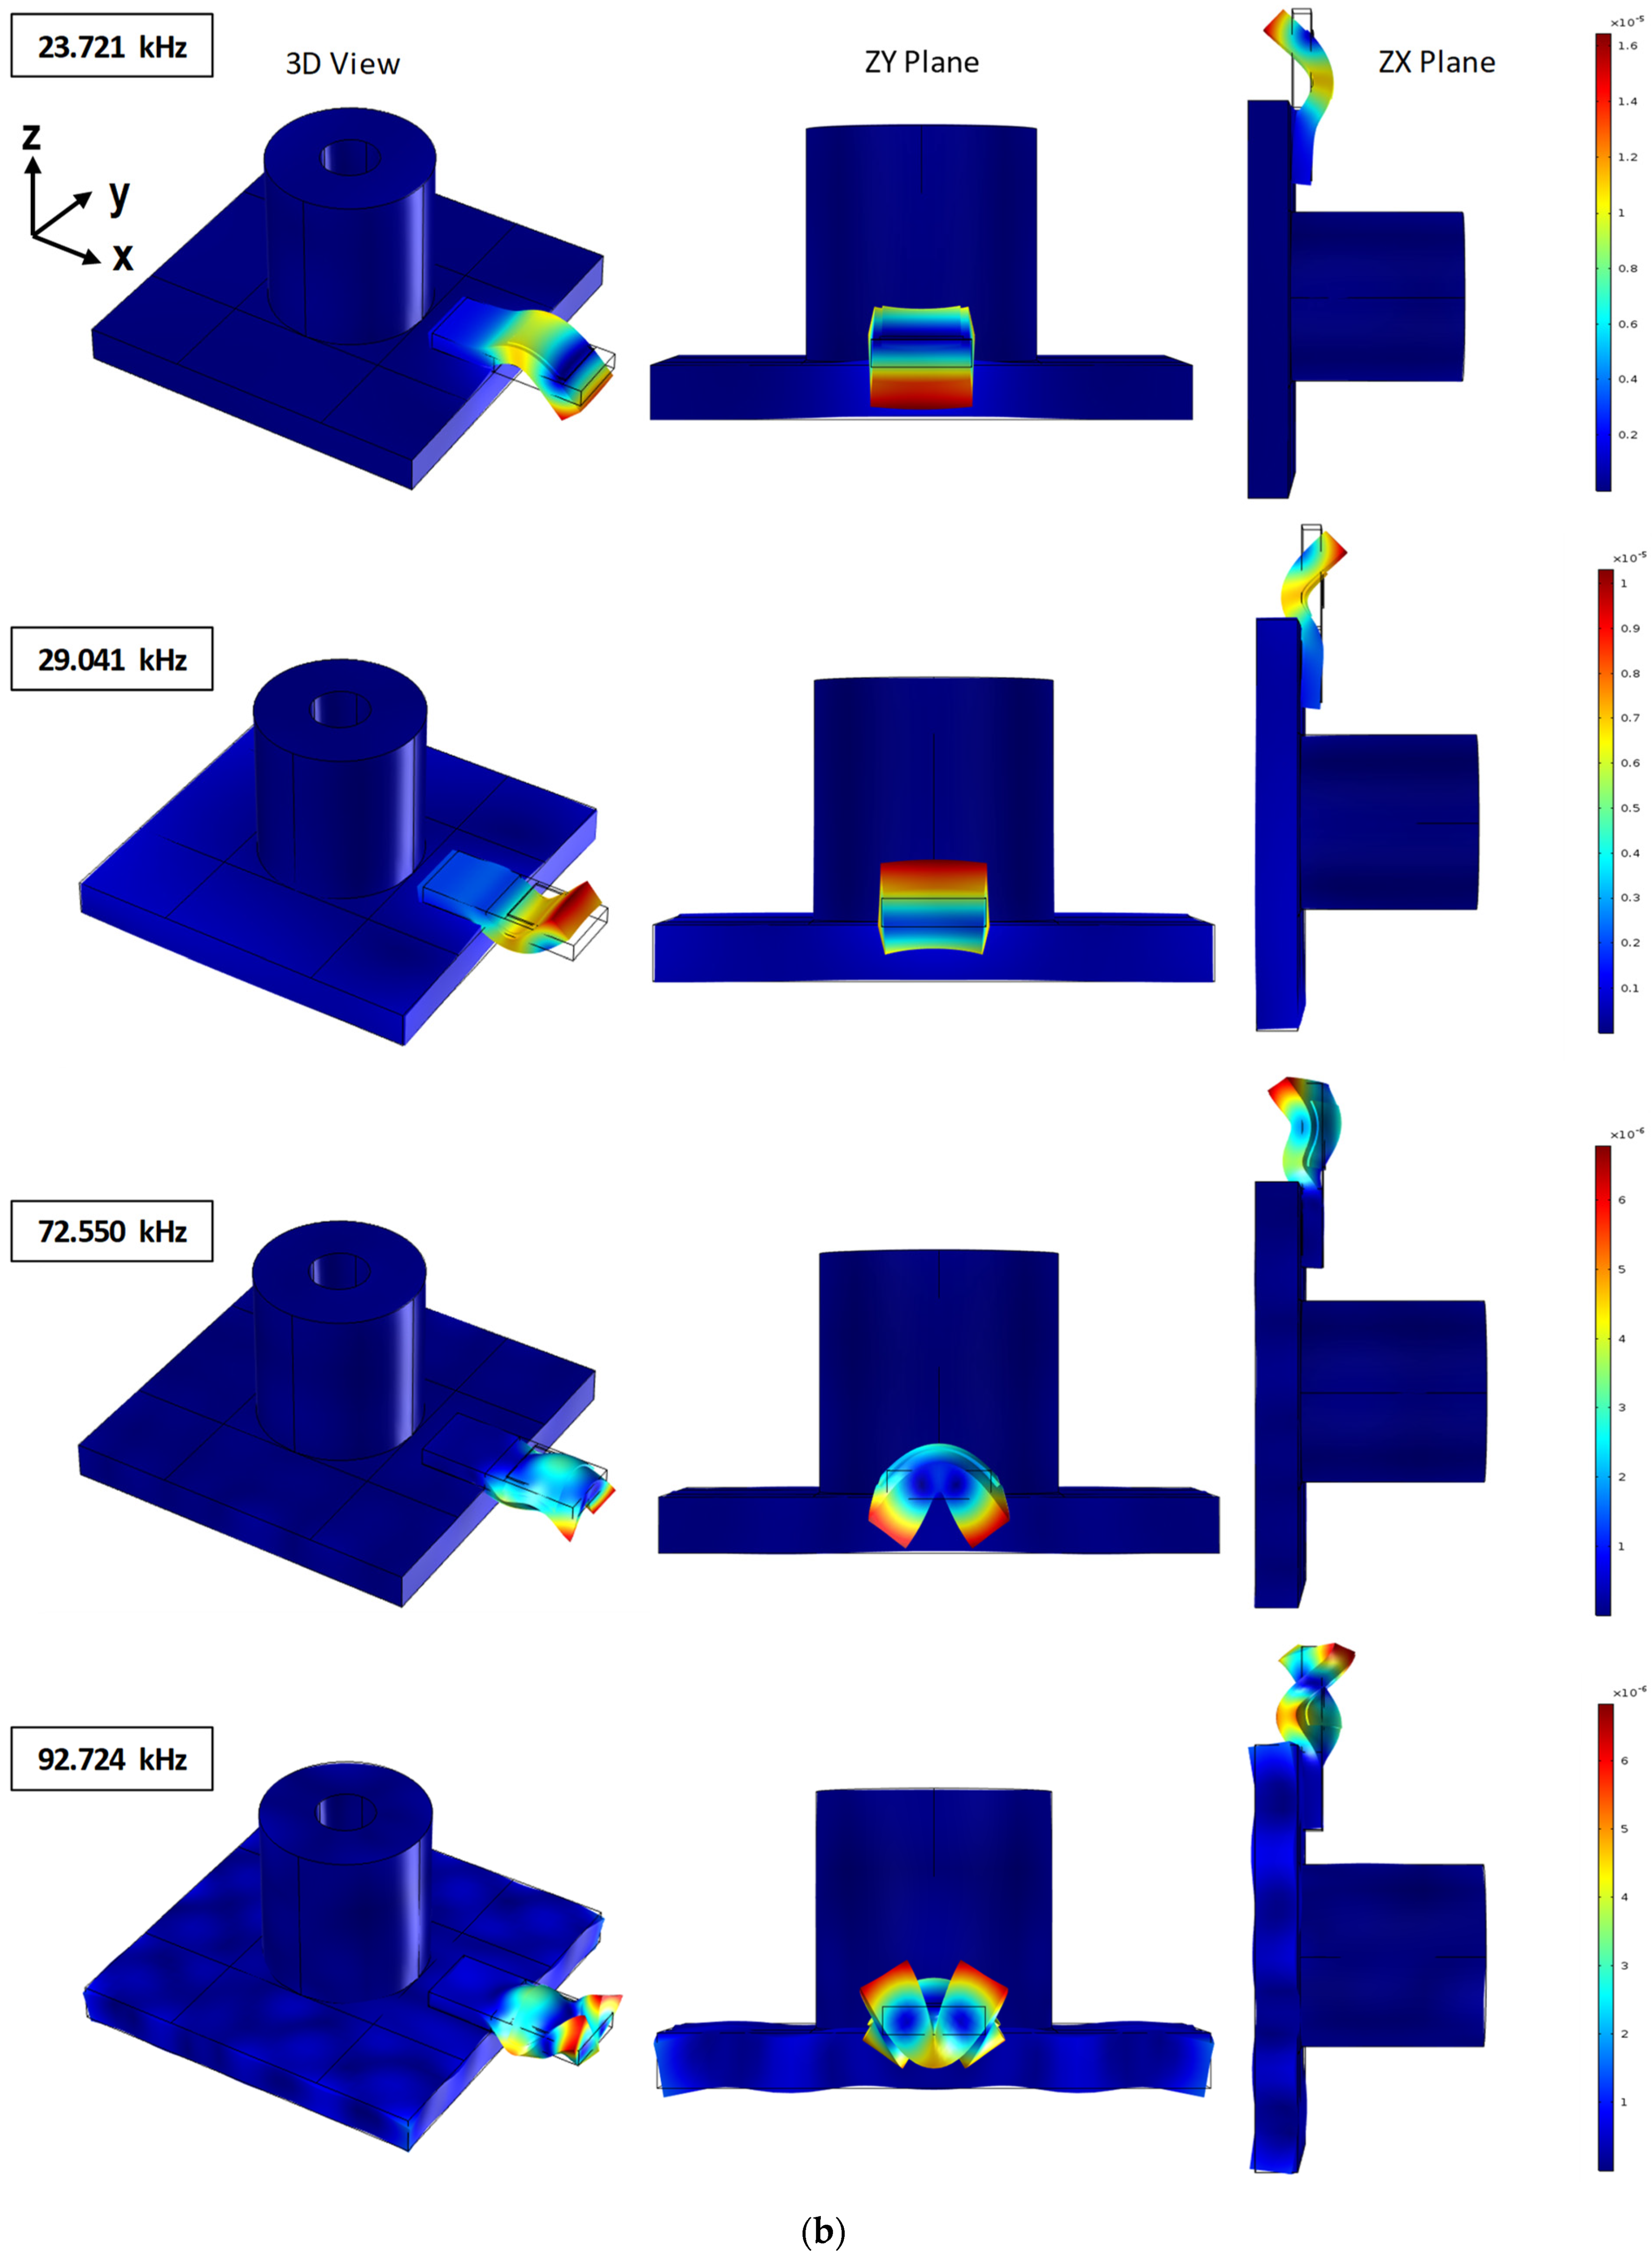
4.1. Local Dynamic Characteristics of Single-Point Mount PZT Interface
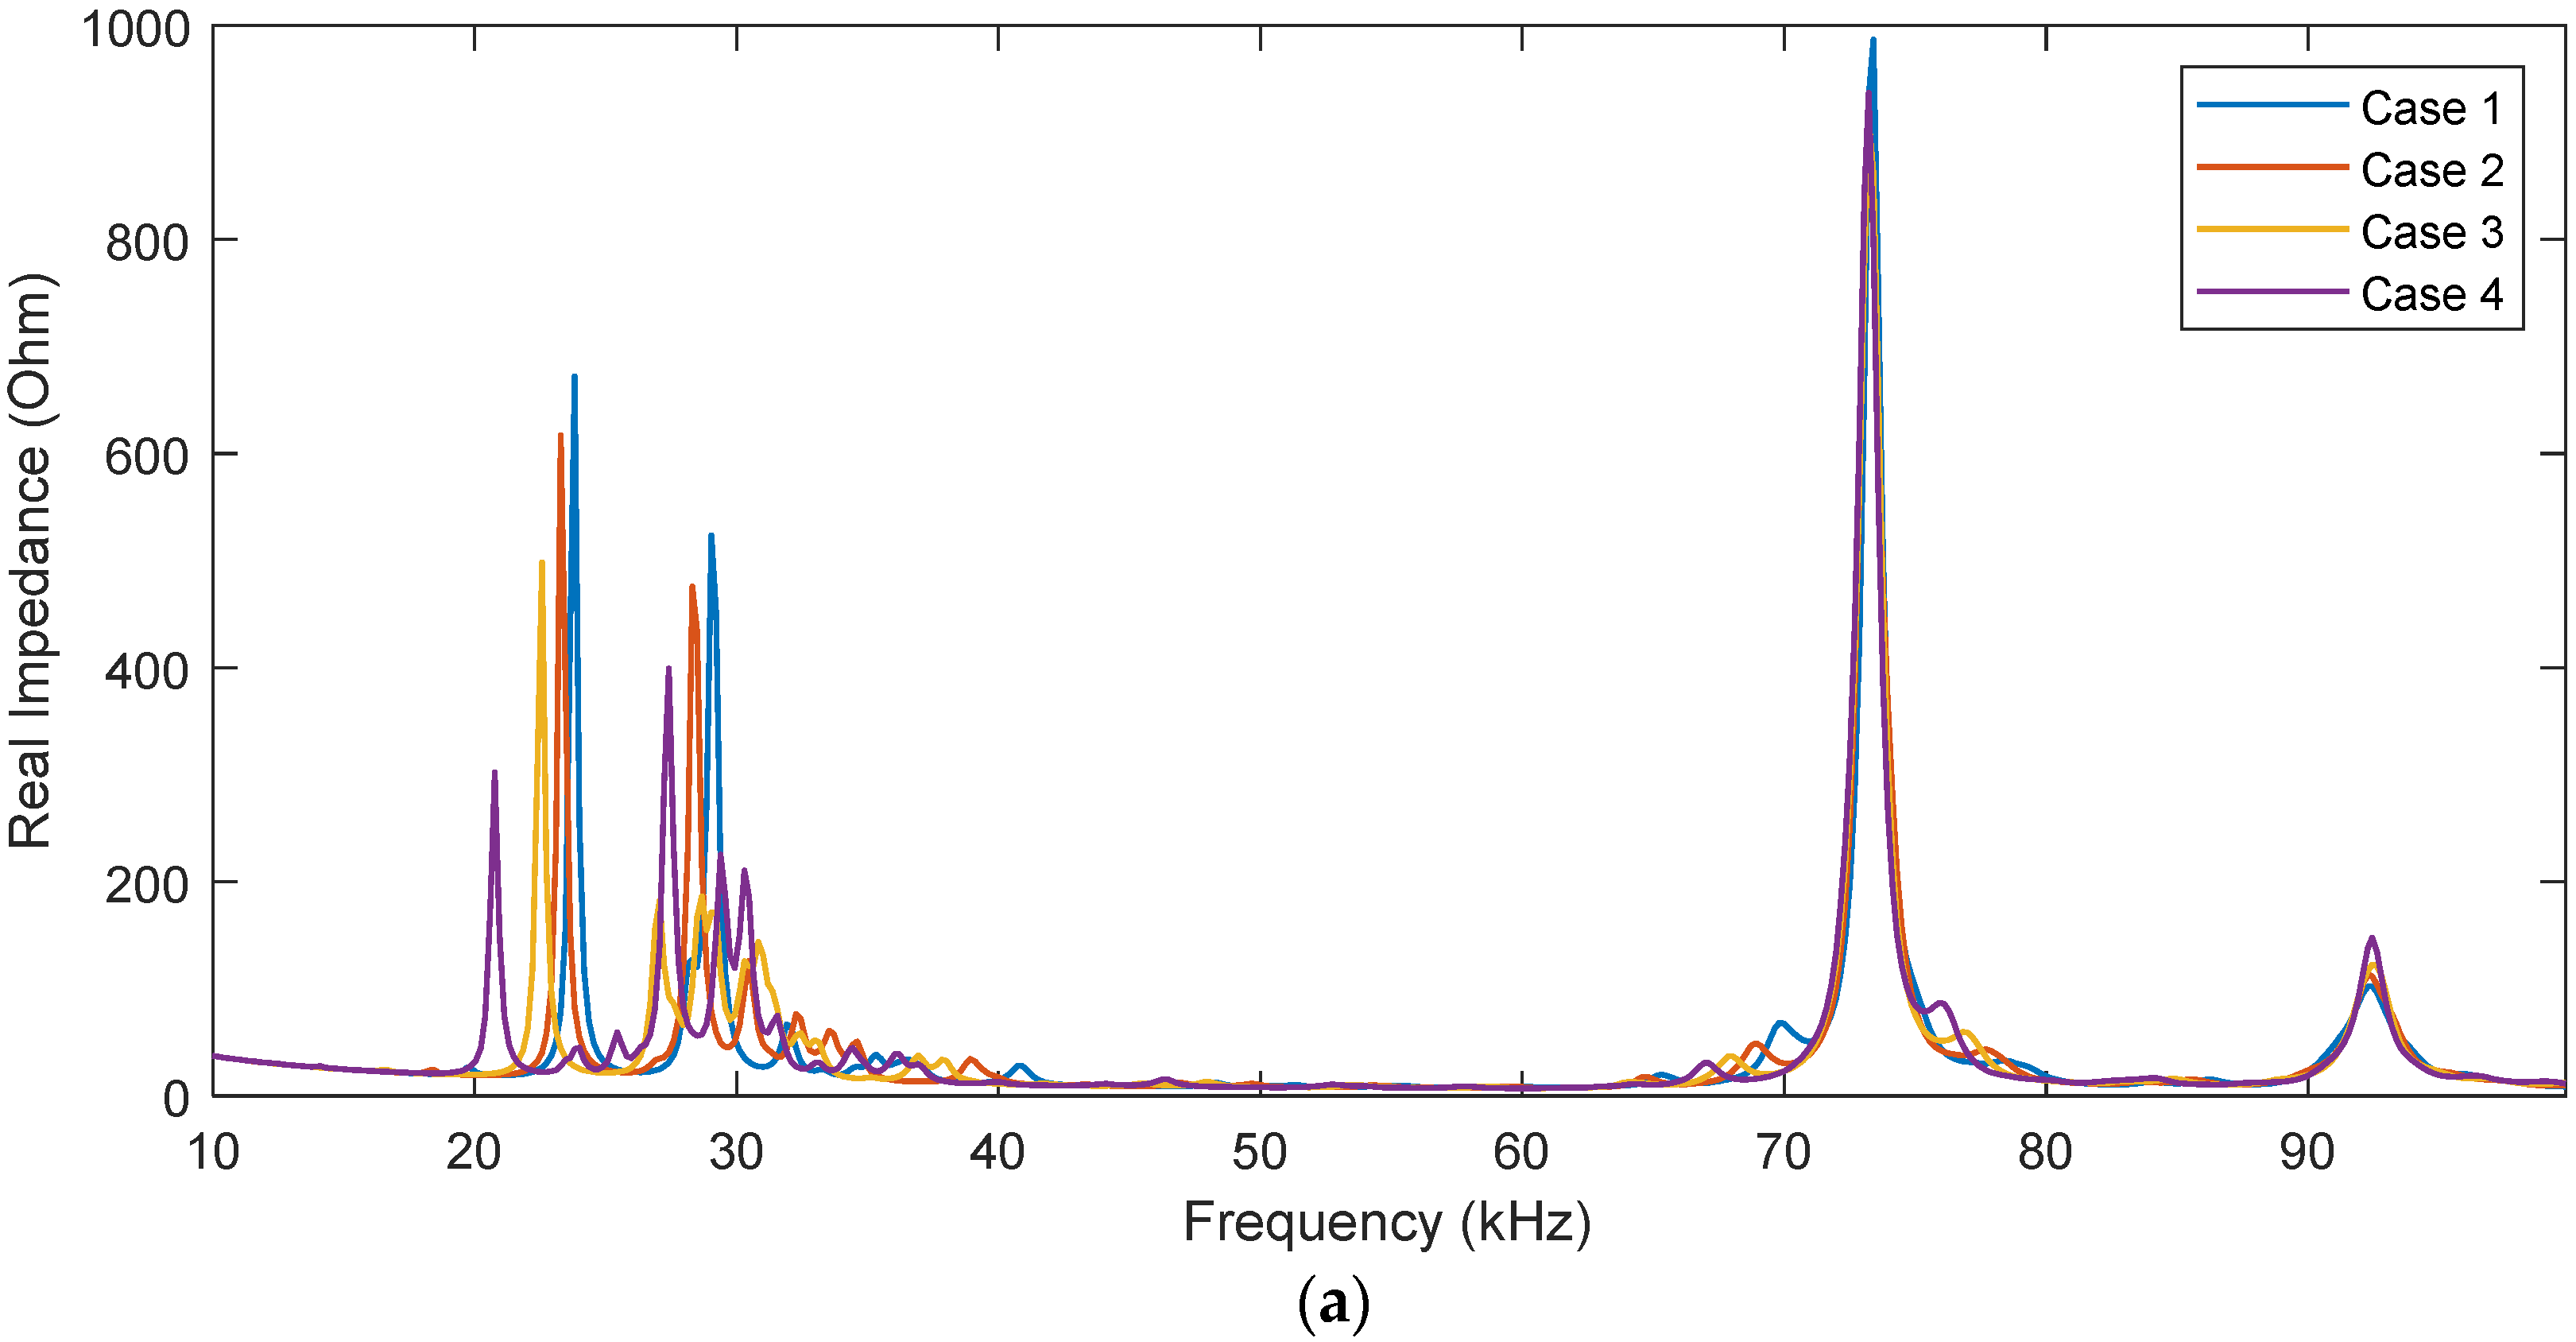
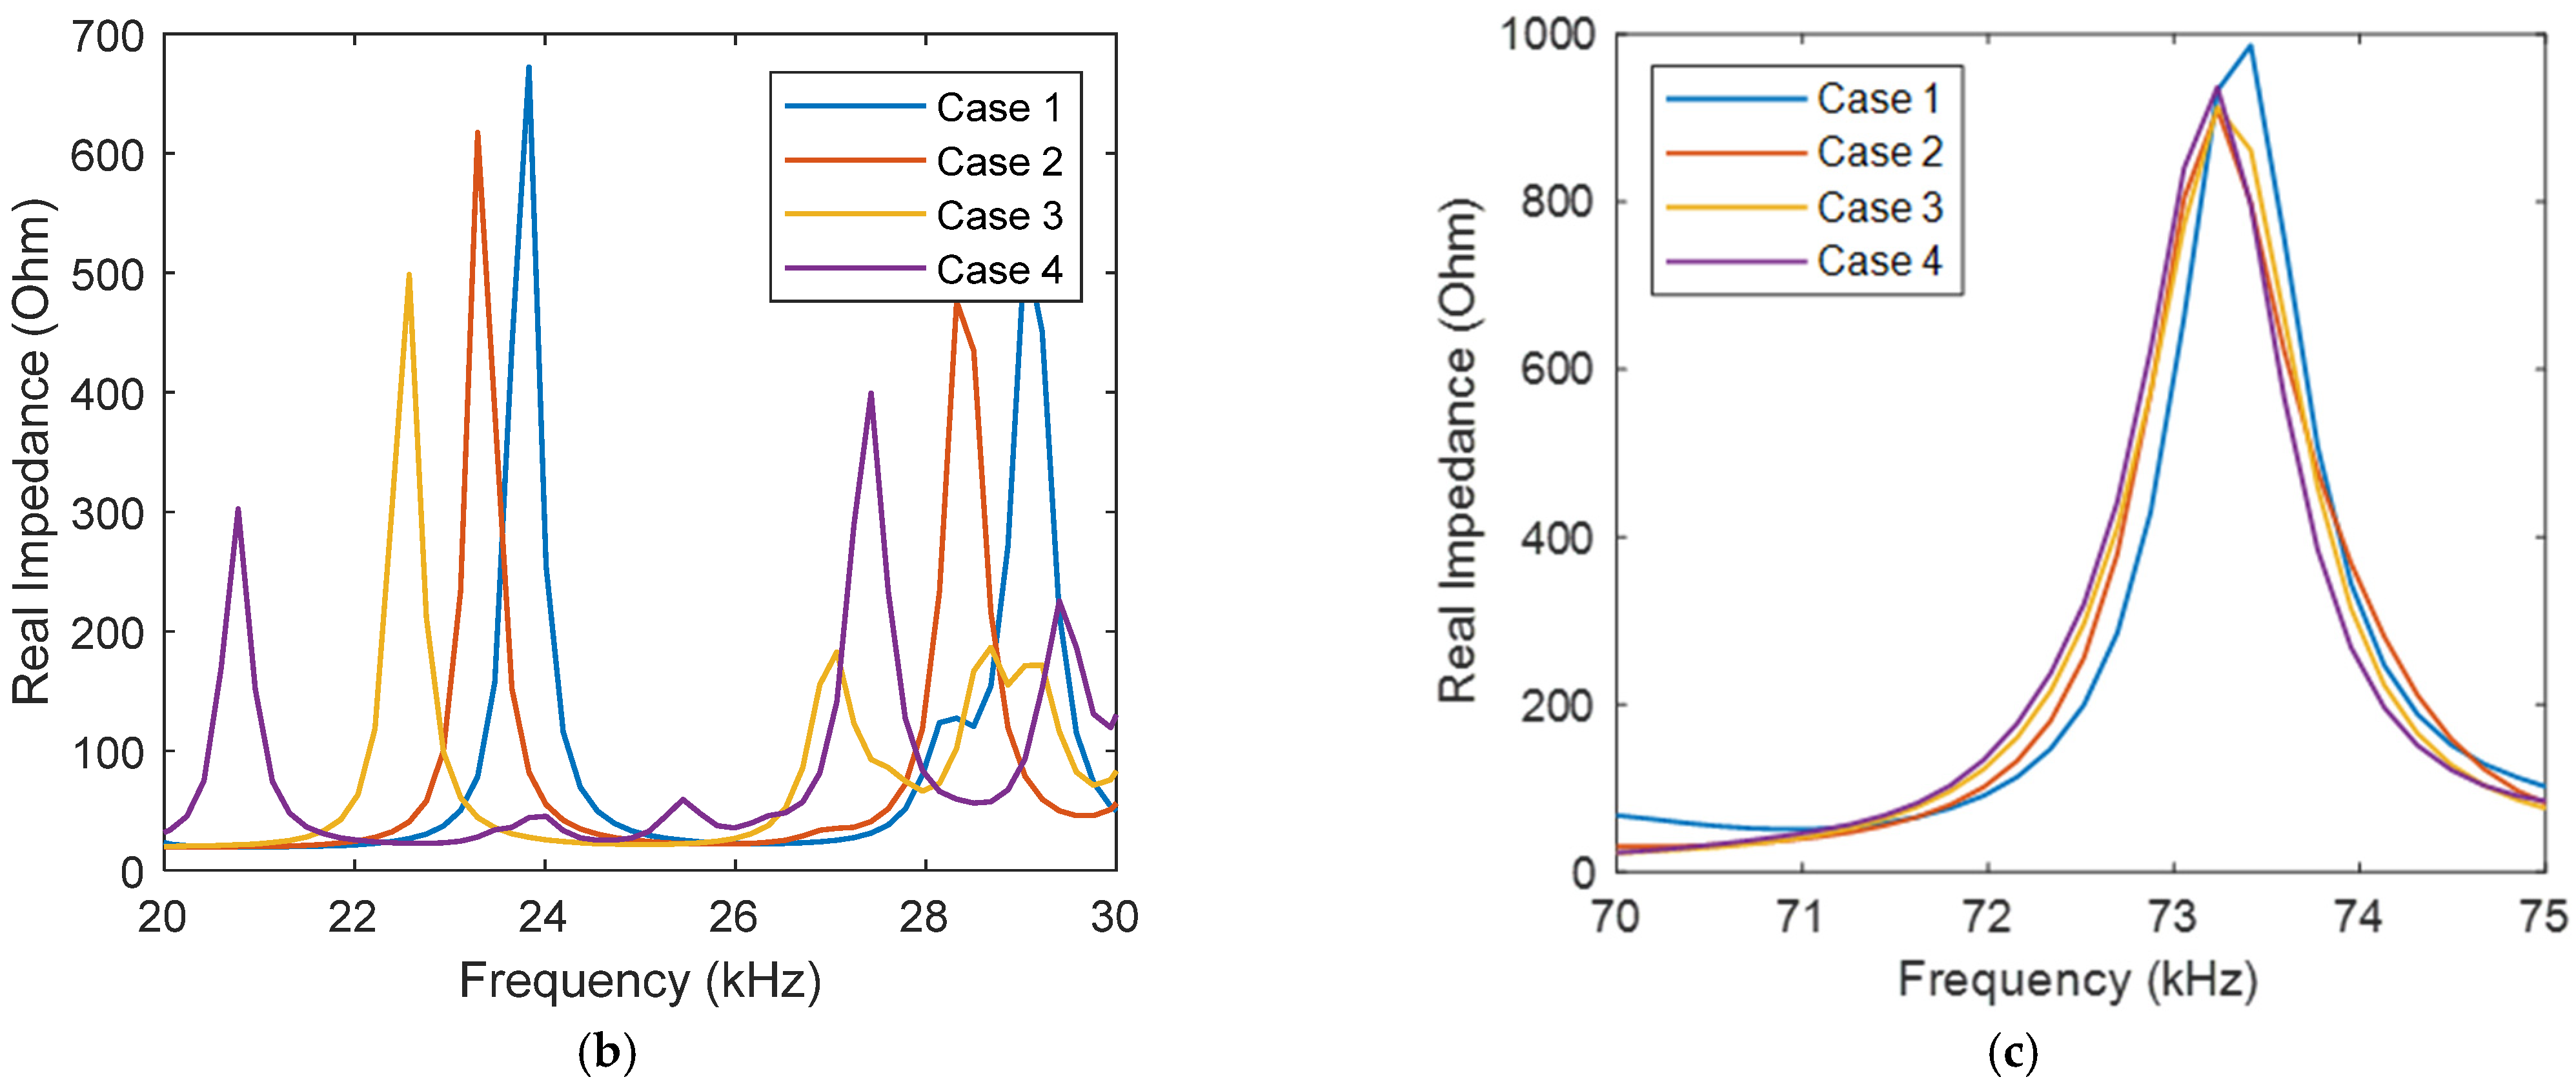
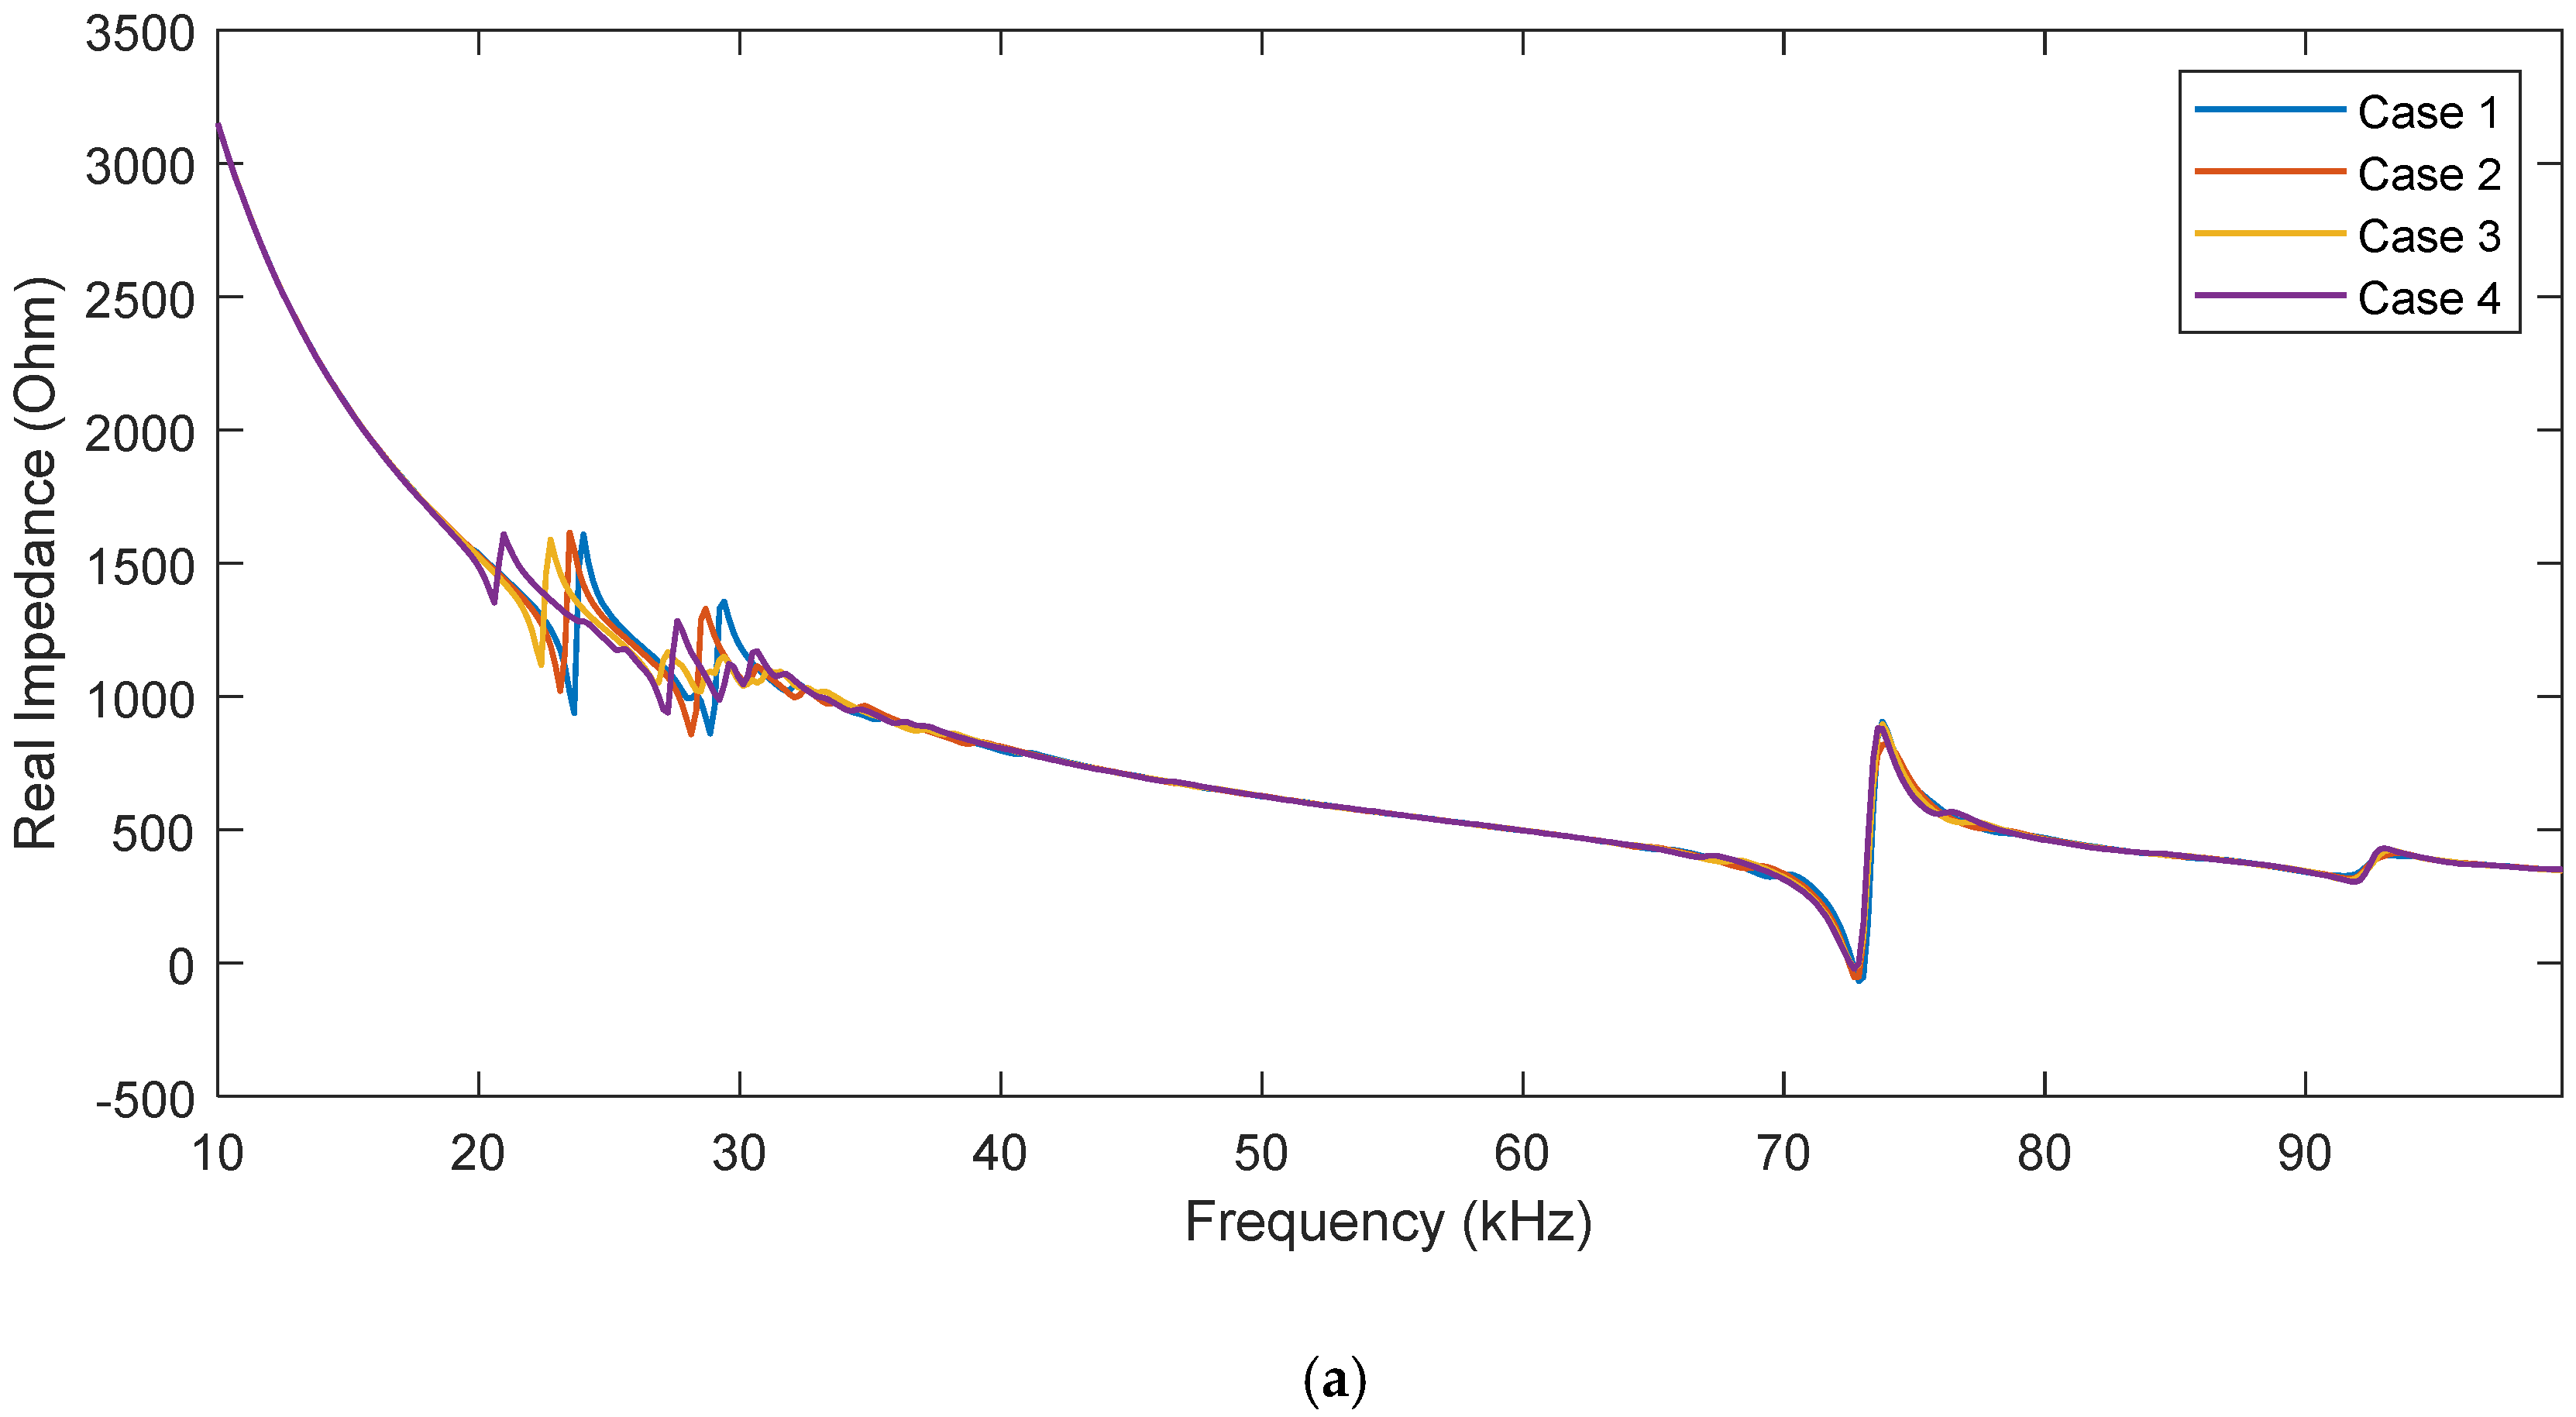
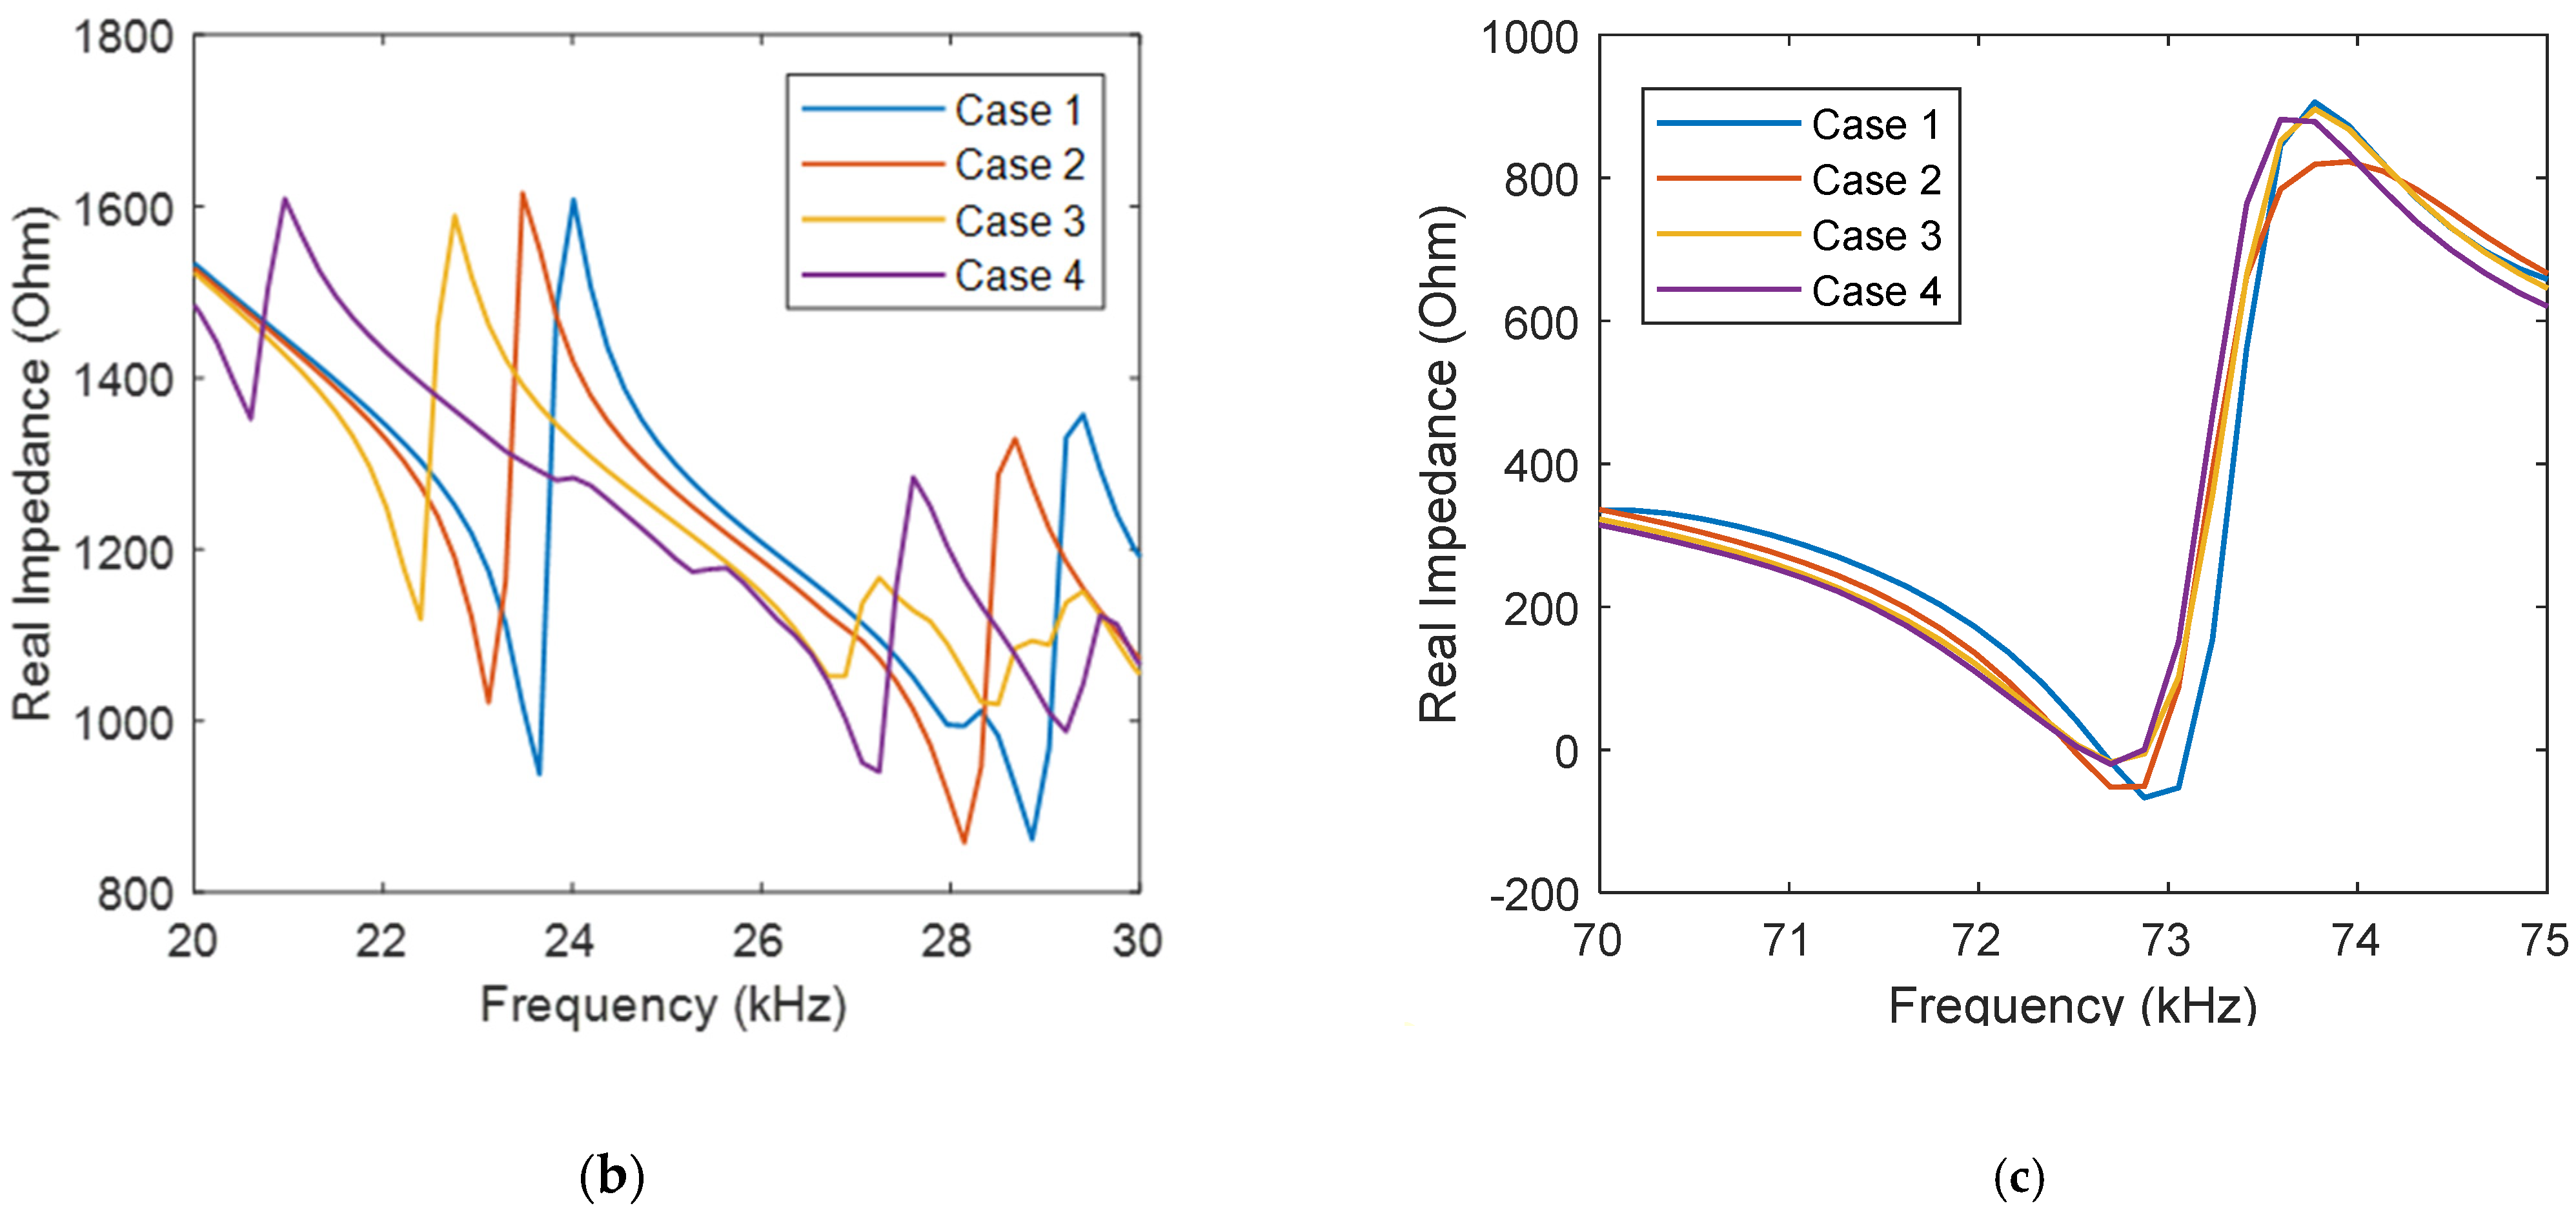
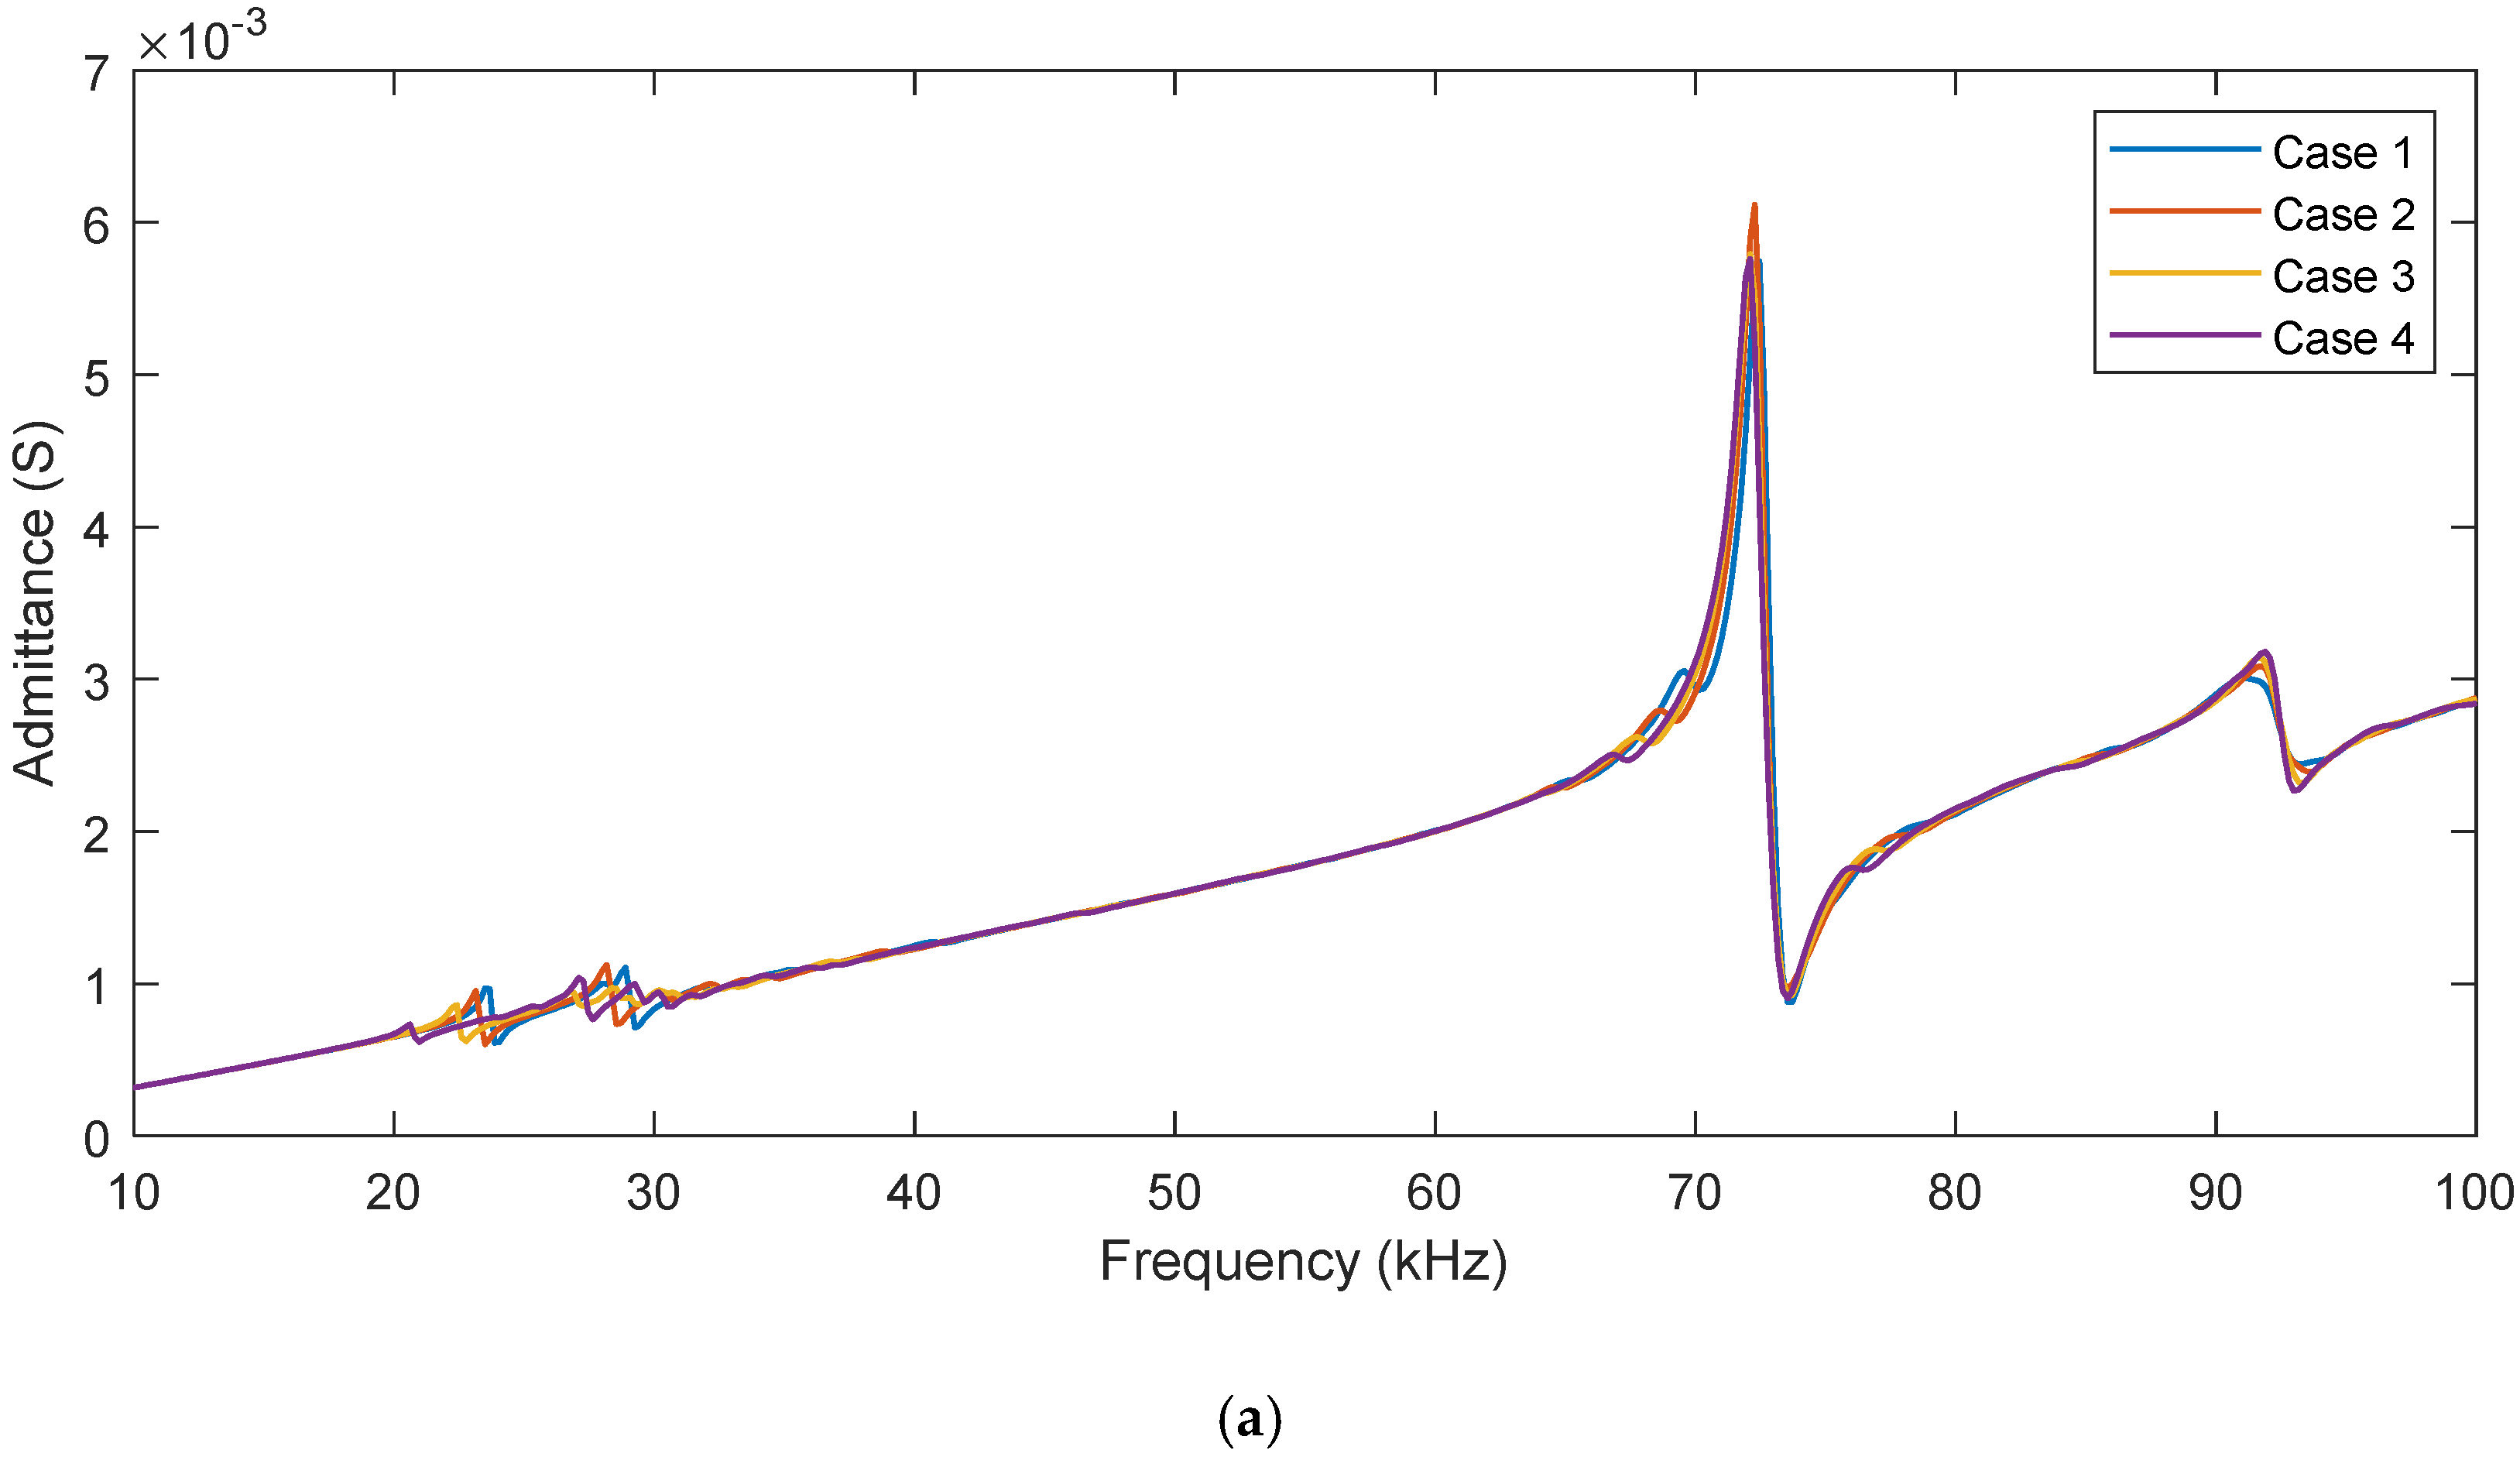
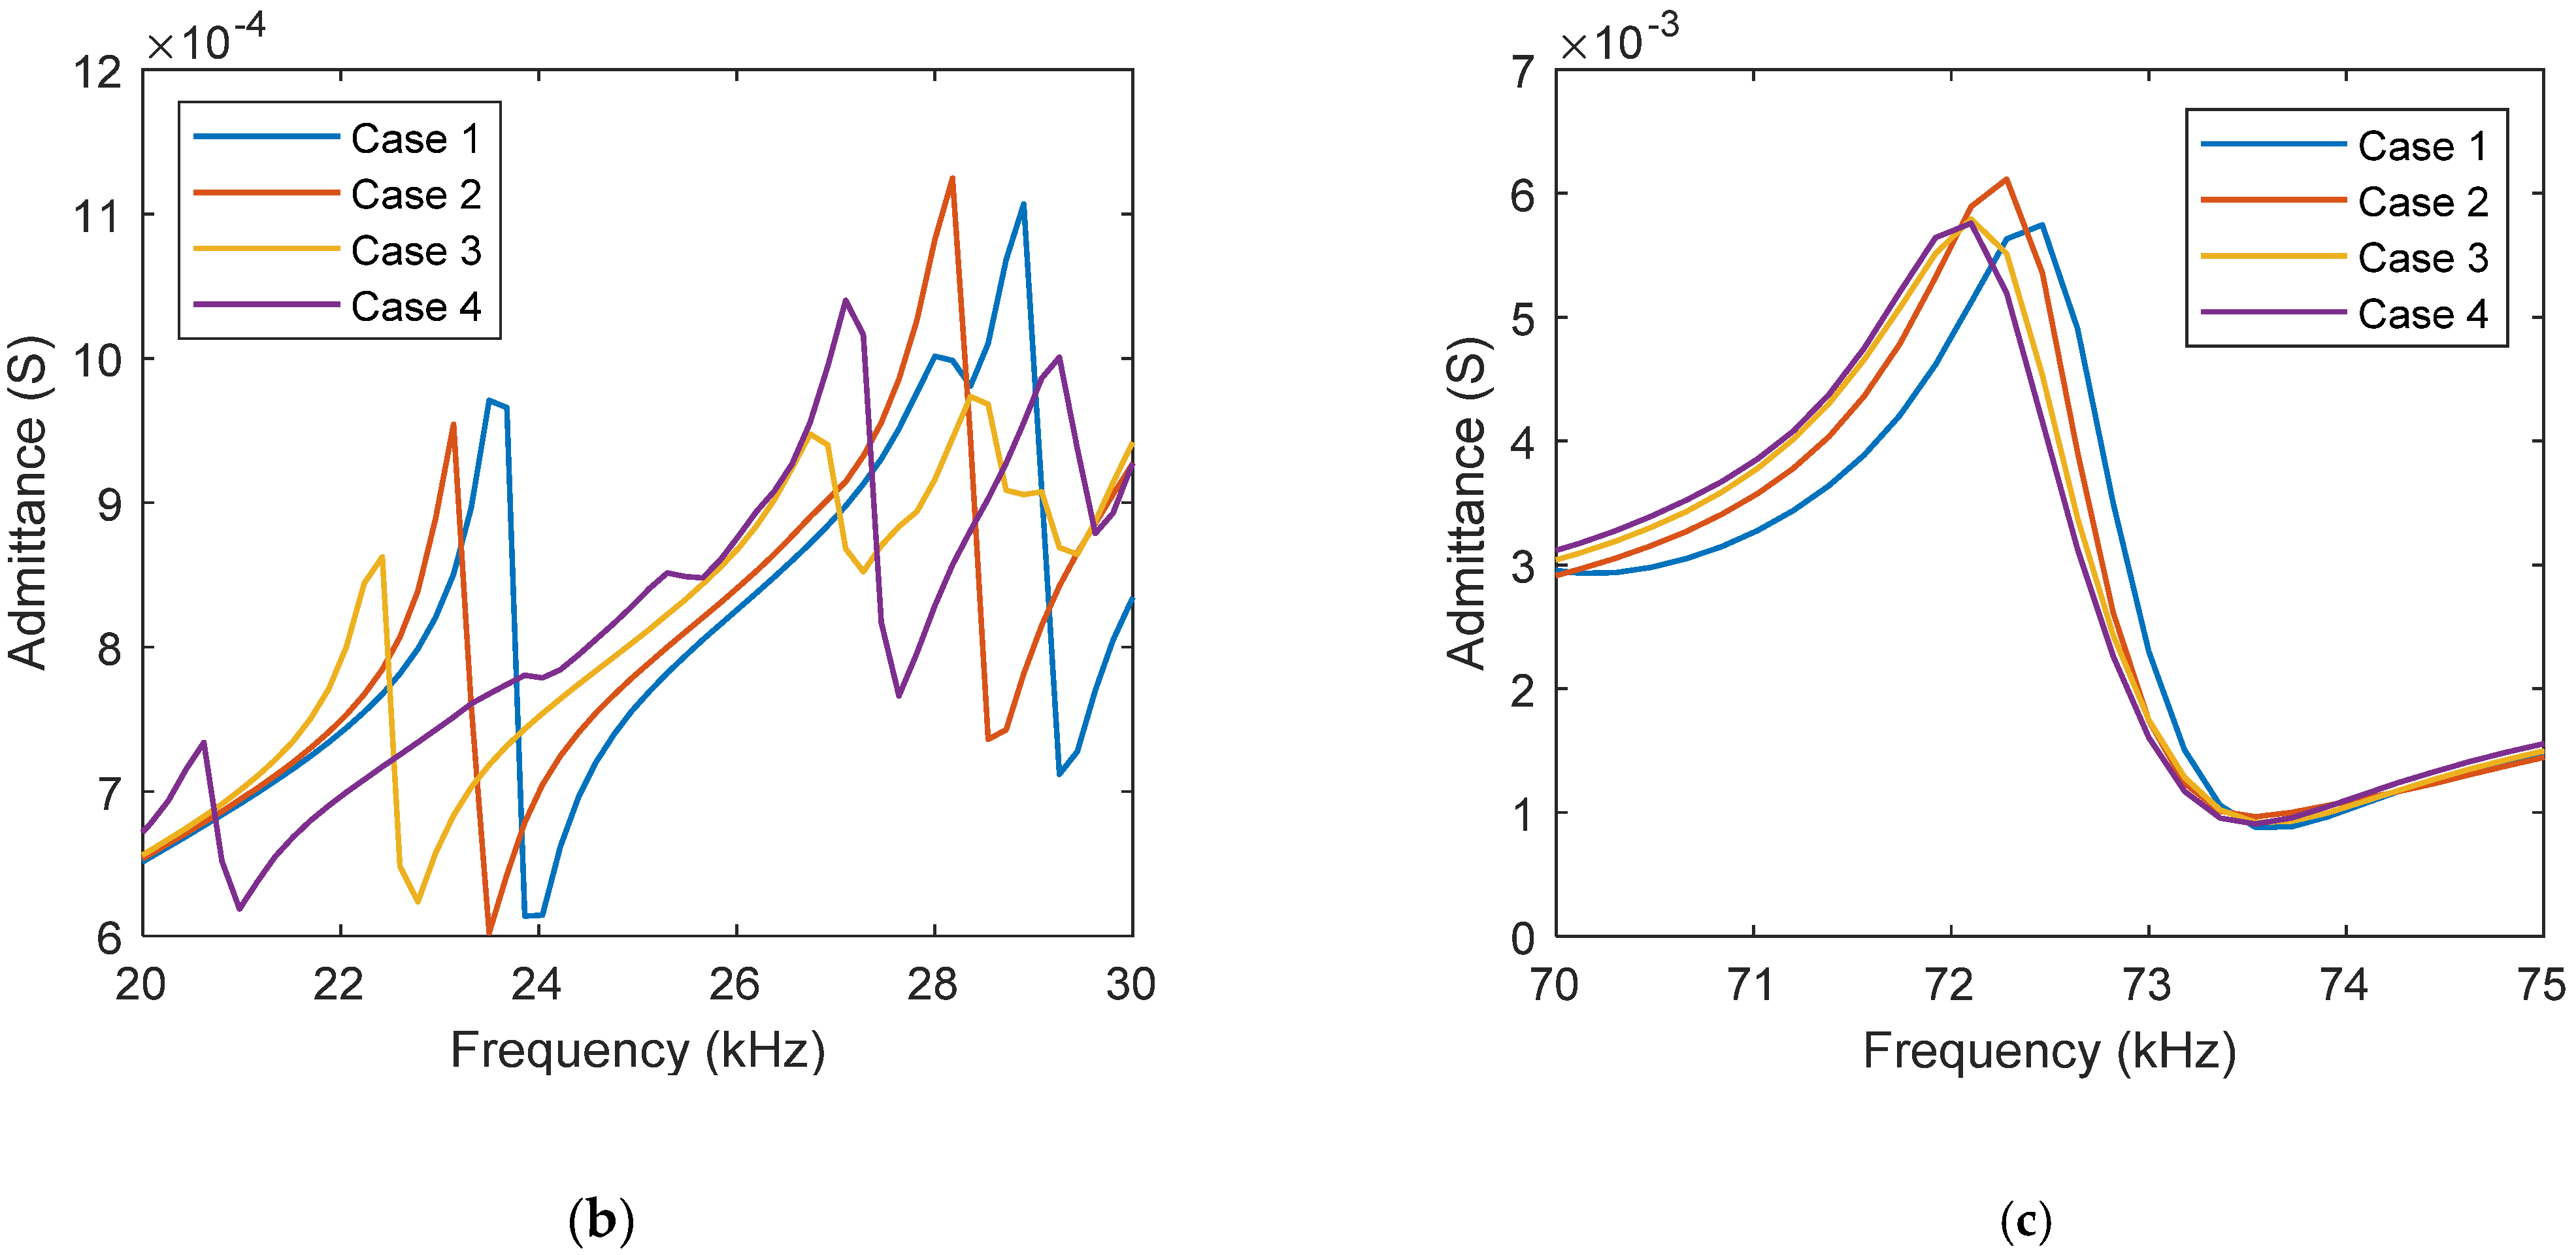
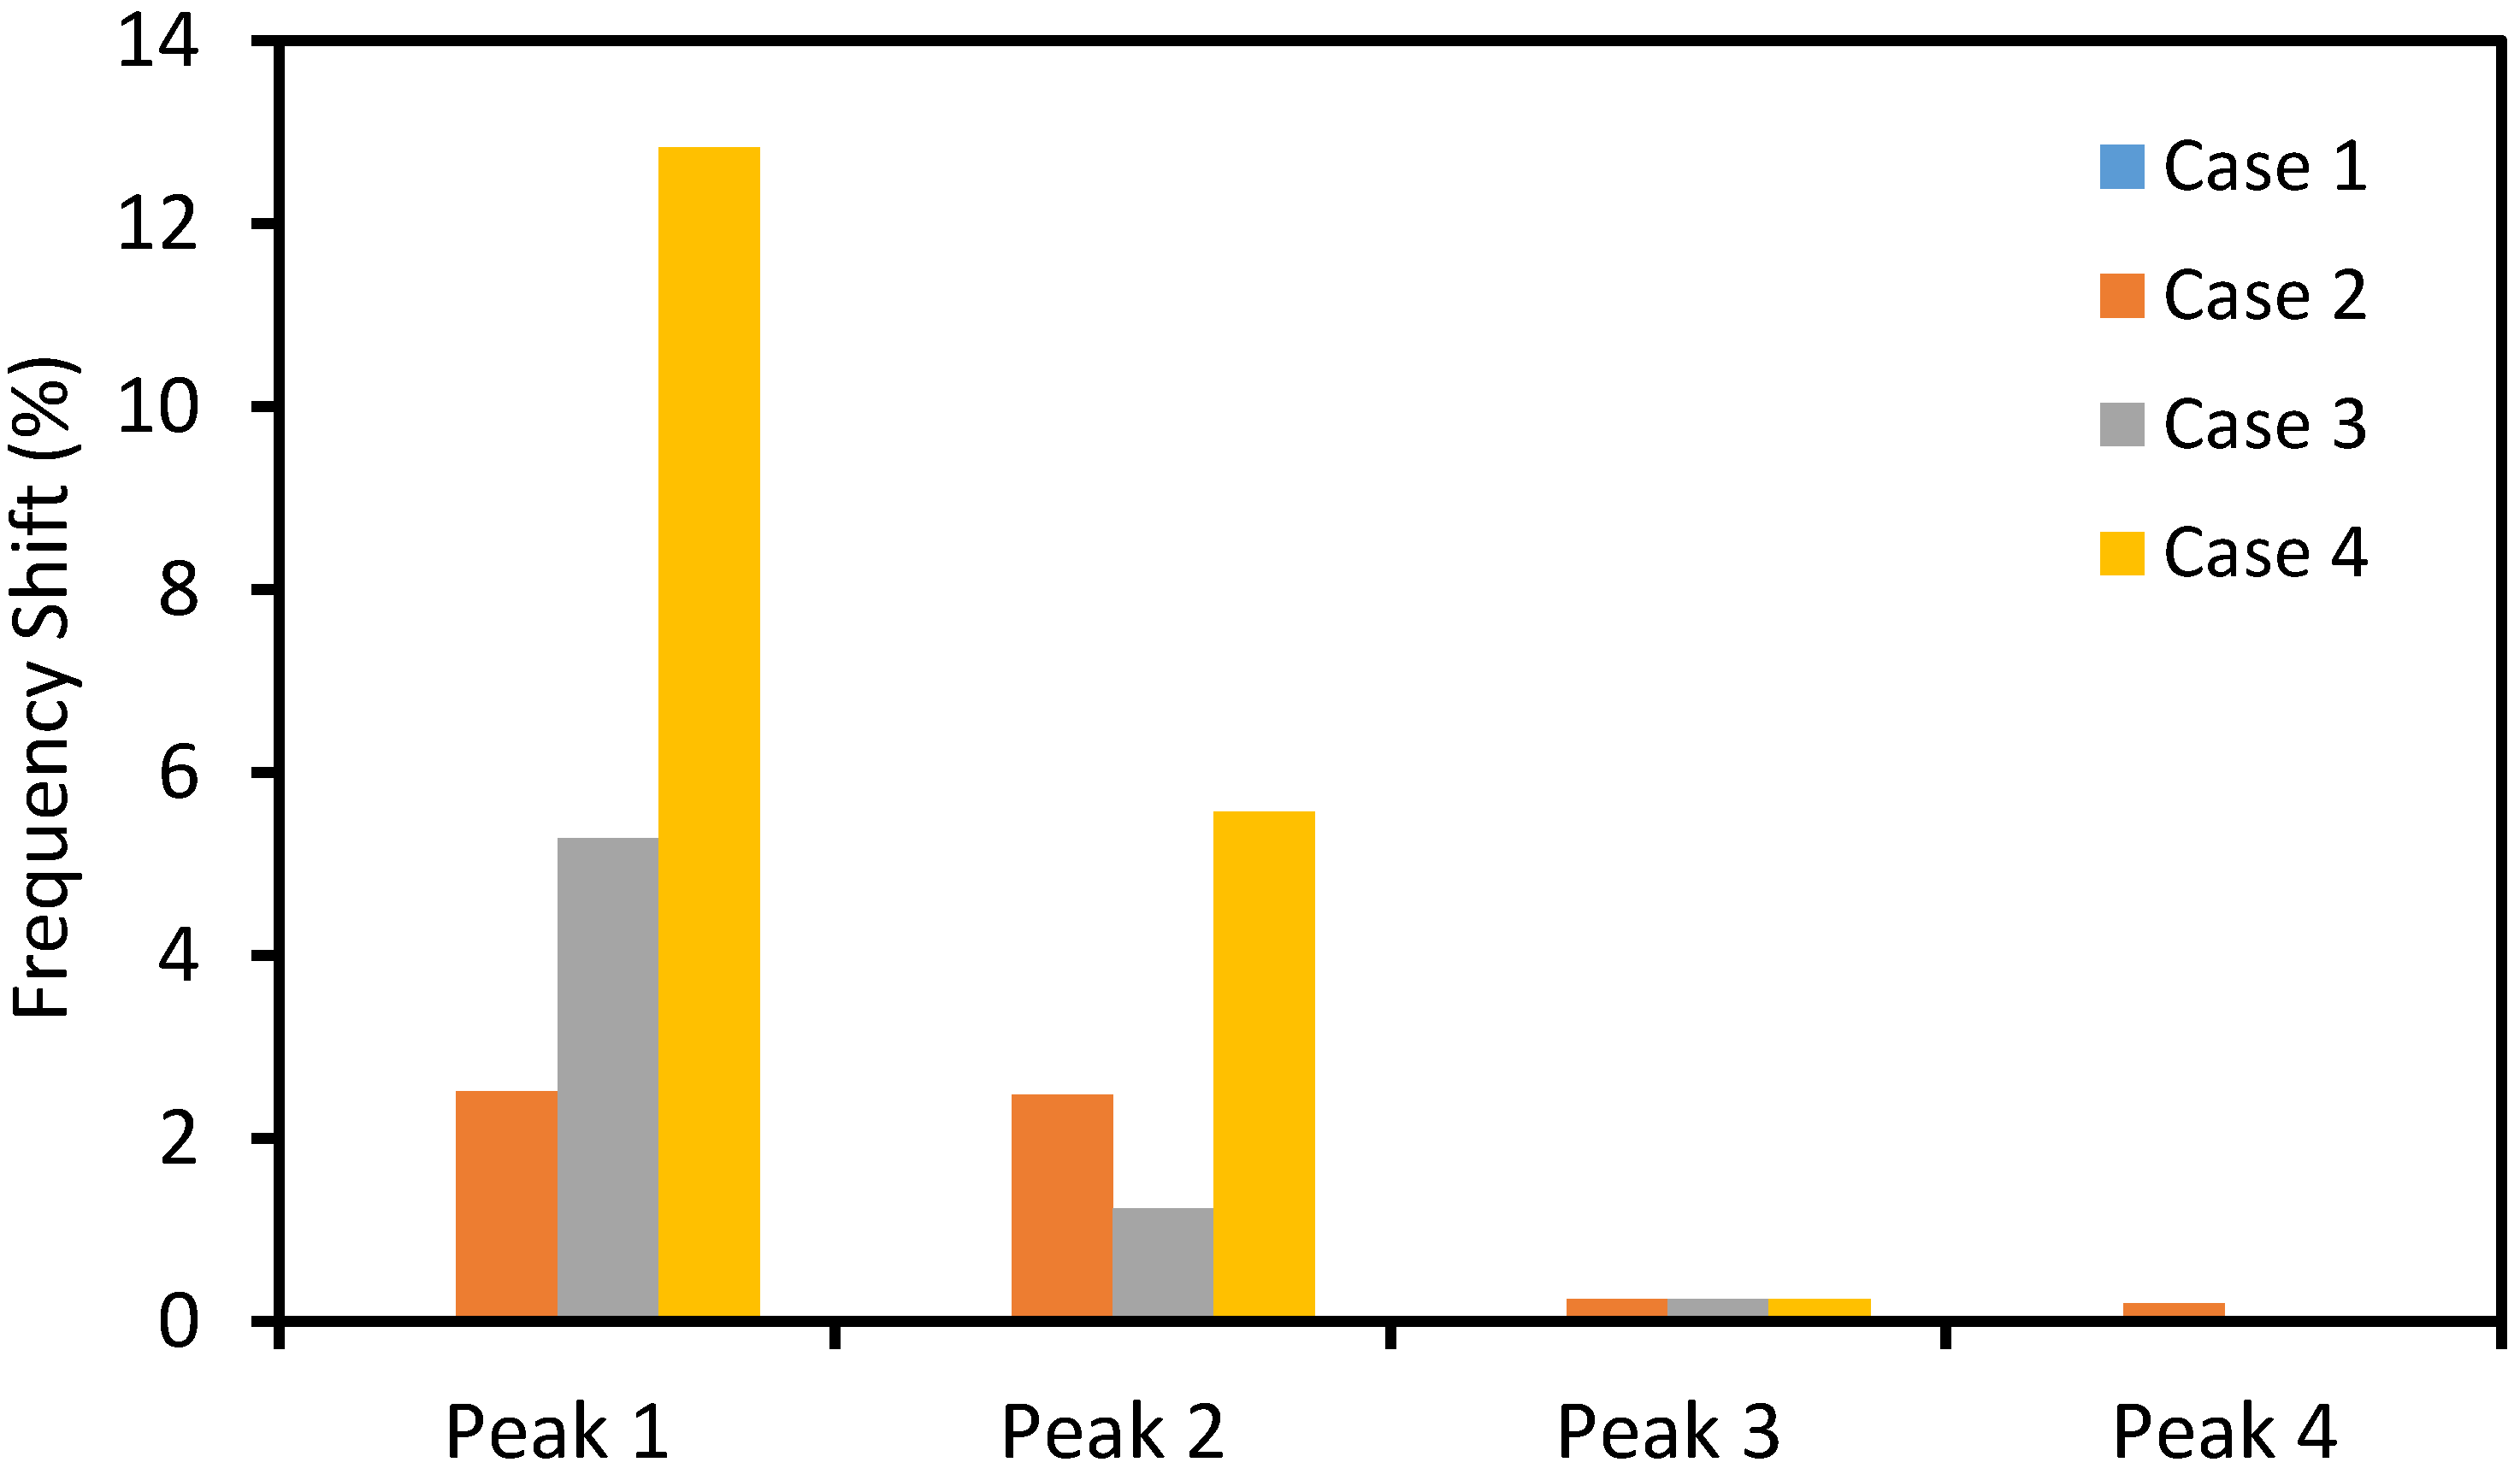
4.2. Numerical Feasibility of Single-Point Mount PZT Interface for Anchor Force Monitoring
5. Summary and Conclusions
Author Contributions
Funding
Data Availability Statement
Acknowledgments
Conflicts of Interest
References
- Yang, Y.; Hu, Y.; Lu, Y. Sensitivity of PZT Impedance Sensors for Damage Detection of Concrete Structures. Sensors 2008, 8, 327–346. [Google Scholar] [CrossRef] [Green Version]
- Yang, W.; Yang, X.; Li, S. Monitoring of Interfacial Debonding of Concrete Filled Pultrusion-GFRP Tubular Column Based on Piezoelectric Smart Aggregate and Wavelet Analysis. Sensors 2020, 20, 2149. [Google Scholar] [CrossRef] [PubMed] [Green Version]
- Na, W.S.; Baek, J. A Review of the Piezoelectric Electromechanical Impedance Based Structural Health Monitoring Technique for Engineering Structures. Sensors 2018, 18, 1307. [Google Scholar] [CrossRef] [Green Version]
- Huynh, T.-C.; Kim, J.-T. RBFN-based temperature compensation method for impedance monitoring in prestressed tendon anchorage. Struct. Control Health Monit. 2018, 25, e2173. [Google Scholar] [CrossRef]
- Negi, P.; Chakraborty, T.; Bhalla, S. Viability of electro-mechanical impedance technique for monitoring damage in rocks under cyclic loading. Acta Geotech. 2021, 1–13. [Google Scholar] [CrossRef]
- Park, G.; Inman, D.J. Impedance-Based Structural Health Monitoring. In Damage Prognosis for Aerospace, Civil and Mechanical Systems; Wiley: Hoboken, NJ, USA, 2005. [Google Scholar] [CrossRef]
- Tseng, K.K.; Wang, L. Impedance-Based Method for Nondestructive Damage Identification. J. Eng. Mech. 2005, 131, 58–64. [Google Scholar] [CrossRef]
- Huynh, T.-C.; Lee, S.-Y.; Dang, N.-L.; Kim, J.-T. Sensing Region Characteristics of Smart Piezoelectric Interface for Damage Monitoring in Plate-Like Structures. Sensors 2019, 19, 1377. [Google Scholar] [CrossRef] [Green Version]
- Kim, J.-T.; Park, J.-H.; Hong, D.-S.; Park, W.-S. Hybrid health monitoring of prestressed concrete girder bridges by sequential vibration-impedance approaches. Eng. Struct. 2010, 32, 115–128. [Google Scholar] [CrossRef]
- Min, J.; Park, S.; Yun, C.-B. Impedance-based structural health monitoring using neural networks for autonomous frequency range selection. Smart Mater. Struct. 2010, 19, 125011. [Google Scholar] [CrossRef]
- Park, S.; Shin, H.-H.; Yun, C.-B. Wireless impedance sensor nodes for functions of structural damage identification and sensor self-diagnosis. Smart Mater. Struct. 2009, 18, 055001. [Google Scholar] [CrossRef]
- Park, J.-H.; Kim, J.-T.; Hong, D.-S.; Mascarenas, D.; Lynch, J.P. Autonomous smart sensor nodes for global and local damage detection of prestressed concrete bridges based on accelerations and impedance measurements. Smart Struct. Syst. 2010, 6, 711–730. [Google Scholar] [CrossRef]
- Nguyen, K.-D.; Kim, J.-T. Smart PZT-interface for wireless impedance-based prestress-loss monitoring in tendon-anchorage connection. Smart Struct. Syst. 2012, 9, 489–504. [Google Scholar] [CrossRef]
- Perera, R.; Pérez, A.; García-Diéguez, M.; Zapico-Valle, J.L. Active Wireless System for Structural Health Monitoring Applications. Sensors 2017, 17, 2880. [Google Scholar] [CrossRef] [Green Version]
- Yan, S.; Sun, W.; Song, G.; Gu, H.; Huo, L.-S.; Liu, B.; Zhang, Y.-G. Health monitoring of reinforced concrete shear walls using smart aggregates. Smart Mater. Struct. 2009, 18, 047001. [Google Scholar] [CrossRef]
- Song, G.; Gu, H.; Mo, Y.-L. Smart aggregates: Multi-functional sensors for concrete structures—A tutorial and a review. Smart Mater. Struct. 2008, 17, 033001. [Google Scholar] [CrossRef]
- Fan, S.; Zhao, S.; Kong, Q.; Song, G. An embeddable spherical smart aggregate for monitoring concrete hydration in very early age based on electromechanical impedance method. J. Intell. Mater. Syst. Struct. 2021, 32, 537–548. [Google Scholar] [CrossRef]
- Le, T.-C.; Phan, T.T.V.; Nguyen, T.-H.; Ho, D.-D.; Huynh, T.-C. A Low-Cost Prestress Monitoring Method for Post-Tensioned RC Beam Using Piezoelectric-Based Smart Strand. Buildings 2021, 11, 431. [Google Scholar] [CrossRef]
- Ryu, J.-Y.; Huynh, T.-C.; Kim, J.-T. Tension Force Estimation in Axially Loaded Members Using Wearable Piezoelectric Interface Technique. Sensors 2019, 19, 47. [Google Scholar] [CrossRef] [PubMed] [Green Version]
- Li, W.; Liu, T.; Zou, D.; Wang, J.; Yi, T.-H. PZT based smart corrosion coupon using electromechanical impedance. Mech. Syst. Signal Process. 2019, 129, 455–469. [Google Scholar] [CrossRef]
- Nguyen, K.-D.; Lee, S.-Y.; Lee, P.-Y.; Kim, J.-T. Wireless SHM for bolted connections via multiple PZT-interfaces and Imote2-platformed impedance sensor node. In Proceedings of the 6ANCRiSST, Dalian, China, 25–26 July 2011. [Google Scholar]
- Huynh, T.-C.; Kim, J.-T. Impedance-Based Cable Force Monitoring in Tendon-Anchorage Using Portable PZT-Interface Technique. Math. Probl. Eng. 2014, 2014, 784731. [Google Scholar] [CrossRef]
- Dang, N.; Huynh, T.; Pham, Q.; Lee, S.; Kim, J. Damage-sensitive impedance sensor placement on multi-strand anchorage based on local stress variation analysis. Struct. Control Health Monit. 2020, 27, 2547. [Google Scholar] [CrossRef]
- Huynh, T.-C.T.; Kim, J.-T. Quantification of temperature effect on impedance monitoring via PZT interface for prestressed tendon anchorage. Smart Mater. Struct. 2017, 26, 125004. [Google Scholar] [CrossRef]
- Le, T.-C.; Ho, D.-D.; Huynh, T.-C. Anchor Force Monitoring Using Impedance Technique with Single-Point Mount Lead-Zirconate-Titanate Interface: A Feasibility Study. Buildings 2021, 11, 382. [Google Scholar] [CrossRef]
- Huynh, T.-C.; Kim, J.-T. Quantitative damage identification in tendon anchorage via PZT interface-based impedance monitoring technique. Smart Struct. Syst. 2017, 20, 181–195. [Google Scholar]
- Liang, C.; Sun, F.P.; Rogers, C.A. Coupled Electro-Mechanical Analysis of Adaptive Material Systems—Determination of the Actuator Power Consumption and System Energy Transfer. J. Intell. Mater. Syst. Struct. 1994, 5, 12–20. [Google Scholar] [CrossRef]
- Xu, Y.G.; Liu, G.R. A Modified Electro-Mechanical Impedance Model of Piezoelectric Actuator-Sensors for Debonding Detection of Composite Patches. J. Intell. Mater. Syst. Struct. 2002, 13, 389–396. [Google Scholar] [CrossRef]
- Yang, Y.; Liu, H.; Annamdas, V.G.M.; Soh, C.K. Monitoring damage propagation using PZT impedance transducers. Smart Mater. Struct. 2009, 18, 045003. [Google Scholar] [CrossRef]
- Sun, F.P.; Chaudhry, Z.; Liang, C.; Rogers, C.A. Truss Structure Integrity Identification Using PZT Sensor-Actuator. J. Intell. Mater. Syst. Struct. 1995, 6, 134–139. [Google Scholar] [CrossRef]
- Saravanan, T.J.; Balamonica, K.; Priya, C.B.; Gopalakrishnan, N.; Murthy, S.G.N. Piezoelectric EMI–Based Monitoring of Early Strength Gain in Concrete and Damage Detection in Structural Components. J. Infrastruct. Syst. 2017, 23, 04017029. [Google Scholar] [CrossRef]
- Zagrai, A.N.; Giurgiutiu, V. Electro-Mechanical Impedance Method for Crack Detection in Thin Plates. J. Intell. Mater. Syst. Struct. 2001, 12, 709–718. [Google Scholar] [CrossRef]
- Uddin, N.; Islam, S.; Sampe, J.; Ali, S.H.M.; Bhuyan, M. Design and simulation of piezoelectric cantilever beam based on mechanical vibration for energy harvesting application. In Proceedings of the 2016 International Conference on Innovations in Science, Engineering and Technology (ICISET), Dhaka, Bangladesh, 28–29 October 2016; pp. 1–4. [Google Scholar]
- Bin Mansoor, M.; Köble, S.; Wong, T.W.; Woias, P.; Goldschmidtböing, F. Design, Characterization and Sensitivity Analysis of a Piezoelectric Ceramic/Metal Composite Transducer. Micromachines 2017, 8, 271. [Google Scholar] [CrossRef]
- Dang, N.-L.; Huynh, T.-C.; Kim, J.-T. Local Strand-Breakage Detection in Multi-Strand Anchorage System Using an Impedance-Based Stress Monitoring Method-Feasibility Study. Sensors 2019, 19, 1054. [Google Scholar] [CrossRef] [PubMed] [Green Version]
- Kim, J.-T.; Nguyen, K.-D.; Park, J.-H. Wireless Impedance Sensor Node and Interface Washer for Damage Monitoring in Structural Connections. Adv. Struct. Eng. 2012, 15, 871–885. [Google Scholar] [CrossRef]
- Huynh, T.-C. Structural parameter identification of a bolted connection embedded with a piezoelectric interface. Vietnam J. Mech. 2020, 42, 173–188. [Google Scholar] [CrossRef] [Green Version]
- Nguyen, T.-T.; Kim, J.-T.; Ta, Q.-B.; Ho, D.-D.; Phan, T.T.V.; Huynh, T.-C. Deep learning-based functional assessment of piezoelectric-based smart interface under various degradations. Smart Struct. Syst. 2021, 28, 69–87. [Google Scholar]
- Negi, P.; Chakraborty, T. Preliminary Experimental and Numerical Studies on PZT Patch and Rock Interaction: EMI Approach; Springer: Singapore, 2021; pp. 627–636. [Google Scholar]
- Huynh, T.-C.; Dang, N.-L.; Kim, J.-T. Preload Monitoring in Bolted Connection Using Piezoelectric-Based Smart Interface. Sensors 2018, 18, 2766. [Google Scholar] [CrossRef] [PubMed] [Green Version]
- Johnson, K.L. Contact Mechanics; Cambridge University Press: Cambridge, UK, 1985. [Google Scholar] [CrossRef]
- Ritdumrongkul, S.; Abe, M.; Fujino, Y.; Miyashita, T. Quantitative health monitoring of bolted joints using a piezoceramic actuator–sensor. Smart Mater. Struct. 2003, 13, 20–29. [Google Scholar] [CrossRef]
- Huynh, T.-C.; Park, Y.-H.; Park, J.-H.; Kim, J.-T. Feasibility Verification of Mountable PZT-Interface for Impedance Monitoring in Tendon-Anchorage. Shock Vib. 2015, 2015, 262975. [Google Scholar] [CrossRef] [Green Version]
- Ong, C.W.; Yang, Y.; Wong, Y.T.; Bhalla, S.; Lu, Y.; Soh, C.K. Effects of adhesive on the electromechanical response of a piezoceramic-transducer-coupled smart system. In Proceedings of the Smart Materials, Structures, and Systems, Bangalore, India, 14 October 2003; pp. 241–247. [Google Scholar]
- Gresil, M.; Yu, L.; Giurgiutiu, V.; Sutton, M. Predictive modeling of electromechanical impedance spectroscopy for composite materials. Struct. Health Monit. 2012, 11, 671–683. [Google Scholar] [CrossRef]
- Nguyen, B.-P.; Tran, Q.H.; Nguyen, T.-T.; Pradhan, A.M.S.; Huynh, T.-C. Understanding Impedance Response Characteristics of a Piezoelectric-Based Smart Interface Subjected to Functional Degradations. Complexity 2021, 2021, 1–24. [Google Scholar] [CrossRef]
- Cremer, L.; Heckl, M.; Petersson, B.A.T. Damping. In Structure-Borne Sound: Structural Vibrations and Sound Radiation at Audio Frequencies; Springer: Berlin/Heidelberg, Germany, 2005; pp. 149–235. [Google Scholar] [CrossRef]
- Huynh, T.-C.; Ho, D.-D.; Dang, N.-L.; Kim, J.-T. Sensitivity of Piezoelectric-Based Smart Interfaces to Structural Damage in Bolted Connections. Sensors 2019, 19, 3670. [Google Scholar] [CrossRef] [PubMed] [Green Version]


| Parameters | Steel Anchor Head and Bearing Plate | Aluminum Interface | Adhesive Layer |
|---|---|---|---|
| Young’s modulus (GPa) | 200 | 70 | 3 |
| Poisson’s ratio | 0.33 | 0.33 | 0.38 |
| Mass density (kg/m3) | 7850 | 2700 | 1700 |
| Damping ratio | 0.01 | 0.005 | 0.005 |
| Parameters | Value |
|---|---|
| Elastic compliance (m2/N) | |
| Dielectric coupling constant (C/N) | |
| Permittivity (Farad/m) | |
| Mass density (kg/m3) | 7750 |
| Damping loss factor | 0.005 |
| Dielectric loss factor, δ | 0.015 |
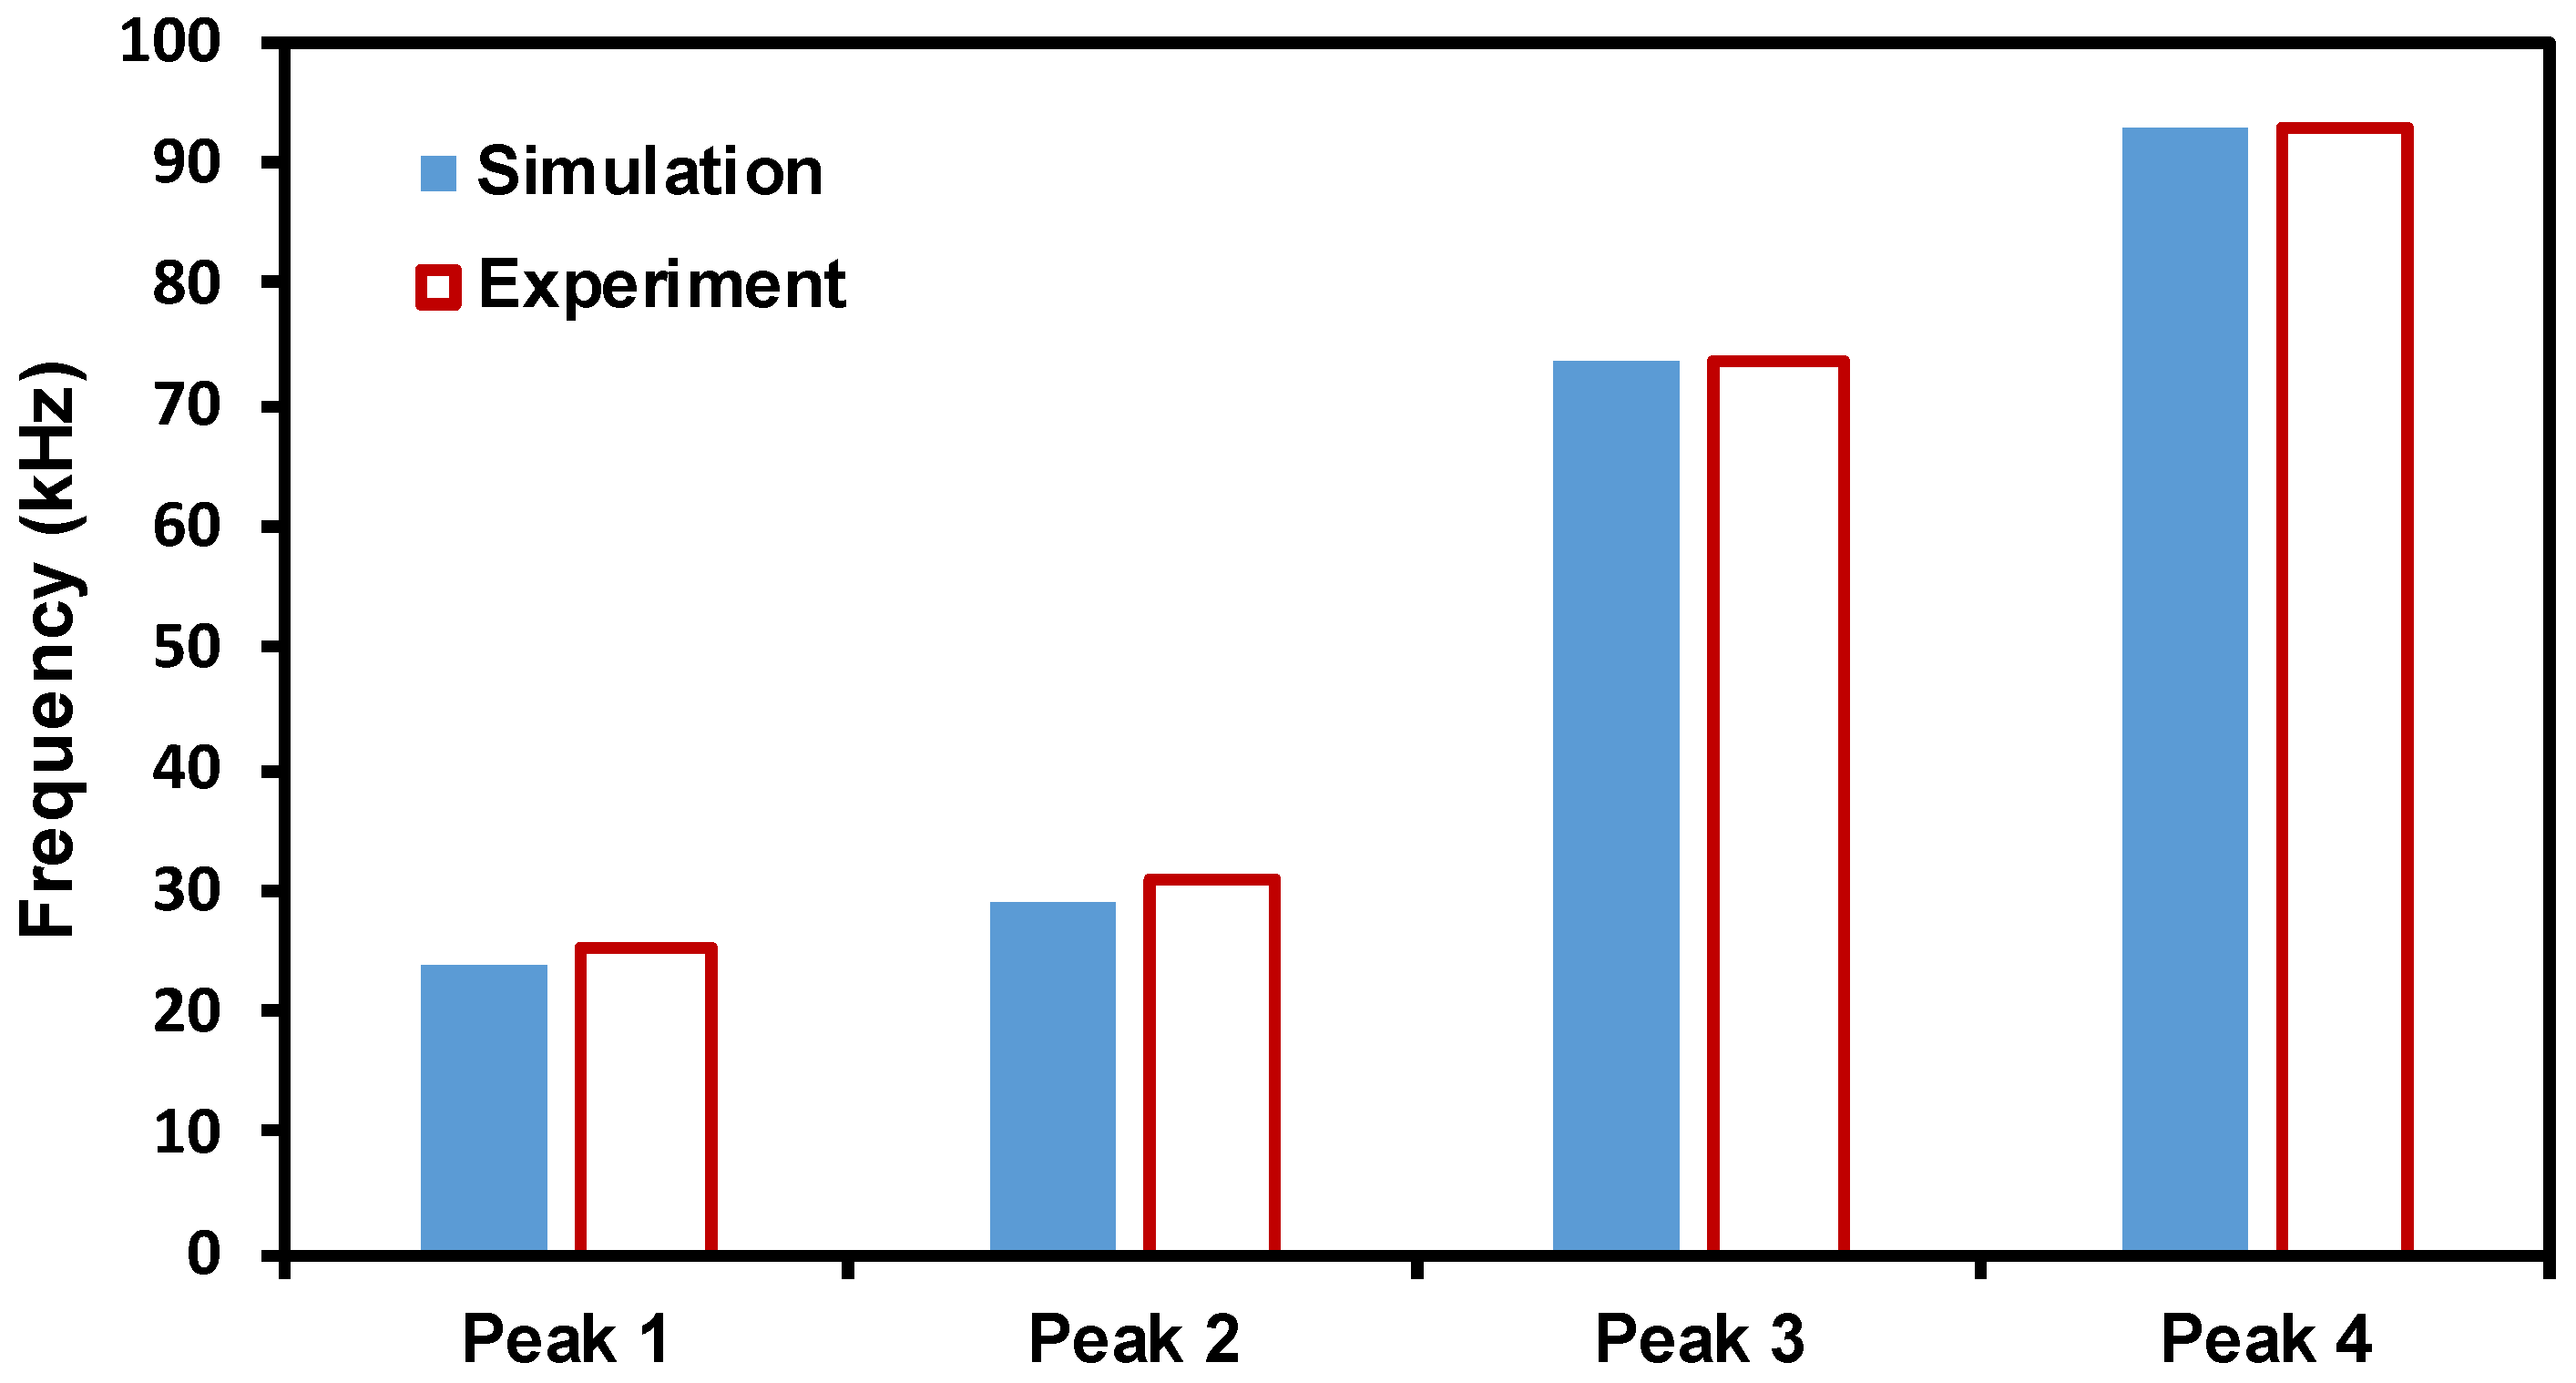
| Peak | Simulation (kHz) | Experiment (kHz) | Difference (kHz) | Error (%) |
|---|---|---|---|---|
| 1 | 23.86 | 25.3 | −1.44 | 5.69 |
| 2 | 29.08 | 30.7 | −1.62 | 5.28 |
| 3 | 73.54 | 73.36 | 0.18 | 0.24 |
| 4 | 92.62 | 92.98 | −0.36 | 0.39 |
| Damage Case | Area Contact Stiffness (N/m/m2) | Peak Frequency (kHz) | ||||
|---|---|---|---|---|---|---|
| kx = ky | kz | Peak 1 | Peak 2 | Peak 3 | Peak 4 | |
| Case 1 | 20 × 1011 | 40 × 1011 | 23.86 | 29.08 | 73.54 | 92.62 |
| Case 2 | 16 × 1011 | 32 × 1011 | 23.26 | 28.36 | 73.36 | 92.44 |
| Case 3 | 12 × 1011 | 24 × 1011 | 22.6 | 28.72 | 73.36 | 92.62 |
| Case 4 | 8 × 10¹¹ | 16 × 1011 | 20.8 | 27.46 | 73.36 | 92.62 |
Publisher’s Note: MDPI stays neutral with regard to jurisdictional claims in published maps and institutional affiliations. |
© 2021 by the authors. Licensee MDPI, Basel, Switzerland. This article is an open access article distributed under the terms and conditions of the Creative Commons Attribution (CC BY) license (https://creativecommons.org/licenses/by/4.0/).
Share and Cite
Nguyen, T.-H.; Phan, T.T.V.; Le, T.-C.; Ho, D.-D.; Huynh, T.-C. Numerical Simulation of Single-Point Mount PZT-Interface for Admittance-Based Anchor Force Monitoring. Buildings 2021, 11, 550. https://doi.org/10.3390/buildings11110550
Nguyen T-H, Phan TTV, Le T-C, Ho D-D, Huynh T-C. Numerical Simulation of Single-Point Mount PZT-Interface for Admittance-Based Anchor Force Monitoring. Buildings. 2021; 11(11):550. https://doi.org/10.3390/buildings11110550
Chicago/Turabian StyleNguyen, Trung-Hau, Thi Tuong Vy Phan, Thanh-Cao Le, Duc-Duy Ho, and Thanh-Canh Huynh. 2021. "Numerical Simulation of Single-Point Mount PZT-Interface for Admittance-Based Anchor Force Monitoring" Buildings 11, no. 11: 550. https://doi.org/10.3390/buildings11110550