Article

Carbon Neutral Roadmap of Commercial Building Operations by Mid-Century: Lessons from China

1
School of Management Science and Real Estate, Chongqing University, Chongqing 400045, China
2
Department of Earth System Science, Tsinghua University, Beijing 100084, China
*
Authors to whom correspondence should be addressed.
Buildings 2021, 11(11), 510; https://doi.org/10.3390/buildings11110510
Submission received: 24 September 2021 / Revised: 22 October 2021 / Accepted: 22 October 2021 / Published: 28 October 2021

Abstract

:
Carbon neutrality has positive impacts on people, nature and the economy, and buildings represent the “last mile” sector in the transition to carbon neutrality. Carbon neutrality is characterized by the decarbonization of operations and maintenance, in addition to zero emissions in electricity and other industry sectors. Taking China’s commercial buildings as an example, this study is the first to perform an extensive data analysis for a step-wise carbon neutral roadmap of building operations via the analysis of a dynamic emission scenario. The results reveal that the carbon emissions abatement of commercial building operations from 2001 to 2018 was 1460.85 (±574.61) mega-tons of carbon dioxide (Mt CO2). The carbon emissions of commercial building operations will peak in the year 2039 (±5) at 1364.31 (±258.70) Mt, with emission factors and energy intensity being the main factors influencing the carbon peak. To move toward carbon neutral status, an additional 169.73 Mt CO2 needs to be cut by 2060, and the low emission path toward carbon neutrality will lead to the realization of the carbon peak of commercial buildings in 2024, with total emissions of 921.71 Mt. It is believed that cutting emissions from the operation of buildings in China will require a multi-sectoral synergistic strategy. It is suggested that government, residents, enterprises, and other stakeholders must better appreciate the challenges to achieve a substantial carbon reduction and the need for urgent action in the building sector in order to achieve carbon neutrality.

1. Introduction

Building operations and the construction industry are, together, responsible for over one-third of final energy use and nearly 40% of total direct and indirect carbon emissions worldwide [1,2]. An expanding population and quickly growing service demand in the developing world (especially emerging economies) require additional energy use for buildings, which will increase 50% by mid-century [3]. Moreover, building floor space is expected to double by 2060, leading to continual resource consumption in the global construction industry [4]. As the largest emitter worldwide, China has pledged to reach its carbon peak before 2030 and, further, to be carbon neutral by 2060 [5]. In the process of achieving carbon neutrality, commercial buildings are still facing rapidly increasing energy demand from the active service industry, which leads to commercial buildings being the “last mile” sector in the carbon neutral transition [6]. Specifically, carbon emissions released by commercial building operations have grown rapidly, at an annual rate of 6.83% during the past decade [7], and total emissions in 2018 reached 881 mega-tons of CO2 (Mt CO2) [8].
The low-carbon transition in buildings is progressing slowly even though buildings show the greatest potential for cost-effective emissions reduction through current strategies and technologies (e.g., net-zero energy building [9,10]), compared with the potential in industry and transportation sectors [11]. Researchers at Berkeley Lab simulated the projected carbon emissions in China’s building sector and showed that the energy demand of commercial building operations would peak as early as 2040 [12]. Therefore, buildings will become a significant challenge to the realization of China’s 2030 carbon peak goal that was pledged in the Paris Agreement. Nevertheless, the above benchmark was set via a static scenario analysis, which gave little consideration to the influence of uncertainty in energy and emission peaks. The limited peak scheme may mislead the government into planning unfeasible emission abatement targets and further hinder the achievement of carbon neutrality by 2060. Thereby, in this study, the following three queries are raised regarding the future of commercial buildings in China:
  • How much historical emission abatement has been observed in commercial building operations?
  • What are the projected carbon peaks contemplating the impacts of uncertainty?
  • How can a step-wise carbon neutral roadmap by mid-century be illustrated?
To address the queries above, this study makes the first attempt to perform an extensive data analysis for a step-wise carbon neutral roadmap of the future commercial building operations until mid-century. Technically, this study characterizes the commercial building emissions model with several factors (including population, technical advancement level, and the socioeconomic process) through the Kaya identity [13], evaluates the carbon emission abatement in 2001–2018 via decomposition analysis, and illustrates the projected emissions up to 2060 in different scenarios through dynamic scenario analysis. For the application, steps to carbon neutrality in the future commercial building operations are proposed. To assist in achieving carbon neutral targets, energy benchmarks in the carbon neutral goal for future building operations are derived. Moreover, a set of strategies for the low carbon transition in future commercial building operations are suggested for buildings to better realize the earliest goals of the emission peak and carbon neutrality.
In an age of carbon neutral transition, the most important advance of this study is to illustrate a step-wise carbon neutral roadmap of commercial building operations by mid-century through dynamic emission scenario analysis. At present, few studies have made such an investigation of commercial building operations. As far as the authors know, the existing literature has mapped projections of carbon emissions based on static scenario analysis, and has not considered the impacts of uncertainty caused by variable changes in the emission assessment models. Thus, it is difficult to achieve carbon abatement goals required for the low carbon transition (or decarbonization) through the proposed schemes, as noted in the subsequent sections of this study. A literature review is conducted in Section 2. Section 3 describes the materials and methods used, including the emission assessment model, past emission abatement evaluation, and dynamic emission scenario analysis. In addition, variable definition and data collection are also outlined in this section. Section 4 illustrates the change in carbon abatement, reveals the projected emission pathways, and investigates the sources of uncertainty of the carbon peak of commercial building operations. Section 5.1 discusses a step-wise carbon neutral roadmap of commercial building operations by mid-century. Section 5.2 derives the energy benchmarks of future commercial building operations to facilitate their carbon neutrality, and Section 5.3 suggests low carbon transition strategies to move towards carbon neutrality. Section 6 presents the main conclusions and discusses forthcoming works.

2. Literature Review

Data accounting is the first step to evaluate carbon abatement and illustrate the projected carbon peaks [14]. In the developed world, an energy survey is an important method for investigating the features of end-use energy and emissions in commercial building operations. Since 1979, the Commercial Buildings Energy Consumption Survey (CBCES) has been periodically conducted by the Energy Information Agency of the United States. By 2018, the 11th CBCES had investigated over 6400 commercial buildings nationwide to collect their energy use data [15]. In the developing world, and specifically for the commercial buildings in China, despite having the largest monitoring system of energy use worldwide [16], the current sample is still not large enough to reliably account for the carbon released by building operations [8]. To fill this gap, the China Association of Building Energy Efficiency proposed the China Building Energy and Emission Database (CBEED) based on the energy balance sheet, which includes the stock, emissions, and energy use of different kinds of buildings in China. Furthermore, the suitability of CBEED has been examined by other studies to assess the long-term scenarios of building operation in China [17].
Regression estimation and scenario analysis are two of the main methods to investigate future carbon emission changes [18]. Regression estimation illustrates the shape of projected carbon emissions, and the feature can normally be characterized by the environmental Kuznets curve (EKC) [19,20]; a typical EKC shows an inverse U-shaped relationship between economic and environmental indicators [21]. Liang et al. [22] applied EKC estimation to investigate the coupling effect of carbon intensity and economic development of residential buildings, and they found the peak of the total emissions had not yet occurred, even though the peak of carbon intensity had already been reached. Moreover, Ma et al. [23] also observed a similar characterization in commercial buildings through EKC estimation, and found that a significant effort will be required for commercial buildings to reach the carbon peak in the near future. Although regression estimation based on EKC is an effective means to analyze past carbon emissions following economic growth [24], it is unable to clearly reveal the projected carbon peak year by year [25]. A few studies have attempted to address this gap through scenario analysis. Wang et al. [26] investigated the decarbonization of building operations globally across scenarios of 1.5–2 °C. To achieve the global 2 °C goal, it is believed that a total reduction of 6000 Mt CO2 will be required until mid-century. At the national scale, researchers at Berkeley Lab investigated the energy transition roadmap of China’s building operations and revealed that commercial buildings are expected to reach their energy demand of 600 mega-tons of standard coal equivalent (Mtce) by 2040 [12].
Nevertheless, the results mentioned above based on static analyses, and the researchers gave little consideration to the uncertainty of potential carbon emissions resulting from variable changes in the building emissions models. A dynamic scenario analysis that considers the influence of uncertainty for future carbon emissions in building operations is therefore needed. Based on the approach of emissions accounting and scenario analysis of projected carbon emissions, two key gaps should be noted as follows:
Regarding the projected carbon emissions of commercial building operations, few investigations have been conducted that simulate the carbon peak and net-zero emissions, in which the influence of uncertainty is considered. This shows that the uncertainty of the projected emissions resulting from variable changes in the emission model has not been considered, and the proposed carbon peak schemes are finite. Furthermore, the abatement goals set by governments lack accuracy and feasibility. Thus, a dynamic emission scenario analysis is required to address uncertainty in upcoming studies, thereby fulfilling this gap.
Regarding the steps toward carbon neutrality in commercial building operations by mid-century, China has pledged that it will achieve carbon neutrality by 2060, and it is believed that buildings will be the “last-mile” sector to realize this net-zero emission goal. Based on the current emissions level, it is believed that it will be difficult to achieve carbon neutrality in commercial building operations in the coming four decades. However, no assessment has been undertaken to determine the probability of such an event. Thus, in the age of carbon neutrality, a reliable assessment and step-wise scheme for future commercial building operations to achieve net-zero emissions should be conducted.
The current situation indicates that considering uncertainty in future carbon emissions dynamic scenario analysis in commercial building operations is urgently needed. Therefore, on the basis of past carbon abatement evaluation, this work focuses on a proposed dynamic scenario analysis to illustrate the decarbonization of China’s commercial building operations from 2000 to 2060, which addresses the gaps mentioned above. This study offers two main contributions:
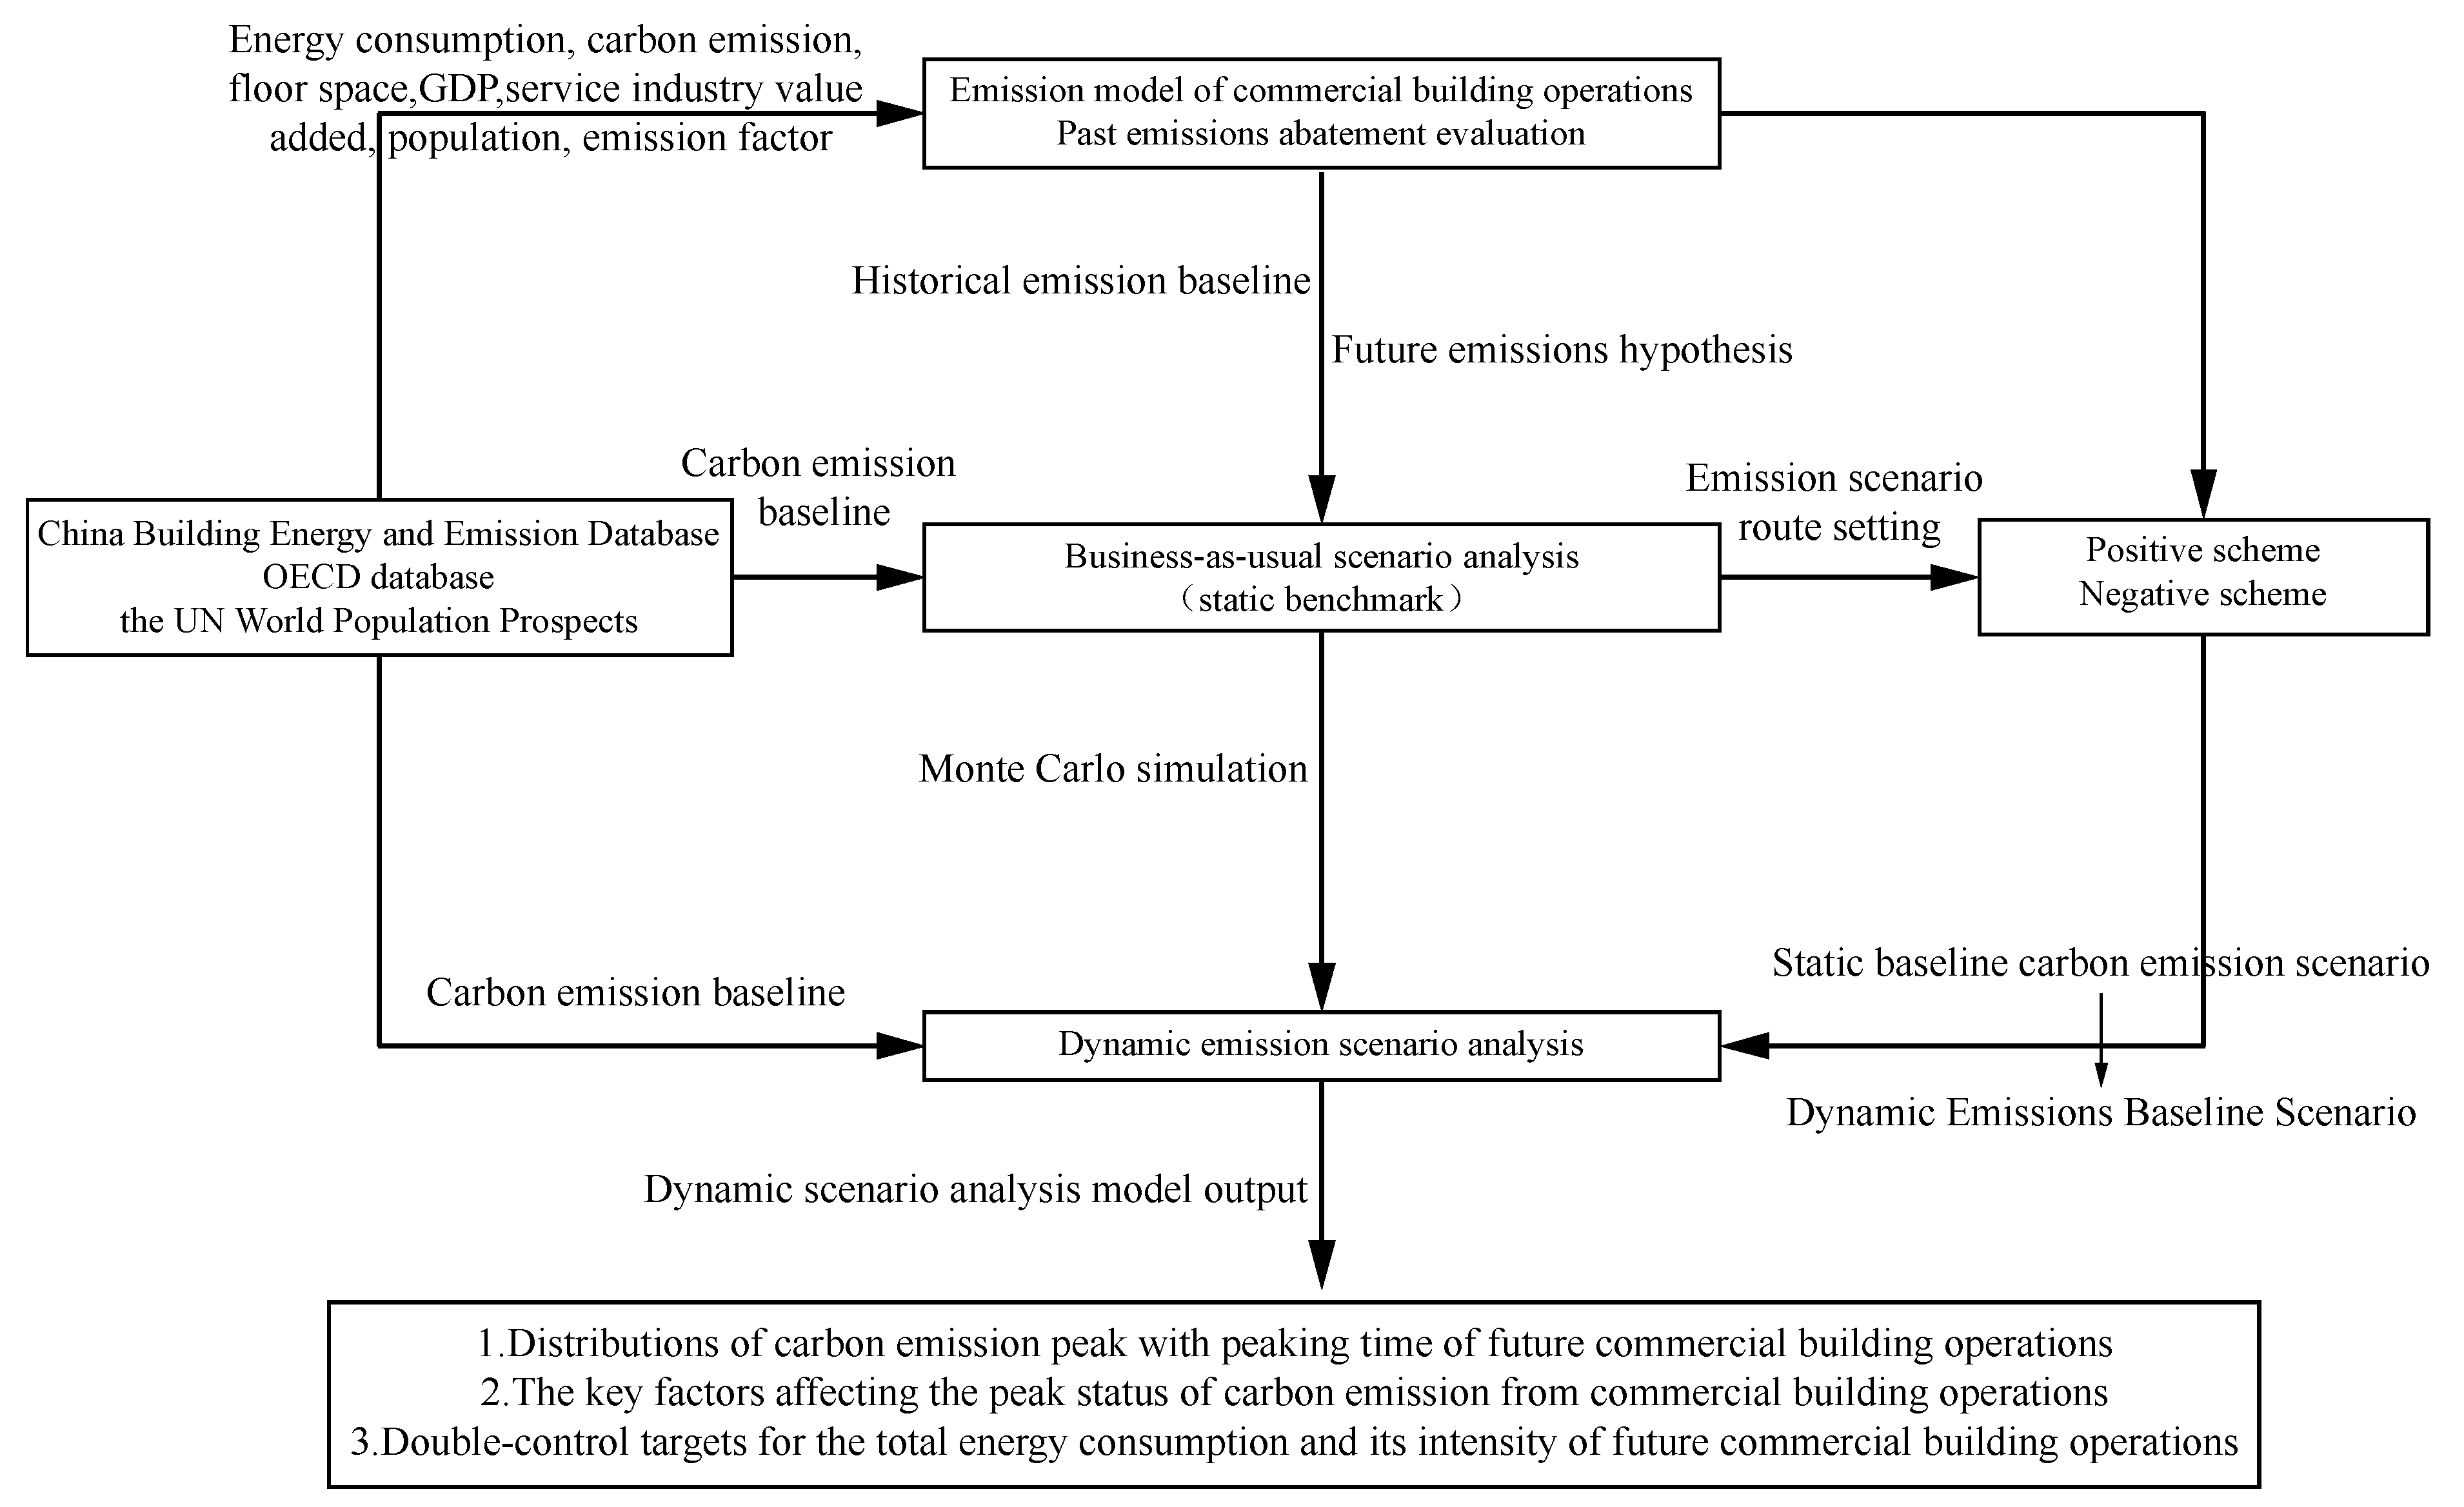
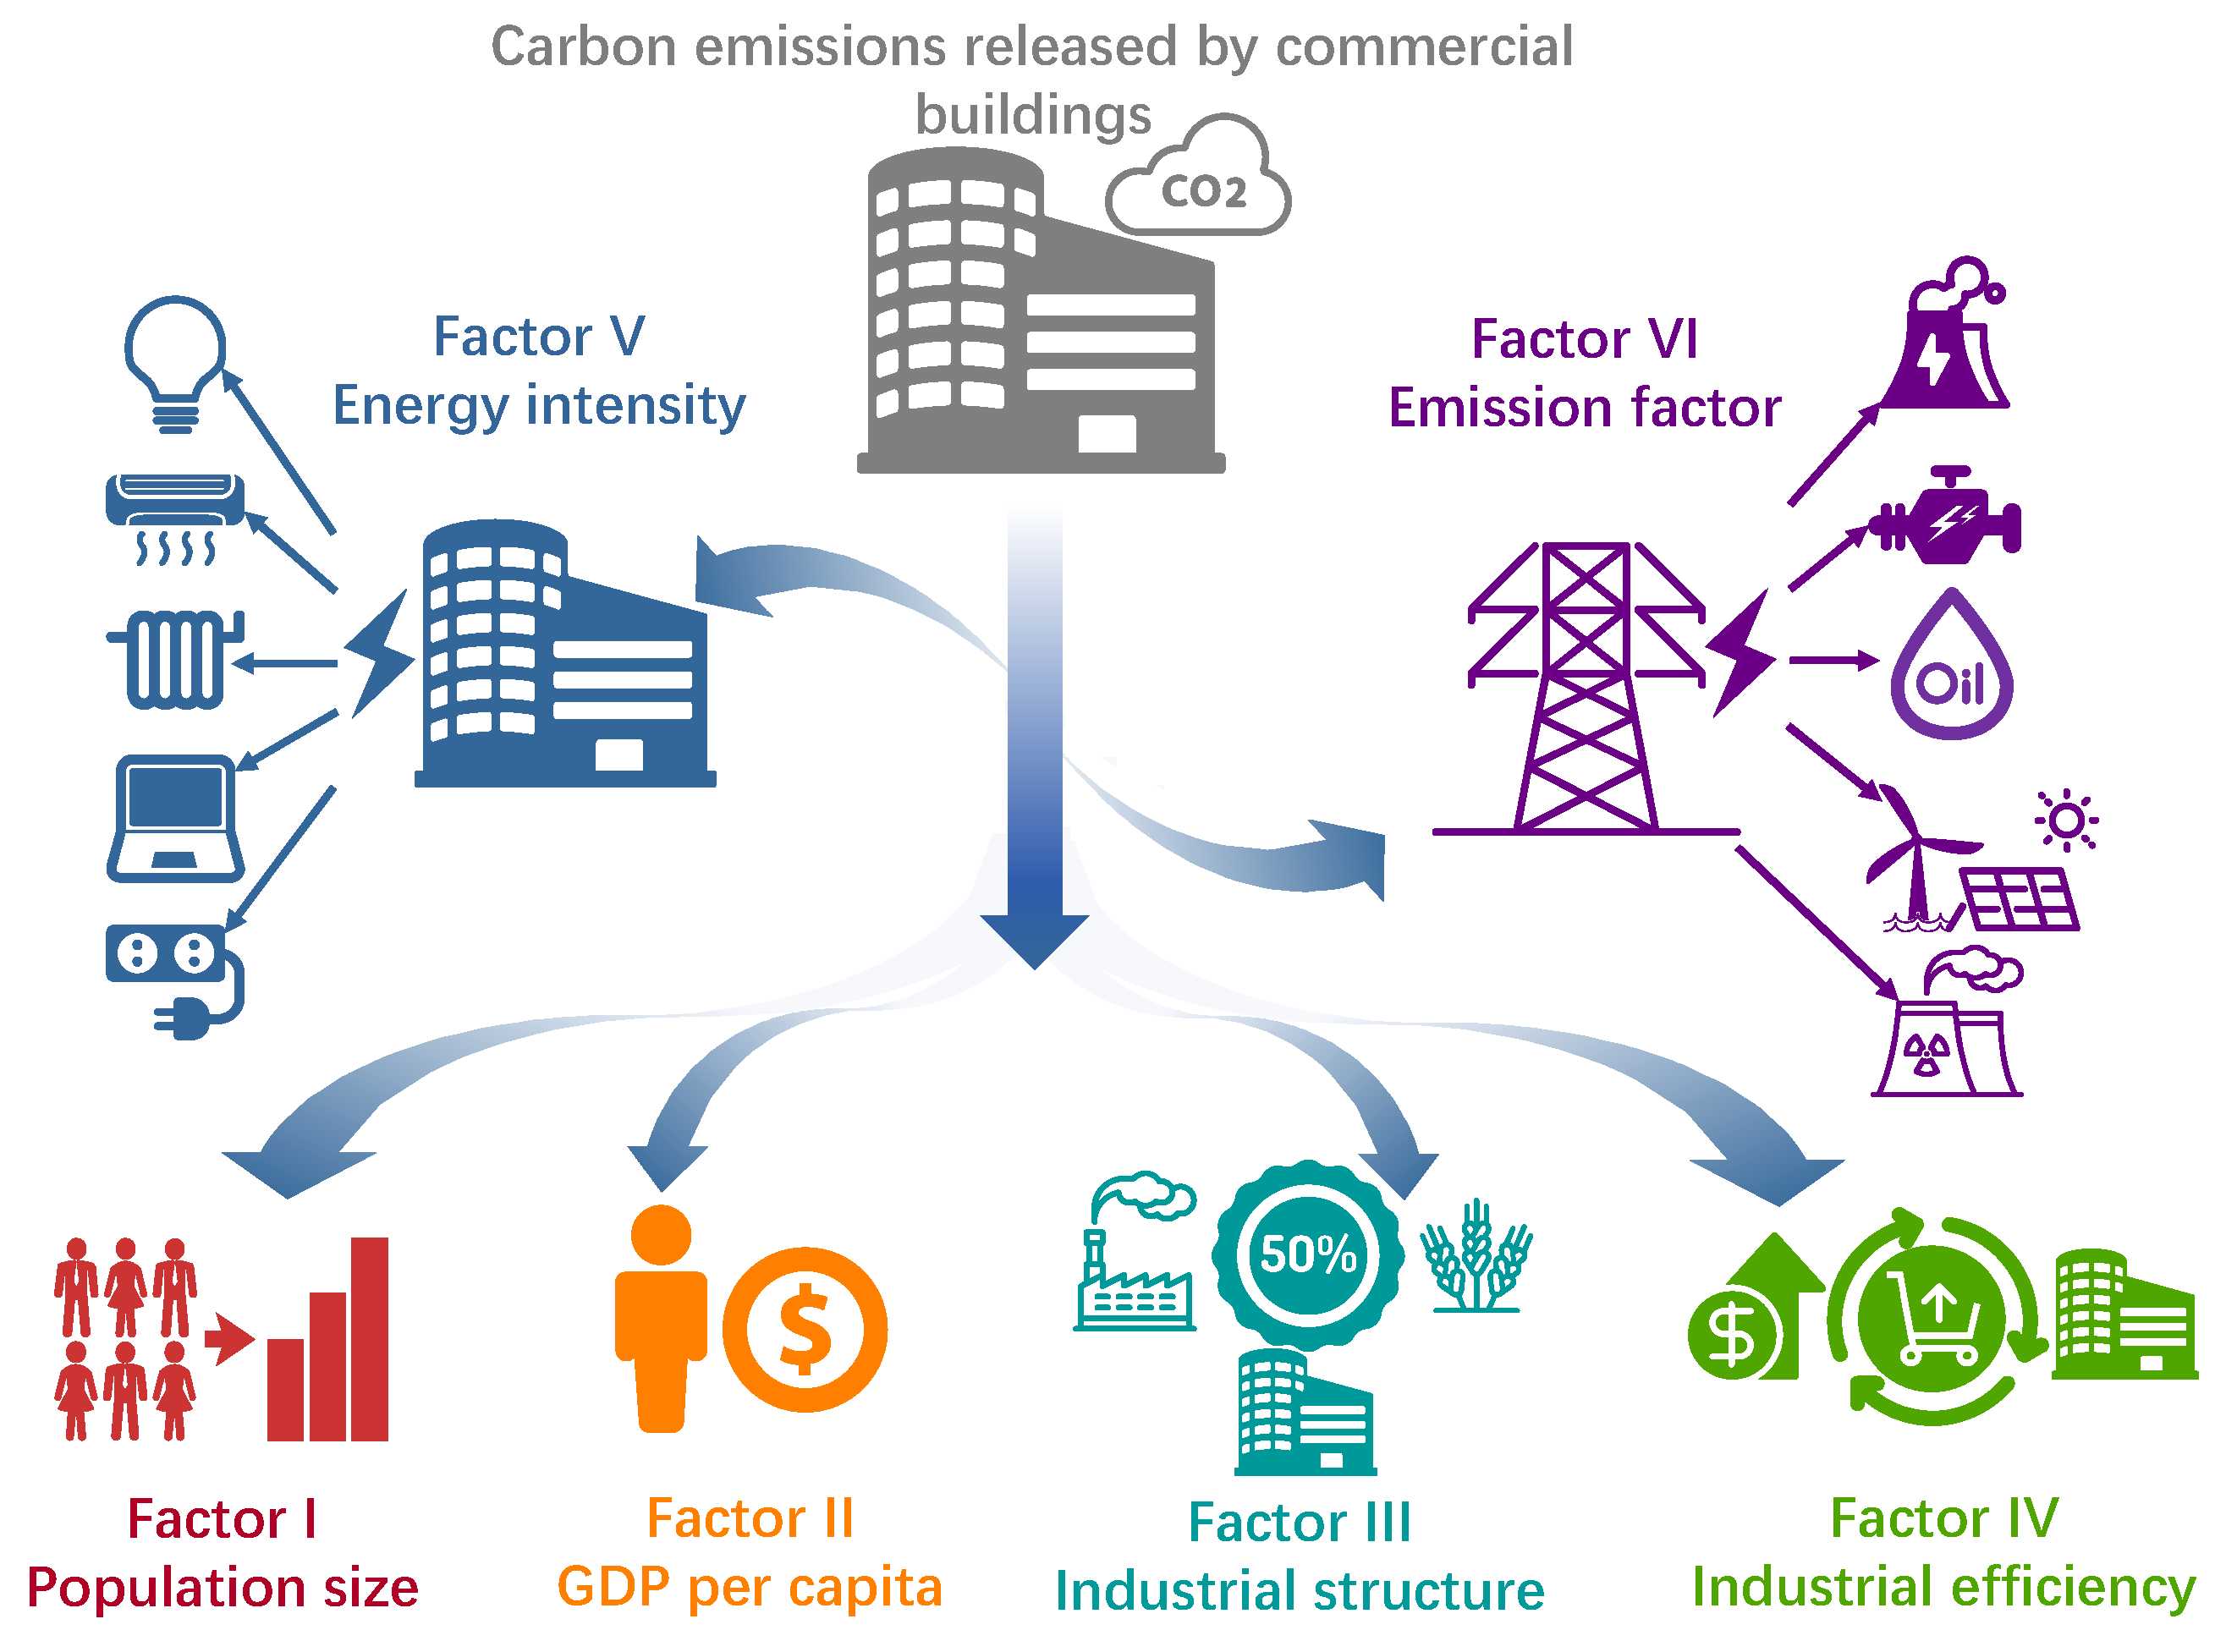
  • Carbon emissions areprojected including the impactsof uncertainty. Some studies have proposed static scenario analyses to show the future decarbonization of the building sector. However, few studies have considered the influence of uncertainty on the carbon peak status, especially in terms of commercial building operations. This study develops a dynamic scenario model to investigate the decarbonization approach in future commercial building operations by mid-century. Carbon emissions are characterized through the Kaya identity, and the potential scenarios are analyzed through Monte Carlo simulation.
  • A step-wise carbon neutral roadmap is programed for future commercial building operations. After simulating the projected carbon emissions of different scenarios, a decarbonization roadmap, which leads to commercial building operations achieving net-zero emission status, is proposed. Additionally, to help commercial building operations to achieve this goal, energy benchmarks of the carbon neutral goal for future building operations were derived. Furthermore, steps including a set of low-carbon transition strategies to move towards net-zero emission status are suggested to assist commercial building operations to achieve carbon neutrality.

3. Materials and Methods

In this section, we primarily develop a dynamic emission scenario analysis approach for commercial building operations. Specifically, this section characterizes the commercial building emissions (Section 3.1), evaluates the past emission abatement (Section 3.2), and sets the emission scenario and simulates it dynamically (Section 3.3). Furthermore, Section 3.4 presents the materials covering the dataset and variables. To show the study logic more clearly, a flowchart is used to explain the method and purpose step by step, as shown in Figure 1.

3.1. Emission Model of Commercial Building Operations

To evaluate past emissions abatement and simulate the prospective emission scenarios of commercial building operations, a few influencing factors were selected using the Kaya identity [13]. The Kaya identity (see Equation (1)) characterizes the carbon emissions through impact factors, including population (P) [27], technical advancement expressed by energy intensity [28] with its emission factor ( CO 2 E ) [29], and the socioeconomic process measured by GDP per capita ( GDP P ) [30].
CO 2 = P · E GDP   · CO 2 E · GDP P
A few classical studies extended the original Kaya identity to suitably illustrate the emission characteristics of commercial building operations [31]. Guided by the research of Ma et al. [8], this study developed a commercial building emissions model considering a series of impact factors, as illustrated in Figure 2 and Box 1.
Equations (1) and (2) demonstrate the logical flow of the extended Kaya identity in Figure 2, which is essential to evaluate the past emissions abatement and simulate the prospective emissions scenario of the commercial building operations [32].
C = P · G P · G s G · F G s · E F · K
Refined   as   C = P · g · S · I · e · K
Box 1. Indicators in the emission characterization
Indicator   I :   P Population   ( P ) Factor   II :   g GDP   per   capita   ( g = G P ) Factor   III :   S Industrial   structure   ( S = G s / G ) Factor   IV :   I Industrial   efficiency   of   the   service   industry   ( I = F / G s ) Factor   V :   e Operational   energy   intensity   ( e = E / F ) Factor   VI :   K Emission   factor   of   commercial   buildings   ( K = C / E )

3.2. Past Emissions Abatement Evaluation

Based on the emissions model (Equation (3)), this study investigates the impact of each factor on carbon emission changes and further seeks the source of past emissions abatement of the commercial building operations [33]. Thereby, Log-Mean Divisia Index (LMDI) decomposition was used to achieve this goal [34]. LMDI is a classical method used to quantify the impact of every factor that affects emissions changes [35,36]. Together with the Kaya identity, the emissions changes during the period of ∆T in the commercial building operations are decomposed as follows:
Δ C | 0 T = C | T C | 0 = ( Δ C P + Δ C g + Δ C S + Δ C I + Δ C e + Δ C K ) | 0 T
Therefore,
Δ C P = C | T C | 0 l n C | T l n C | 0 · l n ( P | T P | 0 )
Thereafter, the emissions abatement of the commercial building operations ( E M ) [37] in Period Δ T is defined as follows:
E M | 0 T =   Δ C i | 0 T
where
Δ C i   ( Δ C P ,   Δ C g ,   Δ C S ,   Δ C I ,   Δ C e ,   Δ C K ) , Δ C i | 0 T < 0

3.3. Dynamic Emission Scenario Analysis

To determine the low emissions pathway of commercial building operations in the future, this study attempted to simulate the prospective emissions peak through scenario analysis. This approach, which is a classical method to simulate the development of energy and emissions, has been extensively used [19]. In scenario analysis, once the scenario model changes the variable values, the simulated carbon emissions will provide feedback related to the change [38]. Technically, the significance of scenario analysis is to illustrate how carbon emissions will change under different policies and strategies to obtain a future low emissions model [39], rather than to simulate potential emissions through hypothetical technological [40] and socioeconomic targets [41].
In this section, we establish the emission scheme in the business-as-usual (BAU) scenario and then dynamically simulate the emissions scenario. In this manner, the energy system and its socioeconomic status in the commercial building operations was developed at the BAU level in the period 2000–2060. Thus, the economy of the service sector [42], the demand of the commercial energy service [43], and the energy efficiency of the building equipment [44] were used to develop following the current benchmark. Moreover, the prospective change interval of all variables in the emissions model (see Equation (3)) locks into the BAU level, which is the basis for simulating other scenarios [45].
Based on the emissions model, the static emissions scenario could be established. Once the BAU emissions scenario was established, the proposed scenario was simulated via the Monte Carlo approach. Monte Carlo simulation is a beneficial approach for uncertainty analysis and has been widely used to characterize uncertain emissions changes [46]. Combined with the simulation, the static emission model is transformed into its dynamic version, which considers the uncertainty led by the changes of model variable in Equation (3). Thereby, dynamic scenario analysis formulates the prospective pathways of energy and emissions into the future commercial building operations with different probabilities. Technically, this study conducted dynamic emissions analysis using three steps. First, the random values in different distributions were added into the factors of the extended Kaya identity (Equation (3)) to show the prospective interval of variable changes. Thereby, the static emissions model was transformed into the dynamic model (see Equation (8)). Thereafter, numerous simulation runs were carried out to establish the dynamic emission scenario via sampling of the random values of the variable in the emissions model. A total of 110,000 runs of Monte Carlo simulation were required to obtain stable outputs. Finally, the simulation distributions reflecting the prospective ranges of energy and emission changes were fitted to determine the peak and the peak time.
C D y n a m i c = C S t a t i c · ( 1 + ω · T 2018 2060 2018 ) ,       ω N ( 0 , σ )
Following dynamic emissions analysis, this study illustrated the intervals of energy and emission peaks with their peak times of the future commercial building operations with different probabilities.

3.4. Dataset

Historical data of the stock, energy, and emissions of building operations were accessed from the CBEED established by the authors’ team. Regarding the trends of the economy and population of China in 2000–2060, this study collected data via the OECD database and the UN World Population Prospects, respectively. Additionally, the main variables in the scenario analysis are listed in Table 1.

4. Results

4.1. Past Emissions Abatement in the Commercial Building Operations

To address the first query listed in the Introduction, namely past emissions abatement in commercial building operations, Figure 3 illustrates the past abatement of CO2 emissions from commercial building operations during 2001–2018, which was evaluated through Equations (6) and (7). To express the uncertainty of the abatement results at different scales, this study considered the annual error bar in the following three values: ±31.92 MtCO2 for total abatement, ±2.52 kgce·m−2 for abatement per floor space, and ±22.59 kgCO2 for abatement per capita.
During 2001–2018, the total emissions abatement from commercial building operations was assessed as 1460.85 (±574.61) MtCO2 (see Figure 3a). Specifically, the past abatement trend followed the “M+N”-shaped curve, which means the trend of annual emissions abatement was not monotonic. For the peak value, the abatement in 2014 was recognized as the highest, with a value of 134.98 MtCO2. Conversely, the valley of the emission abatement appeared in 2002, with a value of 29.71 MtCO2. Through fitting of the total emissions abatement results, it can be observed that the accumulative emission abatement grew consistently by 79.43 MtCO2 per year (see Figure 3a), although the changing trend in emissions abatement continued to fluctuate in 2001–2018. Regarding the intensity change in emissions abatement in commercial building operations, Figure 3b shows that the change in past abatement intensity also followed an “M + N”-shaped curve, compared to the change in total past abatement. Specifically, the abatement intensity in the following four periods was 7.69 (±2.52) kgce·m−2·yr−1 for 2001–2005, 11.18 (±2.52) kgce·m−2·yr−1 for 2006–2010, 11.11 (±2.52) kgce·m−2·yr−1 for 2011–2015, and 8.72 (±2.52) kgce·m−2·yr−1 for 2016–2018. It should be noted that the change trend of emissions abatement per capita was similar to that of emissions abatement intensity during 2001–2018. Due to space limitations, the description of the change in the abatement per capita is not discussed further. To summarize, the past emissions abatement evaluation addresses query 1 of Section 1.

4.2. Emissions Paths of Future Commercial Building Operations

To answer the second issue in the Introduction, namely the emissions paths of future commercial building operations, Figure 4a expresses the emissions path of the commercial buildings up to 2060. The curve in light purple following the inversed U-shaped path shows the projected emissions of future commercial building operations with the BAU scenario. The BAU emissions reveal that the carbon emissions of future commercial building operations will peak in 2040 with a value of 1344.07 MtCO2. Furthermore, to run the dynamic emission simulation based on the BAU dataset, the potential ranges following various probabilities are illustrated by the error bands, as shown in Figure 4a.
Figure 4b,c shows the distributions of carbon peak status in commercial building operations via dynamic emissions scenario analysis. Technically, the above distributions were estimated through Monte Carlo simulation run 110,000 times. According to the dynamic scenario analysis, commercial building operations will achieve a carbon peak at the level of 1364.31 MtCO2 in year 2039 with certainty. Considering the uncertainty from the model simulation, the standard deviation was applied to improve the simulation outputs. Here, the result of the emission peak with its peak year was found to be 1364.31 (±258.70) MtCO2 in the year 2039 (±5). Moreover, this study showed that the results of dynamic scenario simulation (see Figure 4b,c) were consistent with those of the BAU scenario (see Figure 4a), which reflects the reliability of the dynamic scenario model.
To further illustrate the emissions paths of commercial building operations in China, Figure 5 shows the ranges of emission and energy peaks based on the output of dynamic analysis in detail. From the Monte Carlo simulation run 110,000 times, Figure 5a indicates that the energy demand of commercial building operations will peak in the year 2045 (±7) at the level of 445.70 (±90.90) Mtce. As shown in Figure 5b, commercial building operations will peak in the year 2039 (±5) with the value of 1364.31 (±258.70) MtCO2. Hence, the peak of energy demand will appear nearly a decade later than that of carbon emissions, which shows that decarbonization in building energy use is effective, and this evidence can be shown by the decreasing energy-related carbon intensity during the period 2018–2060.
During dynamic scenario analysis, the influence of uncertainty on the emissions status caused by the Monte Carlo simulation run 110,000 times was significant. For example, a variation of ±258.70 MtCO2 existed in the carbon peak of the operation. Hence, the uncertainty sources had to be investigated and a sensitivity analysis was used to achieve this goal. Figure 6 shows the uncertainty sources affecting the emission peak and the peak year of commercial building operations through the output of the sensitivity analysis. It was observed that the total emissions factor from the commercial building operations was the most important source that affected the emission peak status. Specifically, the contributions of the emissions factor to the uncertainties of emission peak status reached 31.7% (±82.01 MtCO2) and 33.3% (±1.67 yrs.), respectively. Compared to the emissions factor, the GDP per capita also showed a strong impact on the uncertainty of emission peak status (see Figure 6). For the elasticity, every 1% change in GDP per capita would cause a ±1.78% change in the peak time and lead to a ±1.79% change of the final emission peak at the same time. Then, the impact of the energy intensity of commercial building operations on the emission peak status was also obvious, as illustrated by the blocks in orange in Figure 6. Regarding the other uncertainty sources, the impacts of industrial efficiency of the service industry, industrial structure, and the population size were normal. As shown in Figure 6, the above three factors in total contributed 14.6% and 14.7% to the uncertainties of the emission peak status, respectively. The uncertainty analysis mentioned above showed that the GDP per capita and the emission factor determine the uncertainty of the emission peak status in the commercial building operations. Through the identification of the future low emission roadmap of the commercial building operations, these two key factors are worth investigating further.

5. Discussion

5.1. Steps to Carbon Neutrality of Future Commercial Building Operations

As proposed in Section 1, the most important advance of this study is to illustrate a feasible data-driven low carbon pathway for commercial building operations in China to achieve carbon neutrality by 2060. The dynamic emissions scenario analysis (see Figure 4) proves that total emissions of 845.87 MtCO2 from building operations will have to be cut by 2060, representing a significant challenge for buildings to achieve carbon neutrality. Hence, in order for commercial buildings to reduce emissions substantially, given current projections, a low-carbon development path is needed. This effort will facilitate the official implementation of feasible and precise targets for the low carbon transition in commercial building operations to meet the carbon neutral goal by mid-century. The proposed decarbonized roadmap addresses issue 2 listed in Section 1 of this study, and will contribute to addressing issue 3.
Two different emission scenarios for future operations are assessed in this section to illustrate paths towards carbon neutrality by 2060. Specifically, Figure 7 illustrates the projected carbon emissions from commercial building operations via two different scenarios: the BAU scenario and the decarbonized scenario. For the emissions in the BAU scenario, the trend is based on the results of the static emissions scenario in Figure 4a. Given current projections of the BAU scenario, the low-carbon development path, referred to as the decarbonized scenario, is proposed to reduce substantial emissions. According to the estimation undertaken using the emissions model, this carbon neutral target is within reach if, by 2060, the energy intensity of commercial building operations decreases by 1.2% per year, the electrification level increases up to 80%, and over 85% of electricity used is generated by renewables [47]. Based on this path, carbon emissions will peak in 2024 at 921.71 MtCO2. Furthermore, along this promising path, only 169.73 MtCO2 will be emitted in 2060, a level that can easily be offset by step iv. From the BAU scenario to the decarbonized scenario, the share of emissions reductions in steps i to iv is assessed as follows:
i.
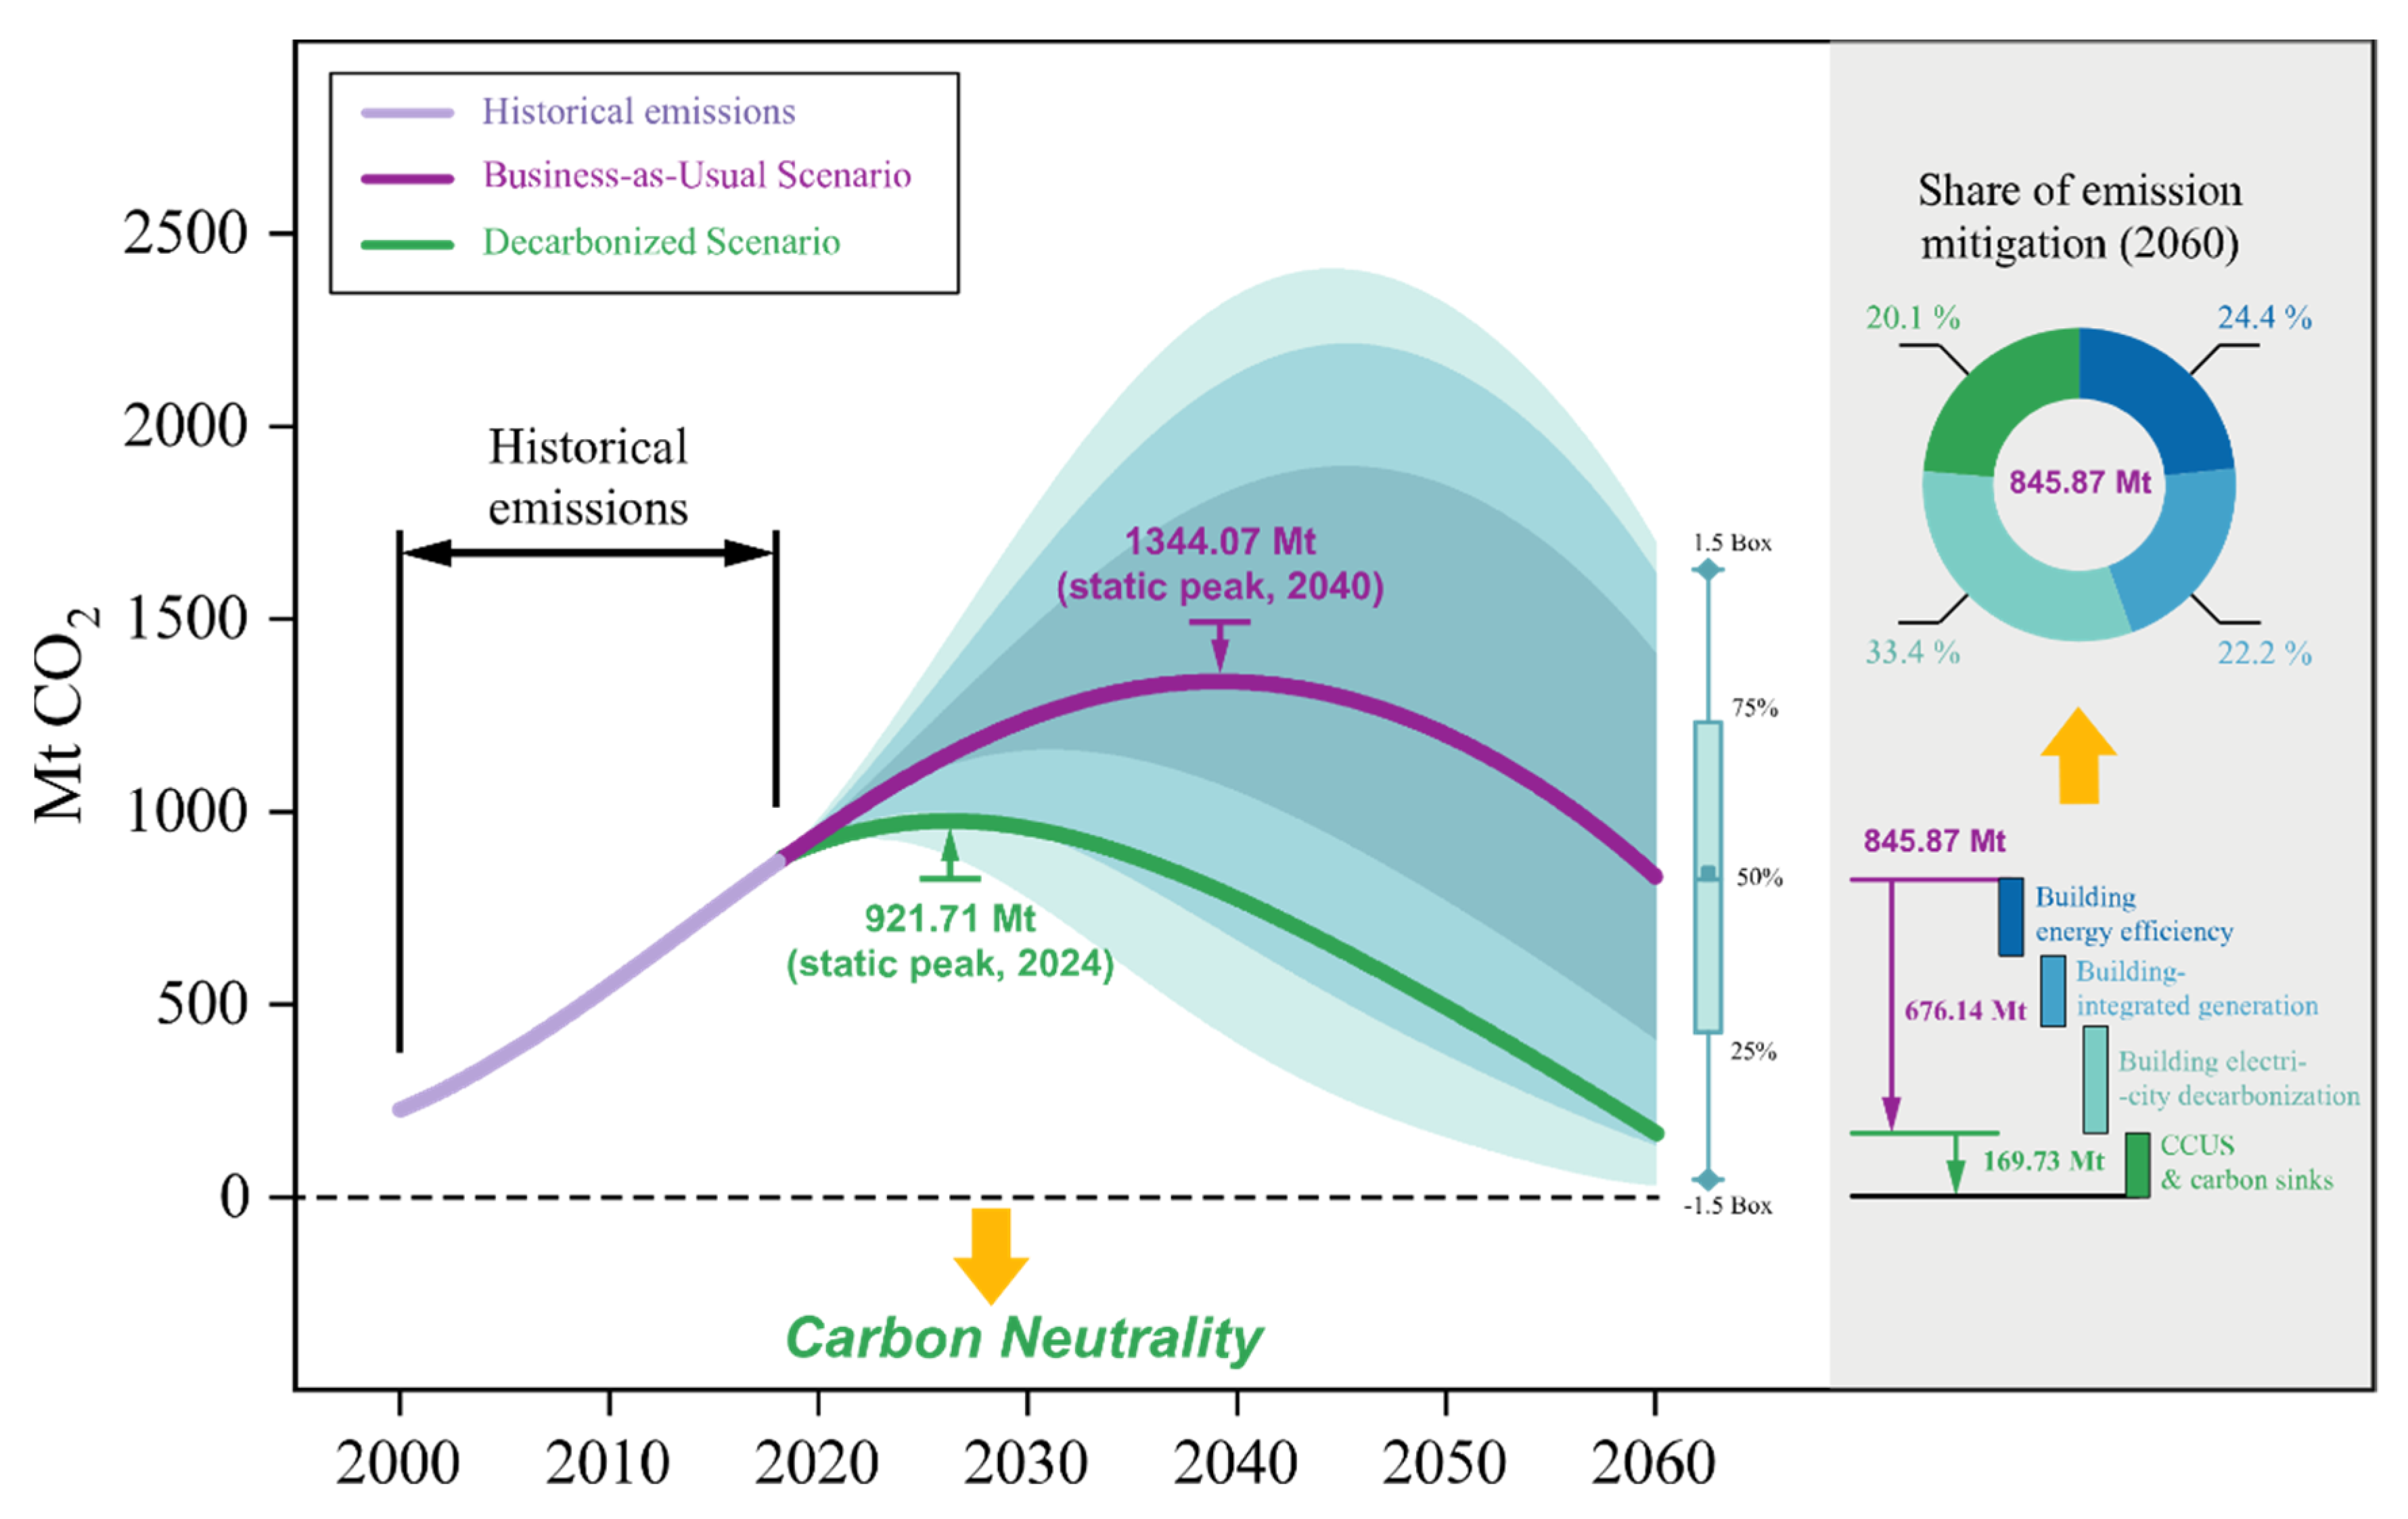
Implement a higher level of energy-efficiency standards (206.19 MtCO2, 24.4%);
ii.
Increase the electrification level and the use of building-integrated photovoltaics in building operations (187.61 MtCO2, 22.2%)
iii.
Promote electricity decarbonization in building operations (282.30 MtCO2, 33.4%);
iv.
Develop carbon capture, utilization and storage, and carbon sinks in buildings (169.73 MtCO2, 20.1%).
In addition, the results of this study show a similar trend to the results of a relevant study that focused on the dynamic emission scenario analysis for the residential buildings [17], with both studies showing an inverse U-shaped curve. The above finding proves the reliability of the results in this study from another perspective.

5.2. Energy Benchmark of Future Commercial Building Operations to Be Carbon Neutral

Section 5.1 presents future emissions benchmarks to achieve the low carbon transition with the goal of carbon neutrality. To assist in achieving carbon neutral targets, energy use benchmarks in future commercial building operations should be planned. As such, this section proposes a double control goal for future commercial building energy use, including control of the total energy demand and the energy peak time, which is beneficial to address issue 3 in Section 1.
For the energy benchmarks of future operations, three different schemes were examined with dynamic scenario analysis, encompassing positive, normal, and negative schemes. Technically, the normal scheme (see Figure 8b) represents the future energy demand developed with the BAU level, as previously illustrated in Figure 5a. In the normal scheme, the future energy demand is suggested to be locked at 445.70 Mtce, and the energy peak time is found to be the year 2045. Moreover, a SD value of negative 1.6 was used to build the positive scheme, for which the path of energy demand in the decarbonized scenario is shown in Figure 7. In the positive scheme, a benchmark of 299.34 Mtce (see Figure 8a) was determined for the future energy consumption with the peak year of 2034 in commercial building operations. Compared to the normal scheme, the positive scheme will achieve the energy peak 11 years earlier, with energy savings of 146.36 Mtce. Contrarily, if the energy demand changes from the BAU scenario to the negative scenario, the energy benchmark will be transformed into the negative scheme. Figure 8c shows that the energy demand peak time is expected to be realized in the year 2049 with the suggested control at 491.15 Mtce. Compared with the BAU level, there is an extra energy demand of 45.45 Mtce in the negative scheme, and the energy peak will be delayed by 4 years. Furthermore, if the energy demand develops at the BAU level, the feasibility of the above three schemes can be shown via probabilities, as follows: the normal scheme (100%), the positive scheme (43.01%), and the negative scheme (83.86%).

5.3. Low Carbon Transition Strategies

Section 5.1 and Section 5.2 propose a carbon neutral roadmap and energy benchmark for commercial building operations by mid-century. Regarding the specific step-by-step solutions for the future commercial buildings, this section provides a detailed suggestion, which is the last step to address issue 3 of Section 1.
Looking back to the historical low carbon transition strategies, significant results have been achieved, as shown in Figure 3 in Section 4.1. At the beginning of the 20th century, China promulgated a number of regulations related to building energy savings, and the most relevant to commercial buildings is the Design Standard for Energy Efficiency of Public Buildings (GB/T50189). The energy consumption target in each GB/T50189 version is 70% of the previous version to decrease energy consumption and increase energy efficiency [48]. In recent years, in order to achieve carbon peak and carbon neutrality in the building sector as soon as possible, the concepts of ultra-low energy buildings, nearly-zero energy buildings, and zero energy buildings have been proposed. The historical low carbon transition paths are illustrated as follows (see Figure 9).
To achieve the carbon neutrality plan before 2060, stricter goals of total emissions abatement in the building sector are required. Based on the content of Section 5.1, a step-by-step solution to address these main challenges, which hinder the ability of commercial building operations to achieve carbon neutrality, are proposed, including the following steps:
  • Implement a higher level of energy-efficiency standards in the design and use of walls, roofs, etc. [49]. Set a specific efficiency limitation for end-use energy equipment, including lighting, heating, ventilation, and air conditioning systems.
  • Develop carbon capture, utilization, and storage technologies, such as new types of building materials and carbon sinks in buildings, including vertical forests.
  • Develop nearly-zero energy building technologies and aim to achieve strict standards.
  • Increase the electrification level and decarbonize electricity by developing and applying renewable energy to reduce the direct emissions [50].
  • Develop low carbon technologies and practices in the service sector.

6. Conclusions

This study evaluated past emissions abatement and conducted a dynamic scenario analysis to investigate the decarbonization of commercial building operations to meet the goal of carbon neutrality in China. To achieve this, carbon emissions from building operations were characterized, and the emissions abatement from 2001 to 2018 was evaluated by decomposition analysis. Thereafter, the projected emissions until 2060 across different scenarios were simulated through Monte Carlo simulation. Based on the results, steps to achieve carbon neutrality in the future commercial building operations were proposed. Furthermore, three schemes of the double-control target for the energy use of the future operations were discussed. Moreover, strategies for the low carbon transition in future commercial building operations were suggested for buildings to realize, as quickly as possible, the goals of reaching an emission peak and carbon neutrality.

6.1. Main Findings

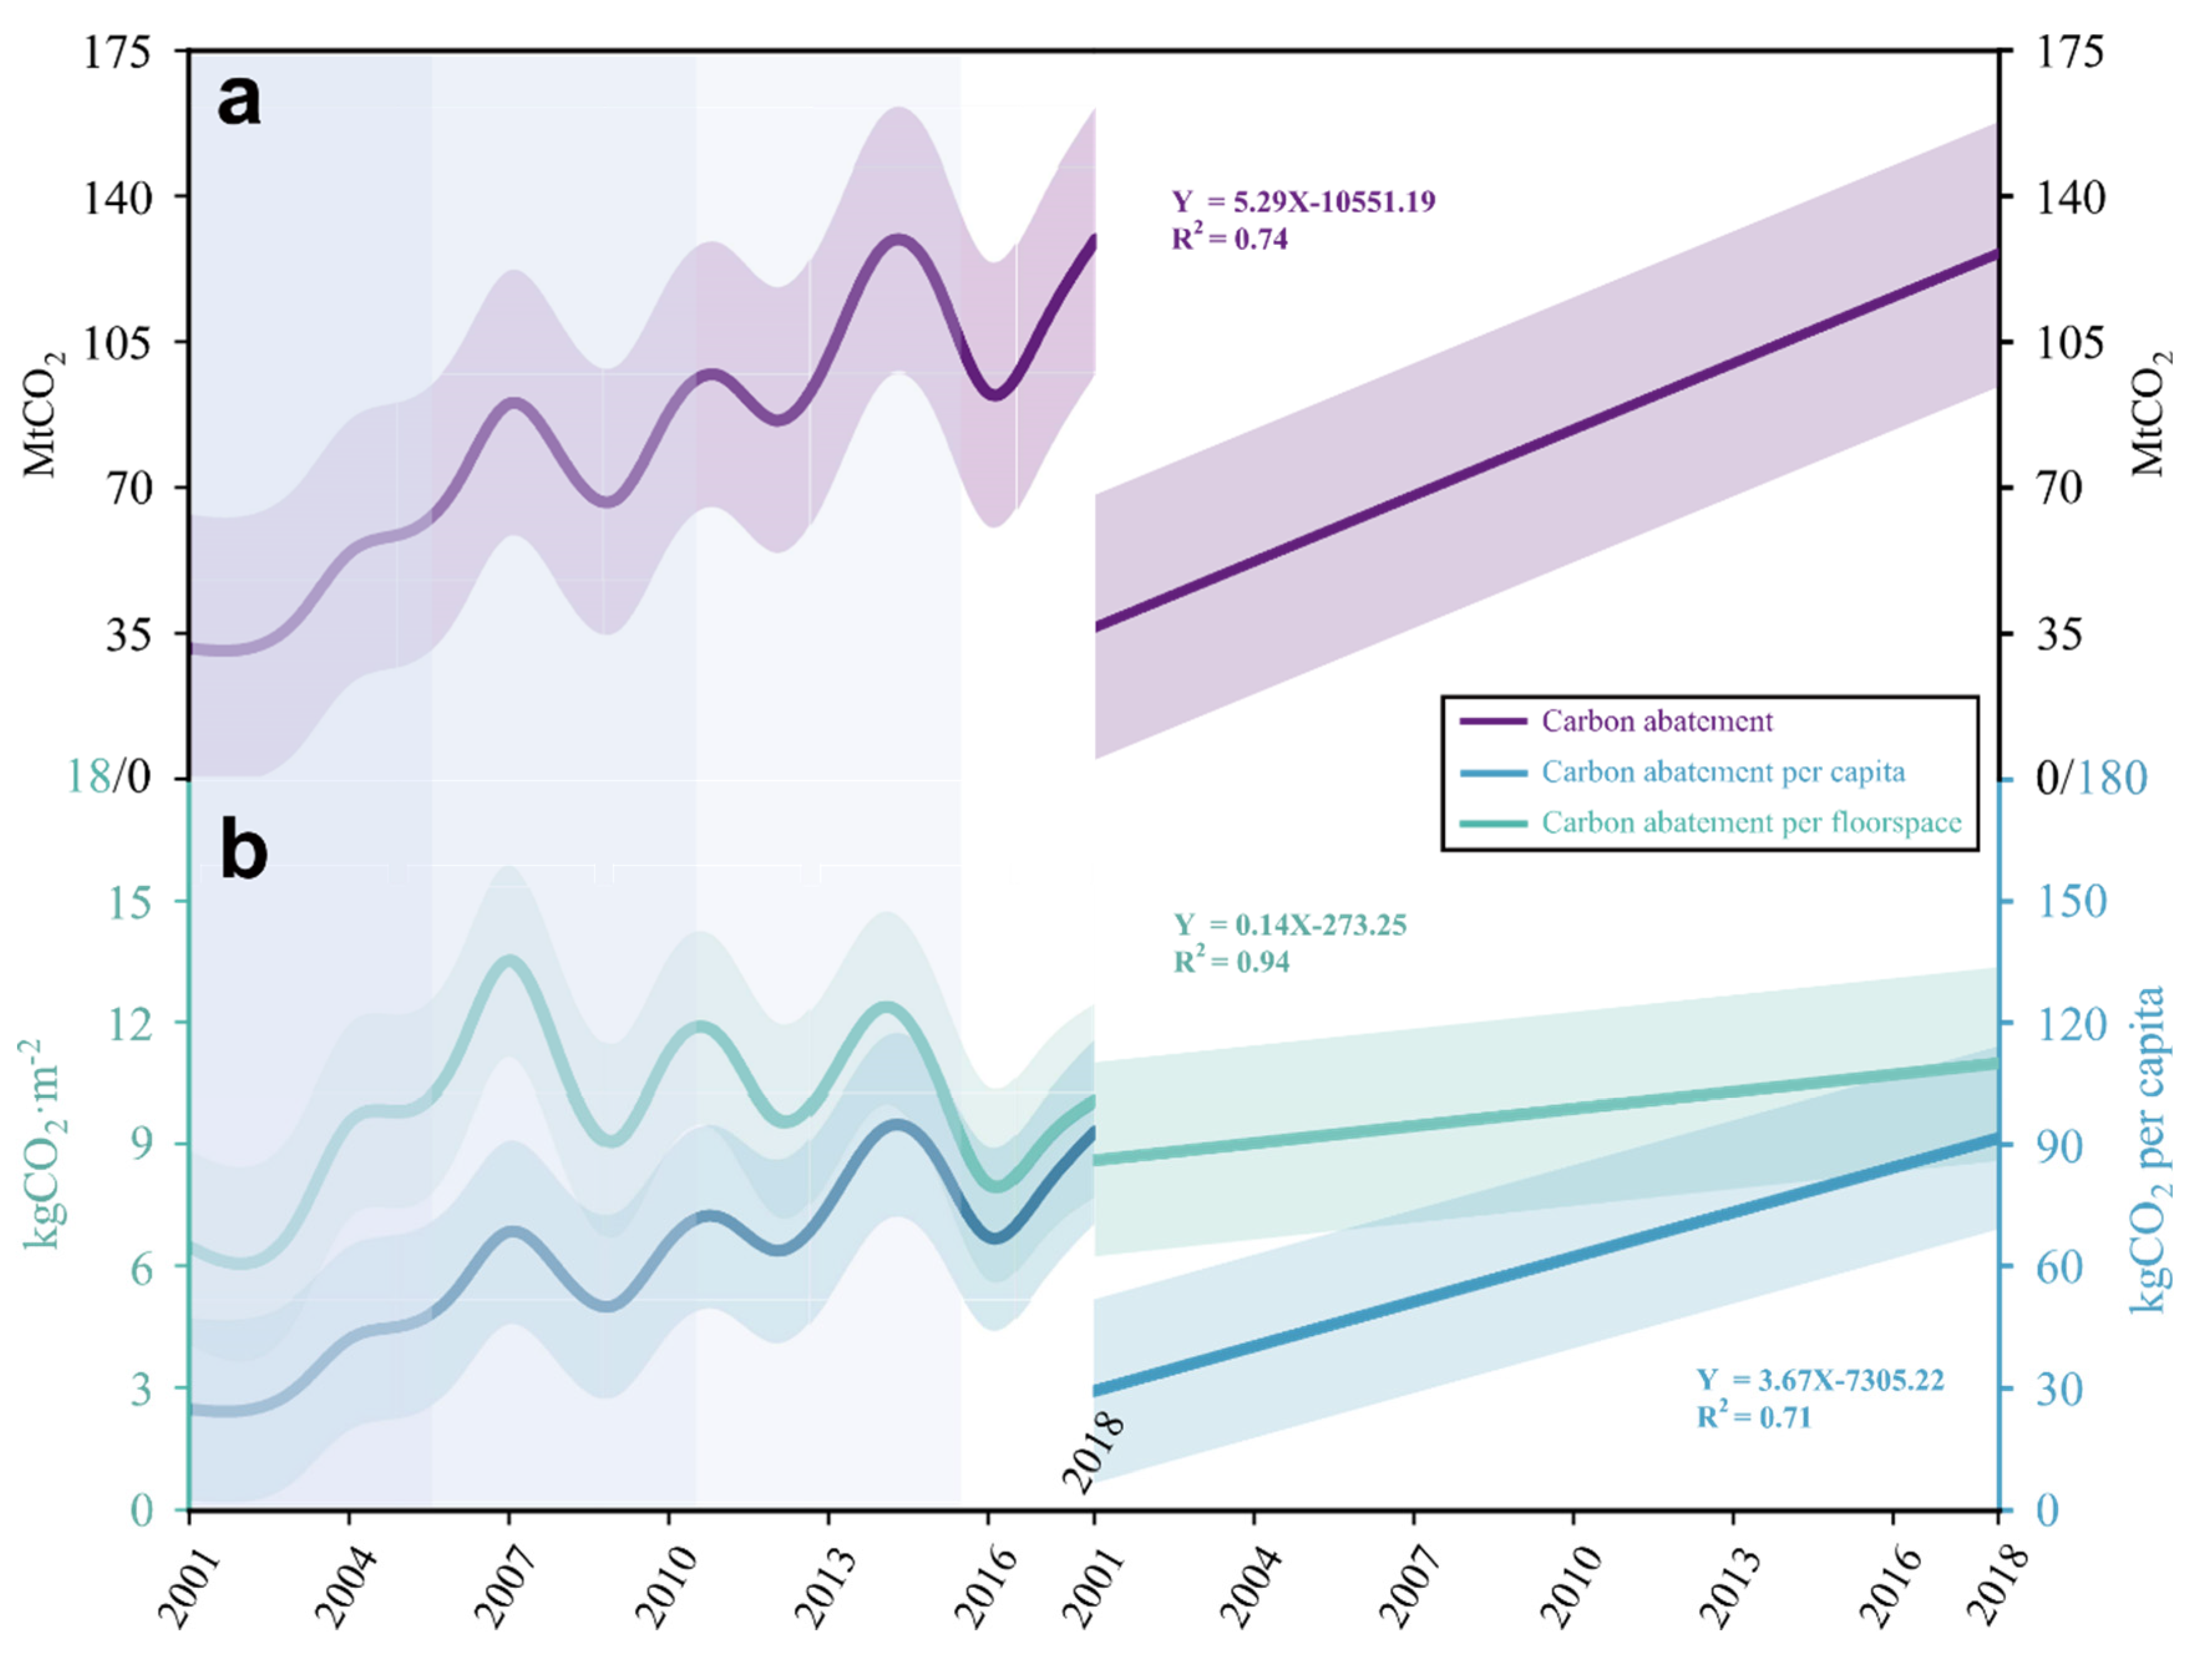
  • Carbon emissions abatement of commercial building operations in 2001–2018 was 1460.85 (±574.61) MtCO2. This study characterized the carbon emissions from building operations via the emission assessment model built through the Kaya identity, and then past emission abatement was evaluated through index decomposition analysis. In general, the nationwide emissions abatement from building operations was 1460.85 (±574.61) MtCO2. Specifically, the emissions abatement levels in different periods were 211.13 (±159.61, 2001–2005), 391.40 (±159.61, 2006–2010), 539.49 (±159.61, 2011–2015), and 318.84 (±95.77, 2016–2018) MtCO2. Regarding intensity level, the emission abatement per floor space in the above four periods was 7.69 (±2.52) kgce·m−2·yr−1 for 2001–2005, 11.18 (±2.52) kgce·m−2·yr−1 for 2006–2010, 11.11 (±2.52) kgce·m−2·yr−1 for 2011–2015, and 8.72 (±2.52) kgce·m−2·yr−1 for 2016–2018. We are confident that continuous emissions abatement from commercial building operations will be significant.
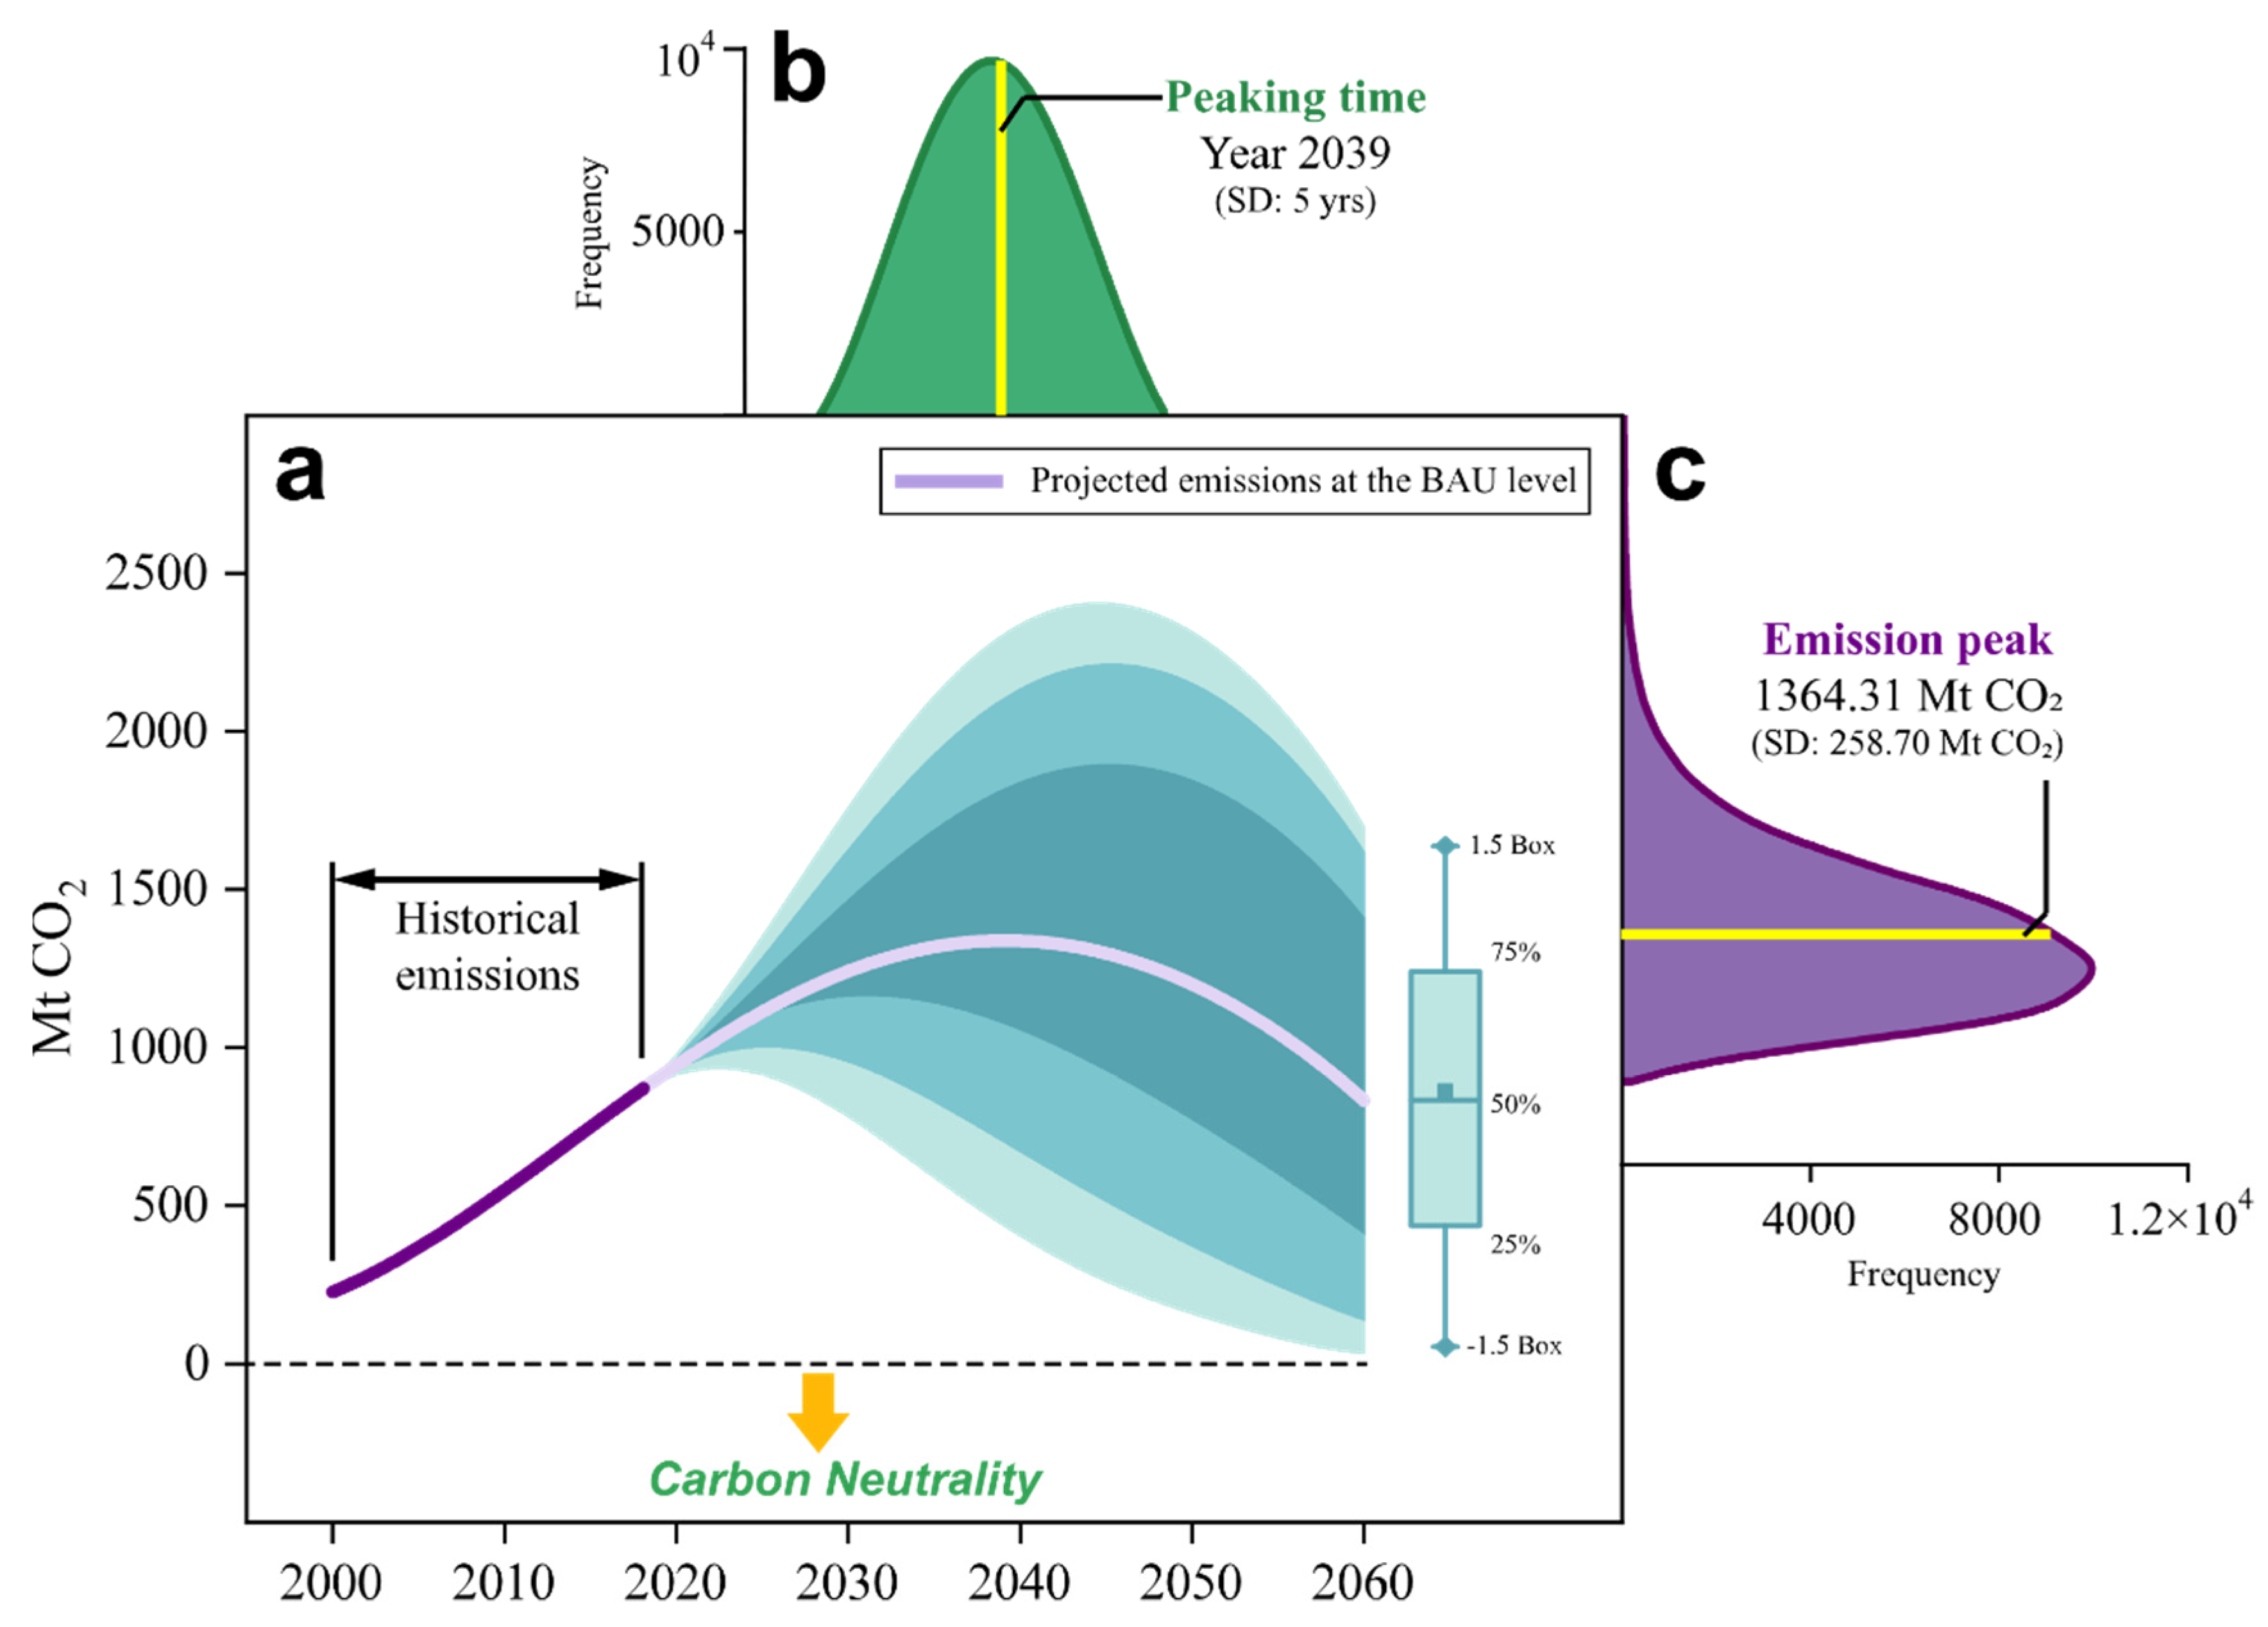
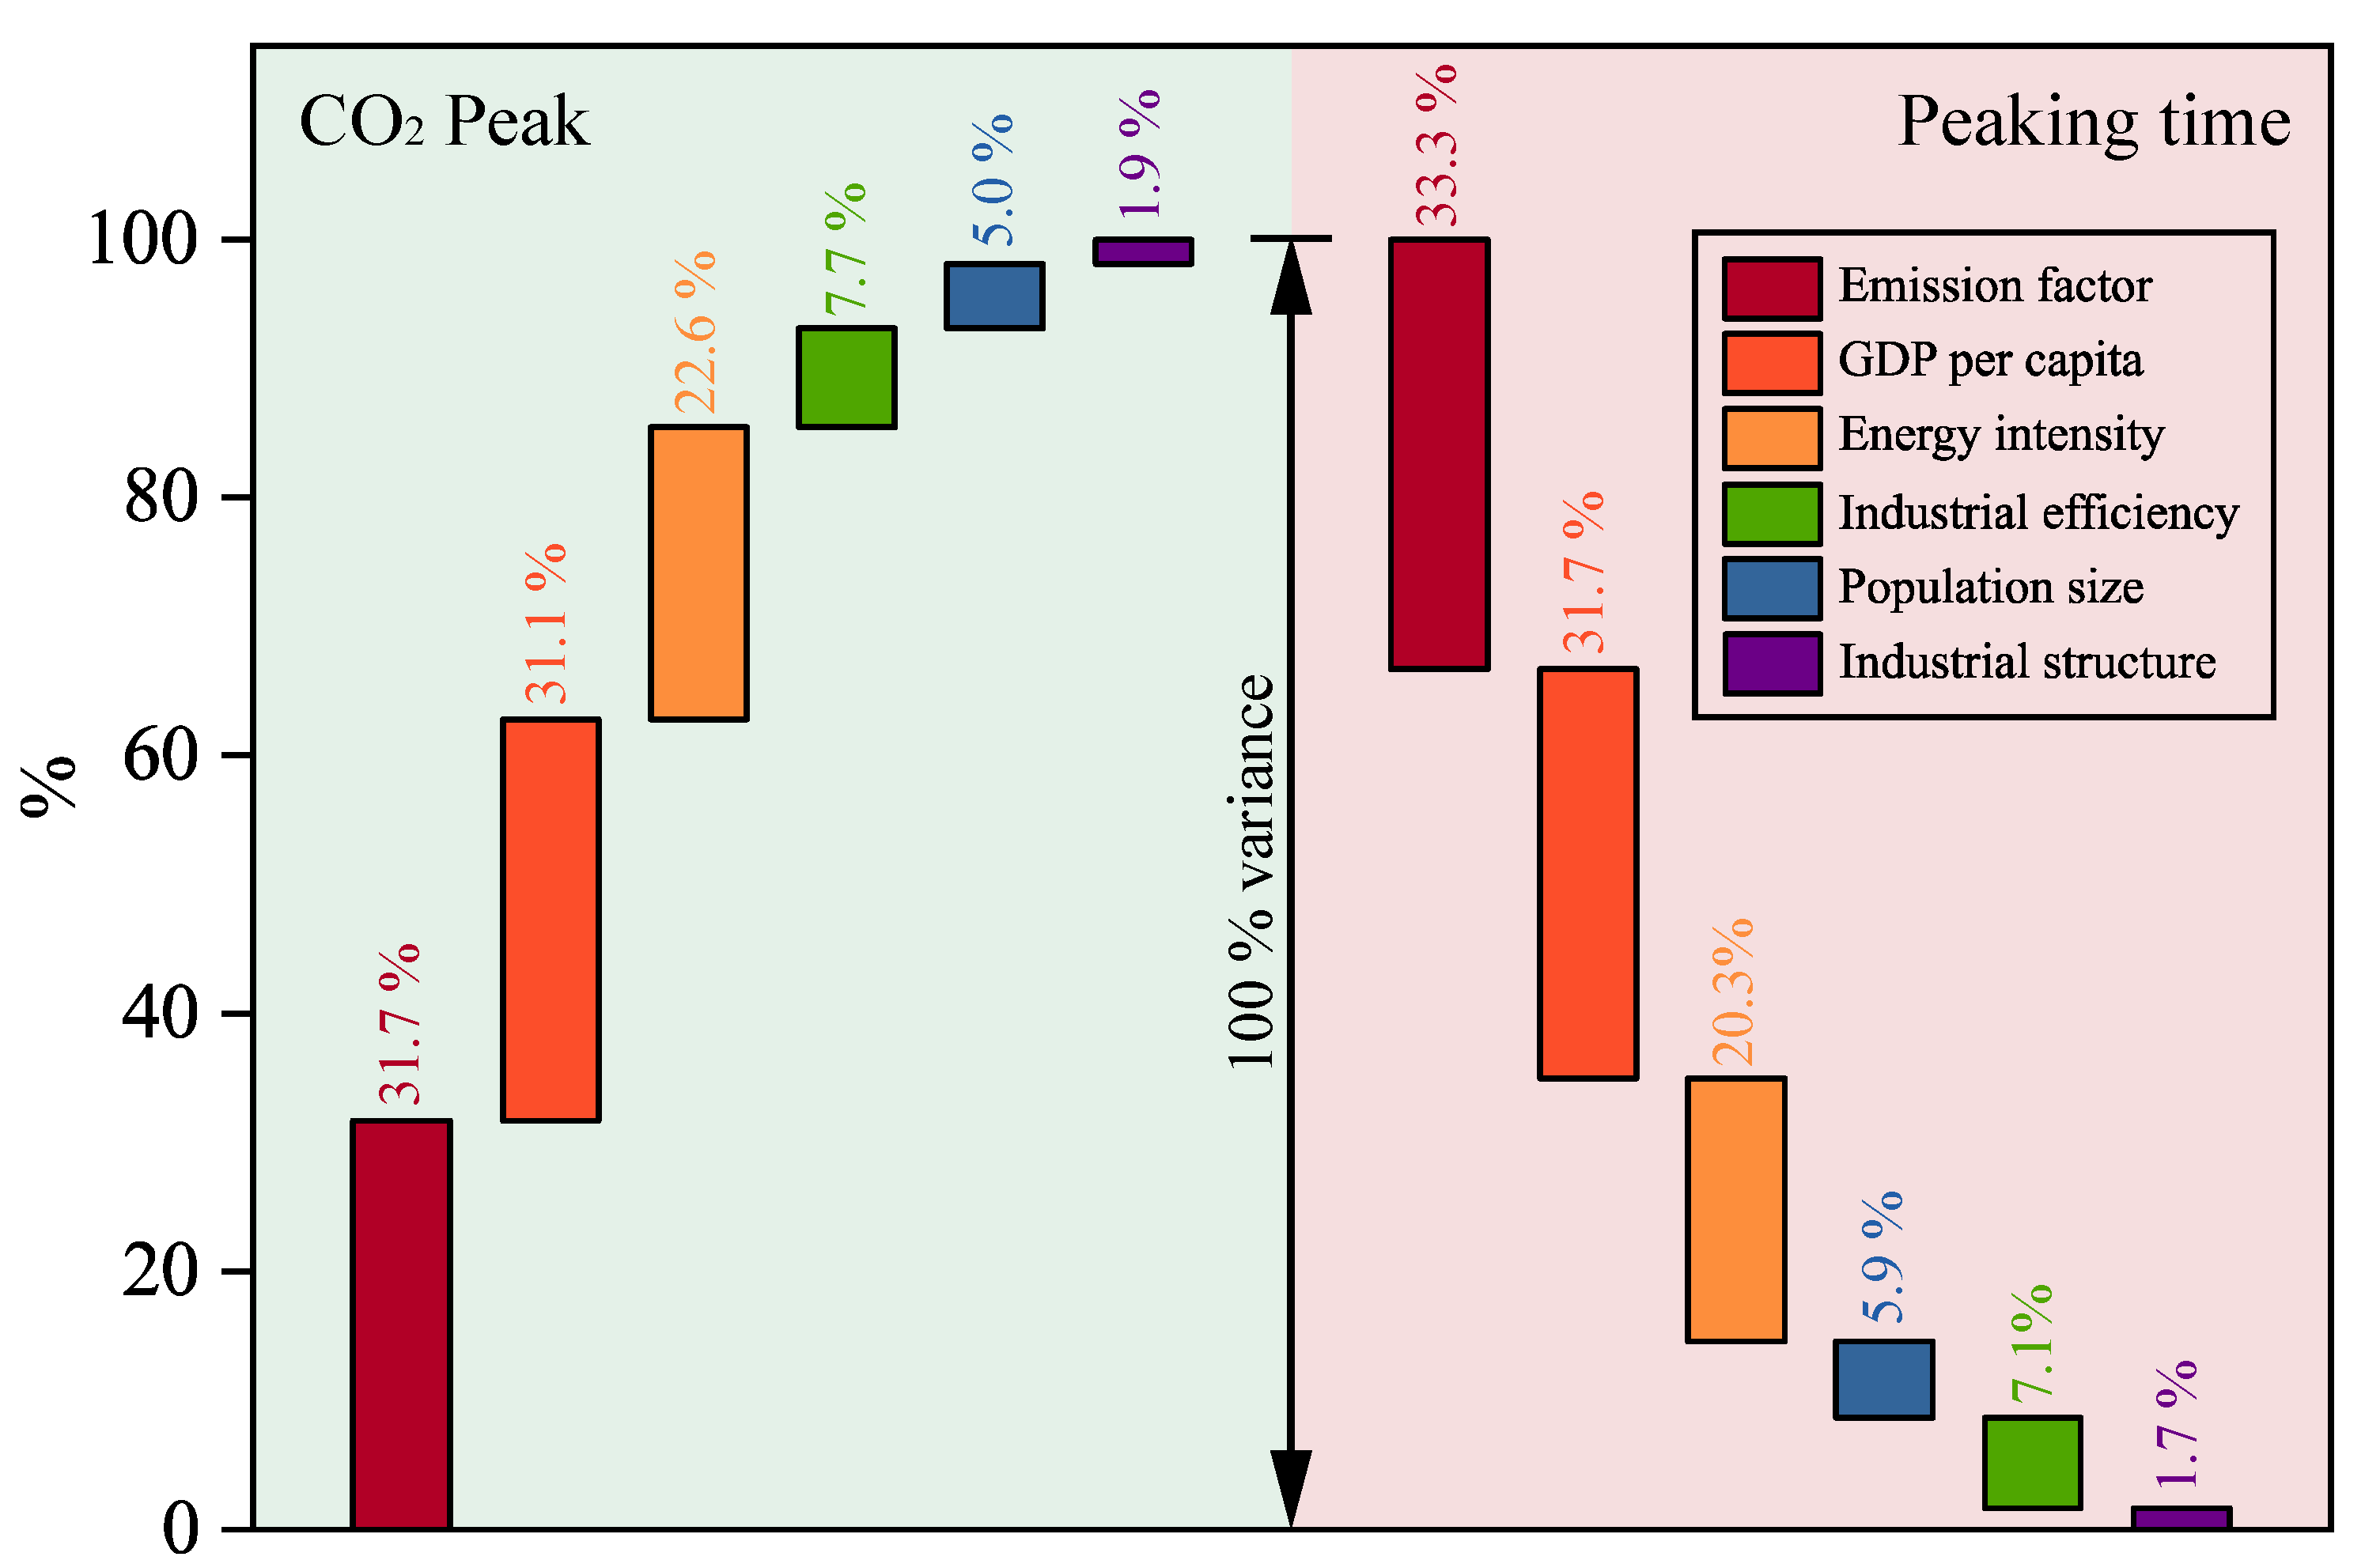
  • To achieve carbon neutrality by 2060, the commercial building operations should hit its emission peak in 2024 at 921.71 MtCO2. This study set the BAU scenario based on the emissions model applied in the past emissions abatement evaluation for the projected emissions from commercial building operations. Thereafter, the static emissions at the BAU level were modeled via a Monte Carlo simulation run 110,000 times. The dynamic emission scenario analysis shows that commercial building operations will achieve their carbon peak in 2039 (±5) at 1364 (±259) MtCO2 without effective intervention, which is a decade later than China pledged in the Paris Agreement. Furthermore, the sensitivity analysis proved that the energy-related carbon intensity and GDP per capita determine the uncertainty of the emission peak. In order to achieve carbon neutrality in commercial building operations by 2060, it is suggested that the commercial building operations should peak emissions in 2024 at a level of 921.71 MtCO2. To achieve this ambitious goal, measures such as implementing higher levels of energy-efficiency standards, increasing electrification levels and decarbonizing electricity, and developing carbon trading and carbon sinks in buildings should be considered to achieve the low carbon transition in commercial building operations.
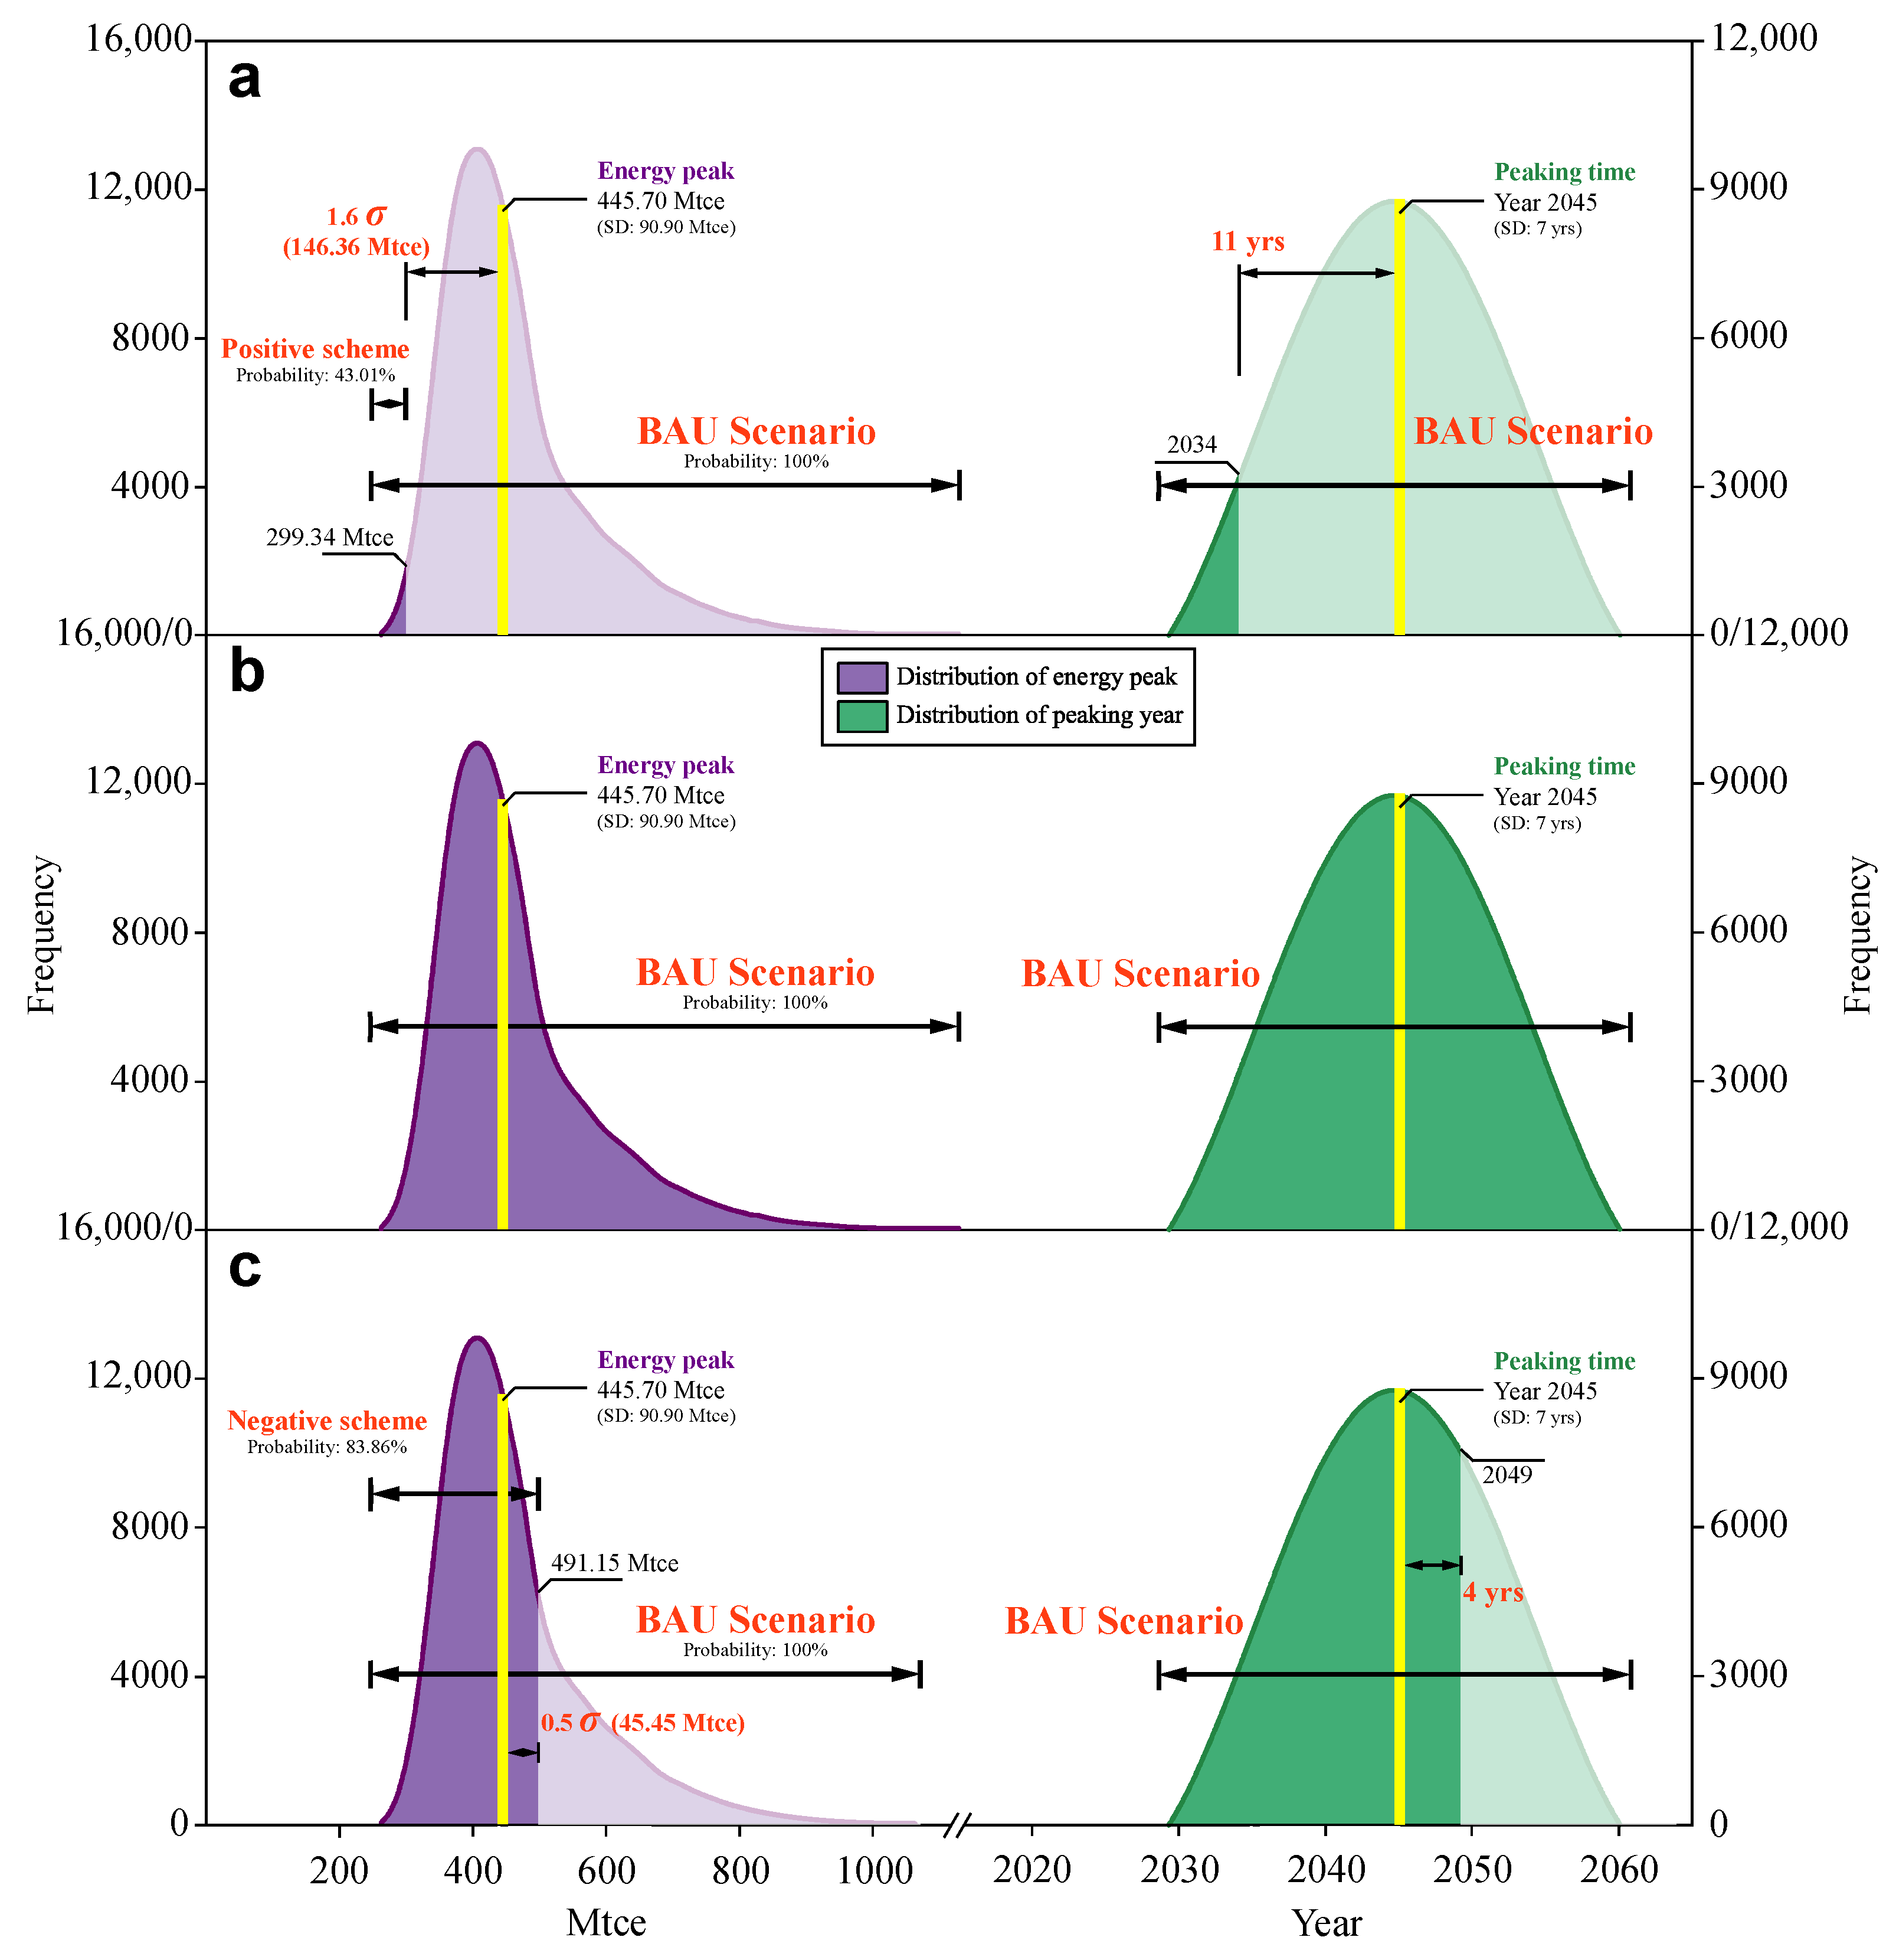
  • The energy benchmark of the future operation is recommended to be set at 299–446 Mtce. Moreover, there are double-control energy demand targets in the future operations, set through dynamic simulation under the BAU scenario (energy peak: 445.7 Mtce, peak time: 2045). In the positive energy benchmark scheme, the implementation probability is 43.01%, which is suggested to control the energy peak at 299.34 Mtce in 2034. The negative scheme would achieve the energy peak in 2049 with the peak value at 491.15 Mtce under an 83.86% implementation probability. Compared to the normal scheme, the positive scheme will achieve the energy peak 11 years earlier, with energy savings of 146.36 Mtce, and the negative scheme will demand additional energy of 45.45 Mtce and the peak time will be delayed by 4 years.

6.2. Forthcoming Studies

A few gaps in this study should be further discussed. Firstly, it is necessary to consider broader economy-related factors that influence the carbon emissions of commercial building operations when conducting the emissions scenario. A set of relatively complete variable systems is beneficial to increase the reliability of the results of the emissions assessment model and emissions scenario analysis. Furthermore, it is possible that there are more critical factors that can assist commercial building operations to achieve a low carbon transition as soon as possible. Moreover, although the decarbonized paths of dynamic emissions scenario analysis in Chinese commercial building operations by 2060 were obtained successfully, the roadmap of the specific influence of these abatements on the global temperature decrease of 1.5–2 °C has yet to be studied. Therefore, the forthcoming studies on carbon emissions in commercial building operations should give sufficient consideration to a low carbon pathway in 1.5–2 °C scenarios. In addition, this tool has the potential to predict future carbon emissions and to assess the carbon abatement in commercial buildings located in different regions. Therefore, this study can be further extended to other economies.

Author Contributions

Conceptualization, M.M. and Z.M.; methodology, M.M.; software, S.Z.; validation, S.Z., C.Z. and X.X.; formal analysis, S.Z.; investigation, S.Z.; resources, M.M.; data curation, X.X.; writing—original draft preparation, S.Z.; writing—review and editing, M.M.; visualization, S.Z. and M.M.; supervision, Z.M.; project administration, Z.M.; funding acquisition, Z.M and M.M. All authors have read and agreed to the published version of the manuscript.

Funding

This study was supported by the China Postdoctoral Science Foundation (2020M680020), the Shuimu Tsinghua Scholar Program of Tsinghua University (2019SM139), the National Planning Office of Philosophy and Social Science Foundation of China (21CJY030 and 18BJL034), and the Fundamental Research Funds for the Central Universities of China (2020CDJSK03YJ07).

Institutional Review Board Statement

Not applicable.

Informed Consent Statement

Not applicable.

Data Availability Statement

Conflicts of Interest

The authors declare no conflict of interest.

References

  1. Normile, D. China’s bold climate pledge earns praise—But is it feasible? Science 2020, 370, 17–18. [Google Scholar] [CrossRef]
  2. UN Environment Programme. 2019 Global Status Report for Buildings and Construction Sector. 2019. Available online: https://www.unep.org/resources/publication/2019-global-status-report-buildings-and-construction-sector (accessed on 21 October 2021).
  3. IEA. World Energy Outlook 2020. 2020. Available online: https://www.iea.org/reports/world-energy-outlook-2020 (accessed on 21 October 2021).
  4. Röck, M.; Saade, M.R.M.; Balouktsi, M.; Rasmussen, F.N.; Birgisdottir, H.; Frischknecht, R.; Habert, G.; Lützkendorf, T.; Passer, A. Embodied GHG emissions of buildings—The hidden challenge for effective climate change mitigation. Appl. Energy 2020, 258, 114107. [Google Scholar] [CrossRef]
  5. Mallapaty, S. How China could be carbon neutral by mid-century. Nat. Cell Biol. 2020, 586, 482–483. [Google Scholar] [CrossRef]
  6. Khalilnejad, A.; French, R.H.; Abramson, A.R. Data-driven evaluation of HVAC operation and savings in commercial buildings. Appl. Energy 2020, 278, 115505. [Google Scholar] [CrossRef]
  7. Ma, M.; Pan, T.; Ma, Z. Examining the Driving Factors of Chinese Commercial Building Energy Consumption from 2000 to 2015: A STIRPAT Model Approach. J. Eng. Sci. Technol. Rev. 2017, 10, 28–38. [Google Scholar] [CrossRef]
  8. Ma, M.; Cai, W.; Cai, W. Carbon abatement in China’s commercial building sector: A bottom-up measurement model based on Kaya-LMDI methods. Energy 2018, 165, 350–368. [Google Scholar] [CrossRef]
  9. Feng, W.; Zhang, Q.; Ji, H.; Wang, R.; Zhou, N.; Ye, Q.; Hao, B.; Li, Y.; Luo, D.; Lau, S.S.Y. A review of net zero energy buildings in hot and humid climates: Experience learned from 34 case study buildings. Renew. Sustain. Energy Rev. 2019, 114, 109303. [Google Scholar] [CrossRef]
  10. Schäuble, D.; Marian, A.; Cremonese, L. Conditions for a cost-effective application of smart thermostat systems in residential buildings. Appl. Energy 2020, 262, 114526. [Google Scholar] [CrossRef]
  11. Hu, S.; Yang, J.; Jiang, Z.; Ma, M.; Cai, W. CO2 Emission and Energy Consumption from Automobile Industry in China: Decomposition and Analyses of Driving Forces. Processes 2021, 9, 810. [Google Scholar] [CrossRef]
  12. Zhou, N.; Khanna, N.; Feng, W.; Ke, J.; Levine, M. Scenarios of energy efficiency and CO2 emissions reduction potential in the buildings sector in China to year 2050. Nat. Energy 2018, 3, 978–984. [Google Scholar] [CrossRef]
  13. Kaya, Y. Impact of Carbon Dioxide Emission Control on GNP Growth: Interpretation of Proposed Scenarios. Intergovernmental Panel on Climate Change/Response Strategies Working Group. May 1989. Available online: https://ci.nii.ac.jp/naid/10021966297/ (accessed on 21 October 2021).
  14. Chen, L.; Cai, W.; Ma, M. Decoupling or delusion? Mapping carbon emission per capita based on the human development index in Southwest China. Sci. Total. Environ. 2020, 741, 138722. [Google Scholar] [CrossRef]
  15. EIA. Commercial Buildings Energy Consumption Survey (CBECS) 2018. Available online: https://www.eia.gov/consumption/commercial/ (accessed on 21 October 2021).
  16. MOHURD. Statistical Statement System of Energy Resource Consumption in Civil Buildings. 2018. Available online: http://www.mohurd.gov.cn/wjfb/201512/t20151218_226035.html (accessed on 21 October 2021).
  17. Ma, M.; Ma, X.; Cai, W.; Cai, W. Low carbon roadmap of residential building sector in China: Historical mitigation and prospective peak. Appl. Energy 2020, 273, 115247. [Google Scholar] [CrossRef]
  18. Xiang, X.; Ma, X.; Ma, M.; Wu, W.; Yu, L. Research and application of novel Euler polynomial-driven grey model for short-term PM10 forecasting. Grey Syst. Theory Appl. 2021, 11, 498–517. [Google Scholar] [CrossRef]
  19. Fang, K.; Tang, Y.; Zhang, Q.; Song, J.; Wen, Q.; Sun, H.; Ji, C.; Xu, A. Will China peak its energy-related carbon emissions by 2030? Lessons from 30 Chinese provinces. Appl. Energy 2019, 255, 113852. [Google Scholar] [CrossRef]
  20. Chen, M.; Ma, M.; Lin, Y.; Ma, Z.; Li, K. Carbon Kuznets curve in China’s building operations: Retrospective and prospective trajectories. Sci. Total. Environ. 2022, 803, 150104. [Google Scholar] [CrossRef] [PubMed]
  21. Zhao, J.; Jiang, Q.; Dong, X.; Dong, K. Would environmental regulation improve the greenhouse gas benefits of natural gas use? A Chinese case study. Energy Econ. 2020, 87, 104712. [Google Scholar] [CrossRef]
  22. Ma, M.; Cai, W.; Cai, W.; Dong, L. Whether carbon intensity in the commercial building sector decouples from economic development in the service industry? Empirical evidence from the top five urban agglomerations in China. J. Clean. Prod. 2019, 222, 193–205. [Google Scholar] [CrossRef]
  23. Liang, Y.; Cai, W.; Ma, M. Carbon dioxide intensity and income level in the Chinese megacities’ residential building sector: Decomposition and decoupling analyses. Sci. Total. Environ. 2019, 677, 315–327. [Google Scholar] [CrossRef]
  24. Dong, K.; Dong, X.; Jiang, Q. How renewable energy consumption lower global CO2 emissions? Evidence from countries with different income levels. World Econ. 2020, 43, 1665–1698. [Google Scholar] [CrossRef]
  25. Dong, K.; Sun, R.; Li, H.; Liao, H. Does natural gas consumption mitigate CO2 emissions: Testing the environmental Kuznets curve hypothesis for 14 Asia-Pacific countries. Renew. Sustain. Energy Rev. 2018, 94, 419–429. [Google Scholar] [CrossRef]
  26. Wang, H.; Chen, W.; Shi, J. Low carbon transition of global building sector under 2- and 1.5-degree targets. Appl. Energy 2018, 222, 148–157. [Google Scholar] [CrossRef]
  27. Shuai, C.; Shen, L.; Jiao, L.; Wu, Y.; Tan, Y. Identifying key impact factors on carbon emission: Evidences from panel and time-series data of 125 countries from 1990 to 2011. Appl. Energy 2017, 187, 310–325. [Google Scholar] [CrossRef]
  28. Dong, K.; Dong, X.; Dong, C. Determinants of the global and regional CO2 emissions: What causes what and where? Appl. Econ. 2019, 51, 5031–5044. [Google Scholar] [CrossRef]
  29. Yang, J.; Cai, W.; Ma, M.; Li, L.; Liu, C.; Ma, X.; Li, L.; Chen, X. Driving forces of China’s CO2 emissions from energy consumption based on Kaya-LMDI methods. Sci. Total. Environ. 2020, 711, 134569. [Google Scholar] [CrossRef]
  30. Liu, Y.; Feng, C. Decouple transport CO2 emissions from China’s economic expansion: A temporal-spatial analysis. Transp. Res. Part D Transp. Environ. 2020, 79, 102225. [Google Scholar] [CrossRef]
  31. Ma, M.; Cai, W. What drives the carbon mitigation in Chinese commercial building sector? Evidence from decomposing an extended Kaya identity. Sci. Total. Environ. 2018, 634, 884–899. [Google Scholar] [CrossRef]
  32. Yan, R.; Ma, M.; Pan, T. Estimating energy savings in Chinese residential buildings from 2001 to 2015: A decomposition analysis. J. Eng. Sci. Technol. Rev. 2017, 10, 105–133. [Google Scholar] [CrossRef]
  33. Ma, M.; Ma, X.; Cai, W.; Cai, W. Carbon-dioxide mitigation in the residential building sector: A household scale-based assessment. Energy Convers. Manag. 2019, 198, 111915. [Google Scholar] [CrossRef]
  34. Ang, B. LMDI decomposition approach: A guide for implementation. Energy Policy 2015, 86, 233–238. [Google Scholar] [CrossRef]
  35. Wang, M.; Feng, C. Exploring the driving forces of energy-related CO2 emissions in China’s construction industry by utilizing production-theoretical decomposition analysis. J. Clean. Prod. 2018, 202, 710–719. [Google Scholar] [CrossRef]
  36. Ma, M.; Yan, R.; Du, Y.; Ma, X.; Cai, W.; Xu, P. A methodology to assess China’s building energy savings at the national level: An IPAT–LMDI model approach. J. Clean. Prod. 2017, 143, 784–793. [Google Scholar] [CrossRef]
  37. Li, K.; Ma, M.; Xiang, X.; Feng, W.; Ma, Z.; Cai, W.; Ma, X. Carbon reduction in commercial building operations: A provincial retrospection in China. Appl. Energy 2022. [Google Scholar] [CrossRef]
  38. Wu, W.; Ma, X.; Zhang, Y.; Li, W.; Wang, Y. A novel conformable fractional non-homogeneous grey model for forecasting carbon dioxide emissions of BRICS countries. Sci. Total. Environ. 2020, 707, 135447. [Google Scholar] [CrossRef]
  39. Khanna, N.; Fridley, D.; Zhou, N.; Karali, N.; Zhang, J.; Feng, W. Energy and CO2 implications of decarbonization strategies for China beyond efficiency: Modeling 2050 maximum renewable resources and accelerated electrification impacts. Appl. Energy 2019, 242, 12–26. [Google Scholar] [CrossRef]
  40. Wang, M.; Feng, C. Decoupling economic growth from carbon dioxide emissions in China’s metal industrial sectors: A technological and efficiency perspective. Sci. Total. Environ. 2019, 691, 1173–1181. [Google Scholar] [CrossRef]
  41. Wei, W.; Zhang, P.; Yao, M.; Xue, M.; Miao, J.; Liu, B.; Wang, F. Multi-scope electricity-related carbon emissions accounting: A case study of Shanghai. J. Clean. Prod. 2020, 252, 119789. [Google Scholar] [CrossRef]
  42. Ma, M.; Cai, W. Do commercial building sector-derived carbon emissions decouple from the economic growth in Tertiary Industry? A case study of four municipalities in China. Sci. Total. Environ. 2019, 650, 822–834. [Google Scholar] [CrossRef]
  43. Zhang, L.; Wang, C.; Song, B. Carbon emission reduction potential of a typical household biogas system in rural China. J. Clean. Prod. 2013, 47, 415–421. [Google Scholar] [CrossRef]
  44. Jing, R.; Kuriyan, K.; Kong, Q.; Zhang, Z.; Shah, N.; Li, N.; Zhao, Y. Exploring the impact space of different technologies using a portfolio constraint based approach for multi-objective optimization of integrated urban energy systems. Renew. Sustain. Energy Rev. 2019, 113, 109249. [Google Scholar] [CrossRef]
  45. Li, J.; Song, X.; Guo, Y.; Yang, Q.; Feng, K. The determinants of China’s national and regional energy-related mercury emission changes. J. Environ. Manag. 2019, 246, 505–513. [Google Scholar] [CrossRef]
  46. Wang, H.; Lu, X.; Deng, Y.; Sun, Y.; Nielsen, C.P.; Liu, Y.; Zhu, G.; Bu, M.; Bi, J.; McElroy, M.B. China’s CO2 peak before 2030 implied from characteristics and growth of cities. Nat. Sustain. 2019, 2, 748–754. [Google Scholar] [CrossRef]
  47. Lu, H.; Ma, X.; Ma, M. A hybrid multi-objective optimizer-based model for daily electricity demand prediction considering COVID-19. Energy 2021, 219, 119568. [Google Scholar] [CrossRef] [PubMed]
  48. Ma, M.; Cai, W.; Wu, Y. China Act on the Energy Efficiency of Civil Buildings (2008): A decade review. Sci. Total. Environ. 2019, 651, 42–60. [Google Scholar] [CrossRef] [PubMed]
  49. Cai, W.; Liu, C.; Jia, S.; Chan, F.T.; Ma, M.; Ma, X. An emergy-based sustainability evaluation method for outsourcing machining resources. J. Clean. Prod. 2020, 245, 118849. [Google Scholar] [CrossRef]
  50. Lu, H.; Ma, X.; Ma, M.; Zhu, S. Energy price prediction using data-driven models: A decade review. Comput. Sci. Rev. 2021, 39, 100356. [Google Scholar] [CrossRef]
Figure 1. Flowchart of this study.
Buildings 11 00510 g001
Figure 2. Six factors guided by the Kaya identity in an emissions model of a commercial building operation.
Buildings 11 00510 g002
Figure 3. Emissions abatement from commercial building operations at the levels of (a) total abatement and (b) abatement per floor space and per capita.
Buildings 11 00510 g003
Figure 4. (a) Static emissions scenario with the emission peak dynamic scenario simulation towards 2060, and (b,c) the distribution of carbon peak status of the commercial building operations.
Buildings 11 00510 g004
Figure 5. Distributions of (a) energy peak status and (b) emission peak status in future commercial building operations.
Buildings 11 00510 g005
Figure 6. Sensitivity analysis of the uncertainty of carbon peak status of commercial building operations.
Buildings 11 00510 g006
Figure 7. Decarbonization roadmap of commercial building operations to obtain carbon neutrality by 2060.
Buildings 11 00510 g007
Figure 8. Energy benchmark with its peak status of future commercial building operations in schemes: (a) positive, (b) normal (BAU scenario), and (c) negative.
Buildings 11 00510 g008
Figure 9. Historical low carbon transition strategies in Chinese commercial building operations from 1980 to 2020.
Buildings 11 00510 g009
Table 1. Variable definitions in the emissions scenario analysis.
SymbolFactorUnitDistribution of Random Value
P PopulationBillion personsN (0, 0.08)
g GDP per capita1000 USD·person−1N (0, 0.20)
S Industrial structure%N (0, 0.05)
I Industrial efficiency of the service industrym2·1000 USD−1N (0, 0.10)
e Energy intensitykgce·m−2N (0, 0.17)
K Energy-related carbon intensitykgCO2·kgce−1N (0, 0.20)
Publisher’s Note: MDPI stays neutral with regard to jurisdictional claims in published maps and institutional affiliations.

