1. Introduction
The Circular Economy (CE) concept usually means taking both environmental and economic aspects very seriously. Its objective is to keep the value of products, resources, and materials in the endless flow. However, a reduction in waste generation is quite substantial [
1,
2,
3]. So, it aims to change the habits from a linear model of the economy (extraction, manufacture, use, and disposal) to a new, circular one that modifies a traditional life cycle of products, materials, and resources (water and energy, among others), by introducing them again and again in successive production cycles [
2,
4]. This approach increases efficiency in the use of resources, achieving a better balance and harmony between economy, environment and society [
5,
6,
7]. Furthermore, it is an idea that applies to companies of all sectors [
2,
6,
7,
8,
9], and therefore also to the construction industry [
4,
10]. It is worth to note that the efforts, made to measure it [
11], in this particular sector, have been merely non-existent. However, there is no doubt that the construction industry has a significant impact on the environment [
12,
13,
14,
15,
16,
17] or the use of materials [
18,
19] and other resources [
20]. Therefore, CE for this sector is quite essential [
4,
12,
18,
19,
20,
21].
A construction industrys environmental impact is conditioned by extensive use of non-renewable resources and a generation of contaminant residues. Unfortunately, the values of the two aspects are increasing at accelerating pace [
18,
19,
22]. Negative externalities of the sector are dangerous, and they start with significant destruction of the stock of natural capital [
23] through entropic degradation. The issue is particularly tangible when we observe its most visible or known effects, such as the fall of the native forest, the depletion of fossil fuels, the reduction of water reserves and the pollution of the environment through the emission of greenhouse gases [
24], and other significant processes [
25,
26]. Therefore, construction projects need to be designed from the beginning with criteria of environmental sustainability [
27], keeping into consideration their entire Life Cycle Analysis (LCA). This attitude considers design phase, manufacturing of materials phase, construction phase, operation and maintenance phase, as well as the end-of-life phase as a closed cycle [
28,
29].
Moreover, in the construction industry, companies are mainly general contractors who manage one or several phases of the life cycle of construction projects. Circular Economy must be present in each phase of the construction projects developed by these enterprises. Thus, it is needed to adopt principles of Cradle to Cradle concept [
30,
31,
32,
33], designing for deconstruction [
22,
34], Building Information Modelling (BIM) [
35,
36], and close loop instruction, in the very beginning of the construction project. Besides, more initiatives for sustainable production and the use of sustainable sources are needed. They would minimise the waste generated and reduce the amount of materials employed during the manufacturing materials, construction and maintenance phases [
4] or the reuse and recycle in demolition or, so-called, end-of-life phase [
22,
34]. All these ideas are strategies of CE that the companies of the construction industry are already using during the projects’ entire life-cycle [
4,
22,
30,
34,
37].
Because of the explicit importance of the CE today, the generation of a relevant set of Key Performance Indicators (KPIs) that allows managers to identify and control if a construction company is applying Circular Economy practices in the different phases of construction projects, and with what intensity, is a subject of great interest [
11]. The generation of these KPIs allows the development of software for control panels specific to this industry [
15]. Precisely, this article puts the focus on these issues. This work is a continuation of previous investigations [
38,
39]. It is a practical refinement of earlier, more theoretical, inquiries. An identification of KPIs related to the CE, which are used by construction companies, is the contribution to research. On the other hand, the paper illustrates the practical applicability of these indicators through the design and development of a dashboard (control panel) for managing CE in a relevant company in the sector.
2. Key Performance Indicators Related to Circular Economy
To determine the KPIs related to CE in the construction industry, we conducted a review of the literature that allowed the first identification of these issues. Such a process is a method generally used for this purpose [
40,
41,
42]. After this step, all items were classified in two ways.
Firstly, they were grouped by their level of measurements: the KPIs related to the whole organisation (1)—macro-level; the KPIs related to the processes (2)—process level, and the KPIs related to the workgroup (3)—micro-level. This way of aggregation is a typical breakdown structure for organisational issues and can be found in the literature [
43,
44]. It is partly transferred from the Shenhar and Dvir’s “Success Dimensions” model [
45], which is a multi-dimensional concept that defines effectiveness across the organisation [
46]. In such a context, the organisation hierarchy consists of three levels where ‘organisation’ is on the top, ‘workgroups’ are at the lowest level, and ‘processes’ are in the middle. It can be noted that the breakdown structure is compatible with process management. The process approach is promoted, among others, by the International Organization for Standardization (ISO), especially in standards of ISO 9000/ISO 14000 families [
47]. Processes occurring in construction enterprises can be divided into primary (main), auxiliary, and management processes, whereas the first two are usually associated with construction projects [
48]. It must be noted that workgroups (also known as workstations) are part of the processes, while the processes form the organization. Such a framework makes the CE measurement in a construction company comprehensive and complex.
Secondly, the items were re-classified according to the LCA phase where each one operated; these are design phase, manufacturing of materials phase, construction phase, operation and maintenance phase, and finally deconstruction/end-of-life phase [
49].
Finally, all searched KPIs were classified according to the criteria mentioned above. Each item was assigned to a group, based on its relevance and its frequency of appearance in the literature. In this way, a total of fifteen KPIs were incorporated into the model.
A standard sustainable CE life cycle of a construction project should consist of five phases: (1) the sustainable process of design; (2) the sustainable process of manufacturing materials and equipment; (3) the sustainable process of construction; (4) the sustainable process of maintenance; and (5) the sustainable process of building demolition and recycling.
The phases include three levels of consideration: (a) organisation—decisions related to the macro-level (usually to the whole construction company) in all phases; (b) processes—decisions regarding the processes of the construction in all phases; and (c) workgroup—decisions related to the micro-level (usually individuals or group of workers) in all phases.
For each indicator, a weight was attributed based on the relevance that it has in the literature, how many times it appears, a position that it occupies within the different studies. Besides, the desired goal (reference value) is established. The KPIs selected the weights, and the desired values are presented in
Table 1.
3. Materials and Methods
A simulation may become a useful technique for analysing and solving problems, which mimics the functioning of a real-world system that evolves. The method applies to any type of problem, probabilistic or deterministic. As a method of numerical character, it has an absolute error in the estimate that decreases to 1/N, when the iterations number increases (N), according to principles of the central limit theorem.
The Monte Carlo simulation (MCS) is an effective method of generating random variables that fit given probability distributions [
50,
51,
52]. After defining a parametric model, the values are computed. Then, the iterative process is repeated thousands of times until the moment in which each range becomes a frequency distribution, which allows describing statistics such as mean, variance, and other parameters [
52].
A probability distributions for KPIs, as the result of the Monte Carlo simulation, are proposed in this article. There are selected groups of KPI results and a result of the final CE index, which measures a degree of the propensity of the construction company to implement the CE (called CE Scale). This output shows the most probable values (score) of each indicator, group of indicators, and the final index so that these values can be used as cut-off values in the graphical representation in Dashboards (CE Scale). It means that if the result of the analysis is below the simulated mean values, a company lies in a danger zone (the degree of application of the CE principles is below desirable minimums). On the other hand, above the simulated mean values are satisfactory states (the degree of CE application is more than expected).
So far, the MCS has been used to investigate general aspects of companies and their projects [
51]. However, its application to sustainability issues was limited [
11,
50,
52]. Besides, in the field of economics and business science, these methods are not concentrated on the CE issues. Therefore, an implementation of the MCS, as a mean to evaluate construction companies in terms of their propensity to carry out activities under the CE principles, is a new look at the problem. So, one can treat it as a critical contribution to research. In the MCS-based model, the following stages are included: (1) the model emerges; (2) stochastic input variables and their probability parameters are defined; (3) software computes random numbers for each input variable according to its probability distribution; (4) running the model; (5) visualisation and capturing the behaviour of the system [
50,
51,
52].
The conceptual model, based on the formula for CE Index (CEI) in the construction industry, is described by the following Equations (1)–(4) [
39]:
wi—weights of particular indicators in
Section 1: ‘Organisation’
SOi—scores in
Section 1, {
SO1,
SO2,
SO3,
SO4,
SO5}
wj—weights of particular indicators in
Section 2: ‘Processes’
SPi—scores in
Section 2, {
SP1,
SP2,
SP3,
SP4,
SP5}
wk—weights of particular indicators in
Section 3: ‘Workgroup’
SWi—scores in
Section 3, {
SW1,
SW2,
SW3,
SW4,
SW5}
SO1—score for ‘Design’
SO2—score for ‘Manufacture of materials’
SO3—score for ‘Construction’
SO4—score for ‘Maintenance’
SO5—score for ‘End-of-life’
SP1—score for ‘Design’
SP2—score for ‘Manufacture of materials’
SP3—score for ‘Construction’
SP4—score for ‘Maintenance’
SP5—score for ‘End-of-life’
SW1—score for ‘Design’
SW2—score for ‘Manufacture of materials’
SW3—score for ‘Construction’
SW4—score for ‘Maintenance’
SW5—score for ‘End-of-life’
The scores are based on deterministic values. The objectives and weights are useful inputs to develop the Monte Carlo simulation technique. These values can vary so should be described by some probabilistic parameters that constitute foundations for the simulation model. A simulated value of the Circular Economy Scale (CES) computes according to Equation (5):
where:
Parameters xi, xj, and xk are random input variables that affect the probabilistic results of the propensity of construction companies to implement CE principles. The statistical properties of inputs may be taken from a database or might be expert-based too. The probability distributions enable simulating the corresponding random numbers. Circular Economy Scale (CES) is the output score (in three mains groups of KPIs and general index). It is calculated in subsequent iterations. As the simulation output is every time different, the CES values take the form of a random variable f which is represented by its probability density function. Besides, multiple iterations allow calculating the most probable value of the CES in the construction company.
All simulations were conducted in “@RISK” software during 5000 pre-set number of iterations.
Monte Carlo Simulation Results
The results of the Monte Carlo simulation method allow obtaining a probable value (score) for Key Performance Indicator in each of the three mains sections, starting from the desired target and the assigned weight by applying Equations (1)–(5). The most probable value of the final score of the Circular Economy Index in construction companies, executing projects according to the CE principles, can also be obtained (in the trial simulation [
39] was 58.78%). These results are shown in
Table 2.
These most likely values can be used to represent a partial measure of a construction company for each of the three major sections (Organization, Processes, Workgroup), and the final score, Circular Economy Index. The latter is calculated as the arithmetic mean of the three groups (see Equations (1)–(4)).
One can also set limits between the excellent and insufficient performance of the company according to CE principles. On the one hand, if the observed results, in reality, are above the limit, then a company follows principles of CE. On the other hand, if results are below the limit, then a company should improve procedures to follow the CE rules. The question is what the limit can be? It is proposed to perform an expert-based session before each simulation. By determining the values represented by each KPI in the specific case of a particular company in the sector, and knowing these most likely values, it is possible to establish a CE Dashboard for the graphical analysis of the company. In the next section, simulations from the previous article [
39] were used to create the dashboard.
4. Results
4.1. The case of General Contractor (GC) Building Company
The construction industry company, for which the dashboard has been designed, is named General Contractor (GC) Building Company due to confidentiality issues. It is an international company of the construction sector, with headquarters in Spain (Europe), and is present in 30 countries. The company employs more than 176,000 people, generating in 2017 a turnover of 27,221 million euros. The 95% of the turnover proceeds from international markets (43% of Asia Pacific; 42% of North America; 2% from South America; 8% of the rest of Europe—not Spain—and 5% from Spain). Its business model is based on three main lines of activities: (1) civil works, infrastructure development projects such as motorways, railway, maritime, and airport infrastructures; (2) building, residential buildings, and social facilities; (3) mining, contracts for the provision of services in mining, as well as the development of the necessary infrastructures. GC Building Company has developed essential construction projects around the world, such as the cable-stayed bridge over the Firth of Forth, an estuary in Edinburgh (United Kingdom); the extension of the London subway (United Kingdom); the renewal of the national road network in Poland; high-speed rail infrastructures in California (the USA) or the expansion of the Hong Kong airport (China).
The company has a firm commitment to the CE, an issue that is reflected in its annual reports on Corporate Social Responsibility [
53]. From these reports, most of the data (
xi,
xj and
xk) on the KPIs have been obtained. When these indicators could not be reached in this way, other secondary sources have been used or have been obtained expressly (ad-hoc).
4.2. Dashboard Design and Development for the Company GC
To design and develop the CE Dashboard, we selected the software Qlik of Qlik Tech International AB Company taking into account several factors, such as the power of its visual interface and the heterogeneity of the data sources it can use [
54]. Companies from different sectors use Qlik software for data processing and visualisation [
54], for example, the manufacturer of the computer Toshiba, Hertz driverless rental car firm, or the consumer electronics manufacturer Sony [
54].
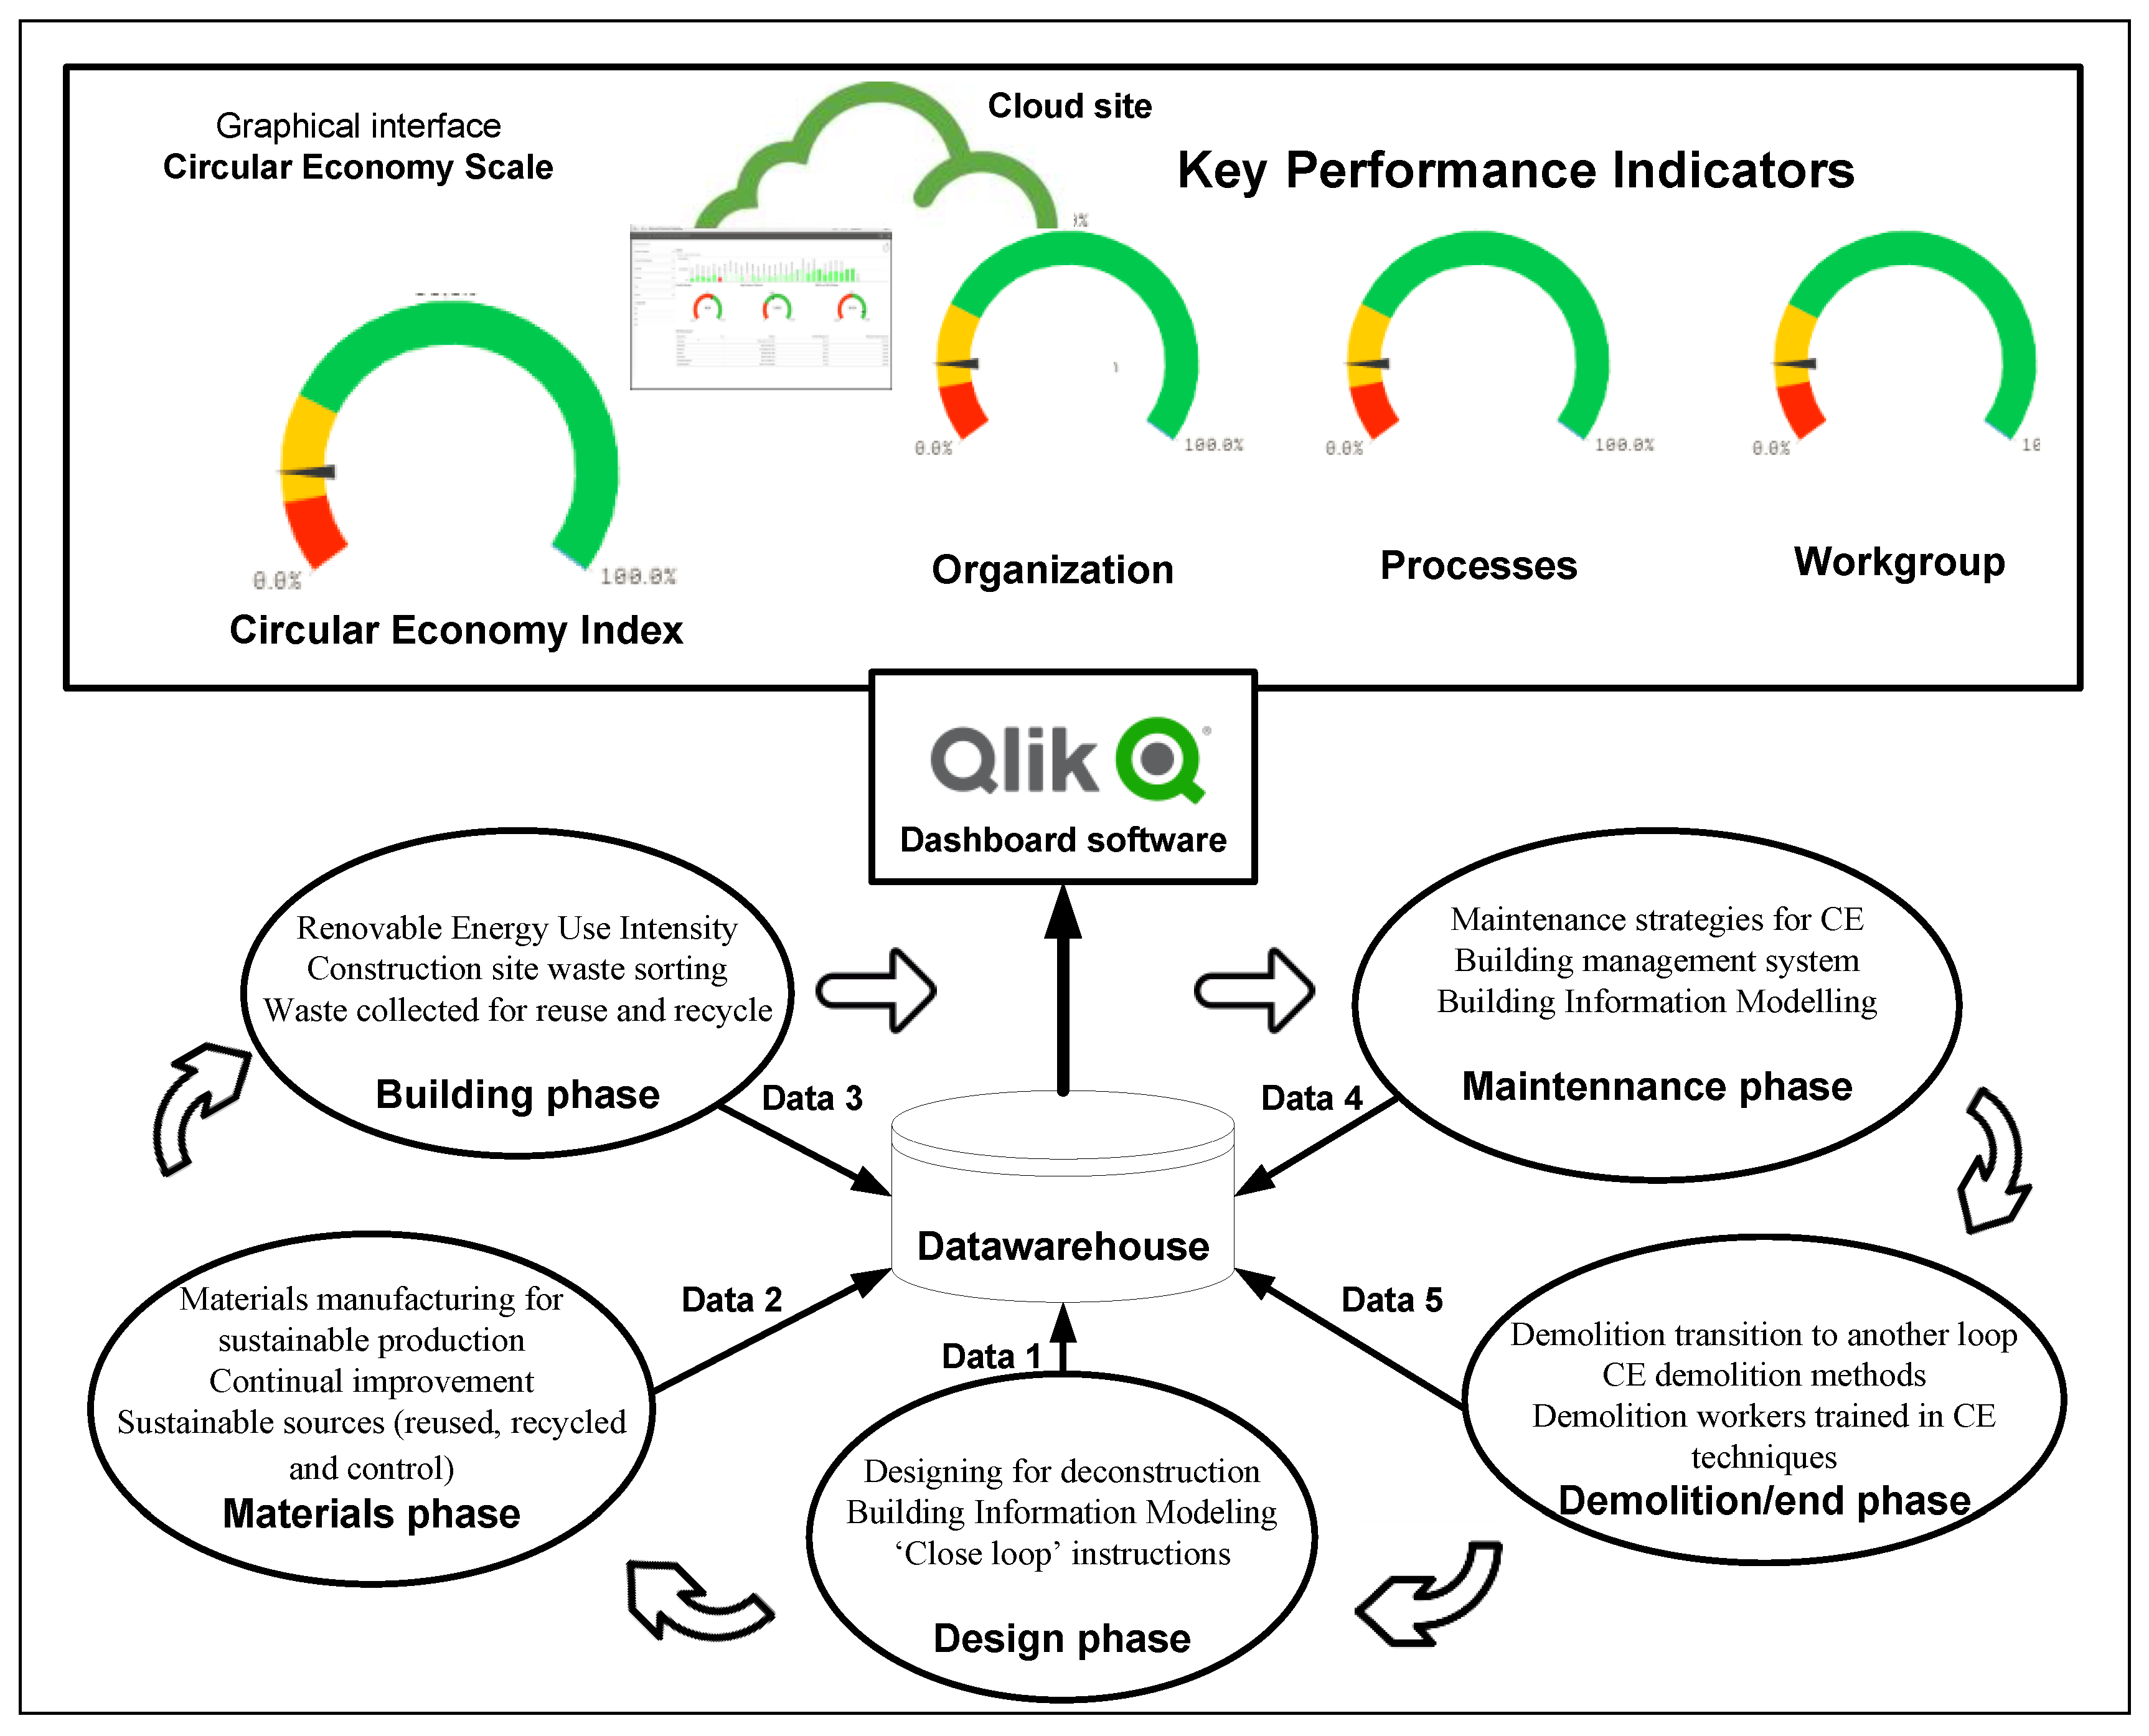
Figure 1 shows the CE Dashboard design from a high conceptual level. In other words, it shows how data is consolidated into a warehouse which connects to a Cloud application that manages the dashboard. The proposed CE Dashboard design from a high conceptual level is developed using a Cloud-Webserver based architecture. Cloud-Webserver based architecture enhances the accessibility so users can avail the CE Dashboard using a web browser from their system. Such an approach is especially beneficial since the storage and distribution network of the organisation is very wide.
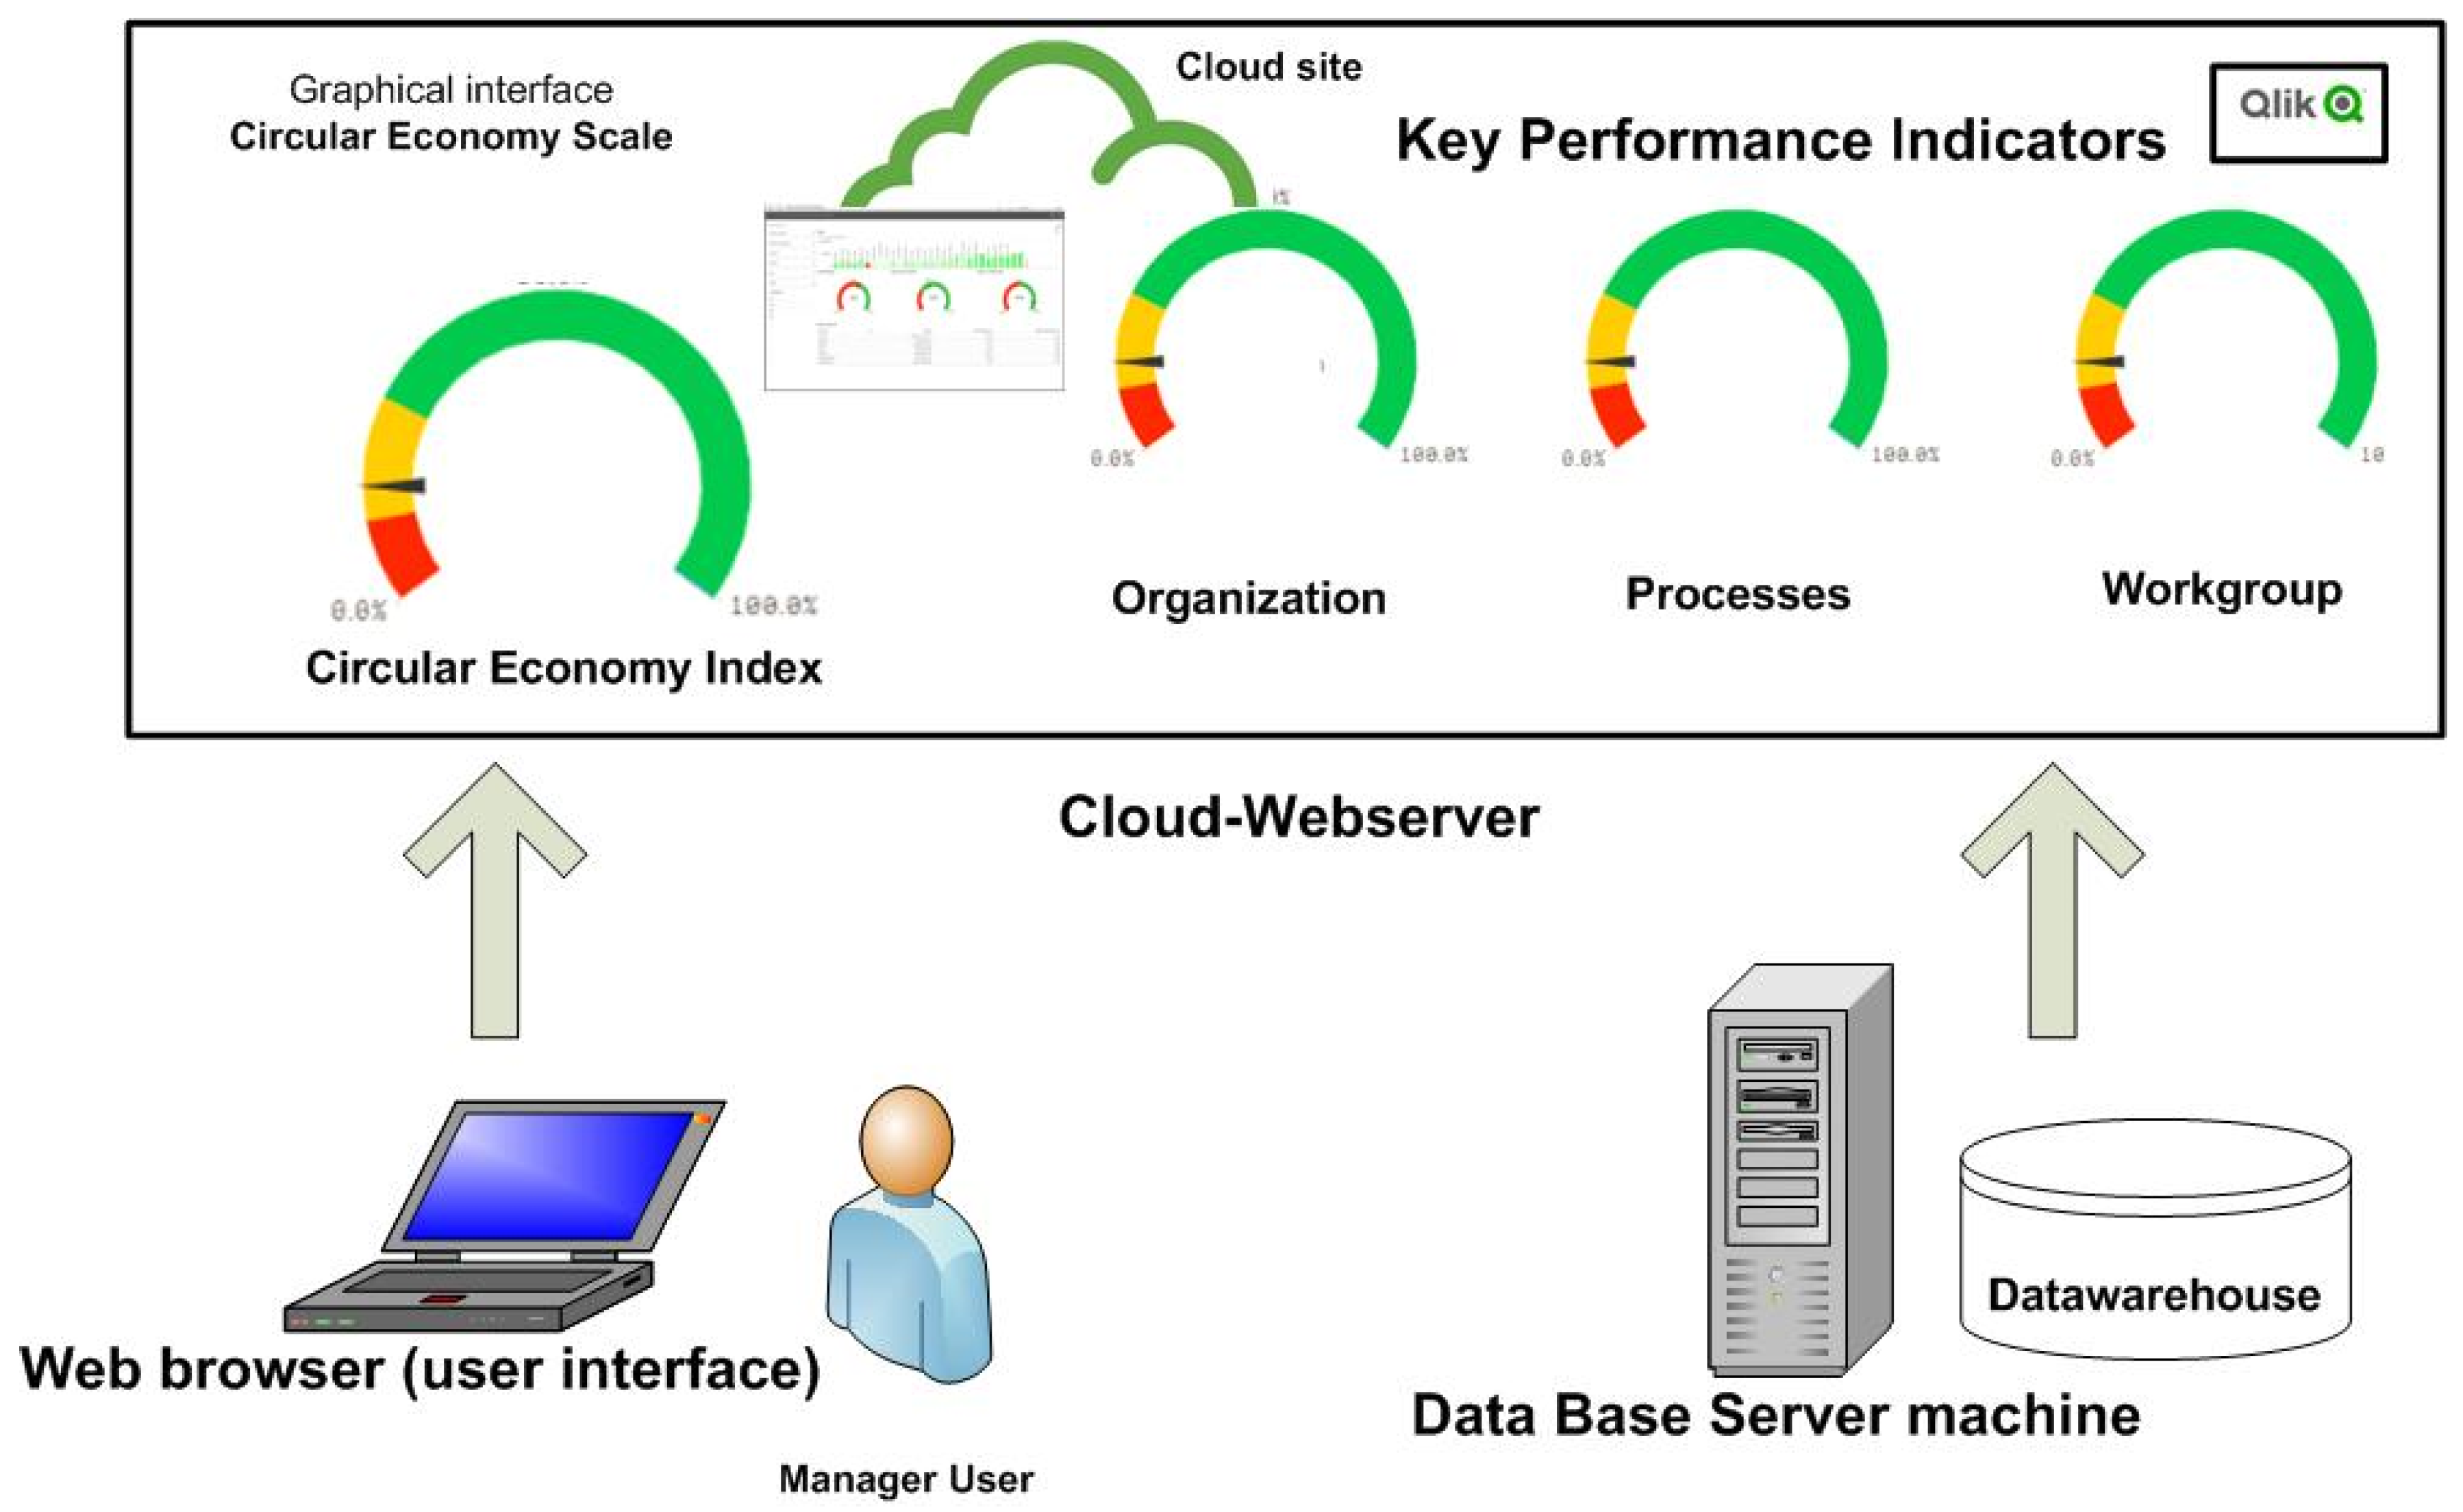
Figure 2 presents the architecture of the proposed CE Dashboard by GC Building Company. It shows a Cloud-Web server framework that receives data from a database server machine (warehouse), which users access from a web browser (user interface).
The KPIs included in
Table 1 were specified in possible measures, going from the conceptual level of the business language to the technical level allowing its graphic representation in the form of a Dashboard. A specific graphic representation was proposed for each KPI, each group of KPIs, and the CE Index. Thus, the speedometer graphs were selected for CE General Index and each of the three mains groups of indicators. This type of representation, like those of a car dashboard, consists of three colours: (1) green indicative of proper compliance, (2) yellow indicative of caution zone, and (3) red, indicative of danger zone. The most probable values for each group and general index, according to the results obtained in the Monte Carlo simulation (output score), suppose the limit of the zone of excellent performance (green). Below these values with a reduction of 10 units expressed in %, delimits the precautionary zone (yellow). Data with a more significant reduction of this value make up the danger zone (red). Within each group, traffic light type horizontal bar graphs were developed for the representation of the individual KPI. The criterion of the zone delimitation values (green/proper compliance, yellow/precaution, and red/danger) is the same as before.
Table 3 shows for each KPI, group of KPIs, and the general Circular Economy Index, the type of graph selected for its visualisation in the dashboard and the values of each of the three zones.
Once the graphics were selected, the different screens of the CE Dashboard were designed. The data to represent the concretes KPIs were obtained from the company’s annual Corporate Social Responsibility report or were expressly identified [
53,
55]. In the development of a Dashboard, it must prevail that in a simple glance, the managers can verify if their objectives in the CE area are fulfilled or not [
15]. This principle has been pursued throughout the design and development phase [
15] (see
Figure 1 and
Figure 2).
4.3. Dashboard Results: Circular Economy Index for the Construction Industry—Case of GC Building Company
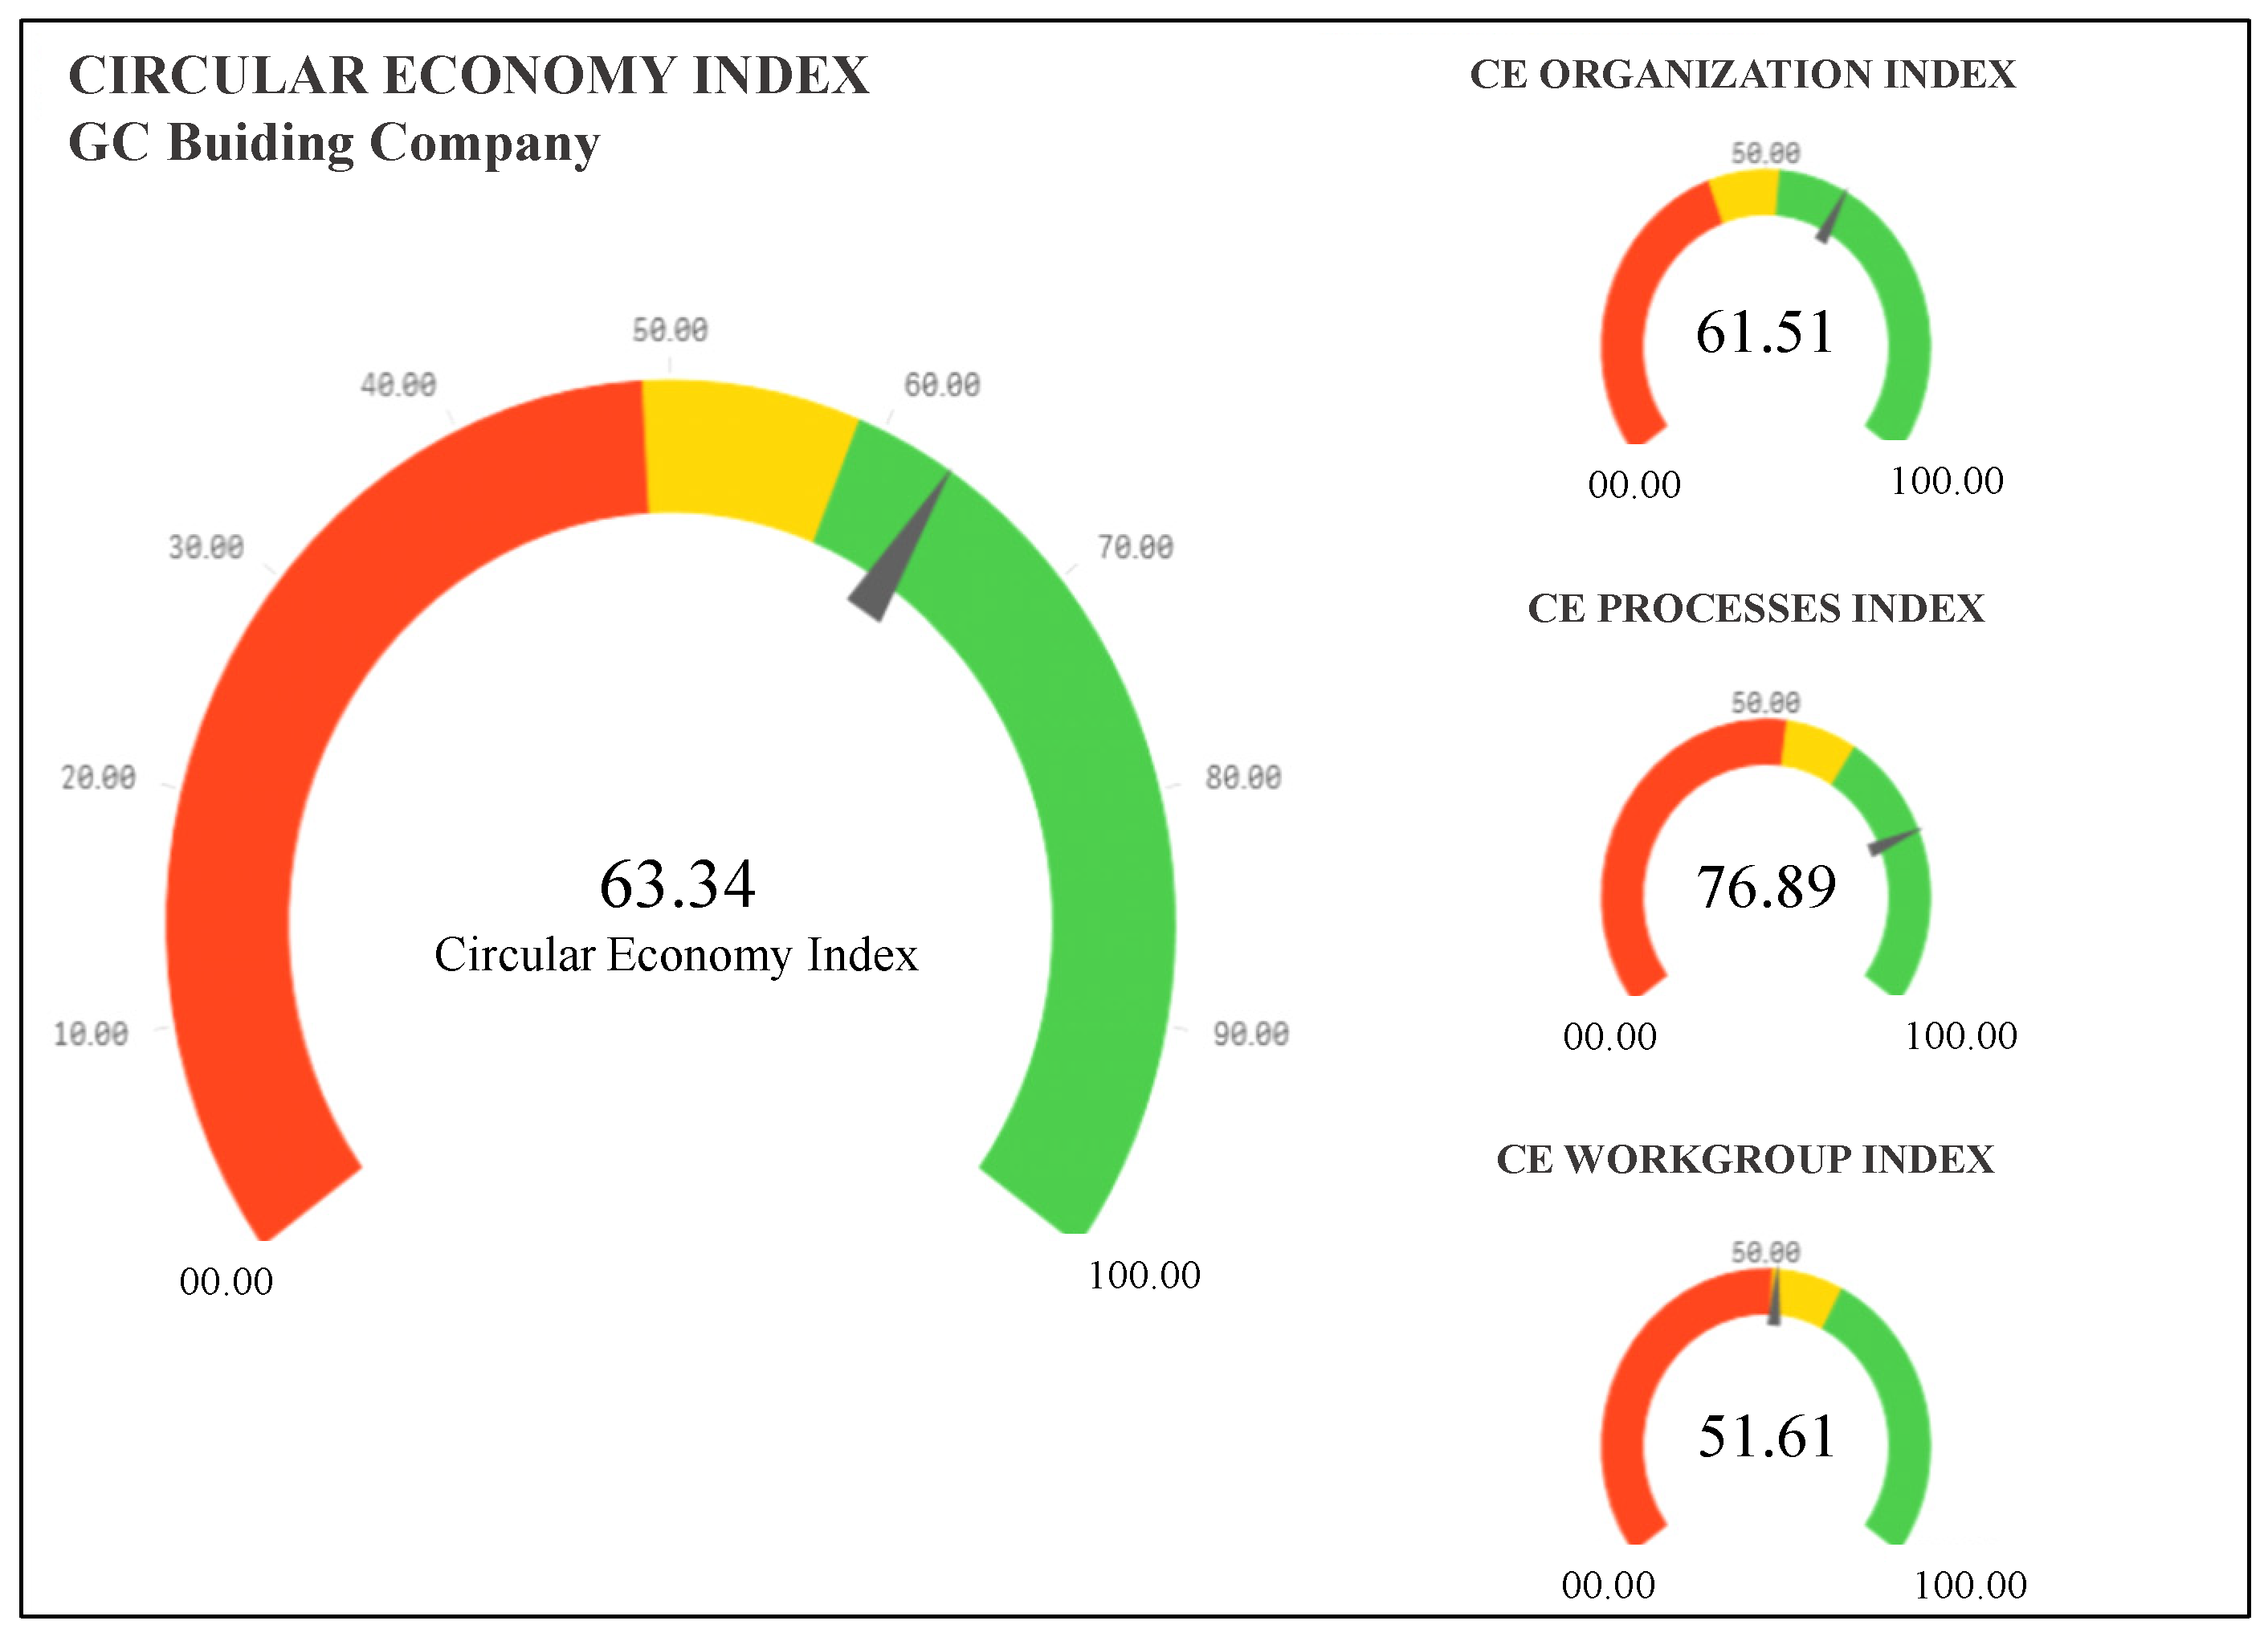
When the simulation results are interpreted, it is noted that GC Building Company obtains excellent performance in the General Circular Economy Index, above the most probable value obtained by the Monte Carlo simulation, as shown in
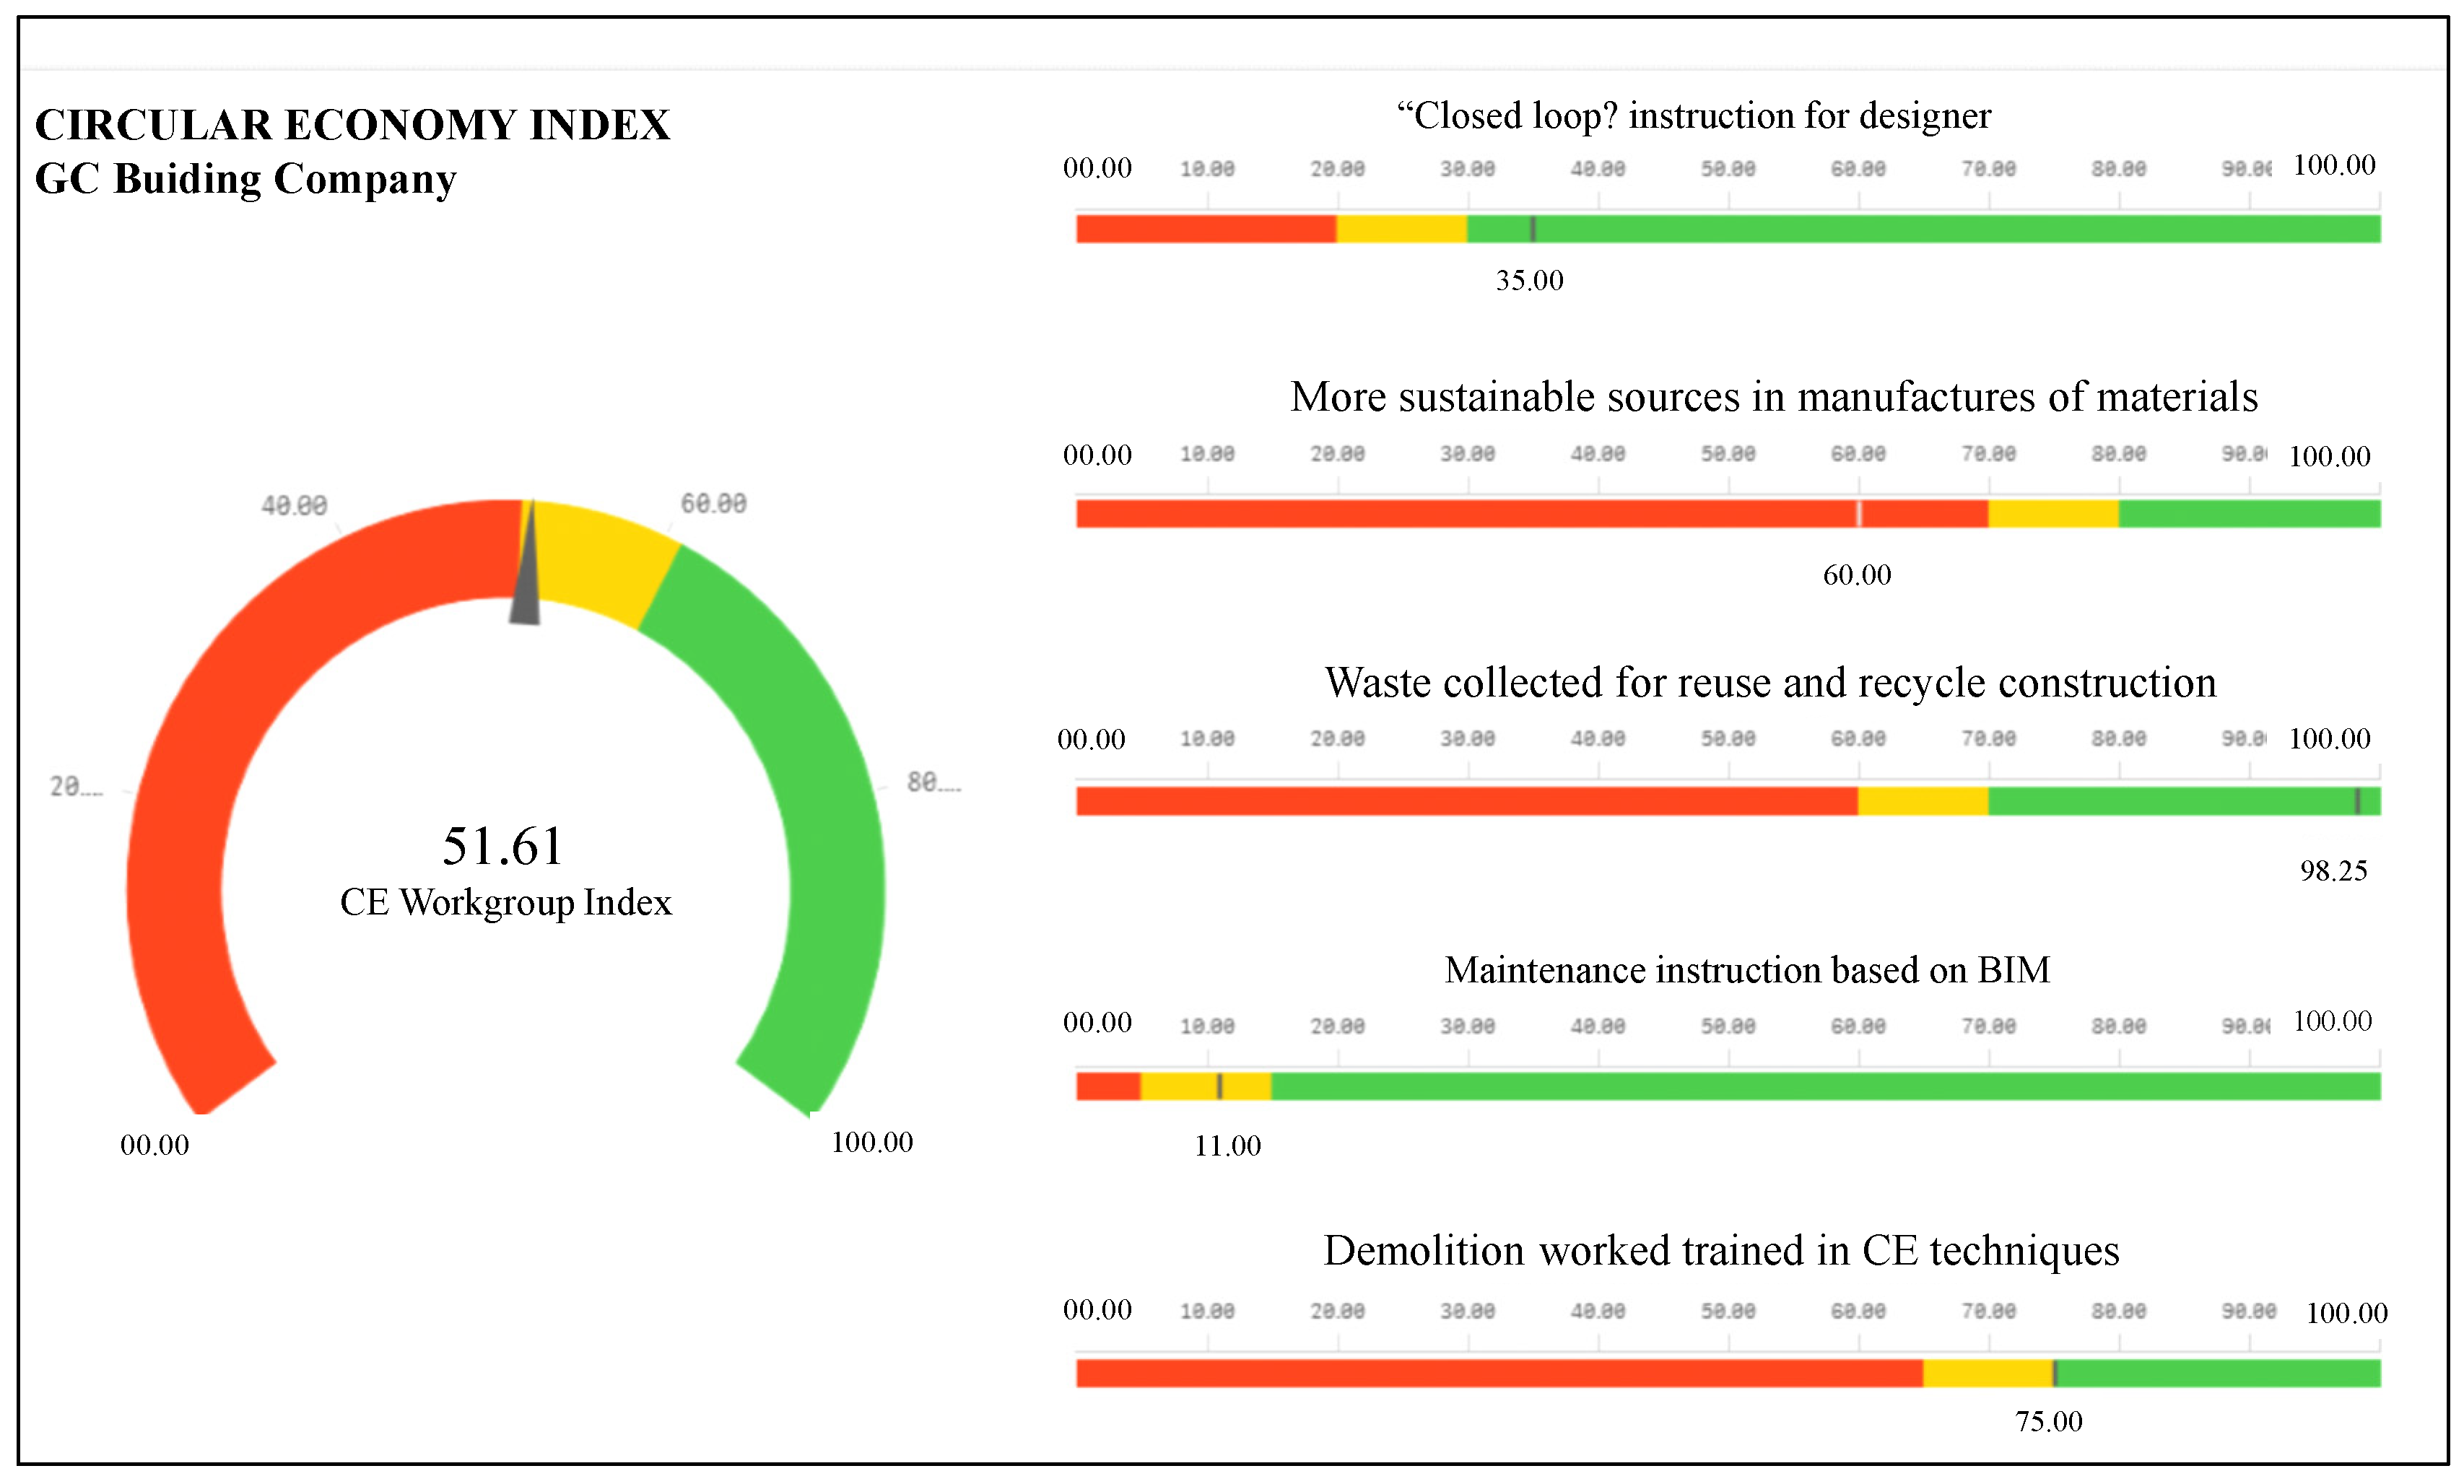
Figure 3. It shows the graphical interface of the Cloud application, with an indicator for the Circular Economy Index, and others for each of the three groups of factors (levels: Organization, Processes and Workgroup). Besides, according to the groups of Indicators, both in the Organization group and in the Process group, it achieves proper compliance, locating in the most desirable zone (green). Finally, it is especially good behaviour in CE Processes Index, where it obtains a compliance value of 76.89% compared to the most probable value of 63% obtained by the Monte Carlo technique. On the other hand, a worse performance is obtained in CE Workgroup index, in which it is located in the caution zone (yellow), near the danger zone (network), with a value of 51.61% compliance with the most probable value obtained by the Monte Carlo technique of 61%.
Then,
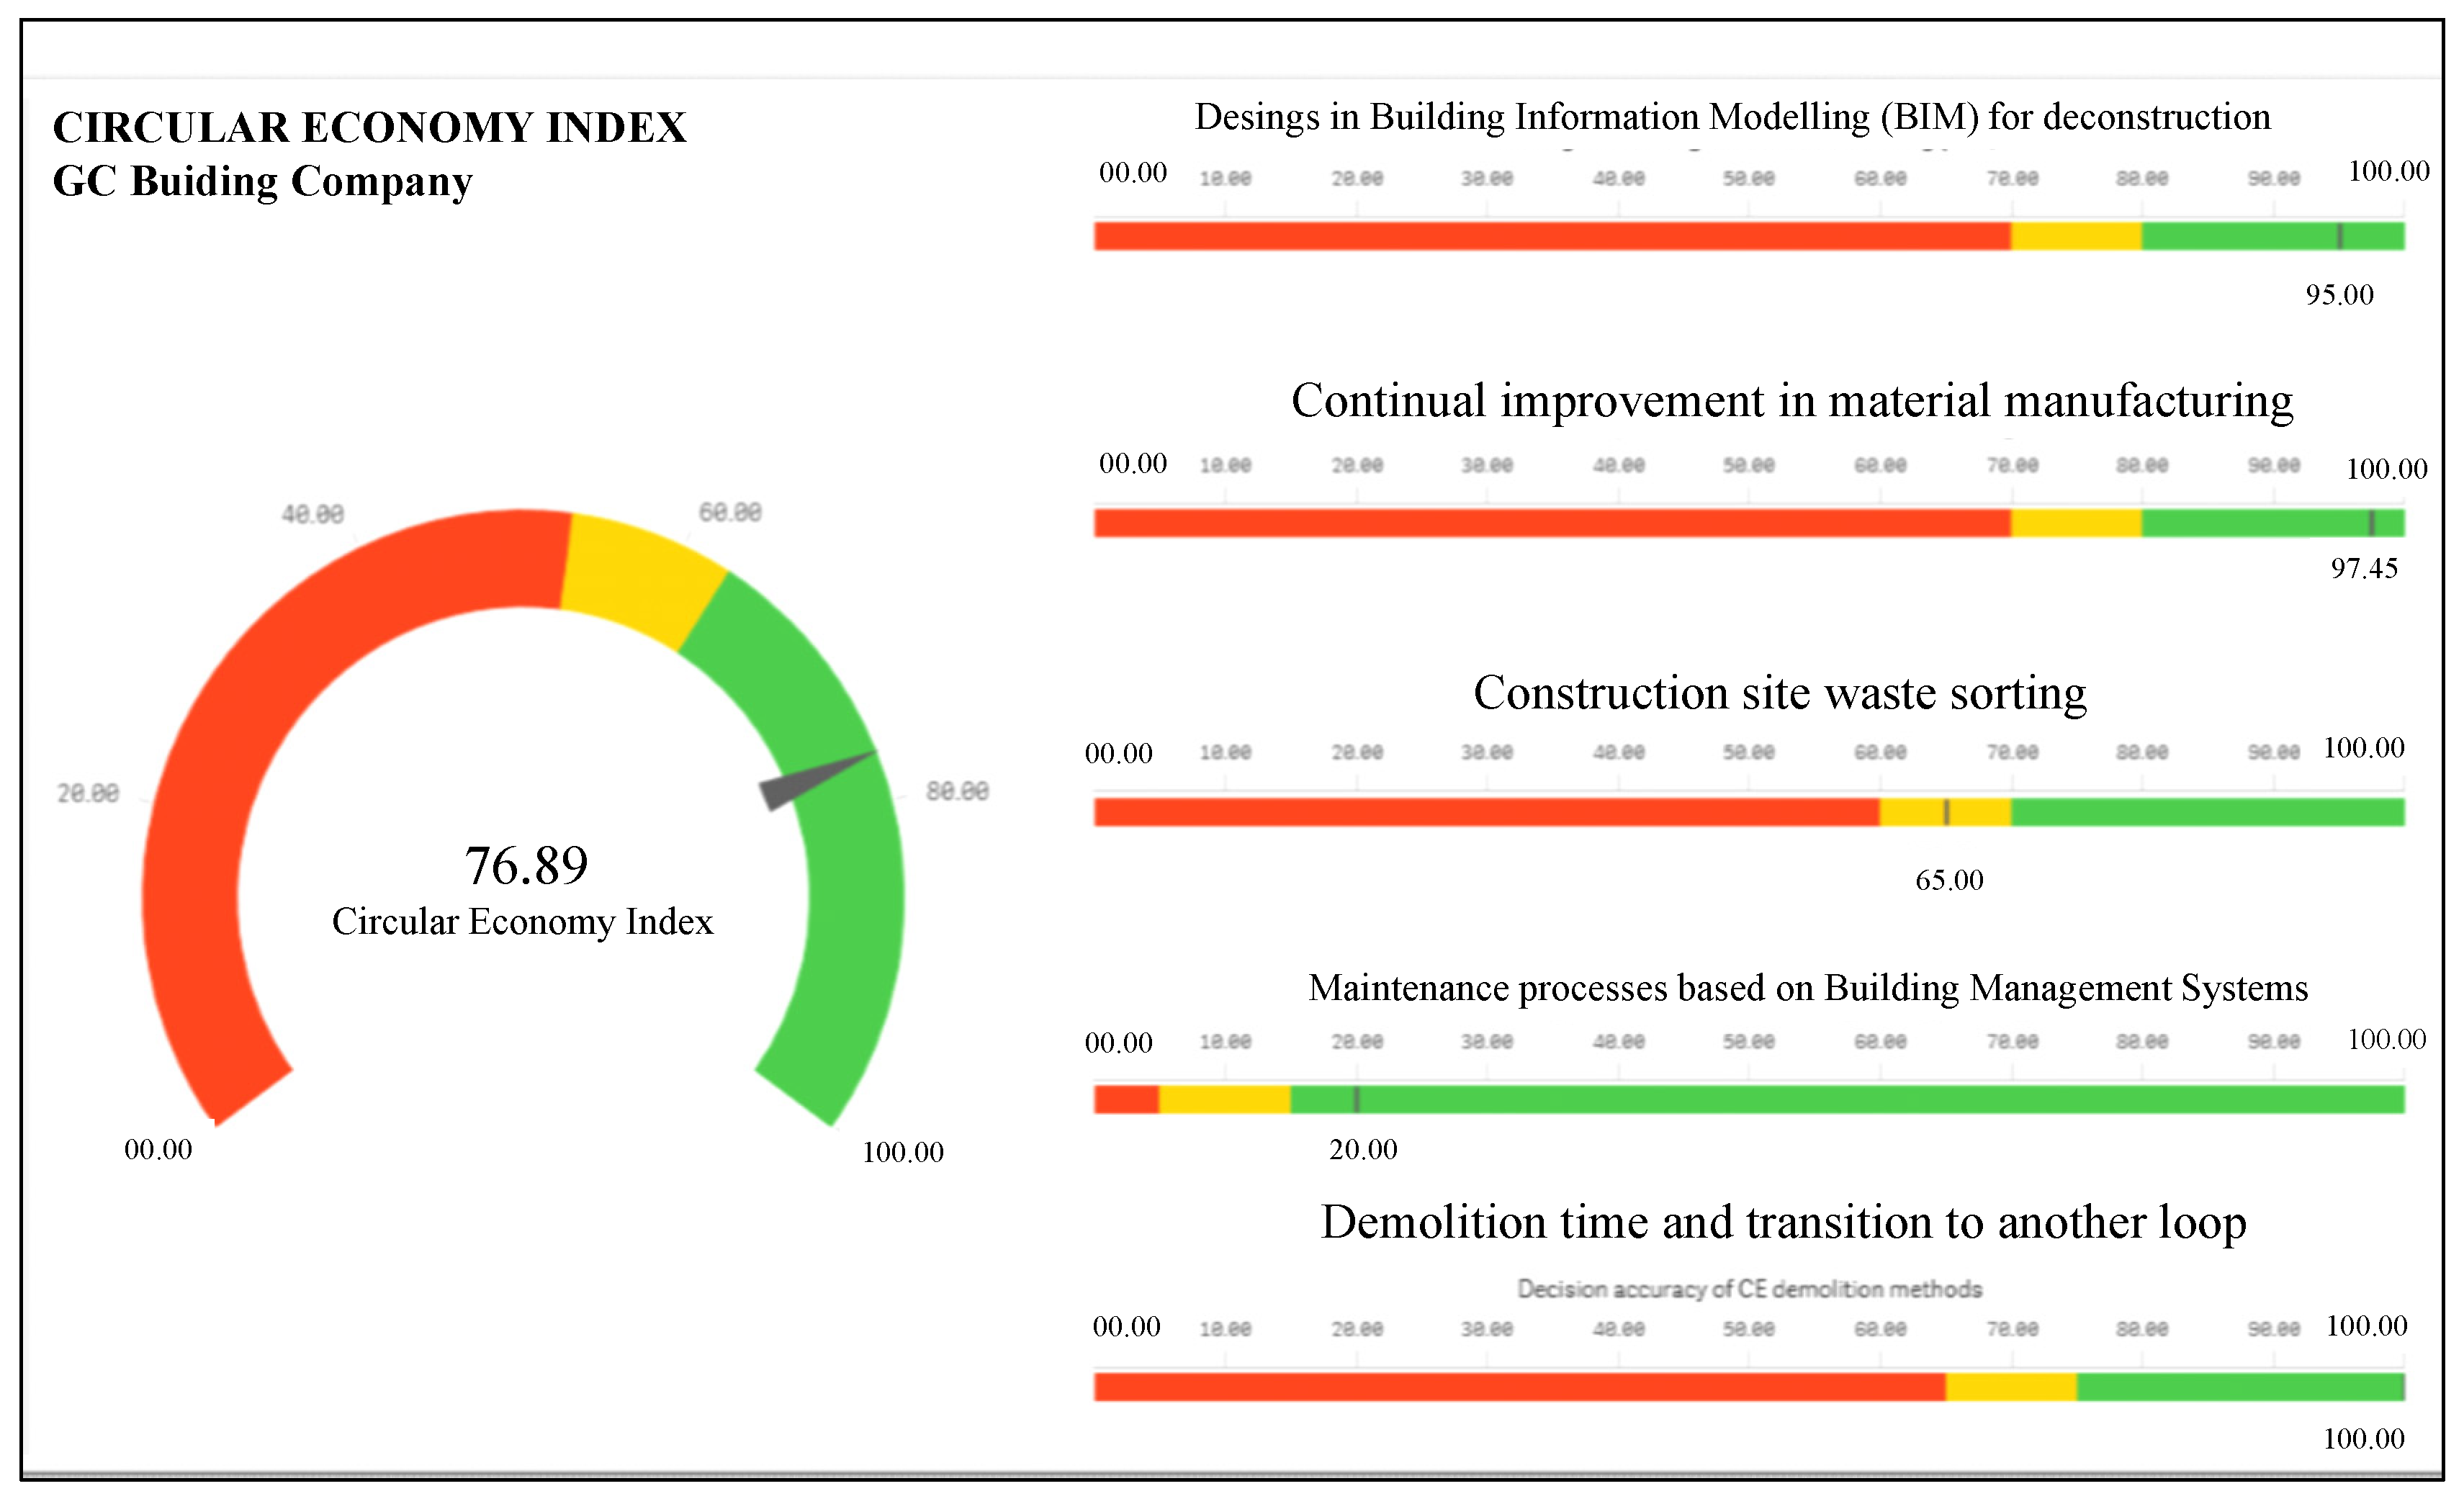
Figure 4,
Figure 5 and
Figure 6 show the three screens that include the values of CE partial index of each group of KPIs, as well as the values of each KPIs separately. The graphics consist of two parts. On the left is the counter for each section (Organization, Processes, and Workgroup). On the right side, there are specific markers for all KPIs. The practical significance of the proposed method is very high due to the fact, that the colours (red, yellow, and green) and set limits allow easy and quick interpretation of the company’s condition in terms of the Circular Economy.
The GC Building Company shows positives values in tow of large groups of indicators (Organization and Processes). In these groups, concerning each specific KPI, in most of them, its behaviour is remarkable (see
Figure 4 and
Figure 5).
In the group of KPIs of CE Workgroup Index (
Figure 6), the result is insufficient in the KPI “More sustainable sources use in manufactured materials phase (recycled components, recycled and controlled virgin feedstock)”, is located in it in the danger zone with a value of 11% compliance. A justification for this could be that the use of sustainable sources for the manufacture of materials is not always possible in a global environment, where local laws do not always regulate and encourage the use of such sources. Additionally, in this group of KPIs, the KPI “Instructions based on BIM in maintenance phase” presents a performance that places it in the precautionary area. The explanation lies in the fact that, in the maintenance phase, many projects were built a long time ago and its complete digitalisation (BIM) is difficult. Thus, old projects in maintenance phase would not be using BIM, while newer projects that enter this phase would be using it.
5. Discussion
This paper introduces a set of valid Key Performance Indicators (KPIs) to help to manage a construction company by visualising its performance in the Circular Economy. According to these indicators, a CE Index is developed for contractors. Using the Monte Carlo simulation technique, the most probable values of performance for companies in the sector are determined. These values or CE scale are obtained for each KPI, group of KPIs, and general index.
The cited previous contributions [
39] allowed us to design and develop a CE Dashboard for a relevant company in the sector. From the specific data obtained from this company, the dashboard was designed and developed as a practical application.
This article can be used as a guide for those companies in the construction industry (general contractors involved in the whole life-cycle of construction projects) that wish to know how their performance in the CE is. Besides, the development of software applications of the dashboard allows their managers, at a glance, to know the real situation of the company facing CE to make decisions related to this matter [
55].
It is worth underlining that CE practices are crucial for the construction industry because of the tremendous impact on the environment. The construction companies are aware of how their performance in CE is [
39,
55,
56]. In this sense, this paper contributes by creating an available instrument for managers to assess the implementation of CE.
6. Conclusions
The construction sector is the largest “consumer” of natural resources and, at the same time, bears the most significant responsibility for the damage of the environment caused by human activity on the Earth. The Circular Economy principles in the built environment have a chance to stop this trend. It will only be possible through thoughtful and systematic actions of all stakeholders of construction projects, throughout its entire life-cycle—from design, construction, operation, and maintenance up to end-of-life phase, including recovery and reuse of previously processed raw materials.
Of all the key players, construction companies, that are usually contractors of construction works, alongside investors, have the most critical impact on the success and effectiveness of policies that close the flow (forces closed-loop) of matter in construction projects. The proposed solution is not only a useful tool for operational management in an enterprise. The adopted method of graphical presentation of the model may become helpful both to large corporations as well as to small and medium-sized enterprises. They can choose appropriate actions through the changing values of instruments, creating an effective development strategy. Such a simulation-based approach is particularly useful in the era of ubiquitous risk and turbulent environment of the economy, which we probably should get used to in the upcoming years.
This work has the following implications for companies in the construction sector. On the one hand, it shows the KPIs that can be considered useful to check if a company is more or less developed when it comes to the adaptation of the Circular Economy principles. On the other hand, it establishes how these KPIs can be controlled in practice through a dashboard. Thus, the development of a dashboard, in the case of the sector company, GC Building, represents a success story that can show the way forward for managers of other companies in the sector.
7. Limitations and Future Research Lines
This work is not without limitations. Although the Dashboard on CE in the construction sector has been developed and applied to a company, it would be necessary to test the model in a large group of companies, of different types, in order to improve it.
As far as the future research directions are concerned, the research should be focused on analyzing different types of construction companies. A different degree of involvement in CE and its quality may be present in the residential construction sector, in contrast to the construction of road, railway or water infrastructures. Besides, it could be interesting to link the use of KPIs with CE maturity levels [
57] or check the relationship between employing specific Circular Economy managers [
58] and the company’s performance in CE.
Author Contributions
Authors declare an equal contribution to the article in all aspects: conceptualization, data curation, formal analysis, funding acquisition, investigation, methodology, project administration, resources, software, supervision, validation, visualization, writing—original draft, writing—review & editing. All authors have read and agreed to the published version of the manuscript.
Funding
We thank the UTP University of Science and Technology, Bydgoszcz (Poland) and its Faculty of Civil and Environmental Engineering and Architecture for proving funds for publication of the manuscript.
Conflicts of Interest
The authors declare no conflict of interest.
References
- Wang, L.; Zhang, H. Development of circular economy and optimization of industrial structure for Shandong Province. Energy Procedia 2011, 5, 1603–1610. [Google Scholar] [CrossRef] [Green Version]
- Lewandowski, M. Designing the business models for circular economy-towards the conceptual framework. Sustainability 2016, 8, 43. [Google Scholar] [CrossRef] [Green Version]
- Witjes, S.; Lozano, R. Towards a more Circular Economy: Proposing a framework linking sustainable public procurement and sustainable business models. Resour. Conserv. Recycl. 2016. [Google Scholar] [CrossRef] [Green Version]
- Nasir, M.H.A.; Genovese, A.; Acquaye, A.A.; Koh, S.C.L.; Yamoah, F. Comparing linear and circular supply chains: A case study from the construction industry. Int. J. Prod. Econ. 2017, 183, 443–457. [Google Scholar] [CrossRef]
- Tibbs, H. Industrial Ecology: An Environmental Agenda for Industry; Global Business Network: Emeryville, CA, USA, 1993. [Google Scholar]
- Lenox, M.; Ehrenfeld, J. Organizing for effective environmental design. Bus. Strateg. Environ. 1997, 6, 187–196. [Google Scholar] [CrossRef]
- Hopwood, B.; Mellor, M.; O’Brien, G. Sustainable development: Mapping different approaches. Sustain. Dev. 2005, 13, 38–52. [Google Scholar] [CrossRef] [Green Version]
- Reh, L. Process engineering in circular economy. Particuology 2013, 11, 119–133. [Google Scholar] [CrossRef]
- Scheel, C. Beyond sustainability. Transforming industrial zero-valued residues into increasing economic returns. J. Clean. Prod. 2016. [Google Scholar] [CrossRef]
- Janubová, B.; Grešš, M.; Janubová, B.; Grešš, M. Urbanization of Poverty and the Sustainable Development of Urban Areas in Chile. Theor. Empir. Res. Urban Manag. 2016, 11, 17–29. [Google Scholar]
- Pask, F.; Lake, P.; Yang, A.; Tokos, H.; Sadhukhan, J. Sustainability indicators for industrial ovens and assessment using Fuzzy set theory and Monte Carlo simulation. J. Clean. Prod. 2017, 140, 1217–1225. [Google Scholar] [CrossRef] [Green Version]
- Sachs, J. The Age of Sustainable Development; Columbia University Press: New York, NY, USA, 2015; ISBN 978-0-231-17314-8. [Google Scholar]
- Pilger, J.D.; Machado, Ê.L.; de Assis Lawisch-Rodriguez, A.; Zappe, A.L.; Rodriguez-Lopez, D.A. Environmental impacts and cost overrun derived from adjustments of a road construction project setting. J. Clean. Prod. 2020, 256, 120731. [Google Scholar] [CrossRef]
- Wu, L.; Ye, K.; Gong, P.; Xing, J. Perceptions of governments towards mitigating the environmental impacts of expressway construction projects: A case of China. J. Clean. Prod. 2019, 236, 117704. [Google Scholar] [CrossRef]
- Chung, C.-C.; Chao, L.-C.; Chen, C.-H.; Lou, S.-J. A Balanced Scorecard of Sustainable Management in the Taiwanese Bicycle Industry: Development of Performance Indicators and Importance Analysis. Sustainability 2016, 8, 518. [Google Scholar] [CrossRef] [Green Version]
- Guo, S.; Zheng, S.; Hu, Y.; Hong, J.; Wu, X.; Tang, M. Embodied energy use in the global construction industry. Appl. Energy 2019, 256, 113838. [Google Scholar] [CrossRef]
- Onat, N.C.; Kucukvar, M. Carbon footprint of construction industry: A global review and supply chain analysis. Renew. Sustain. Energy Rev. 2020, 124, 109783. [Google Scholar] [CrossRef]
- Bignozzi, M.C. Sustainable cements for green buildings construction. Proc. Procedia Eng. 2011, 21, 915–921. [Google Scholar] [CrossRef] [Green Version]
- Mhlongo, S.; Abiola, O.S.; Ndambuki, J.M.; Kupolati, W.K. Use of Recycled Asphalt Materials for Sustainable Construction and Rehabilitation of Roads. In Proceedings of the International Conference on Biological, Civil and Environmental Engineering (BCEE-2014), Dubai, UAE, 17–18 March 2014; pp. 91–94. [Google Scholar]
- Jiménez Rivero, A.; Sathre, R.; García Navarro, J. Life cycle energy and material flow implications of gypsum plasterboard recycling in the European Union. Resour. Conserv. Recycl. 2016, 108, 171–181. [Google Scholar] [CrossRef] [Green Version]
- Foster, G. Circular economy strategies for adaptive reuse of cultural heritage buildings to reduce environmental impacts. Resour. Conserv. Recycl. 2020, 152. [Google Scholar] [CrossRef]
- Esa, M.R.; Halog, A.; Rigamonti, L. Developing strategies for managing construction and demolition wastes in Malaysia based on the concept of circular economy. J. Mater. Cycles Waste Manag. 2017, 19, 1144–1154. [Google Scholar] [CrossRef]
- Lo Presti, D. Recycled Tyre Rubber Modified Bitumens for road asphalt mixtures: A literature review. Constr. Build. Mater. 2013, 49, 863–881. [Google Scholar] [CrossRef]
- Arıoğlu Akan, M.Ö.; Dhavale, D.G.; Sarkis, J. Greenhouse gas emissions in the construction industry: An analysis and evaluation of a concrete supply chain. J. Clean. Prod. 2017, 167, 1195–1207. [Google Scholar] [CrossRef]
- Wadel, G.; Avellaneda, J.; Cuchí, A. La sostenibilidad en la arquitectura industrializada: Cerrando el ciclo de los materiales. Inf. la Construcción 2010, 62, 37–51. [Google Scholar] [CrossRef] [Green Version]
- Wu, M.; Zhang, Y.; Ji, Y.; Liu, G.; Liu, C.; She, W.; Sun, W. Reducing environmental impacts and carbon emissions: Study of effects of superfine cement particles on blended cement containing high volume mineral admixtures. J. Clean. Prod. 2018, 196, 358–369. [Google Scholar] [CrossRef]
- Zhou, J.; Ren, D. A hybrid model of external environmental benefits compensation to practitioners for the application of prefabricated construction. Environ. Impact Assess. Rev. 2020, 81, 106358. [Google Scholar] [CrossRef]
- Borsato, M. Bridging the gap between product lifecycle management and sustainability in manufacturing through ontology building. Comput. Ind. 2014, 65, 258–269. [Google Scholar] [CrossRef]
- Pinna, C.; Galati, F.; Rossi, M.; Saidy, C.; Harik, R.; Terzi, S. Effect of product lifecycle management on new product development performances: Evidence from the food industry. Comput. Ind. 2018, 100, 184–195. [Google Scholar] [CrossRef]
- Braungart, M.; McDonough, W.; Bollinger, A. Cradle-to-cradle design: Creating healthy emissions—A strategy for eco-effective product and system design. J. Clean. Prod. 2007, 15, 1337–1348. [Google Scholar] [CrossRef]
- McDonough, W.; Braungart, M.; Anastas, P.T.; Zimmerman, J.B. Peer Reviewed: Applying the Principles of Green Engineering to Cradle-to-Cradle Design. Environ. Sci. Technol. 2003, 37, 434A–441A. [Google Scholar] [CrossRef] [Green Version]
- Mulhall, D.; Braungart, M.; Hansen, K. How to Plan a Big Beneficial Footprint. Guide to Innovation Tools for Cradle to Cradle®-Inspired Value in Building Developments; Erasmus University: Rotterdam, The Netherlands, 2013. [Google Scholar]
- Mulhall, D.; Braungart, M. Cradle to Cradle® criteria for the built environment. EKONOMIAZ 2010, 75, 182–193. [Google Scholar]
- Silvestre, J.D.; De Brito, J.; Pinheiro, M.D. Environmental impacts and benefits of the end-of-life of building materials - Calculation rules, results and contribution to a “cradle to cradle” life cycle. J. Clean. Prod. 2014, 66, 37–45. [Google Scholar] [CrossRef]
- Shadram, F.; Johansson, T.D.; Lu, W.; Schade, J.; Olofsson, T. An integrated BIM-based framework for minimizing embodied energy during building design. Energy Build. 2016, 128, 592–604. [Google Scholar] [CrossRef]
- Honic, M.; Kovacic, I.; Sibenik, G.; Rechberger, H. Data- and stakeholder management framework for the implementation of BIM-based Material Passports. J. Build. Eng. 2019, 23, 341–350. [Google Scholar] [CrossRef]
- Wei, Y.L.; Lin, C.Y.; Cheng, S.H.; Wang, H.P. Recycling steel-manufacturing slag and harbor sediment into construction materials. J. Hazard. Mater. 2014, 265, 253–260. [Google Scholar] [CrossRef] [PubMed]
- Nuñez-Cacho, P.; Górecki, J.; Molina-Moreno, V.; Corpas-Iglesias, F. What Gets Measured, Gets Done: Development of a Circular Economy Measurement Scale for Building Industry. Sustainability 2018, 10, 2340. [Google Scholar] [CrossRef] [Green Version]
- Núñez-Cacho, P.; Górecki, J.; Molina-Moreno, V.; Corpas-Iglesias, F.A. New Measures of Circular Economy Thinking In Construction Companies. J. EU Res. Bus. 2018, 2018. [Google Scholar] [CrossRef]
- Chan, A.P.C.; Chan, A.P.L. Key performance indicators for measuring construction success. Benchmarking 2004, 11, 203–221. [Google Scholar] [CrossRef]
- Cox, R.F.; Issa, R.R.A.; Ahrens, D. Management’s Perception of Key Performance Indicators for Construction. J. Constr. Eng. Manag. 2003, 129, 142–151. [Google Scholar] [CrossRef]
- Wu, H.Y. Constructing a strategy map for banking institutions with key performance indicators of the balanced scorecard. Eval. Program Plan. 2012, 35, 303–320. [Google Scholar] [CrossRef]
- Schalock, R.L.; Lee, T.; Verdugo, M.; Swart, K.; Claes, C.; van Loon, J.; Lee, C.-S. An evidence-based approach to organization evaluation and change in human service organizations evaluation and program planning. Eval. Program. Plan. 2014, 45, 110–118. [Google Scholar] [CrossRef]
- Perez-freije, J.; Enkel, E. Creative Tension in the Innovation Process:: How to Support the Right Capabilities. Eur. Manag. J. 2007, 25, 11–24. [Google Scholar] [CrossRef]
- Dvir, D.; Segev, E.; Shenhar, A. Technology’s varying impact on the success of strategic business units within the miles and snow typology. Strateg. Manag. J. 1993, 14, 155–161. [Google Scholar] [CrossRef]
- Maltz, A.C.; Shenhar, A.J.; Reilly, R.R. Beyond the Balanced Scorecard:: Refining the Search for Organizational Success Measures. Long Range Plan. 2003, 36, 187–204. [Google Scholar] [CrossRef]
- Castka, P.; Balzarova, M.A. The impact of ISO 9000 and ISO 14000 on standardisation of social responsibility—an inside perspective. Int. J. Prod. Econ. 2008, 113, 74–87. [Google Scholar] [CrossRef]
- Hoła, B. Identification and evaluation of processes in a construction enterprise. Arch. Civ. Mech. Eng. 2015, 15, 419–426. [Google Scholar] [CrossRef]
- Rivela, B.; Cuerda, I.; Olivieri, F.; Bedoya, C.; Neila, J. Life Cycle Assessment for ecodesign of ecological roof made with Intemper TF Ecological Water-Tank System. Mater. Constr. 2013, 63, 131–145. [Google Scholar] [CrossRef] [Green Version]
- Arnold, U.; Yildiz, Ö. Economic risk analysis of decentralized renewable energy infrastructures—A Monte Carlo Simulation approach. Renew. Energy 2015, 77, 227–239. [Google Scholar] [CrossRef]
- González Dan, J.R.; Guix, A.; Martí, V.; Arnaldos, J.; Darbra, R.M. Monte Carlo simulation as a tool to show the influence of the human factor into the quantitative risk assessment. Process Saf. Environ. Prot. 2016, 102, 441–449. [Google Scholar] [CrossRef]
- Olaru, M.; Şandru, M.; Pirnea, I.C. Monte Carlo Method Application for Environmental Risks Impact Assessment in Investment Projects. Procedia Soc. Behav. Sci. 2014, 109, 940–943. [Google Scholar] [CrossRef] [Green Version]
- ACS Group. ACS Informe Integrado 2016. Available online: https://www.grupoacs.com/informe-anual-2016/ (accessed on 1 May 2020).
- QlikTech. International Qlik. Available online: https://www.qlik.com (accessed on 1 May 2020).
- Leyh, C.; Rossetto, M.; Demez, M. Sustainability management and its software support in selected Italian enterprises. Comput. Ind. 2014, 65, 386–392. [Google Scholar] [CrossRef]
- Núñez-Cacho, P.; Molina-Moreno, V.; Corpas-Iglesias, F.A.; Cortés-García, F.J. Family Businesses Transitioning to a Circular Economy Model: The Case of “Mercadona”. Sustainability 2018, 10, 538. [Google Scholar] [CrossRef] [Green Version]
- Górecki, J. Circular Economy Maturity in Construction Companies. IOP Conf. Ser. Mater. Sci. Eng. 2018, 471, 1–8. [Google Scholar] [CrossRef]
- Górecki, J. Simulation-Based Positioning of Circular Economy Manager’s Skills in Construction Projects. Symmetry (Basel) 2020, 12, 25. [Google Scholar] [CrossRef] [Green Version]
© 2020 by the authors. Licensee MDPI, Basel, Switzerland. This article is an open access article distributed under the terms and conditions of the Creative Commons Attribution (CC BY) license (http://creativecommons.org/licenses/by/4.0/).


