3D Concrete Printing Sustainability: A Comparative Life Cycle Assessment of Four Construction Method Scenarios


Abstract
:1. Introduction
- Investigate the environmental tradeoff gained when utilizing 3DCP over conventional construction;
- Investigate the environmental impact of incorporating reinforced columns and beams within a 3D-printed structure versus their omission;
- Investigate the environmental impact of 3DCP when an alternative concrete mixture is adopted.
- Scenario 1 (S-1): Conventional construction method using concrete masonry block with reinforce concrete columns and beam.
- Scenario 2 (S-2): 3DCP construction method with reinforced concrete columns and beams.
- Scenario 3 (S-3): 3DCP construction method without reinforced concrete columns and beams.
- Scenario 4 (S-4): 3DCP construction method using an alternative concrete mixture and without reinforced concrete columns and beams.
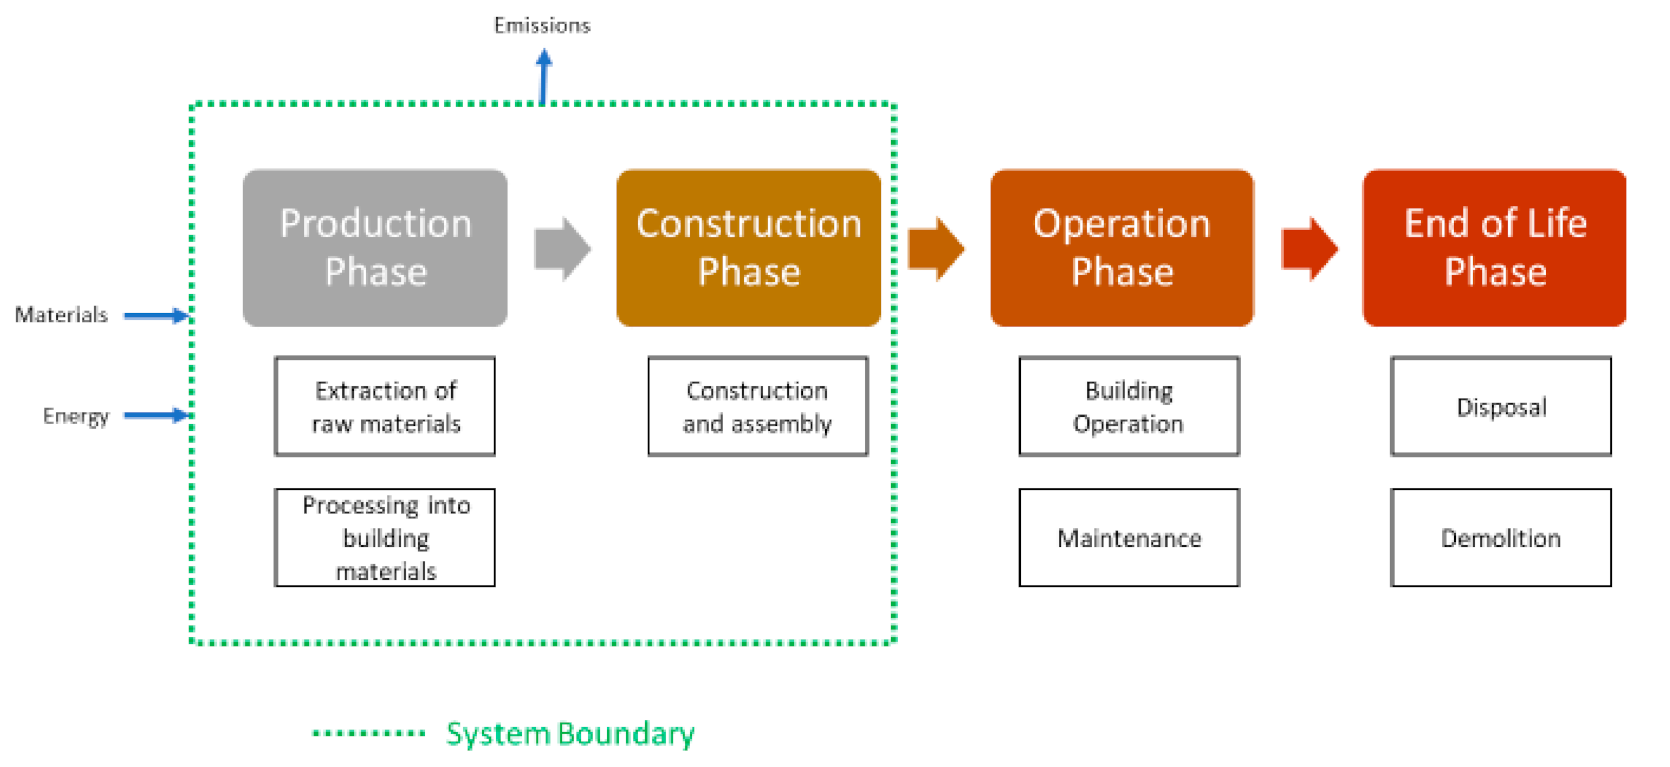
2. Materials and Methods
2.1. Goal and Scope
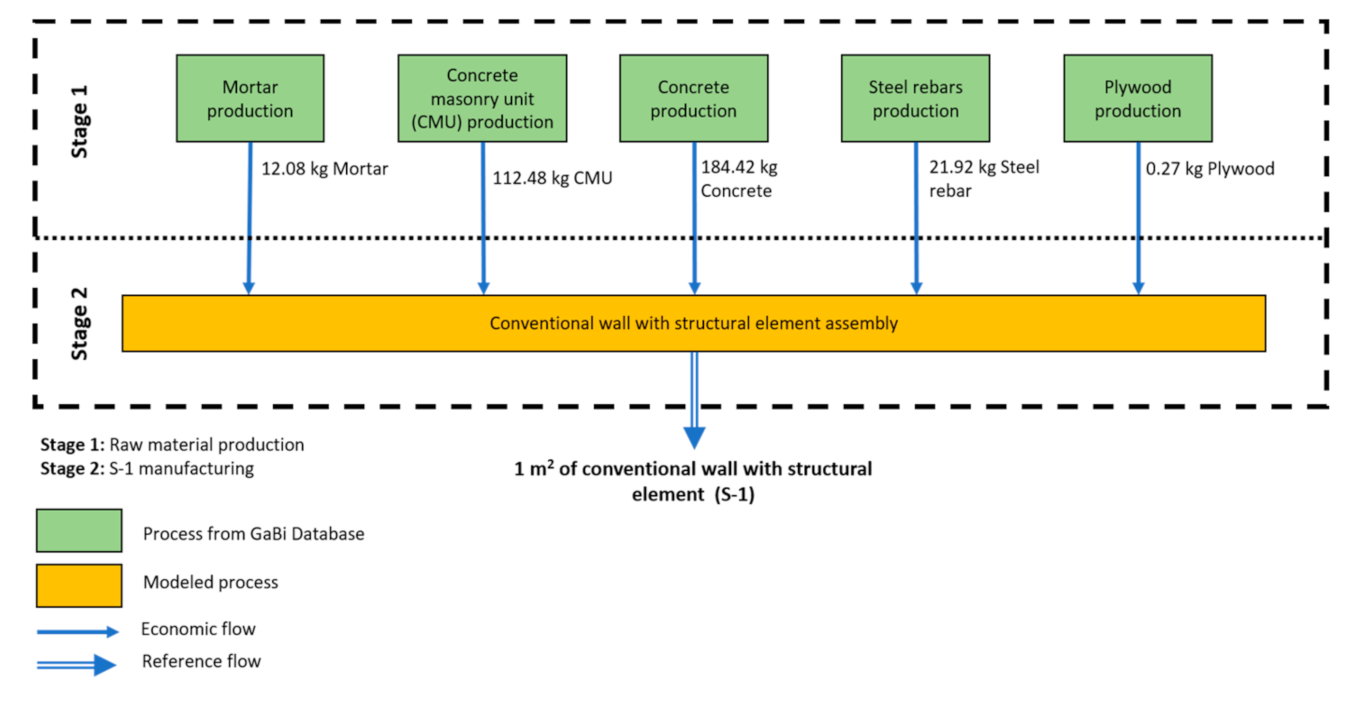
2.2. Material and Data Inventory
2.2.1. Scenario 1
2.2.2. Scenario 2
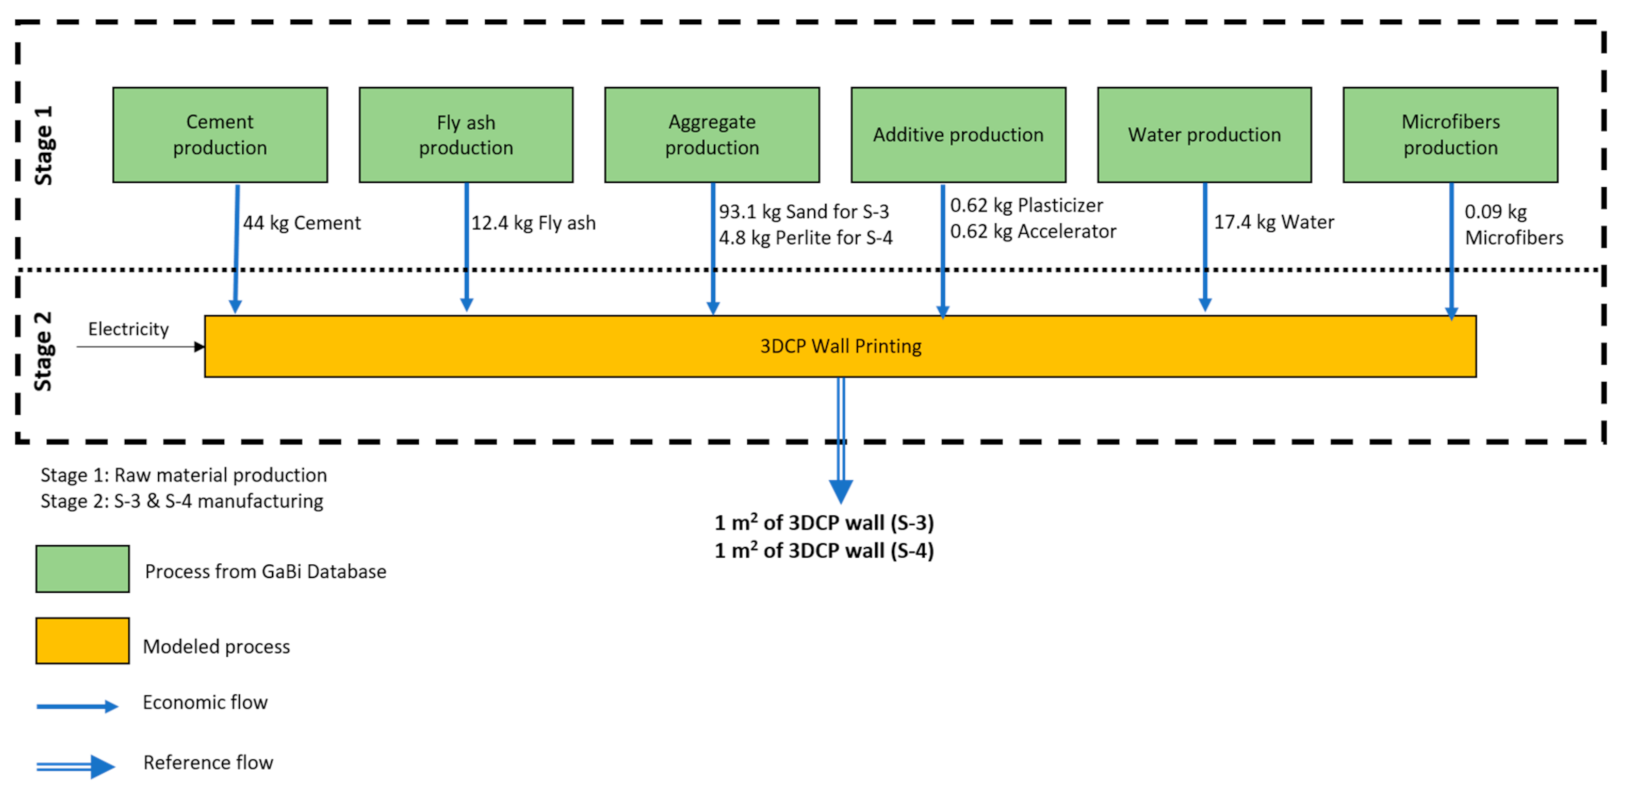
2.2.3. Scenario 3 and 4
2.2.4. Electricity Consumption for 3DCP Process
2.3. Life Cycle Impact Assessment (LCIA)
3. Results and Discussion
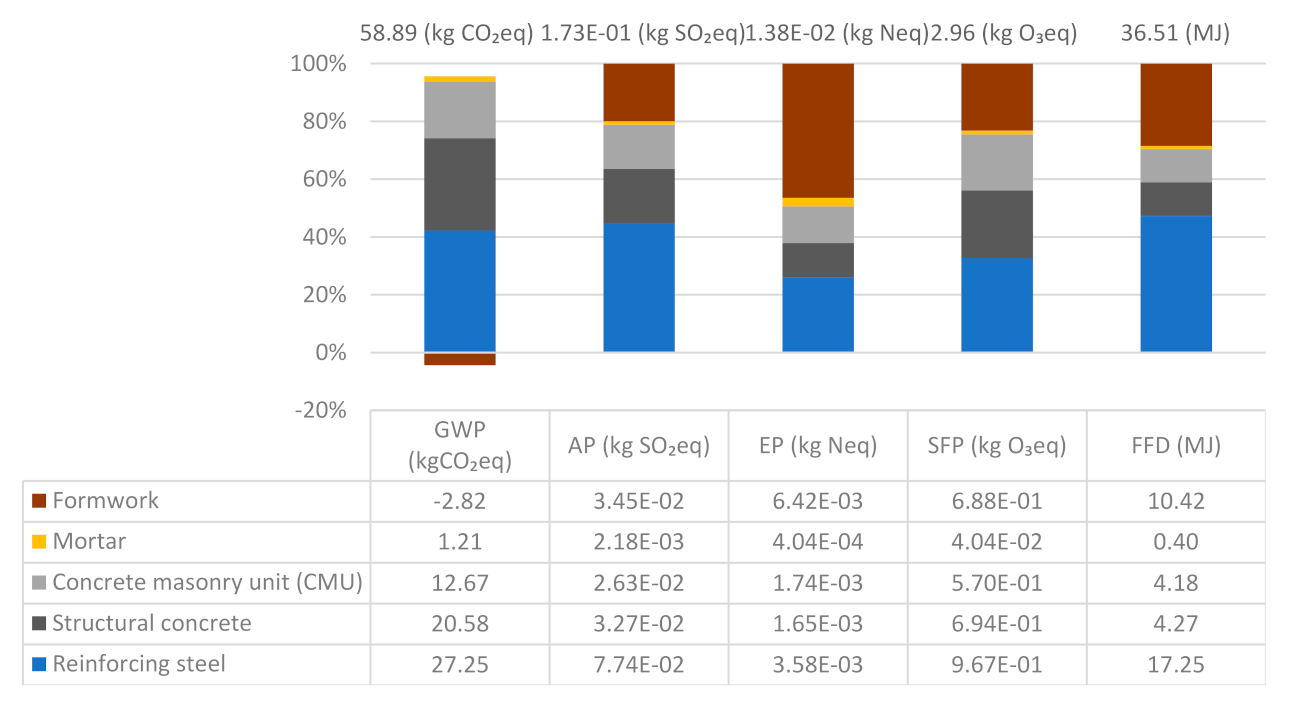
3.1. Environmental Impact of S-1
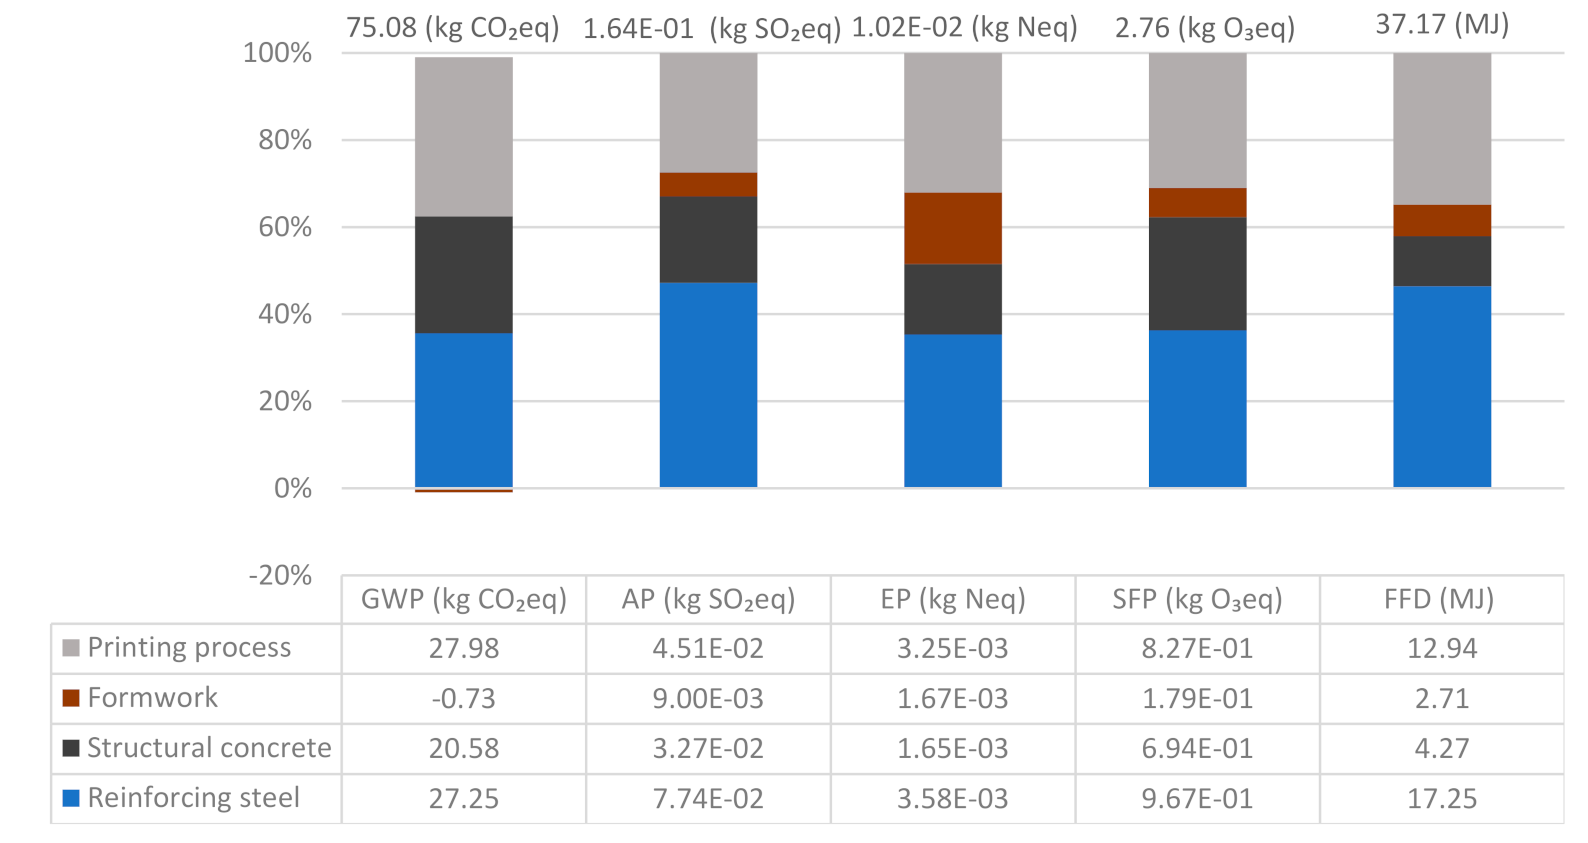
3.2. Environmental Impact of S-2
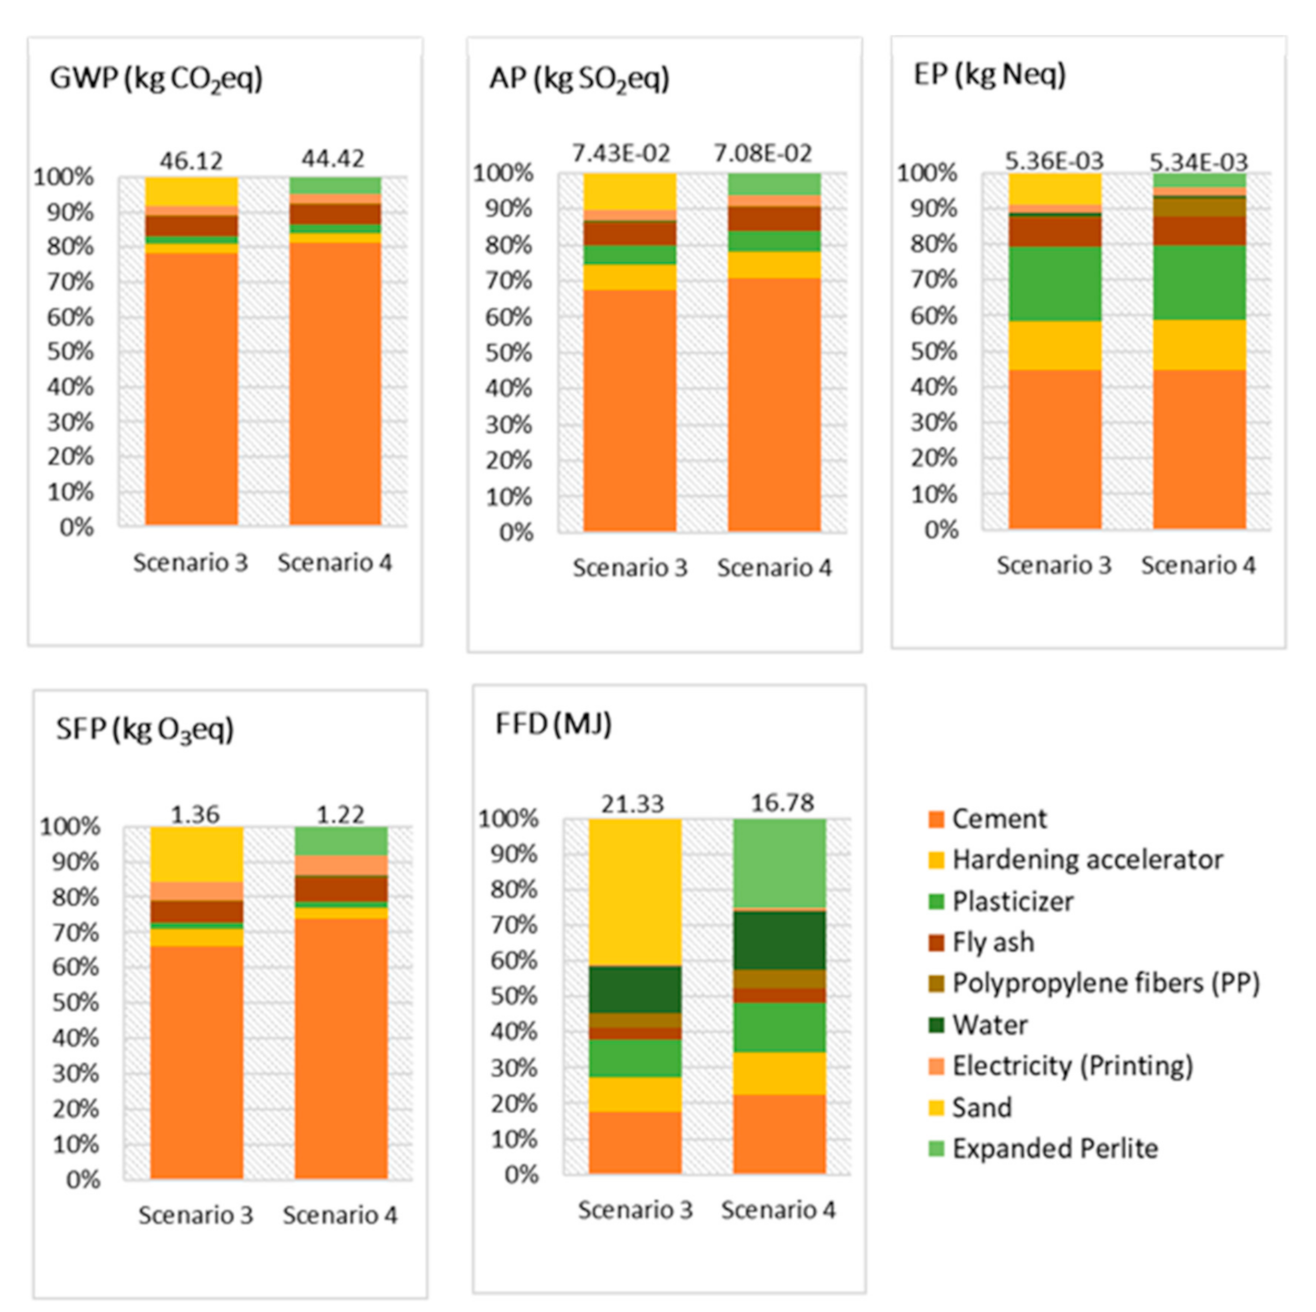
3.3. Environmental Impact of S-3 and S-4
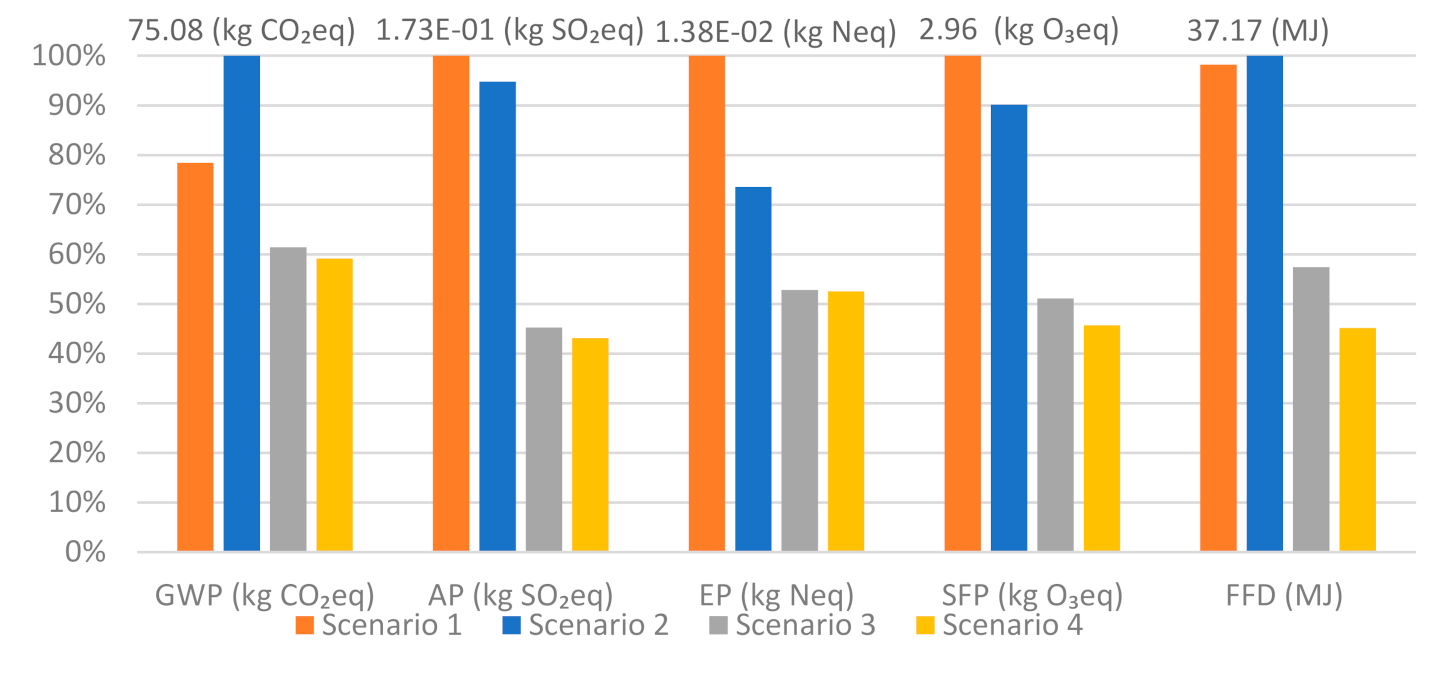
3.4. Overall Environmental Impact Comparison
4. Sensitivity Analysis
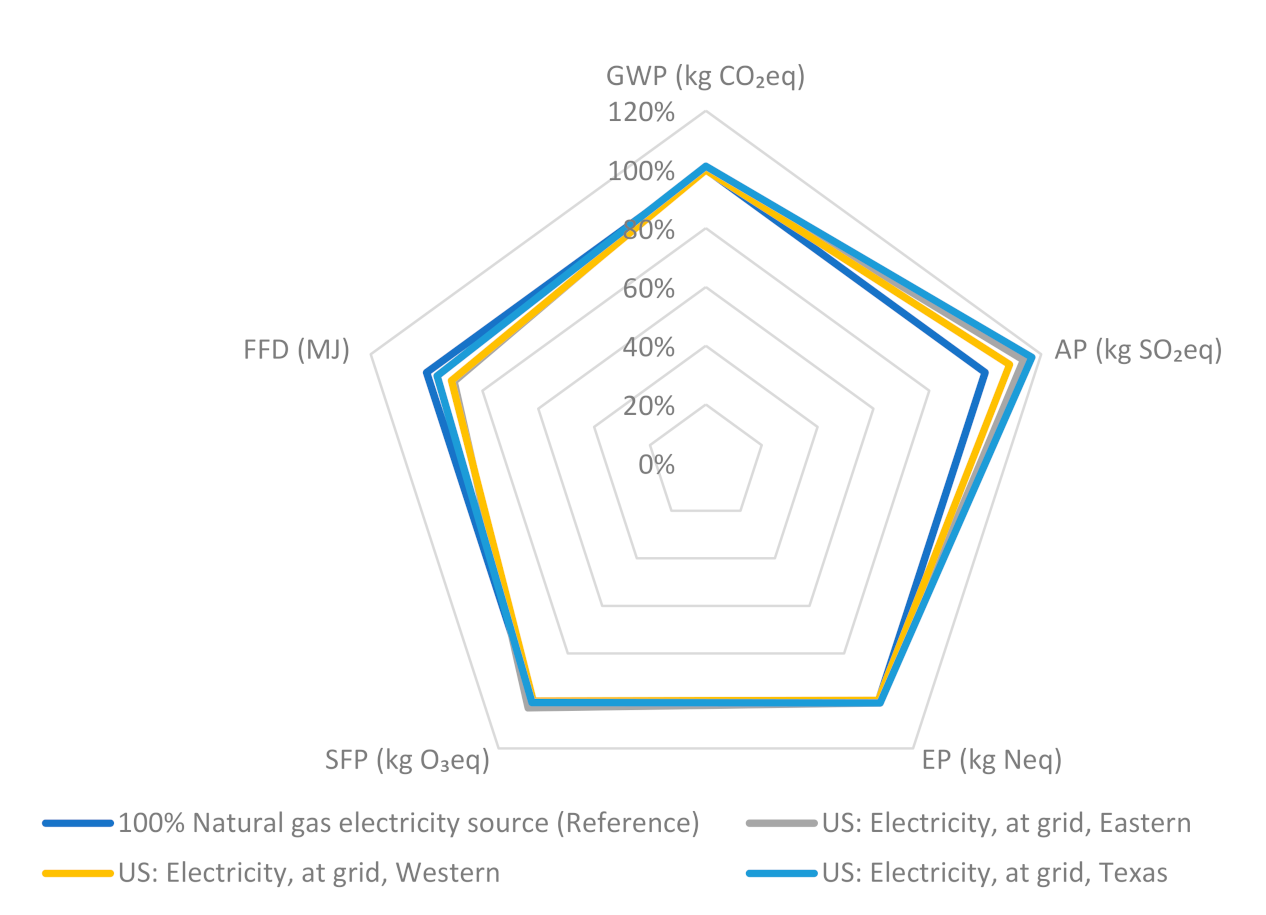
4.1. Energy Source
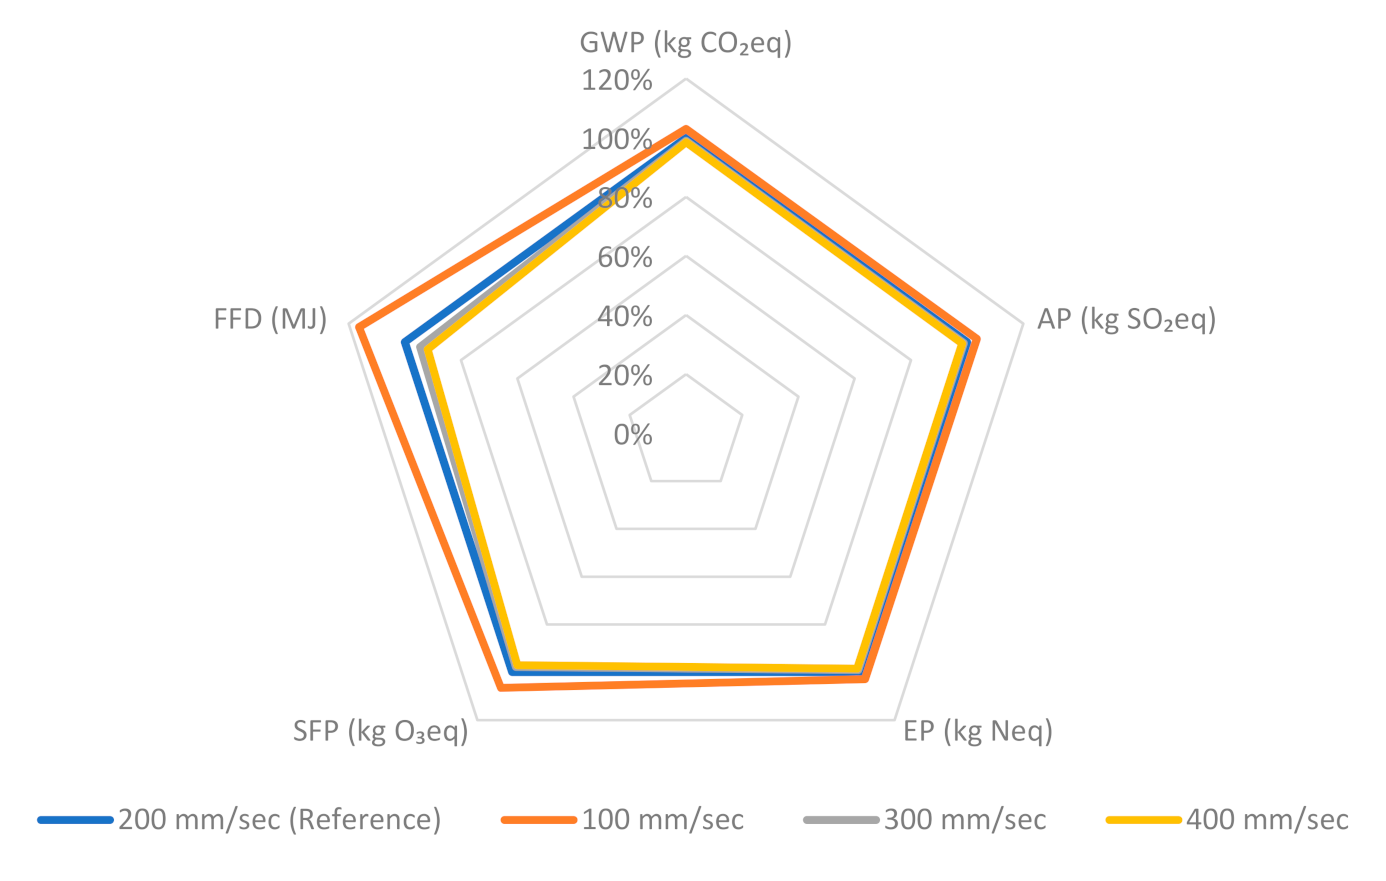
4.2. Printing Speed
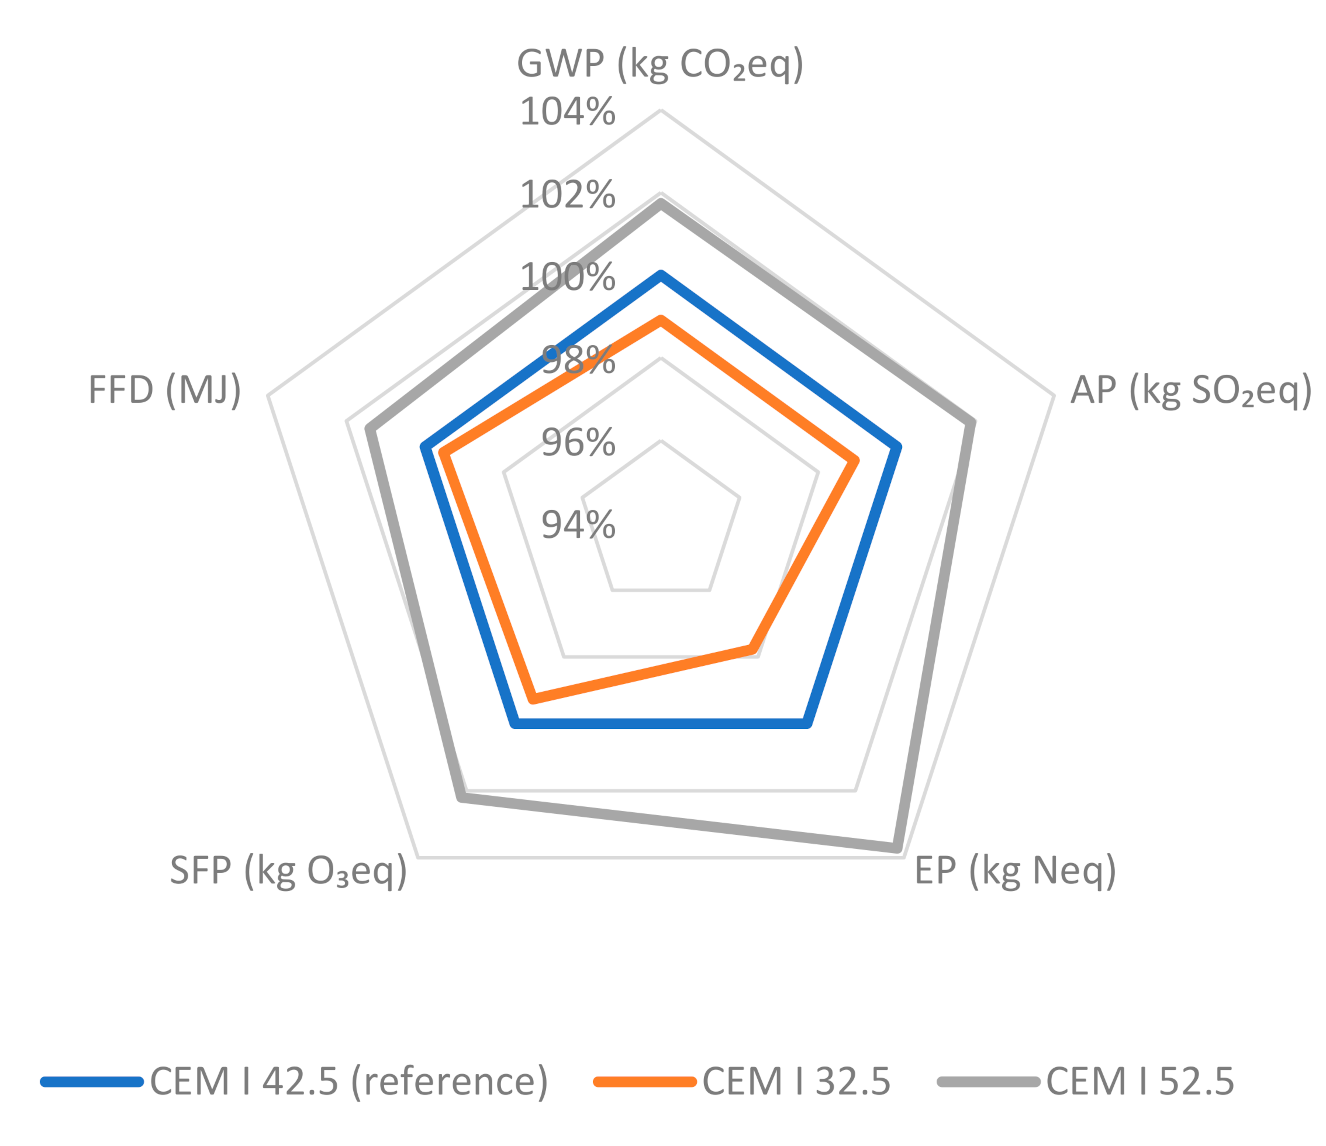
4.3. Cement Grade
5. Conclusions
Supplementary Materials
Author Contributions
Funding
Conflicts of Interest
References
- Agustí-Juan, I.; Habert, G. Environmental design guidelines for digital fabrication. J. Clean. Product. 2017, 142, 2780–2791. [Google Scholar] [CrossRef] [Green Version]
- Scrivener, K.L.; John, V.M.; Gartner, E.M. Eco-efficient cements: Potential economically viable solutions for a low-CO2 cement-based materials industry. Cem. Concr. Res. 2018, 114, 2–26. [Google Scholar] [CrossRef]
- Szabó, L.; Hidalgo, I.; Cisar, J.C.; Soria, A.; Russ, P. Report EUR Energy Consumption and CO2 Emissions from the World Cement Industry; European Commission Joint Research Centre: Brussels, Belgium, 2003; p. 20769. [Google Scholar]
- Andrew, R.M. Global CO2 emissions from cement production. Earth Syst. Sci. Data 2018, 10, 195–217. [Google Scholar] [CrossRef] [Green Version]
- Marzouk, M.; Azab, S. Environmental and economic impact assessment of construction and demolition waste disposal using system dynamics. Res. Conserv. Recycl. 2014, 82, 41–49. [Google Scholar] [CrossRef]
- Weng, Y.; Li, M.; Ruan, S.; Wong, T.N.; Tan, M.J.; Yeong, K.L.O.; Qian, S. Comparative economic, environmental and productivity assessment of a concrete bathroom unit fabricated through 3D printing and a precast approach. J. Clean. Product. 2020, 261, 121245. [Google Scholar] [CrossRef]
- Khoshnevis, B. Automated construction by contour crafting—Related robotics and information technologies. Autom. Construc. 2004, 13, 5–19. [Google Scholar] [CrossRef]
- Khoshnevis, B.; Hwang, D.; Yao, K.-T.; Yeh, Z. Mega-scale fabrication by contour crafting. Int. J. Ind. Syst. Eng. 2006, 1, 301–320. [Google Scholar] [CrossRef] [Green Version]
- International Organization for Standardization. Environmental Management: Life Cycle Assessment; Principles and Framework; ISO: Geneva, Switzerland, 2006. [Google Scholar]
- Junnila, S.; Horvath, A.; Guggemos, A.A. Life-cycle assessment of office buildings in Europe and the United States. J. Infrastruct. Syst. 2006, 12, 10–17. [Google Scholar] [CrossRef]
- Bahramian, M.; Yetilmezsoy, K. Life cycle assessment of the building industry: An overview of two decades of research (1995–2018). Energy Build. 2020, 219, 109917. [Google Scholar] [CrossRef]
- Nwodo, M.N.; Anumba, C.J. A review of life cycle assessment of buildings using a systematic approach. Build. Environ. 2019, 162, 106290. [Google Scholar] [CrossRef]
- Saade, M.R.M.; Guest, G.; Amor, B. Comparative whole building LCAs: How far are our expectations from the documented evidence? Build. Environ. 2020, 167, 106449. [Google Scholar] [CrossRef]
- Häfliger, I.-F.; John, V.; Passer, A.; Lasvaux, S.; Hoxha, E.; Ruschi, M.; Saade, M.; Habert, G. Buildings environmental impacts’ sensitivity related to LCA modelling choices of construction materials. J. Clean. Product. 2017, 156, 805–816. [Google Scholar] [CrossRef] [Green Version]
- Agustí-Juan, I.; Habert, G. An Environmental Perspective on Digital Fabrication in Architecture and Construction. In Proceedings of the 21st International Conference on Computer-Aided Architectural Design Research in Asia CAADRIA, Melbourne, FL, USA, 30 March–2 April 2016; pp. 797–806. [Google Scholar]
- Asprone, D.; Auricchio, F.; Menna, C.; Mercuri, V. 3D printing of reinforced concrete elements: Technology and design approach. Construct. Build. Mater. 2018, 165, 218–231. [Google Scholar] [CrossRef]
- Camacho, D.D.; Clayton, P.; O’Brien, W.J.; Seepersad, C.; Juengar, M.; Ferron, R.; Salamone, S. Applications of additive manufacturing in the construction industry–A forward-looking review. Automat. Construct. 2018, 89, 110–119. [Google Scholar] [CrossRef]
- Ghaffar, S.H.; Corker, J.; Fan, M. Additive manufacturing technology and its implementation in construction as an eco-innovative solution. Automat. Construct. 2018, 93, 1–11. [Google Scholar] [CrossRef]
- Kreiger, M.; Pearce, J.M. Environmental life cycle analysis of distributed three-dimensional printing and conventional manufacturing of polymer products. ACS Sustain. Chem. Eng. 2013, 1, 1511–1519. [Google Scholar] [CrossRef]
- Kohtala, C.; Hyysalo, S. Anticipated environmental sustainability of personal fabrication. J. Clean. Product. 2015, 99, 333–344. [Google Scholar] [CrossRef] [Green Version]
- Faludi, J.; Bayley, C.; Bhogal, S.; Iribarne, M. Comparing environmental impacts of additive manufacturing vs traditional machining via life-cycle assessment. Rapid Prototyp. J. 2015, 21, 14–33. [Google Scholar] [CrossRef] [Green Version]
- Cerdas, F.; Juraschek, M.; Thiede, S.; Herrmann, C. Life cycle assessment of 3D printed products in a distributed manufacturing system. J. Ind. Ecol. 2017, 21, S80–S93. [Google Scholar] [CrossRef]
- Yao, Y.; Hu, M.; Di Maio, F.; Cucurachi, S. Life cycle assessment of 3D printing geo-polymer concrete: An ex-ante study. J. Ind. Ecol. 2020, 24, 116–127. [Google Scholar] [CrossRef] [Green Version]
- Alhumayani, H.; Gomaa, M.; Soebarto, V.; Jabi, W. Environmental assessment of large-scale 3D printing in construction: A comparative study between cob and concrete. J. Clean. Product. 2020, 270, 122463. [Google Scholar] [CrossRef]
- Long, W.-J.; Tao, J.L.; Lin, C.; Gu, Y.; Duan, H.B. Rheology and buildability of sustainable cement-based composites containing micro-crystalline cellulose for 3D-printing. J. Clean. Product. 2019, 239, 118054. [Google Scholar] [CrossRef]
- Chen, D.; Heyer, S.; Ibbotson, S.; Salonitis, K. Direct digital manufacturing: Definition, evolution, and sustainability implications. J. Clean. Product. 2015, 107, 615–625. [Google Scholar] [CrossRef]
- Gebler, M.; Schoot Uiterkamp, A.J.M.; Visser, C. A global sustainability perspective on 3D printing technologies. Energy Policy 2014, 74, 158–167. [Google Scholar] [CrossRef]
- Liu, Y.; van Nederveen, S.; Hertogh, M. Understanding effects of BIM on collaborative design and construction: An. empirical study in China. Int. J. Proj. Manag. 2017, 35, 686–698. [Google Scholar] [CrossRef]
- de Soto, B.G.; Agustí-Juan, I.; Hunhevicz, J.; Joss, S.; Graser, K.; Habert, G.; Adey, B.T. Productivity of digital fabrication in construction: Cost and time analysis of a robotically built wall. Automat. Construct. 2018, 92, 297–311. [Google Scholar] [CrossRef]
- Tukker, A. Life cycle assessment as a tool in environmental impact assessment. Environ. Impact Assessm. Rev. 2000, 20, 435–456. [Google Scholar] [CrossRef]
- Morgan, R.K. Environmental Impact Assessment: The State of the Art. Impact Assem. Proj. Appr. 2012, 30, 5–14. [Google Scholar] [CrossRef]
- Mohammad, M.; Masad, E.; Seers, T.; Al-Ghamdi, S.G. High-Performance Light-Weight Concrete for 3D Printing. In Second RILEM International Conference on Concrete and Digital Fabrication; Springer: Cham, Switzerland, 2020; Volume 28, pp. 459–467. [Google Scholar] [CrossRef]
- Berge, B.; Butters, C.; Henley, F. The Ecology of Building Materials, Chapter 6: Minerals, 2nd ed.; Berge, B., Butters, C., Henley, T., Eds.; Taylor and Francis: Oxfordshire, UK, 2009. [Google Scholar]
- Demirboğa, R.; Gül, R. The effects of expanded perlite aggregate, silica fume and fly ash on the thermal conductivity of lightweight concrete. Cem. Concr. Res. 2003, 33, 723–727. [Google Scholar] [CrossRef]
- Kramar, D.; Bindiganavile, V. Impact response of lightweight mortars containing expanded perlite. Cem. Concr. Compos. 2013, 37, 205–214. [Google Scholar] [CrossRef]
- Lanzón, M.; García-Ruiz, P. Lightweight cement mortars: Advantages and inconveniences of expanded perlite and its influence on fresh and hardened state and durability. Constr. Build. Mater. 2008, 22, 1798–1806. [Google Scholar] [CrossRef]
- Mohammad, M.; Masad, E.; Seers, T.; Al-Ghamadi, S.G. Properties and microstructure distribution of high-performance thermal insulation concrete. Materials 2020, 13, 2091. [Google Scholar] [CrossRef] [PubMed]
- Agustí-Juan, I.; Hollberg, A.; Habert, G. Early-Design Integration of Environmental Criteria for Digital Fabrication. In Life Cycle Analysis and Assessment in Civil Engineering: Towards an Integrated Vision, Proceedings of the Sixth International Symposium on Life-Cycle Civil Engineering (IALCCE 2018), Ghent, Belgium, 28–31 October 2018; CRC Press: Boca Raton, FL, USA.
- Bare, J.C. Tool for the Reduction and Assessment of Chemical and Other Environmental Impacts (TRACI), Version 2.1-User’s Manual; US EPA Office of Research and Development: Washington, DC, USA, 2012. [Google Scholar]
- Rajagopalan, N.; Bilec, M.M.; Landis, A.E. Residential life cycle assessment modeling: Comparative case study of insulating concrete forms and traditional building materials. J. Green Build. 2010, 5, 95–106. [Google Scholar] [CrossRef]
- Phillips, R.; Troup, L.; Fannon, D.; Eckelman, M.J. Triple bottom line sustainability assessment of window-to-wall ratio in US office buildings. Build. Environ. 2020, 182, 107057. [Google Scholar] [CrossRef]
- Ben-Alon, L.; Loftness, V.; Harries, K.A.; DiPetro, G.; Hameen, E.C. Cradle to site life cycle assessment (LCA) of natural vs conventional building materials: A case study on cob earthen material. Build. Environ. 2019, 160, 106150. [Google Scholar] [CrossRef]
- Gardner, H.; Garcia, J.; Hasik, V.; Olinzock, M.; Banawi, A.; Bilec, M.M. Materials life cycle assessment of a living building. Procedia Cirp 2019, 80, 458–463. [Google Scholar] [CrossRef]
- Alcorn, J.A. Global Sustainability and the New Zealand House. Ph.D. Thesis, Victoria University of Wellington, Wellington, New Zealand, 2010. [Google Scholar]
- Densley Tingley, D.; Hathway, A.; Davison, B. An environmental impact comparison of external wall insulation types. Build. Environ. 2015, 85, 182–189. [Google Scholar] [CrossRef]
- Chen, C.; Habert, G.; Bouzidi, Y.; Jullien, A. Environmental impact of cement production: Detail of the different processes and cement plant variability evaluation. J. Clean. Product. 2010, 18, 478–485. [Google Scholar] [CrossRef]
- Lindemann, H.; Gerbers, R.; Ibrahim, S.; Dietrich, F.; Herrmann, E.; Dröder, K.; Raatz, A.; Kloft, H. Development of a Shotcrete 3D-Printing (SC3DP) Technology for Additive Manufacturing of Reinforced Freeform Concrete Structures. In First RILEM International Conference on Concrete and Digital Fabrication—Digital Concrete 2018; Springer: Cham, Switzerland, 2018; Volume 19, pp. 287–298. [Google Scholar] [CrossRef]
- Lloret, E.; Shahab, A.R.; Linus, M.; Flatt, R.J.; Gramazio, F.; Kohler, M.; Langenberg, S. Complex concrete structures: Merging existing casting techniques with digital fabrication. Comput. Aided Des. 2015, 60, 40–49. [Google Scholar] [CrossRef]


| S-1 | S-2 | S-3 | S-4 | |
|---|---|---|---|---|
| Description | Conventional construction method | 3DCP method with reinforced concrete structural system | 3DCP method without reinforced concrete structural system using high-performance concrete | 3DCP method without reinforced concrete structural system using lightweight concrete |
| Columns and beam | 2 columns 60 × 20 cm and beam 40 × 20 cm | 2 columns 60 × 20 cm and beam 40 × 20 cm | N/A | N/A |
| Material | Concrete Steel reinforcement Formwork CMU Mortar | Concrete Steel reinforcement Formwork 3DCP high-performance concrete | 3DCP high-performance concrete | 3DCP lightweight concrete |
| Material | Quantity | |||
|---|---|---|---|---|
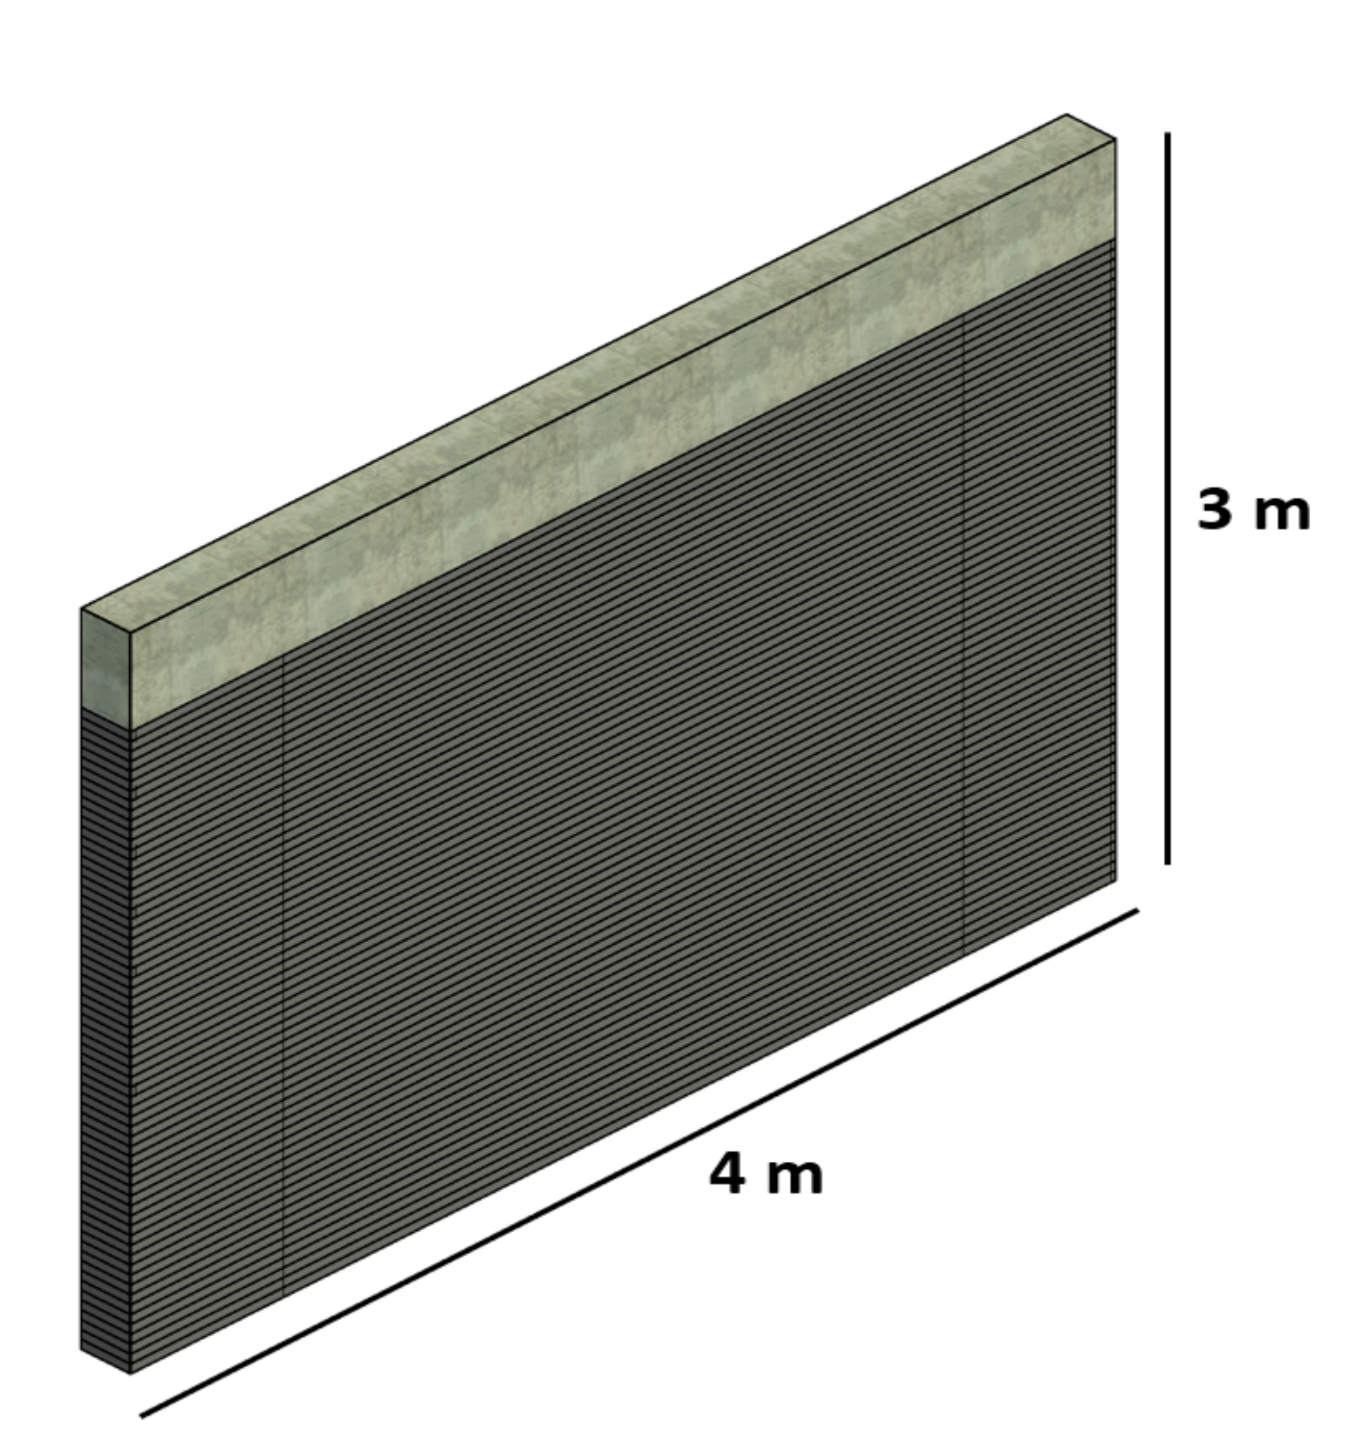
| Representative of 12 m2 Wall | Representative of 1 m2 Wall | |||
| S-1 | S-2 | S-1 | S-2 | |
| Structural Concrete (kg) | 2213.00 | 2213.00 | 184.42 | 184.42 |
| Steel Rebar (kg) | 263.00 | 263.00 | 21.92 | 21.92 |
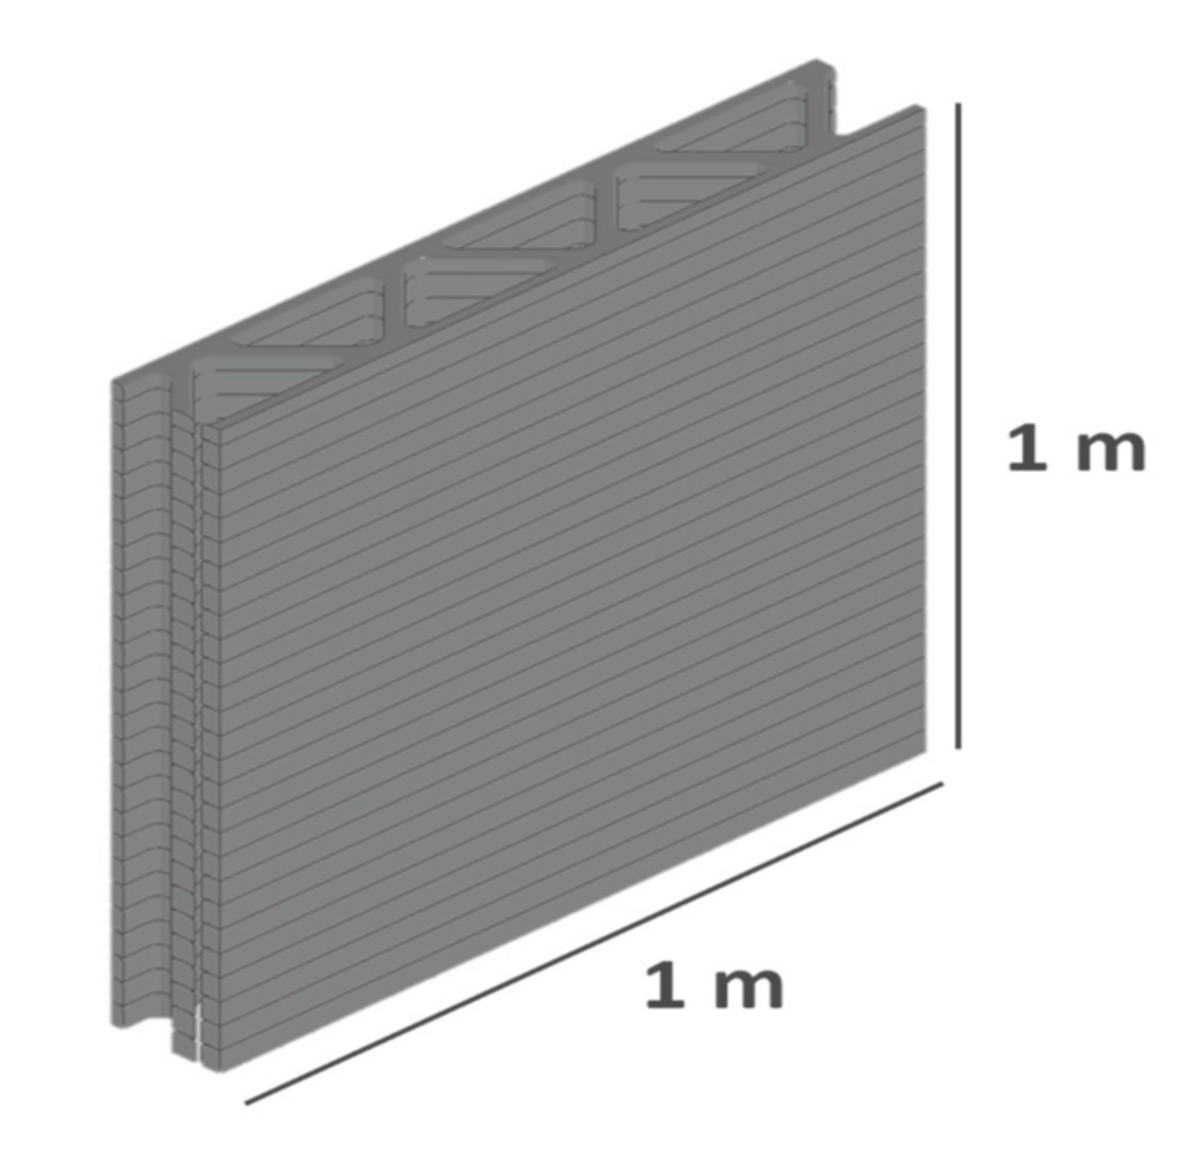
| Concrete Masonry Unit (kg) | 1349.70 | - | 112.48 | - |
| Mortar (kg) | 145.00 | - | 12.08 | - |
| Plywood (kg) | 126.00 | 3.20 | 10.50 | 0.27 |
| 3DCP Concrete (m3) | - | 0.70 | - | 0.06 |
| Material | Mix-1 | Mix-2 |
|---|---|---|
| Cement (kg/m3) | 579 | 579 |
| Fly ash (kg/m3) | 165 | 165 |
| Microsilica (kg/m3) | 83 | 83 |
| Sand (kg/m3) | 1241 | 0 |
| Perlite (kg/m3) | 0 | 63.9 |
| Water (kg/m3) | 232 | 232 |
| Microfiber (kg/m3) | 1.2 | 1.2 |
| Super-Plasticizer (kg/m3) | 8.27 | 8.27 |
| Accelerator (kg/m3) | 8.27 | 8.27 |
| Equipment | Power Requirement (kW) | Electricity Consumption (kWh) |
|---|---|---|
| Mixer and pump | 7.38 | 1.55 |
| Robotic arm | 3.40 | 0.71 |
| Total | 2.26 |
| Environmental Impact Categories | Description | Unit of Measurement |
|---|---|---|
| Global Warming Potential (GWP) | A measure of GHG emissions leading to the Earth’s greenhouse effects | |
| Acidification Potential (AP) | A measure of emissions that creates an acidic effect in the environment. Unit of measurement | |
| Eutrophication Potential (EP) | Measures the impacts of high levels of macronutrients (mainly nitrogen (N) and phosphorus (P)) in the environment | |
| Smog Formation Potential (SFP) | A measure of ground-level ozone produced by chemical reactions between volatile organic compounds and nitrogen oxides in sunlight | |
| Fossil Fuel Depletion (FFD) | A measure of the total amount of primary energy extracted from the earth (energy demand from both non-renewable and renewable resources) | MJ |
| Material | GWP (kg CO₂eq) | AP (kg SO₂eq) | EP (kg Neq) | SFP (kg O₃eq) | FFD (MJ) |
|---|---|---|---|---|---|
| Cement | 36.00 | 5.01E-02 | 2.39E-03 | 9.01E-01 | 3.77 |
| Hardening Accelerator | 1.26 | 5.21E-03 | 7.36E-04 | 6.71E-02 | 1.99 |
| Plasticizer | 1.14 | 4.01E-03 | 1.12E-03 | 2.22E-02 | 2.32 |
| Fly Ash | 2.49 | 4.60E-03 | 4.39E-04 | 8.02E-02 | 0.68 |
| Polypropylene Fibers | 0.20 | 3.15E-04 | 2.68E-05 | 4.96E-03 | 0.89 |
| Water | 0.08 | 1.86E-04 | 4.58E-05 | 3.30E-03 | 2.80 |
| Electricity | 1.08 | 2.06E-03 | 1.23E-04 | 6.93E-02 | 0.08 |
| Sand | 3.87 | 7.79E-03 | 4.84E-04 | 2.15E-01 | 8.80 |
| Total | 46.12 | 7.43E-02 | 5.36E-03 | 1.36E+00 | 21.33 |
| Material | GWP (kg CO₂eq) | AP (kg SO₂eq) | EP (kg Neq) | SFP (kg O₃eq) | FFD (MJ) |
|---|---|---|---|---|---|
| Cement | 36.00 | 5.01E-02 | 2.39E-03 | 9.01E-01 | 3.77 |
| Hardening Accelerator | 1.26 | 5.21E-03 | 7.36E-04 | 3.71E-02 | 1.99 |
| Plasticizer | 1.14 | 4.01E-03 | 1.12E-03 | 2.22E-02 | 2.32 |
| Fly Ash | 2.48 | 4.59E-03 | 4.38E-04 | 8.00E-02 | 0.68 |
| Polypropylene Fibers | 0.20 | 3.15E-04 | 2.68E-04 | 4.96E-03 | 0.89 |
| Water | 0.08 | 1.86E-04 | 4.58E-05 | 3.30E-03 | 2.80 |
| Electricity | 1.08 | 2.06E-03 | 1.23E-04 | 6.93E-02 | 0.08 |
| Expanded Perlite | 2.18 | 4.35E-03 | 2.17E-04 | 1.01E-01 | 4.25 |
| Total | 44.42 | 7.08E-02 | 5.34E-03 | 1.22E+00 | 16.78 |
| Scenario | GWP (kg CO₂eq) | AP (kg SO₂eq) | EP (kg Neq) | SFP (kg O₃eq) | FFD (MJ) |
|---|---|---|---|---|---|
| Scenario 1 | 58.89 | 1.73E-01 | 1.38E-02 | 2.96 | 36.51 |
| Scenario 2 | 75.08 | 1.64E-01 | 1.02E-02 | 2.67 | 37.17 |
| Scenario 3 | 46.12 | 7.43E-02 | 5.36E-03 | 1.36 | 21.33 |
| Scenario 4 | 44.42 | 7.08E-02 | 5.34E-03 | 1.22 | 16.78 |
| Impact Assessment | 100% Natural Gas (Reference) | US: Electricity, at Grid, Eastern | US: Electricity, at Grid, Western | US: Electricity, at Grid, Texas, US |
|---|---|---|---|---|
| GWP (kg CO2eq.) | 46.1 | 46.4 | 46.0 | 46.6 |
| AP (kg SO2eq.) | 7.43E-02 | 8.45E-02 | 8.08E-02 | 8.67E-02 |
| EP (kg Neq.) | 5.37E-03 | 5.42E-03 | 5.36E-03 | 5.42E-03 |
| SFP (kg O3eq.) | 1.36 | 1.40 | 1.36 | 1.37 |
| FFD (MJ) | 21.3 | 19.2 | 19.4 | 20.5 |
| Impact Assessment | 100 mm/s | 200 mm/s (Reference) | 300 mm/s | 400 mm/s |
|---|---|---|---|---|
| GWP (kg CO2eq.) | 47.8 | 46.4 | 45.9 | 45.7 |
| AP (kg SO2eq.) | 7.75E-02 | 7.49E-02 | 7.4E-02 | 7.36E-02 |
| EP (kg Neq.) | 5.56E-03 | 5.40E-03 | 5.35E-03 | 5.32E-03 |
| SFP (kg O3eq.) | 1.47 | 1.38 | 1.35 | 1.34 |
| FFD (MJ) | 25.7 | 22.1 | 20.9 | 20.3 |
| Impact Assessment | CEM I 42.5 (Reference) | CEM I 32.5 | CEM I 52.5 |
|---|---|---|---|
| GWP (kg CO2eq.) | 46.1 | 45.6 | 46.9 |
| AP (kg SO2eq.) | 7.43E-02 | 7.35E-02 | 7.57E-02 |
| EP (kg Neq.) | 5.37E-03 | 5.25E-03 | 5.57E-03 |
| SFP (kg O3eq.) | 1.36 | 1.35 | 1.39 |
| FFD (MJ) | 21.3 | 21.2 | 21.6 |
Publisher’s Note: MDPI stays neutral with regard to jurisdictional claims in published maps and institutional affiliations. |
© 2020 by the authors. Licensee MDPI, Basel, Switzerland. This article is an open access article distributed under the terms and conditions of the Creative Commons Attribution (CC BY) license (http://creativecommons.org/licenses/by/4.0/).
Share and Cite
Mohammad, M.; Masad, E.; Al-Ghamdi, S.G. 3D Concrete Printing Sustainability: A Comparative Life Cycle Assessment of Four Construction Method Scenarios. Buildings 2020, 10, 245. https://doi.org/10.3390/buildings10120245
Mohammad M, Masad E, Al-Ghamdi SG. 3D Concrete Printing Sustainability: A Comparative Life Cycle Assessment of Four Construction Method Scenarios. Buildings. 2020; 10(12):245. https://doi.org/10.3390/buildings10120245
Chicago/Turabian StyleMohammad, Malek, Eyad Masad, and Sami G. Al-Ghamdi. 2020. "3D Concrete Printing Sustainability: A Comparative Life Cycle Assessment of Four Construction Method Scenarios" Buildings 10, no. 12: 245. https://doi.org/10.3390/buildings10120245