1. Introduction
In urban areas, especially in the metropolises, the number of underground constructions is increasing steadily [
1]. In fact, due to the high density of construction and in order to relieve traffic congestion, it is necessary to use the subsoil for the construction of motorways, railways, and subway tunnels [
2].
Nowadays, to assess the impact of these construction operations on adjacent buildings is increasingly important for designers, especially for tunneling works. In fact, all construction activities involve risks that the designers must assess necessarily. In the preliminary design stage, designers usually do not inspect buildings adjacent to construction sites because these activities are often too expensive.
Vibrating [
3], noises, excavations [
4], and demolitions are the main causes of damages to buildings adjacent to construction sites. Detecting damage caused by construction works is not an easy task. In fact, in order to establish whether structural or architectural damage is pre-existing or caused by construction works, technicians should carry out visual inspections before, during, and after construction activities. For this reason, all existing buildings and infrastructure within the influence zone should be inspected to record their current state before construction works begin [
5].
Visual inspections are not an easy task for technicians because a lot of data has to be collected and recorded.
The data collected must necessarily be recorded into a database for analysis and evaluation. A “traditional” data collection consists of a data entry in a structured way on forms and the capture of images through a camera. The forms can be compiled on paper or typewritten using a device. The difference with the “modern” data collection is that the operations of data entry in a database are carried out in a subsequent operation. Summarizing, two phases can be identified:
- (1)
The collection of data in a format (paper or digital) in a structured way according a model;
- (2)
The entry and recording of the data collected in a database.
The second phase often involves transcription errors and significant processing times. To overcome this problem, we can use automated systems to collect data and enter it into a database. Nowadays, technicians use IT tools to collect data because laptops, smartphones, or tablets have the potential to reduce the logistical load, costs, and error rate of paper-based data collection methods [
6]. These instruments are personal devices equipped with several sensors that have a GPS system and are connected to the Internet. They are the best platform for data collection and sharing. The constant presence of these devices and their data collection capacity make them perfect tools for civil, environmental, and seismic engineering studies.
Mobile data collection usually requires experienced users with knowledge of existing data and their data models [
7]. However, the complexity of operations is reduced with the support of well-structured data collection applications, so even non-expert users can collect data. Data collection is an important stage in any field of research. Mobile applications with form-based surveys are increasingly used to support this, thanks to the large number of mobile devices and their growing number of built-in sensors [
8].
In the literature, there are many studies on mobile data collection. For example, Hartung et al. (2010) [
9] developed Open Data Kit (ODK) software to collect data in situ. It is an extensible, open-source tool that can be used in a variant of mobile operation systems given the support of a lot of communication protocols to export and import data.
Dos Santos et al. [
10] described the Maritaca Project, which is a web-based environment to create different mobile applications to collect data in the field based on questionnaires. The user created customizable online questionnaires, and it automatically generated an application for it. It allows data collection from a wide range of data types such as sounds, videos, GPS localization, text, and images. The Maritaca Project has a client–server architecture to send and receive data from the mobile application using web-services.
Arcidiacono and Cimellaro [
11] proposed D.A.S.—Damage Assessment, an Android application for smartphones that acquires citizens’ requests and assesses the damage state of buildings, providing efficient real-time information for the evaluation of emergency plans required after a natural disaster.
Han et al. [
12] proposed the E-Explorer application for iOS platform. It is an emergency communication and quick seismic damage investigation method based on smartphones. E-Explorer integrates questionnaire and picture collection functions for damage phenomenon recording and image acquisition, following an intensity evaluation method according to the seismic index.
Table 1 shows a comparison between some mobile data collection tools and STATUS. Few systems are able to operate offline, and in general, they are designed to collect few data. STATUS is able to collect a lot of data and is the only system analyzed that generates and exports a report of data collected offline directly from the device. STATUS creates reports on the state of the inspected properties that are printed and signed on site.
This paper shows the STATUS app, which is an Android mobile data collection for tablets developed by Geofunction srls. The system assists technicians with visual inspections and the recording of pre-existing architectural and/or structural damages in buildings adjacent to construction sites before the beginning of activities in real time.
The aim of the research is to show the benefits obtained through the study, engineering, and implementation of a software system for the data management and collection during visual inspections carried out on adjacent buildings of tunneling works. The main goal is to demonstrate the economic benefits achieved with the help of simple equipment during inspections and a data collection software implemented ad hoc.
The STATUS app was tested for the construction of the new railway line: “Doubling section of the Cefalù-Castelbuono” in Palermo–Messina line [
13].
This paper explains:
The design and implementation of the STATUS app;
The application of the STATUS app to the real case of the tunneling works in Cefalù (Italy);
Benefits of using the STATUS app;
A demonstration of monitoring that can be carried out thanks to the automated collection of data in real time through geo-algorithms implemented in QGIS.
2. Materials and Methods
2.1. Interference between Construction Work and Adjacent Buildings
In urban underground infrastructures, there is a limited knowledge of the exact propagation of interference with the surrounding area. For this reason, the Eurocode 7 Section 2 chap. 2.7 suggests the “observation method” [
14]: “If the prediction of the geotechnical behavior is difficult, it can be appropriate to apply the approach known as
the observational method [
15], in which the design is reviewed during construction”. In particular, this methodology requires compliance with some requirements before construction operations begin. A control plan must be able to determine whether the building behavior falls within the admissible limits. Therefore, all buildings that interfere with the construction activities have to be monitored during the operation in order to limit the risks of damage and the environmental impacts.
In the specific case of tunneling works, buildings can radically change the settlements because of their structural rigidity. The soil–structure interaction is a complex phenomenon. In fact, it depends on several factors: geometry, rigidity, relative position with the tunnel, etc. Therefore, in the technical–economic feasibility studies, the soil–structure interaction is often ignored. The risk of damages is assessed on the assumption that the buildings have a free field failure pattern.
The Italian legislation on the environmental monitoring plan [
16] suggests to carry out
ante operam monitoring should be carried out in order to:
Providing a description of the environmental status before the start of the construction activities of a construction site;
Serving as a basis for forecasting the variations that may occur during the construction phases, proposing any countermeasures;
Constituting the initial point of reference to which to report the existence of the campaigns of measures in progress.
The legislation does not specify how ante operam monitoring is to be carried out, but could be summarized as follows:
A preliminary analysis of the urban context in which the construction site is located;
A census of all potentially interfering structures according to the area of influence;
A visual inspection to identify the most vulnerable structures.
One of the major problems is due to the large number of buildings present in the area of influence. This means high costs for inspections, data collection, and structural analysis.
2.2. Identification Procedures of the Influence Area
The proposed methodology does not change the procedures but allows an improvement of the results through an assisted approach to the data collection on site.
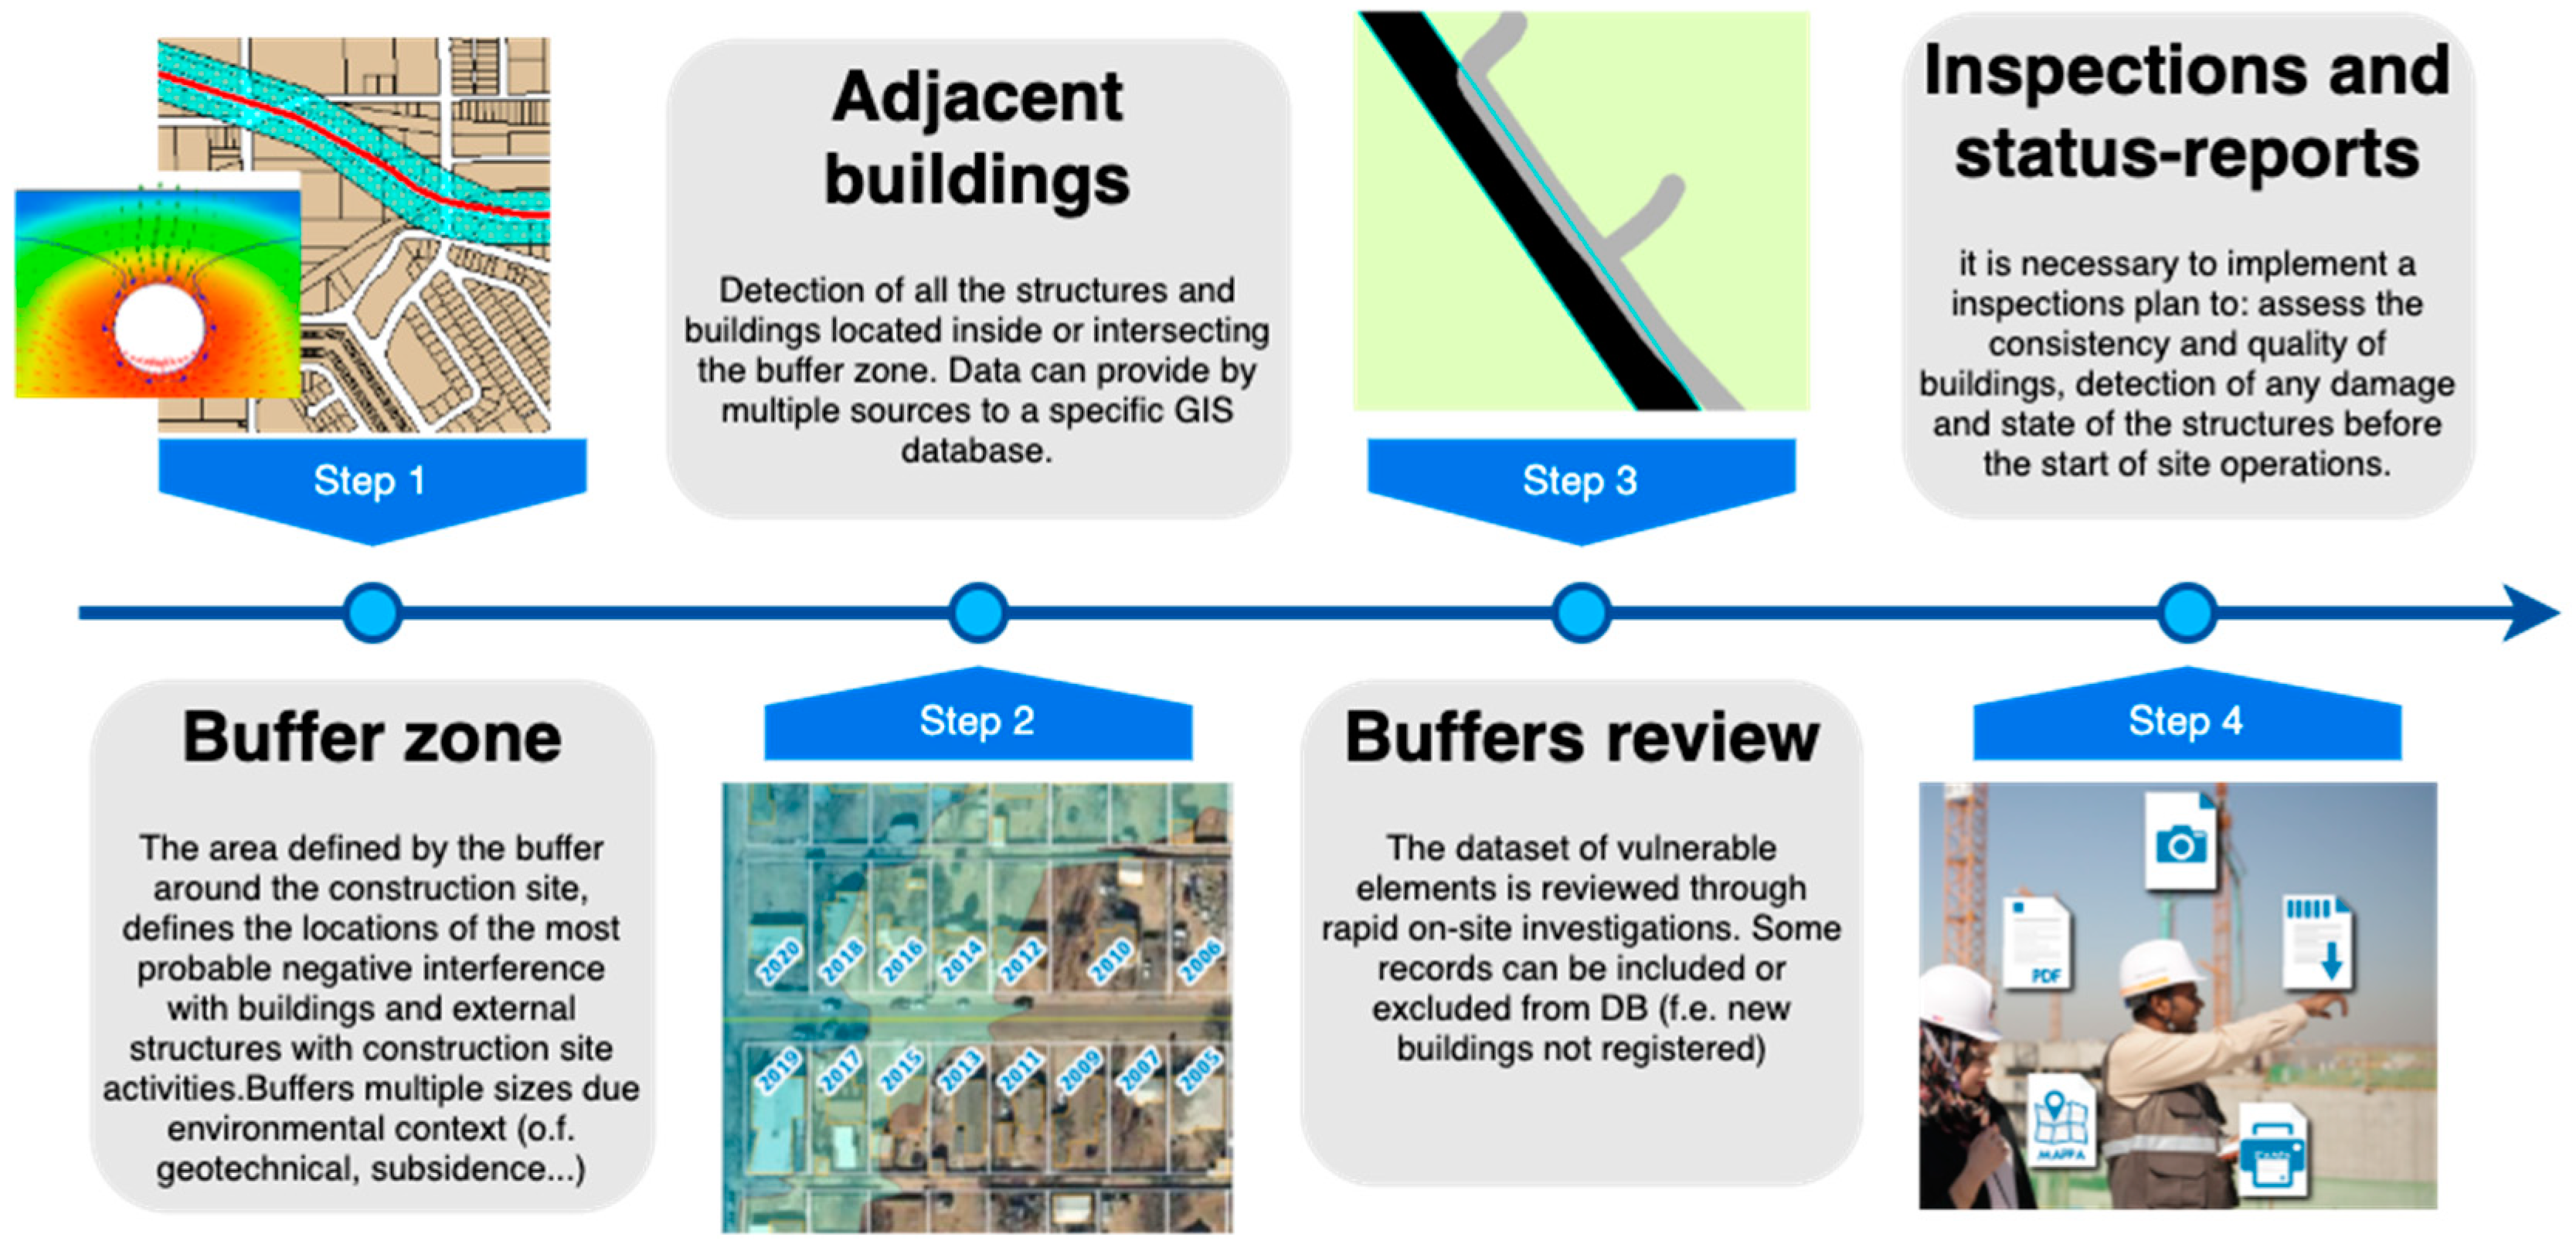
Figure 1 shows a step-by-step procedure to identify buildings adjacent to the tunneling works. The first step is to identify the buffer zone through specific studies such as geological, geotechnical, risk analysis, and many other approaches [
17]. The preventive collection of technical maps, inspections, design data, satellite, and aerial images is required. The results of these analysis produce buffers around the site [
18]. The area within the buffer is the place where interference may occur among site activities.
The second step is to identify adjacent buildings. For this purpose, it is necessary to query all the available geodatasets:
Civil and industrial buildings;
Transport infrastructures;
Facilities services buildings;
Historical buildings, monuments;
Artistic and naturalistic heritage;
Special requirements dictated by local regulations;
Any other element (even temporary) susceptible to interference.
All the identified elements will have to be cataloged and inserted in a GIS database. The database will contain all elements and their data provided by the queried datasets.
The third step is a “buffer zone review”. There are some cases where it is appropriated to add or remove a building from database.
“Only a part of the building is inside the buffer zone”. In such cases, it must be checked if the characteristics of the building will make it interfere with the construction site or not.
“No buildings in the buffer zone but buildings indeed”. It is probable that some buildings do not exist in the datasets used. Examples are recent infrastructure or construction sites in progress. Additional buildings can be added to inspections database in follow up.
“Removing a building from the inspections database for another reason”. Sometimes, some identified buildings must be removed because they do not interfere with the construction site operation for other reasons.
Steps 1 and 2 can be carried out by remote sensing using the datasets provided by the authorities or institutions contacted. Step 3 (“Buffer review”) requires on-the-spot checks by expert technicians and designers of the work to be performed in order to make the right decisions.
At the end of Step 3, we obtain a dataset of buildings and infrastructure potentially interfering with construction site activities and a database of buildings to inspect. Step 4 starts before the beginning of construction operations:
An inspections plan is required. The plan is necessary to assess the consistency and quality of buildings to detect any damage and state of the structures. Since there are usually a lot of buildings to inspect, the effective planning of human resources and operations is mandatory. The inspection team must be competent, qualified, and adequately trained;
The scheduling of appointments with each owner is required for access to each property unit.;
Designing a form for inspections is required. The forms are needed to enter the collected data into the database and generate reports;
Real-time monitoring of inspection progress and team evaluation results is required.
2.3. Mobile Data Collection
The data collection is carried out through an electronic device in which the data is recorded. In order to limit errors, structured and simplified templates should be used. Whatever device we used, we can identify three tasks for each inspection:
Evaluation and choice of data to be recorded.
Manual data entry on device.
Moving data into a database.
Tasks 1 and 2 can be performed even though there is not any computer equipment. Task 3, on the other hand, requires a specific database software.
“Traditional methods” provide for Tasks 1 and 2 during inspections and leave the transportation of data into a database later.
2.3.1. Data Collection and Mobile Technologies
Data collection is “the process of gathering and measuring information on variables interest” [
19]. Methodologies concerning data collection processes are largely derived from the experiences related to statistical and commercial surveys [
20].
Data collection methods are multiple. In this research, we defined a standard method to collect data useful to detect the state of “health” of buildings adjacent to a construction site. Some information is quantitative and directly detectable (e.g., the width, size, and composition of buildings), while other information is qualitative (e.g., type of pre-existing damage). Therefore, we decided to use a mixed quantitative/qualitative methodology, because this approach is related to the way in which the data are integrated and used as a whole [
21,
22].
Nowadays, mobile devices are equipped with technologically advanced sensors that are capable of facilitating the development of useful applications for data collection and analysis. In the past, the same work was carried out through monolithic applications [
23], and little attention was paid to the design of more general frameworks aimed at data collection.
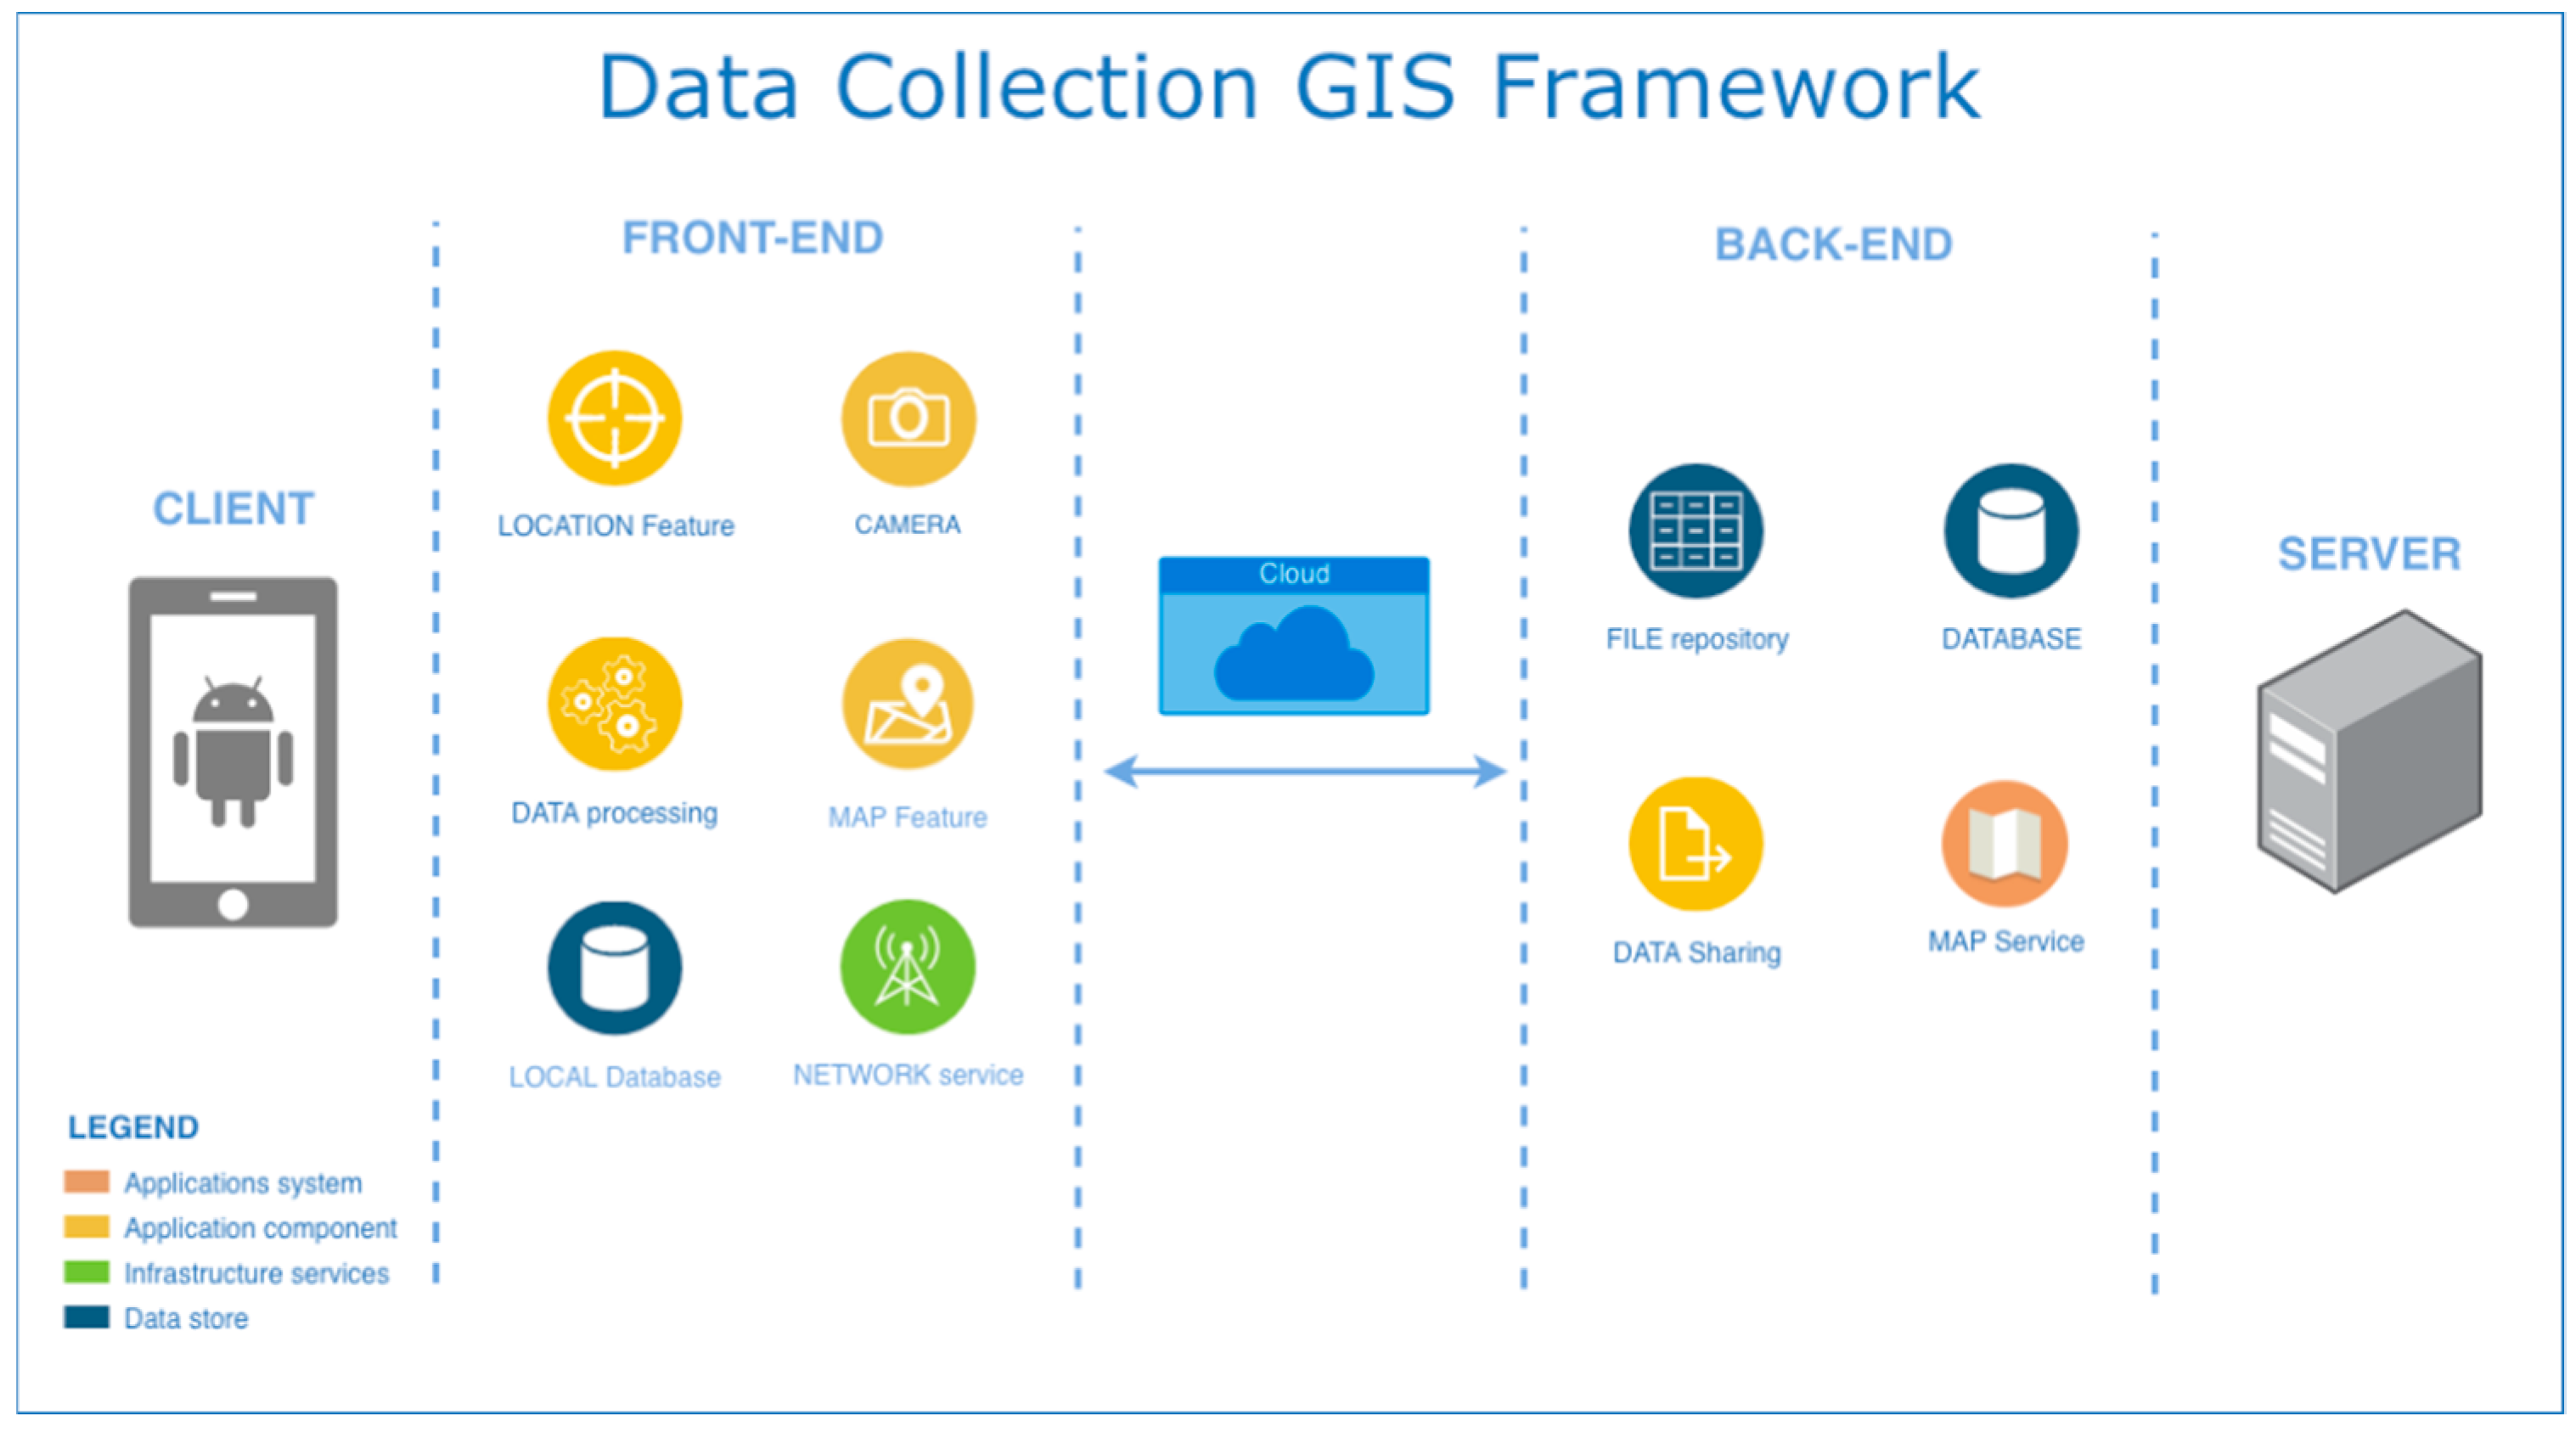
Typically, there are two components of a data collection framework through a mobile device: back-end and front-end components (
Figure 2).
The back-end component works on a server or on a cloud service, and its main task is the reception and management of data collected by the various client applications. The front-end component is installed on mobile devices and has the task of retrieving update data from the back-end component and allows operators to update them or insert new elements in the database. Processing of the collected data can be carried out by one or both components (front-end, back-end).
Processing carried out in the back-end component is adopted when the clients are equipped with limited computational resources and can allow complex operations (such as the aggregation/processing of data) to be performed quickly, without overloading the clients. Conversely, processing performed in the front-end component requires that the computational operations to be performed are sustainable for the client devices used, with limited hardware resources.
A further crucial aspect concerns techniques of data transmission between client and server. First of all, data transmission depends on the adopted network technology (Wi-Fi, Bluetooth, GPRS, UMTS, etc.). Generally, Wi-Fi connectivity allows a greater speed of data transmission. A second aspect concerns the synchronicity of transmission. Data can be transmitted in real time, during collection data, after the activation of a Wi-Fi connection (asynchronous transmission), or ultimately, manually. Synchronous transmission is preferable when the size of the data is small, while an asynchronous transmission is preferable when the size of the data or the geographical area is large.
2.3.2. Database
In data collection, the most efficient IT tool for storing and retrieving information organized in a predefined structure is the databases. In particular, databases allow collecting homogeneous sets of data stored on permanent structures. Data can be accessed through a system called DBMS (Database Management System) [
24]. Generally, when data collected are full and heterogeneous, the database should respect the following criteria [
25]:
Independence: applications must not be exposed to the implementation details of data representation;
Efficient access: read and write access speed to the data must be guaranteed;
Integrity and security: data integrity constraints must be respected, and access controls must be defined to prevent unauthorized users from modifying sensitive data;
Concurrent access: users must be able to access data simultaneously in a transparent manner;
Reliability: fast data recovery must be guaranteed in the event of software or hardware crash.
In particular, among the various solutions available, for this research we used the relational model (RDBMS) as the data representation model. This model is based on the concept of relationship or the relational table, which is intended as a set of records: all data are represented as relations and manipulated with relational algebra or relational calculation operators [
24]. This representation model allows creating a consistent and logical representation of the information collected. Data consistency is obtained by inserting appropriate integrity constraints, or the conditions that the records of a relationship must satisfy, increasing the integrity with which the data can therefore be represented.
2.3.3. Interfaces
The front-end component of a mobile data collection system contains the following essential features:
Location feature: advanced positioning control functionality via GPS, GPRS, or UMTS connection;
Database: must allow you to store data in a structured way; typically, it is relational and must be small, fast, and suitable for devices with limited computational resources, such as smartphones and tablets;
Map feature: visualization of the map containing the position of the elements containing the data to be collected and cataloged;
Camera: integration of the device with the camera aimed to associate photos taken in situ with the data collected.
The back-end component of a mobile data collection system should contain the following essential features:
File repository: remote storage space for images and data collection reports, shared in secure mode between the various clients;
Database: must allow the storage of data collected in a structured way and must be synchronized efficiently with all client devices.
2.4. STATUS App
2.4.1. Description and System Requirements
The STATUS app was developed by Geofunction Srls [
26], and it was released under a closed-source license. It is a GIS system that consists of an Android app integrated with a remote server, which allows data collection and the drafting of reports on the state of buildings. The reports contain data (in text format) and images and generated in PDF format.
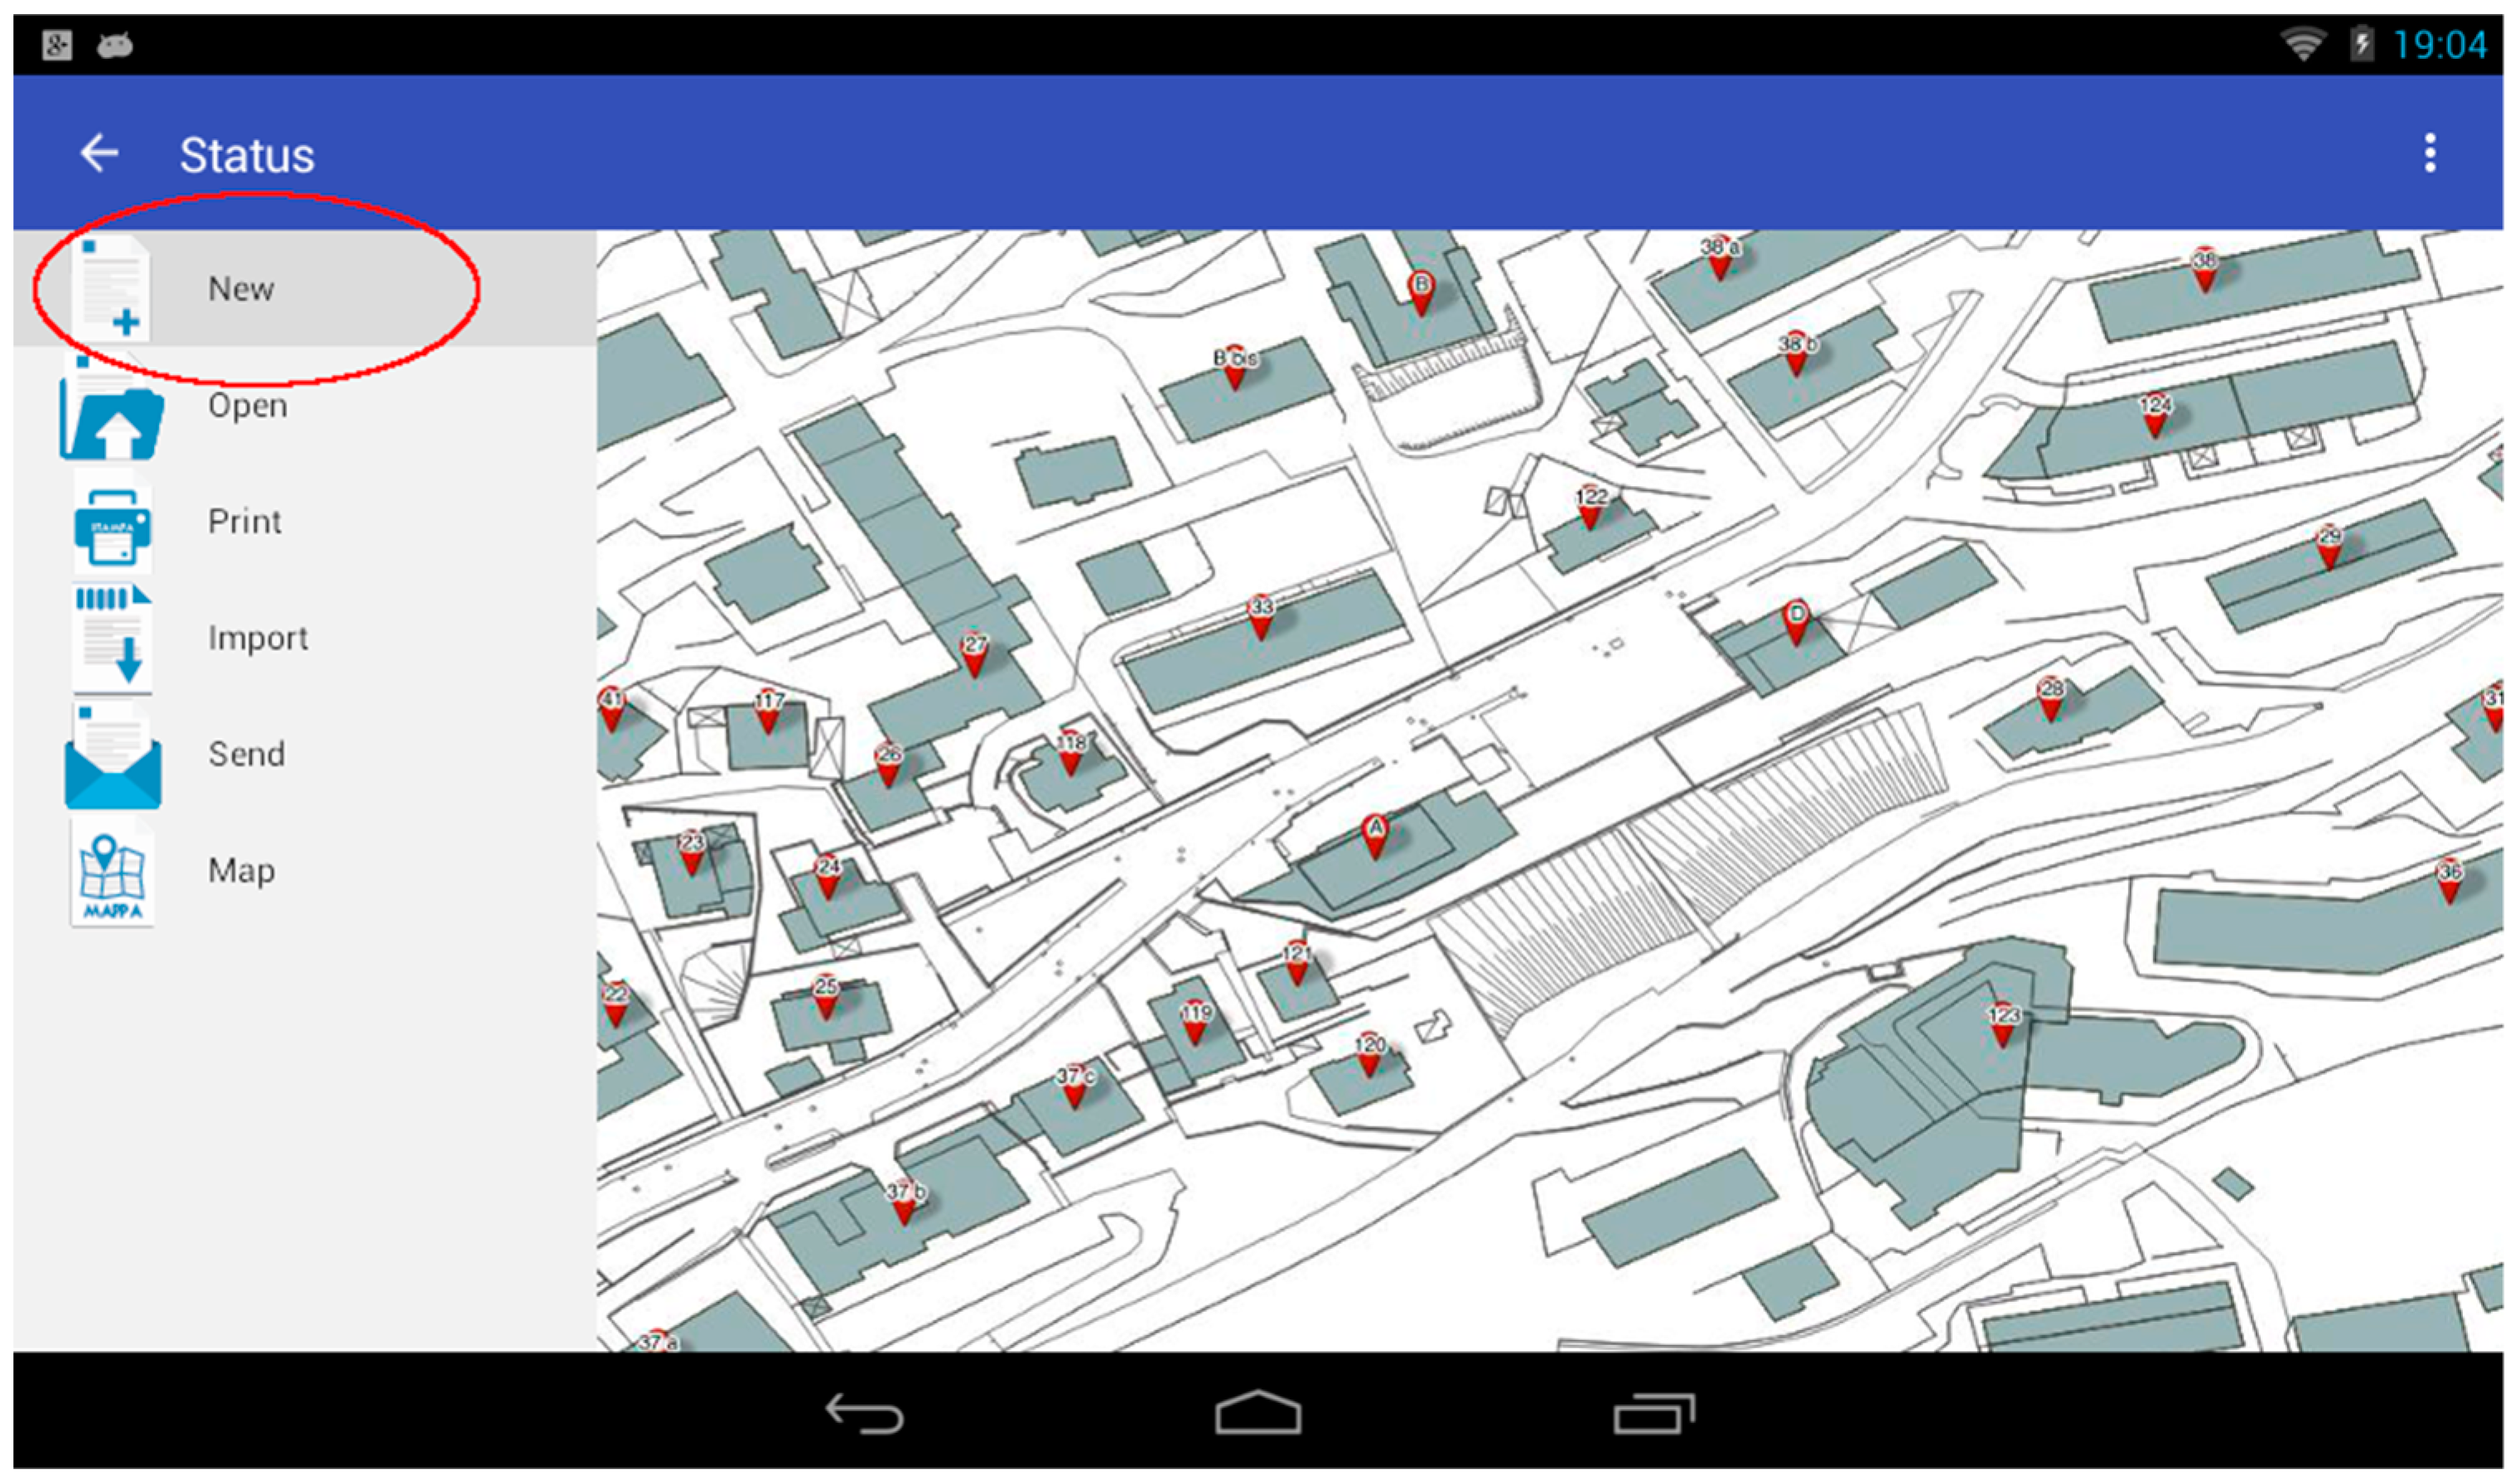
The output file is stored locally on the device and can be printed in situ using a wireless printer. The application allows synchronizing the data collected with a remote LAMP (Linux, Apache, MySQL, PHP) server. The STATUS app shows a map of buildings to the users (see
Figure 3). The building is marked as completed by the user if all the property units have been inspected, and a report has been drawn up for each of them. The number and ID of the property units is defined by the cadastral data, but it can be changed during inspections. Users can also work offline in areas without network coverage. The GIS system allows managing the team and monitoring the entire process. Operators were able to identify the position of the buildings where they could carry out inspections through a specific offline map feature.
STATUS was used by delegates and collaborators of the company, which was responsible for the management of the works and management of the site where it was tested (
Figure 4 and
Figure 5).
Reports are drawn up using a layout to describe the technical and architectural characteristics of the buildings and carry out a quick check of the state of the buildings to identify any damage existing at the time of the inspection.
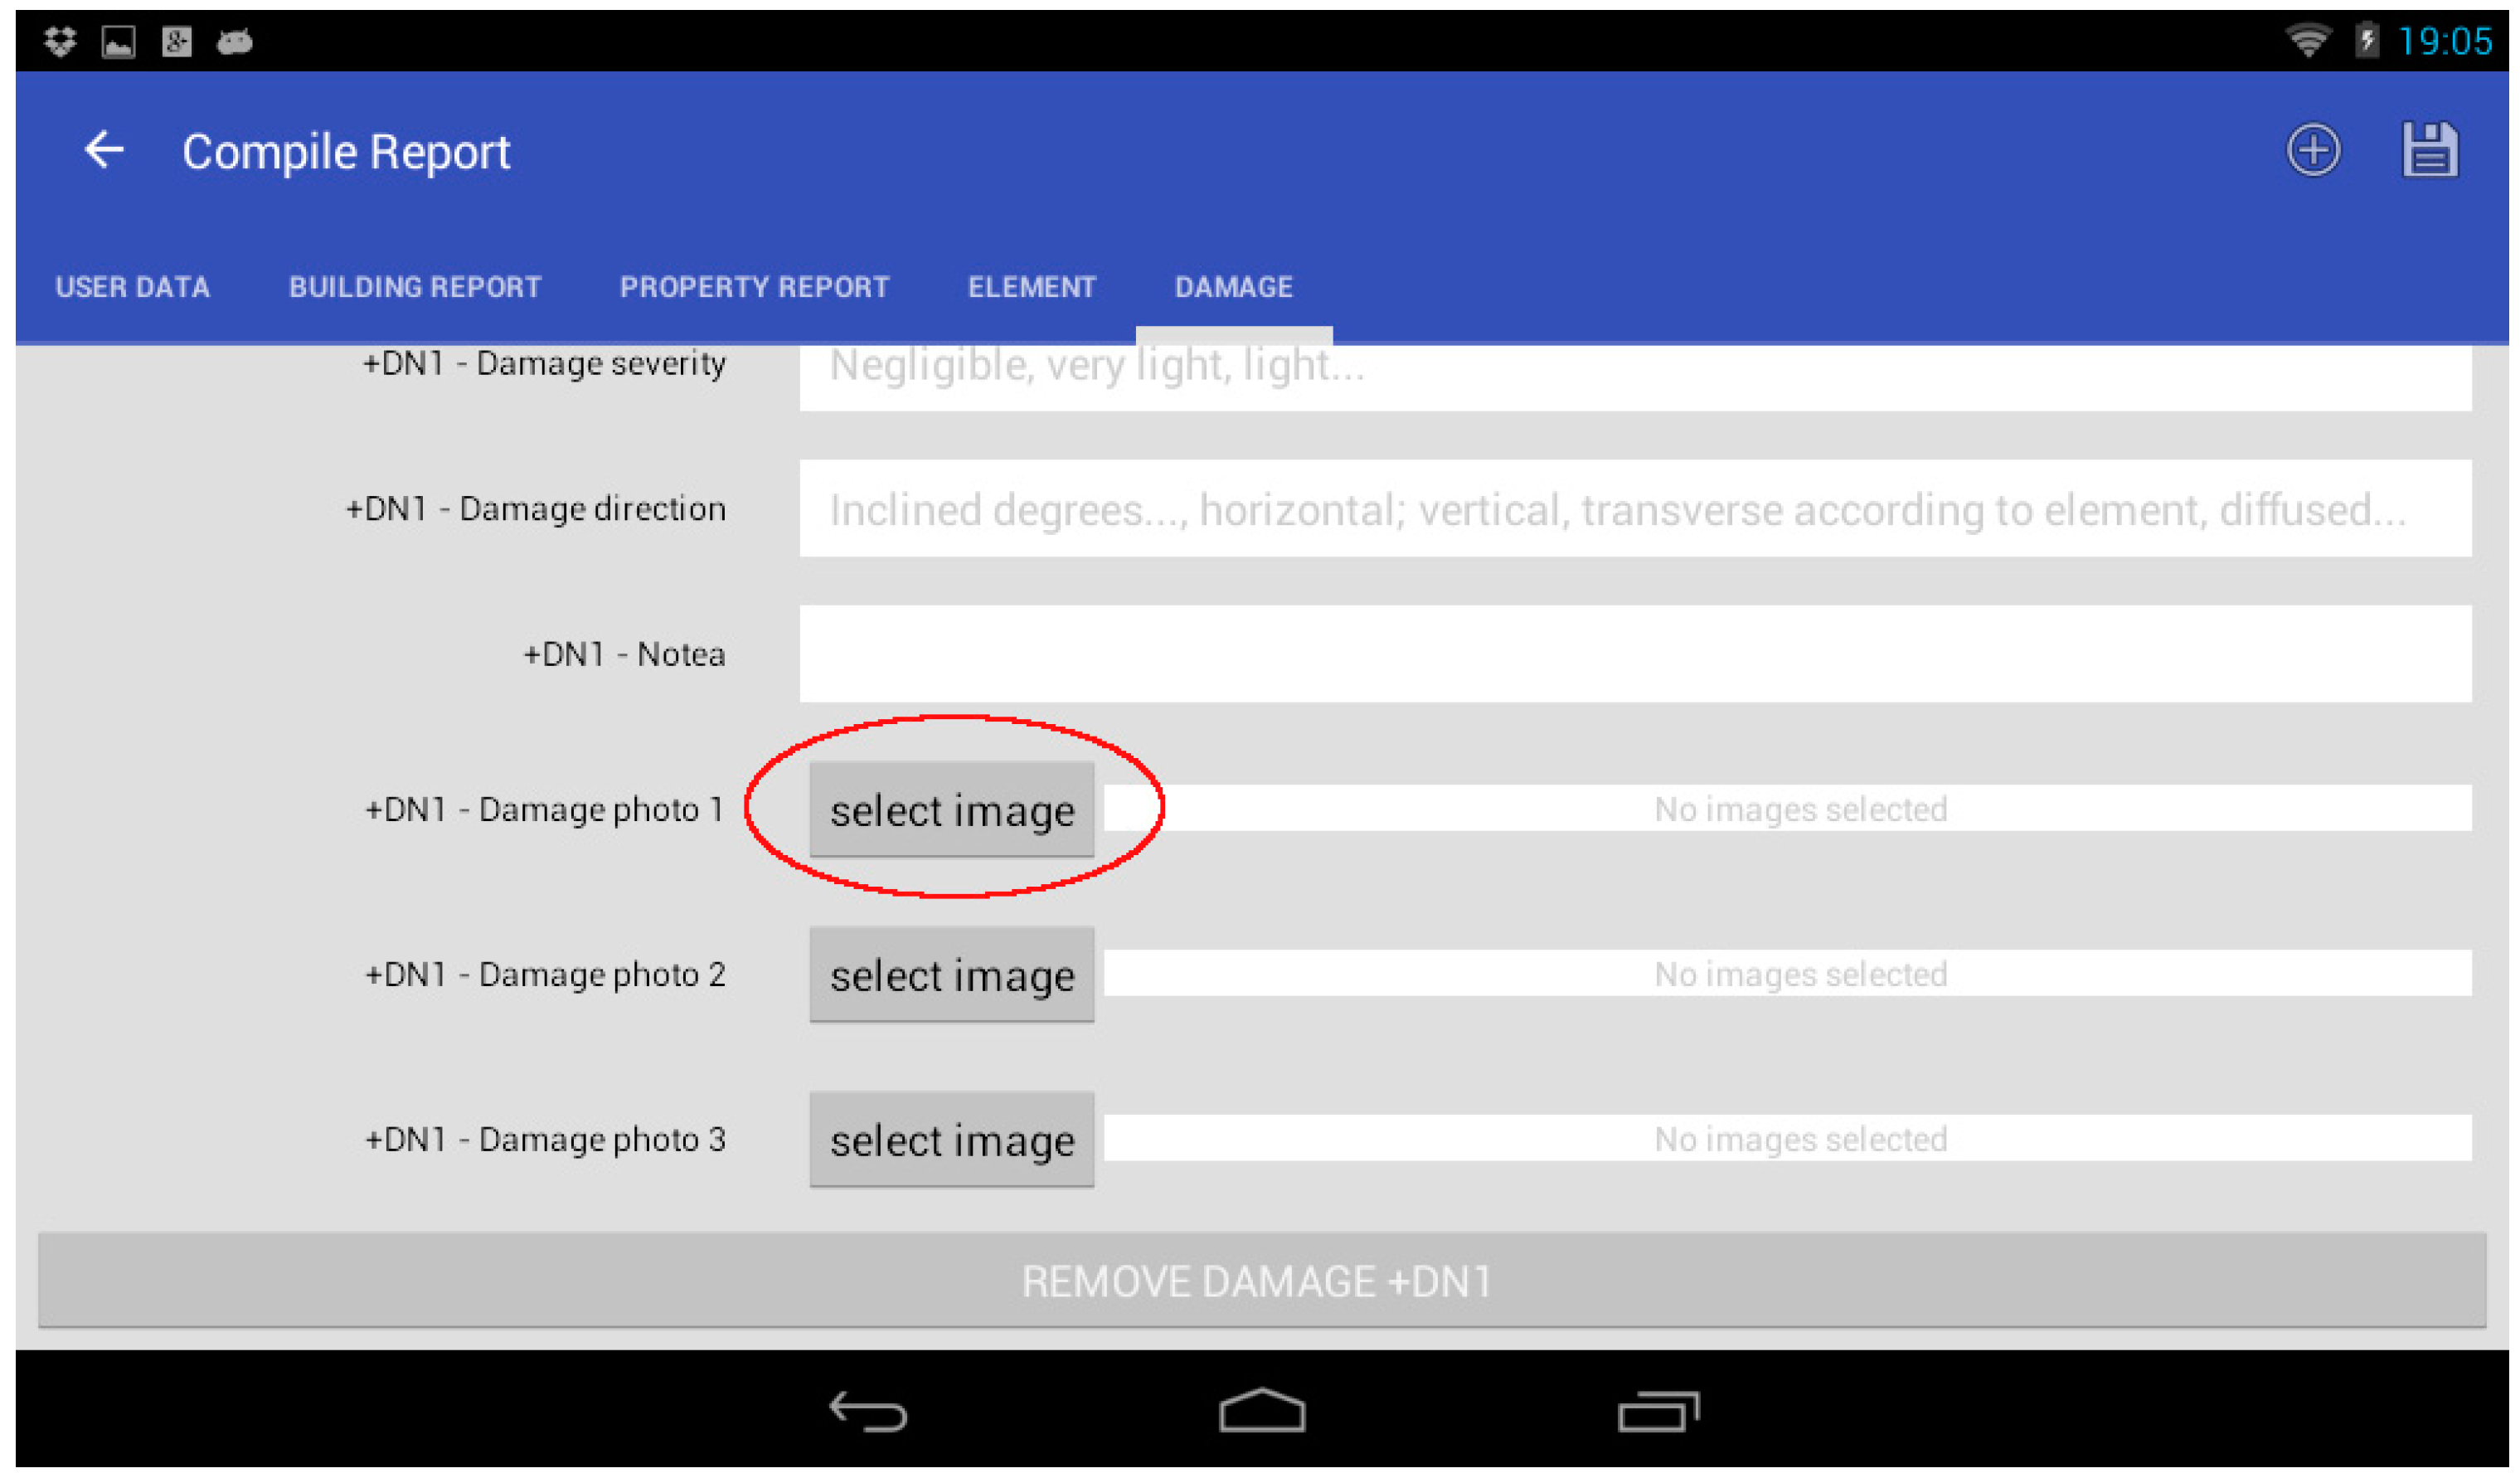
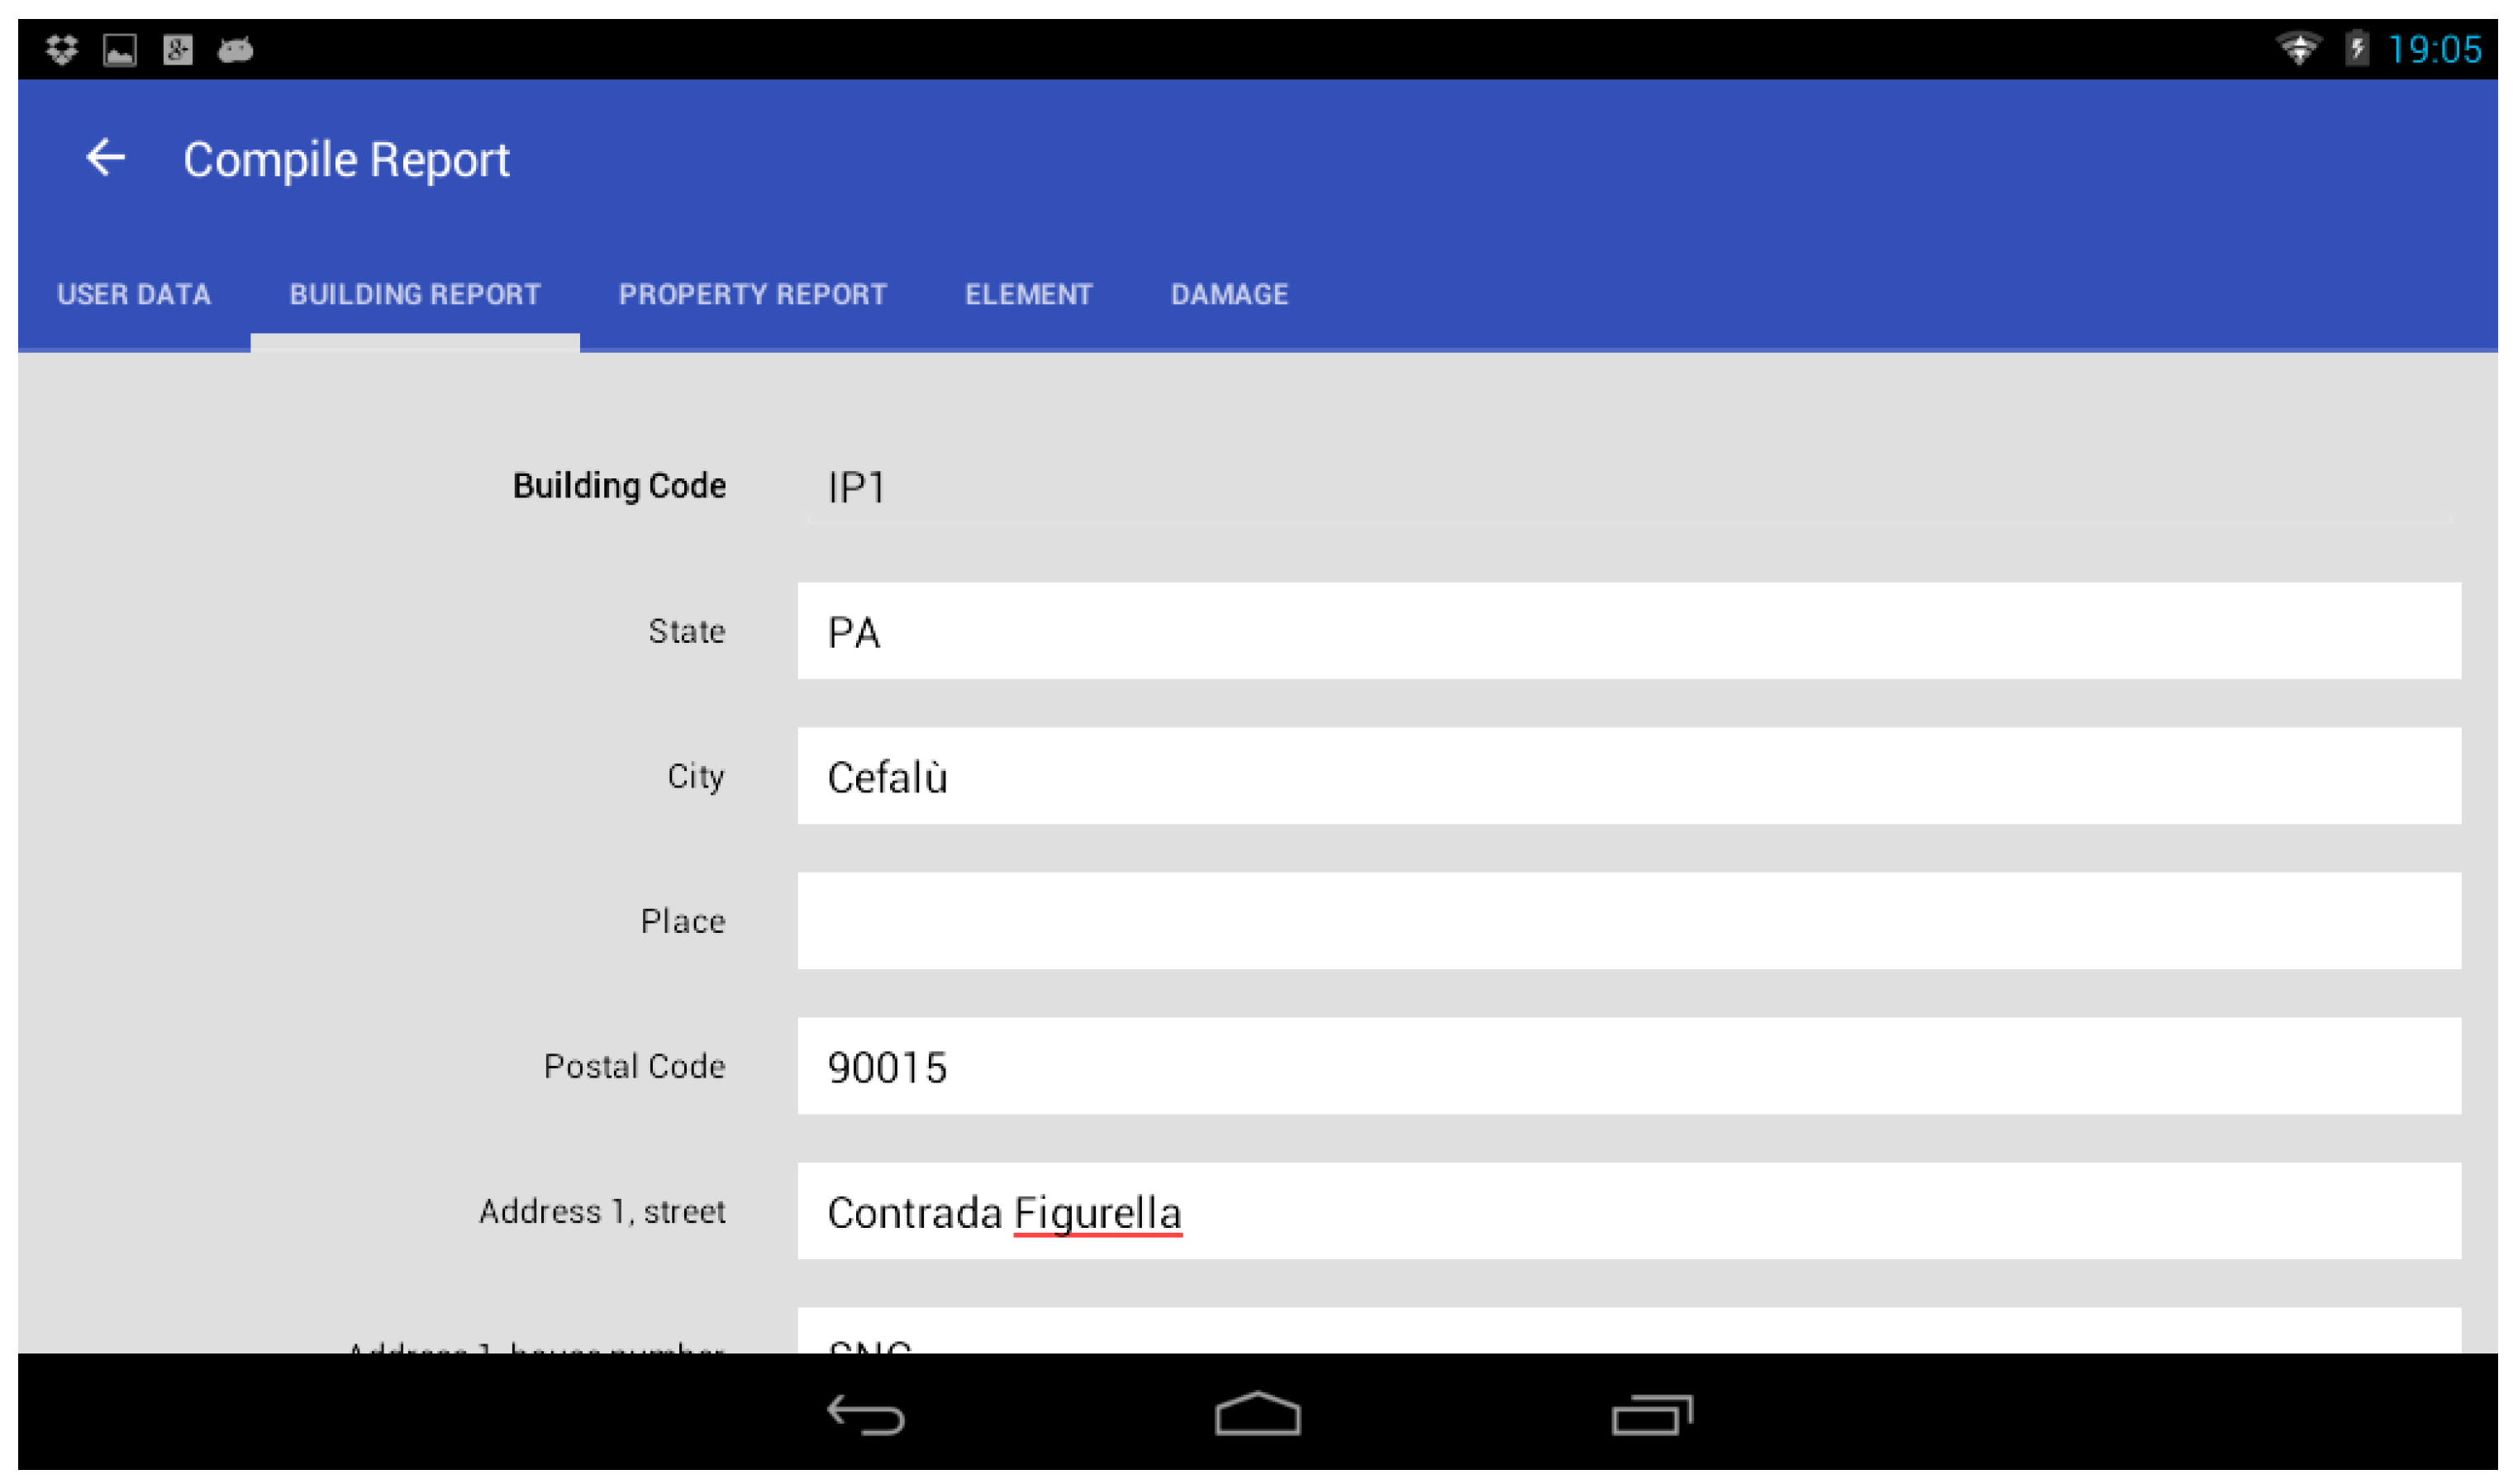
Figure 5 is a screenshot of the data collection forms; users can insert data using the same form for all buildings and properties. The user can insert all the important data that describe the building.
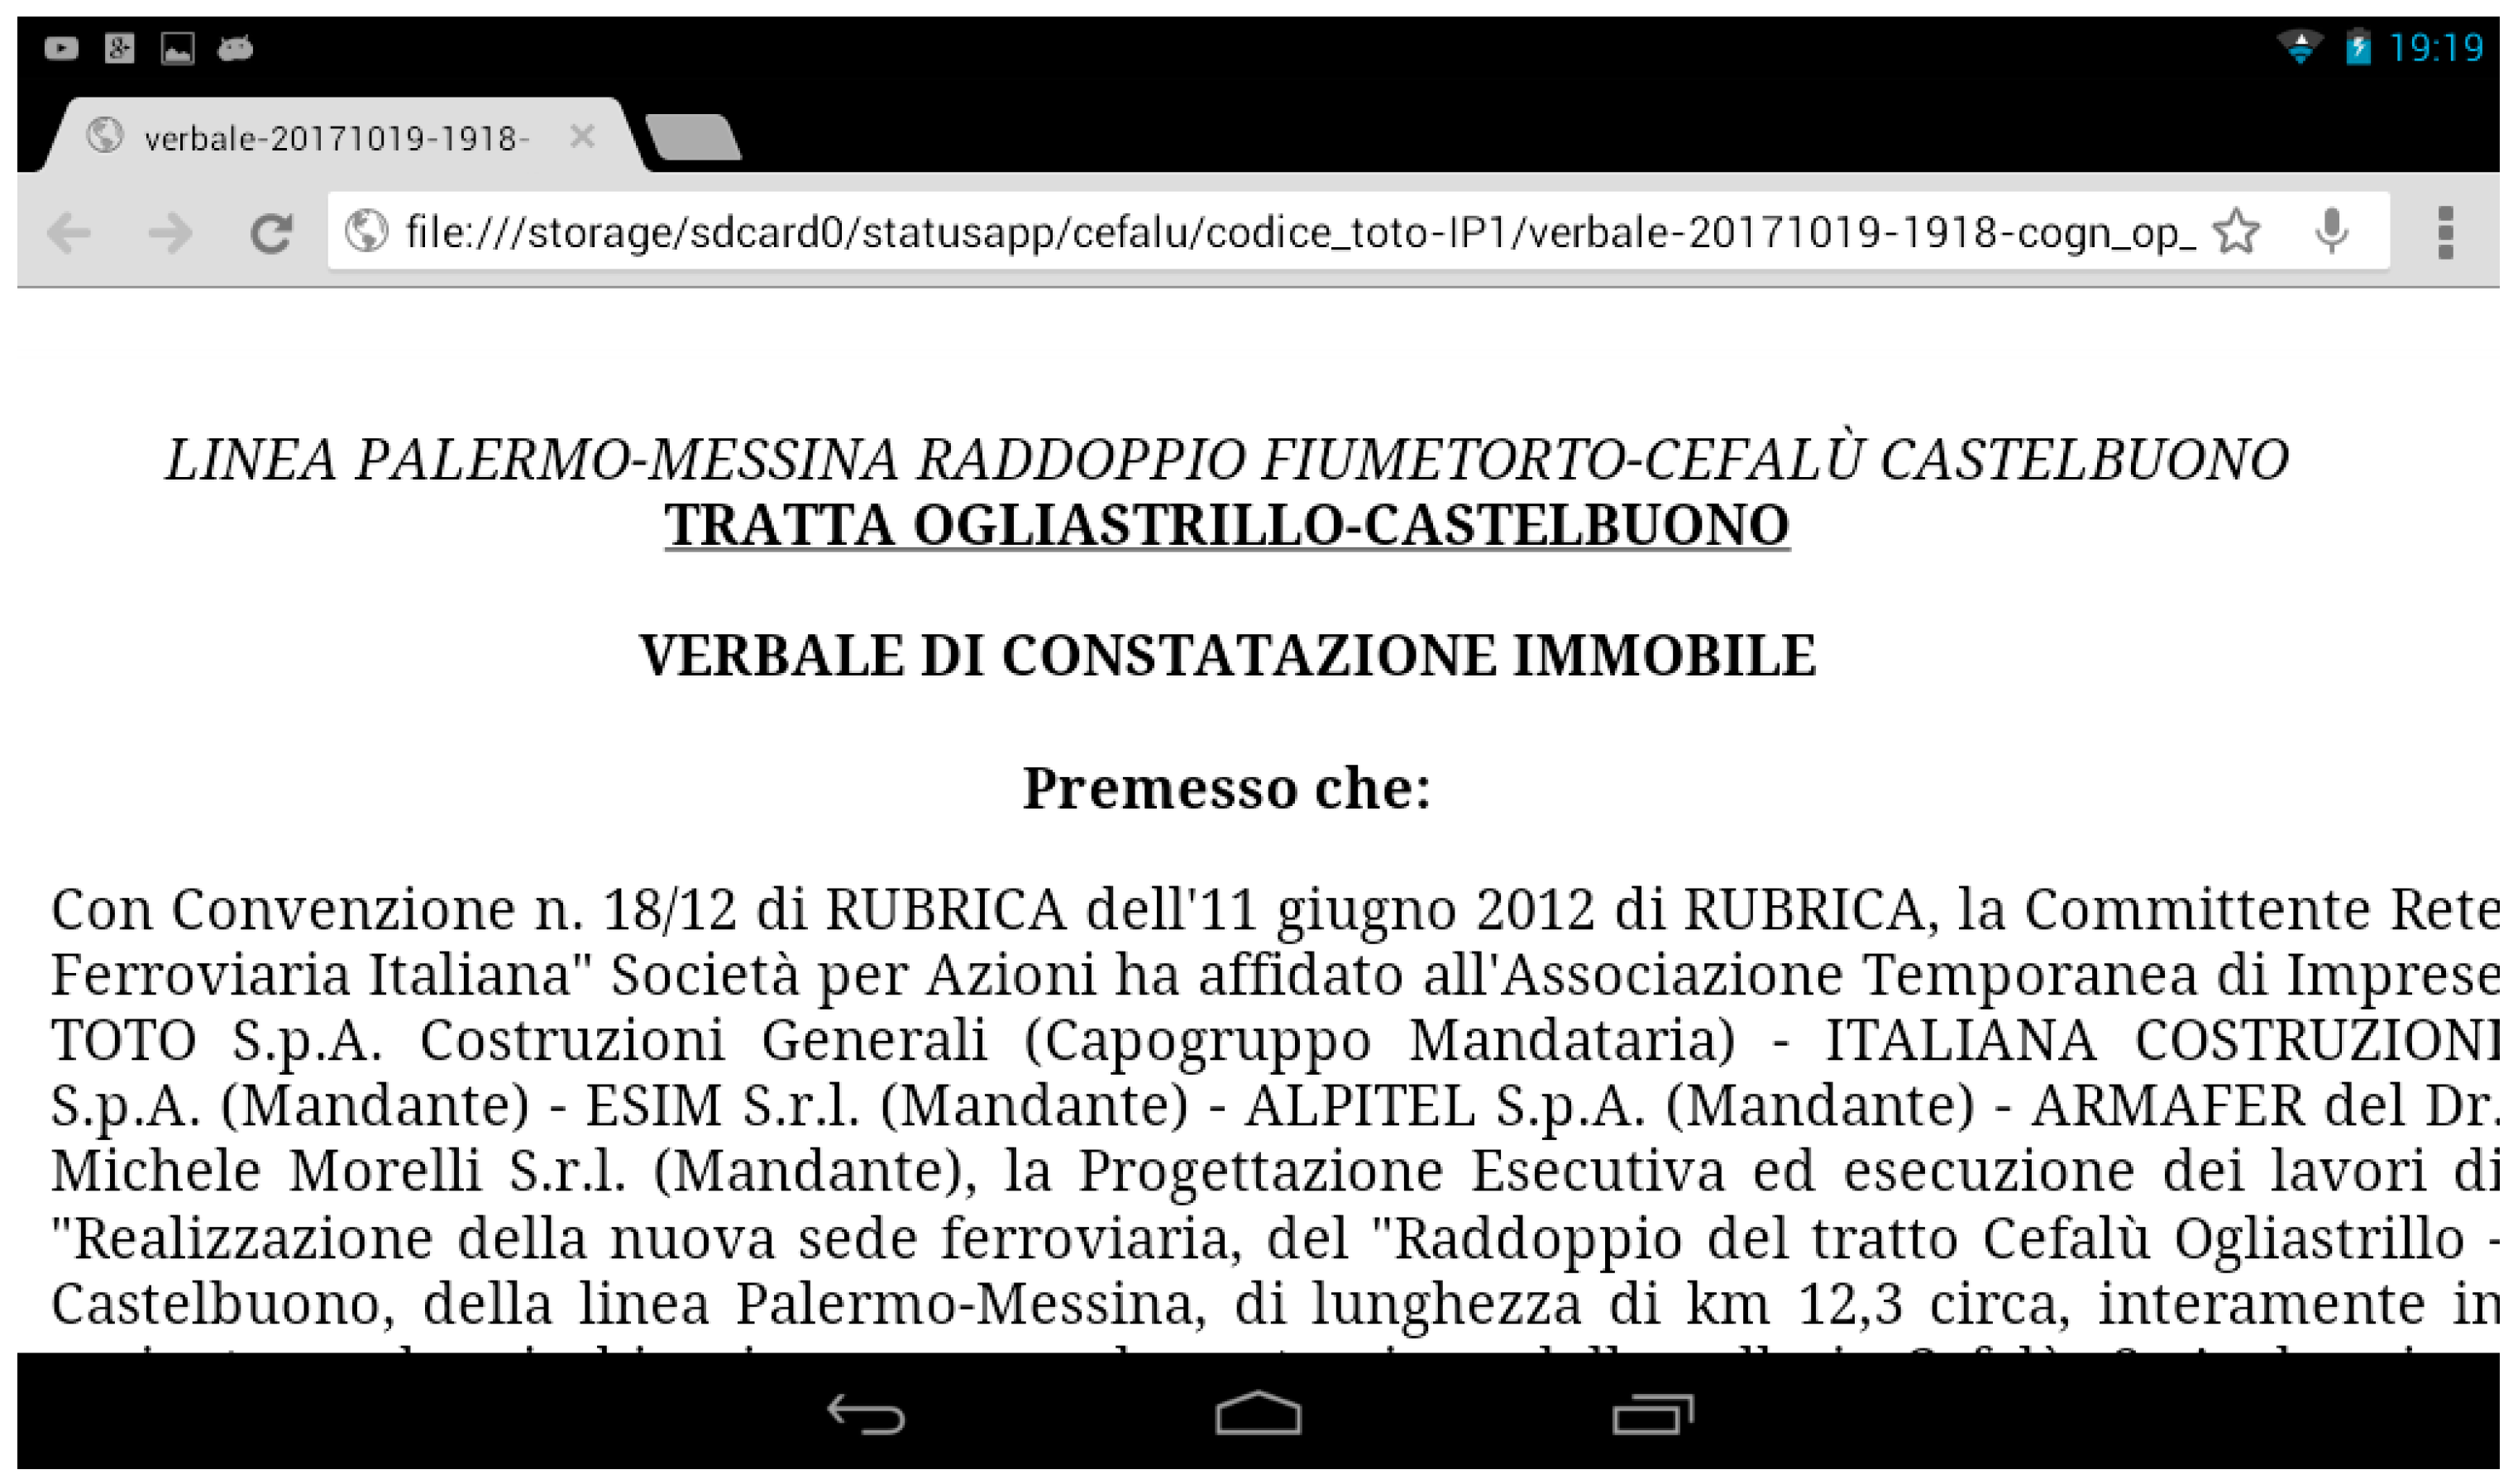
The application is able to work completely offline, when there is no Wi-Fi or cellular connectivity: users can export reports into PDFs and in HTML editable format (
Figure 6). Users can also send RAW data to a shared folder in the cloud through the cloud storage service offered by the Dropbox as soon as connectivity is available.
The main purposes can be summarized in the following results:
In situ census of buildings adjacent to large construction sites;
Quick assessment of the health status and quality of adjacent buildings;
Rapid identification of existing damage inside the buildings before operations begin.
The system improves the efficiency and speed of investigation. The technical teams, thanks to appropriate training, have been able to carry out the inspections and detect the necessary information correctly.
2.4.2. Data Structure
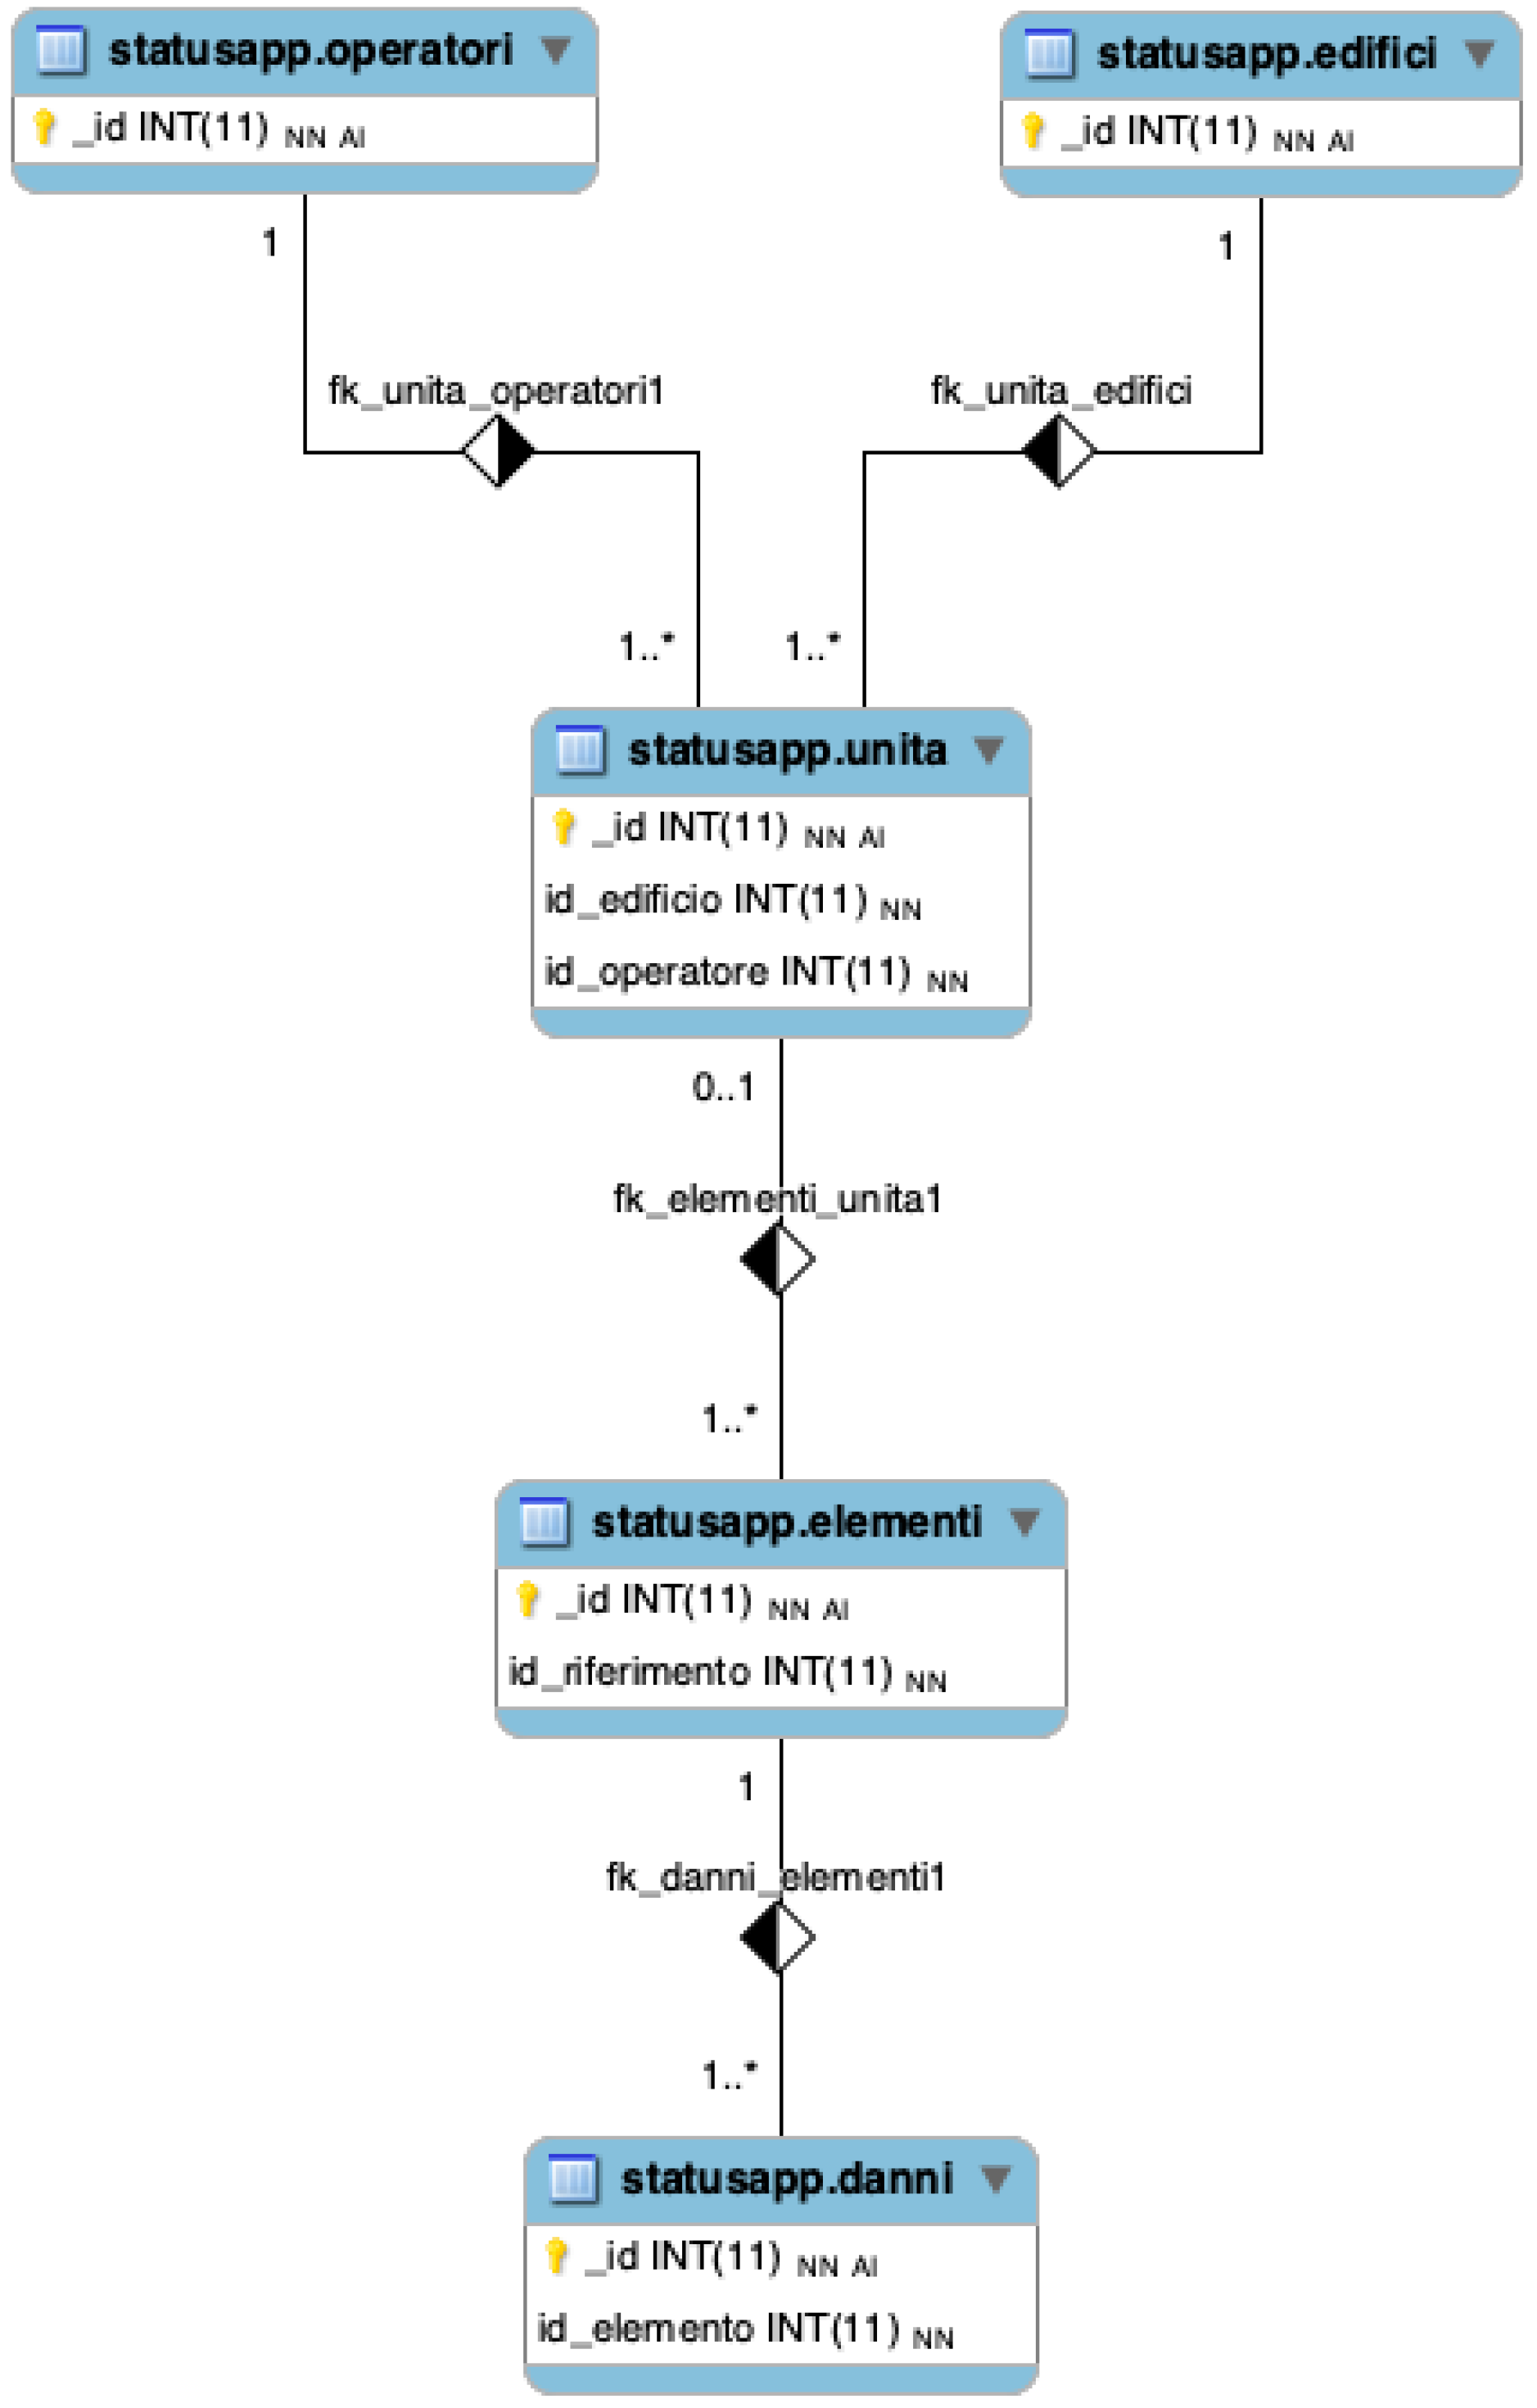
We used a RDBMS structure for data. Data was structured according to a traditional logic based on records and tables and using primary and external keys to link the tables. In particular, the data structure is described by the following ER (Entity-relationship) diagram shown in
Figure 7.
The tables of relational database are the following:
“operators”: it contains the fields relating to the personal data of the users who carried out the inspections; in addition to personal data, this table contains the fields relating to their identification in the company that carried out the work management.
“buildings”: it contains the fields relating to the identification of the buildings to be inspected; a building is a complex and unique structural unit. A census and the partial insertion of some data of this table was carried out before the start of the relevant operations.
“unit”: it contains the fields relating to the identification of the individual property units (apartments, shops, etc.) inside a building. Reports, including pre-existing identified and detected damage, were carried out for each unit.
“elements”: it contains data and photos relating to the environments inside the inspected housing units (rooms, porches, etc.) and data describing them. Users can insert new elements during the inspections and can associate them with the unit in which they are carrying out inspections. All data and images are inserted by operators using devices during the inspections.
“damage”: it contains information and photos relating to the presence of damage or injury to the buildings detected. Users can add damage data and associate it with the architectural element to which it refers (room, porch, etc.). Descriptions, types, and images are associated with each damage.
Reports are generated using all the fields inserted in the tables: a report can be generated for each record in the “unit” table. To allow this, the relational database was set up as follows:
“operators” table and the “buildings” table contain an “id” key field;
“unit” table contains an “id” key field and fields for foreign keys called “operator_id” and “building_id” used to connect the respective tables;
“elements” table contains an “id” key field and a field for the foreign key called “reference_id” used to connect to the “id” key field of the “unit” table;
“damage” table contains an “id” key field and a field for the foreign key called “element_id” used to connect to the “id” key field of the “elements” table.
Reports are of the “one to many” type and allow aggregating all the data entered in a single data group for each real estate unit (apartment, shop, office, etc.) within each building. In the case of isolated houses, there is only one record in the unit table connected to that building.
Before the start of the inspections, information such as cadastral data, information on owners, addresses, subdivision into real estate units, year of construction, etc. was provided to the operators. In any case, technicians check the correctness data during the inspections.
2.4.3. Back-End Component
To store files generated by the application on the server, we decided to use Dropbox API [
27]. It is a cloud service that offers a storage space where users can save even large files. We used Dropbox because storage space is easily accessible from any device with an Internet connection, and in addition, the service offers good protection against unwanted access and loss of stored data. Dropbox also guarantees data availability at all times. Above all, it provides developers with an efficient API system that integrates with different programming languages and software platforms, including Java for Android. These APIs help developers efficiently manage both user authentication and file management activities and their properties.
The DBMS that was adopted in the back-end interface was MySQL [
28] with spatial extensions. The choice allowed implementing a remote geodatabase that is able to store the geometries associated with map elements and to query the geometric properties of objects loaded into the database. We used the WKT syntax to represent the geometries and JSON as a representation format for the synchronization between the client database and the server. We used this configuration because it is easy to use on mobile devices on the market. The JSON format is widely supported in different environments and software that is used for web applications.
2.4.4. Front-End Component
The STATUS front-end component was developed using the Model/View/Controller (MVC) design paradigm. In particular, the Model component manages the representation of the data related to the processing produced by the main component of the software. The View component manages the implementation of input forms for data collection and the output display of the processing results. Finally, the Controller component ensures correct communication between the Model and View components. We adopted the MVC software design model because it is the most used for web and mobile applications.
The mobile application is designed to be compatible with the 4.4. KitKat version of Android (API level 19), which is installed on devices supplied to operators involved in data collection. The choice of this version of Android was forced, because one of the requirements of the system was the use of devices with this specific version of Android. This system has limitations that we solved with implementations. In fact, this Android API does not natively support the generation of documents in PDF format; therefore, the implementation consisted of generating the report in editable HTML format, which was accessible from the browser and easily convertible to PDF format.
The front-end component includes also an advanced control of the GPS status and positioning on the map, and it also works when there is not connectivity, as the GPS signal receiver can be set with some parameters by the user or managed automatically. Activation of the GPS signal is checked at the start of the map. The application enables knowing at any time the status of the GPS signal, in order to check whether the area is covered or not and measure the coverage level. However, we can use a low-quality geolocation system based on a Wi-Fi, GSM, or UMTS network. The localization system adopted by the system is based on the “Location Services” functions natively implemented on Android and accessible through API: the main component is called “LocationManager” and allows the access and management of data related to geolocation.
We chose the SQlite database for the front-end component because it is the DBMS natively integrated on Android. SQLite is a DBMS that is small, fast, portable and therefore suitable for devices with limited resources [
29]. Moreover, it allows the creation of large databases, and supports atomic, consistent, isolated and durable (ACID) transactions even after an application crash event, thus ensuring excellent reliability. Database management is carried out in a special Java package called “database” which contains the classes that allow the definition of the database fields and the access queries. The class that defines the structure of the tables and relationships is called “
DatabaseHelper”.
The SQL queries that allow reading, updating, and deleting local database table fields are defined in a special class called “DatabaseAdapter”.
The interface for displaying the map was implemented using Nutiteq SDK Mobile [
30], which is a set of libraries for the development of map-based mobile applications. We used Nutiteq libraries because it was the open source project that best suited the needs of the implementation. In particular, Nutiteq allows the development of mobile GIS applications in Java language for Android and offers support for the management of online and offline cartographic layers. Nutiteq’s MapView interface allows the visualization of maps and interaction with them through pan-zoom, rotation, touch, and geolocation operations. Supported offline layer formats can be vector (points, lines, polygons) or raster (GeoTIFF). Furthermore, online vector and raster data sources such as WMS, WFS, KML, CSV, etc. are supported. The class used for this purpose is called “
MapActivity”, included in Java package named “map”.
To integrate the camera of Android devices, a native API of the Android framework was adopted: through library functions, the system automatically interacts with the camera integrated in the device and the photos taken can be stored in the main or external memory of the devices. The app saves only on external memory, because the size of data to be stored is very large.
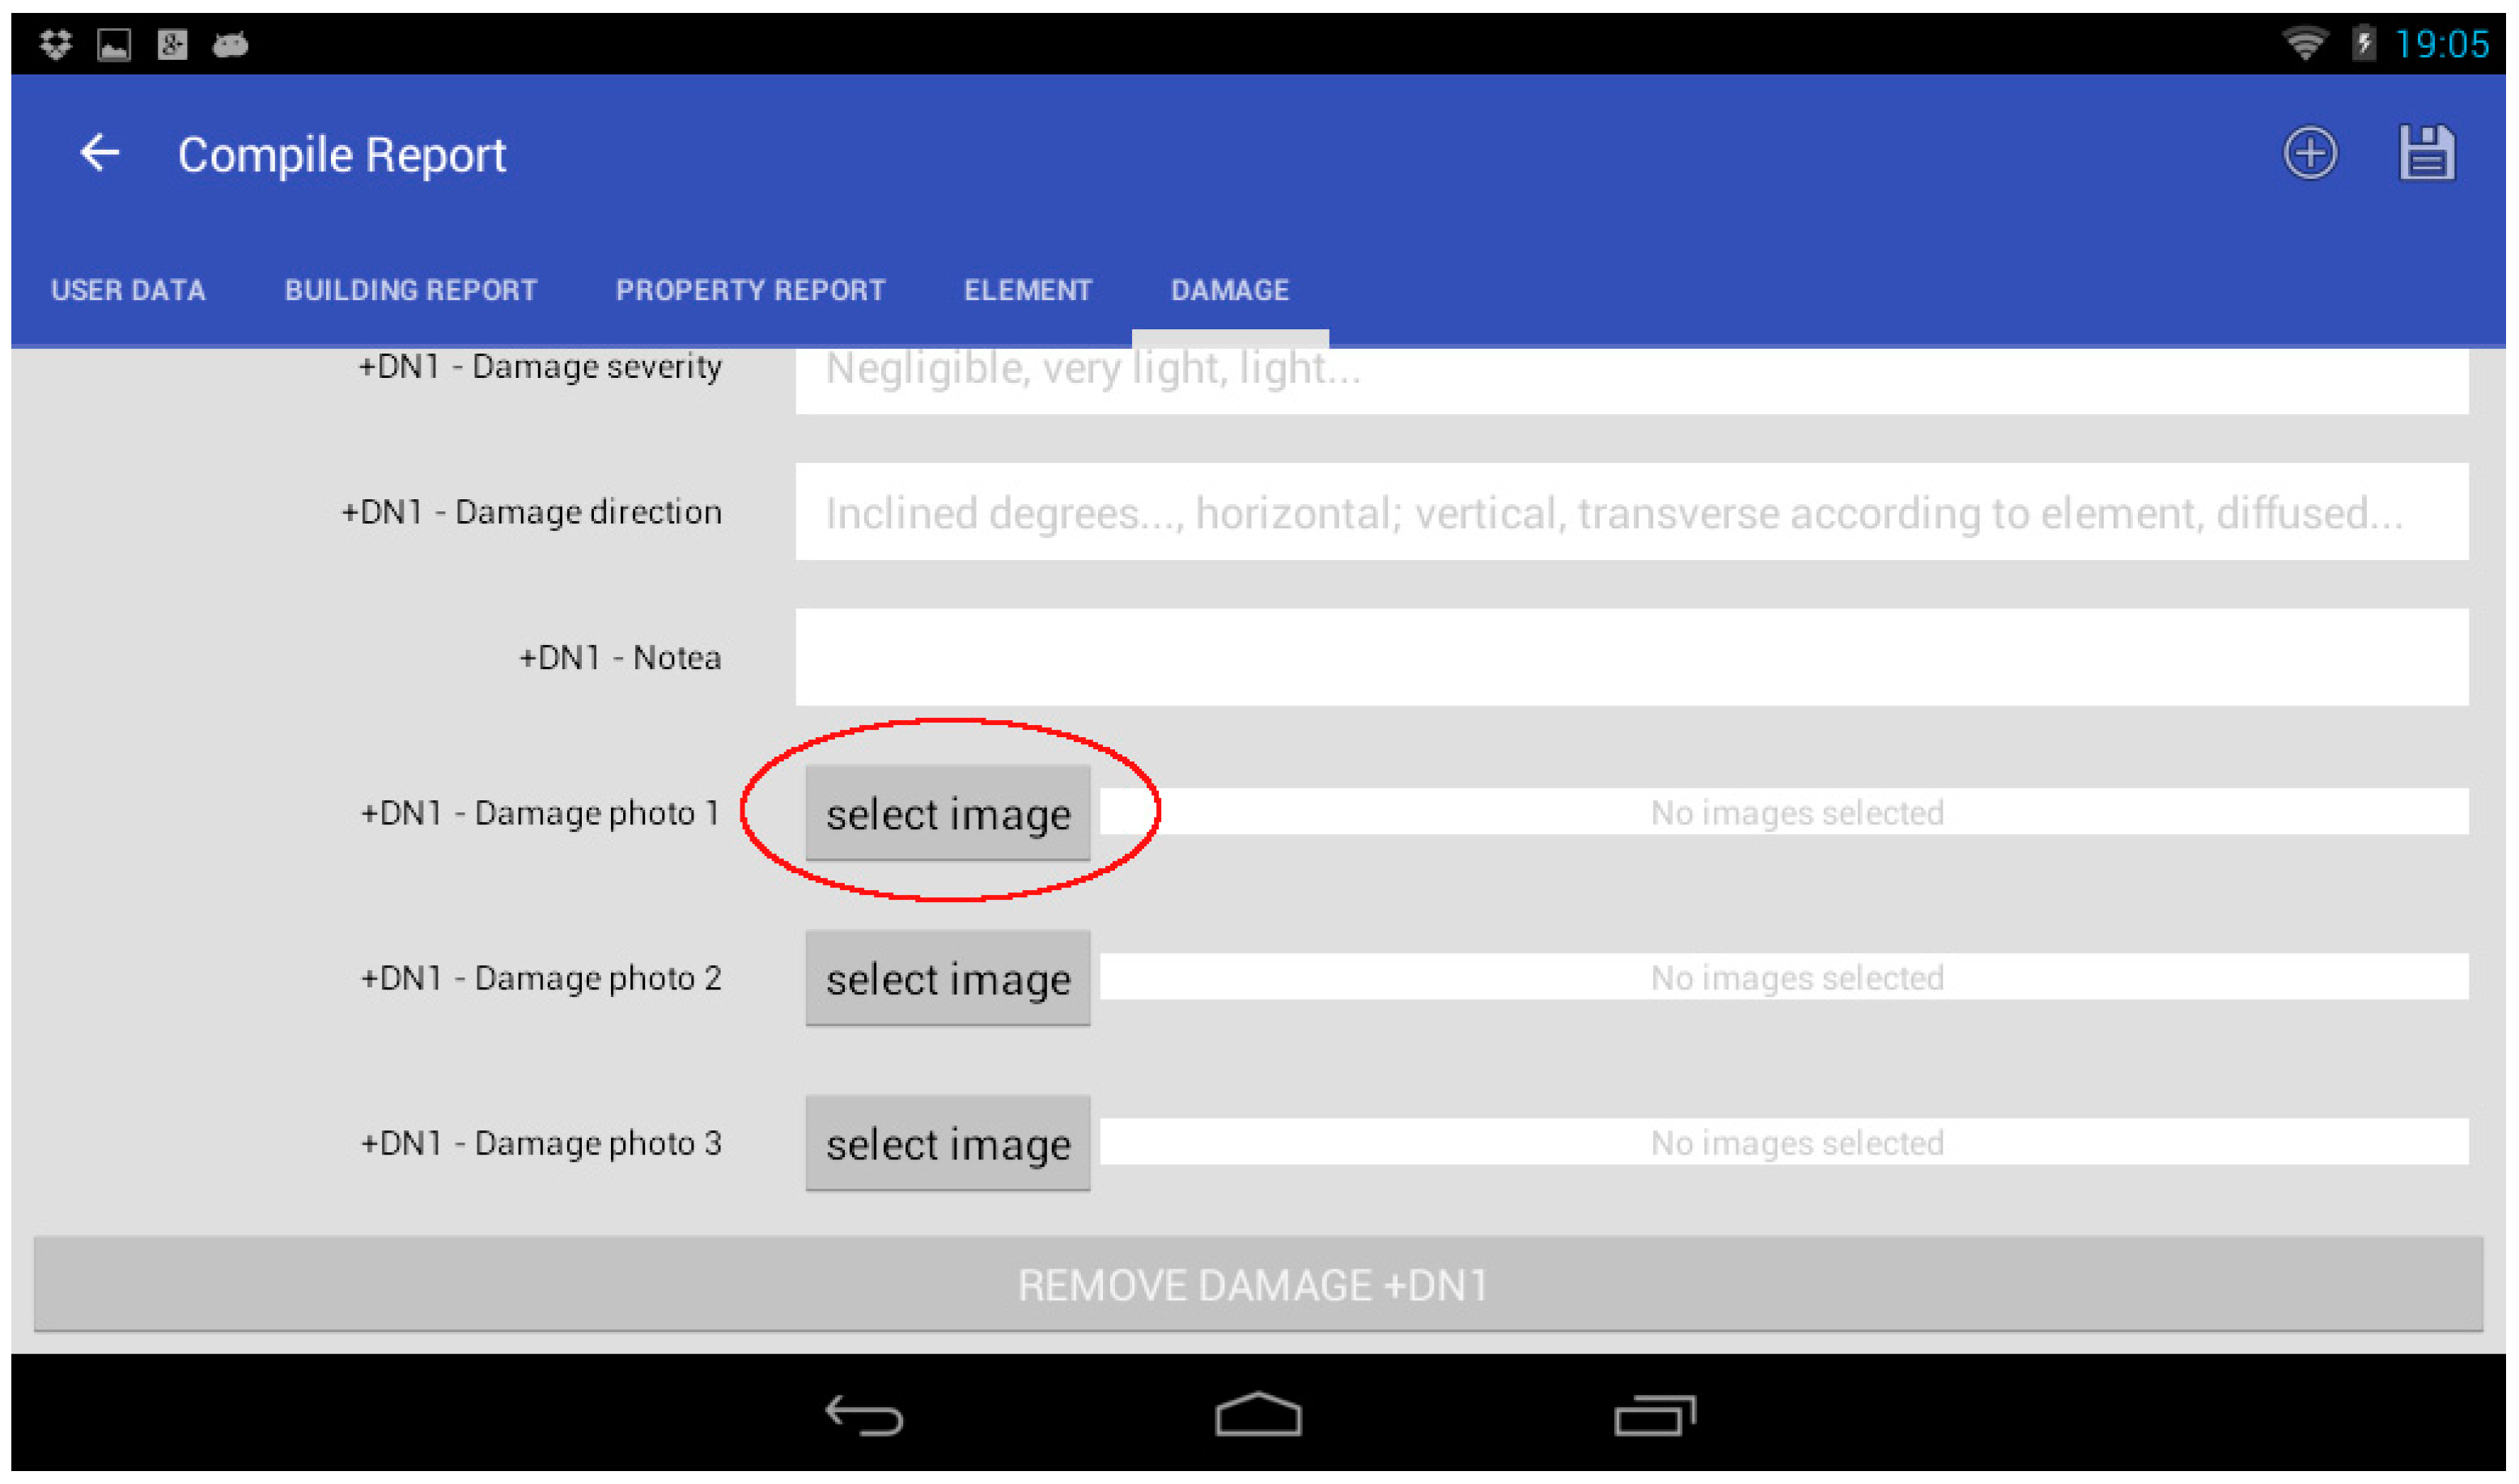
The View component of the application is responsible for creating masks for data entry (
Figure 8) and was implemented through Activity and Fragment, which are natively supported by Android: the main classes that manage the component are defined in a subpackage called “activity”:
“MainActivity”: it implements the interface of the application on the start screen;
“NewActivity”: it implements the interface for data collection (creation of new report from scratch or from a saved report).
“NewActivity”: class interfaces with some Fragments that allow the management of the data collection interface components, in particular:
“TabFragment”: it has the purpose of managing the various tabs referring respectively to the fields relating to buildings, property units, elements, and damages;
“ListFragment”: it has the purpose of managing the fields that make up each tab.
The data representation format adopted for communication between the components is JSON. The object containing the data is of the “JSONObject” type and is generated by a class called “PrintFragment”. The data collected through the masks are saved using a special asynchronous task, which is implemented in the “WriteJsonDataTask” class that writes data in the memory and in the local database.
The system was implemented to work both offline and online. The management of the connectivity is delegated to the native Android component called “ConnectionManager”, which verifies the presence of data connectivity (Wi-Fi, GPRS, UMTS, etc.) and the start of the data synchronization phase with the back-end component when the application starts.
2.5. Case History
The STATUS app was tested for the construction of a 12.3 km of doubling of the Cefalù–Castelbuono railway line, on the Palermo–Messina line, for a total amount of €338,576,440.
The inspections were carried out before the beginning of three construction sites: the double tunnel in Cefalù (6700 m), the Sant’Ambrogio gallery (4300 m), and the Malpertugio (135 m).
In the preliminary design phase, geotechnical investigations were carried out to understand the behavioral patterns of the soil surrounding the tunnel excavations. In order to determine the area of subsidence surrounding the excavations, a finite element analysis was applied. From these geotechnical analyses, buffers and finally the buildings inside were inspected with the methodology described in
Section 2.2.
The site management company commissioned Geofunction Srls (of which the authors are the co-founders) to study, build, and implement a computer system to optimize the census and estimation of pre-existing damage on the interfering structures before the beginning of the tunneling works.
Then, the authors tried to bridge the gap between existing commercial (and non-commercial) systems and the particular needs of the case under consideration. Among the various difficulties in adapting the available systems, there were production reports on site, complete operation of the system offline, and the lightness and manageability of the required equipment.
These constraints and other conditions prompted the authors to develop independently a system that met the client’s needs.
After the design and development, the system was used in a real context. From a technical point of view, we can say that the technology readiness level (TRL) achieved is “System prototype demonstration in operational environment”.
The implemented system was useful for inspections in over 1000 property units over the course of a few months. The system STATUS was used to carry out visual inspection on 96 buildings, including condominiums and townhouses.
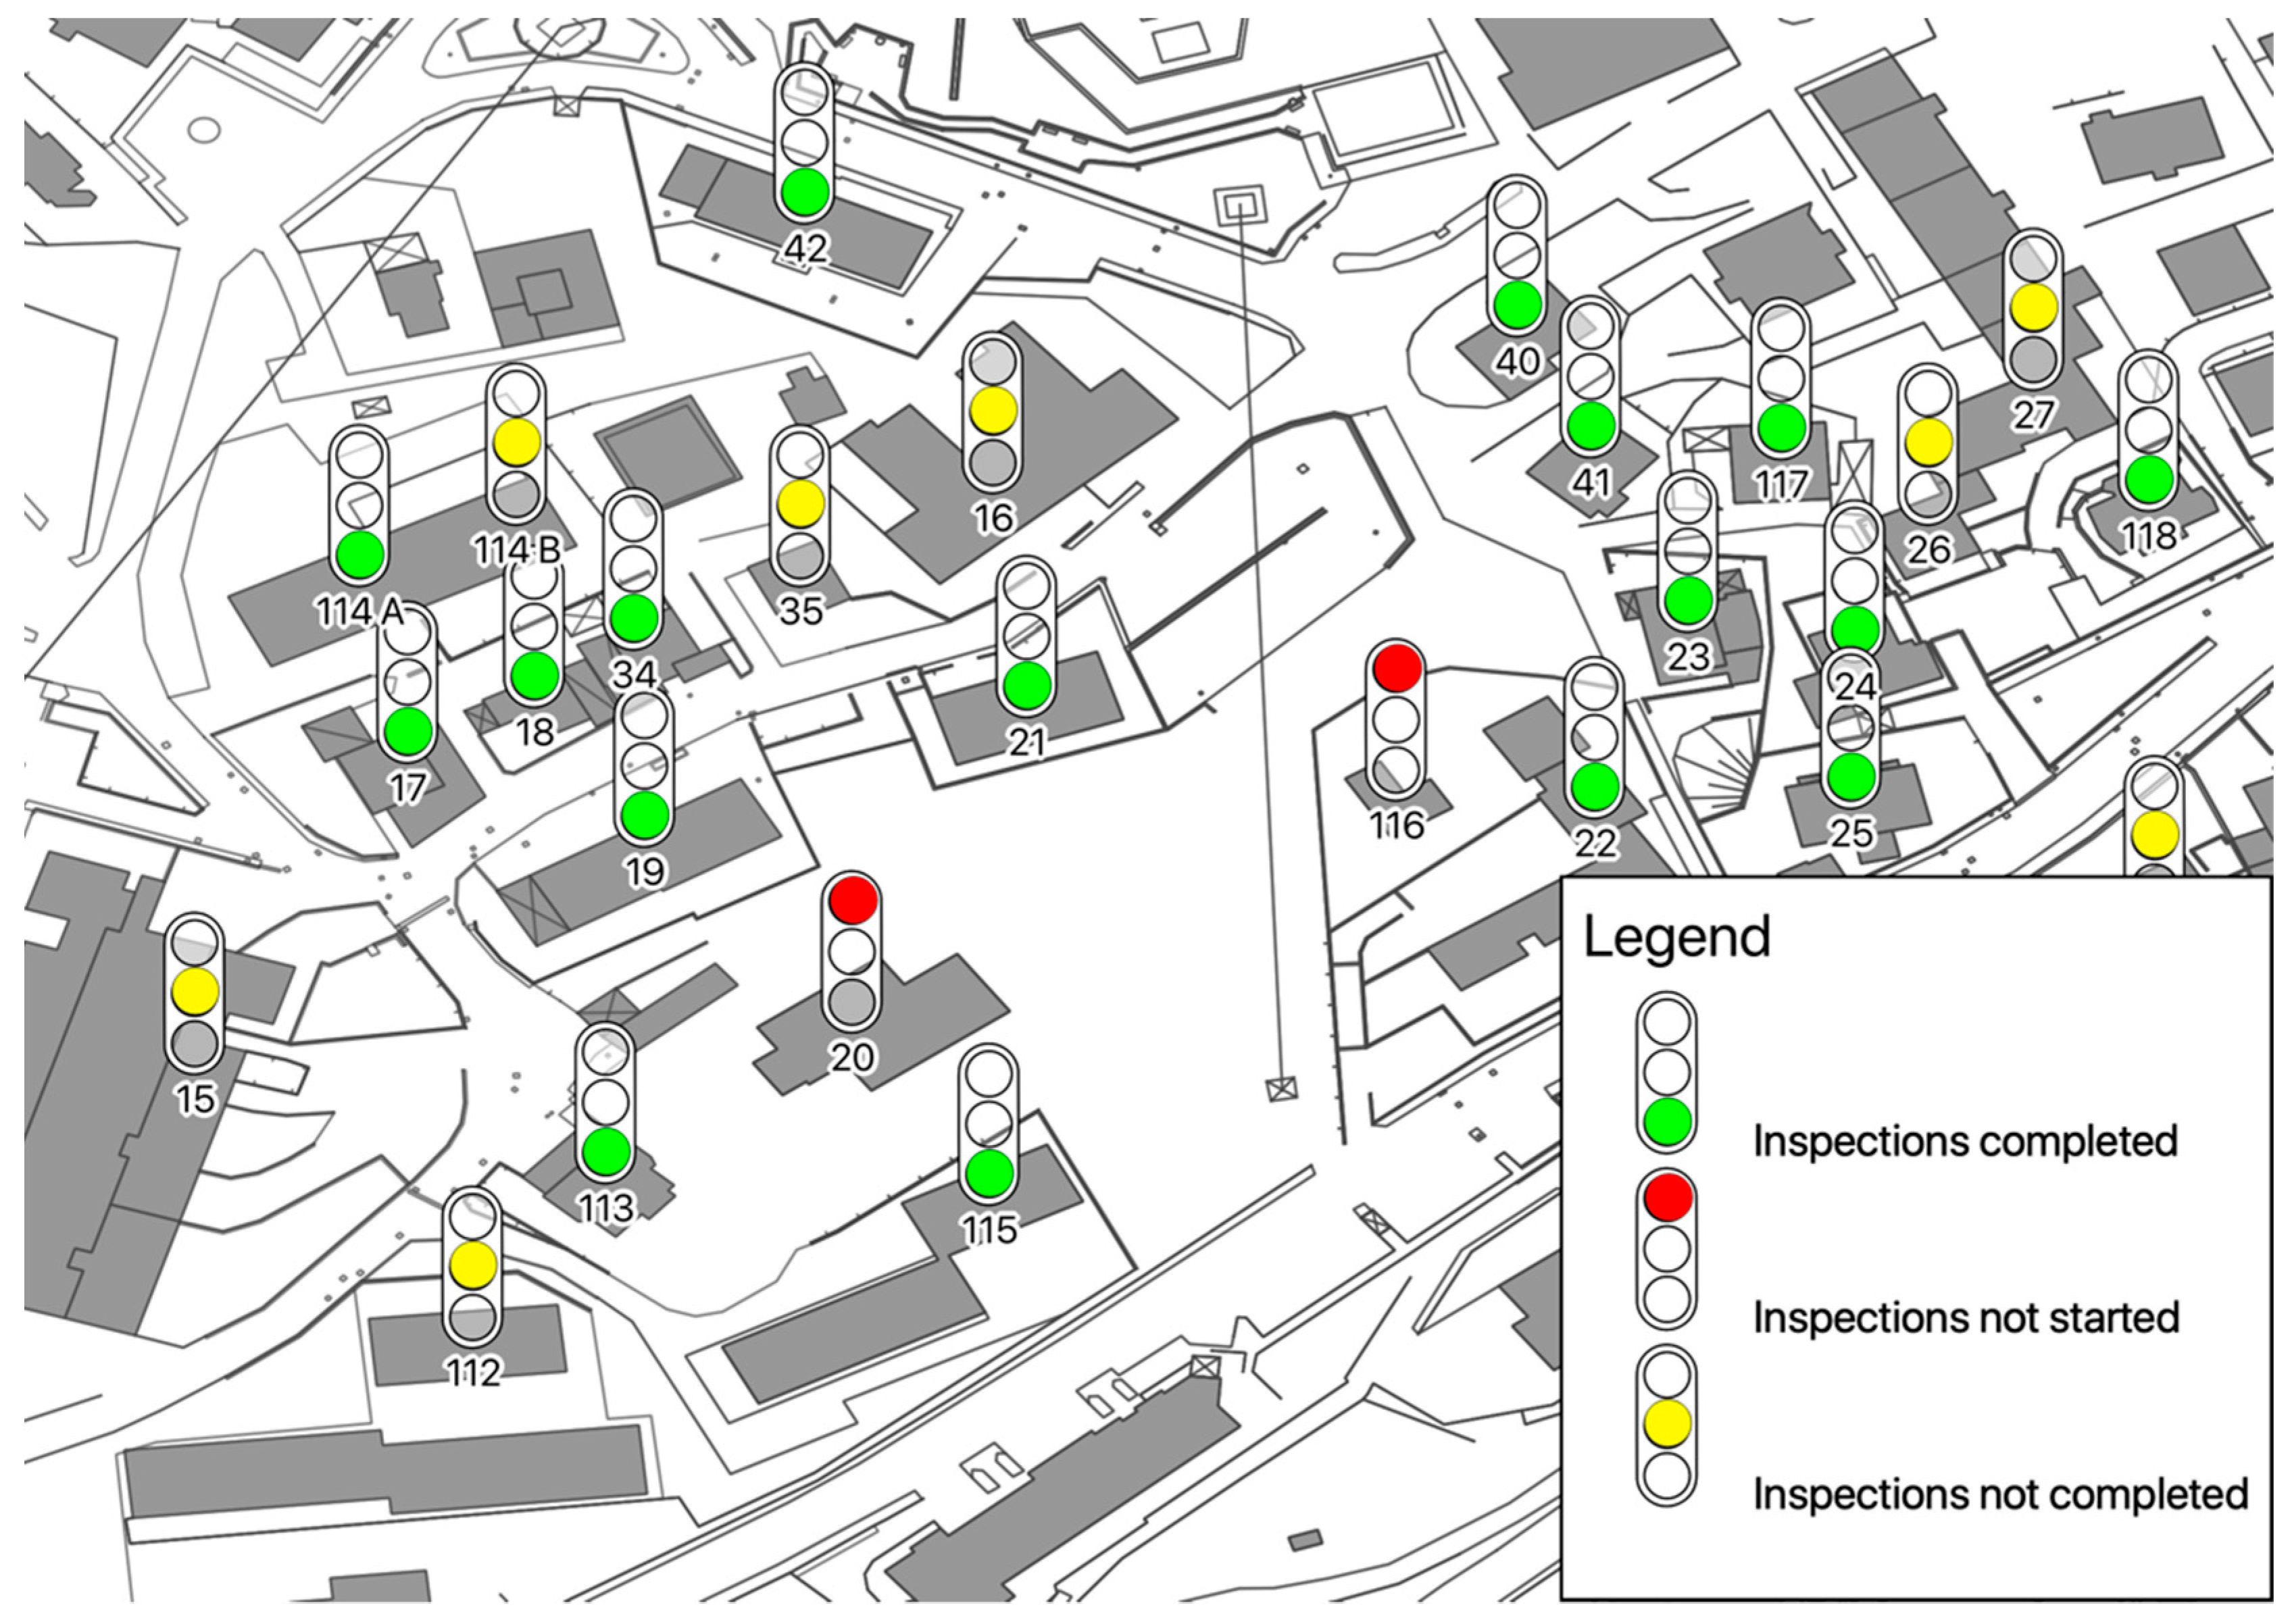
Figure 9 shows an example of the monitoring process of visual inspections. A building with a green traffic light icon indicates that all the properties inside were inspected; a building with a red traffic light icon indicates that none of the properties inside were inspected; a building with a yellow traffic light icon indicates that only some of the properties were inspected.
3. Results
3.1. STATUS App Applied to the Case History
The STATUS app allows optimizing time and cost-reducing errors that can be generated during the transfer of information from the paper to the laptop. Therefore, the system was developed mainly for economic reasons. As discussed in
Section 2.2, the main steps of the operations are four:
Determine a buffer zone,
Identify adjacent buildings,
Review buffers,
Detect, inspect, and generate property status reports.
For Steps 1, 2, and 3, the use of the STATUS app (designed and implemented ad hoc) does not affect the time, mode, and therefore costs. So, the effects of the use in these steps have not been considered.
For Step 4, on the other hand, the use of the STATUS app allows saving time and costs compared to a more traditional system.
In the case study, doubling of the Cefalù–Castelbuono railway line has been shown to save a considerable amount of time, human resources, and costs.
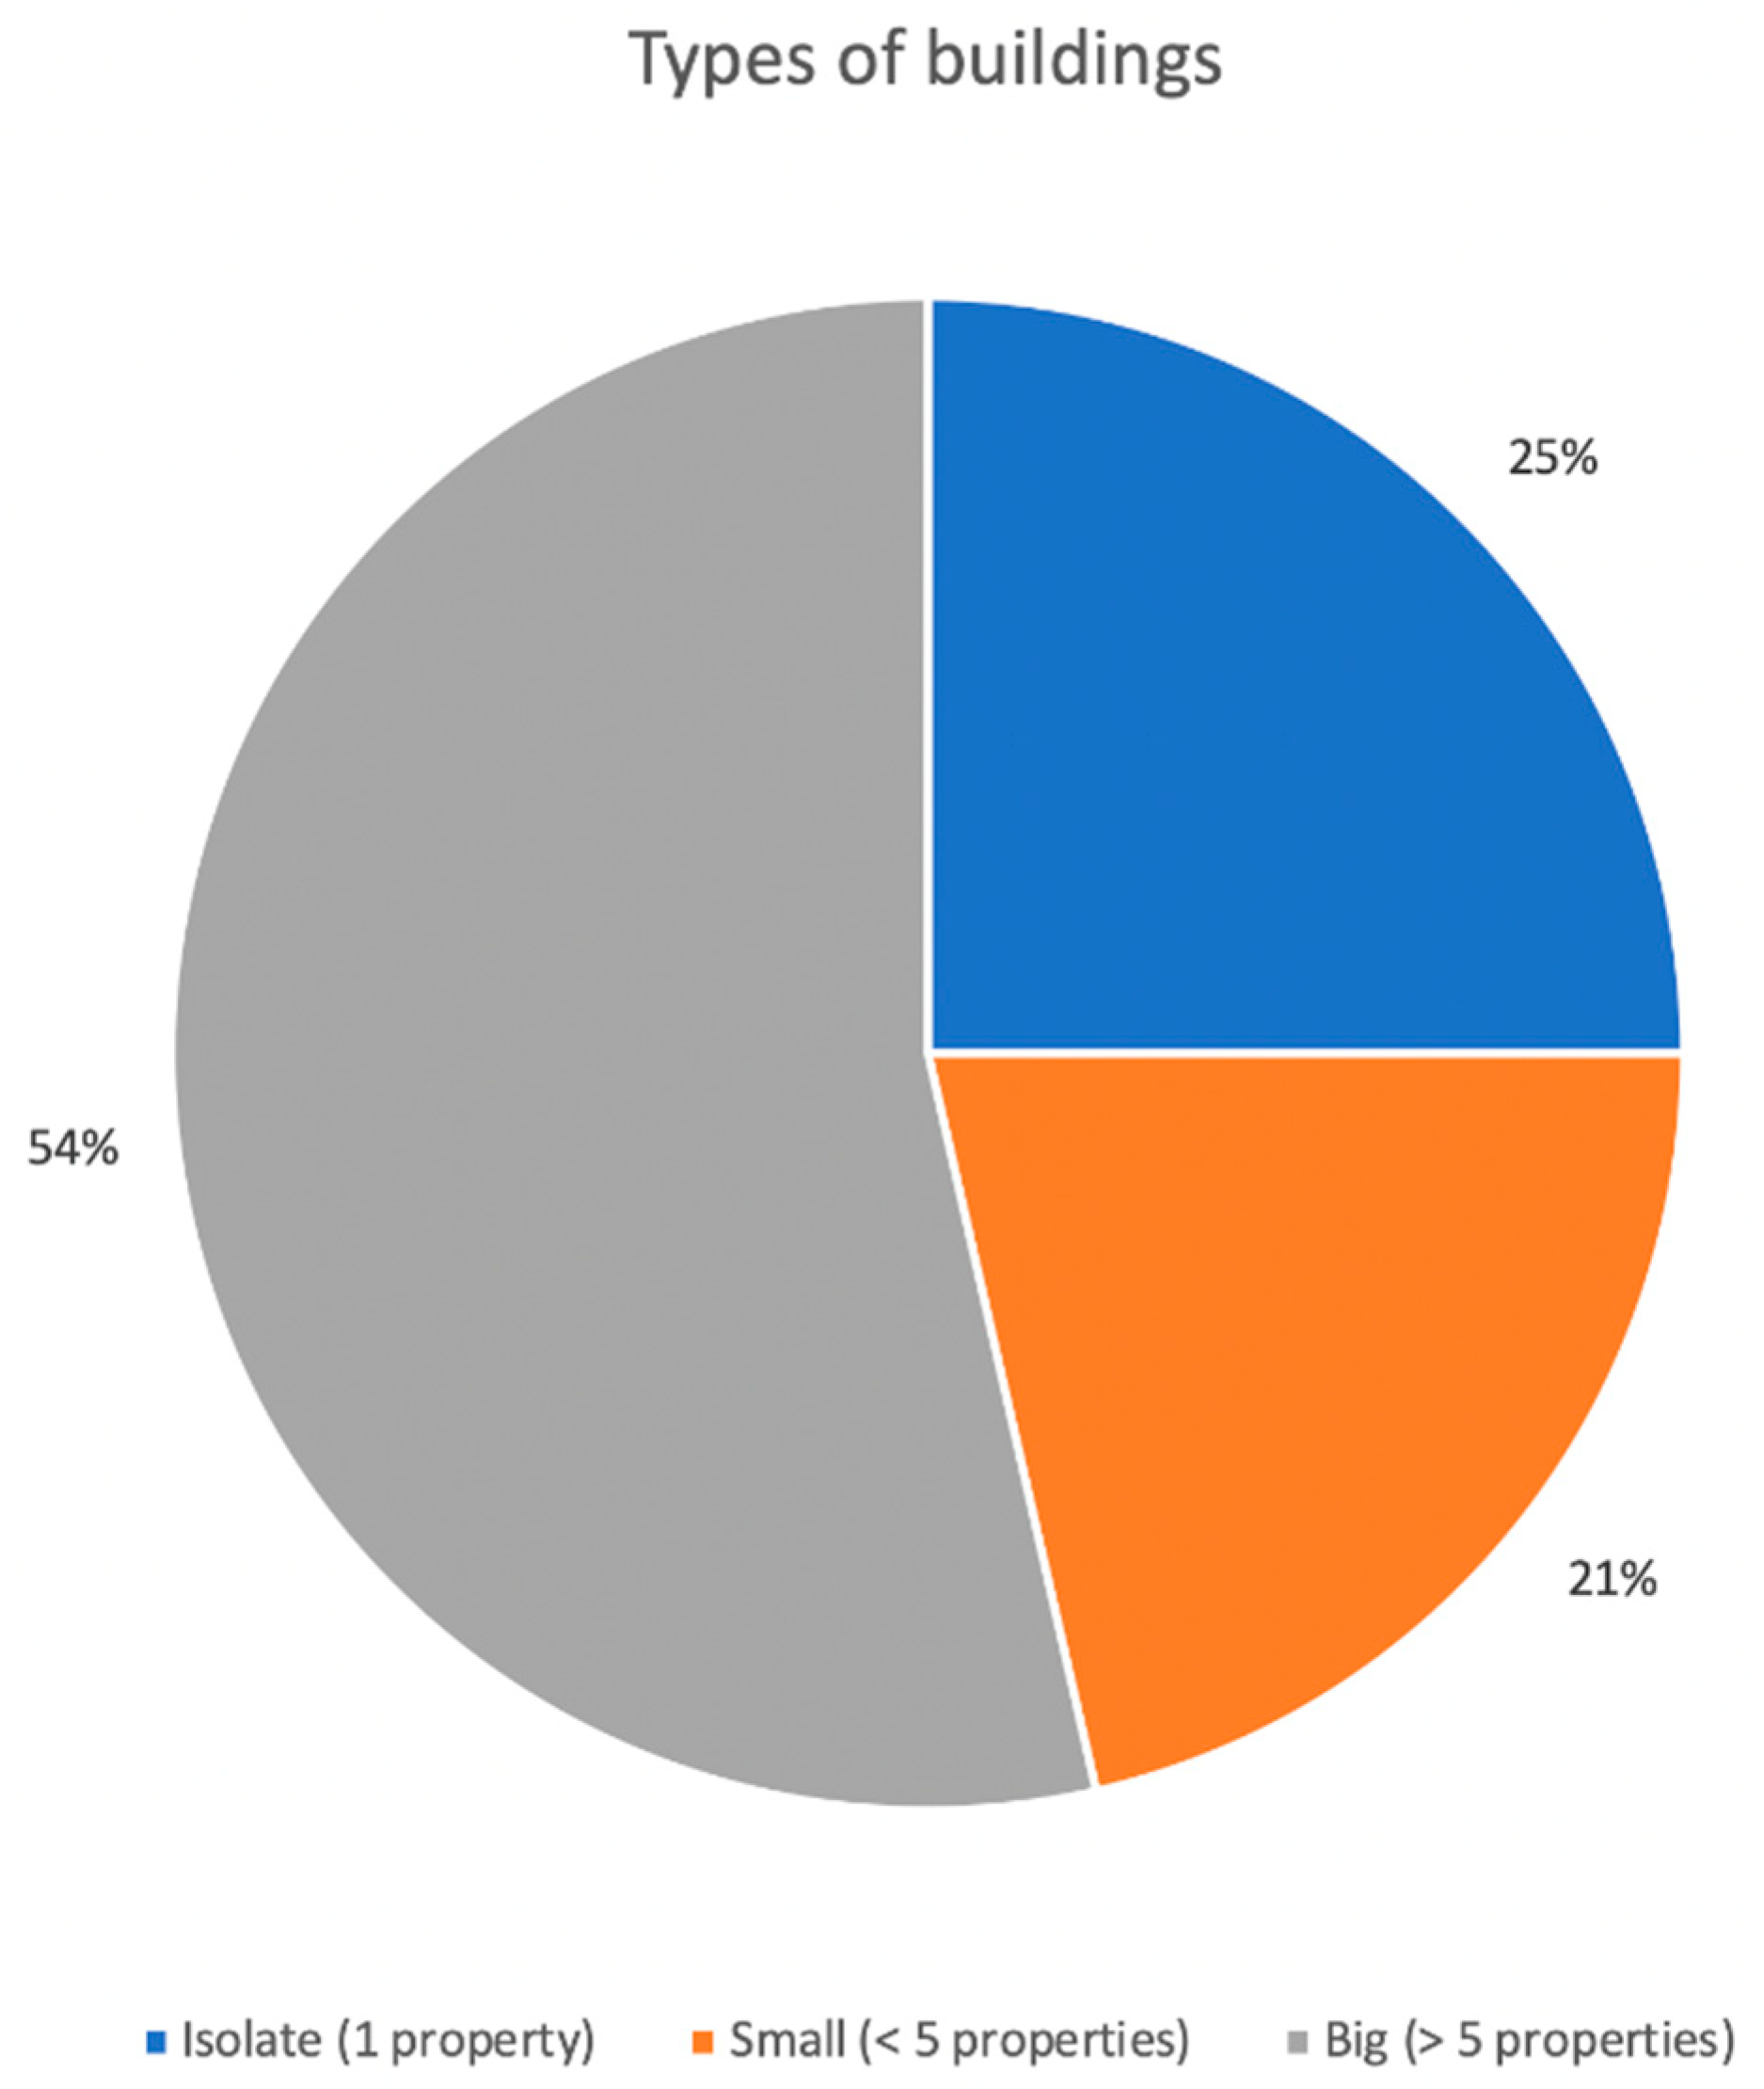
During Steps 1, 2, and 3, 94 buildings of different types were identified for inspection. Step 4 allowed identifying, inspecting, and generating reports on the status of 1189 property units within the 94 buildings.
Figure 10 shows the categorization of buildings according to the number of property units inside. One quarter (25%) of the buildings inspected were “isolated”, while 21% of the buildings were small (<5 property units), usually multi-family houses. Most of the buildings (54%) were small and large apartment blocks.
The inspections allowed finding different information: buildings dimension, identification of all elements (rooms), images, and damage identification. All these data were collected through the use of Android tablets in which the STATUS app was installed and configured.
For each inspection, it was necessary to agree access to the properties with the owners. Coordination activities for the access, traceability, and retrieval of documents were carried out over 6 months.
Figure 11 shows the progress of inspections over time (June–December 2015). The first month (June 2015) was dedicated to the preparation and scheduling of access by operators, and in the last days of the month, the first inspections were carried out.
In the next 5 months (from July to December 2015), technicians carried out 1189 inspections. For each inspection, they collected data on the damage existing before the beginning of construction site activities and drew up a report that they countersigned with the owners on site.
3.2. Comparison and Economic Benefits
The traditional equipment is configured as follows: camera, laptop with a word processor and database for data entry, and a portable wireless printer. With this equipment, a team of two operators can perform the tasks required for each inspection: control of the real estate unit, identification of existing damage, entry of all required data, writing and printing the report, delivery and signature to the owners of the property unit.
By using the STATUS system, the equipment only consists of an Android tablet with the STATUS app installed and a portable wireless printer.
Table 2 is an overview of the average time taken for the various tasks performed. As we can see, there is a time saving of 5 h 45 m per inspection compared to using of traditional mobile data collection. Similarly, we can assume that 10 operators would have been required for the operations carried out in Cefalù in the case described.
Thanks to the STATUS app, the work was carried out by only three operators with a minimum amount of equipment (tablet and printer). Using the system, the same work for 1189 inspections was carried out in 2680 h with a net saving of over 6500 h, corresponding to an economic benefit of over 250,000.00 euros. The process of sharing in real time and uploading data to GIS has allowed an instant sharing of work in progress with the customer and the simplification of the accounting process. To prevent legal disputes in Italy, the paper report with the state of the property in addition to the owners’ signature requires validation by a third party (court, public, or accredited authority). In all cases, the use of a digital signature and time stamp on the document was opted for through an accredited provider in Italy. This allowed further savings in time and resources compared to a traditional method that would have provided a paper stamping in three copies for each report.
As a result, the STATUS app led to an overall saving of almost €300,000.00 compared to traditional methods of detection and return.
3.3. Data Analysis
During the inspection operations, admin users monitored the progress of the activities through a specially designed QGIS project: a connection with the database and specific queries returned the status of completion of the inspections in real time, building by building (
Figure 10). In this way, it was possible to monitor the activities of the technicians who used the application in the field.
The QGIS project is connected to the MySQL database and automatically updates the following tables each time it started: “buildings”, “units”, “elements”, and “damage”.
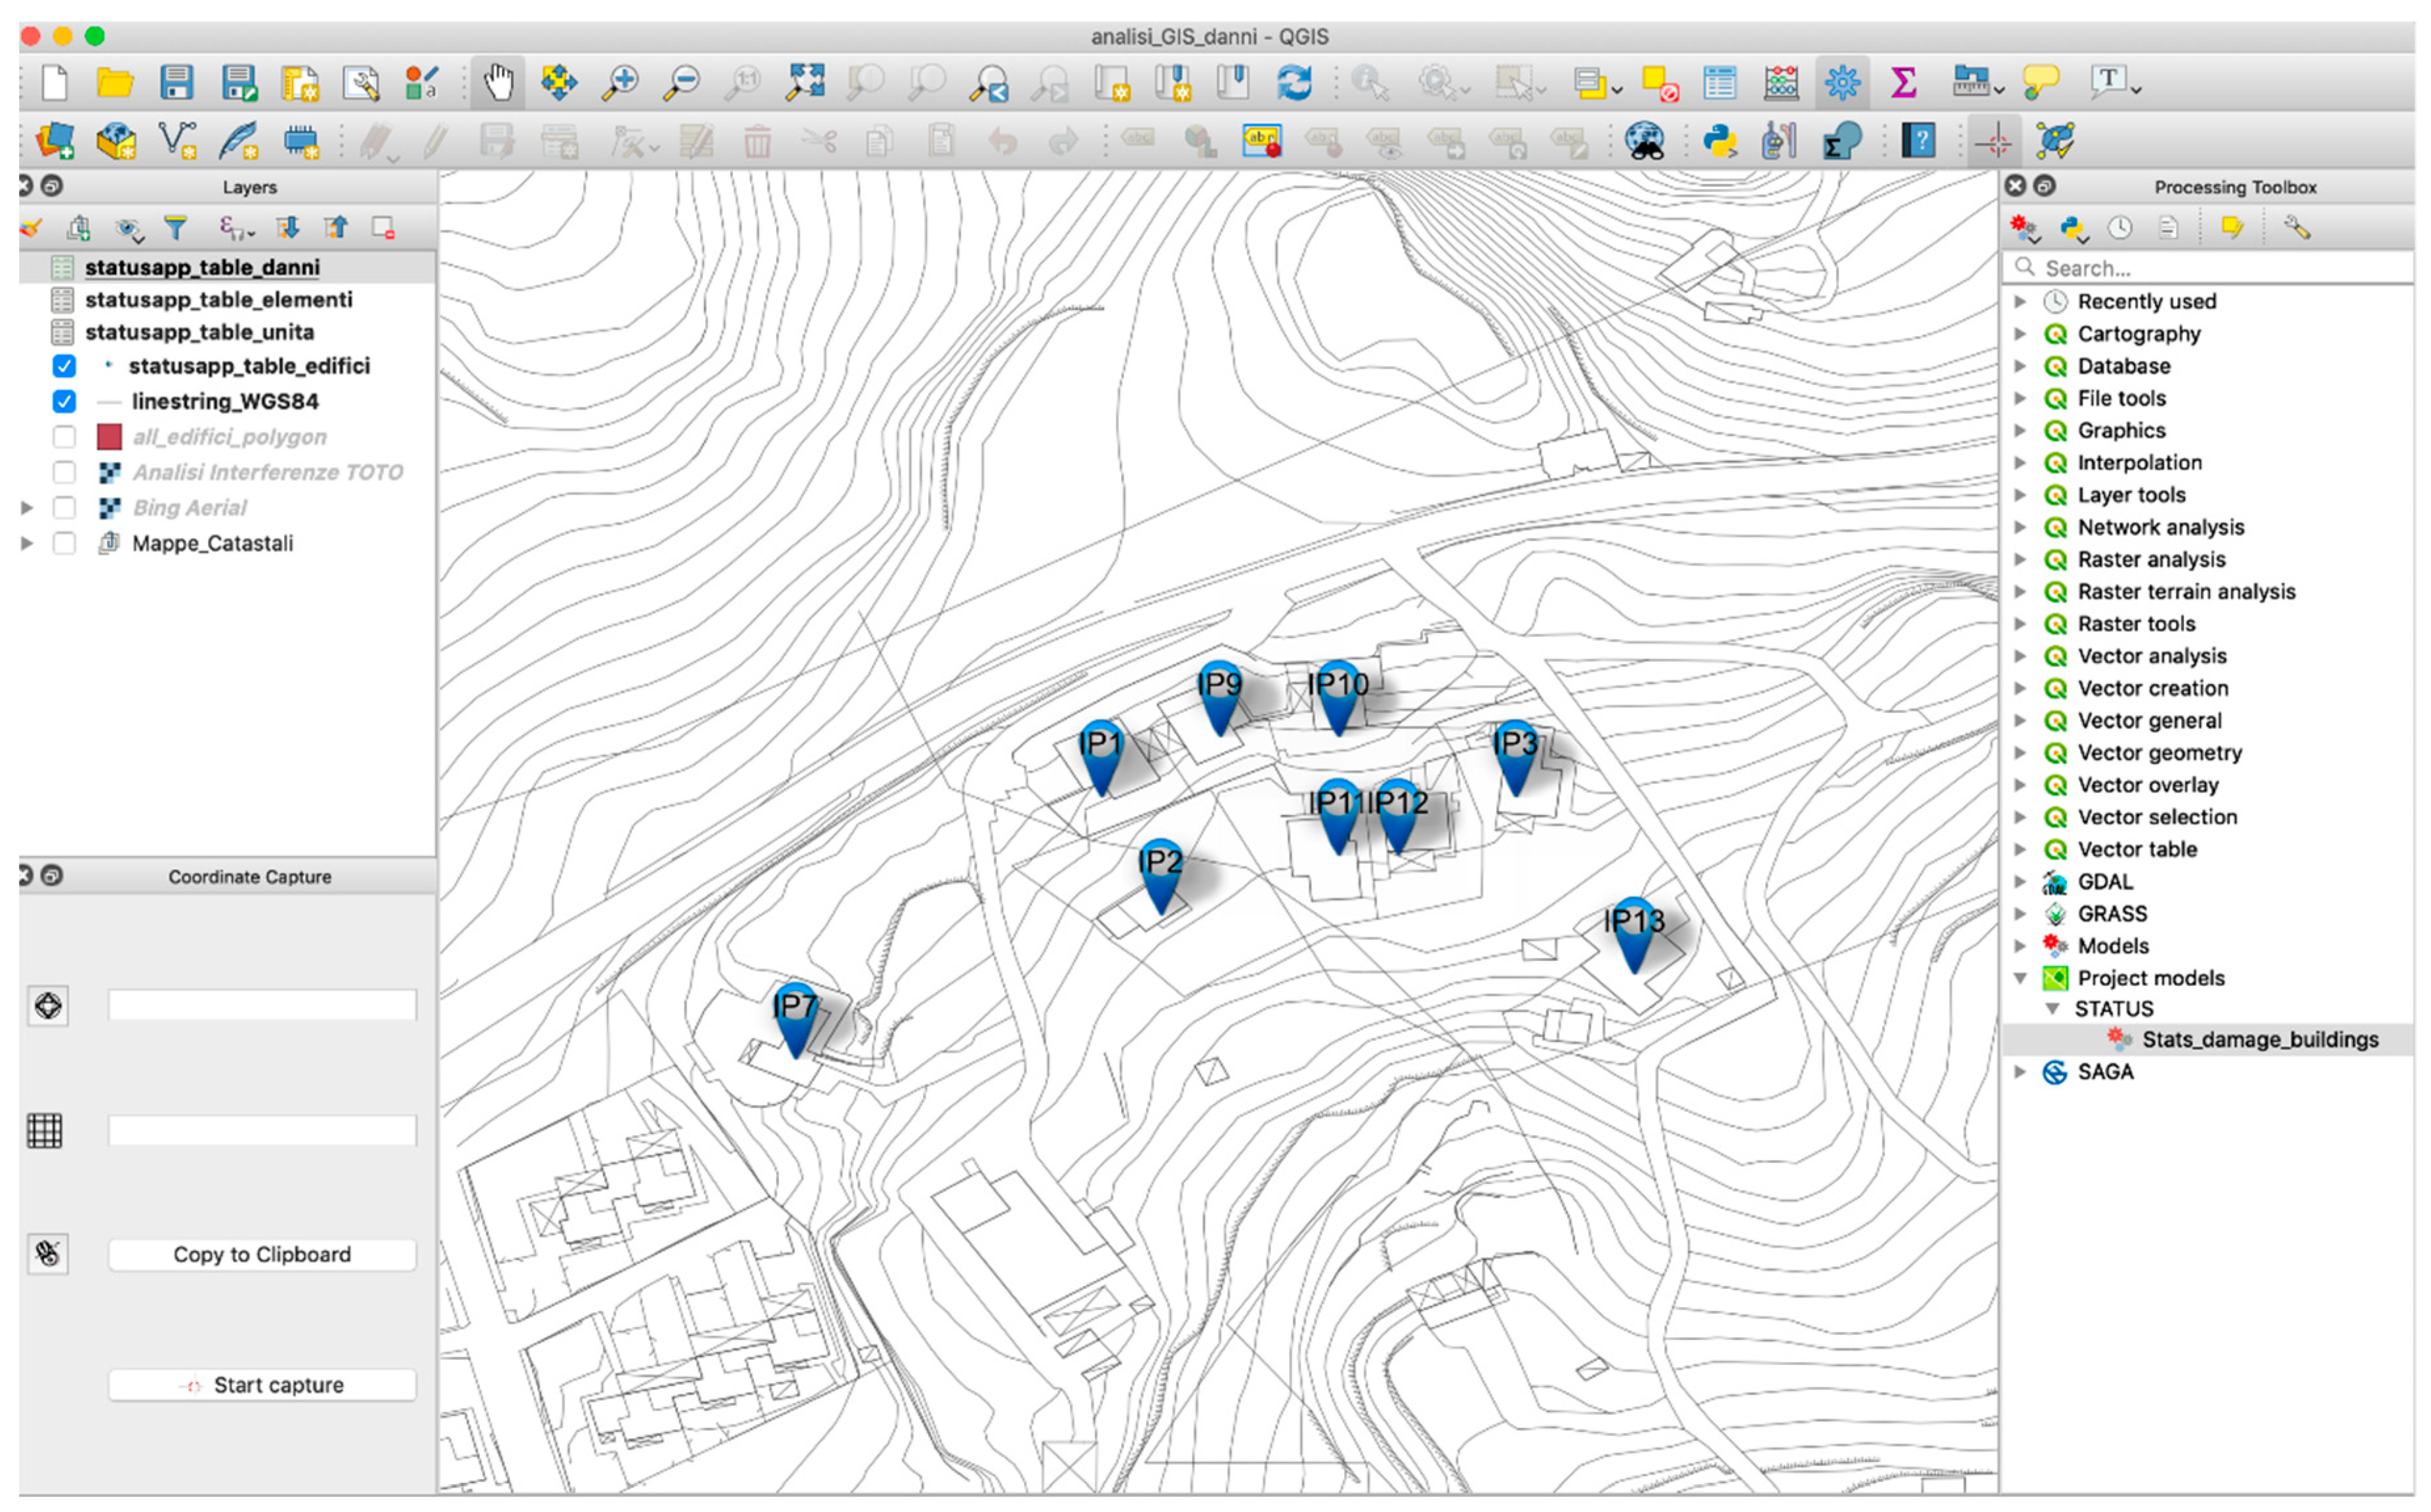
Thanks to the data collected, we could carry out spatial analyses. In particular, a script (
Figure 12) was implemented that executes algorithms within the QGIS software. The purpose of the script is to automatically create maps that represent the vulnerability of buildings as a result of inspections and collected data. Each building is classified for the damages identified by the users of the application. Subsequently, for each building, a quick assessment of the damage level is carried out. Finally, an output map with the analysis produced and the graphical clothing is processed.
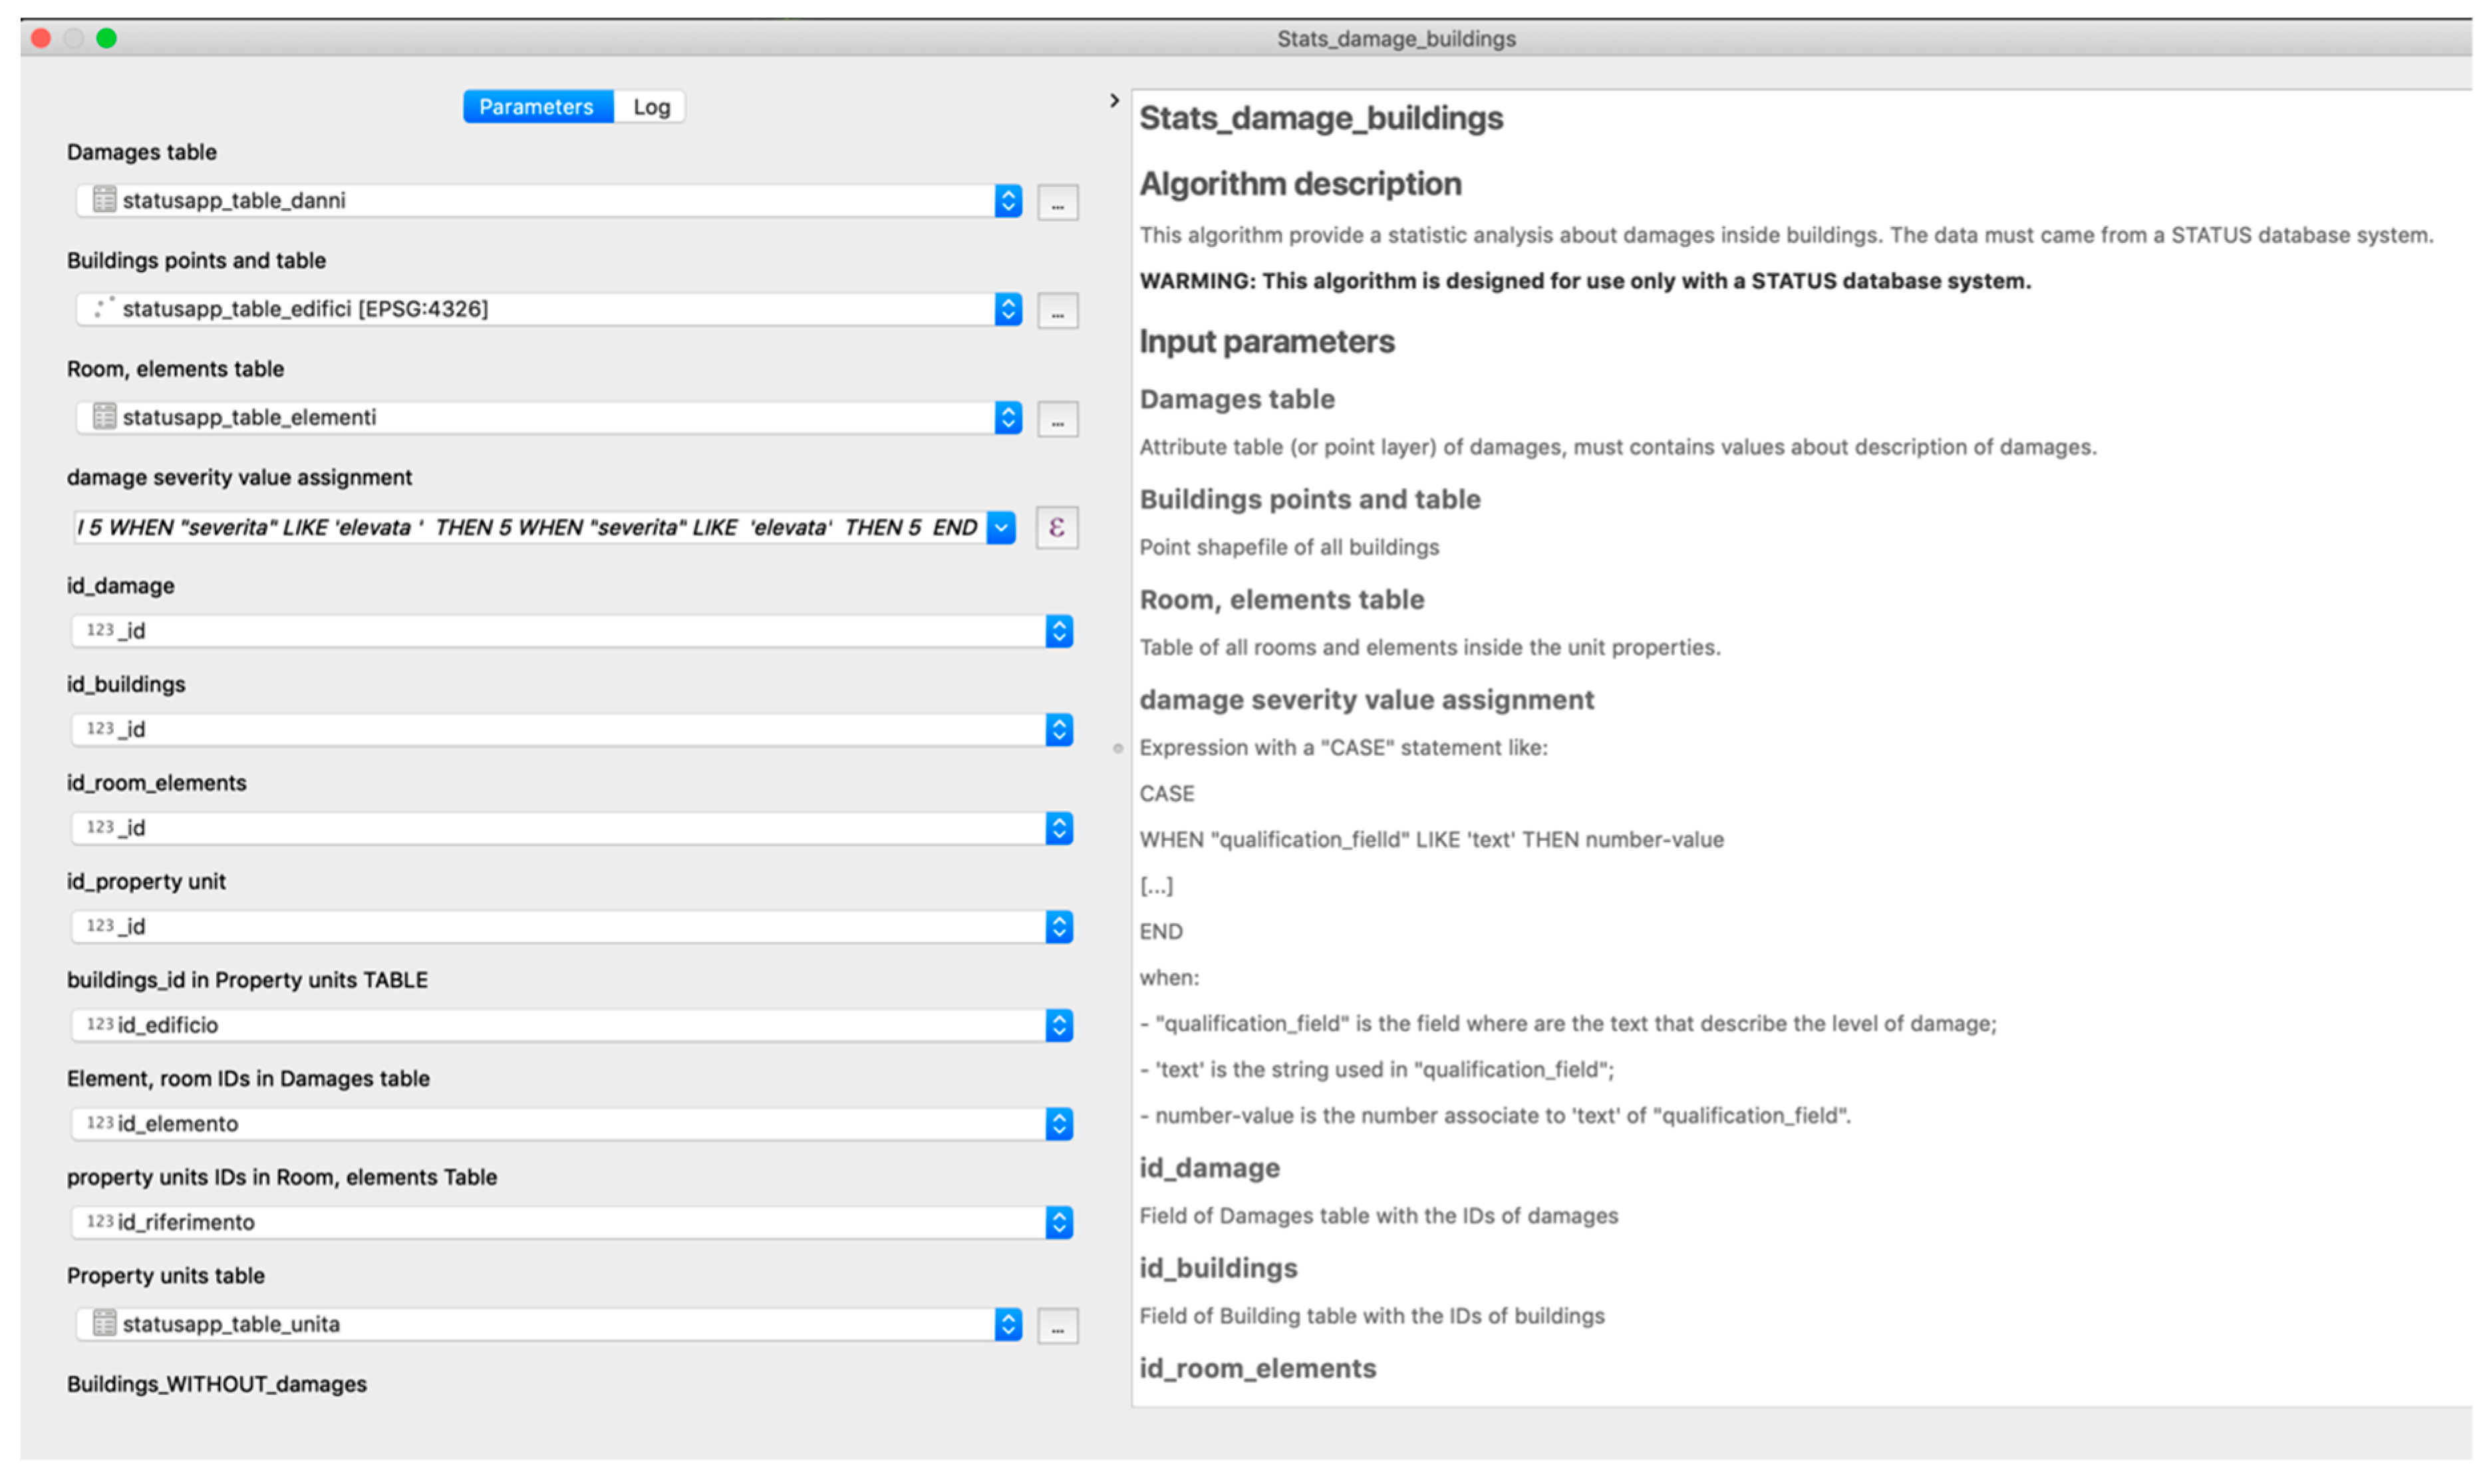
The script (see
Figure 13) allows setting a numerical value for each level of damage. For each property unit and building, a sum of the values obtained will be carried out. In this way, it is possible to classify and generate maps of the territory with buildings already damaged before the start of works. This information will be useful to reduce impacts and prevent further damage during tunnel excavation operations.
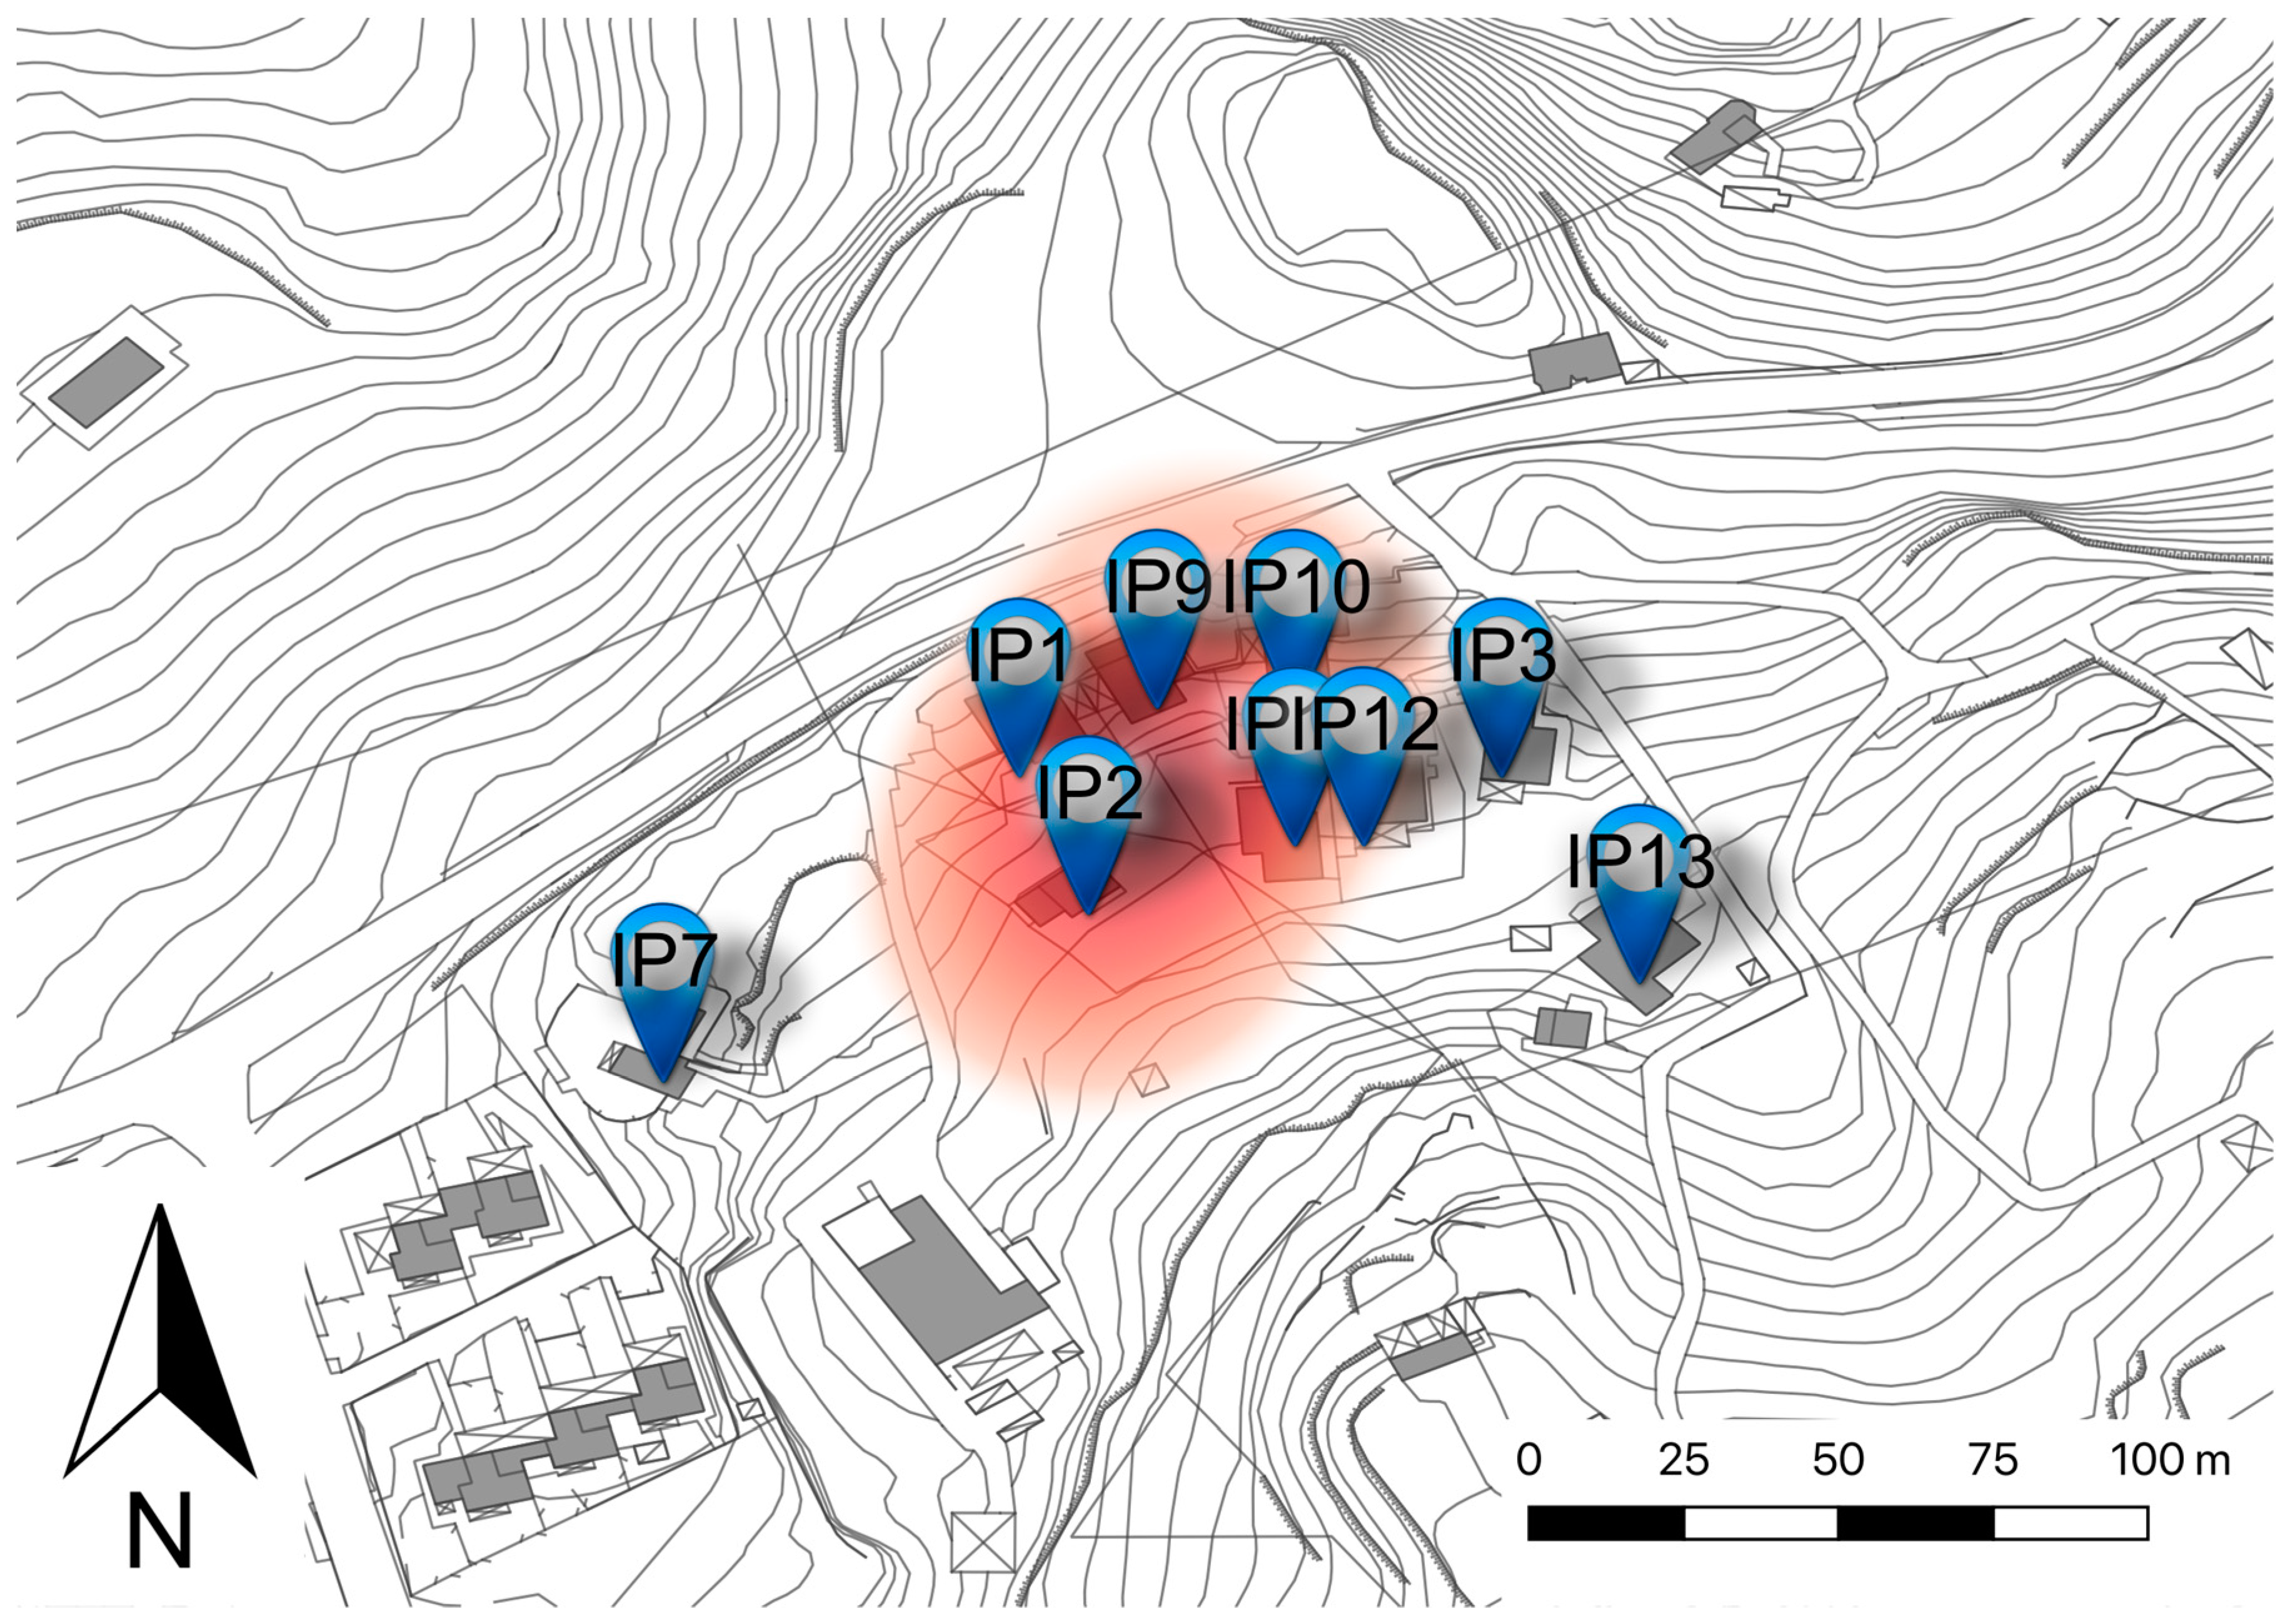
The system is complemented by reports that allow admin users to produce daily heatmaps of damages or vulnerabilities (
Figure 14).
The data collected do not allow determining with accuracy the benefits of the system at the territorial level. In fact, the system is not designed to analyze the territory but rather the buildings. Despite the large amount of data collected, the only analysis that can be performed refers to the existing damage detection.
The inspections carried out were not designed for a quantitative assessment of the damage, neither in structural nor in economic terms. Nevertheless, we can have a greater knowledge of the (hypothesized) vulnerability of the structures above the excavated tunnels.
The most important requirement for developers was to print the reports on site.
4. Discussion and Conclusions
This paper introduces a mobile data collection tool that can record the “health” status of buildings adjacent to construction sites before the beginning of construction works.
We designed the STATUS system specifically to assist technicians with visual inspections inside buildings that interfere with construction sites.
We successfully tested the STATUS system before the construction of a railway doubling in Cefalù (Italy) in 2016. It allowed the collection of data from over 1000 properties in a few months by a small number of expert teams, saving time and costs.
The geo-referenced dataset gave the project management the opportunity to analyze and assess correctly the most vulnerable territorial areas before the beginning of the operations. The technicians, assisted by STATUS solution, identified all the pre-existing damage in buildings within the buffer zones. At the end of the inspections and the successful loading of data in the system, property owners and technicians countersign reports (generated on site) to protect themselves from legal disputes due to the free-rider problem.
These operations, which are usually complex, were easily managed by a monitoring dashboard developed through a QGIS project that interfaced with the database. Whenever a user submitted data, the system updated the dashboard map, optimizing the decision-making processes and planning inspections within all the buildings concerned.
Future research developments concern both the architectural structure of the databases and the purpose of using the tool.
In the first case, the structure of the database can be improved by adopting other models of representation. We can choose entity–attribute–value model where the databases are made up of individual attributes, numerous tables, or categories that vary over time. In this model, the data are composed of a few dozen of records, or alternatively a relatively small number of tables, but with thousands or millions of rows or instances each. An alternative solution can be the adoption of databases where each record is stored as a document that has certain characteristics. In this case, we can add to the document any numbers of fields of any length, and the fields can contain even more data components.
The GIS analyses described can be a further implementation of studies using the STATUS system. These analyses can be implemented in a web interface; a WebGIS that displays in real time the results of the algorithms already developed. In this way, even users who are not experts on the use of the QGIS software could analyze the progress of the inspections.
At the current stage of development, the system is accessible only by a consulting contract for adaptation to a specific use case. At the moment, there is no dedicated commercial support, and it is not possible to say that the system is on the market, because the level of development would not allow a public release of the system at the moment.
In the case of an implementation with a view to commercial distribution, these aspects will have to be taken into account, and the investments will have to be carefully evaluated.

 ,
, 


