Article

Crime and Punishment—Crime Rates and Prison Population in Europe

by
Beata Gruszczyńska
1 and
Marek Gruszczyński
2,*
1
Department of Criminology and Criminal Policy, University of Warsaw, 00-927 Warszawa, Poland
2
Institute of Econometrics, SGH Warsaw School of Economics, 02-554 Warszawa, Poland
*
Author to whom correspondence should be addressed.
Laws 2023, 12(1), 19; https://doi.org/10.3390/laws12010019
Submission received: 11 November 2022 / Revised: 30 January 2023 / Accepted: 7 February 2023 / Published: 9 February 2023
(This article belongs to the Section Criminal Justice Issues)

Abstract

:
This paper presents an attempt at establishing an association between crime levels and prison populations across European countries. We observe that the situation in Central and Eastern European countries differs distinctly from the rest of Europe. Building on this, we offer justification that is methodologically based on correlations and regressions of country incarceration rates on crime rates, with reference to governance indicators. Our cross-sectional analysis uses data on crime and prisoner rates by offence from Eurostat and SPACE for the year 2018. The paper’s empirical analysis is preceded by a discussion of the challenges faced when attempting to compare crime between countries in Europe. A review of research focused on relationships between incarceration and crime follows, with the emphasis on the deterrence effect and the prison paradox. Typically, this stream of research uses microdata covering a single country or limited to a smaller geographic area. International comparisons are rare, and are usually based on time series and trend analyses. The quantitative approach applied here is based on recognizing two clusters of countries: the Central and Eastern European (CEE) cluster and the Western European (WE) cluster. We show that the observation of higher prisoner rates and lower crime rates for CEE countries is confirmed with regression analysis. Our study encompasses four types of offences: assault, rape, robbery, and theft. The final section of the paper presents an attempt to incorporate Worldwide Governance Indicators into the analysis of the association between incarceration and crime rates. The results confirm that crime rates in WE countries are distinctly higher than in CEE countries, while incarceration rates in WE are significantly lower than in CEE countries. We think this is due to a higher percentage of crimes being reported and the greater accuracy of police statistics in WE countries. The prison population in each country is largely determined by its criminal and penal policies, which differ substantially between CEE and WE countries (e.g., in terms of frequency of imposing prison sentences and the length of imprisonment). These tendencies result in higher incarceration rates in CEE countries, despite lower crime rates when compared to WE countries.

1. Introduction

The motivation for this study originated with our paper dedicated to Professor Martin Killias on the occasion of his 65th birthday (Gruszczyńska and Gruszczyński 2013). In that paper we discussed the question of how the prison population relates to recorded crime. We showed how the rates of incarceration and crime differ substantially between Central and Eastern European (CEE) countries and other countries in Europe—subsequently referred to as Western Europe or WE. That presentation was based on data from 2009, while here we revisit the issue by examining data for 2018. The analysis has been expanded into types of crime, as well as an attempt to examine how country governance relates to the link between prison rates and crime rates. This paper is organized as follows. In Section 2 we present the sources of crime statistics in Europe, the challenges in comparing crime and imprisonment data between countries, as well as a review of previous research, emphasizing the topics of deterrence effect and prison paradox. Section 3 presents the data. Section 4 begins with the graphic comparison of 2018 data on European countries in terms of incarceration rates and crime rates. Next, we introduce regression modelling, including the separate cluster of CEE countries. Section 5 presents the effect of including the Worldwide Governance Indicators chosen to represent variables defining country level governance in Europe. Section 6 is the conclusion.

2. Prison Rates vs. Crime Rates: Previous Research and the Challenges of Comparing Crime Internationally

2.1. Deterrence Effect and Prison Paradox

Numerous publications have tackled the challenge of relating countries’ prison rates to crime rates (or the reverse). Most research concentrates on single countries such as the USA and the analysis of time series. A good example is the influential paper by Levitt (1996) in which the author estimated the elasticity of crime with respect to prisoner populations for the USA. Using annual state-level data from 1972–1993 (a total of 1063 observations), he applied an instrumental variable panel regression with the instrument representing overcrowding litigation in each state, in order to overcome the simultaneity between prisoner populations and crime rates. The result shows negative insignificant association between the lagged prison variable and the current crime variable: the reduction in the number of prisoners is associated with the increases in crime.
The research debated here may be linked to broader questions of deterrence theories. The general idea is that “if state-imposed sanctions are sufficiently severe, criminal activity will be discouraged, at least for some; severity alone, however, cannot deter; there must also be some probability that the sanction will be incurred if the crime is committed” (Beccaria [1764] 2007; Travis et al. 2014). These issues have been present in criminological debate for many years. We highlight here the work of Killias (1986) and numerous references in the paper by Greenberg (2002).
The “deterrence effect” is confronted by the “prison paradox” that is clearly seen in the USA. Stemen (2017) points out that “…increasing incarceration rates has a minimal impact on reducing crime and entails significant costs”. And more: “Increases in incarceration rates have a small impact on crime rates and each additional increase in incarceration rates has a smaller impact on crime rates than previous increases. Any crime reduction benefits of incarceration are limited to property crime. Research consistently shows that higher incarceration rates are not associated with lower violent crime rates. Incarceration may increase crime in certain circumstances. In states with high incarceration rates and neighborhoods with concentrated incarceration, the increased use of incarceration may be associated with increased crime. Incarceration is expensive. The United States is spending heavily on jails and prisons and under-investing in less expensive, more effective ways to reduce and prevent crime” (Stemen 2017).
Today, a large part of research in criminology focuses on various aspects of crime vs. incarceration. One example is the study of Nieuwbeerta et al. (2009) on the effect of imprisonment on subsequent criminality in The Netherlands. Using microdata and matched samples, that study found that first-time imprisonment is associated with an increase in criminal activity within three years of release. Similarly, Mitchell et al. (2016) used the regression discontinuity approach (to account for selection bias) on a cohort of criminal offenders in Florida. In that case, “results suggest that prison, as compared to non-incarcerative sanctions, has no appreciable impact on recidivism”.
In an attempt to specify the relationship between crime and prisons, Spelman (2008) shows how time series analysis methodology may accommodate “the crime equation” for US panel data for the 1971–1989 period. Both “crime” and “prisons” variables were found to be nonstationary and not co-integrated. In another paper, Spelman (2013) used annual panel data from the 50 US states covering 1977–2009. With a specific approach to address simultaneity between crime rates and prison rates, the author estimated the effect of prison on crime, using OLS panel regressions with a number of control and instrumental variables. Other country-wide research by Spelman (2017) also employed panel data, for US cities for 1970–2013 and shows that lagged crime rates are good predictors for police staffing and current crime rate variables.
Lofstrom and Raphael (2016) examined the relationship between incarceration and crime in California counties using panel data. Their primary model was the regression of crime change on changes in the state prison incarceration rate and the county jail incarceration rate, both before and after the so-called “Corrections Realignment” arising from California’s reform legislation in 2011. That legislation eliminated the practice of returning parolees to state prison for technical parole violations—except for the most serious offenders. County jails were designated as places to serve sentences for nonserious offences. The results show “very little evidence that the large reduction in California’s incarceration rate had an effect on violent crime and modest evidence of effects on property crime”.
Nagin and Snodgrass (2013) estimated the effect of incarceration on post-release criminality—for individual data on six thousand offenders convicted of a criminal offense in Pennsylvania in 1999. Reoffending was measured by the re-arrest rates at points one, two, five and ten years after release. Another example of the use of microdata is the research of Clear et al. (2014) on “prison cycling”. Using US data for Boston, Newark, and Trenton. they attempted to determine the “impact of prison cycling—that is, removing people from the community into prison and then, sometime later, returning them to the community—on crime rates”.

2.2. Methodological Issues

As seen in the examples presented in Section 2.1, studies into an association between “crime” and “punishment” that are quantitatively oriented mostly use regression-econometric methods. The data are either aggregates—such as crime rates—or sets of microdata—for example, on individual offenders. The methods applied depend on the quality and availability of data. All major approaches, both classical and modern, are present in this research stream: linear regression and time series analysis, panel models, instrumental variables, matching, natural experiments, and other modern techniques.
One issue in examining the relationship between data on crime and data on incarceration is the possibility of including additional variables (controls, instruments) into the research frame. For example, the poverty rate in California counties is present in one additional regression in Lofstrom and Raphael (2016), but not in the primary model. With annual panel data on the 50 US states from 1971 to 1993, Levitt (1996) used variables including income per capita, the unemployment rate, the number of police employees, the percentage of the black population, and the percentage living in metro areas. Spelman (2013) also has panel data (for the 50 US states over 30 years) and additional variables representing economic conditions, underclass and high-risk, failing institutions, criminal opportunities, partisan politics, state spending, prison crowding, sentencing policy, and crime control. In their microdata study, Nieuwbeerta et al. (2009) used additional variables such as marriage, children, and social demographics. Mitchell et al. (2016) also operated on microdata and used variables such as age, race, and gender.
Another problem appears when we have complete data on all units of the population (i.e., no sampling is implemented). The 50 US states comprise the entire population of the USA. While there is sometimes doubt whether statistical tests can be applied when data cover the entire population, the answer is not straightforward. If we have the “entire population” and we estimate one of its parameters (e.g., the average value of some variable), then the only errors are measurement errors. However, even the simplest regression will include some “error in equation” represented by random disturbance (on the right-hand side of the model). Therefore, statistical inference about the model—about its parameters—should take this into account (Gruszczyński 2020, p. 14)1. In addition to this reasoning, it is important to bear in mind that the use of statistical significance is strongly discouraged by the scientific community (see, e.g., Amrhein et al. 2019).
One additional comment. Most studies that address the relationship between crime and incarceration quantitatively have been performed on data from the USA, both aggregate and microdata. Similar research for the countries in Europe is rare—especially with aggregate data.

2.3. Comparing Crime Internationally

Researchers rarely attempt to compare international data on crime and prison rates. This hesitancy stems from one major shortcoming—international statistics on crime and imprisonment are far from consistent as countries differ in many respects: in definitions of crime, in its extent, in judiciary details surrounding imprisonment, among many other aspects. Generally, differences between countries pose a challenge when one tries to compare raw data in any category. This is especially true among the social sciences, including the law and criminology.
Why is comparing crime statistics between countries challenging? It is because countries differ with respect to their penal code, penal procedures, and data collection methodology. At variance also are the definitions of offences, multiple offences, continuous offending, age of perpetrator, and serious offences vs. petty crimes, among others. It is understood that imprisonment data are more reliable than crime data, and that crime levels from official statistics are lower than those estimated from victimization data (Van Dijk et al. 2007). The harmonization of national judicial system definitions is always problematic and, therefore, inter-country statistics rely on metadata.
Efforts within the Council of Europe resulted in a sort of data unification that may serve as a starting point for further analyses. In this regard, an invaluable role has been played by the European Sourcebook of Crime and Criminal Justice Statistics project (see e.g., Aebi et al. 2010, 2012, 2014). Other primary sources of criminal statistics in Europe are:
  • Eurostat—collects data on crime and prison population annually.
  • CEPEJ: European Judicial Systems, Council of Europe—published annually.
  • National crime statistics.
  • UNODC: United Nations Office on Drugs and Crime.
Attempts at examining the relationship between prison population rates and crime rates for the countries in Europe are rare. Aebi and Kuhn (2000) “show that crime rate is absolutely not correlated with the prisoner rate” and “there are some indications suggesting that these results could be different from one type of offence to another” (quotations from the abstract). The authors found that prisoner rates were correlated with the rates of homicide. Aebi et al. (2015) in the paper entitled “Is There a Relationship Between Imprisonment and Crime in Western Europe?” show that during 1982–2011 prison population rates rose until 2005 and then stabilized. On the other hand, incarceration rates have decreased since 1987—mostly due to an increase in the average length of detention. The authors cast doubt on the “hypothesis of total independence between crime trends and imprisonment rates”.
The international comparison of crime and incarceration attempted in our paper makes use of aggregate crime rates and prison rates for individual countries. We accepted these data as reported in EU statistics, with the assumption that the numbers are comparable in terms of definitions, legal base, and collection technique. This assumption may not be fully valid and, therefore, our results may be subject to criticism. Obviously, all results that utilize international crime statistics are always subject to limitations, as addressed in previous paragraphs. Harrendorf (2018), who presents a detailed view on comparing crime data internationally, advocates the use of “the indicators expressed as ratios of different system-based values,” as well as “crime trends” and “carefully built country clusters”.
The country clusters mentioned in the previous sentence are the starting point for our research. We propose two major clusters for the countries of the European Union, following on research into international justice data presented by Smit et al. (2008). Those authors used principal component analysis to find the country groups (clusters) that are “similar” in terms of several crime and justice variables (rates) as well as geographical, cultural, and political characteristics—27 variables in total. For our analysis, the clusters found by Smit et al. (2008) are2: (1) “East”—countries that were formerly Soviet states, (2) “Central”—“countries in transition,” that is, countries in the Soviet Union’s sphere of influence before the 1990s, excluding the former Yugoslavian countries, (3) “North/West” countries and (4) “South” countries—the latter two clusters selected on geographical bases only3.
In our analysis, we consider only European countries and, therefore, we propose two groups (clusters) of countries: the CEE countries and Western Europe; both groups in a sense coinciding with the findings of Smit et al. (2008).

3. Data and Variables

In this paper, we use data on crime and incarcerations in Europe and demonstrate how the countries of Western Europe (WE) and those of Central and Eastern Europe (CEE) differ substantially.
Our research is focused on 2018. We examine the association between crime rates in 2018 (CR) and prison rates (PR) as of 31 January 2019 for European countries. Considering the issue of simultaneity of the CR and PR relationship, we introduce other variables that may moderate the problem of endogeneity in the relationship of CR and PR.
The data source for country crime levels and rates in 2018 is Eurostat statistics: “Recorded offences by offence category—police data [CRIM_OFF_CAT]”. Offence categories are defined by ICCS (the International Classification of Crime for Statistical Purposes). The country numbers of sentenced prisoners by offence (as of 31 January 2019) are taken from the report on SPACE I—2019 (Aebi and Tiago 2020).
Using European country data for 2018, we considered the CEE countries separately from the WE countries as listed below. We selected four types of offences and regressed the prisoner rate on crime rate for each offence separately, with the dummy variable representing the CEE countries. The offence types are:
  • assault
  • rape
  • robbery
  • theft
This exercise is followed by investigating whether some indicators of country governance represent possible explanations as to why the CEE and the WE countries differ.
Countries included in the dataset are:
A—CEE countries: Bulgaria, Estonia, Croatia, Latvia, Lithuania, Hungary, Poland, Romania, Slovenia, and Slovakia; no data for the Czech Republic
B—WE countries: Denmark, Germany, Ireland, Spain, France, Italy, Cyprus, Luxembourg, The Netherlands, Portugal, Finland, Sweden, England and Wales, Northern Ireland, Iceland, Norway, and Switzerland; only offence data available for Greece, Austria, Liechtenstein, and Scotland; no data for Belgium or Malta.
All observations cover these European countries for one year. The major variables are Y = prisoner (incarceration) rate for a country, and X = crime rate for a country. Rates are calculated for 100,000 inhabitants and pertain to four types of offences: assault, rape, robbery, and theft. Country data are not available for some offences; therefore, the numbers of observations for a given sentence vary across both variables Y and X.

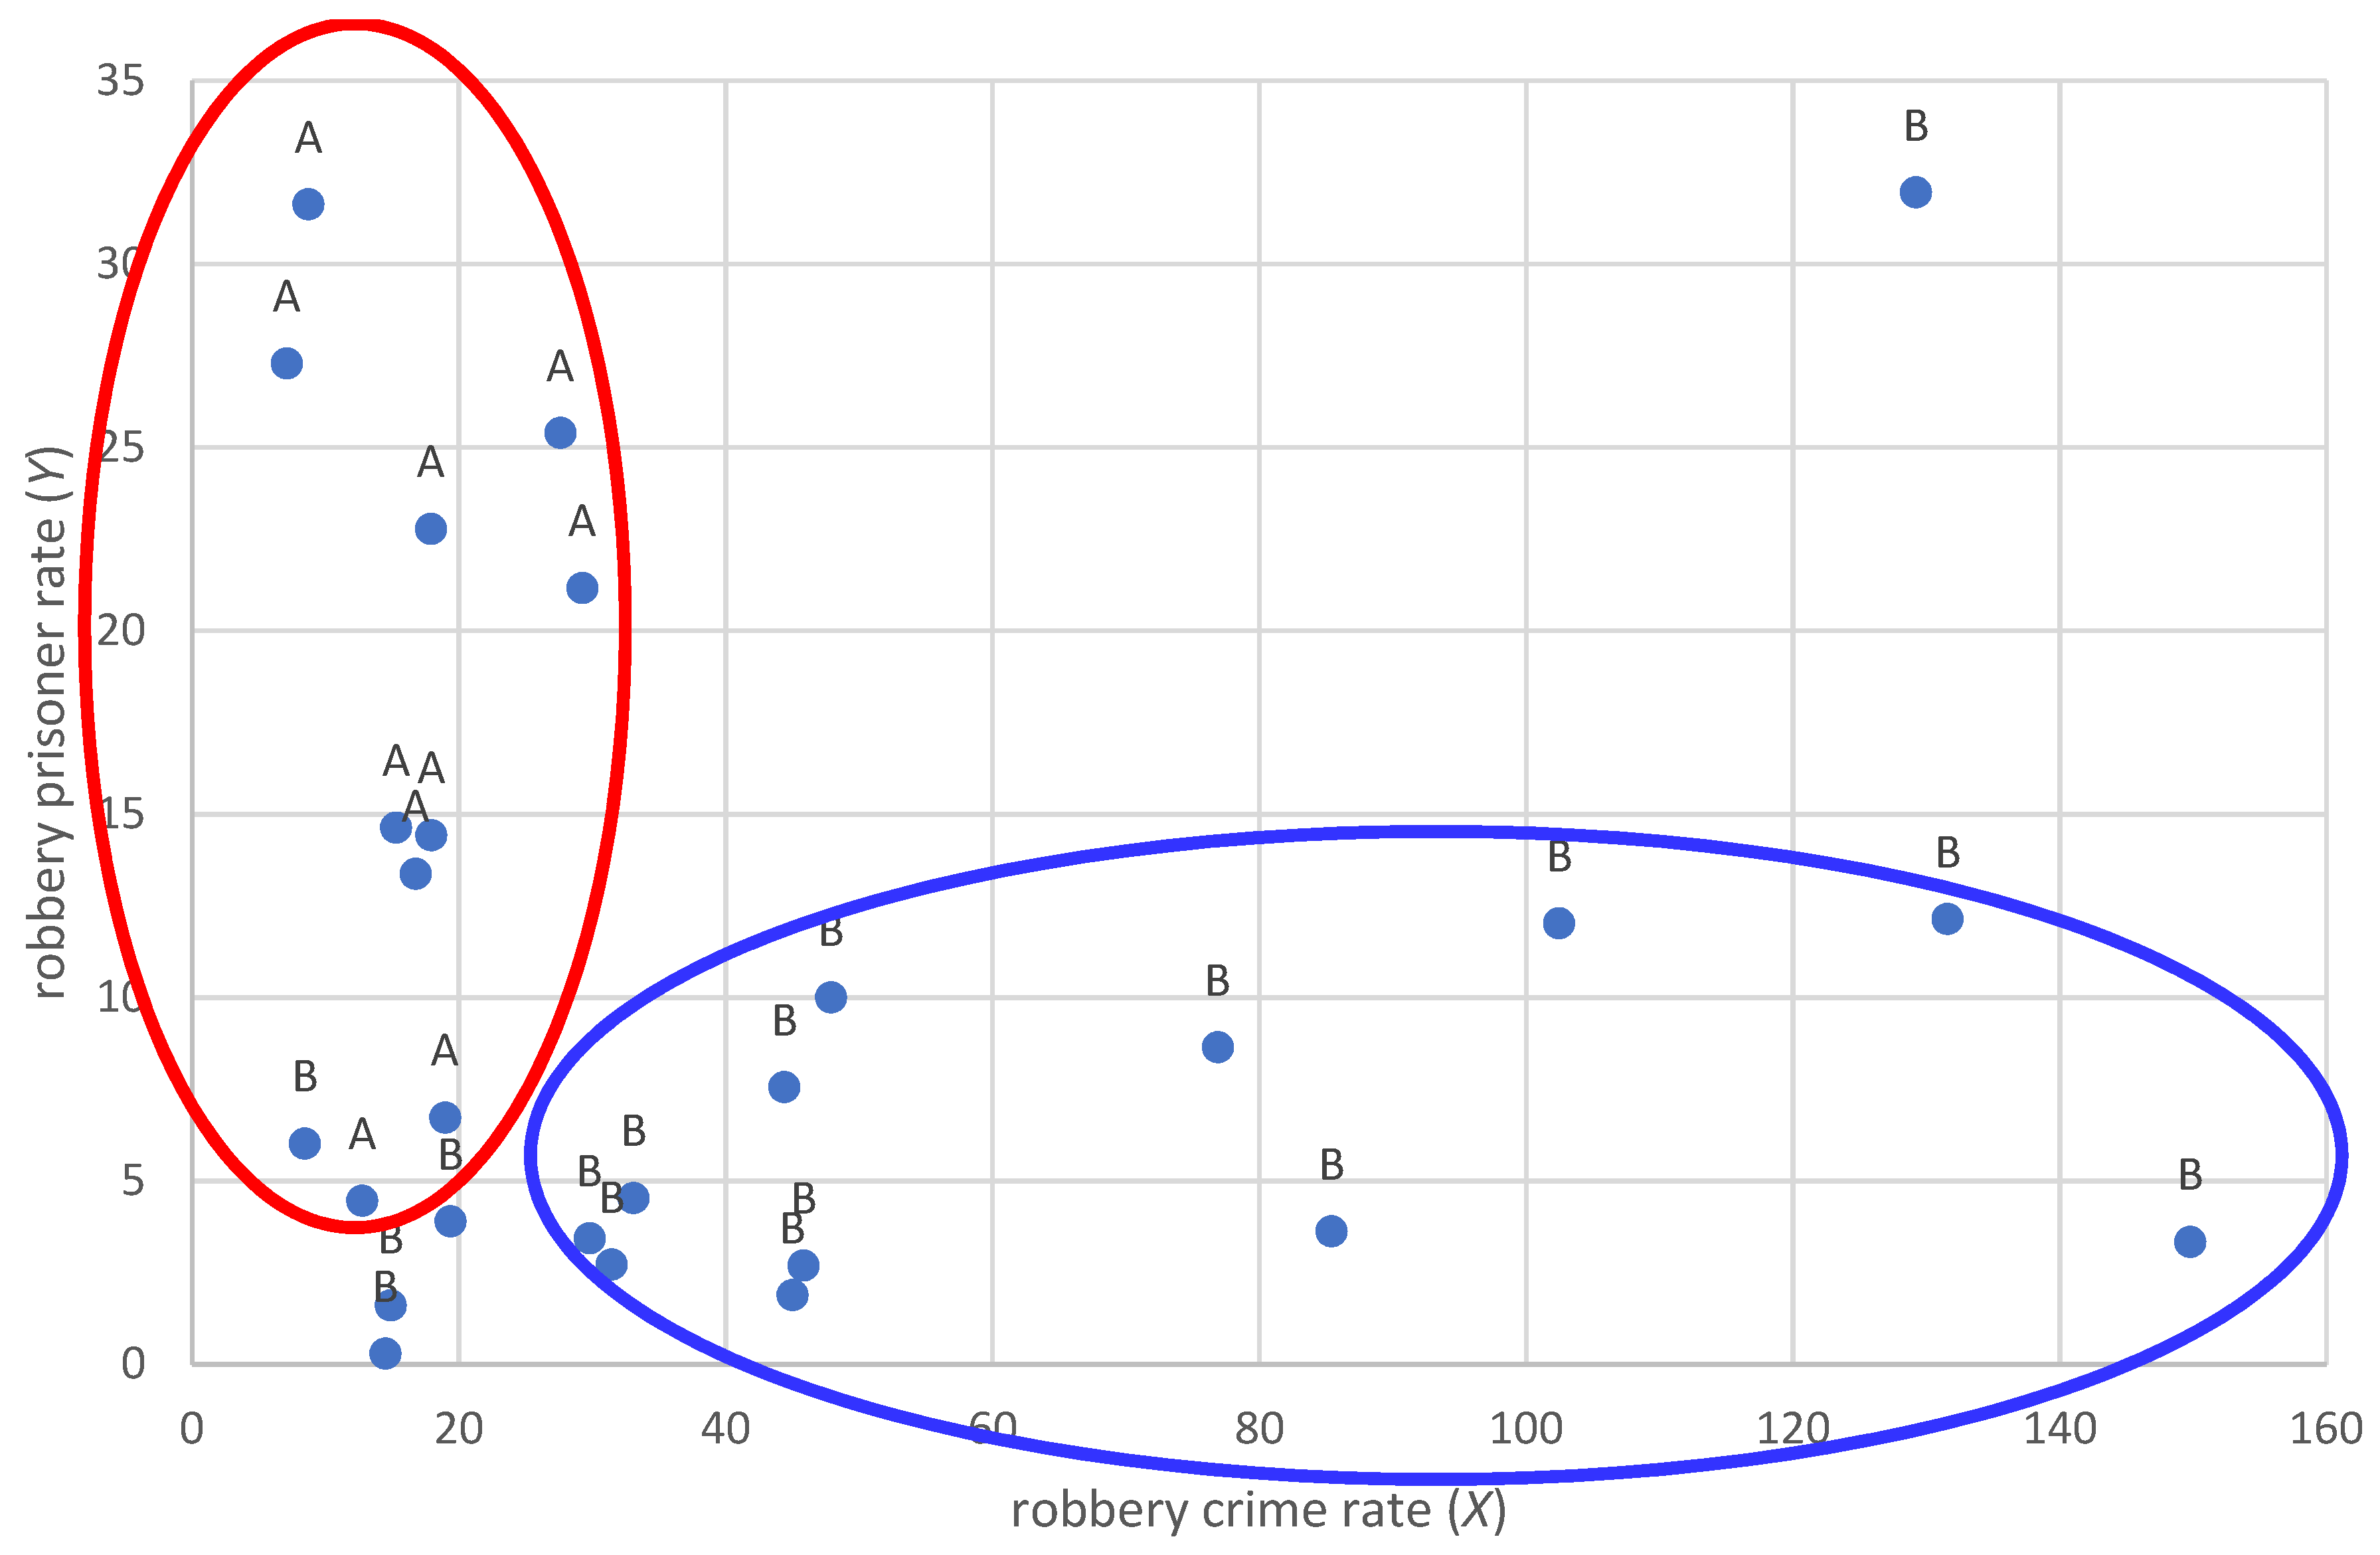
4. Prison vs. Crime Clusters of the CEE and the WE Countries

The simple graphical representation of prisoner (incarceration) rate vs. crime rate for robbery in 2018 is presented in Figure 1. What is clearly visible is the cluster of the CEE countries (A) with rather low robbery crime rates (X) and very high robbery incarceration rates (Y). The WE countries (B) have low robbery incarceration rates.
For other offences (assault, rape, theft), the graphical representations of prisoner rate vs. crime rate are similar to Figure 1, all showing high incarceration rates with relatively low crime rates for the CEE countries.
This observation is confirmed in Table 1 in which the averages of X and Y variables for the 2018 data are presented. Prisoner rates for the CEE countries are distinctly higher than those for Western Europe. In fact, they are quite the opposite—the reported crime rates for the WE countries are markedly higher than for the CEE countries4. The crime rate discrepancies have been confirmed in numerous works—e.g., Gruszczyńska and Heiskanen (2018).
We believe that the higher levels of crime rates in WE are, in part, due to the higher percentage of crimes being reported and the greater accuracy of police statistics. The prison population is mostly determined by the criminal and penal policy in each country. The decisive elements are the frequency of prison sentences and the length of imprisonment. The criminal and penal policies in the CEE countries are evidently different than those in the WE countries. In effect, incarceration rates in the CEE countries are higher, despite the lower crime rates—as compared to the WE countries.
Table A1 in the Appendix A shows the correlation coefficients between the dummy variable D (where D = 1 for the CEE countries and D = 0 for the WE countries) and the X and Y variables. Correlations of prisoner rates with the D variable are all positive, and statistically significant for robbery and theft. These correlations are all negative for crime rates, and significant for rape, robbery, and theft.
Before addressing more formally our observation from Figure 1, we examine simple correlation coefficients between variables X and Y for the four types of offences. They are as follows:
0.5030 ** for assault (26 observations).
0.1906 for rape (24 observations).
−0.0022 for robbery (27 observations).
−0.4079 ** for theft (27 observations).
(** indicates p < 0.05).
This indicates that the simple regressions of Y on X (without the D variables) for assault and theft are statistically acceptable, while for rape and robbery such regressions may not be relevant. We now try to confirm the graphical inferences from Figure 1 by introducing dummy variable D into linear regressions of variable Y on X as follows:
Y i = β 0 + β 1 X i + β 2 D i + ε i i = 1 , 2 , n
where:
Y i = prisoner (incarceration) rate for country i.
X i = crime rate for country i.
D i = 1 for i indicating a CEE country; D i = 0 for i indicating a WE country.
ε i = error term.
β 0 , β 1 , β 2 = regression parameters.
In (1), variable Y is explained (regressand) and variables X and D are explanatory (regressors). Regression Equation (1) represents two regression lines:
Y i = β 0 + β 2 + β 1 X i + ε i for   the   CEE   countries   ( D i = 1 )
Y i = β 0 + β 1 X i + ε i for   the   WE   countries   ( D i = 0 )
Table 2 shows the results of OLS estimation of the four regressions of type (1). In all regressions, the variable representing “presence” of a CEE country (variable D) is significantly positive. This confirms our intuition from Figure 1 that incarceration rates for the CEE countries are distinctly higher than in WE—also shown in Table 1.
Table 2 demonstrates that the linear relationship of prisoner rate (Y) and crime rate (X) is positive and significant for assault, rape, and robbery, provided the CEE effect is taken into account. This effect is not visible for theft: the relationship between prisoner rates and crime rates for theft is stronger and negative without accounting for CEE, while in model (1) this association is not confirmed.
To sum up, our statistical evidence mostly confirms the relationship between prisoner rates and crime rates for European countries with the account of two country clusters: CEE and WE. We see, as in Aebi and Kuhn (2000), that for some types of offences this association may be relevant. We show it for all four offences albeit by different methods: for assault—by both attempts (simple correlation, regression (1)), for rape—by regression (1), for robbery—by regression (1), for theft—by simple correlation.
In the second part of our exercise, we return to the issue of simultaneity and introduce other variables into the equation.

5. Worldwide Governance Indicators vis-à-vis Crime and Prison Data

To mitigate simultaneity in some way between prisoner rates and crime rates, we introduce variables that account for country governance. We used the Worldwide Governance Indicators (WGI), while another option would be the Database of Political Institutions (DPI, Cruz et al. 2020).
The Worldwide Governance Indicators (WGIs) have been constructed since 1996 and report on six “dimensions” of country governance for more than 200 countries. More than 30 data sources are utilized to develop these indicators, the methodology for which is based on an unobserved components model—for the methodology, see Kaufmann et al. (2010).
Indicators (indices) of governance for a country measure the levels of six dimensions. The higher the WGI, the better the level of country governance. We believe that the quality of governance is reflective of the quality of the justice system. According to Kaufmann et al. (2010), governance is defined as “the traditions and institutions by which authority in a country is exercised”. The six measures (dimensions) of governance are:
  • Voice and Accountability (WGI_VA) captures perceptions of the extent to which a country’s citizens are able to participate in selecting their government, as well as freedom of expression, freedom of association, and a free media.
  • Political Stability and Absence of Violence/Terrorism (WGI_PS) captures perceptions of the likelihood that the government will be destabilized or overthrown by unconstitutional or violent means, including politically motivated violence and terrorism.
  • Government Effectiveness (WGI_GE) captures perceptions of the quality of public services, the quality of the civil service and the degree of its independence from political pressures, the quality of policy formulation and implementation, and the credibility of the government’s commitment to such policies.
  • Regulatory Quality (WGI_RQ) captures perceptions of the ability of the government to formulate and implement sound policies and regulations that permit and promote private sector development.
  • Rule of Law (WGI_RL) captures perceptions of the extent to which agents have confidence in, and abide by, the rules of society, and in particular the quality of contract enforcement, property rights, the police, and the courts, as well as the likelihood of crime and violence.
  • Control of Corruption (WGI_CC) captures perceptions of the extent to which public power is exercised for private gain, including both petty and serious forms of corruption, as well as the “capture” of the state by elites and private interests.
    (descriptions from Kaufmann et al. (2010)).
The Worldwide Governance Indicators are popular in research in the social sciences, but they are also subject to critiques (e.g., Apaza 2009). Critics stress, mostly, that the WGIs are atheoretical and biased while “critics of the critics counter that no better alternative exists” (Andrews et al. 2010). We believe that the WGIs can play important roles in analyses like ours by introducing a broader perspective that includes a variety of data on certain “qualities” of countries.
Thus, we place the relationship between incarceration rates and crime rates for European countries into the broader picture represented by country governance indices. Our WGI data cover the 2019 edition of six “dimensional” WGIs for the European countries in our dataset on incarceration and crime. As in the previous section, we begin with considering the arithmetic averages of the WGIs for the CEE and the WE countries. These are presented in Table 3. The difference between the CEE countries and the WE countries is profound in the case of all the WGIs. The indices for the WE countries are higher than those for the CEE countries by as much as 23% for PS, and up to 209% for CC.
The observation from Table 3 is supported by values of correlation coefficients between the WGIs and the D variable as presented in Table A2 in the Appendix A. All governance indicators have negative correlation with the dummy variable D (lower values of the WGIs for the CEE countries, higher values of the WGIs for the WE countries), and almost all (except WGI_PS) are statistically significant.
The next step is the analysis of correlations between the six WGIs representing various aspects of country governance levels and incarceration rates (Y), as well as with the crime rates (X). Table A3 in the Appendix A shows all these correlations. We note that prisoner rates are correlated (mostly) negatively with the WGIs: the higher the country governance level, the lower the imprisonment rate. Crime rates are correlated (mostly) positively with the WGIs: the higher the country governance index, the higher the crime rate. These observations may have direct interpretation. The countries with better governance collect and report more offences (per 100,000 population) and sentence less offenders to prison (per 100,000 population) than countries with lower governance levels.
We now propose using the WGIs to better explain the relationship between Y and X within the framework of the two clusters: the CEE and the WE countries. Our analysis uses the instrumental variables (IV) approach. As before, we consider four regression models of type (1) separately for each offence:
Y i = β 0 + β 1 X i + β 2 D i + ε i i = 1 , 2 , , n
where Y i = prisoner rate, X i = crime rate, D i = the dummy variable for indication of a CEE country. Variable Y is endogenous (explained), and variables X and D are explanatory.
Typical IV technique is applied when the explanatory variable is suspected to be endogenous as well as Y. In the case of (1), we assume that X is endogenous. Our approach is a kind of “quasi-IV,” since we do not consider instruments (single variables) that are correlated with X and are taken from outside of the Y and X framework. Our IV-like approach makes use of the WGIs that were chosen to represent “external” circumstances which surround the relationship between incarceration and crime. As the instrument for the X variable, we take one of the WGIs, the indicator that is well correlated with X for a given offence. The first step consists of estimating the linear regression of each X variable (each offence) on the selected instrument:
X i = α 0 + α 1 W G I i + ε i i = 1 , 2 , , n
where X i = crime rate, and W G I i = index WGI selected for the offence considered.
Next, the estimated values of X i from Equation (2) are included into regressions (1) instead of X i , i.e.,
Y i = γ 0 + γ 1 X ^ i + γ 2 D i + ε i i = 1 , 2 , , n
where X ^ i is the value of X i estimated (predicted) from (2).
Based on the correlations presented in Table A3, we select the instrument WGI that is entered in each Equation (3). These are WGI_CC for assault5, WGI_RL for rape, WGI_PS for robbery, and WGI_CC for theft. The results of the estimating Equation (4) are shown in Table 4.
Analysis with the IV approach yielded similar results to model (1). When we compare the estimation results from Table 2 and Table 4, we see that:
  • results confirm that the CEE countries differ distinctly from the WE countries in terms of the relationship between “crime and punishment”(i.e., crime rates (X) and incarceration rates (Y));
  • the direction of association between crime rates and incarceration rates is confirmed to be distinctly positive for assault, rape, and robbery;
  • for theft, the inclusion of the CEE variable makes the association between X and Y weaker than is seen from the simple correlation (i.e., significantly negative).
It should be stressed that our approach has limitations. Firstly, all our regression models are based on a rather small number of observations that are also country aggregates. The cross-sectional analysis for such macro data must inevitably be flawed due to data quality and deficiencies (as mentioned in Section 2), as well as the fact that not all statistical assumptions may be met or tested.
Secondly, our instruments (the WGIs) may not be fully exogenous since they are composite indicators, possibly also associated with the endogenous variable. In effect, our exercise might result in a less reliable outcome. Let us repeat here that the WGI is an instrument-like variable that is taken from outside the Y and X context. Our instruments may be considered as weak (see, e.g., Stock and Watson 2019, chp. 12). In future studies, (e.g., with panel data), the choice of better instruments would be essential. For example, Levitt (1996) uses the “changes in overcrowding litigation status” as being “truly exogenous shifters of the prison population” in US states.6
Due to the small number of observations, we do not attempt to include here other variables that may typically be considered in examining the relationship between the crime rate and the incarceration rate. As pointed out in Section 2.2, for aggregate data such variables may include the poverty rate, the unemployment rate, GDP per capita, the size of the police force, among other variables.

6. Conclusions

What might the reader take away from this paper? Our modest hope is that we have shown two clusters of countries within Europe that differ strikingly in terms of incarceration and crime. In the era of big data, our exercise using a few aggregates for a group of countries may seem old-fashioned, at least in terms of methodology. However, what we hope to show—in simple terms—is how one specific group of countries substantially differs from other countries in Europe in terms of legal and criminal policies—no more and no less. Using the methodology of simple correlation and multiple regression, we have shown that the association between prisoner rates and crime rates for European countries is explained better if two clusters are distinguished: the Central and Eastern European countries and the Western European countries.
We have presented several outcomes of research on the prisoner-crime relationship worldwide. Building on our paper from 2013, we examined aggregates of incarceration and crime for European countries in 2018, for selected offences: assault, rape, robbery, and theft. For the analysis, we also applied data from the Worldwide Governance Indicators (WGI) for the first time, in our knowledge, to criminological research.
What are the limitations of our research? Firstly, as pointed out in Section 3, we assumed that the EU data on crime and incarceration are comparable between countries. although this assumption may not be fully valid. In our opinion, however, there is no better source of international data on European countries than these EU statistics. The second limitation is the methodology. As indicated in Section 5, potential imperfections in our approach may result from the small number of observations and from the choice of instruments. Despite this, we are convinced that it is worth undertaking such attempts in order to transform the qualitative perceptions depicted in Figure 1 into a more quantitative representation. By separating the cluster of Central and Eastern European countries, we believe that we have taken a novel approach to European data on prisoner rates and crime rates that may be extended into a more sophisticated methodological framework. Richer analyses of the relationship examined here might be based on panel data, lagged variables, or other instruments, and might be developed upon our primary observation that the incarceration-crime relationship for the CEE countries is distinctly different from the rest of Europe.

Author Contributions

Conceptualization, B.G. and M.G.; Methodology, B.G. and M.G.; Writing—original draft, B.G. and M.G.; Writing—review & editing, B.G. and M.G. All authors have read and agreed to the published version of the manuscript.

Funding

This research received no external funding.

Data Availability Statement

Data are taken from the following sources: (1) Eurostat statistics: “Recorded offences by offence category—police data [crim_off_cat]” Recorded offences by offence category—police data—Products Datasets—Eurostat (europa.eu), (2) report on SPACE I—2019 (Aebi and Tiago 2020) and (3) Worldwide Governance Indicators https://databank.worldbank.org/source/worldwide-governance-indicators.

Conflicts of Interest

The authors declare no conflict of interest.

Appendix A

Table A1. D variable and prisoner rate Yi and (2) D variable and crime rate Xi, n = number of observations. D = 1 for CEE countries, D = 0 for WE countries.
Correlation CoefficientAssaultRapeRobberyTheft
Y = prisoner rate0.17960.21600.5806 **0.6741 **
n26252727
X = crime rate−0.2473−0.4368 **−0.4557 **−0.5652 **
n34333434
* indicates p < 0.1; ** indicates p < 0.05.
Table A2. Correlation coefficients between WGIs and D variable; n = number of observations. D = 1 for CEE countries, D = 0 for WE countries.
WGI_VAWGI_PSWGI_GEWGI_RQWGI_RLWGI_CC
−0.7414 **−0.2679−0.6065 **−0.5337 **−0.5881 **−0.5978 **
n = 32n = 32n = 32n = 32n = 32n = 32
* indicates p < 0.1; ** indicates p < 0.05.
Table A3. Correlation coefficients between (1) WGIs and prisoner rate Yi and (2) WGIs and crime rate Xi, n = number of observations.
WGIAssaultRapeRobberyTheft
WGI_VA
Y = prisoner rate−0.0807−0.1412−0.5867 **−0.5610 **
n25242626
X = crime rate0.12180.4609 **0.28280.6418 **
n32313232
WGI_PS
Y = prisoner rate−0.2381−0.3681 *−0.4776 **−0.3941 **
n25242626
X = crime rate−0.22260.2261−0.3094 *0.1619
n32313232
WGI_GE
Y = prisoner rate0.0654−0.1325−0.5389 **0.4083 **
n25242626
X = crime rate−0.12520.4656 **0.1686 *0.6090 **
n32313232
WGI_RQ
Y = prisoner rate0.16570.0564−0.5089 **−0.3866 *
n25242626
X = crime rate0.21150.4983 **0.19660.6144 **
n32313232
WGI_RL
Y = prisoner rate0.0987−0.0360−0.5817 **−0.4525 **
n25242626
X = crime rate0.18460.5429 **0.20210.6349 **
n32313232
WGI_CC
Y = prisoner rate0.1223−0.0541−0.6191 **−0.4959 **
n25242626
X = crime rate0.24560.5584 **0.21230.6511 **
n32313232
* indicates p < 0.1; ** indicates p < 0.05.

References

  1. Aebi, Marcelo F., and André Kuhn. 2000. Influences on the Prisoner Rate: Number of Entries into Prison, Length of Sentences and Crime Rate. European Journal on Criminal Policy and Research 8: 65–75. [Google Scholar]
  2. Aebi, Marcelo F., and Melanie M. Tiago. 2020. SPACE I—2019—Council of Europe Annual Penal Statistics: Prison Populations. Strasbourg: Council of Europe. [Google Scholar]
  3. Aebi, Marcelo F., Antonia Linde, and Natalia Delgrande. 2015. Is There a Relationship Between Imprisonment and Crime in Western Europe? European Journal on Criminal Policy and Research 21: 425–46. [Google Scholar]
  4. Aebi, Marcelo F., Bruno Aubusson de Cavarlay, Gorgon Barclay, Beata Gruszczyńska, Stefan Harrendorf, Markku Heiskanen, Vasilika Hysi, Jörg-Martin Jehle, Anniina Jokinen, Annie Kensey, and et al. 2010. European Sourcebook of Crime and Criminal Justice Statistics—2010, 4th ed. Den Haag: Boom. [Google Scholar]
  5. Aebi, Marcelo F., Galma Akdeniz, Gordon Barclay, Claudia Campistol, Stefano Caneppele, Beata Gruszczyńska, Stefan Harrendorf, Markku Heiskanen, Vasilika Hysi, Jörg-Martin Jehle, and et al. 2012. European Sourcebook of Crime and Criminal Justice Statistics. Questionnaire Covering the Years 2007–2011. Lausanne: University of Lausanne. [Google Scholar]
  6. Aebi, Marcelo F., Galma Akdeniz, Gordon Barclay, Claudia Campistol, Stefano Caneppele, Beata Gruszczyńska, Stefan Harrendorf, Markku Heiskanen, Vasilika Hysi, Jörg-Martin Jehle, and et al. 2014. European Sourcebook of Crime and Criminal Justice Statistics—2014, 5th ed. Helsinki: Helsinki United Nations Institute. [Google Scholar]
  7. Amrhein, Valentin, Sander Greenland, and Blake McShane. 2019. Retire statistical significance. Nature 567: 305–7. [Google Scholar] [PubMed]
  8. Andrews, Matt, Roger Hay, and Jerrett Myers. 2010. Can Governance Indicators Make Sense? Towards a New Approach to Sector-Specific Measures of Governance. Oxford Development Studies 38: 391–410. [Google Scholar]
  9. Apaza, Carmen R. 2009. Measuring Governance and Corruption through the Worldwide Governance Indicators: Critiques, Responses, and Ongoing Scholarly Discussion. Political Science and Politics 42: 139–43. [Google Scholar]
  10. Beccaria, Cesare. 2007. On Crimes and Punishments. Translated by Aaron Thomas, and Jeremy Parzen. Toronto: University of Toronto Press. First published 1764. [Google Scholar]
  11. Clear, Todd R., Natasha A. Frost, Michael Carr, Geert Dhondt, Anthony Braga, and Garrett A. R. Warfield. 2014. Predicting Crime through Incarceration: The Impact of Rates of Prison Cycling on Rates of Crime in Communities. Washington, DC: National Institute of Justice. [Google Scholar]
  12. Cruz, Cesi, Philip Keefer, and Carlos Scartascini. 2020. The Database of Political Institutions 2020 (DPI2020). Available online: https://publications.iadb.org/en/database-political-institutions-2020-dpi2020 (accessed on 8 February 2023).
  13. Greenberg, David F. 2002. Striking out in democracy. Punishment & Society 4: 237–52. [Google Scholar]
  14. Gruszczyńska, Beata, and Marek Gruszczyński. 2013. Prison population and crime rates: How Poland differs from other EU countries. In Kriminologie, Kriminalpolitik Und Strafrecht Aus Internationaler Perspektive. Edited by André Kuhn, Pierre Margot, Marcelo F. Aebi, Christian Schwarzenegger, Andreas Donatsch and Daniel Jositsch. Bern: Stämpfli Verlag AG. [Google Scholar]
  15. Gruszczyńska, Beata, and Markku Heiskanen. 2018. Trends in Police-Recorded Offenses at the Beginning of the Twenty-First Century in Europe. European Journal of Crime and Criminal Policy Research 24: 37–53. [Google Scholar]
  16. Gruszczyński, Marek. 2020. Financial Microeconometrics. A Research Methodology in Corporate Finance and Accounting. Cham: Springer. [Google Scholar]
  17. Harrendorf, Stefan. 2018. Prospects, problems, and pitfalls in comparative analyses of criminal justice data. Crime and Justice 47: 159–207. [Google Scholar] [CrossRef]
  18. Kaufmann, Daniel, Aart Kraay, and Massimo Mastruzzi. 2010. The Worldwide Governance Indicators: Methodology and Analytical Issues. World Bank Policy Research Working Paper No. 5430. Washington, DC: The World Bank. [Google Scholar]
  19. Killias, Martin. 1986. Power Concentration, Legitimation Crisis and Penal Severity. In Punishment and Privilege. Edited by Byron Groves and Graeme Newman. Albany: Harrow and Heston, pp. 95–117. [Google Scholar]
  20. Levitt, Steven D. 1996. The effect of prison population size on crime rates: Evidence from prison overcrowding legislation. Quarterly Journal of Economics 111: 319–52. [Google Scholar]
  21. Lofstrom, Magnus, and Steven Raphael. 2016. Incarceration and Crime: Evidence from California’s Public Safety Realignment Reform. Annals of the American Academy of Political and Social Science 664: 196–220. [Google Scholar] [CrossRef]
  22. Mitchell, Ojmarrh, Joshua C. Cochran, Daniel P. Mears, and William D. Bales. 2016. Examining Prison Effects on Recidivism: A Regression Discontinuity Approach. Justice Quarterly 34: 571–96. [Google Scholar]
  23. Murray, Michael P. 2006. Avoiding Invalid Instruments and Coping with Weak Instruments. Journal of Economic Perspectives 20: 111–32. [Google Scholar]
  24. Nagin, Daniel S., and G. Matthew Snodgrass. 2013. The Effect of Incarceration on Re-Offending: Evidence from a Natural Experiment in Pennsylvania. Journal of Quantitative Criminology 29: 601–42. [Google Scholar]
  25. Nieuwbeerta, Paul, Daniel S. Nagin, and Arjan A. J. Blokland. 2009. Assessing the Impact of First-Time Imprisonment on Offenders’ Subsequent Criminal Career Development: A Matched Samples Comparison. Journal of Quantitative Criminology 25: 227–57. [Google Scholar]
  26. Smit, Paul, Ineke H. Marshall, and Mirjam van Gammeren. 2008. An Empirical Approach to Country Clustering. In Crime and Criminal Justice Systems in Europe and North America, 1995–2004. Edited by Aromaa Kauko and Markku Heiskanen. Helsinki: Helsinki United Nations Institute. [Google Scholar]
  27. Spelman, William. 2008. Specifying the Relationship Between Crime and Prisons. Journal of Quantitative Criminology 24: 149–78. [Google Scholar]
  28. Spelman, William. 2013. Prisons and Crime, Backwards in High Heels. Journal of Quantitative Criminology 29: 643–74. [Google Scholar]
  29. Spelman, William. 2017. The Murder Mystery: Police Effectiveness and Homicide. Journal of Quantitative Criminology 33: 859–86. [Google Scholar]
  30. Stemen, Don. 2017. The Prison Paradox: More Incarceration Will Not Make Us Safer. New York: Vera Institute of Justice. [Google Scholar]
  31. Stock, James H., and Mark W. Watson. 2019. Introduction to Econometrics, 4th ed. London: Pearson. [Google Scholar]
  32. Travis, Jeremy, Bruce Western, and Steve Redburn, eds. 2014. The Growth of Incarceration in the United States: Exploring Causes and Consequences. Washington, DC: The National Academies Press. [Google Scholar]
  33. Van Dijk, Jan, John van Kesteren, and Paul Smit. 2007. Criminal Victimization in International Perspective. Key Findings from the 2004–2005 ICVS and EU ICS. Onderzoek en Beleid No. 257. WODC. Den Haag: Boom Legal Publishers. [Google Scholar]
1
We simply need to know whether our data comprise a sample or represent the entire population. In both cases, the relationships between variables may, and should, be examined. Interpretations and statistical inference will be different. The model for the entire population relates only to this particular population, i.e., the insignificant variable in the regression equation may mean that, in fact, this particular variable may not be suitable for explaining the relationship in question for this population (Gruszczyński 2020, p. 14).
2
We follow here the explanation by Harrendorf (2018).
3
“South” means south of the Pyrenees and the Alps. The USA and Canada were placed in the category “North/West”. (Smit et al. 2008, p. 186).
4
Due to the small number of observations, we have not attempted to test the difference between the means.
5
As seen in table C, the instrument WGI_CC selected for assault is weakly correlated with this variable (it is a weak instrument), although this correlation is the highest among all correlations of assault with the WGIs.
6
However, Levitt’s approach to choosing and validating instruments has been subject to thorough examination and critique in the seminal paper by Murray (2006).
Figure 1. 2018 robbery prisoner rate (Y = vertical axis) vs. robbery crime rate (X = horizontal axis). Data points for the CEE countries are designated by A, for the WE countries by B.
Laws 12 00019 g001
Table 1. Average values of Y and X variables in 2018 by type of offence and cluster. Rates per 100,000 inhabitants.
Arithmetic MeanAssaultRapeRobberyTheft
Prisoner rate (Y)
CEE countries (A)7.5605.15818.17927.003
no. of observations9101010
WE countries (B)5.8463.6226.8407.318
no. of observations17161717
Crime rate (X)
CEE countries (A)34.9675.69917.236525.946
no. of observations10101010
WE countries (B)115.72228.30553.1601489.433
no. of observations21212121
Table 2. Estimation results of regressions (1) with prisoner rate Yi as regressand and Xi and Di as regressors, n = number of observations.
Yi = Prisoner RateAssaultRapeRobberyTheft
Xi = crime rate0.0142 **0.0465 * 0.0909 **0.0001
Di2.9715 * 2.6608 * 15.1775 **19.8069 **
constant4.0864 **2.2317 * 1.43337.1373
R20.34470.17280.45040.4544
n26242727
* indicates p < 0.1; ** indicates p < 0.05; for “Assault” no data for Latvia; for “Rape” no data for Germany, Italy, or The Netherlands.
Table 3. The average values of the WGIs in the 2019 edition of Worldwide Governance Indicators.
Arithmetic MeanWGI_VAWGI_PSWGI_GE
CEE countries (A)0.7360.6600.664
no. of observations101010
WE countries (B)1.2080.8141.307
no. of observations212121
WGI_RQWGI_RLWGI_CC
CEE countries (A)0.9160.6700.438
no. of observations101010
WE countries (B)1.3111.3351.354
no. of observations212121
Table 4. Estimation results of instrumental variable regressions (3); n = number of observations.
Yi = Prisoner RateAssaultRapeRobberyTheft
InstrumentWGI_CCWGI_RLWGI_PSWGI_CC
X ^ i = crime rate predicted from (2)
Di0.0474 *0.0351 0.2540 * −0.0019
constant5.0455 * 1.8138 9.1045 **18.0669 **
R2−0.5367 3.1072 * −3.6794 10.3354
n0.16670.05310.42110.4485
25242626
* indicates p < 0.1; ** indicates p < 0.05.
Disclaimer/Publisher’s Note: The statements, opinions and data contained in all publications are solely those of the individual author(s) and contributor(s) and not of MDPI and/or the editor(s). MDPI and/or the editor(s) disclaim responsibility for any injury to people or property resulting from any ideas, methods, instructions or products referred to in the content.

