Review

A Short Review on Fracture Mechanisms of Mechanical Components Operated under Industrial Process Conditions: Fractographic Analysis and Selected Prevention Strategies

by
George A. Pantazopoulos
ELKEME Hellenic Research Centre for Metals S.A., 61st km Athens–Lamia National Road, 32011 Oinofyta, Viotias, Greece
Metals 2019, 9(2), 148; https://doi.org/10.3390/met9020148
Submission received: 9 January 2019 / Revised: 25 January 2019 / Accepted: 27 January 2019 / Published: 29 January 2019
(This article belongs to the Special Issue Failure Mechanisms in Alloys)

Abstract

:
An insight of the dominant fracture mechanisms occurring in mechanical metallic components during industrial service conditions is offered through this short overview. Emphasis is given on the phenomenological aspects of fracture and their relationships with the emergent fracture mode(s) with respect to the prevailed operating parameters and loading conditions. This presentation is basically fulfilled by embracing and reviewing industrial case histories addressed from a technical expert viewpoint. The referenced case histories reflected mainly the author’s team expertise in failure analysis investigation. As a secondary perspective of the current study, selected failure investigation and prevention methodological approaches are briefly summarized and discussed, aiming to provide a holistic overview of the specific frameworks and systems in place, which could assist the organization of risk minimization and quality enhancement.

1. Introduction

Failure analysis (FA) is a multidisciplinary, multifaceted scientific field, connecting areas of engineering from diverse backgrounds and bodies of knowledge; from applied mechanics to electrochemistry and corrosion and from numerical modeling, to the understanding of surface science and tribology. The complexity of the nature of the subject requires the embracing of various engineering disciplines, to succeed high process performance and effective root-cause analysis, which is the core and the central objective of the failure investigation process [1]. The evolution of the failure analysis area is massive and perpetual, since it advances together with the numerous independent fields and core competencies, which are considered as the main constituents of its entire body of knowledge.
There are representative textbooks and monographs, aiming to serve the FA subject from different viewpoints and perspectives, assisting and guiding engineers and failure analysis practitioners working in a variety of industry areas. Some characteristic examples add appreciable effort in understanding the basic elementary technical disciplines, building the framework of FA, and highlighting the role of fractography are referred to in [2,3,4,5,6].
Another approach, which is noteworthy, is focused on the management and organizational aspects of failure analysis, aiming to present and examine its current status as a structured and disciplined procedure [7]. Without the need to mention other literature sources, when treating niche areas of FA, undoubtedly, the great variety and extent of its subject constitutes a common perception. Therefore, filtering and condensing areas of specific knowledge will be valuable for researchers and engineers working in their respective disciplines, while a rigorous review in FA is rather a futile endeavor.
The aim of this short and targeted review is, firstly, to summarize the most common fracture mechanisms of machine components, highlighting their unique identification fingerprints through the contribution of macro- and micro-fractography. The value of fractography in FA is remarkable and it was specifically referred to in an excellent historical overview [8] and in a focused presentation on machine components, presented in [9].
Apart from traditional qualitative fractography, the application of quantitative fractography aims to measure the fracture surface topographic features, revealing significant characteristics of the fracture surface, in terms of true surface areas, distances, sizes, numbers, morphologies, orientations, and positions, as well as statistical distributions of these quantities. Modern quantitative fracture image analysis systems play an important part in the progress and successful achievement of these goals, not only to accelerate the measurement procedures, but also to perform operations that would not be possible by other techniques. Although classical macro-fractography is mostly elaborated utilizing optical methods (stereo-microscopy), research studies are increasingly motivated to realize quantitative measurements using Scanning Electron Microscopy (SEM) microfractography [10].
The experimental routes together with the presentation of fracture mechanisms, decorated through special case studies, will be discussed in Section 2, Section 2.1, Section 2.2 and Section 2.3. For the sake of simplicity and taxonomy, two classes of fracture are discussed: Instant or overload (Section 2.2) and progressive (Section 2.3) fractures. The subject is limited to the fracture of metallic components, while corrosion/environmental or surface (tribological) degradation mechanisms are out of the scope of the present work. Secondarily, in Section 3, a typical selection of methodologies used to tackle and prevent failures, aiming to enhance production efficiency and minimize machine downtime, are addressed. This section is a complementary part of the preceding section, which presents the “diagnostic” part of fracture analysis, acting as its “prognostic” inseparable twin sister – following the scheme, as the generic Equation (1) addresses:
Component Failure Investigation → Root-Cause Analysis → Failure Prevention
The contents of the short review paper concern principally the engineers and FA practitioners working in the manufacturing and metal working industry, aiming to provide:
(a)
A quick and condensed guide sharing knowledge from a technical expert point of view;
(b)
The basic methodological tools used for further preventive actions, at least in the form of their titles and not in a comprehensive and rigorous manner; and
(c)
Offer a sort of inspiration for research and continuous learning, which constitute the driving force and the backbone of improvement and sustainability.

2. Phenomenological Aspects of Fracture

The recognition of a fracture mode is a morphological identification process; fracture history is traced back to its origin, development (growth or propagation), and final ending stage. The description of the fracture process is literally connected to the construction of fracture history and main failure hypothesis. Fractographic analysis, using optical and scanning electron microscopy, constitutes an irresistible technique towards the resolution of fracture analysis problem solving. The unfolding of fracture process history is clearly stipulated through the rigorous description of the fracture surface topography; hence the preservation of fracture surfaces plays a key role in the entire FA investigation.

2.1. Experimental Procedure

Optical stereomicroscopy was performed using a Nikon SMZ 1500 (Nikon, Tokyo, Japan) stereo-microscope, using image analysis software (Image Pro Plus, Rockville, MD, USA). High-magnification fracture surface observations, utilizing a FEI XL40 SFEG scanning electron microscope (FEI, Eindhoven, The Netherlands), were realized using secondary electron (SE) and backscattered electron (BSE) imaging under 20 kV accelerating voltage conditions.

2.2. Instant (Overload) Fracture Mechanisms

This section summarizes the main types of overload fracture, which occurs instantly, once the intensity of the operating conditions exceeds the load-carrying capability of the component(s). Typically, the main overload fracture classes are categorized according to the accompanied plasticity (ductility) criterion, leading to two main groups:
Ductile Fracture (Section 2.2.1) and
Low/Limited Ductility Fracture (Section 2.2.2). In this case, the term “brittle fracture” is intentionally avoided and it is included with the present fracture type. Brittle fracture is an extreme case of low/limited ductility fracture where the absorbed plastic strain energy is negligible.

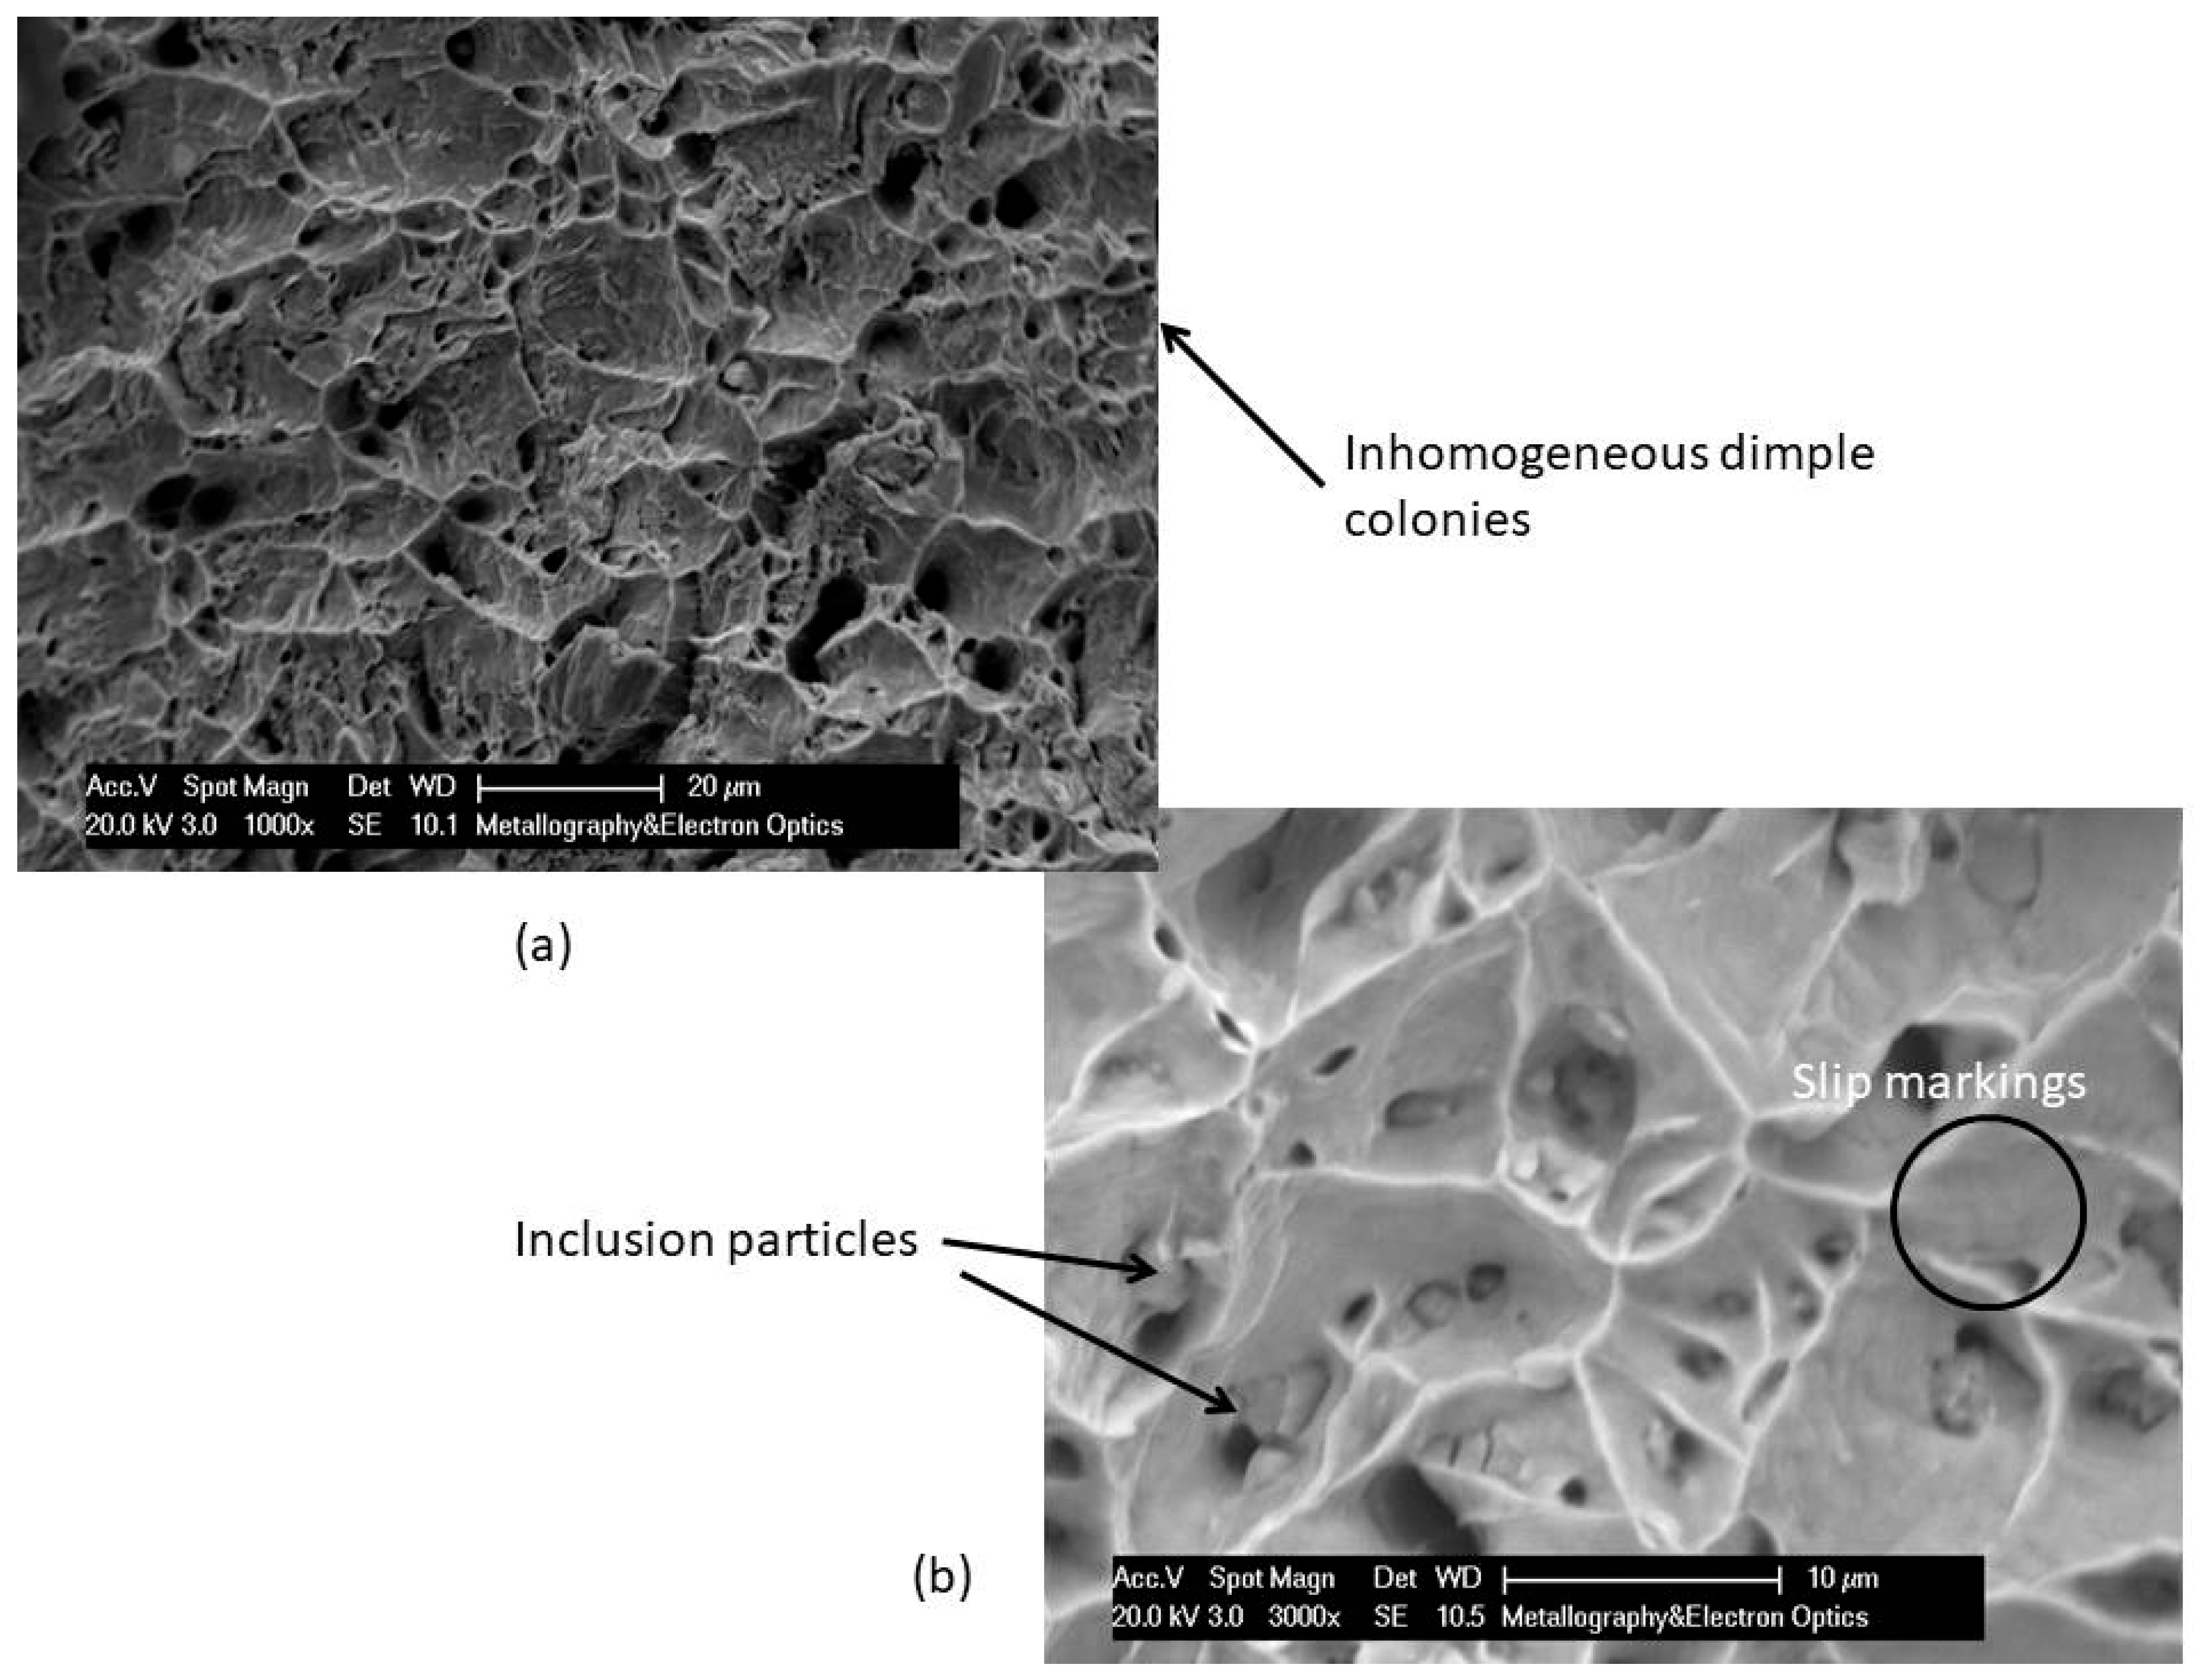
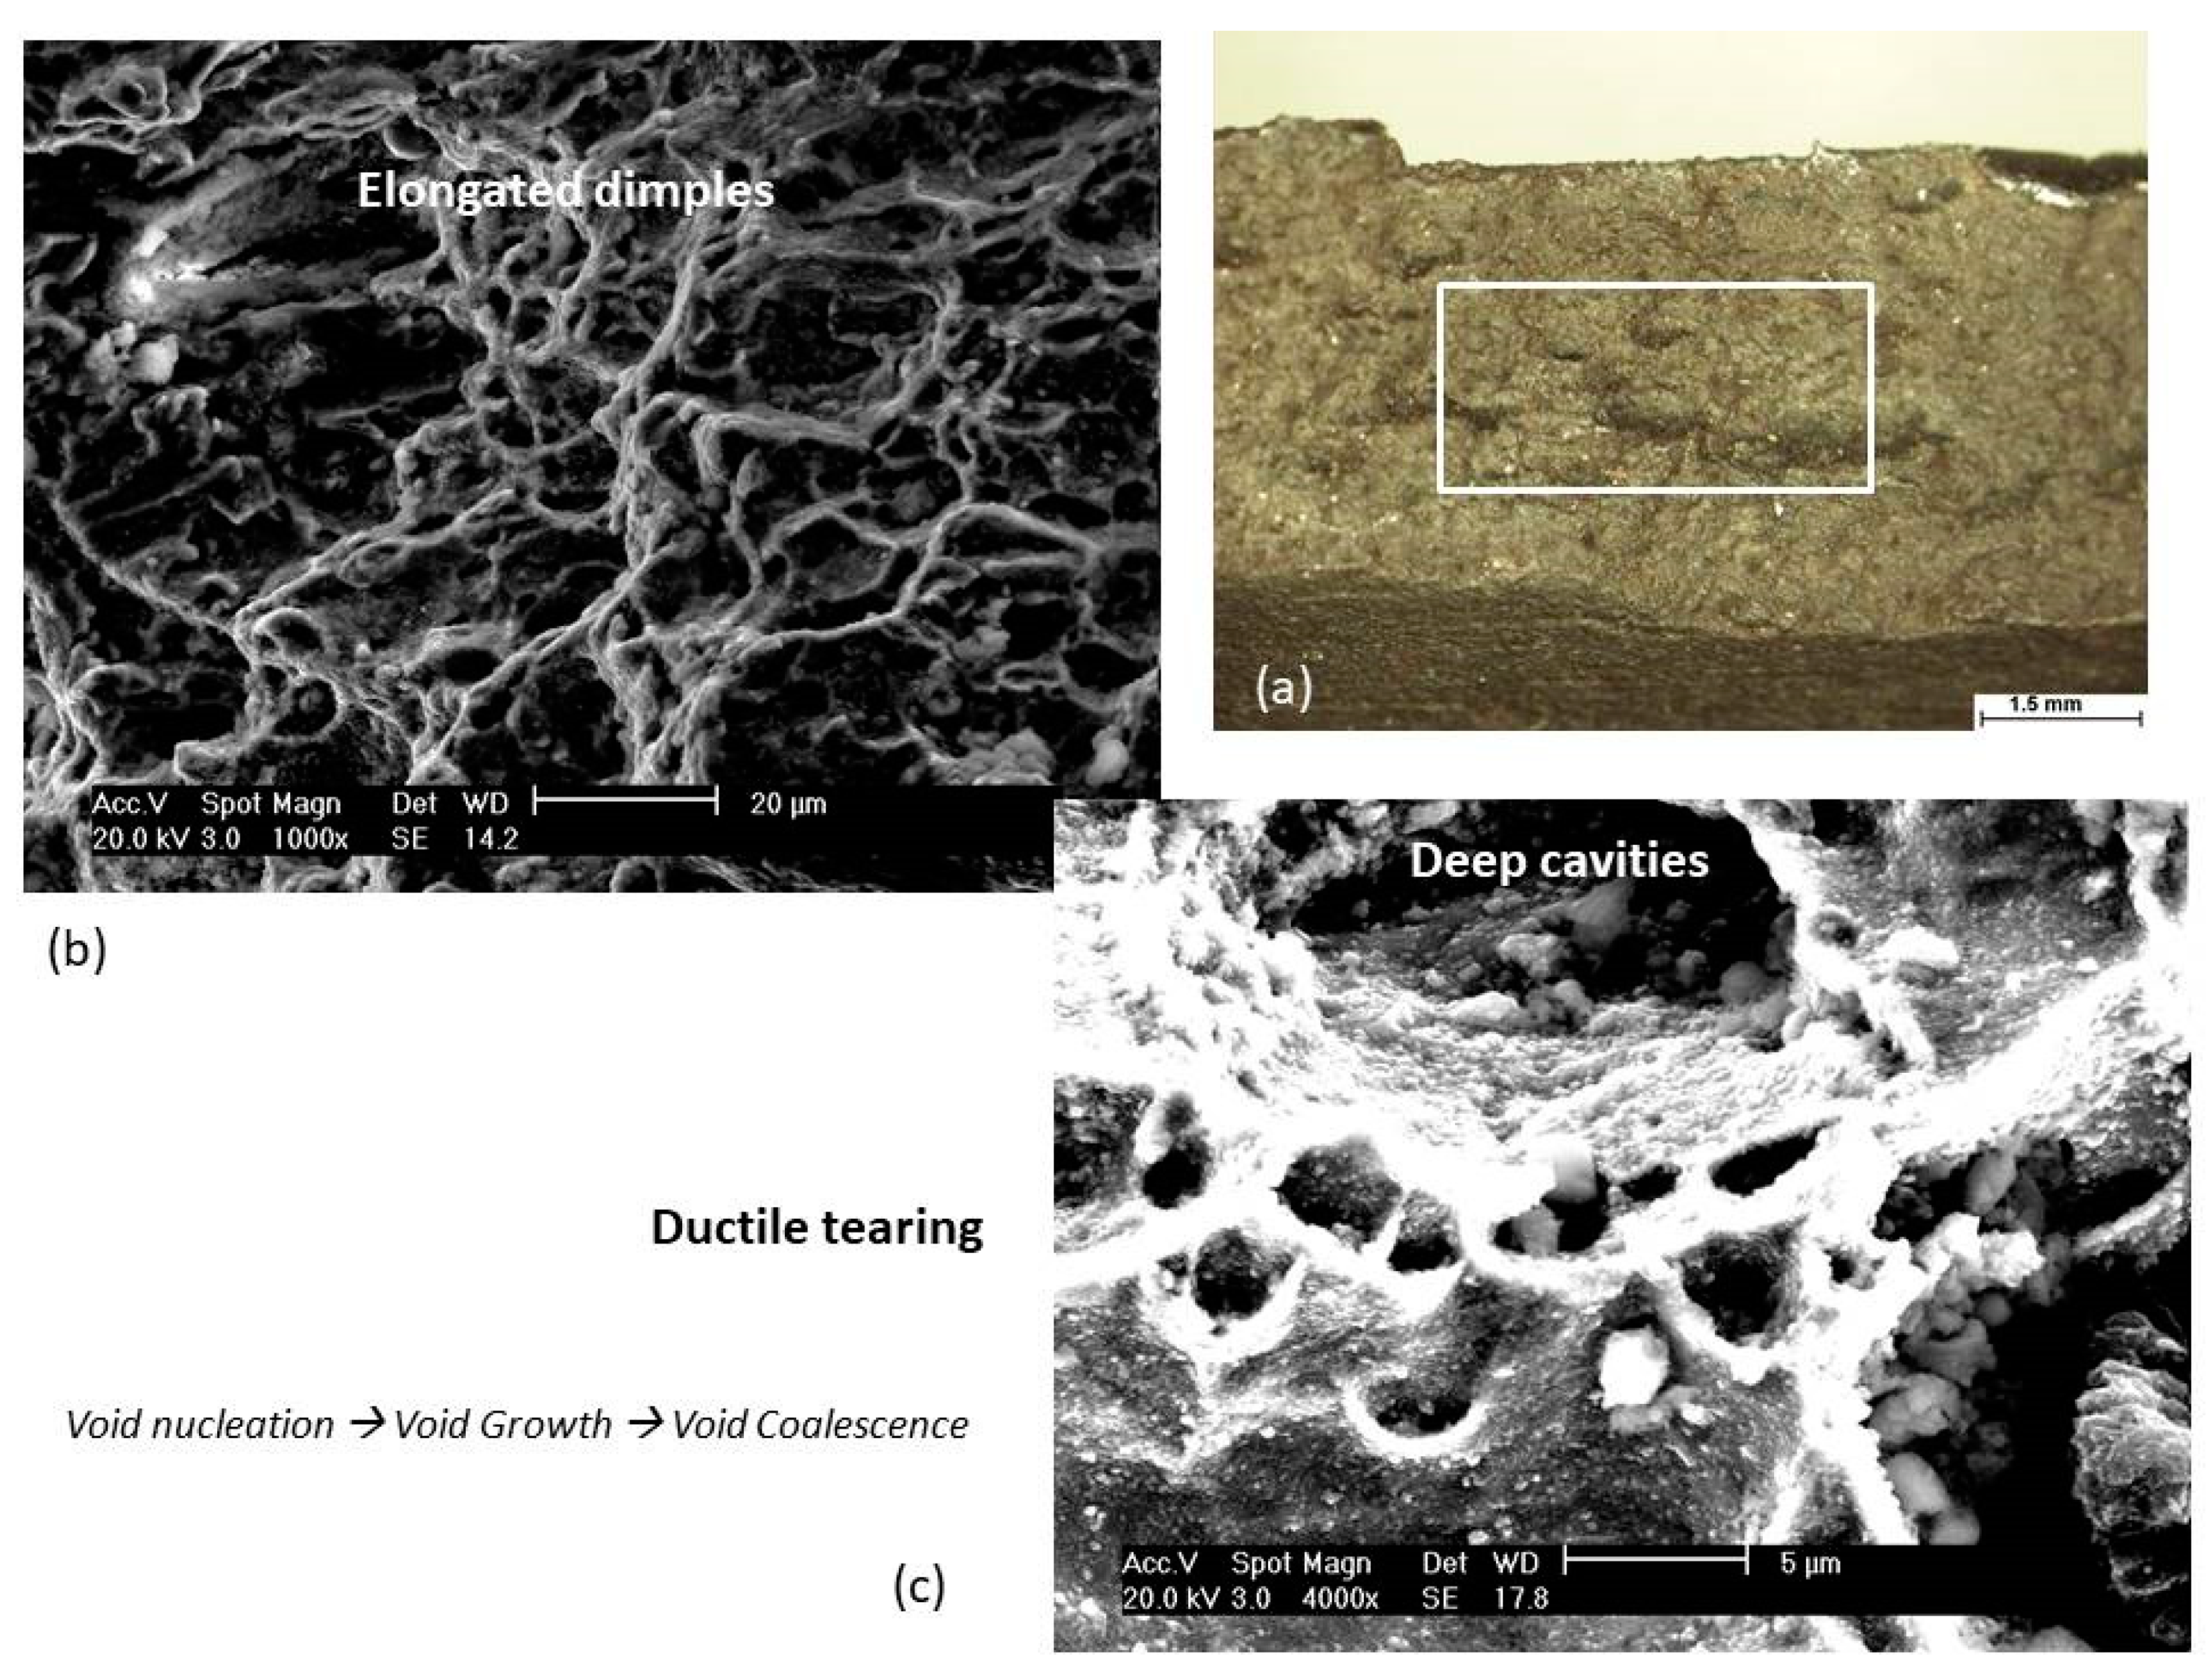
2.2.1. Ductile Fracture

Ductile fracture is accompanied by an appreciable amount of permanent plastic deformation, which is manifested even macroscopically by shape-geometry or cross section distortion (necking). Microscopically, voids are generated around inclusions, inclusion/matrix interfaces, and at the centre of the neck, where the hydrostatic stress is maximized and stress triaxiality dominates. The process of fracture development includes the following steps:
Void nucleation;
void growth; and
void linking (coalescence).
The inclusion density affects the microvoid nucleation rate, leading to a higher number of nucleation sites and lower growth potential, resulting in a high void distribution density and lower size dimples, signifying lower overall plasticity [11]. The Gurson based model, later modified by Tvegaard and Needleman, treated the damage evolution using void failure criteria and correlating hydrostatic stress with von Mises stress and the void volume fraction number, see Equation (2) [11,12,13]. The examination of ductile fracture evolution is out of the scope of the present work and, therefore, only a simple reference to the previous classical GTN (Gurson-Tvegaard-Needleman) model is attempted:
φ = σ e q 2 σ 0 2 + 2   C 1 · f ·   cosh ( 3 2 ·   C 2 · σ h σ 0 ) ( 1 + C 3 · f 2 ) = 0
where σeq is the equivalent von Mises stress, σh is the hydrostatic stress, σ0 is the actual yield stress, C1, C2, and C3 are model constants, and f is the effective void volume fraction. When, C1 = C2 = C3 = 1, the model is transitioned to the original Gurson model.
This model refers to a yield state, of the form, φ, as a function of the stresses (σeq, σ0, σh) and void volume fraction (f), which equals 0 for a porous ductile material [13].
The microvoid coalescence gives rise to the evolution of ductile (plastic) fracture, which creates characteristic signatures and fracture surface patterns [14]. The observation of fracture surface topography, using scanning electron microscopy (SEM) reveals a specific anaglyph consisting of dimples of various size, shape, and distribution (Figure 1). The growth of coarse voids proceeds against fine ones. As void evolution advances, the un-fractured metal links between the holes (behaving as columns or webs) are consecutively strained until final failure occurs, creating lower size secondary dimples and leading to an assigned distribution of cavities, as it is also described in [15]. The variation of dimple size is affected by the void threshold stress and growth rate, which are principally influenced by the geometrical and physical characteristics of the microstructural features [15].
The orientation of dimples denotes the load application (axial, shear, tear), see also [2]. The presence of shear dimples indicates high stress triaxiality conditions, impeding profuse void growth. In case of shear ductile fracture, slip band formation is restricted on inclusions, causing localized strain evolution and void nucleation [16].

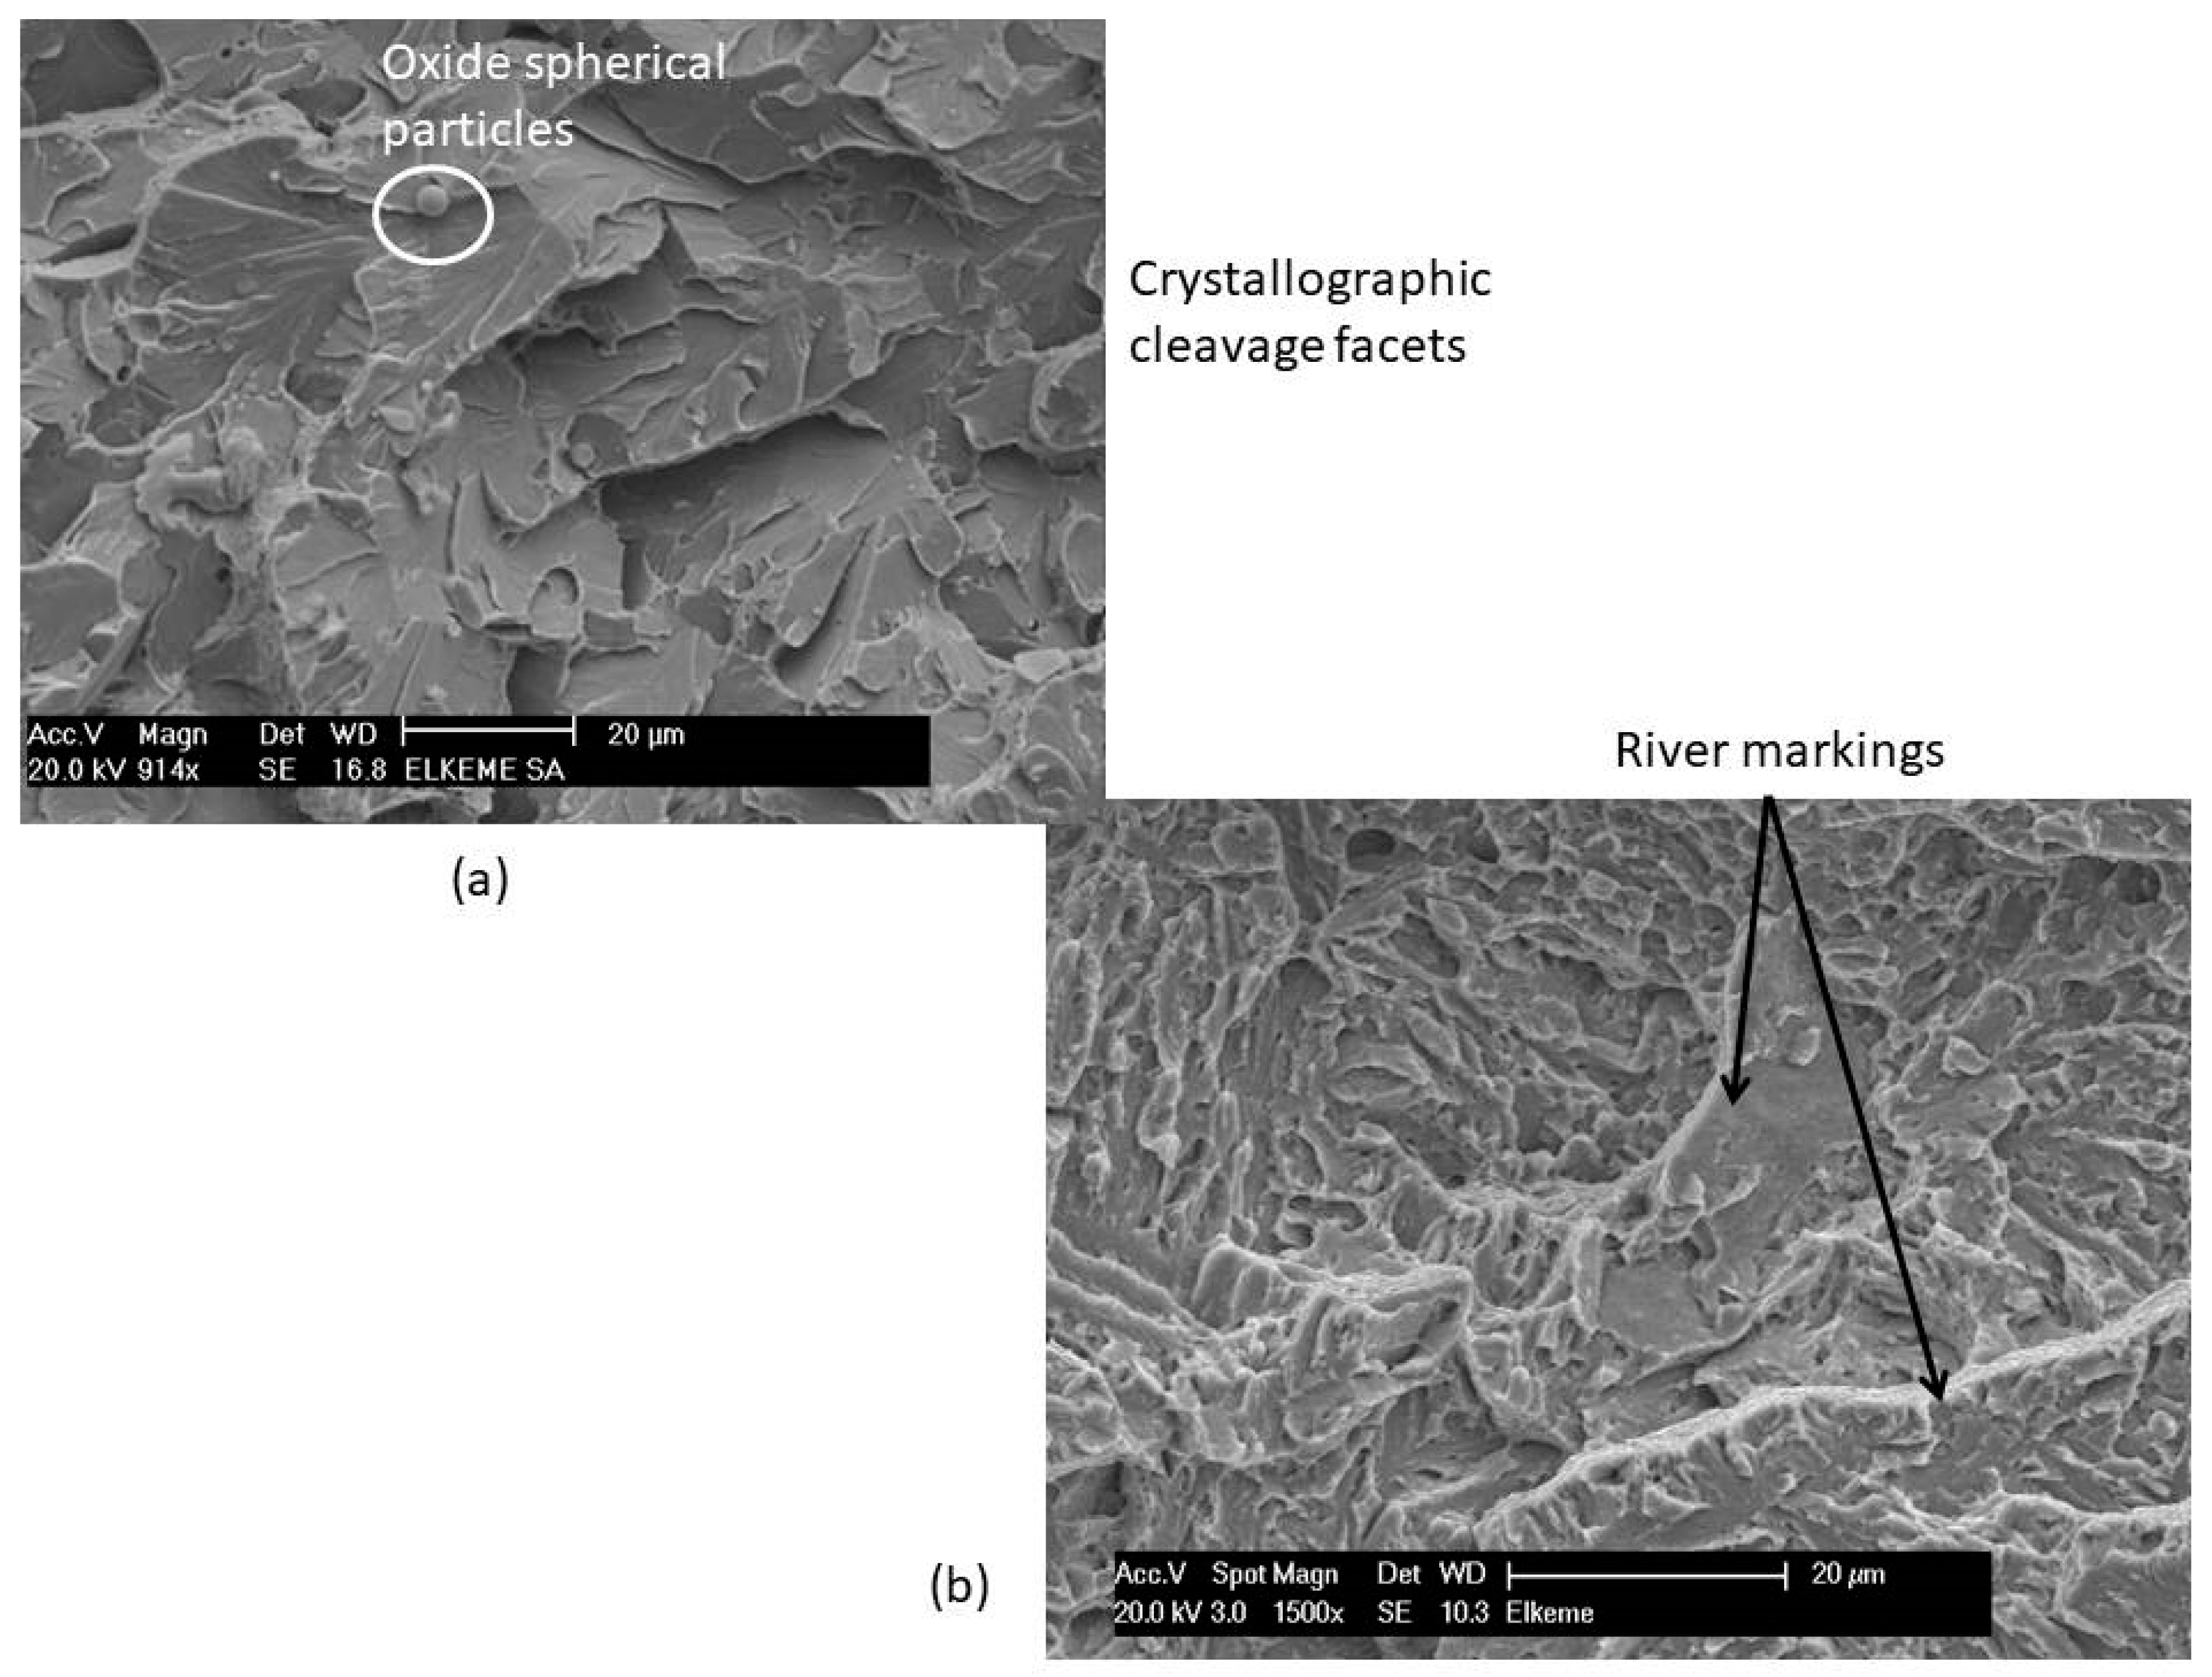
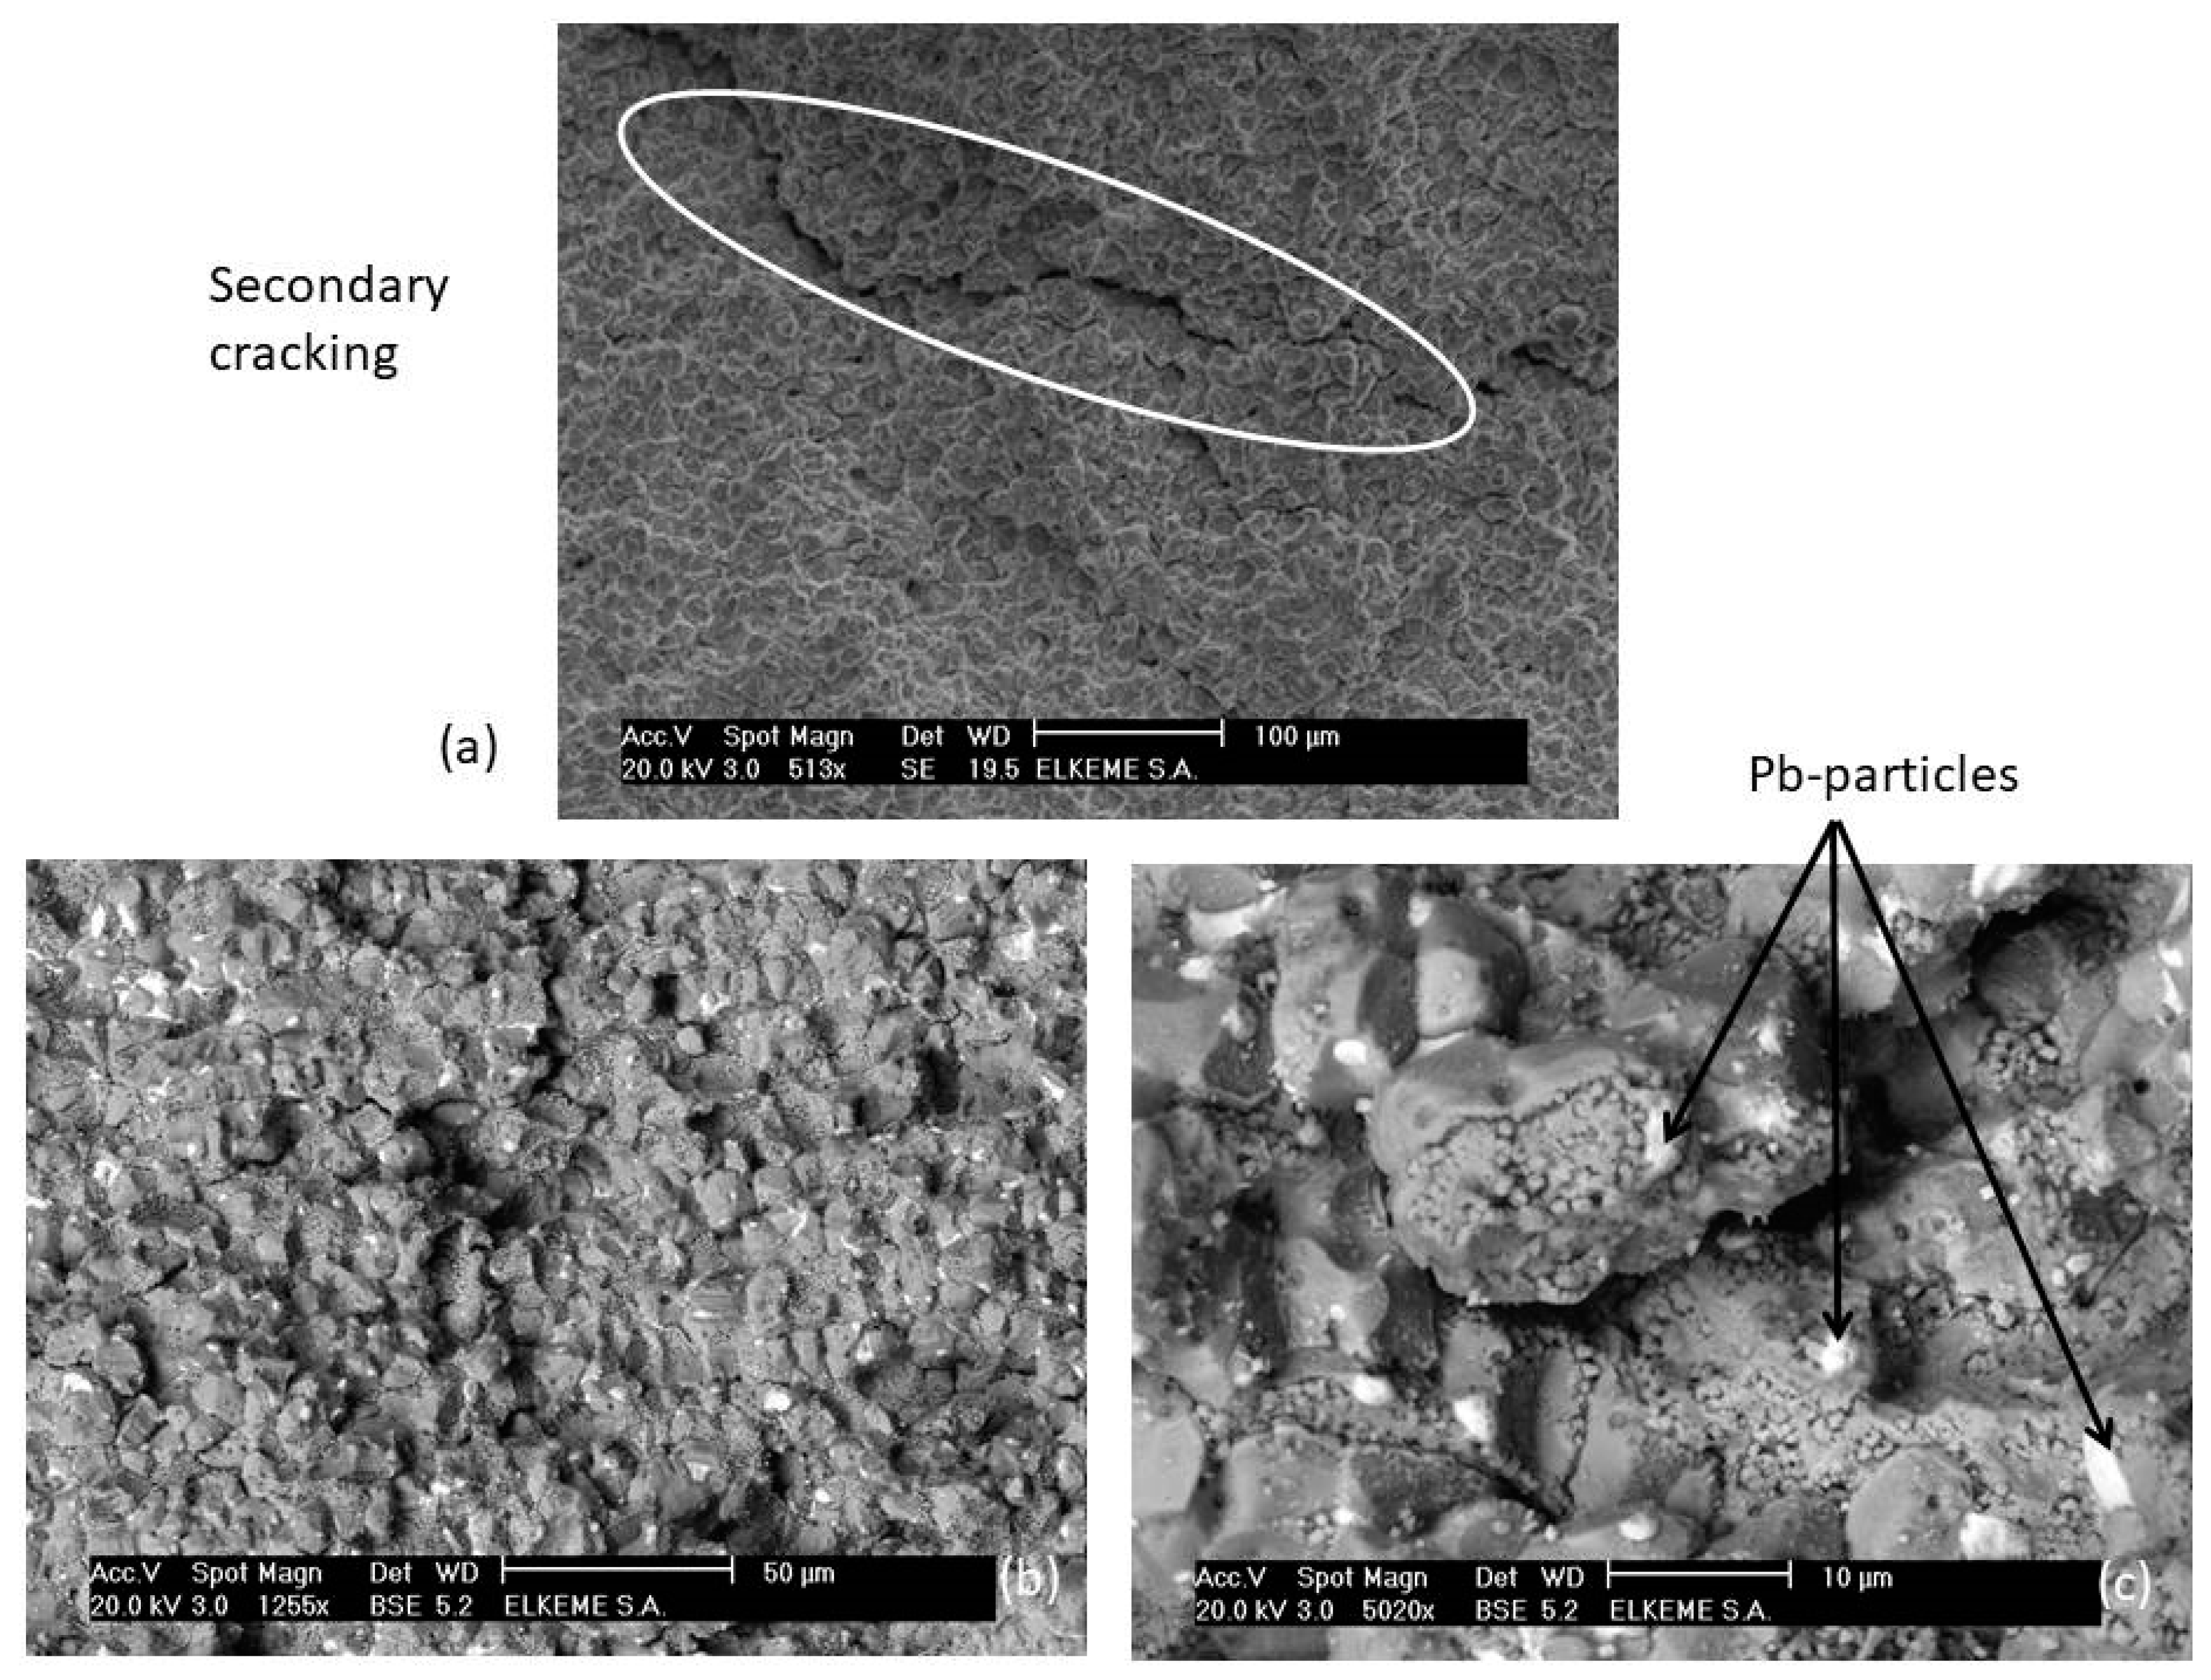
2.2.2. Low/Limited Ductility Fracture

In this class of fracture, there are two principal categories:
(a) Transgranular (cleavage) fracture; and
(b) Intergranular fracture
The cleavage fracture proceeds on {100} planes in <110> directions for body-centered-cubic (bcc) metals, while it seems somehow contradictory to Griffith’s thermodynamic criterion for brittle fracture, which foresees that the {110} should be the cleavage planes, showing minimum surface energy without any preferred crystallographic direction [8]. Since dislocation processes accompany cleavage, it has been postulated that preferred cleavage planes and directions are those of the lowest plasticity around the crack [8]. River-line patterns are characteristic features of transgranular (cleavage) fracture, represented topographically as plateaus connected by shear ledges, showing the direction of crack propagation [17]. The formation mechanism of river patterns is based on the change of the fracture mode from mode I with an increasing component of mode III [15]. A typical fractograph of the cleavage fracture of a steel chain link is given in Figure 2a [18]. In Figure 2b, a quasi-cleavage is shown, observed in a tool steel gripper’s teeth, where minute areas of plastic deformation are also evidenced [19].
Very frequently, intergranular fractures are observed rather than cleavage, due to either the concentration of low melting-point impurity phases or the segregation of impurity elements at grain boundary areas (such as V-group elements in steels). P, As, Sb, and Sn are considered as intergranular embrittling elements, while the development of Auger electron spectroscopy (AES) in 1969 assisted in the identification of a monolayer of such impurities at grain boundaries, which promotes embrittlement [8]. The presence of minor impurities, such as Bi and Pb, could induce severe damage due to hot shortness, leading to intergranular fracture in copper and copper alloys [20,21,22,23]. Pb particles could lead to the formation of micro-voids, enlarged by growth and coalescence by an adsorption-induced de-cohesion, or emission of dislocation, which results in intergranular damage evolution, see also [24]. Typical intergranular fracture in a leaded copper alloy is shown in Figure 3.
In case of lead-free heat treated CuZn42 copper alloy, an almost entirely IG (intergranular) fracture mode was observed under static and dynamic loading conditions [25,26]. In a previous study, the absence of Pb and the room temperature testing conditions rather ruled-out the possibility of the occurrence of hot-shortness as the main cause of the identified IG fracture. According to [26], the occurrence of such an IG fracture requires a salient interpretation based on the following notions:
Low stress intensity factor range (ΔΚ);
coarse β-phase in relation to the developed plastic zone size; and
high-angle grain boundaries.
All the above parameters could be considered as a potential that could act separately or synergistically, enhancing the possibility of the IG fracture for the heat treated CuZn42 alloy.

2.3. Progressive Fracture Mechanisms

This section elucidates the so-called “progressive fracture modes” or “delayed fracture modes”, pertaining to two main broad categories:
Fatigue Fracture (Section 2.3.1); and
Creep Fracture (Section 2.3.2).
Although the extent of the above subjects is undoubtedly complex and enormous, special emphasis is placed on the major fractographic aspects, which are commonly observed and are considered as the “fracture fingerprints” or “signatures”, in analogy to the previously presented sections.

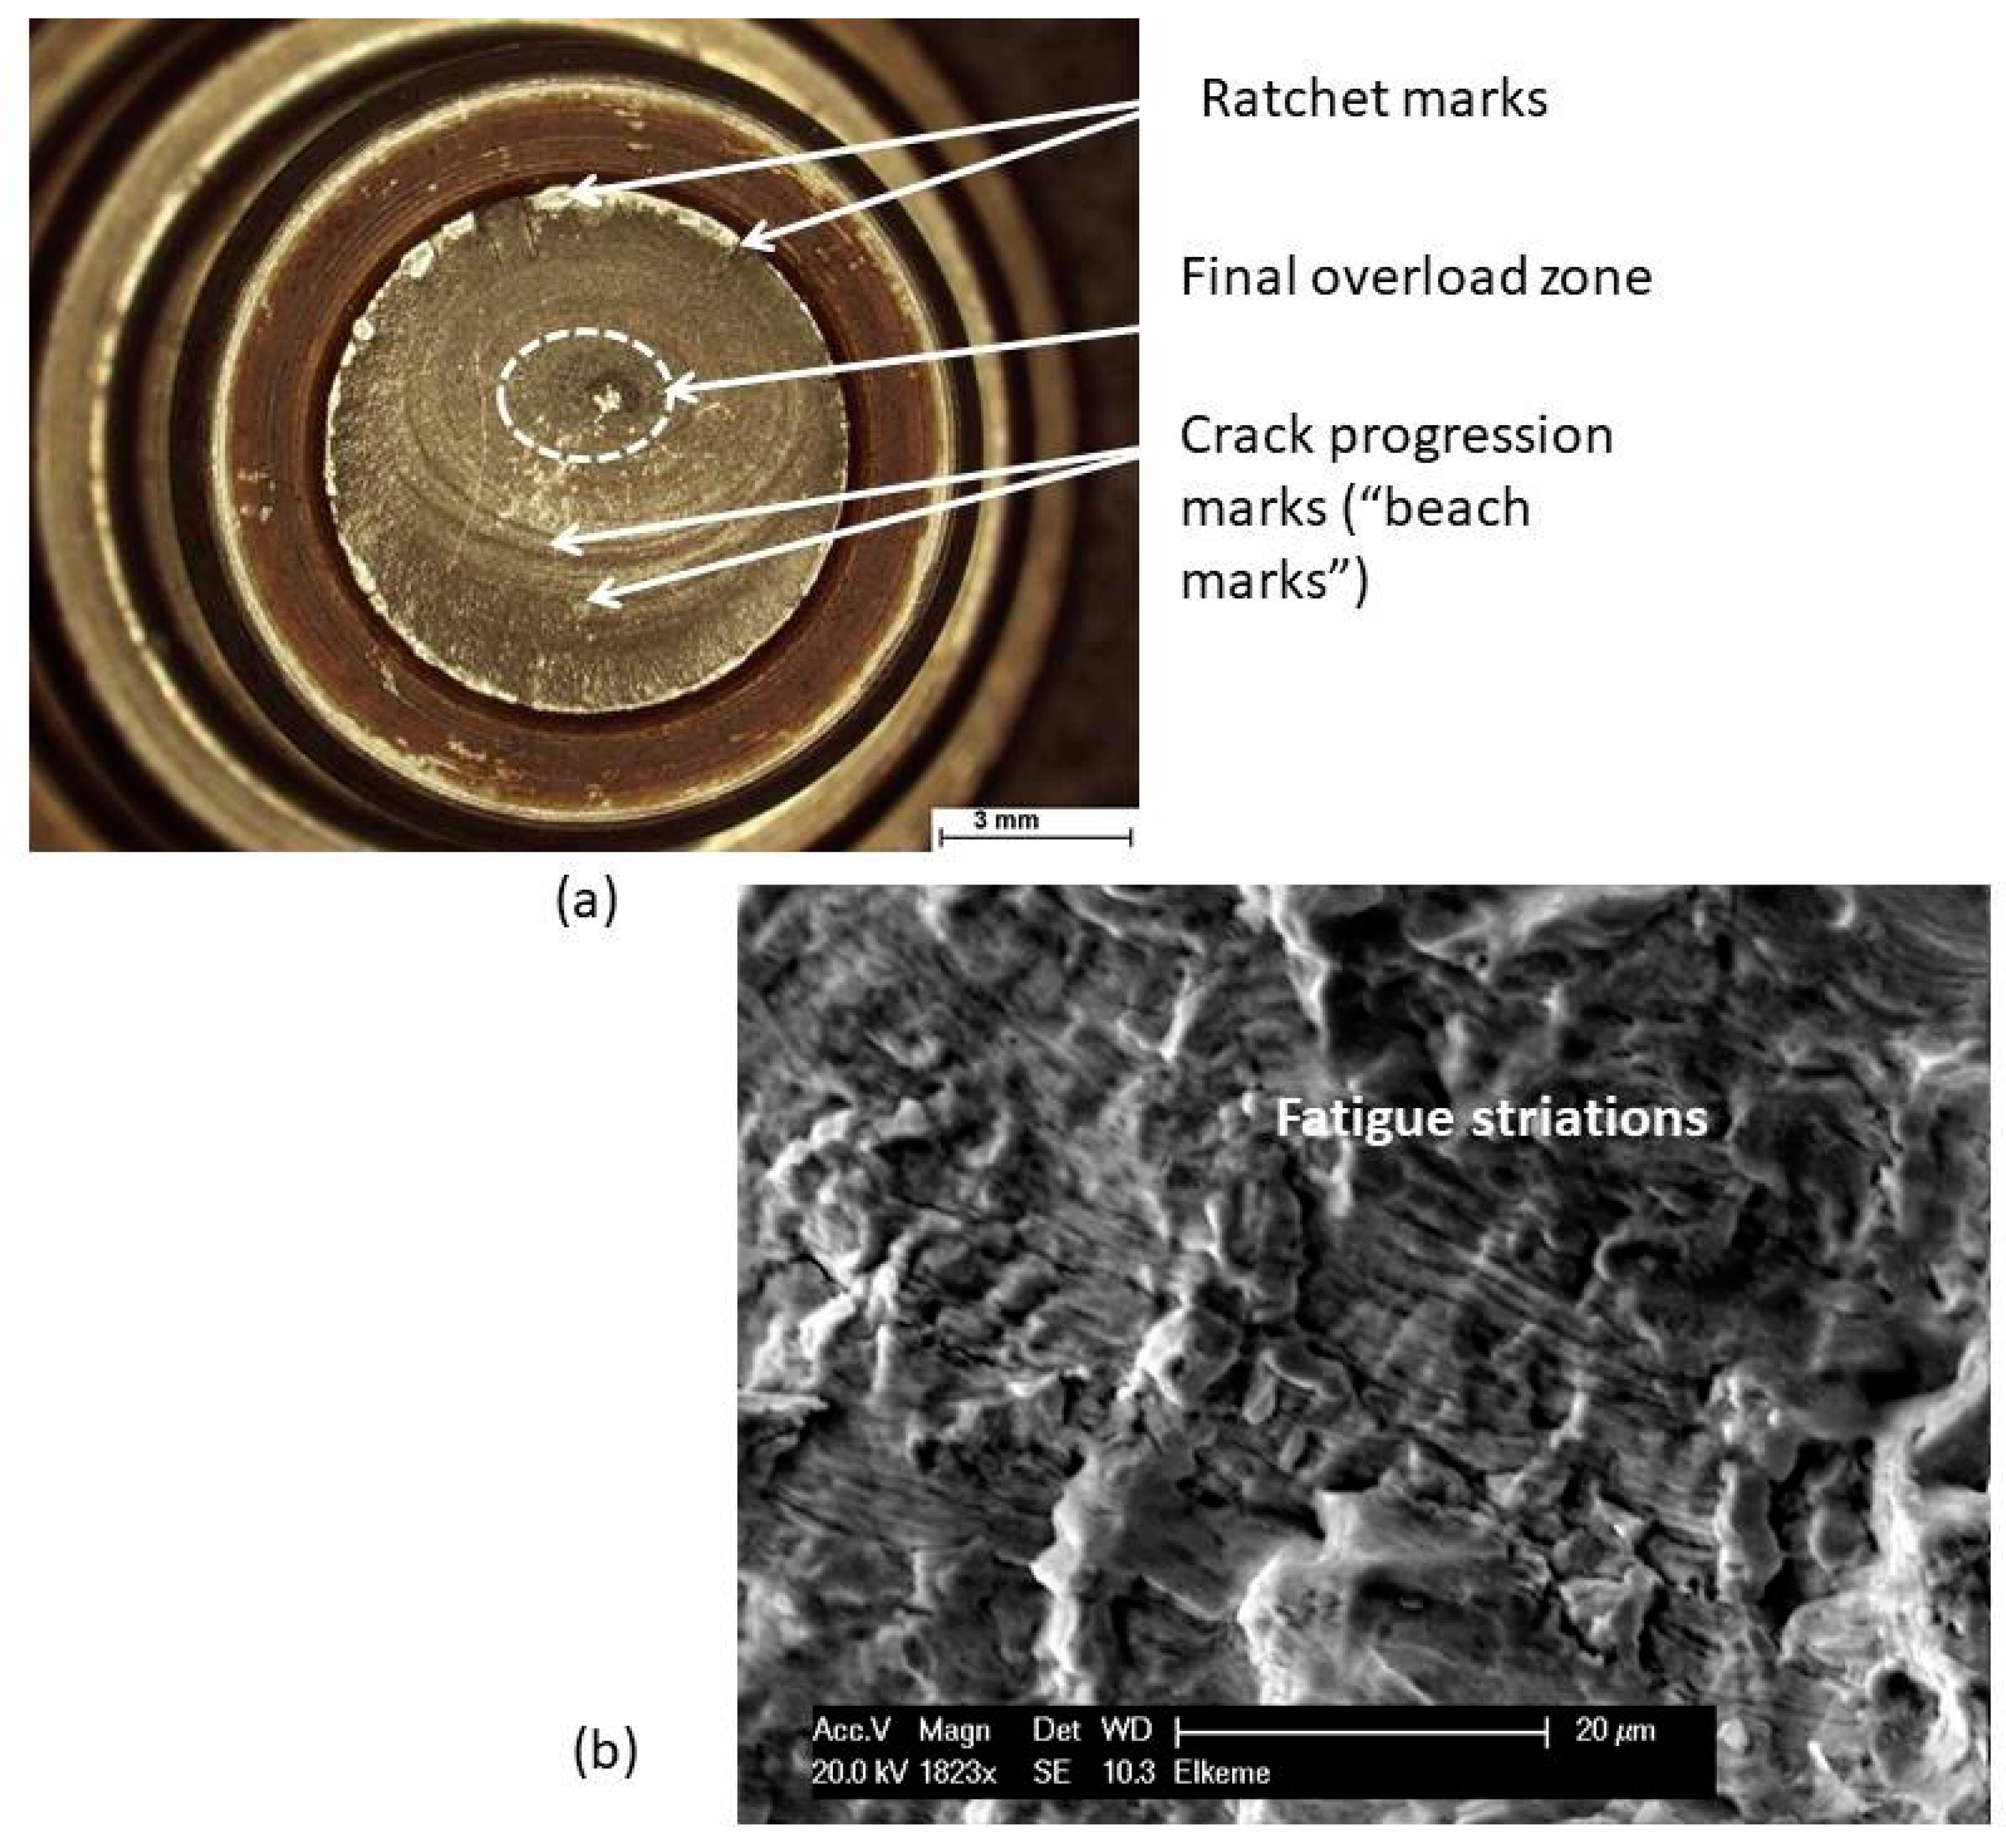
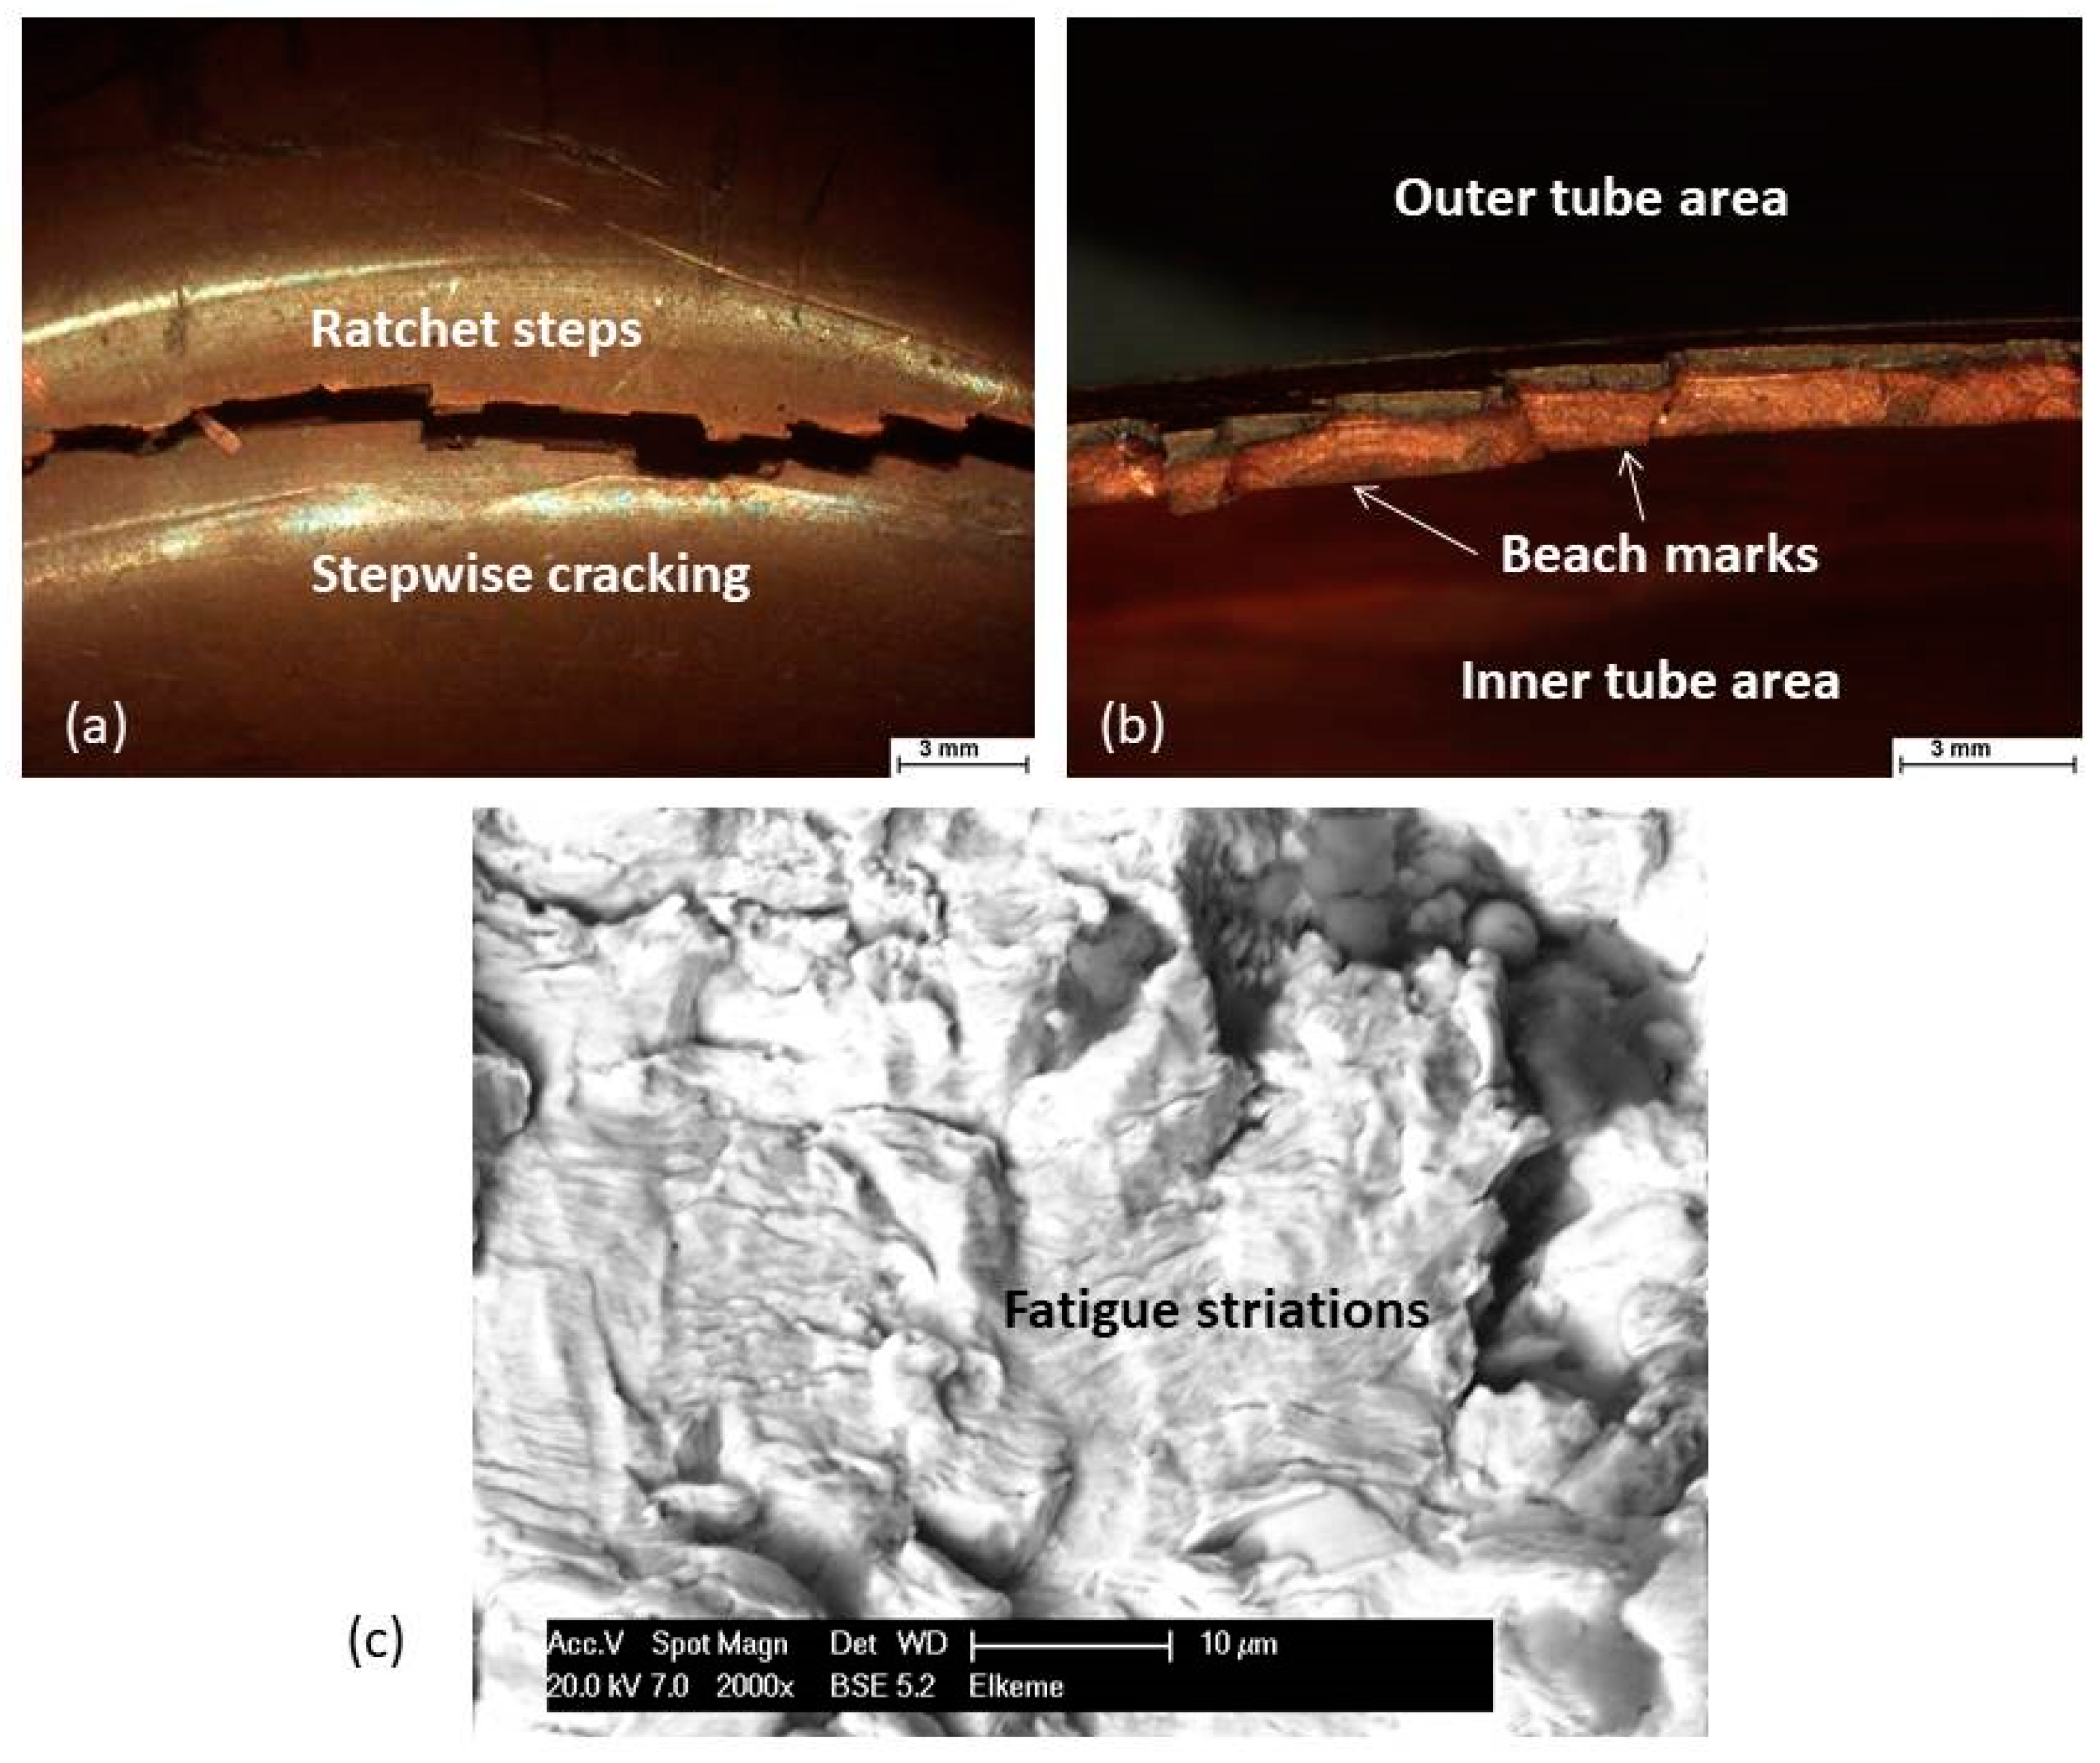
2.3.1. Fatigue Fracture

Fatigue failure is a progressive failure process that occurs under cyclic loading and it is comprised of three distinct stages: Stage I is related to the crack nucleation at 45° to the load direction (following slip planes); Stage II is the continuous crack growth, perpendicular to the stress up to the point when the remaining cross section can no longer withstand the applied load; and, finally, Stage III, which is the instant ultimate fracture due to overload [27]. The rate of crack propagation during Stage III fracture is almost equal to half of the speed of sound in the material. The majority of the mechanical components (shaft, gears, turbine blades, bearings, rolls, etc.) are subjected to cyclic/periodic loading conditions and, hence, the fatigue failure mode is the predominant fracture mechanism. As a rule of thumb, the time necessary for the nucleation of the fatigue crack is almost equal to 80–90% of the total lifetime of the machine element.
Macro-fractographic or visual observation of fatigue fracture reveals rather a smooth surface texture, comprising various topographic features; the most significant ones are the following (Figure 4), see also [27,28]:
(a)
Crack progression marks (also called beach marks or crack arrest marks). These are elliptical or semi-circular shaped marks, signifying a change of the position of the fatigue crack front. They are also related to the arrestment or decrease of crack growth due to the load interruption during machine operation, or due to the development of a compressive stress field ahead of the crack tip [27]; and
(b)
Ratchet marks. They look like “shear ridges”, separating successive crack fronts. The existence of ratchet marks indicates the presence of multiple crack initiation sites and high stress concentration conditions. Ratchet marks are created when cracks initiated at different positions are joined together, creating steps on the fracture surface (Figure 4a).
The final fracture zone (overload or instant fracture zone) is rough and its pattern corresponds either to ductile (dimpled) or low energy (transgranular or intergranular) failure, depending on the loading conditions, the mechanical properties, and the geometry of the component. The size of the overload zone with respect to the entire cross section is related to the magnitude of the loading conditions at the end of the fracture process; a large overload zone (approximately >70% of the whole section) indicates severe loading conditions as opposed to the small size overload zone (approximately <40% of the whole cross section). The presence, orientation, and extent of the above macro-fractographic features are widely used in failure analysis as diagnostic tracing marks of the loading history (régime and magnitude) and stress concentration conditions [2,3]. For instance, in Figure 4a, the evidence of multiple crack initiation sites (ratchet marks) around the roll pin circumference, together with the location and size of the ultimate failure area, suggest that the component failed due to rotating bending fatigue, under low applied load and high stress concentration conditions, see also [28].
Through SEM micro-fractography (SE imaging), a fine striation-pattern, which corresponds to a microscopic fingerprint of fatigue crack propagation (Stage II), can be also detected (Figure 4b). This topographic feature is a sign of microscopic plasticity and it is generated by blunting and re-sharpening of the crack-tip, during individual load cycles, known as Laird’s mechanism [27]. The striation spacing normally corresponds to the local fatigue crack propagation rate (da/dN).
In Figure 5, a bent deoxidized high phosphorus (DHP) copper tube, working in a refrigerating system, failed due to fatigue. The pulsating loads applied due to alternating pressure conditions and the residual stresses imposed during bending constitute synergistic parameters of the imminent fatigue fracture [29]. The stepwise crack extension fashion, denoted by the presence of ratchet steps, is a plausible indicator of stress concentration on the outer bent area.

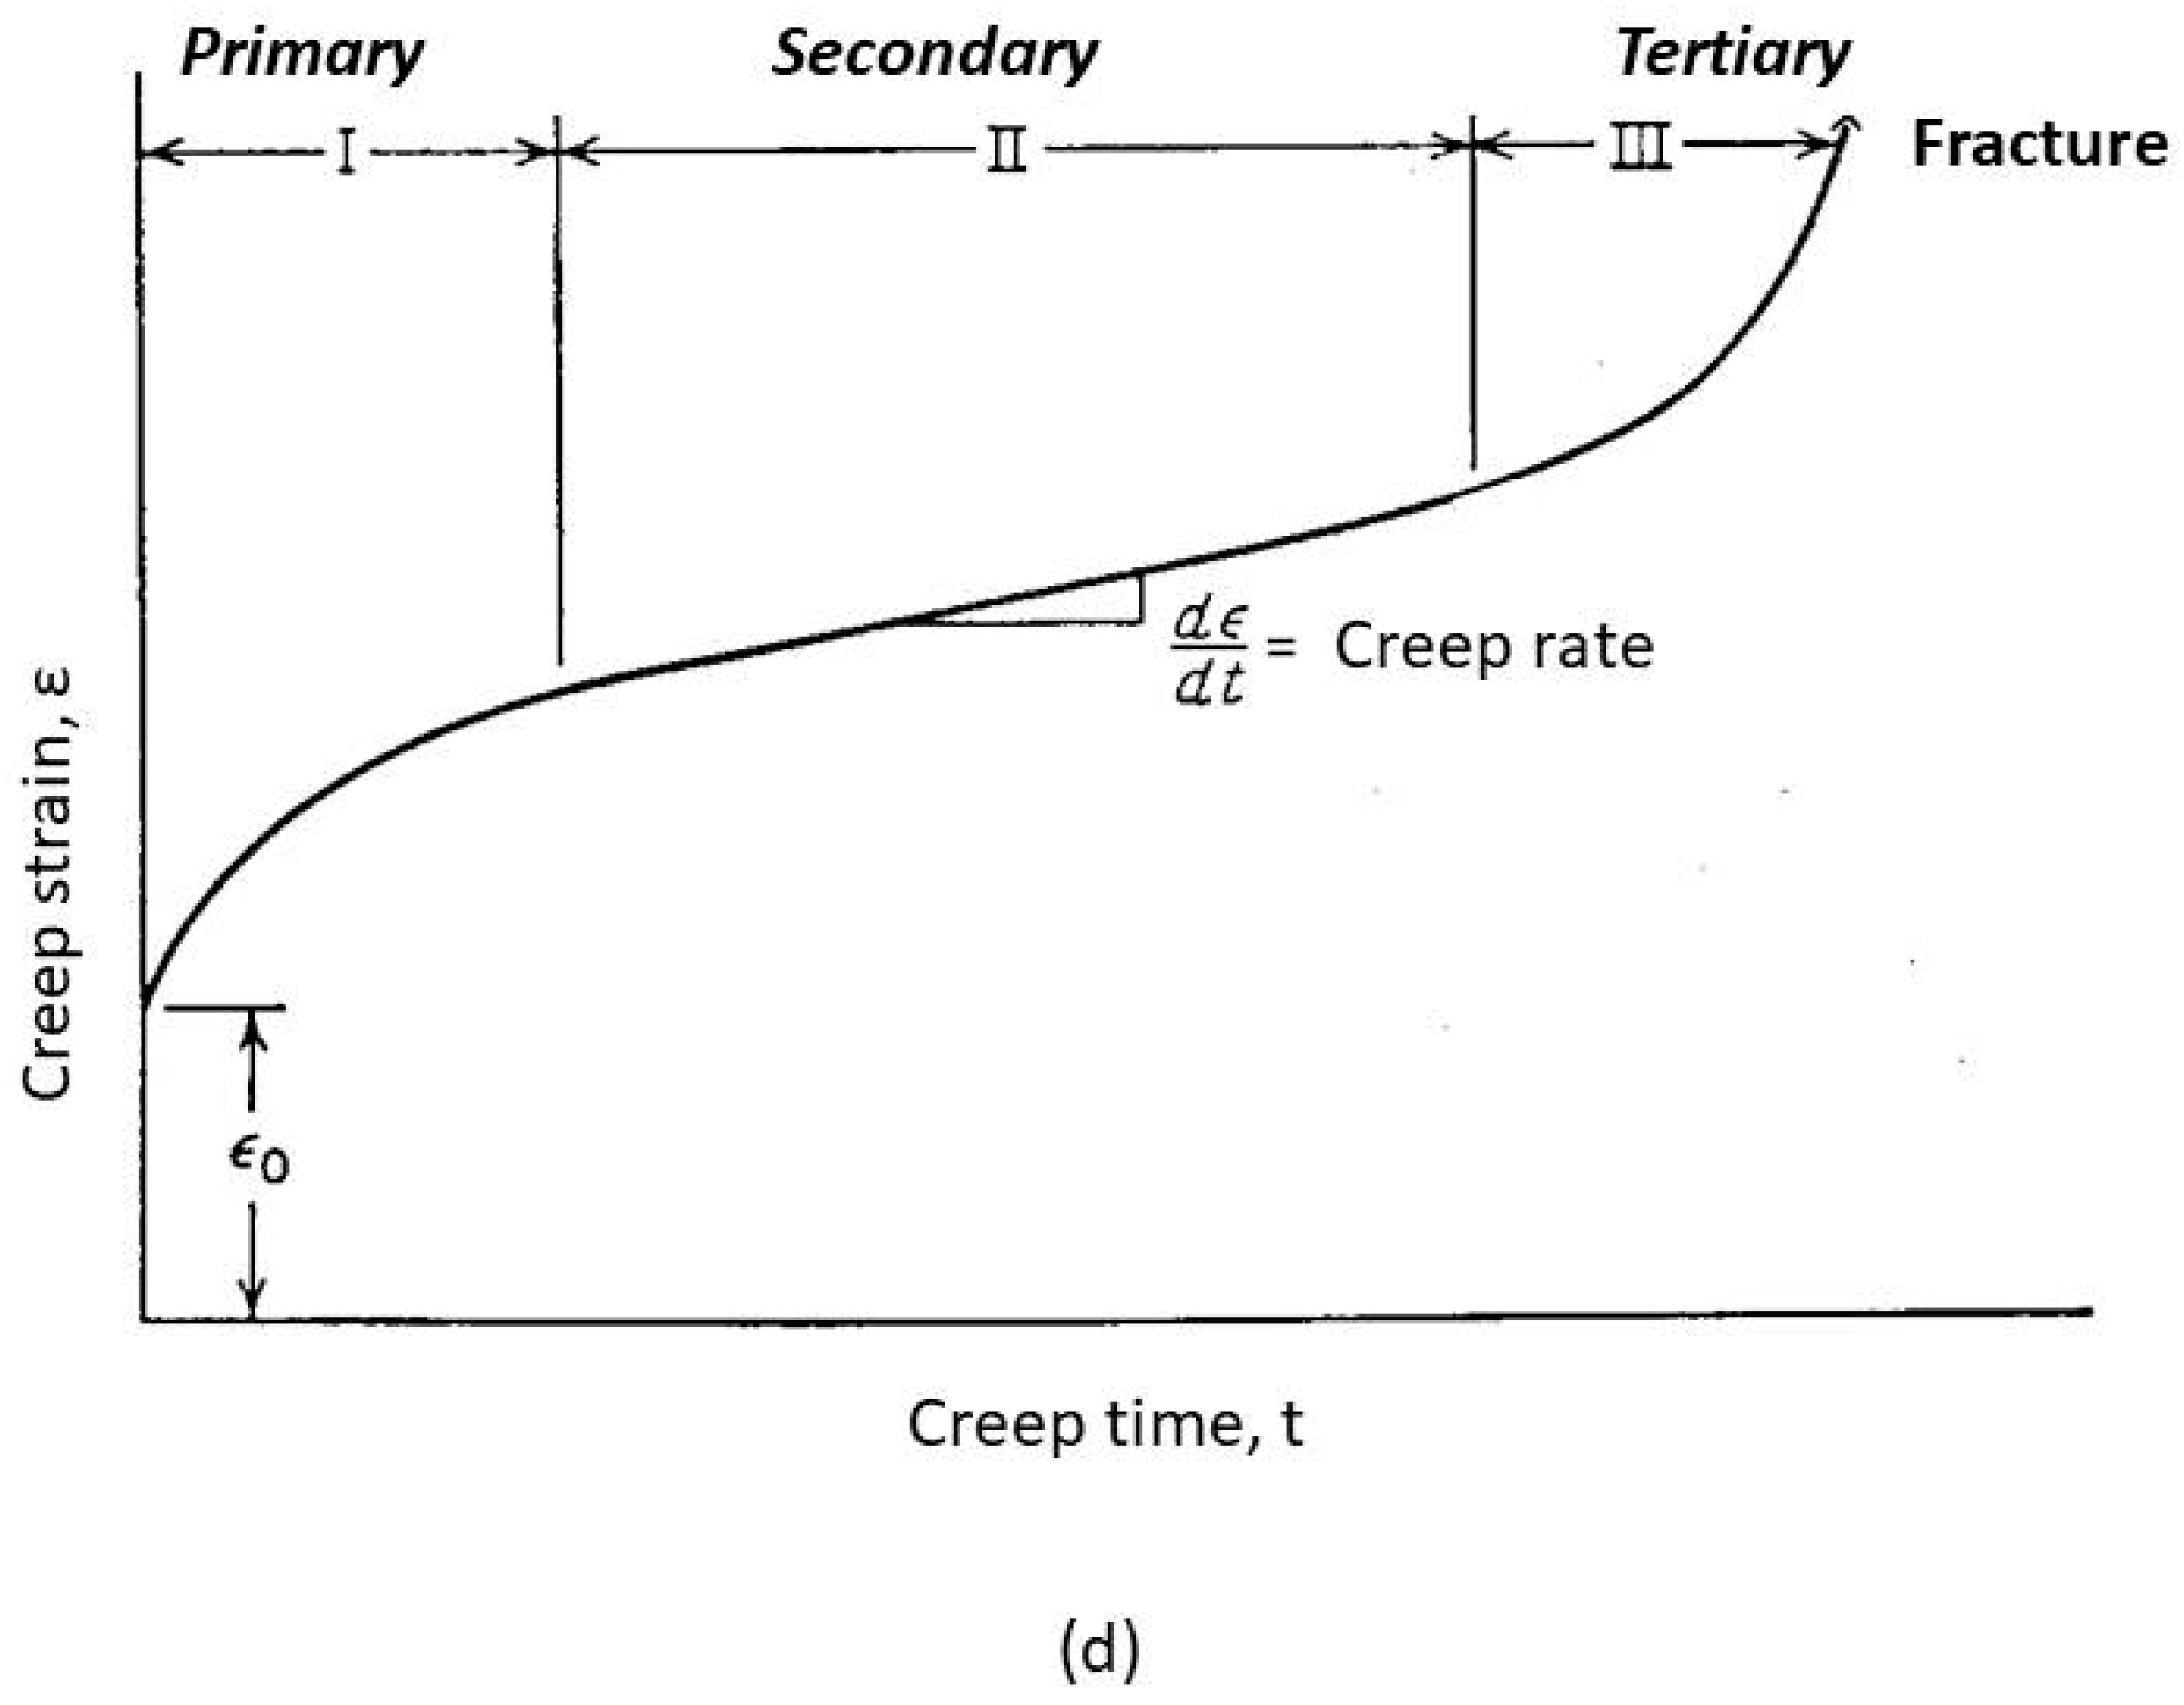
2.3.2. Creep Fracture

Metallic components show a lower lifetime when operated under high temperature conditions, e.g., in energy generation systems, power plants, gas turbines, chemical process industries [6]. Depending on the dominant environmental and stress conditions, the metallic structural parts suffer from creep-originated, environmentally induced fractures, high temperature fatigue, and thermal fatigue. Creep is realized through the nucleation and growth of transgranular or intergranular voids depending on the applied operating conditions, driven by diffusion and dislocation motion as a result of simultaneous application of stress and heat input, see also [30]. Creep is a progressive time-dependent plastic deformation, which leads to final failure with potential destructive consequences to health, safety, and the environment. It is noteworthy that remaining service life assessment techniques constitute a significant framework in failure prediction, resulting in cost minimization, due to its contribution to the maintenance planning and scheduling of high temperature process equipment, without unnecessary replacements and avoiding the risk of catastrophic property losses with severe implication to human, health, and environmental safety. Methods, using the classical Larson-Miller parameter (LMP) expressed in Equation (3) and life fraction rules using the damage accumulation concepts, are very widely applied in remaining life prediction, assisted also by finite element analysis techniques, see [31,32,33]:
L M P = T · ( 23 + l o g t )
where, T is the operating temperature (K) and t the operation time (h).
Creep rupture curves present the variation of stress variation, as a function of the Larson Miller parameter. Knowledge of stress and temperature conditions could therefore lead to the estimation of the creep lifetime at a certain statistical confidence level. The life fraction rule is applied for the calculation of the remaining life of structural elements, working at high temperatures, see Equation (4):
t o p T o p + t t e s t T t e s t = 1
where, top is the operating time, Top is the total operating time under service conditions, ttest is the time required for rupture at the test under accelerating creep conditions, and Ttest is the time for rupture of the fresh component under the above accelerating creep conditions.
In the case of creep failure of superheater pipes (ferritic steel 15Mo3 grade, working at 500 °C approximately), a characteristic “fish-mouth” deformation pattern is evidenced, see [34]. Macro-fractographic observations performed on the pipe ruptured lips are illustrated in Figure 6a. A typical ductile fracture surface consisting of profuse elongated dimples is directly identified, signifying the occurrence of exhaustive plastic deformation (Figure 6b). Large equiaxed cavities developed from the growth and linking of creep voids of a smaller size were readily discerned (Figure 6c). Elongated dimples corresponding to the initial grain orientation to the original pipe metal forming operation are evidenced (Figure 6b). Isolated areas of transgranular facets and ductile tearing are found in the interior of the dimples (Figure 6c). The evolution of cavitation is, therefore, a significant fingerprint of creep damage evolution across the pipe wall.
The idealized creep curve is shown in Figure 6d and it consists of three stages (primary, secondary, and tertiary creep). Following a primary creep stage (I), where strain is increased at relatively high rates, the creep rate decreases, reaching a steady state value (dε/dt) at the secondary phase of creep. During the third creep stage (known as tertiary creep), the creep rate is asymptotically increased up to the final failure. Tertiary creep usually occurs under high stress–high temperature conditions. During third stage creep, an effective reduction of cross-section happens, and various microscopic degradation phenomena take place, such as massive void formation (cavitation) and microstructural changes driven by diffusion processes (e.g., intermetallic phase coarsening) and recrystallization [17].
Creep and fatigue interaction is the progressive time-dependent inelastic deformation under constant temperature and variable loading conditions. The creep-fatigue process is accompanied by many different slow structure rearrangements, including dislocation motion, aging of the microstructure, and grain boundary cavity formation [35]. In a relevant study, creep-fatigue crack growth rate tests were performed on a specially designed program test cycle. In a relevant study, continuum damage mechanics were applied to estimate creep damage under multi-axial loading conditions [36]. Using the compact tension (C(T)) specimen, a creep-fatigue crack growth test was realized in 12Cr1MoV steel at 550 °C. Finally, the application of the creep stress intensity factor (as a creep-damage-sensitive parameter) for creep-fatigue interaction was discussed. The coupled micro-damage and macro-fracture analysis involves the definition of the creep crack-tip stress field model, induced by the application of the ductility-based model and the formulation of the damage evolution and constitutive equations regarding creep-strain rate behavior. The effect of the specimen thickness on the stress and process zone was studied and reproduced utilizing a full-field 3D finite element (FE) model [36].

3. Failure Analysis and Selected Prevention Strategies

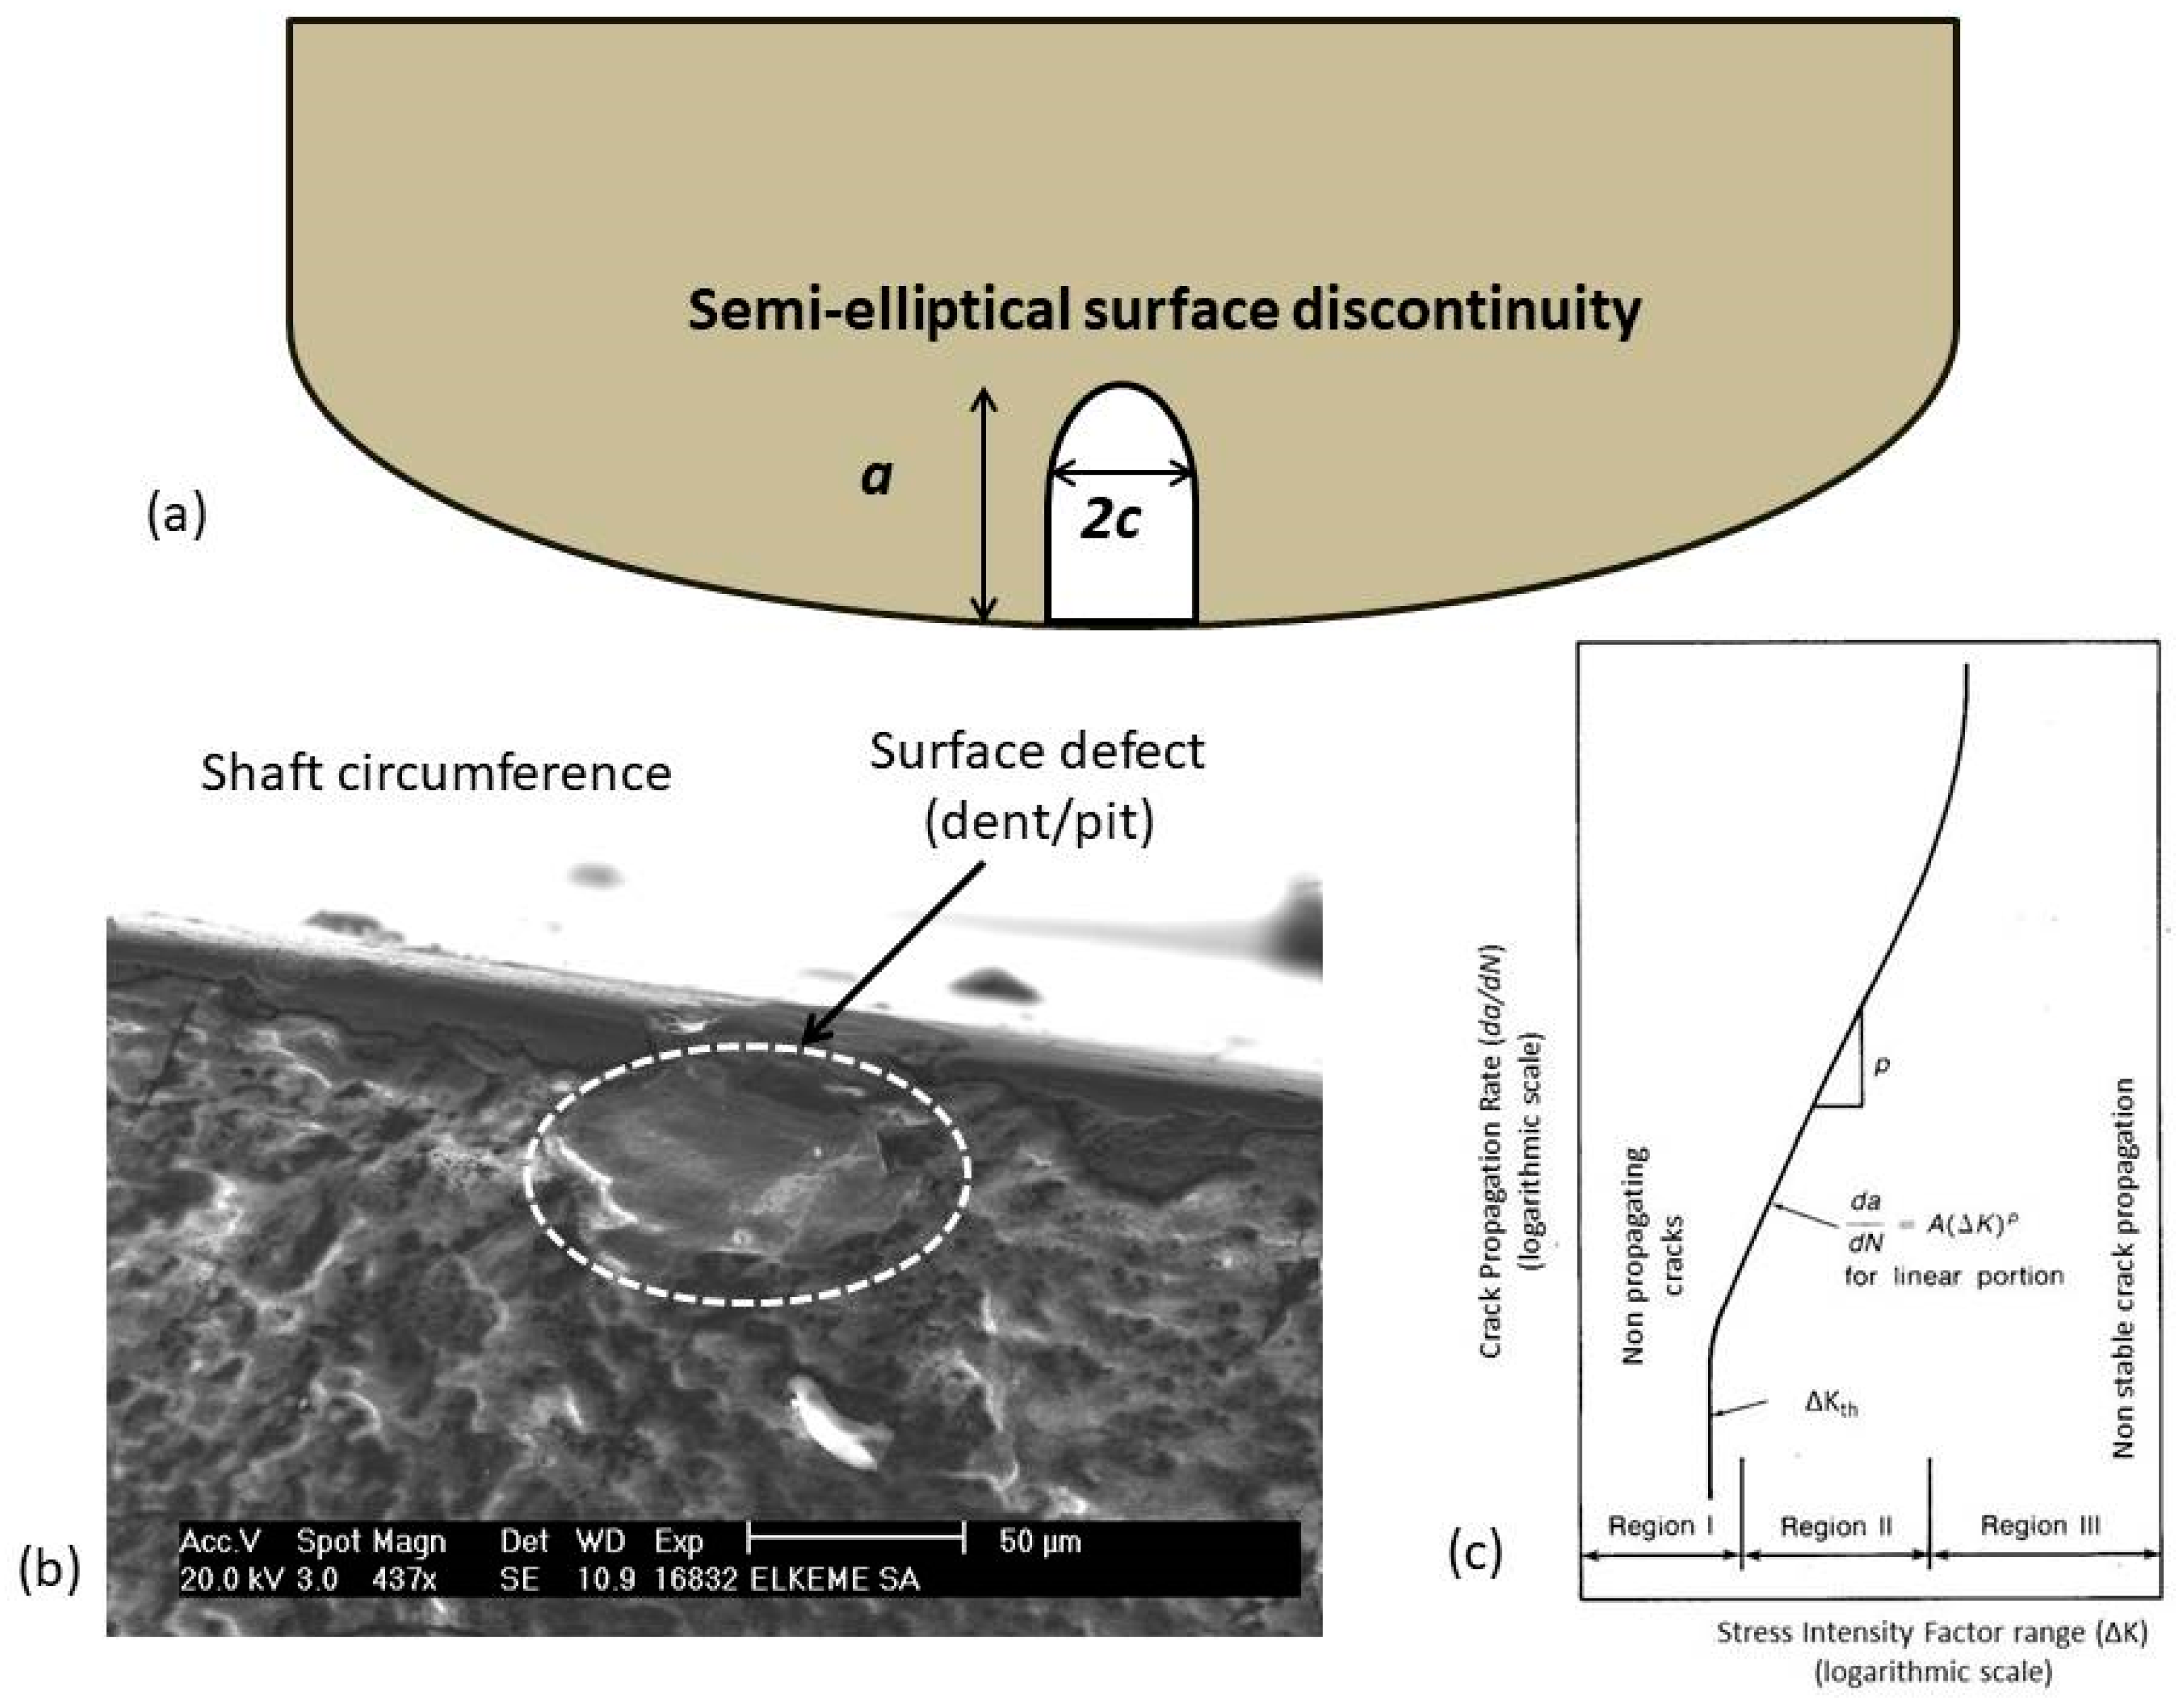
3.1. Fracture Mechanics Approach

The main aspects of fracture mechanics, which can be considered as the corners of a triangle, are the following: Loading, material toughness, and defect crack size. If two corners of the triangle are given, the third one can be estimated.
  • The fracture resistance (toughness) of the material and the crack size are both known. Then, the critical load can be estimated and a decision can be made whether further operation is safe or not;
  • the loading conditions and the maximum (undetected) crack or minimum (detectable) crack size specified, which can be accurately measured by quality control, are known. Based on this information, a minimum fracture resistance (toughness) of the material can be ascertained used for material selection or during the design stage; and
  • for a given fracture resistance (toughness) and loading conditions, a critical crack or defect size can be calculated and used as further information for non-destructive testing (NDT).
A review of the emergence of fracture mechanics in failure analysis projects is comprehensively attempted in [37]. It is noteworthy that the utilization of fracture mechanics in FA creates some issues related with conservatism, originating mainly from different sources, such as uncertainties and a lower number of data, critical stress intensity factor estimation (KIc), and the consideration of an extremely sharp crack tip size (zero-tip radius).
The present approach encompasses mostly the principal aspects of linear-elastic fracture mechanics (LEFM), while a limited involvement of elastic-plastic fracture mechanics (EPFM) is intended. The topic and the contribution of fracture mechanics are quite extensive and the potential utilization in FA is very promising. In this short reference, an attempt was made, focused on the following important parameters in FA investigation:
(a)
Predicting the critical defect size that can be permissible to the applied loading conditions; and
(b)
estimating the fracture resistance using standard methods.
The first point can provide significant input in non-destructive-testing techniques, where defect size is monitored and replacement of critical components can be precisely forecasted.
The presence of surface or internal defects, such as grooves from machining, dents/pits, inclusions, etc., are considered potential sites for fatigue crack initiation and propagation (Figure 7). Using the assumptions related for short cracks extending from minute surface flaws, see [38,39], the following expression representing the Murakami-Endo approximation, given by Equation (5), can be applied, employing the mean surface Vickers hardness of the material:
σ r , t h = 2.86 · ( H V + 120 ) · ( A ) 1 6 · 1 R 2 ( 0.226 + 10 4 · H V )
where, σr,th is the threshold stress range (MPa), HV is the Vickers indentation hardness, A is the defect projection area normal to the maximum stress (μm2), and R is the stress ratio (equals to σminmax, for a pure tensile stress regime, σmin = 0, R = 0).
Equation (5) can be applied to a wide range of materials possessing high and low ductility behaviour (more brittle), ranging within the Vickers hardness range: 70 < HV < 720 [39].
Under this stress range level (σr,th), the crack does not propagate or it advances at very low (rather negligible) rates. Equation (5) can be re-written using, ΔKth instead of σr,th, under the principal LEFM expression, see Equation (6):
Δ K t h = σ r , t h · π · a
where, ΔKth is threshold stress intensity range and α is the semi-elliptical defect size (Figure 7a).
In a recent work, the above analysis was used to analyze the level of stress required for the propagation of fatigue crack in an austenitic stainless steel propeller shaft, due to the presence of a mechanical surface defect [40]. The fatigue crack origin located on a surface defect appeared as a “dent or pit” coming most probably from localized mechanical damage (Figure 7b), see also [40]. The investigation findings suggested strongly that the propeller shaft failed due to combined rotating bending/torsional fatigue initiated from the shaft periphery and close to the keyway. The formation of surface defects is responsible for the initiation and propagation of fatigue cracks. The presence of a semi-elliptical surface defect actuates the propagation of fatigue cracks for applied tensile stress threshold above 590 MPa, for R = 0. For completely reversed loading conditions (R = −1), the threshold alternating stress is 355 MPa, which is almost approximately 30% of the shaft tensile strength (1000–1200 MPa).
The characteristic shape of crack propagation rate (da/dN) as a function of the stress intensity factor range (ΔK) is shown in Figure 7c. The curve is divided in three regions [17,39]:
In Region I, where there is a stress intensity threshold range (ΔKth), below which fatigue cracks do not propagate (or propagate at quite low rates);
in Region II, noted as the continuous crack propagation region (linear portion of the log-log diagram), where Paris law is in effect; and
in Region III, where fatigue cracks propagate unstably up to the point where the maximum stress intensity factor takes the value of the critical stress intensity factor (KIc), resulting in overload fracture (intergranular, transgranular, or dimpled fracture).
The second point serves in the determination of the required or the expected fracture mechanics properties, which are foreseen by the standards or by the customer’s/design requirements. The fracture toughness is often confused with impact toughness, which corresponds to the energy absorbed during dynamic loading applications, such as foreseen during the Charpy test (CVN = Charpy V–notched value), using a 45°, 2 mm notched specimen of dimensions 10 × 10 × 55 mm3 [41]. However, the most suitable testing fracture mechanics methods refer to the determination of LEFM properties, such as the critical stress intensity factor (KIc), and EPFM properties, such as J-integral and Critical-Crack-Tip-Opening-Displacement (CTOD), see [42]. In previous works, the fracture mechanics properties, such as CTOD of extruded/drawn and heat treated copper alloys, were experimentally determined [26,43]. The CTOD value represents the distance between the crack flanks, which corresponds to the extent of plastic deformation at the onset of unstable fracture propagation. For bend type specimens, the CTOD values (δ) comprise two main components, the elastic and plastic one, see Equation (7):
δ = δ e l + δ p l =   [ S B · P W 1.5 ·   g 1 ( a o W ) ] 2 · 1 v 2 2 Y S · E +   0.4   ( W a o ) 0.6 a o + 0.4 W + z · V p
where, S is the span distance between outer bending supports, P is the load, B is the specimen thickness, W is the specimen width, g10/W) is the stress intensity function, α0 is the average original crack length, ν is the Poisson’s ratio, E is the Young’s modulus, Vp is the plastic component of CMOD (Crack-Mouth-Opening-Displacement), z is the knife edges’ thickness, and YS is the material yield strength (actually the 0.2% proof strength is used, Rp0.2).
Apart from the critical CTOD values, the Load vs. Crack-Mouth-Opening-Displacement (CMOD) curves, denoted also as P-V graphs, constitute additional indicators of the fracture behaviour for tested alloys and their metallurgical conditions. The “type 6” curves, as categorized by BS 7448-1 standard [42] and the absence of abrupt load-drops (“pop-in’s”), due to localized instabilities, signify adequate crack arrestment and fully plastic behaviour [26]. Therefore, the assessment of fracture mechanics properties, together with the rest of the fractographic and load-displacement behaviour evidence, provide vital information, simulating the actual material behaviour under the real service conditions, resulting in design optimization aiming to prevent failure.
Various fracture mechanics models are used to analyze the fracture toughness of notched components; the most known ones are the theory of critical distances (TCD) [44,45], strain energy density (SED) [46], and cohesive zone model (CZM) [47]. The rigorous elaboration of the above mentioned fracture mechanics models is out of the scope of the present work; rather a short highlight of the TCD is worth mentioning.
The theory of critical distances (TCD) consists of a framework of methods introducing the critical distance or length parameter [44]. This length parameter is expressed in Equation (8):
L = 1 π · ( K m a t σ 0 ) 2
where, Kmat is the fracture toughness of the material, while σ0 is the inherent strength parameter.
In case of full LEFM conditions, σ0 coincides with the ultimate tensile strength (σUTS). A relevant study of the fracture toughness of U-notched components using the TCD is given in [45].
The parameter, L, presented as the length constant, can be calculated in various different ways [44,45]. Particularly, a number of researchers have proposed that failure can be predicted by modifying the critical stress idea so that the stress to be used is not the maximum stress (at the notch root), but the stress at a point located at a certain distance from the notch. Other researchers have used the average stress on a line starting from the notch. These two techniques, which are called as the point method (PM) and line method (LM), are very popular and they are proposed for further use in fatigue.
Cracks and notches in components and structures are frequently subjected to complex loading under states and combinations of normal and shear stresses ahead of the crack tip. Mixed-mode fracture mechanics deals with experimental studies and theoretical models for predicting the onset and path of crack propagation under the combination of Mode I (opening), Mode II (sliding), and Mode III (tearing) conditions [48]. Problems of this type are considered in case complex materials, such as welded structures, adhesive joints, and composites, in plain and reinforced concrete structures, aircrafts, bridges, etc. A mixed-mode superposition can also occur during crack branching, i.e., when a crack changes path and the classical energy balance of Griffith’s theory can no longer be valid in a simple way, since cracking is not collinear, as it has been assumed previously [49].
Fast fracture and crack arrest is a highly specialized topic in fracture mechanics. The problem of dynamic fracture is considered mainly in to two basic areas: In pipelines and thick-walled pressure vessels [39]. In gas pipelines, the dynamic fracture issue rises from the rapid gas depressurization and the release of a decompression shock wave. In the case of a liquid-filled pipeline, the higher speed decompression shock-wave leads to a subsequent load release and to possible crack arrestment. The problem of crack propagation and arrestment in this type of structure (pipelines) is viewed in terms of dynamic energy balance. Dynamic fracture in thick walled pressure vessels considers the presence of partially through-the-wall cracks initiated from the inner wall surface. Unstable crack propagation becomes feasible upon thermal shock (caused due to rapid cooling of the interior of pressure vessel), which leads to the development of high tensile stress fields imposed at the inner wall.

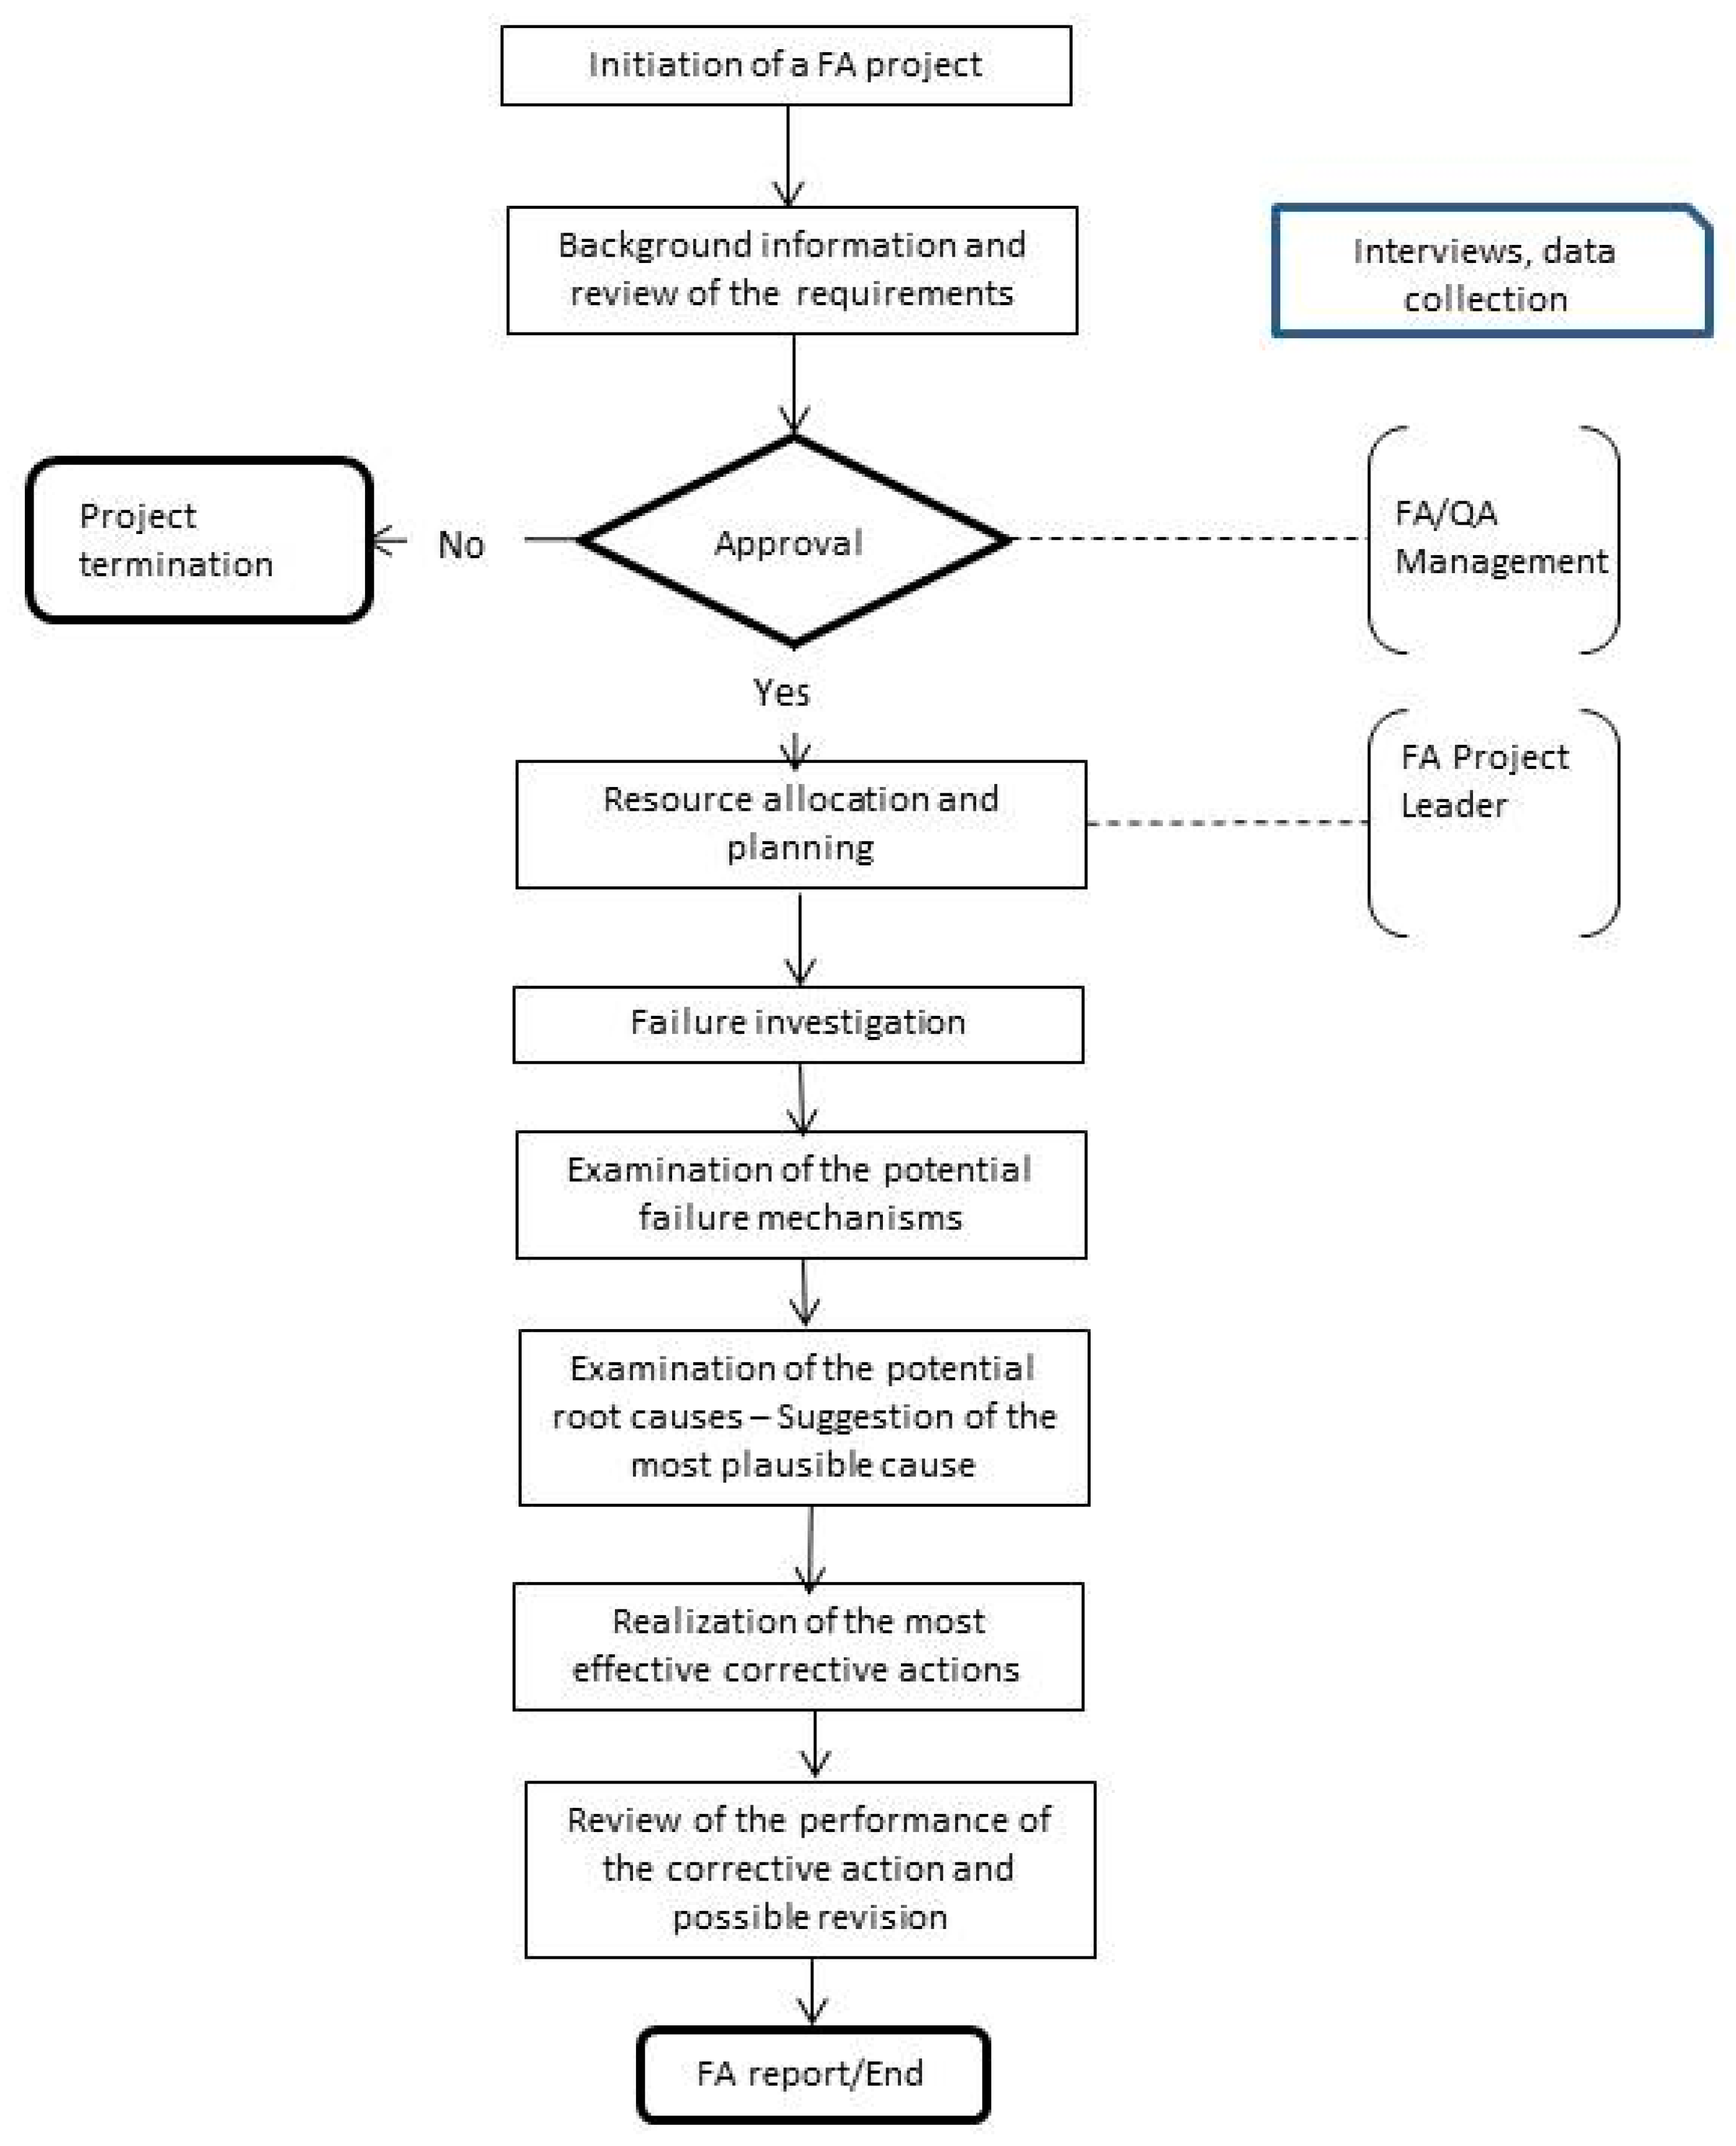
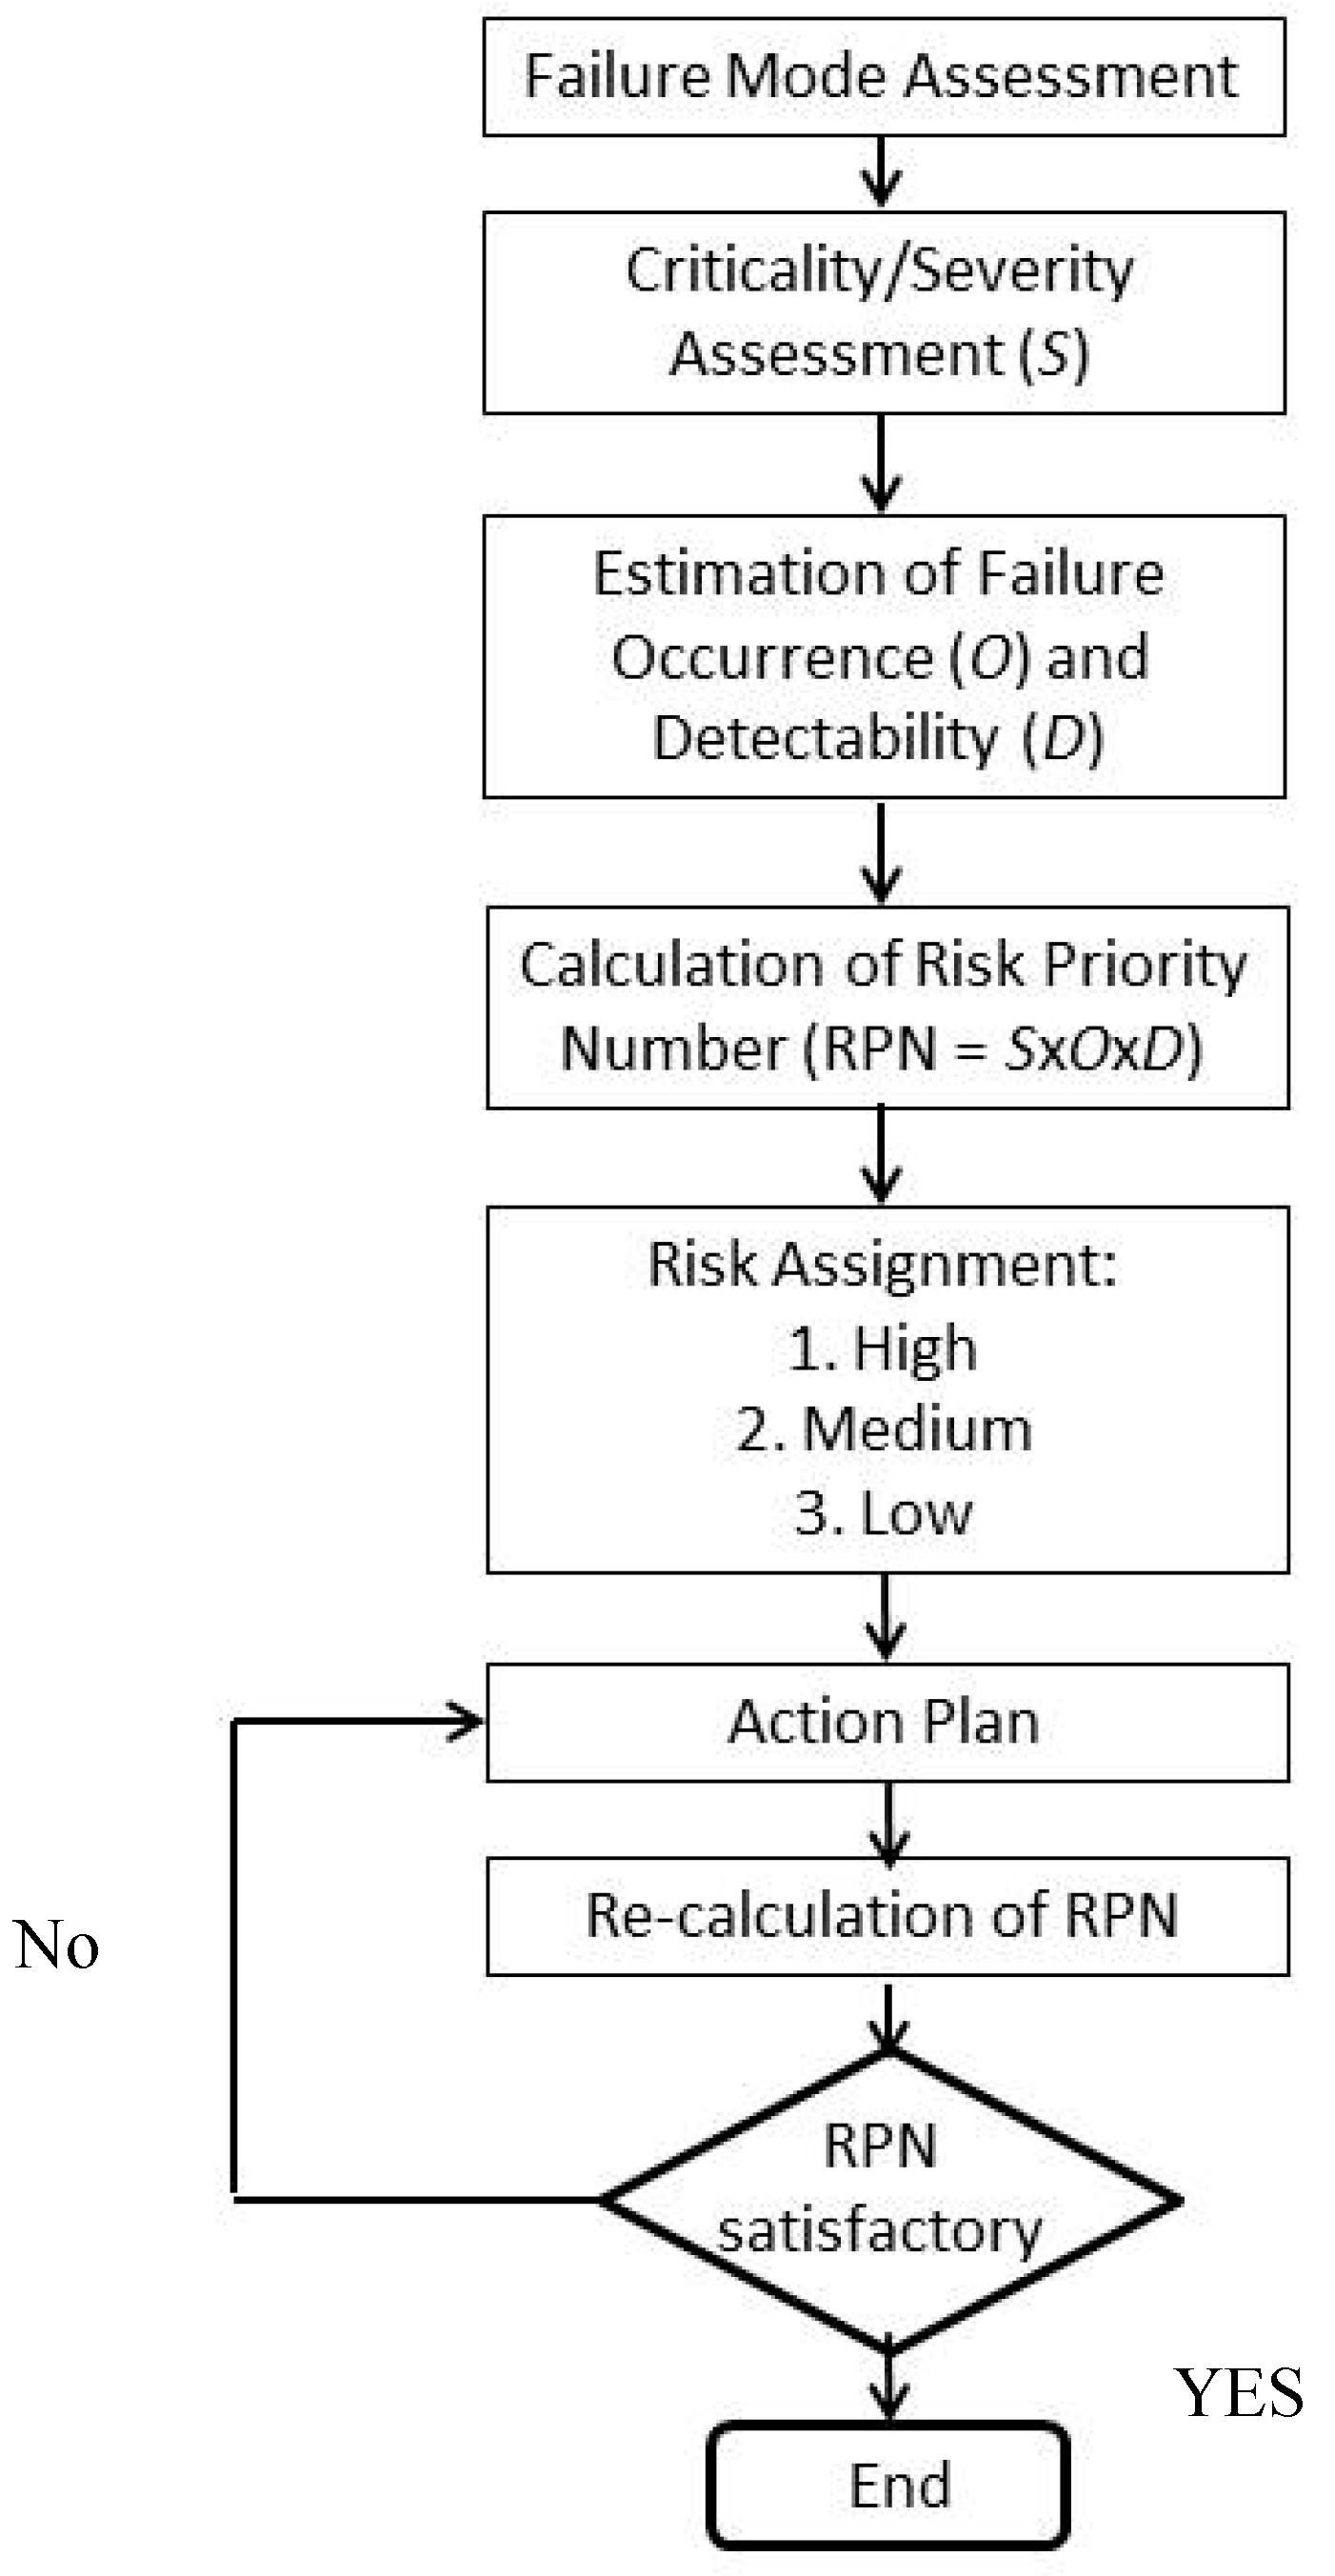
3.2. Quality Tools and Techniques—Process Approach and FMEA

The organization of the FA as a systematic nine-step procedure is referred to in the textbook of [7]. The detailed analysis of the FA procedure aims to provide guidance to engineers and practitioners and to offer consistent results towards failure prevention and quality improvement. Such a procedure could be carefully and suitably implemented, reflecting also the goals of the hosting organization, and reviewed for the attained performance and resource availability. The complexity, cross-disciplinary nature, and team involvement necessitates a process-oriented approach, treating the transformation of “inputs” to the “desired” outputs.
The FA process could be designed as a procedure having steps and interconnected links, using the “flow-chart” visualization (Figure 8), see also [1]. The FA procedure should be both detailed and generic, applicable for the entire corpus of failure analysis investigation types of the organization, as is demonstrated by the exemplar diagram in Figure 8. It is usually embedded in a quality management system and therefore QA (quality assurance) plays a vital role in maintaining, reviewing, and revising this procedure.
The first phase (initiation of a FA project—resource allocation and planning) should involve the handling, registration, and approval stages of the FA project, together with planning/scheduling, background information, and resource allocation. The second phase (failure investigation—examination of the potential root causes-suggestion of the most plausible cause) constitutes the “core” of the technical FA investigation, containing NDT, material testing, and analysis, performance of numerical modeling, etc. together with the compilation and interpretation of the collected evidence.
This will lead to the determination of the failure mechanism(s), answering the question “how has the component failed?” and to the judgment of the root-cause(s), answering the question “why has the component failed via the stated failure mechanism?” Finally, in the last phase (realization of the most effective corrective actions—FA report/end), the FA team should propose and decide for the appropriate corrective actions to minimize the risk, preventing the recurrence of the failure.
In the frame of failure prevention, one of the most important techniques is Failure Mode and Effects Analysis (FMEA). This technique is dedicated to reducing risks of failure and understanding the nature of preventive actions needed to be taken as measures of continuous improvement and sustainability. The implementation of a rigorous FMEA foresees that preventive actions have to be identified prior to an incident and should be applied without delay. The principal stages of FMEA application can be summarized as the following 10 steps:
  • Determination of process parameters;
  • Determination of the possible failure modes;
  • Determination of the failure effects on the final product, system or service;
  • Determination of the root-causes;
  • Assessment of the criticality of the failure;
  • Assessment of the failure occurrence (probability);
  • Assessment of the failure detectability;
  • Determination of the risk priority number (RPN);
  • Suggestion/proposal of preventive actions;
  • Re-estimation of the RPN under the new revised conditions.
The risk priority number (RPN) is defined as the product of the three independent terms (criticality, occurrence, and detectability), see Equation (9):
RPN = ( Criticality ) × ( Occurrence ) × ( Detectability )
where, criticality is the failure indicator and it is ranked within 1 to 10 (1: Low criticality, 10: High criticality), occurrence is the failure frequency indicator and it is ranked within the range 1 to 10 (1: Low frequency, 10: High frequency), and detectability is the failure detection capability and it is ranked within 1 to 10 with decreasing tendency (1: High detection capability, 10: Low detection capability).
The scheme of the FMEA flow-chart is illustrated in Figure 9. FMEA is not only an appropriate and useful risk analysis technique in the quality assurance/management field, but also in environmental health and safety (EHS). The presentation of FMEA scores is usually performed using common spreadsheets. A paradigm of a rigorous process-FMEA applied in the metal forming industry, which was used for quality improvement in brass annealing, is analytically presented in [50].
Statistical techniques using non-parametric analysis (e.g., Taguchi Design of Experiments/DOE, using Signal-to-Noise ratio) and analysis of variance (ANOVA) could be employed also to find the most influential factor(s) and succeed in process optimization [51]. The above techniques can be used in conjunction to FMEA to optimize the most critical process parameters [52]. It is noteworthy that modern trends in machine learning and artificial intelligence explore the possibilities of implementing and applying computer algorithms in the field of failure identification. The shafts’ failure mode identification, using an expert system deploying three types of inference engines (rule-based, fuzzy logic, and Bayesian statistics) was presented in [53]. The knowledge was transmitted to the three inference engines through specific tables containing the most typical visual characteristics recognized in the failed shafts (e.g., beach marks, distortion, corrosion evidence), according to the technical expertise. According to [53], the best performance was recorded by the Bayesian statistics inference engine.

3.3. Systems Approach—ISO 9001:2015 and Risk Analysis

The family of the International Quality Management Standards ISO 9001 constitutes, in a broader context, a strategic decision of the industry to improve the overall performance for its customers, employees, stakeholders, and society. The adoption and conformance to the requirements of the standard contribute to the genesis of a new quality culture, which provides significant benefits to the organization towards the following areas:
  • Meeting regulatory and statutory requirements;
  • Enhancing customer satisfaction through the delivery of sound products; and
  • Addressing risks and opportunities.
The ISO 9001 quality management system is based on the following management principles [54]:
  • Customer focus;
  • leadership;
  • people engagement;
  • process approach;
  • improvement;
  • evidence-based decision making; and
  • relationship management
The recently revised ISO 9001:2015 standard has a process-based approach, using the well-known Deming’s Plan-Do-Check-Act (PDCA) cycle and risk-based thinking [54]. The application of the PDCA cycle ensures that the processes, established by the organization, are adequately organized and managed and the necessary resources are provided by the top management. Continuous improvement is also an essential element of the PDCA cycle and the new quality philosophy. Risk-based thinking provides to the organization the necessary approach to establish controls and preventive measures to mitigate risks incurred by the unplanned results of the quality management system, and to obtain maximum benefit from the opportunities that arise.
The PDCA cycle ingredients are described as follows:
  • Plan: Establish the objectives of the system and the resources to achieve the necessary results;
  • Do: Realization of what has been planned;
  • Check: Monitoring and measurement of product and process performance; and
  • Act: Taking the necessary actions to improve the results.
Risk is the effect of uncertainty and, in the present case, it reflects negative results. Risk-based thinking in the industry is a significant driver of failure prevention and quality improvement. The recognition of risks and the establishment of preventive actions to avoid failures and non-conformities increase the reliability of the supplied products and minimize the negative effects of the resulted incidents, creating a significant impact on the progress and welfare of society.

4. Epilogue

In the present short review, the basic fracture mechanisms of mechanical metallic components working in an industrial environment were summarized using fractographic analysis performed by the respective case studies. Although the subject is deemed as quite extensive, this approach was adopted from a technical expert point of view, aiming to provide condensed knowledge and guidance for component failure investigation and root-cause analysis using fracture mode identification.
Furthermore, an insight was offered to selected failure prevention strategies (or frameworks), which, in general, embrace broader aspects of industrial processes, assisting in design, failure prediction, and failure prevention. The highlighted strategies were briefly presented while they concerned various established areas in the field, such as the following:
(1) The emergence of fracture mechanics, which encourages the design of damage tolerant components;
(2) The use of a process approach and failure prevention methodologies (such as FMEA); and
(3) The adoption of a systems approach and the institution of quality management systems (such as ISO 9001:2015), which are based on a Plan-Do-Check-Act cycle and risk based thinking.
Using a presentation from “specific” to “generic”, this review places emphasis and provides the necessary inspiration to FA researchers and engineers to seek knowledge following reasonable (logic paths) and determining the “cause-and-effect” relationships, which are the essential ingredients of the failure analysis procedure. As a final note, the basic principles of the failure prevention philosophy constitute an un-separable part of the entire corpus of the continuous quality improvement, which is an effective driver for industrial breakthrough change and innovation.

Funding

This research received no external funding.

Acknowledgments

The author wish to express his gratitude to ELKEME colleagues for the fruitful discussions and ELKEME Management for the encouragement and continuous support.

Conflicts of Interest

The author declares no conflict of interest.

References

  1. Pantazopoulos, G.A. A process-based approach in failure analysis. J. Fail. Anal. Prev. 2014, 14, 551–553. [Google Scholar] [CrossRef]
  2. Wulpi, D.J. Understanding How Components Fail, 2nd ed.; ASM International: Materials Park, OH, USA, 2005. [Google Scholar]
  3. Sachs, N.W. Practical Plant Failure Analysis; CRC Press: Boca Raton, FL, USA, 2007. [Google Scholar]
  4. González-Velázquez, J.L. Fractography and Failure Analysis, Structural Integrity 3; Springer Nature: Cham, Switzerland, 2018. [Google Scholar]
  5. Broek, D. Some contributions of electron fractography to the theory of fracture. Int. Metall. Rev. 1974, 19, 135–182. [Google Scholar] [CrossRef]
  6. Pantazopoulos, G.A.; Psyllaki, P.P. Progressive failures of components in chemical process industry: Case history investigation and root-cause analysis. In Handbook of Materials Failure Analysis with Case Studies from Chemical, Concrete and Power Industries; Makhlouf, A.S.H., Aliofkhazraei, M., Eds.; Elsevier: Oxford, UK, 2016; pp. 1–23. [Google Scholar]
  7. Dennies, D.P. How to Organize and Run a Failure Investigation; ASM International: Materials Park, OH, USA, 2005. [Google Scholar]
  8. Lynch, S.P.; Moutsos, S. A brief history of fractography. J. Fail. Anal. Prev. 2006, 6, 54–69. [Google Scholar] [CrossRef]
  9. Pantazopoulos, G. Damage assessment using fractography as failure evaluation: Applications in industrial metalworking machinery. J. Fail. Anal. Prev. 2011, 11, 588–594. [Google Scholar] [CrossRef]
  10. Underwood, E.E. Quantitative Fractography; Springer Nature: Cham, Switzerland, 1986. [Google Scholar]
  11. Hosford, W.F. Solid Mechanics; Cambridge University Press: Cambridge, UK, 2013. [Google Scholar]
  12. Gurson, A.L. Plastic Flow and Fracture Behavior of Ductile Materials Incorporating Void Nucleation, Growth and Interaction. Ph.D. Thesis, Brown University, Providence, RI, USA, 1975. [Google Scholar]
  13. Tvegaard, V.; Needleman, A. Analysis of the cup-cone fracture in a round tensile bar. Acta Metall. 1984, 32, 157–169. [Google Scholar] [CrossRef]
  14. Pantazopoulos, G.; Toulfatzis, A.; Vazdirvanidis, A.; Rikos, A. Analysis of the degradation process of structural steel component subjected to prolonged thermal exposure. Metall. Microstruct. Anal. 2016, 5, 149–156. [Google Scholar] [CrossRef]
  15. Hull, D. Fractography: Observing, Measuring and Interpreting the Fracture Surface Topography; Cambridge University Press: Cambridge, UK, 1999. [Google Scholar]
  16. Abbasi, S.; Esmailian, M.; Ahangarani, S. Investigation of the microstructure, micro-texture and mechanical properties of the HSLA steel, hot-rolled and quenched at different cooling rates. Metall. Microstruct. Anal. 2018, 7, 596–607. [Google Scholar] [CrossRef]
  17. Dieter, G.E. Mechanical Metallurgy; McGraw Hill: New York, NY, USA, 1988. [Google Scholar]
  18. Pantazopoulos, G.; Vazdirvanidis, A.; Toulfatzis, A.; Rikos, A. Fatigue failure of steel links operating as chain components in a heavy duty draw bench. Eng. Fail. Anal. 2009, 16, 2440–2449. [Google Scholar] [CrossRef]
  19. Pantazopoulos, G.; Zormalia, S. Analysis of failure mechanism of gripping tool steel component operated in an industrial draw bench. Eng. Fail. Anal. 2011, 18, 1595–1604. [Google Scholar] [CrossRef]
  20. Pantazopoulos, G. Leaded brass rods C38500 for automatic machining operations. J. Mater. Eng. Perform. 2002, 11, 402–407. [Google Scholar] [CrossRef]
  21. Pantazopoulos, G. A review of defects and failures in brass rods and related components. Pract. Fail. Anal. 2003, 3, 14–22. [Google Scholar] [CrossRef]
  22. Pantazopoulos, G.; Vazdirvanidis, A. Failure analysis of a fractured leaded-brass (CuZn39Pb3) extruded hexagonal rod. J. Fail. Anal. Prev. 2008, 8, 218–222. [Google Scholar] [CrossRef]
  23. Pantazopoulos, G.; Vazdirvanidis, A. Fracture analysis and embrittlement phenomena of machined brass components. Procedia Struct. Integrity 2017, 5, 476–483. [Google Scholar] [CrossRef]
  24. Lynch, S.P. Failures of structures and components by metal-induced embrittlement. J. Fail. Anal. Prev. 2008, 8, 259–274. [Google Scholar] [CrossRef]
  25. Toulfatzis, A.; Pantazopoulos, G.; Paipetis, A. Microstructure and properties of lead-free brasses using post-processing heat treatment cycles. Mater. Sci. Technol. 2016, 32, 1771–1781. [Google Scholar] [CrossRef]
  26. Toulfatzis, A.; Pantazopoulos, G.; Paipetis, A. Fracture mechanics properties and failure mechanisms of environmental-friendly brass alloys under impact, cyclic and monotonic loading conditions. Eng. Fail. Anal. 2018, 90, 497–517. [Google Scholar] [CrossRef]
  27. Totten, G. Fatigue crack propagation. Adv. Mater. Processes 2008, 5, 39–41. [Google Scholar]
  28. Pantazopoulos, G.; Zormalia, S.; Vazdirvanidis, A. Investigation of fatigue failure of roll shafts in a tube manufacturing line. J. Fail. Anal. Prev. 2010, 10, 358–362. [Google Scholar] [CrossRef]
  29. Pantazopoulos, G.; Zormalia, S.; Vazdirvanidis, A. Failure analysis of copper tube in an industrial refrigeration unit: A case history. Int. J. Struct. Integrity 2013, 4, 55–66. [Google Scholar] [CrossRef]
  30. Jones, D.R.H. Engineering Materials 3—Materials Failure Analysis; Pergamon Press: Oxford, UK, 1993. [Google Scholar]
  31. Benac, D.J. Failure avoidance brief: Estimating heater tube life. J. Fail. Anal. Prev. 2009, 9, 5–7. [Google Scholar] [CrossRef]
  32. Ilman, M.N. Analysis of material degradation mechanism and life assessment of 25Cr-38Ni-Mo-Ti wrought alloy steel (HPM) for cracking tubes in an ethylene plant. Eng. Fail. Anal. 2014, 42, 100–108. [Google Scholar] [CrossRef]
  33. Quickel, G.; Taske, C.; Rollins, B.; Beavers, J. Failure analysis and remaining life assessment of methanol reformer tubes. J. Fail. Anal. Prev. 2009, 9, 511–516. [Google Scholar] [CrossRef]
  34. Psyllaki, P.; Pantazopoulos, G.; Lefakis, H. Metallurgical evaluation of creep-failed superheater tubes. Eng. Fail. Anal. 2009, 16, 1420–1431. [Google Scholar] [CrossRef]
  35. Shlyannikov, V.N.; Tumanov, A.V.; Boychenko, N.V.; Tartygasheva, A.M. Loading history effect on creep-fatigue crack growth in pipe bend. Int. J. Press. Vessels Pip. 2016, 139-140, 86–95. [Google Scholar] [CrossRef]
  36. Shlyannikov, V.; Tumanov, A.; Boychenko, N. Creep-fatigue crack growth rate assessment using ductility damage model. Int. J. Fatigue 2018, 116, 448–461. [Google Scholar] [CrossRef]
  37. Zerbst, U.; Klinger, C.; Clegg, R. Fracture mechanics as a tool in failure analysis—Prospects and limitations. Eng. Fail. Anal. 2015, 55, 376–410. [Google Scholar] [CrossRef]
  38. Murakami, Y.; Endo, M. Effects of defects, inclusions and inhomogeneities on fatigue strength. Int. J. Fatigue 1994, 16, 163–182. [Google Scholar] [CrossRef]
  39. Janssen, M.; Juidema, M.; Wanhill, R. Fracture Mechanics, 2nd ed.; SPON Press: London, UK, 2004. [Google Scholar]
  40. Pantazopoulos, G.; Papaefthymiou, S. Failure and fracture analysis of austenitic stainless steel marine propeller shaft. J. Fail. Anal. Prev. 2015, 15, 762–767. [Google Scholar] [CrossRef]
  41. ISO 148-1: 2009. Metallic Materials—Charpy Pendulum Impact Test. Test Method; ISO: Geneva, Switzerland, 2009. [Google Scholar]
  42. BS 7448-Part 1: 1991. Fracture Mechanics Tests. Determination of KIc, Critical CTOD and Critical J Values of Metallic Materials; BSI: London, UK, 1991. [Google Scholar]
  43. Toulfatzis, A.; Pantazopoulos, G.; Paipetis, A. Fracture behavior and characterization of lead-free brass alloys for machining applications. J. Mater. Eng. Perform. 2014, 23, 3193–3206. [Google Scholar] [CrossRef]
  44. Taylor, D. The Theory of Critical Distances: A New Perspective in Fracture Mechanics; Elsevier: Oxford, UK, 2007. [Google Scholar]
  45. Cicero, S.; Fuentes, J.D.; Procopio, I.; Madrazo, V.; González, P. Critical Distance Default Values for Structural Steels and a Simple Formulation to Estimate the Apparent Fracture Toughness in U-Notched Conditions. Metals 2018, 8, 871. [Google Scholar] [CrossRef]
  46. Li, M.Q. Strain energy density failure criterion. Int. J. Solids Struct. 2001, 38, 6997–7003. [Google Scholar] [CrossRef]
  47. Cricrì, G. Cohesive law identification of adhesive layers subject to shear load—An exact inverse solution. Int. J. Solids Struct. 2019, 158, 150–164. [Google Scholar] [CrossRef]
  48. Berto, F.; Majid, A.; Marsavina, L. Mixed mode fracture. Theor. Appl. Fract. Mech. 2017, 91, 1. [Google Scholar] [CrossRef]
  49. Perez, N. Mixed Mode Fracture Mechanics, Fracture Mechanics; Springer Nature: Cham, Switzerland, 2016; pp. 289–325. [Google Scholar]
  50. Pantazopoulos, G.; Tsinopoulos, G. Process failure modes and effects analysis (PFMEA): A structured approach for quality improvement in metal-forming industry. J. Fail. Anal. Prev. 2005, 5, 5–10. [Google Scholar] [CrossRef]
  51. Toulfatzis, A.; Pantazopoulos, G.; David, C.; Sagris, D.; Paipetis, A. Machinability of eco-friendly lead-free brass alloys: Cutting-force and surface-roughness optimization. Metals 2018, 8, 250. [Google Scholar] [CrossRef]
  52. Mariajayaprakash, A.; Senthilvelan, T. Optimizing process parameters of screw conveyor (sugar mill boiler) through Failure Mode and Effect Analysis (FMEA) and Taguchi Method. J. Fail. Anal. Prev. 2014, 14, 772–783. [Google Scholar] [CrossRef]
  53. Moreno, C.J.; Espejo, E. A performance evaluation of three inference engines as expert systems for failure mode identification in shafts. Eng. Fail. Anal. 2015, 53, 24–35. [Google Scholar] [CrossRef]
  54. ISO 9001:2015. Quality Management Systems—Requirements; CEN—European Committee for Standardization: Brussels, Belgium, 2015. [Google Scholar]
Figure 1. SEM micrographs showing: (a) Ductile fracture surface (SE imaging) showing inhomogeneous dimple distribution and (b) higher magnification topographic features showing details of dimples around non-metallic inclusions (BSE imaging). Material: Low carbon structural steel grade (C15), fractured under tensile overload.
Metals 09 00148 g001
Figure 2. SEM micrographs showing: (a) Transgranular cleavage fracture surface (SE imaging) showing crystallographic facets and “occluded” river patterns (Material: Chain link, structural steel grade C40), (b) “quasi-cleavage” fracture surface (SE imaging), showing a mixed-mode transgranular fracture, accompanied with areas of localized plastic deformation (Material: Tool steel gripper W.Nr. 1.2343).
Metals 09 00148 g002
Figure 3. (a) SEM fractograph (SE imaging) showing a typical intergranular fracture mechanism and (b,c) higher magnification SEM fractographs (BSE imaging) showing details of the intergranular fracture facets; note the “bright spots”, representing Pb particles, accumulated in the grain boundaries (shown by black arrows). Material: CuZn39Pb3 rod fractured during hot extrusion.
Metals 09 00148 g003
Figure 4. (a) Stereo-micrograph showing the fatigue fracture of a steel pin of a roll chain mechanism. The fractographic signs advocate the occurrence of rotating bending fatigue, under low load and high stress concentration conditions. (b) SEM fractograph (SE imaging) of the same roll showing a typical fine striation pattern. Material: Structural steel, ferritic-pearlitic microstructure, hardness: 210 HV.
Metals 09 00148 g004
Figure 5. (a) Stereo-micrograph showing the fatigue crack (stepwise propagation) on the bent tube surface; (b) stereo-micrograph of the tube fracture surface, showing multiple crack initiation sites and beach marks; (c) higher magnification of the fracture surface performed by SEM (BSE imaging) where fine fatigue striations are readily resolved. Material: deoxidized high phosphorus (DHP) copper tube.
Metals 09 00148 g005
Figure 6. (a) Stereo-micrograph showing the fracture surface of the pipe-wall; (b) SEM micrograph (SE-imaging) showing the profuse dimpled fracture surface; (c) SEM micrograph (SE-imaging) showing details of the fracture surface, highlighting the presence of deep cavities and ductile tearing. (d) Typical diagram of creep strain evolution as a function of time/duration.
Metals 09 00148 g006aMetals 09 00148 g006b
Figure 7. (a) Schematic showing the geometry of semi-elliptical surface imperfection, located on shaft periphery; (b) SEM micrograph showing the fatigue crack origin, indicating the presence of a surface defect and (c) fatigue crack propagation graph.
Metals 09 00148 g007
Figure 8. Flow-chart depicting the various stages of a Failure Analysis (FA) procedure.
Metals 09 00148 g008
Figure 9. Representative flow-chart depicting the various stages of a Failure Mode and Effects Analysis (FMEA) procedure.
Metals 09 00148 g009

