
Wetting by Liquid Metals—Application in Materials Processing: The Contribution of the Grenoble Group

Abstract
:1. Introduction

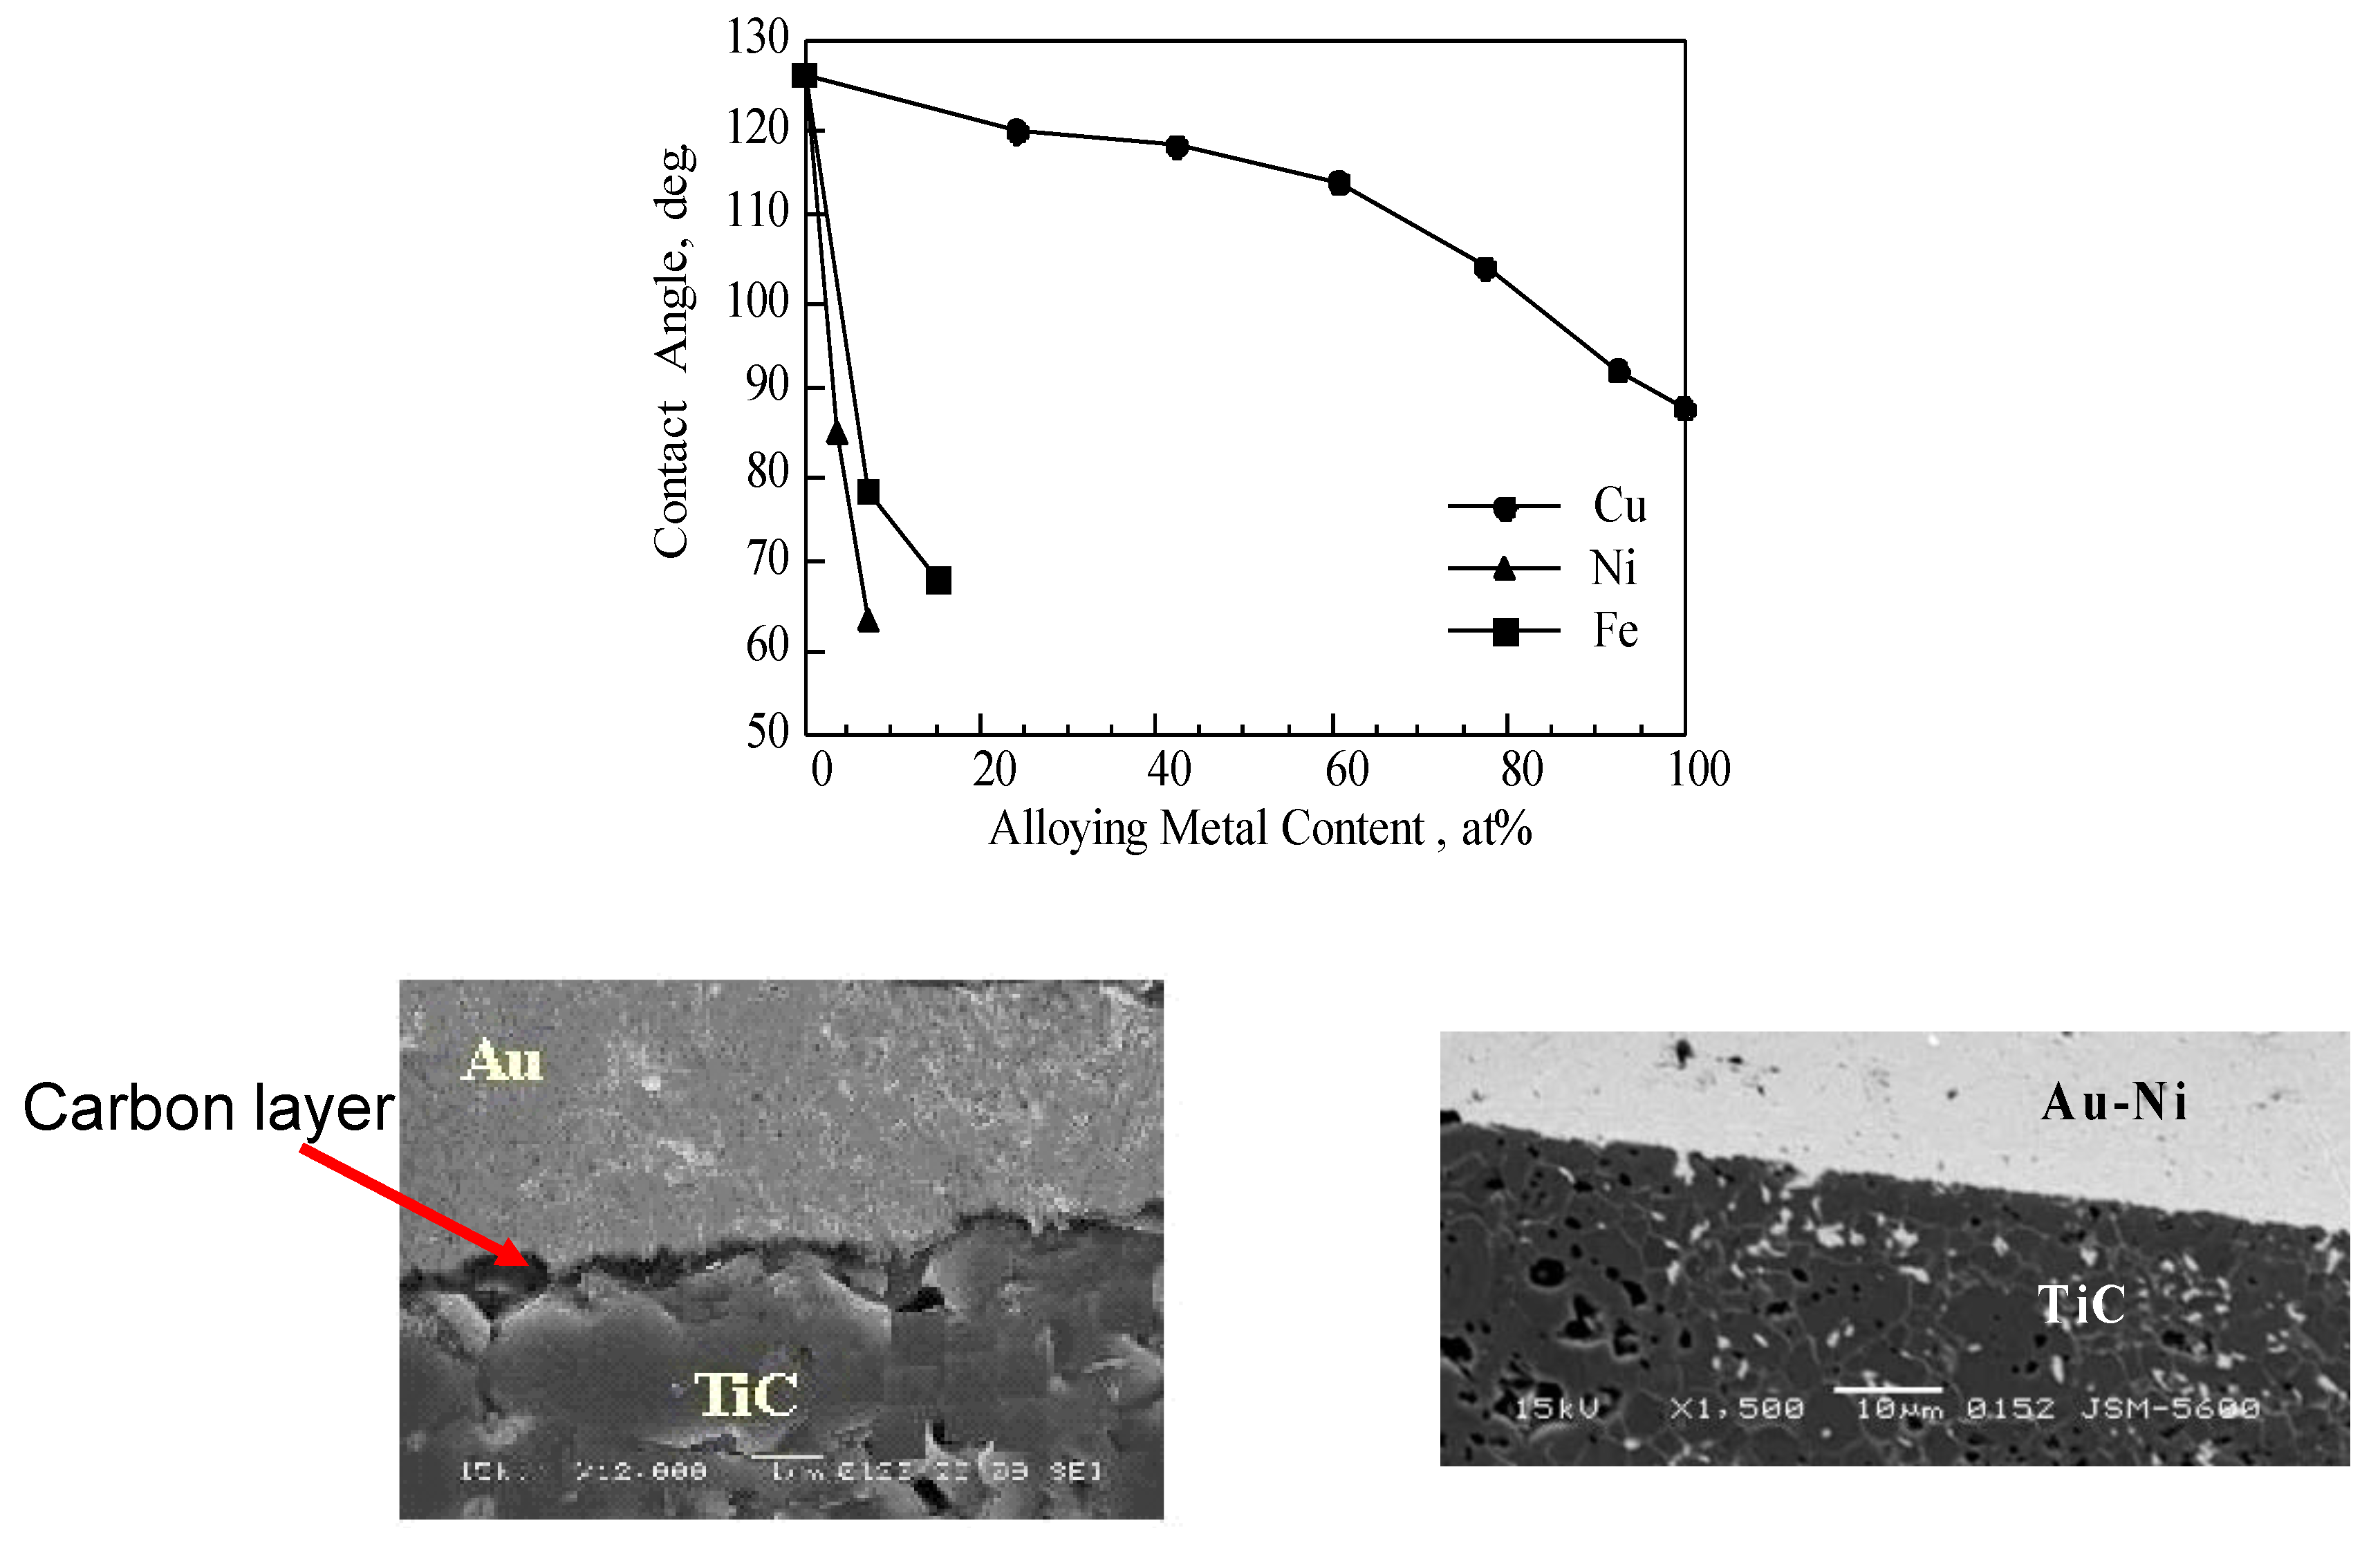
2. Non-Reactive Wetting
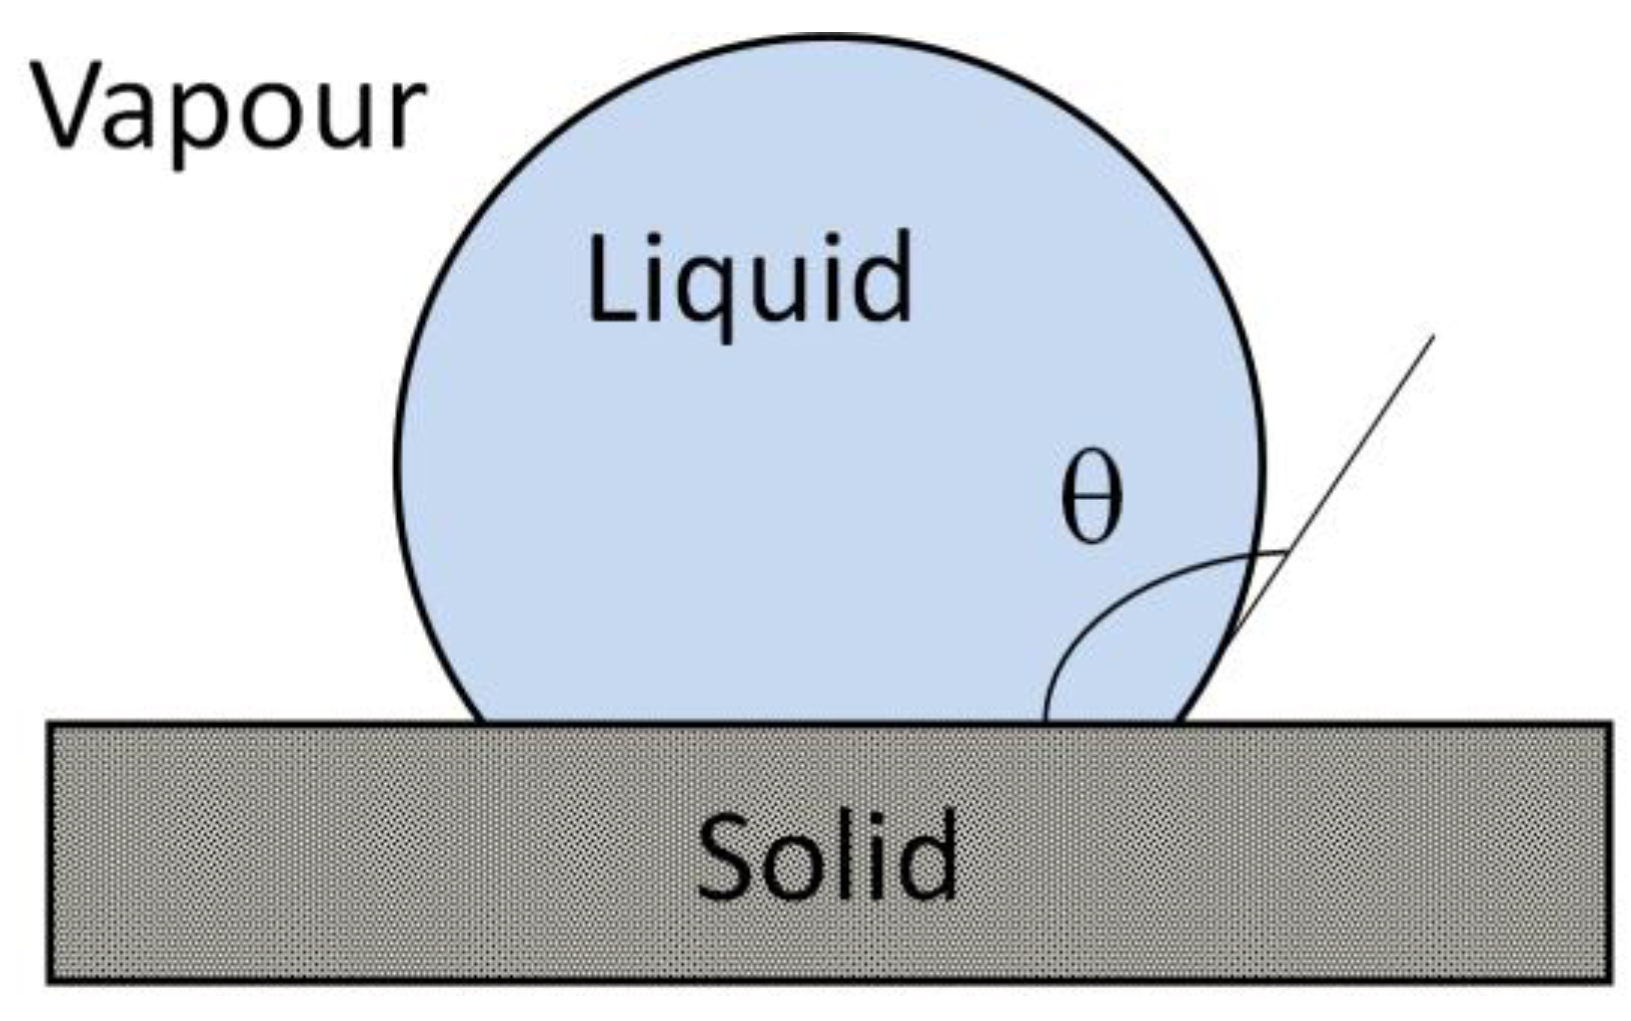
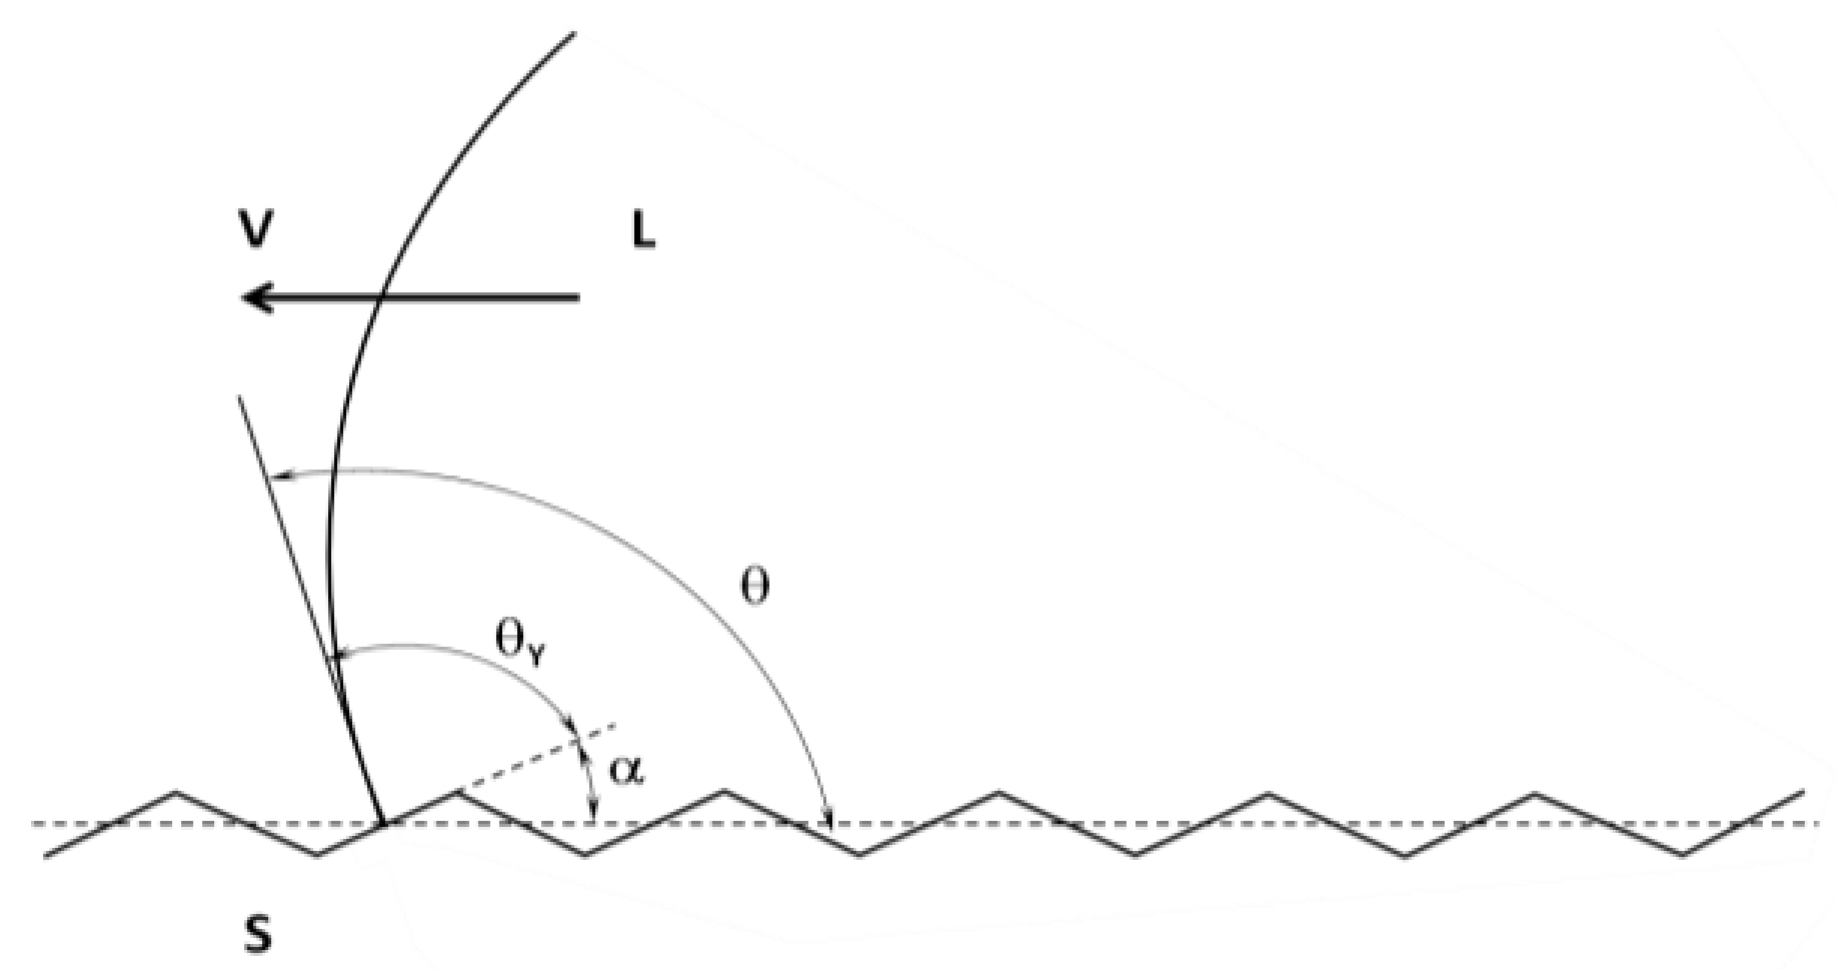
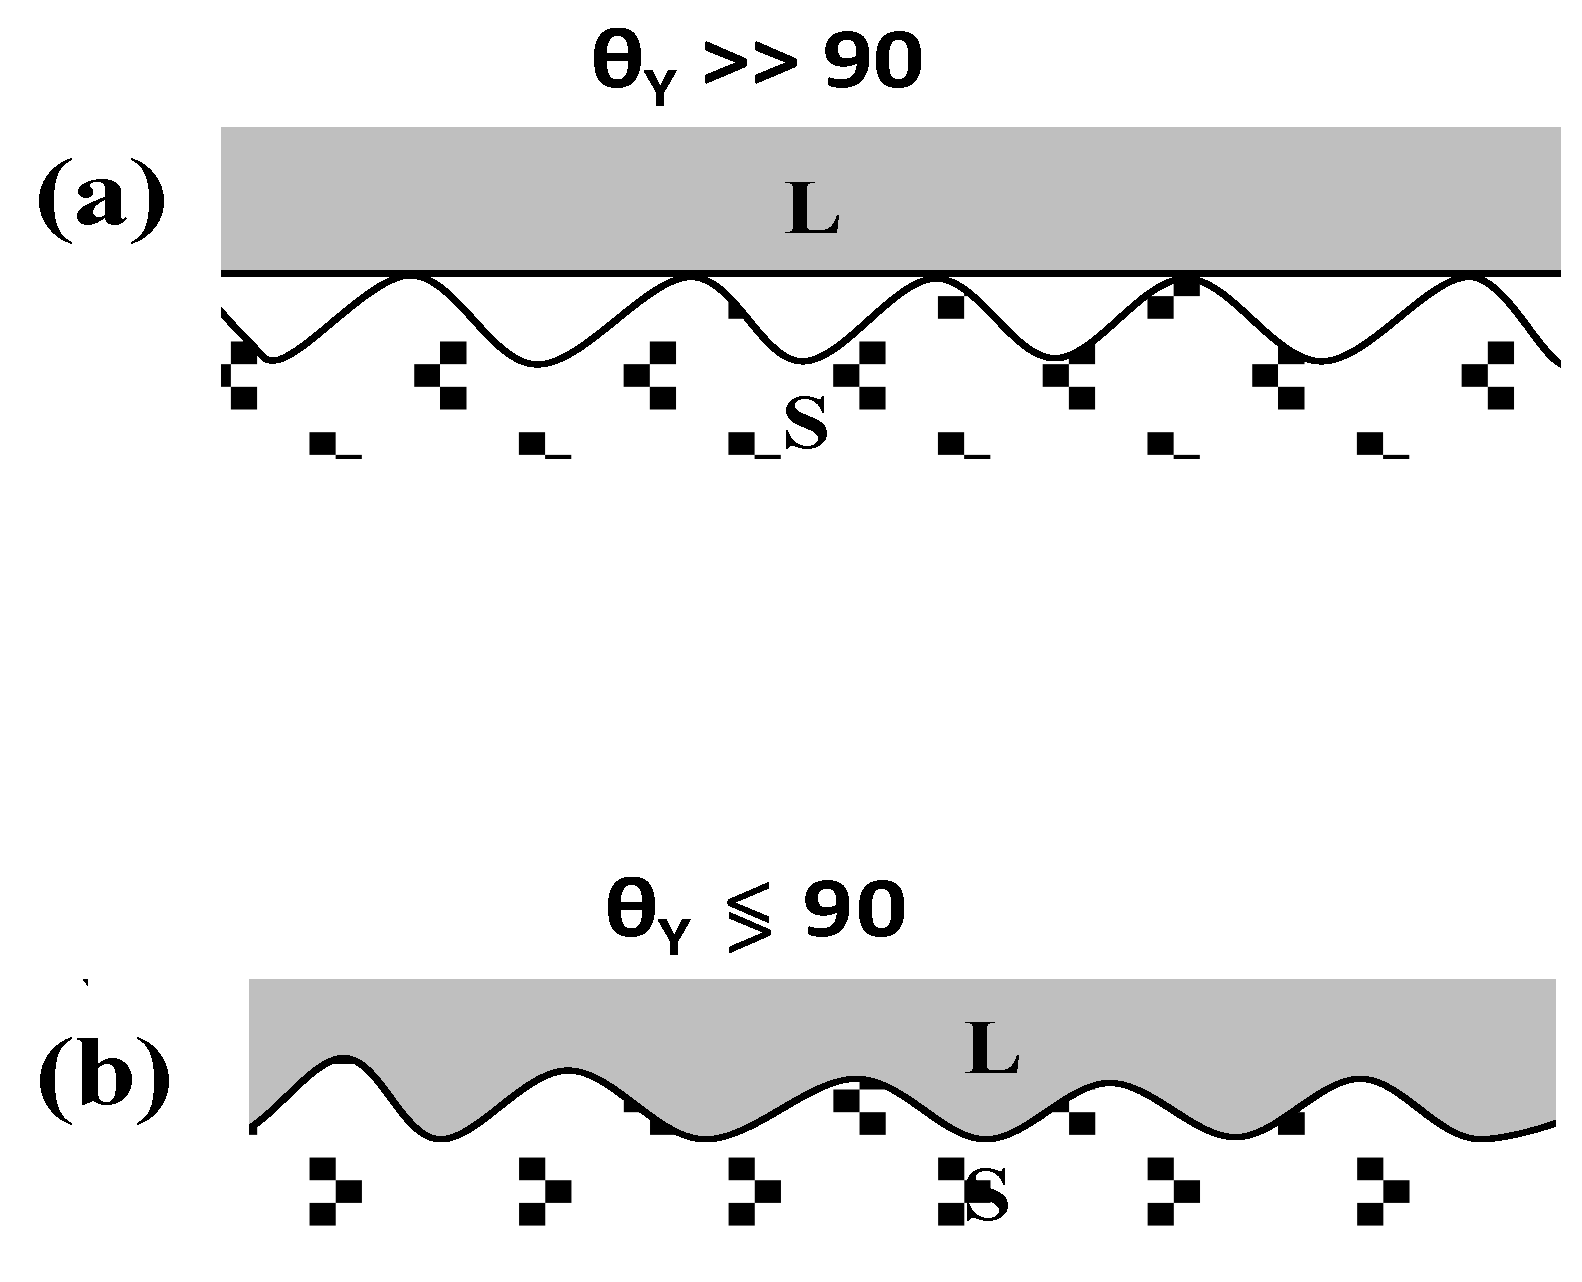
2.1. Thermodynamics

| Type of substrate | Type of interaction | θ (degrees) | Examples |
|---|---|---|---|
| Solid metals | Strong (chemical) | θ << 90° | Cu/Mo: 10°–30° |
| Semiconductors | Sn/Ge: 40°; Si/SiC: 35°–45° | ||
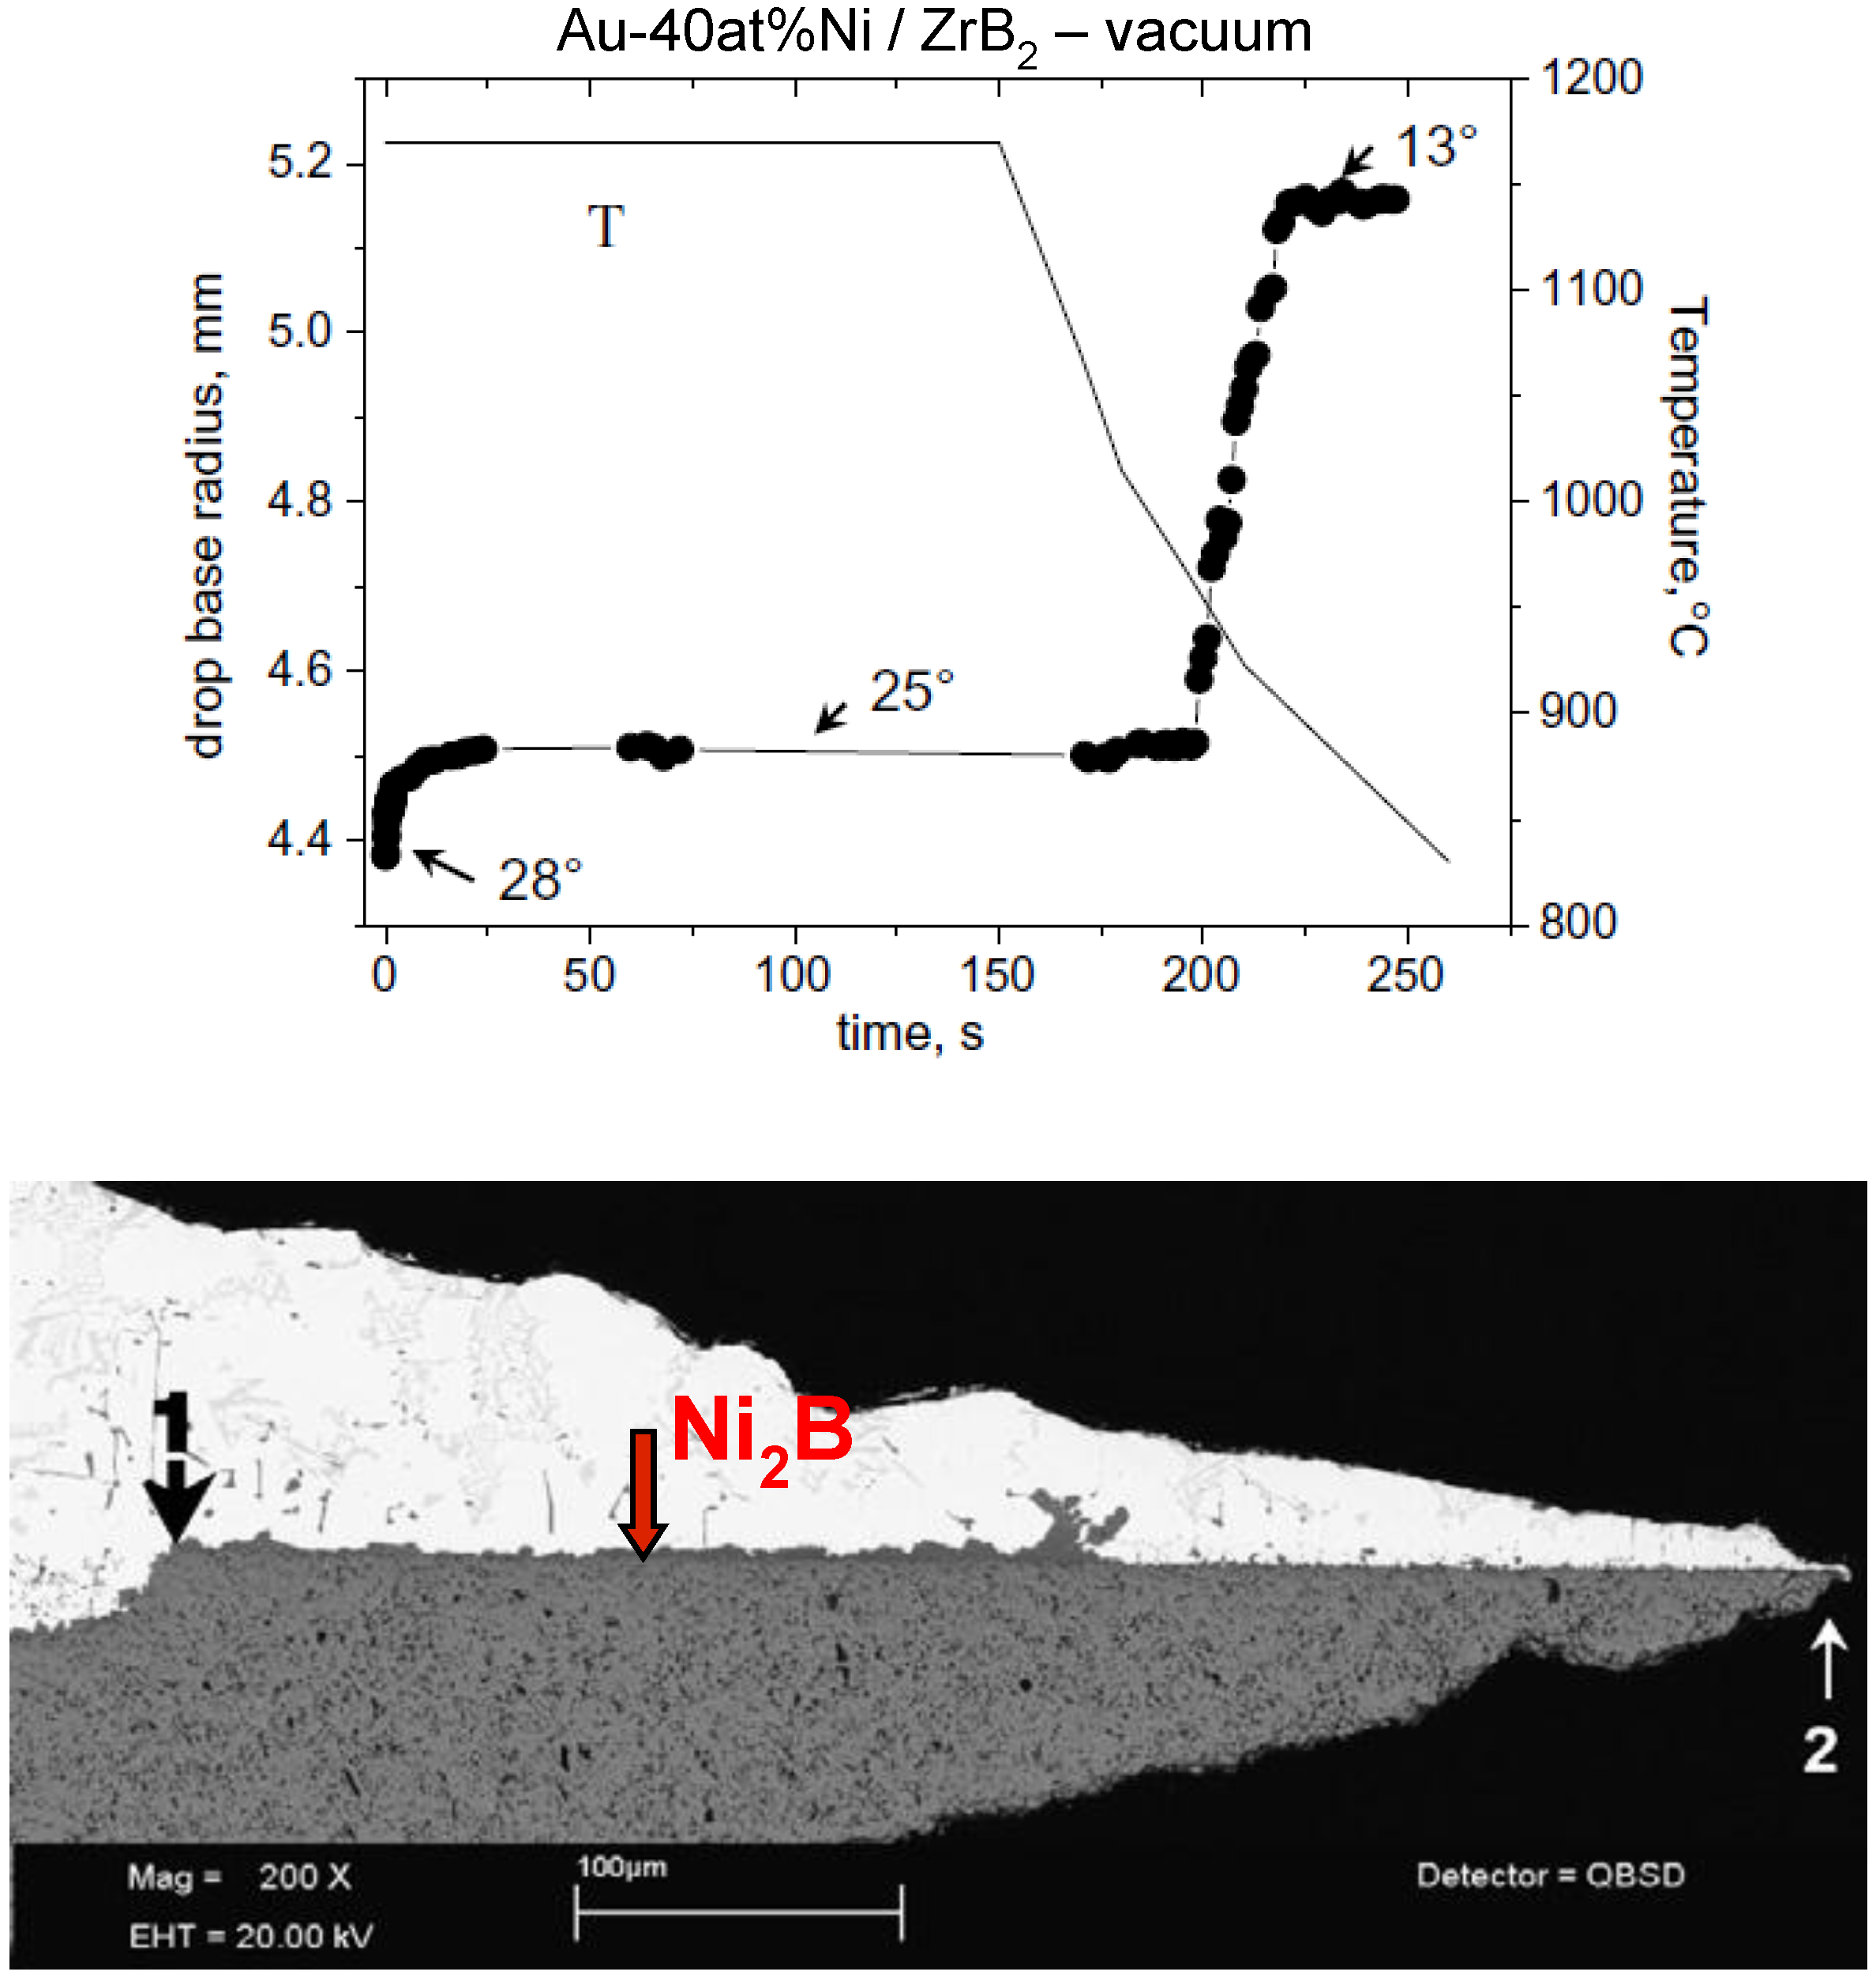
| Ceramics with a partially metallic character | Cu/WC: 20°; Au/ZrB2: 25° | ||
| Carbon materials | Weak (physical) | θ >> 90° | Au/C: 120°–135° |
| Ionocovalent ceramics | Ag/Al2O3, Cu/SiO2: 120°–140°; Au/BN: 135°–150° | ||
| Ionocovalent oxides | Moderate (chemical) | θ ≈ 90° | (Ag+O)/Al2O3; Al/Al2O3 |


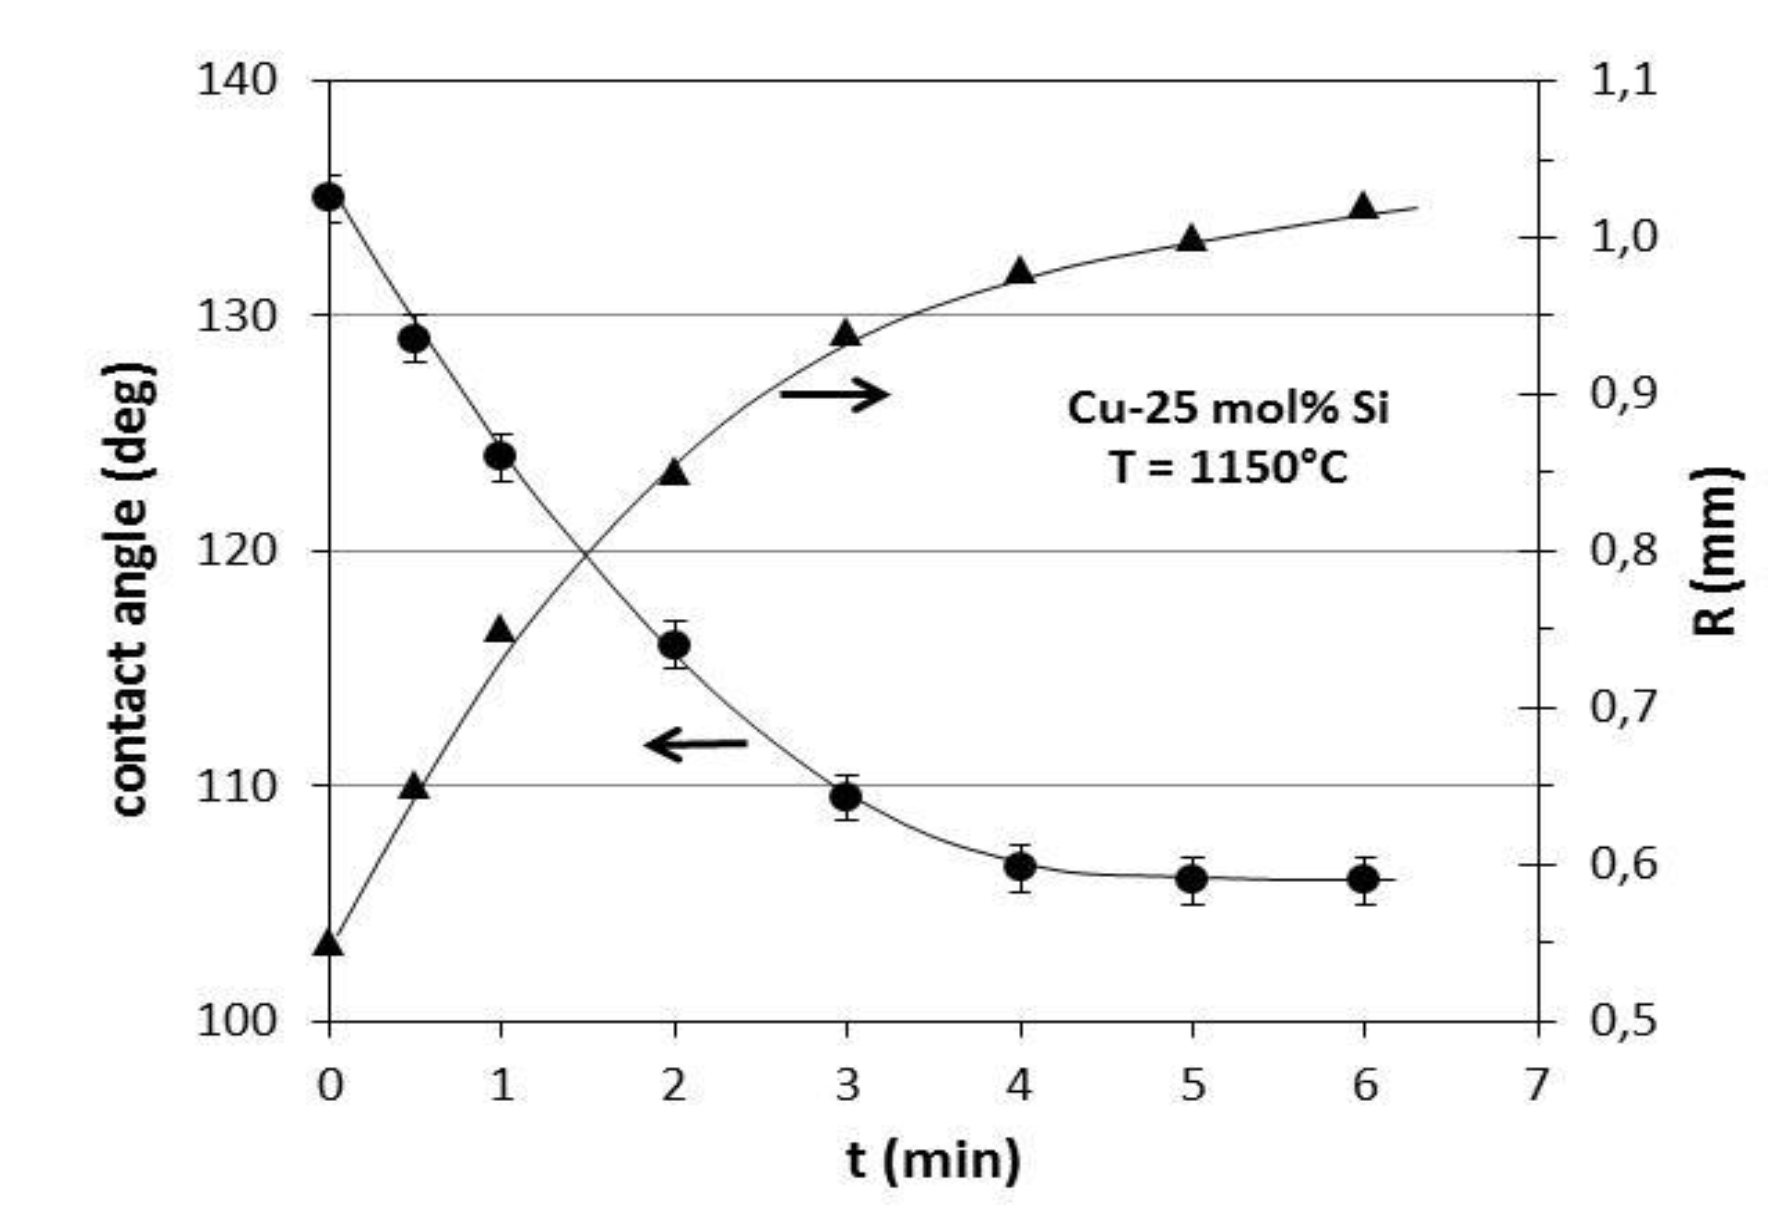
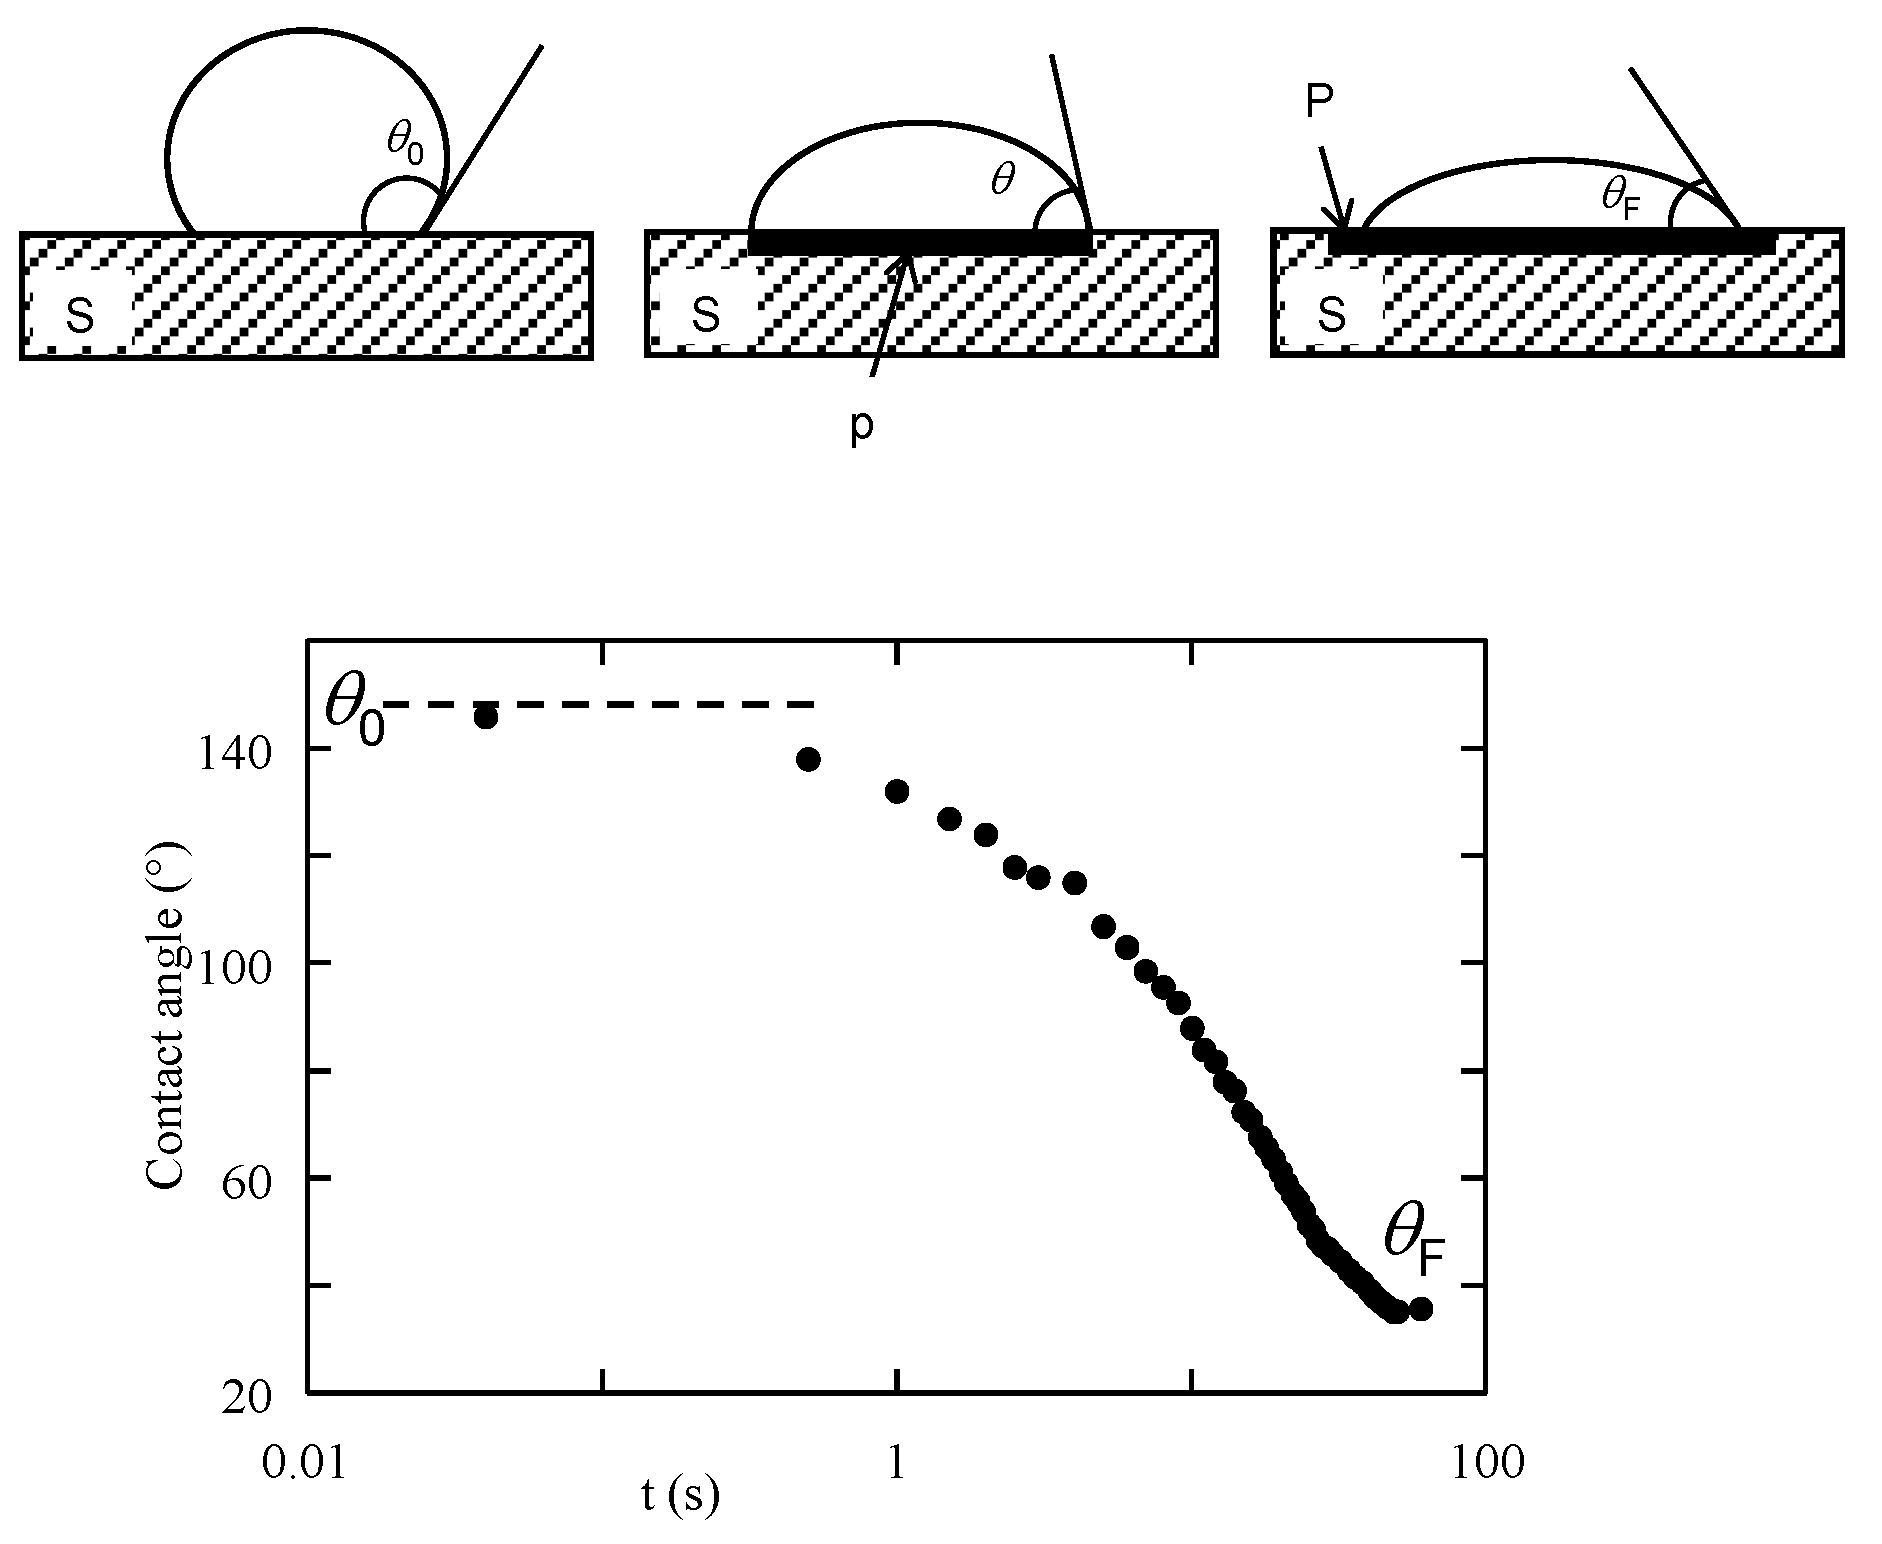
2.2. Kinetics


3. Reactive Wetting
3.1. Wetting with Formation of a New Compound at the Interface


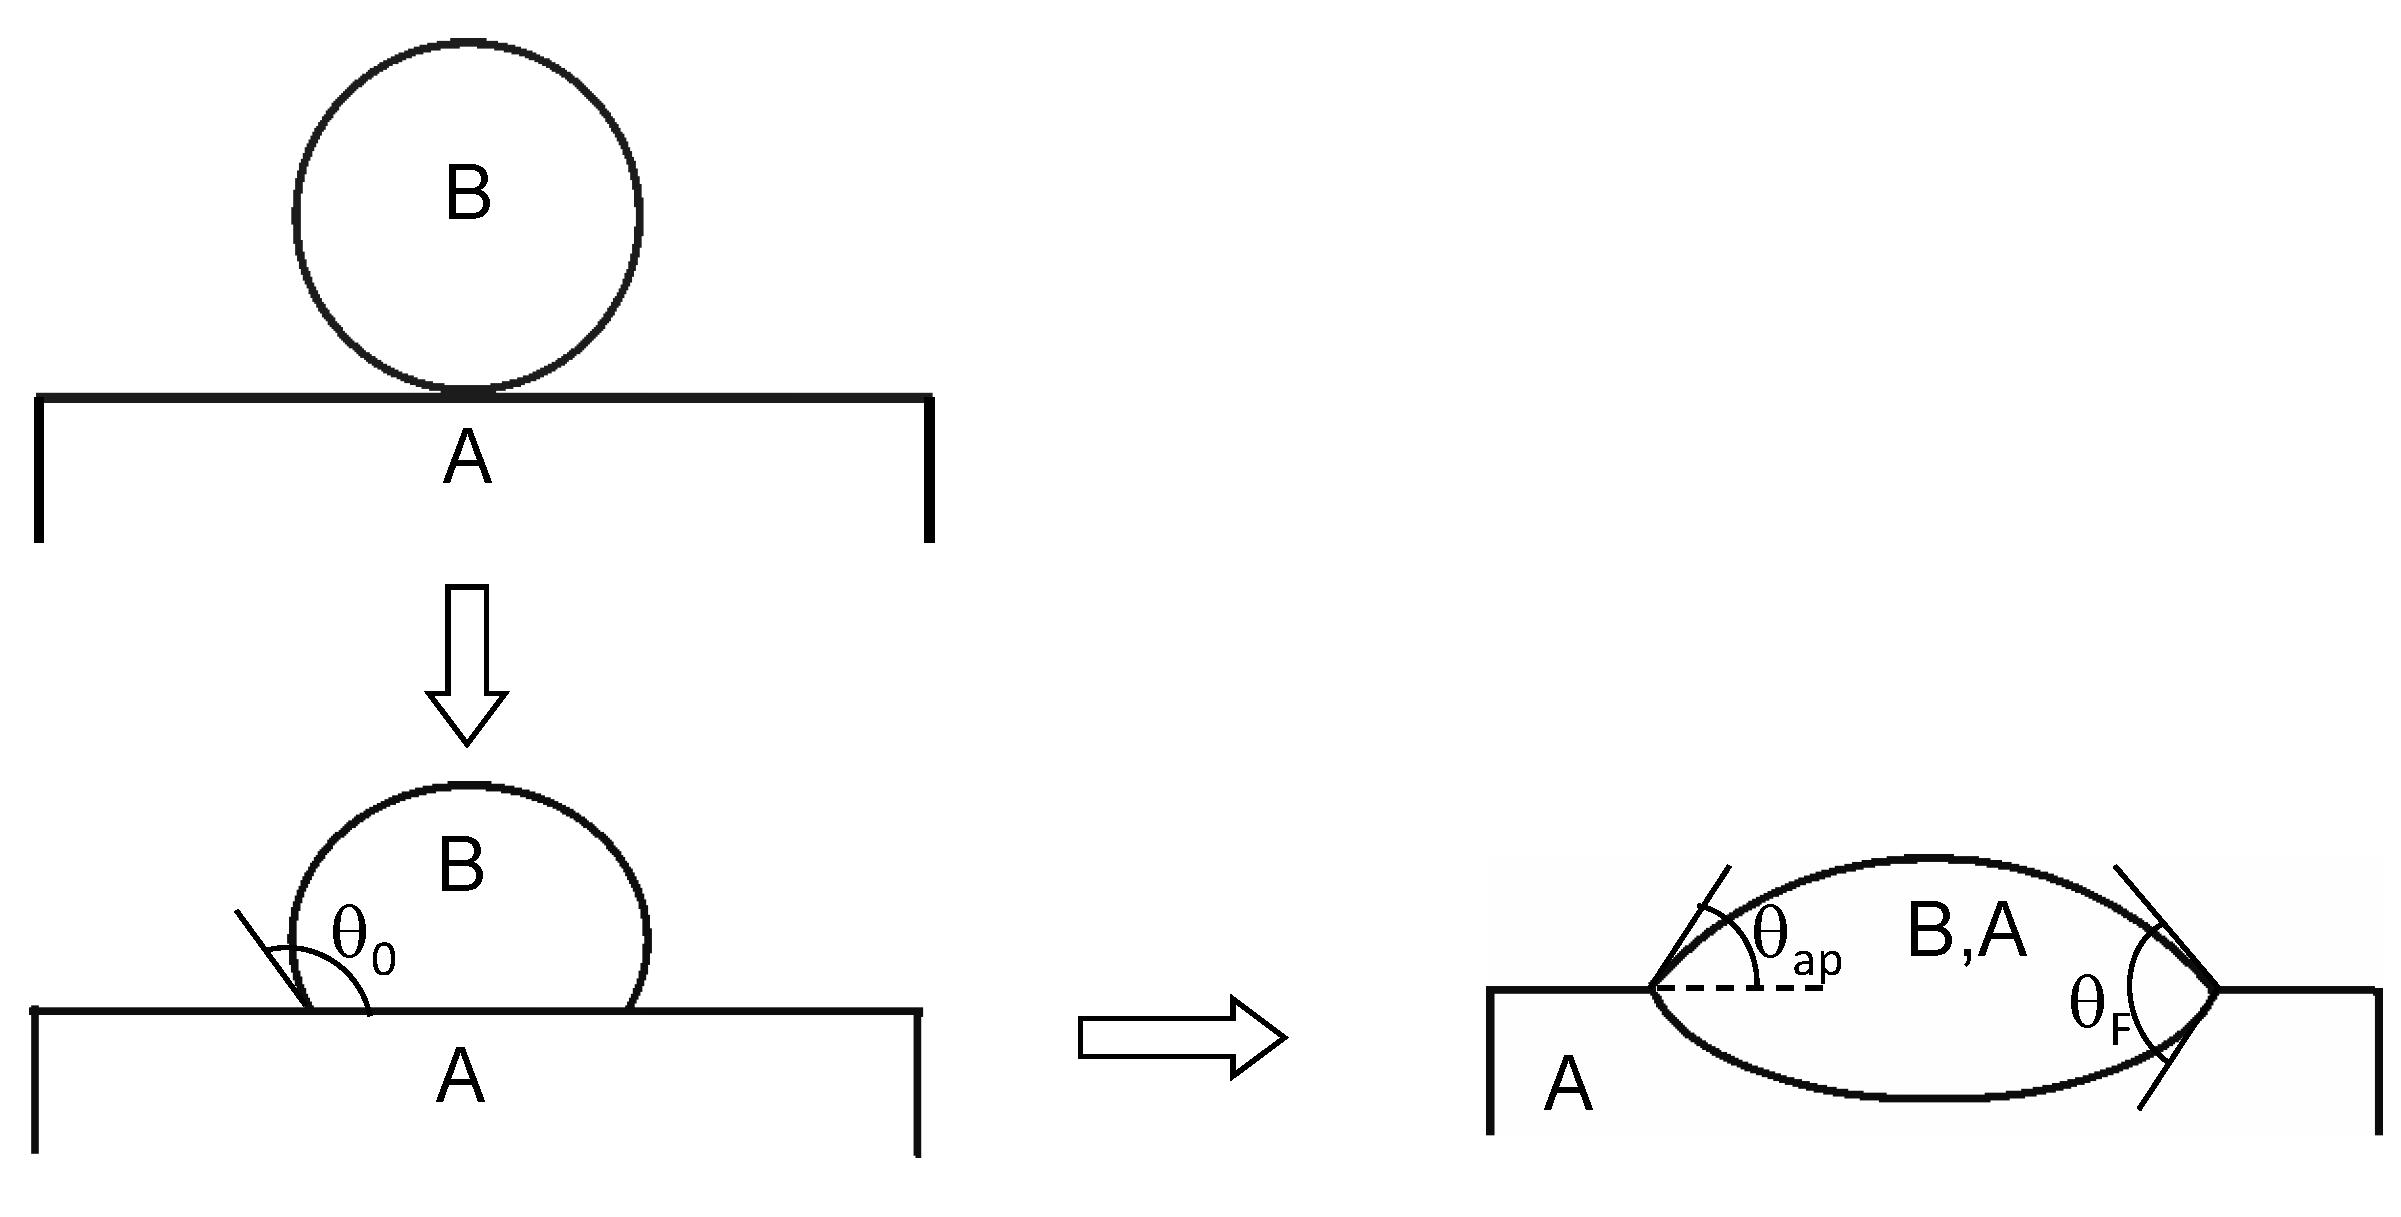
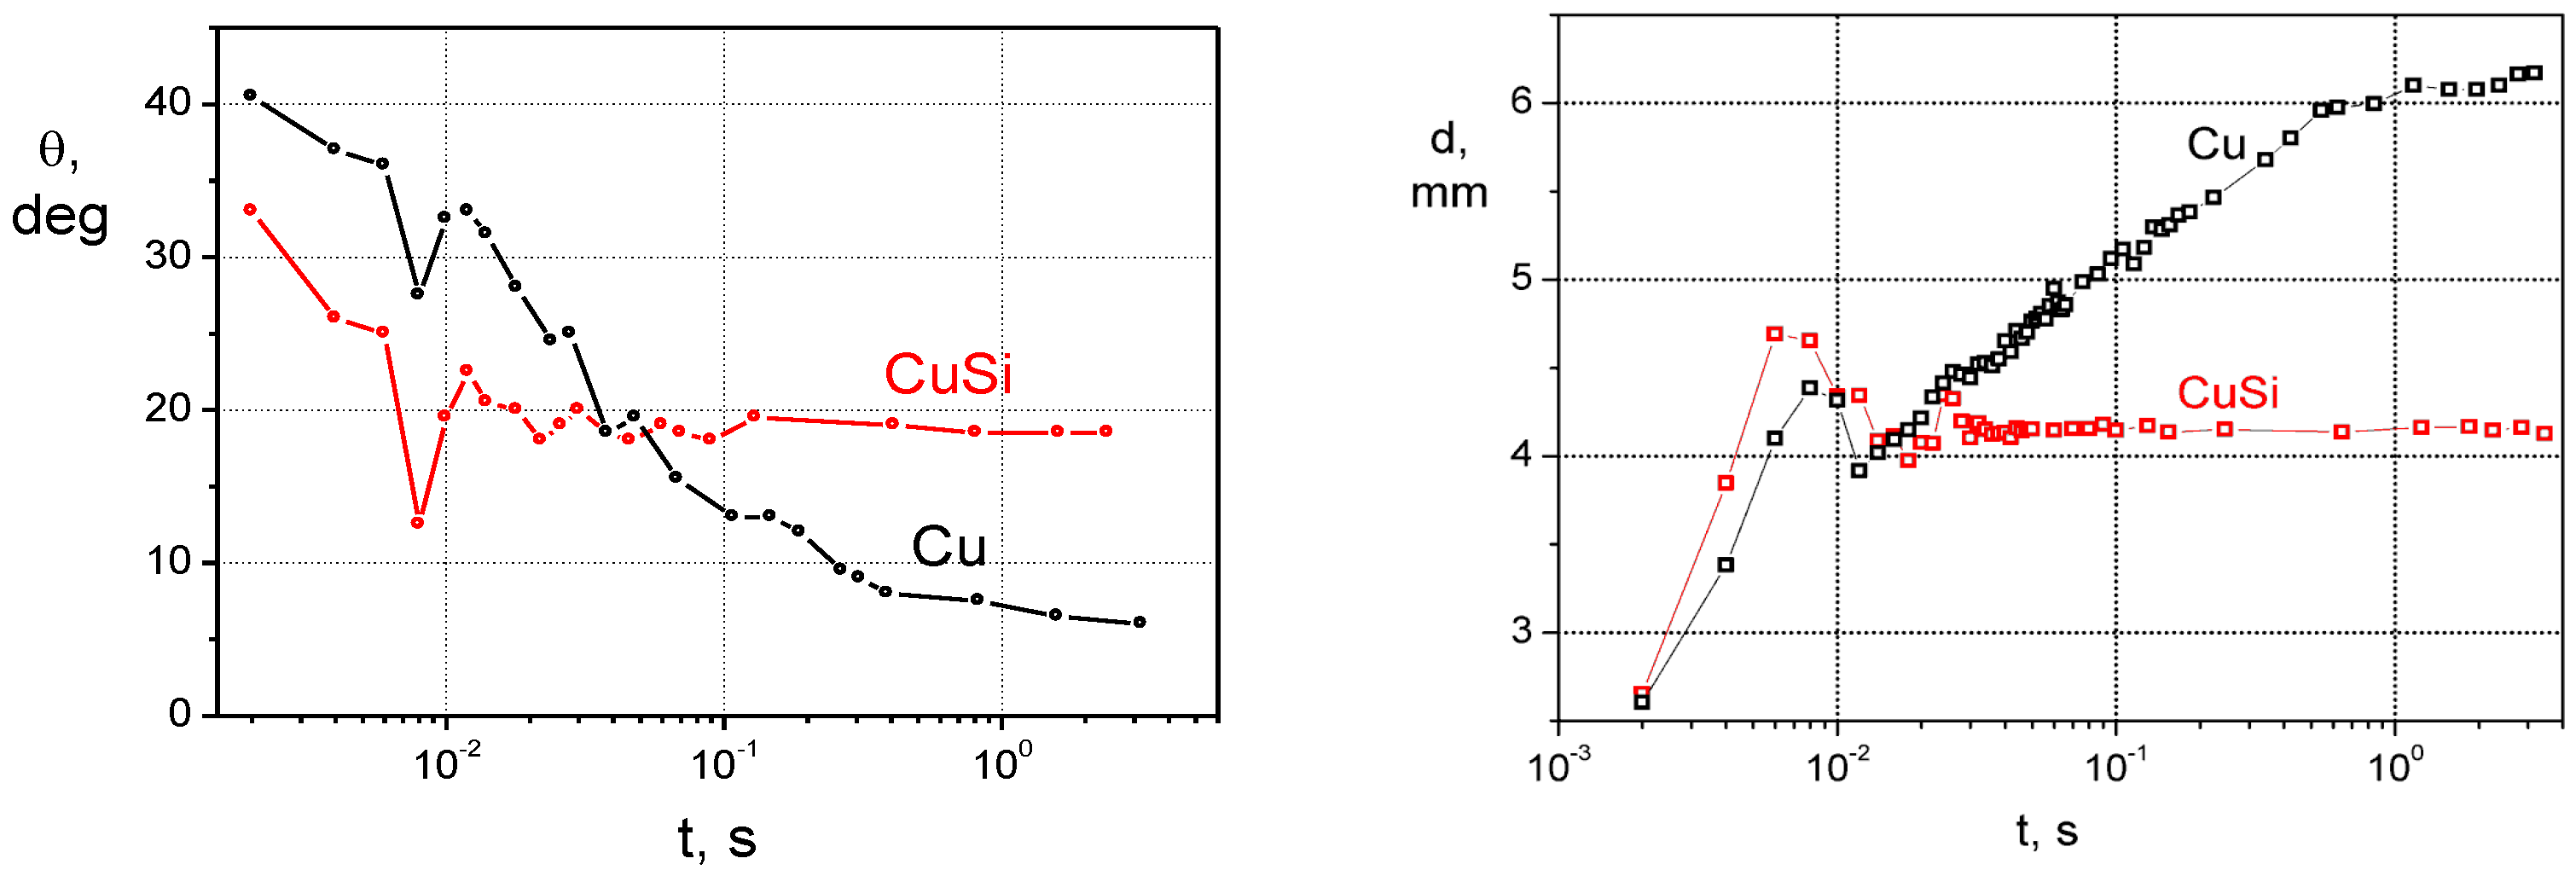
3.2. Dissolutive Wetting


3.3. Dissolution vs. Formation of a New Compound


4. Application in Processing of Materials
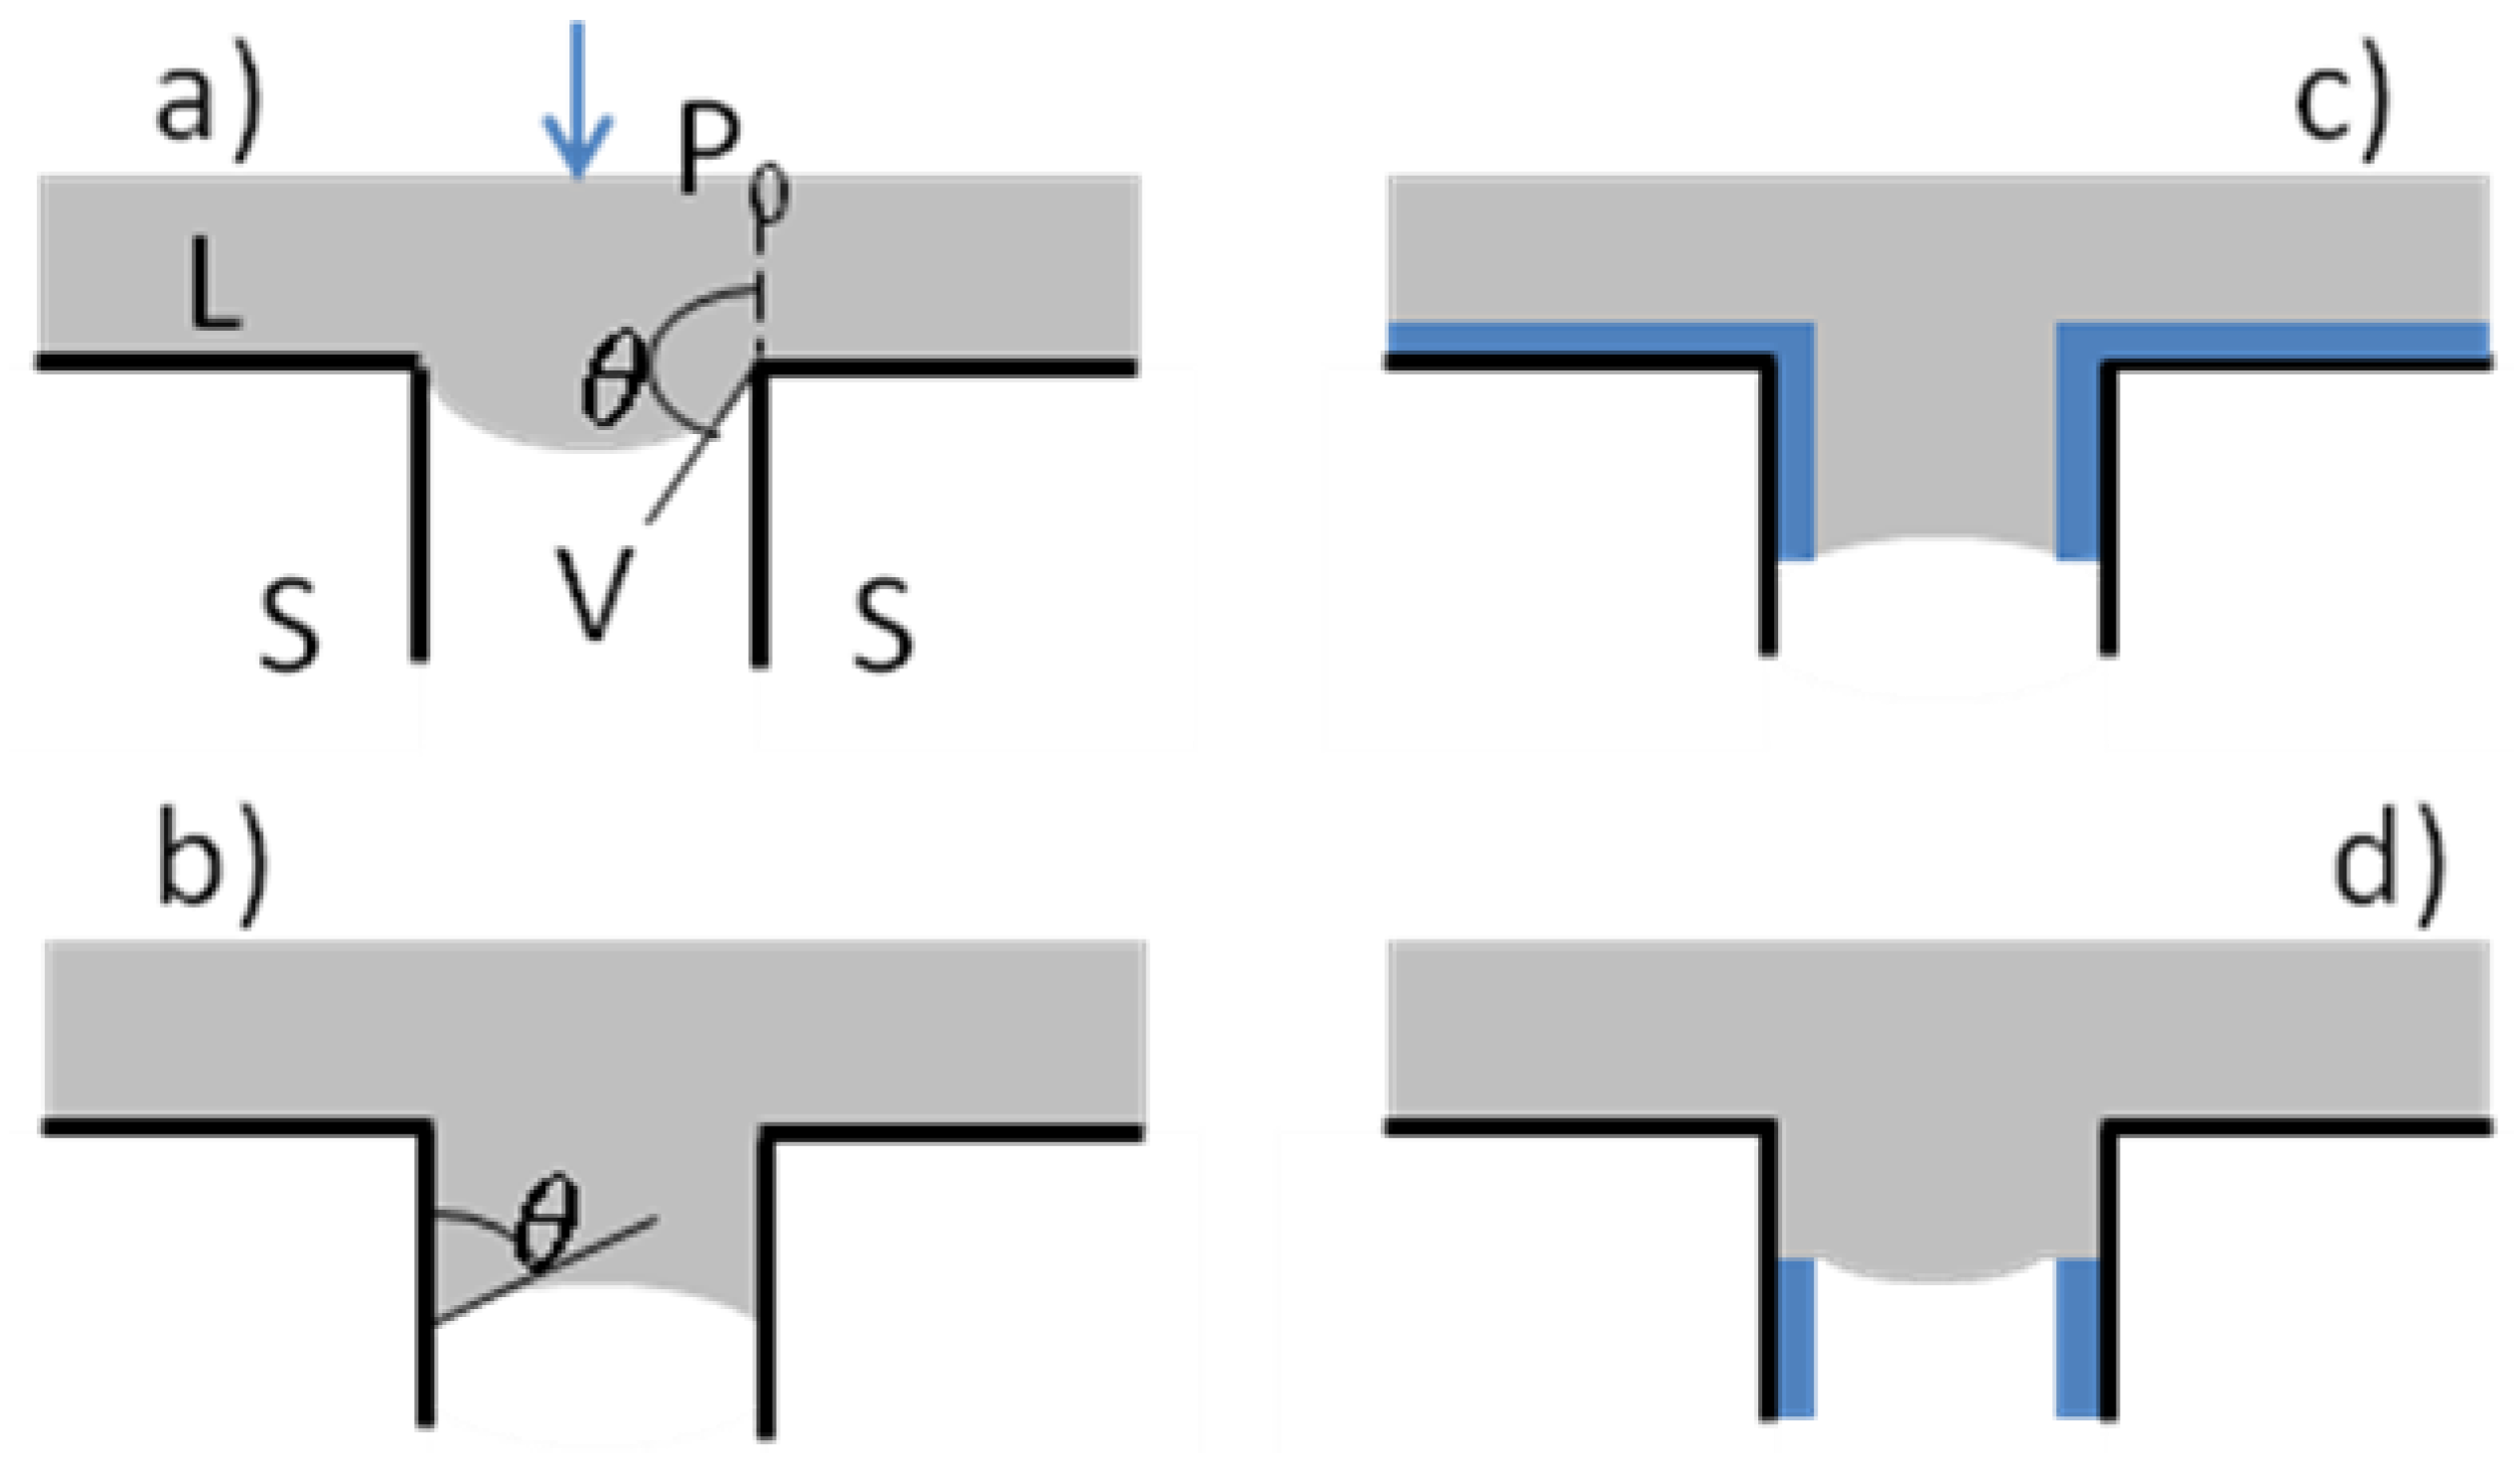
4.1. Wetting in Infiltration


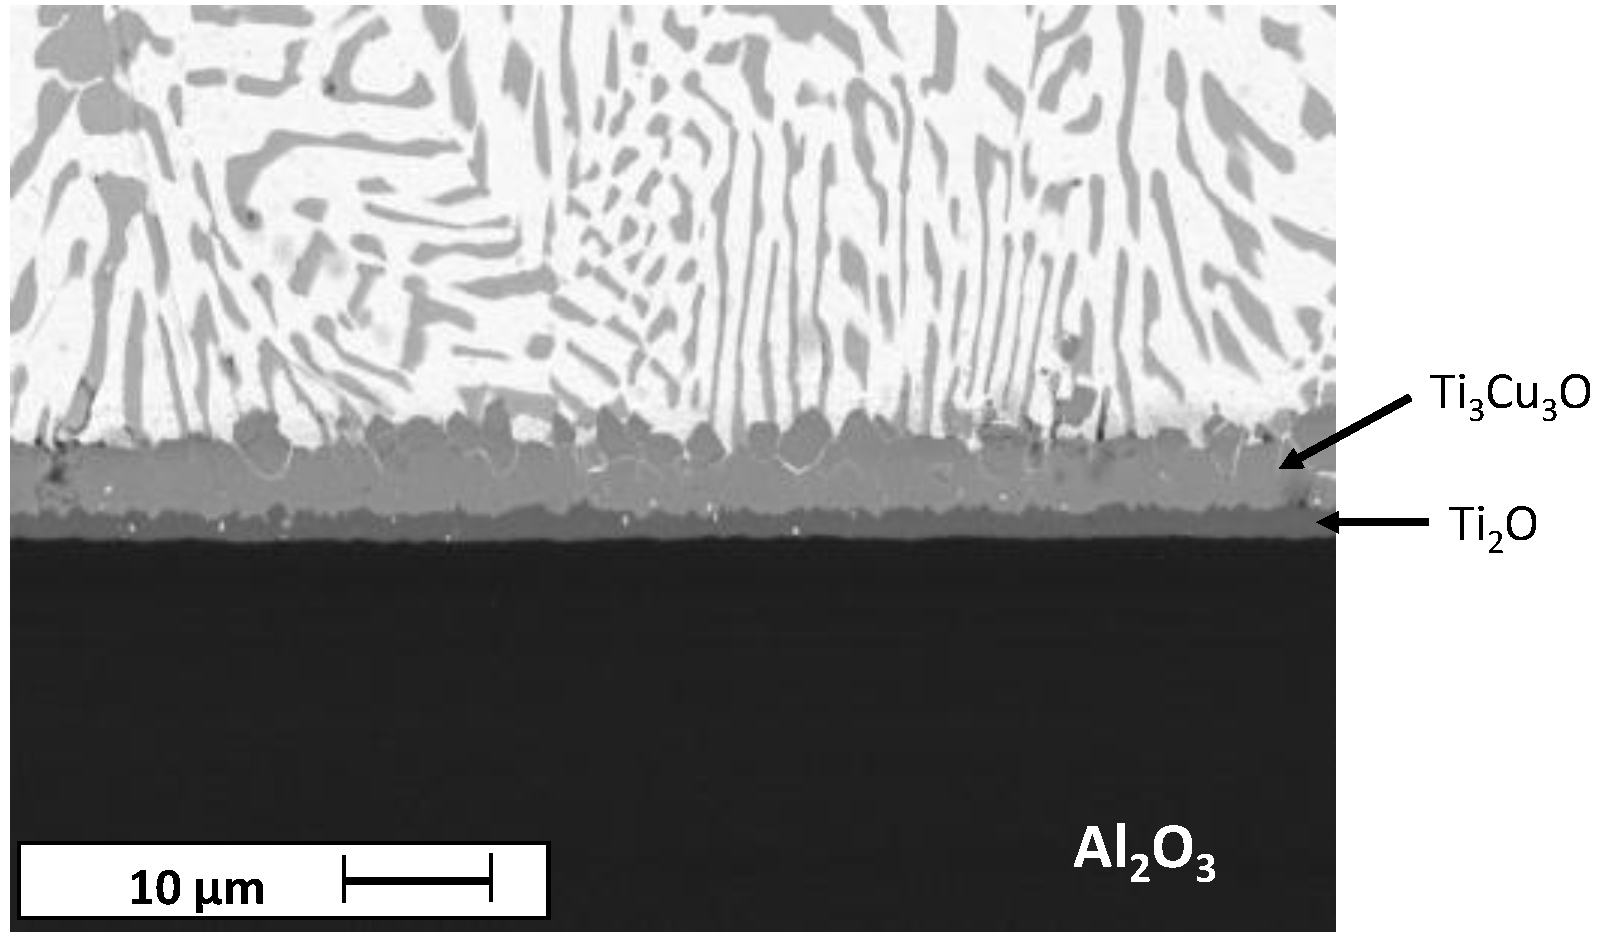
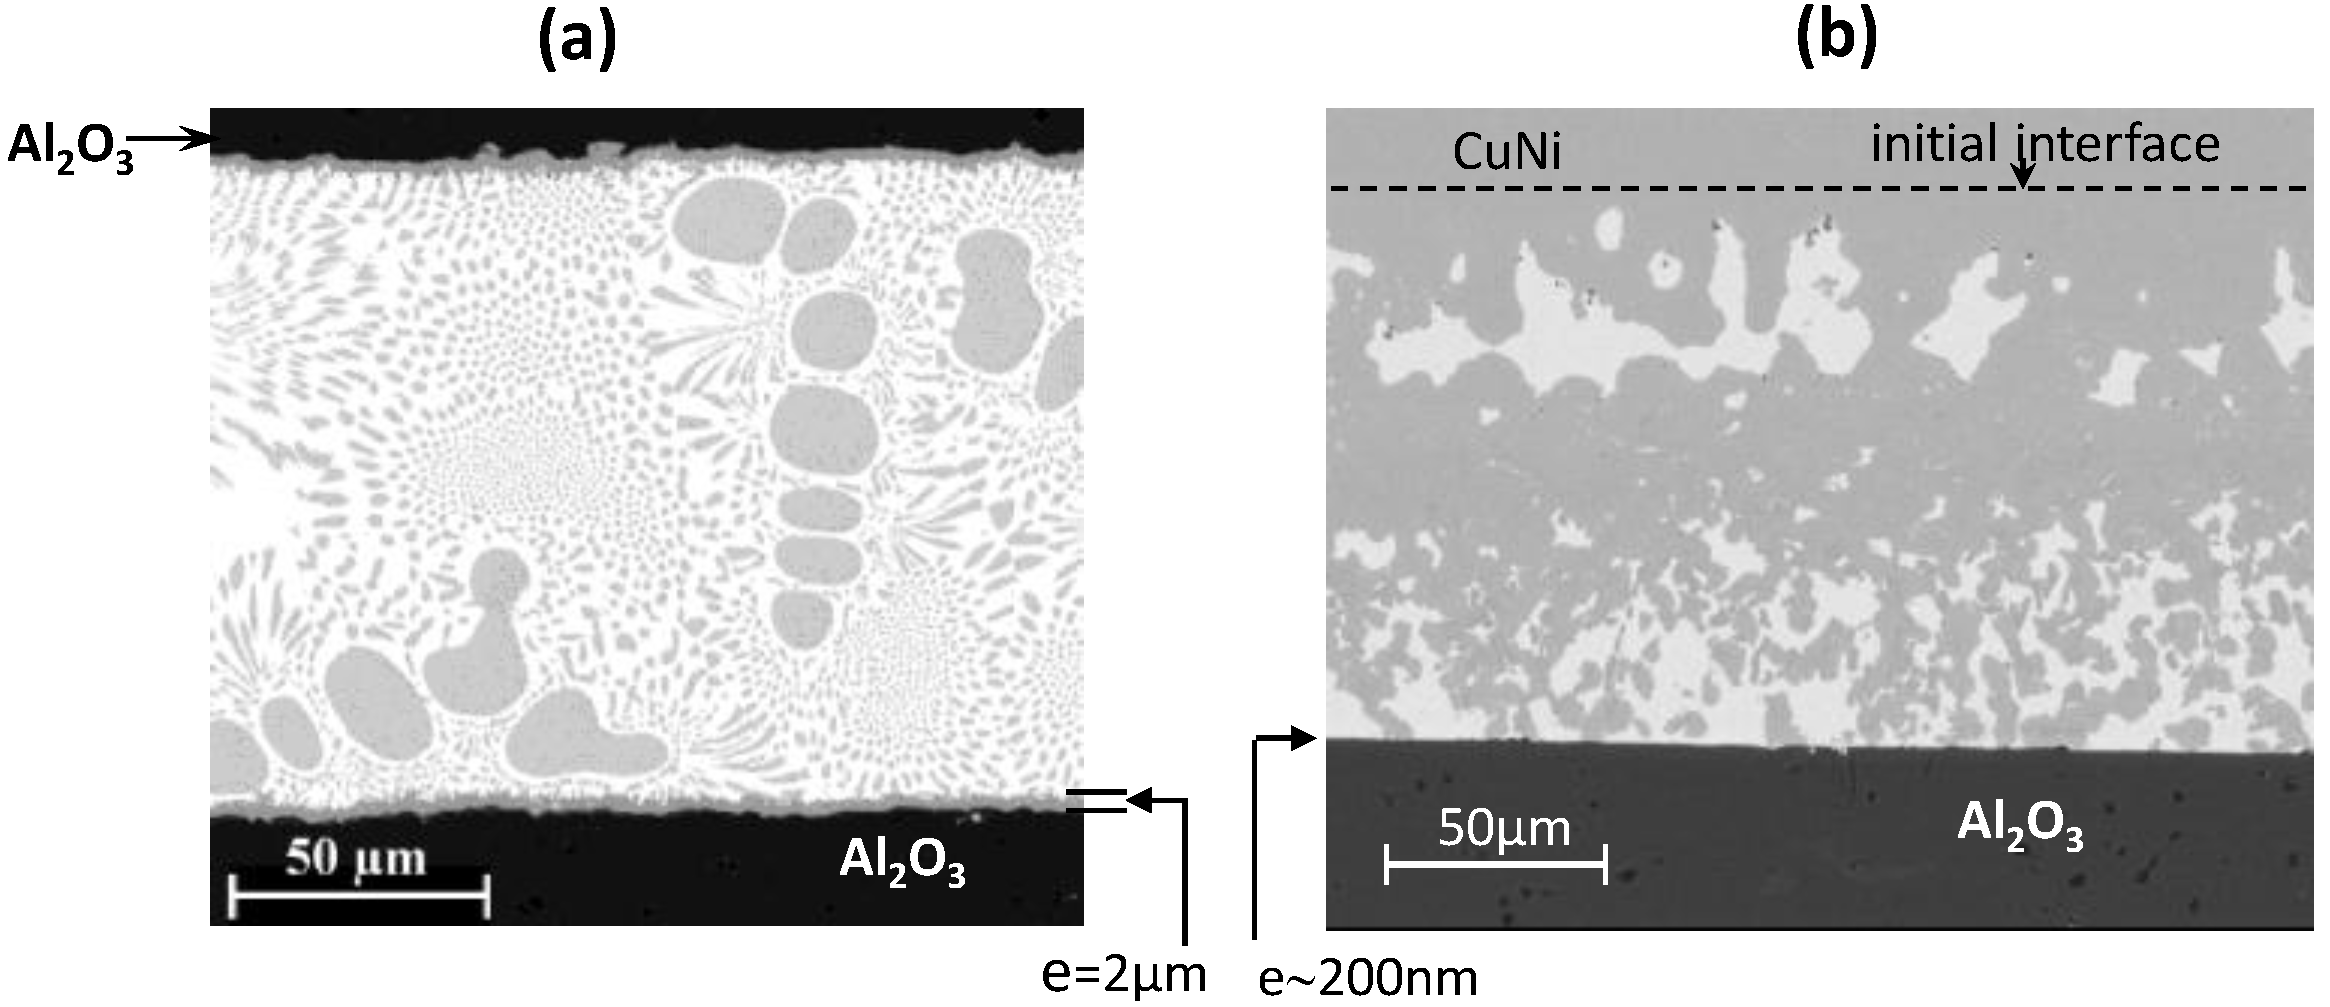
4.2. Wetting in Brazing: Effect of Interfacial Reactions


5. Conclusions and Perspectives
Conflicts of Interest
References
- Eustathopoulos, N.; Sobczak, N.; Passerone, A.; Nogi, K. Measurement of contact angle and work of adhesion at high temperature. J. Mater. Sci. 2005, 40, 2271–2280. [Google Scholar] [CrossRef]
- Eustathopoulos, N.; Drevet, B.; Nicholas, M.G. Wettability at High Temperatures; Pergamon: Oxford, UK, 1999; Volume 3. [Google Scholar]
- Kumar, G.; Prabhu, K.N. Review of non-reactive and reactive wetting of liquids on surfaces. Adv. Colloid Interface Sci. 2007, 133, 61–89. [Google Scholar] [CrossRef] [PubMed]
- Eustathopoulos, N.; Drevet, B.; Muolo, M.L. The oxygen-wetting transition in metal/oxide systems. Mater. Sci. Eng. A 2001, 300, 34–40. [Google Scholar] [CrossRef]
- Battezzati, L.; Greer, L.A. The viscosity of liquid metals and alloys. Acta Metall. 1989, 37, 1791–1802. [Google Scholar] [CrossRef]
- Saiz, E.; Tomsia, A.P. Atomic dynamics and Marangoni films during liquid-metal spreading. Nat. Mater. 2004, 3, 903–909. [Google Scholar] [CrossRef] [PubMed]
- Saiz, E.; Tomsia, A.P.; Rauch, N.; Scheu, C.; Ruehle, M.; Benhassine, M.; Seveno, D.; de Coninck, J.; Lopez-Esteban, S. Nonreactive spreading at high temperature: Molten metals and oxides on molybdenum. Phys. Rev. E 2007, 76, 041602–041615. [Google Scholar] [CrossRef]
- Protsenko, P.; Garandet, J.-P.; Voytovych, R.; Eustathopoulos, N. Thermodynamics and kinetics of dissolutive wetting of Si by liquid Cu. Acta Mater. 2010, 28, 6565–6574. [Google Scholar] [CrossRef]
- Kozlova, O.; Voytovych, R.; Protsenko, P.; Eustathopoulos, N. Non-reactive versus dissolutive wetting of Ag-Cu alloys on Cu substrates. J. Mater. Sci. 2010, 45, 2099–2105. [Google Scholar] [CrossRef]
- Rado, C. Contribution à l’étude du mouillage et de l’adhésion thermodynamique des métaux et alliages sur le carbure de silicium. Ph.D. Thesis, Grenoble-INP, Grenoble, France, 1997. [Google Scholar]
- Frage, N.; Froumin, N.; Dariel, M.P. Wetting of TiC by non-reactive liquid metals. Acta Mater. 2002, 50, 237–245. [Google Scholar] [CrossRef]
- Dezellus, O.; Hodaj, F.; Eustathopoulos, N. Progress in modeling of chemical-reaction limited wetting. J. Eur. Ceram. Soc. 2003, 23, 2797–2803. [Google Scholar] [CrossRef]
- Saiz, E.; Tomsia, A.P.; Cannon, R.M. Ridging effects on wetting and spreading of liquids on solids. Acta Mater. 1998, 46, 2349–2361. [Google Scholar] [CrossRef]
- Eustathopoulos, N. Progress in understanding and modelling reactive wetting of metals on ceramics. Curr. Opin. Solid State Mater. Sci. 2005, 9, 152–160. [Google Scholar] [CrossRef]
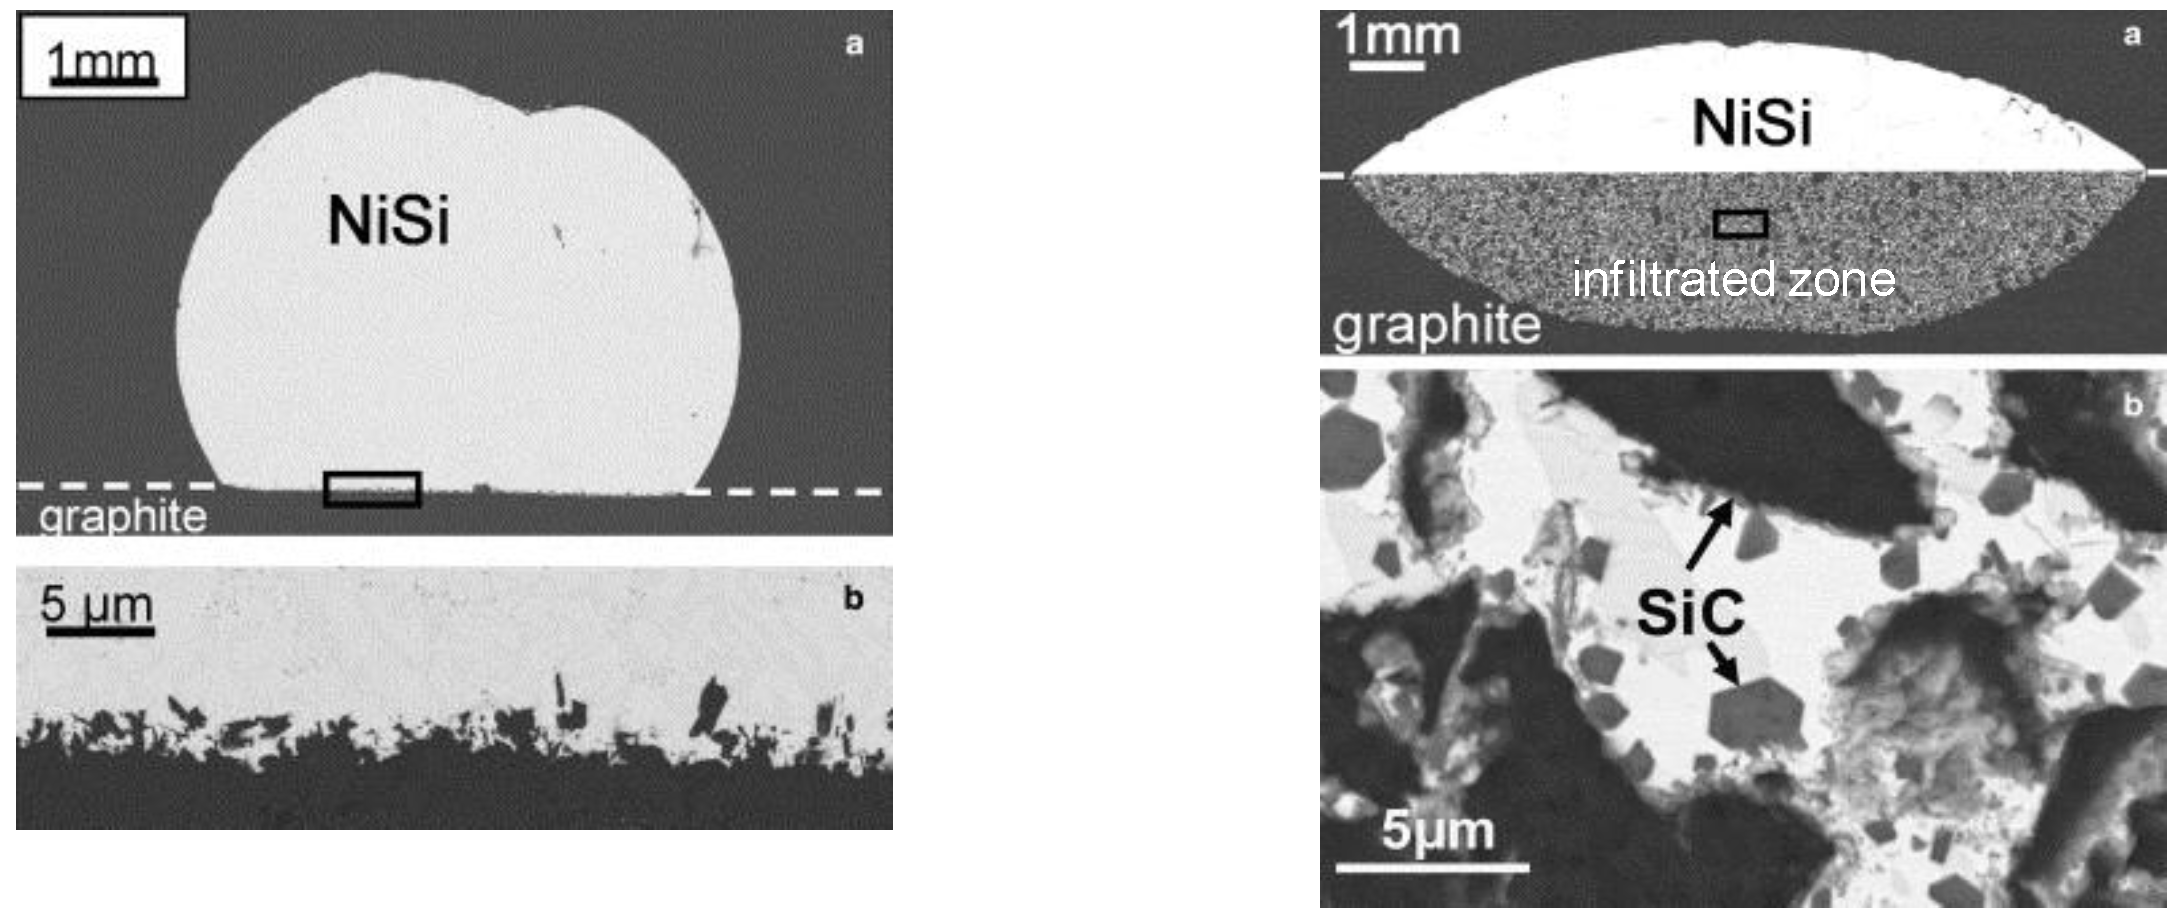
- Bougiouri, V.; Voytovych, R.; Dezellus, O.; Eustathopoulos, N. Wetting and reactivity in Ni-Si/C system: Experiments versus model predictions. J. Mater. Sci. 2007, 42, 2016–2023. [Google Scholar] [CrossRef]
- Dezellus, O.; Jacques, S.; Hodaj, F.; Eustathopoulos, N. Wetting and infiltration of carbon by liquid silicon. J. Mater. Sci. 2005, 40, 2307–2311. [Google Scholar] [CrossRef]
- Yin, L.; Murray, B.T.; Singler, T.J. Dissolutive wetting in the Bi-Sn system. Acta Mater. 2006, 54, 3561–3574. [Google Scholar] [CrossRef]
- Lai, Q.Q.; Zhang, L.; Eustathopoulos, N. Enhanced wetting of dual-phase metallic solids by liquid metals: A new effect of interfacial reaction. Acta Mater. 2013, 61, 4127–4134. [Google Scholar] [CrossRef]
- Voytovych, R.; Koltsov, A.; Hodaj, F.; Eustathopoulos, N. Reactive vs. non-reactive wetting of ZrB2 by azeotropic Au-Ni. Acta Mater. 2007, 55, 6316–6321. [Google Scholar] [CrossRef]
- Bougiouri, V.; Voytovych, R.; Rojo-Calderon, N.; Narciso, J.; Eustathopoulos, N. The role of the chemical reaction in the infiltration of porous carbon by NiSi alloys. Scr. Mater. 2006, 54, 1875–1878. [Google Scholar] [CrossRef]
- Evans, A.; SanMarchi, C.; Mortensen, A. Metal Matrix Composites in Industry: An Introduction and a Survey; Kluwer Academic Publishers: Dordrecht, NL, USA, 2003. [Google Scholar]
- Mortensen, A. Melt infiltration of metal matrix composites. In Comprenhensive Composite Materials; Kelly, A., Zweben, C., Eds.; Pergamon: Oxford, UK, 2000; Volume 3, pp. 521–554. [Google Scholar]
- Michaud, V.J.; Compton, L.M.; Mortensen, A. Capillarity in isothermal infiltration of alumina fiber preforms with aluminum. Metall. Mater. Trans. A 1994, 25A, 2145–2152. [Google Scholar] [CrossRef]
- Alonso, A.; Pamies, A.; Narciso, J.; Garcia-Cordovilla, C.; Louis, E. Evaluation of the wettability of liquid aluminum with ceramic particulates (SiC, TiC, Al2O3) by means of pressure infiltration. Metall. Trans. A 1993, 24A, 1423–1432. [Google Scholar] [CrossRef]
- Washburn, E.W. The dynamics of capillary flow. Phys. Rev. 1921, 17, 273–283. [Google Scholar] [CrossRef]
- Trumble, K.P. Spontaneous infiltration of non-cylindrical porosity: Close-packed spheres. Acta Mater. 1998, 46, 2363–2367. [Google Scholar] [CrossRef]
- Kaptay, G.; Barczy, T. On the asymmetrical dependence of the threshold pressure of infiltration on the wettability of the porous solid by the infiltrating liquid. J. Mater. Sci. 2005, 40, 2531–2535. [Google Scholar] [CrossRef]
- Ness, J.N.; Page, T.F. Microstructural evolution in reaction-bonded silicon carbide. J. Mater. Sci. 1986, 21, 1377–1397. [Google Scholar] [CrossRef]
- Wang, Y.; Tan, S.; Jiang, D. The effect of porous carbon preform and the infiltration process on the properties of reaction-formed SiC. Carbon 2004, 42, 1833–1839. [Google Scholar] [CrossRef]
- Einset, E.O. Capillary infiltration rates into porous media with applications to Silcomp processing. J. Am. Ceram. Soc. 1996, 79, 333–338. [Google Scholar] [CrossRef]
- Sangsuwan, P.; Tewari, S.N.; Gatika, J.E.; Singh, M.; Dickerson, R. Reactive infiltration of silicon melt through microporous amorphous carbon performs. Metall. Mater. Trans. B 1999, 30B, 933–944. [Google Scholar] [CrossRef]
- Kumar, S.; Kumar, A.; Devi, R.; Shukla, A.; Gupta, A.K. Capillary infiltration studies of liquids into 3D-stitched C-C preforms Part B: Kinetics of silicon infiltration. J. Eur. Ceram. Soc. 2009, 29, 2651–2657. [Google Scholar] [CrossRef]
- Israel, R.; Voytovych, R.; Protsenko, P.; Drevet, B.; Camel, D.; Eustathopoulos, N. Capillary interactions between molten silicon and porous graphite. J. Mater. Sci. 2010, 45, 2210–2217. [Google Scholar] [CrossRef]
- Israel, R. Etude des interactions entre silicium liquid et graphite pour l’application à l’elaboration du silicium photovoltaique. Ph.D. Thesis, Grenoble-INP, Grenoble, France, 2009. [Google Scholar]
- Drevet, B.; Eustathopoulos, N. Wetting of ceramics by molten silicon and silicon alloys: A review. J. Mater. Sci. 2012, 47, 8247–8260. [Google Scholar] [CrossRef]
- Drevet, B.; Voytovych, R.; Israel, R.; Eustathopoulos, N. Wetting and adhesion of Si on Si3N4 and BN substrates. J. Eur. Ceram. Soc. 2009, 29, 2363–2367. [Google Scholar] [CrossRef]
- Huguet, C.; Deschamps, C.; Voytovych, R.; Drevet, B.; Camel, D.; Eustathopoulos, N. Initial stages of silicon–crucible interactions in crystallisation of solar grade silicon: Kinetics of coating infiltration. Acta Mater. 2014, 76, 151–167. [Google Scholar] [CrossRef]
- Rado, C.; Drevet, B.; Eustathopoulos, N. The role of compound formation in reactive wetting: The Cu/SiC system. Acta Mater. 2000, 48, 4483–4491. [Google Scholar] [CrossRef]
- Koltsov, A.; Hodaj, F.; Eustathopoulos, N. Brazing of AlN to SiC by a Pr silicide: Physicochemical aspects. Mater. Sci. Eng. A 2008, 495, 259–264. [Google Scholar] [CrossRef]
- Voytovych, R.; Robaut, F.; Eustathopoulos, N. The relation between wetting and interfacial chemistry in the CuAgTi/alumina system. Acta Mater. 2006, 54, 2205–2214. [Google Scholar] [CrossRef]
- Kozlova, O.; Braccini, M.; Voytovych, R.; Eustathopoulos, N.; Martinetti, P.; Devismes, M.-F. Brazing copper to alumina using reactive CuAgTi alloys. Acta Mater. 2010, 58, 1252–1260. [Google Scholar] [CrossRef]
- Valette, C.; Devismes, M.-F.; Voytovych, R.; Eustathopoulos, N. Interfacial reactions in alumina/CuAgTi braze/CuNi system. Scr. Mater. 2005, 52, 1–6. [Google Scholar] [CrossRef]
- Landry, K.; Eustathopolos, N. Dynamics of wetting in reactive metal/ceramic systems: Linear spreading. Acta Mater. 1996, 44, 3923–3932. [Google Scholar] [CrossRef]
- Mortensen, A.; Drevet, B.; Eustathopoulos, N. Kinetics of diffusion-limited spreading of sessile drops in reactive wetting. Scr. Mater. 1997, 36, 645–651. [Google Scholar] [CrossRef]
- Koltsov, A.; Hodaj, F.; Eustathopoulos, N.; Dezellus, A.; Plaindoux, P. Wetting and interfacial reactivity in Ag-Zr/sintered AlN system. Scr. Mater. 2003, 48, 351–357. [Google Scholar] [CrossRef]
© 2015 by the authors; licensee MDPI, Basel, Switzerland. This article is an open access article distributed under the terms and conditions of the Creative Commons Attribution license (http://creativecommons.org/licenses/by/4.0/).
Share and Cite
Eustathopoulos, N. Wetting by Liquid Metals—Application in Materials Processing: The Contribution of the Grenoble Group. Metals 2015, 5, 350-370. https://doi.org/10.3390/met5010350
Eustathopoulos N. Wetting by Liquid Metals—Application in Materials Processing: The Contribution of the Grenoble Group. Metals. 2015; 5(1):350-370. https://doi.org/10.3390/met5010350
Chicago/Turabian StyleEustathopoulos, Nicolas. 2015. "Wetting by Liquid Metals—Application in Materials Processing: The Contribution of the Grenoble Group" Metals 5, no. 1: 350-370. https://doi.org/10.3390/met5010350