

Design of Glass Fiber-Doped High-Resistivity Hot-Pressed Permanent Magnets for Reducing Eddy Current Loss


Division of Function Materials, Central Iron and Steel Research Institute, Beijing 100081, China
*
Author to whom correspondence should be addressed.
Metals 2023, 13(4), 808; https://doi.org/10.3390/met13040808
Submission received: 11 March 2023
/
Revised: 12 April 2023
/
Accepted: 18 April 2023
/
Published: 20 April 2023
(This article belongs to the Topic Microstructure and Properties in Metals and Alloys)
Abstract
:The Nd-Fe-B hot-deformation magnet with high resistivity was successfully prepared by hot-pressing and hot-deformation of Nd-Fe-B fast-quenched powder with amorphous glass fiber. After the process optimization, the resistivity of the magnet was increased from 0.383 mΩ·cm to 7.2 mΩ·cm. Therefore, the eddy current loss of magnets can be greatly reduced. The microstructure shows that the granular glass fiber forms a continuous isolation layer during hot deformation. At the same time, the boundary of Nd-Fe-B quick-quenched the flake and glass fiber from the transition layer, which improves the binding of the two, and which can effectively prevent the spalling of the isolation layer. In addition, adding glass fiber improves the orientation of the hot deformation magnet to a certain extent. The novel design concept of insulation materials provides new insights into the development and application of rare earth permanent magnet materials.
1. Introduction
Permanent magnet materials are important for industry, military, and information technology [1,2,3,4]. At present, in an environment where green and clean energy is promoted, the demand for permanent magnet materials in the fields of wind power, electric vehicles, electric motors, robots, and aerospace is continuously increasing [5]. Among the permanent magnets, the demand for Nd-Fe-B increased the most, reaching 2.1×10⁴ t production in 2020. However, after 2011, the price of rare earth soared due to fluctuations in prices [1]. At the same time, Ce-containing dual-main phase (DMP) Nd-Fe-B magnets emerged and became popular due to their balanced utilization of high-abundance rare earth elements [6]. DMP magnets are made by adding Ce-Fe-B during the preparation of Nd-Fe-B magnets to form magnets with both Nd-Fe-B and Ce-Fe-B main phases, and they have excellent magnetic properties compared to single main phase Nd-Fe-B magnets [7,8].
As the temperature increases, all magnets inevitably face the problem of irreversible demagnetization, and the above means only alleviating the problem to a certain extent. After the high temperature demagnetization of the magnet, it still has enough magnetic properties for use. The ideal magnet should have a high magnetic energy product and a square demagnetization curve, which undoubtedly describes Nd-Fe-B magnets. However, the Curie temperature of 315 °C limits its usable condition, which has to be lower than 80 °C (N grade); otherwise, irreversible demagnetization will occur. Although the coercivity is increased by adding heavy rare earth elements such as Dy and Tb, and although the Curie temperature is increased by adding Co, the maximum service temperature is not more than 240 °C (AH grade) [3]. When the Nd-Fe-B magnet rises from 20 °C to 100 °C, the magnetic energy product will decrease by half, and the motor power will decrease [9], which will cause a waste of magnetic energy.
Because the resistivity of rare earth permanent magnets is very small, the eddy current generated in them is the main factor for the heating of magnets. Reducing the eddy current loss in magnets and thus reducing the temperature of magnets during operation is a problem that needs to be considered. Through the optimization of motor structure designs, although a certain effect has been achieved [9,10,11], the magnet resistivity is often used as a fixed value, so the optimization results are not satisfactory. In addition to optimizing the design of the motor structure, Aoyama [12] noted that increasing the resistivity of the magnet can also effectively reduce the eddy current loss. Considering the skin effect of the eddy current and the insulation of the main phase grains or raw material particles in the magnet, the electron transport in the magnet can be reduced by the heat source, and the resistivity can be increased. Thus, the working temperature of the magnet can be decreased. Gabay [13] introduced CaS for insulation and isolation, and it was found that adding sulfur (phosphorus) compounds would form NdS, which would reduce the metallurgical bonding of the cladding layer. Although the introduction of SiO2 increases the resistivity to a certain extent, Nd will combine with O to form NdO, resulting in the loss of the Nd-rich phase and the reduction of magnetic properties [14]. Fluoride is suitable for addition to permanent magnet materials because of its inertia. The addition of NdF increased the magnetic resistivity by 200% [15]. Komuro et al. [16] prepared a magnet with a fluoride coating with a resistivity of 1.4 mΩ·mm. The surface resistivity of the magnet increased by 10 times, and the rotor temperature decreased by 50%. Although these works have made some progress, some problems still occur. In the above methods, most of the materials involved are inorganic compounds. In the process of magnet insulation and coating, these inorganic compounds cannot deform with the magnet; thus, spalling occurs during the deformation process of the magnet, which cannot effectively isolate the magnet. In addition, it is often necessary to complete the coating process with the help of liquid re-rich phase flow. The participation of the rare-earth rich phase in the coating will not only reduce the insulating ability of the coating layer but also cause the loss of the rare-earth rich phase and reduce the magnetic properties.
The method of adding insulating materials and the form of insulating materials play an important role in the resistivity of composite materials. McLachlan [17] gave the general effective media equation and described the different wetting and coating conditions between the conductive phase and the insulating phase. For calculating the resistivity of composite materials with continuous isolation layers:
ρm = ρh(1 − Φ)mΦ
ρm is the resistivity of the composite, ρh is the resistivity of the low-conductivity phase, Φ is the volume fraction of the high-conductivity phase, and mΦ is the exponent for randomly oriented high-conductivity ellipsoids.
Depending on the value range of mΦ, a thin layer of insulation distributed continuously helps to isolate electron transport between adjacent particles, thus increasing the resistivity of the composite magnet. As seen from the metal binary phase diagram, most of the crystalline compound insulating materials have very high melting points, which cannot follow the deformation of the magnet during the particle coating process. Moreover, spalling occurs during the deformation process. At the same time, liquid re-rich phase flow is often needed to complete the coating process. The isolation layer formed by these crystalline compounds is still dispersed rather than continued under the non-wetting or intermediate wetting case discussed for the general effective media equation.
In this work, to overcome the shortcomings of the insulating layer, we designed a composite magnet doped with amorphous materials. In contrast to crystalline materials, amorphous materials, which can be deformed well with magnetic powder, will exhibit viscous flow with an increasing temperature. Through the systematic study of magnets with amorphous glass fibers, it is verified that this design can significantly improve the resistivity of the magnets and facilitate the preparation of magnets with oriented textures. The new design idea provides a new way to develop high-resistivity rare earth permanent magnets with oriented textures.
2. Materials and Methods
The magnetic powder was commercial melt-spun ribbon powder with a composition of Nd30.7Febal(Co3.98Ga0.48)B0.89 (wt.%), and the glass fiber was crushed through a 2000 mesh screen, with a composition of CaO·SiO2. Three different additions of mixed magnetic powder were prepared, and the additions were 2 wt.%, 5 wt.%, and 10 wt.%, respectively. The mixing powder was hot-pressed at temperatures of 550 °C under 130 MPa for 2 min. After that, the sample was heated to 850 °C and kept warm for 1 min with a deformation rate of approximately 60~70%. A simple hot-deformed magnet without the addition of glass fiber was also prepared. The resistivity was by a four-point probe resistivity. The microstructure was studied using scanning electron microscopy (SEM) JEOL JSM 7100F, and energy dispersion spectrum (EDS) was used for elemental analysis. X-ray diffraction (XRD) was used to examine the crystalline constituents and detected on PANalytical Empyrean Series 2. The orthogonal experiment in Table L9(34) was used to explore and optimize the magnet preparation experimental parameters. For the experimental parameters, the hot-pressing temperature was 550 °C, 575 °C, and 600 °C, and then the hot-deformed temperature was 850 °C, 870 °C, and 890 °C, respectively.
3. Results
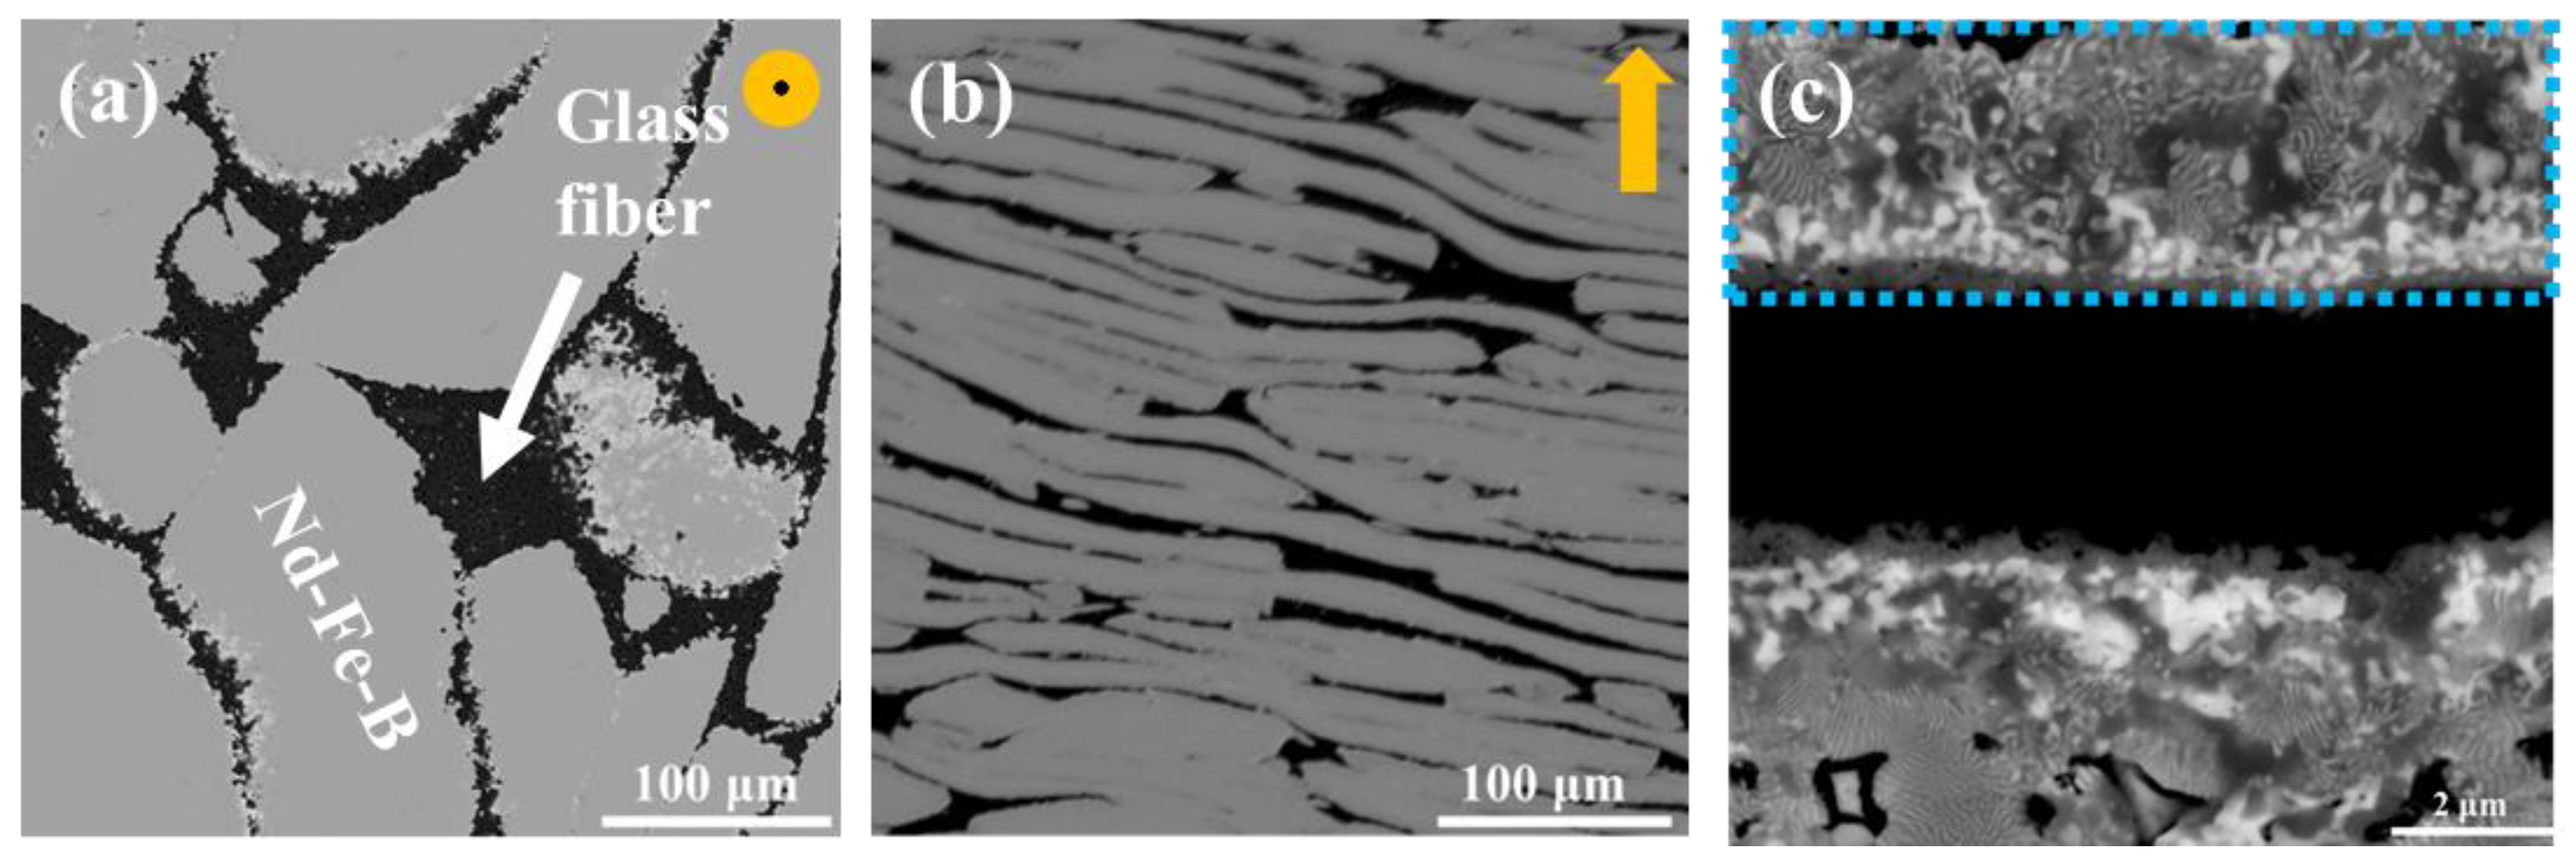
Backscattered electron (BSE)-SEM image from the hot-pressed magnet is shown in Figure 1a. The black regions are the grainy glass fiber between the original flakes of Nd-Fe-B, and they have relatively rough interfaces. BSE-SEM image of the hot-deformed magnet sample (Figure 1b) shows that glass fiber particles aggregate to form a continuous isolation layer after being hot deformed, and the interface with Nd-Fe-B flakes becomes smoother. Figure 1c is a partial enlargement of Figure 1b. It can be seen that the glass fiber not only aggregates itself but also forms transitional layers between the glass fiber and the Nd-Fe-B flakes, as shown by the line segment in Figure 1c.
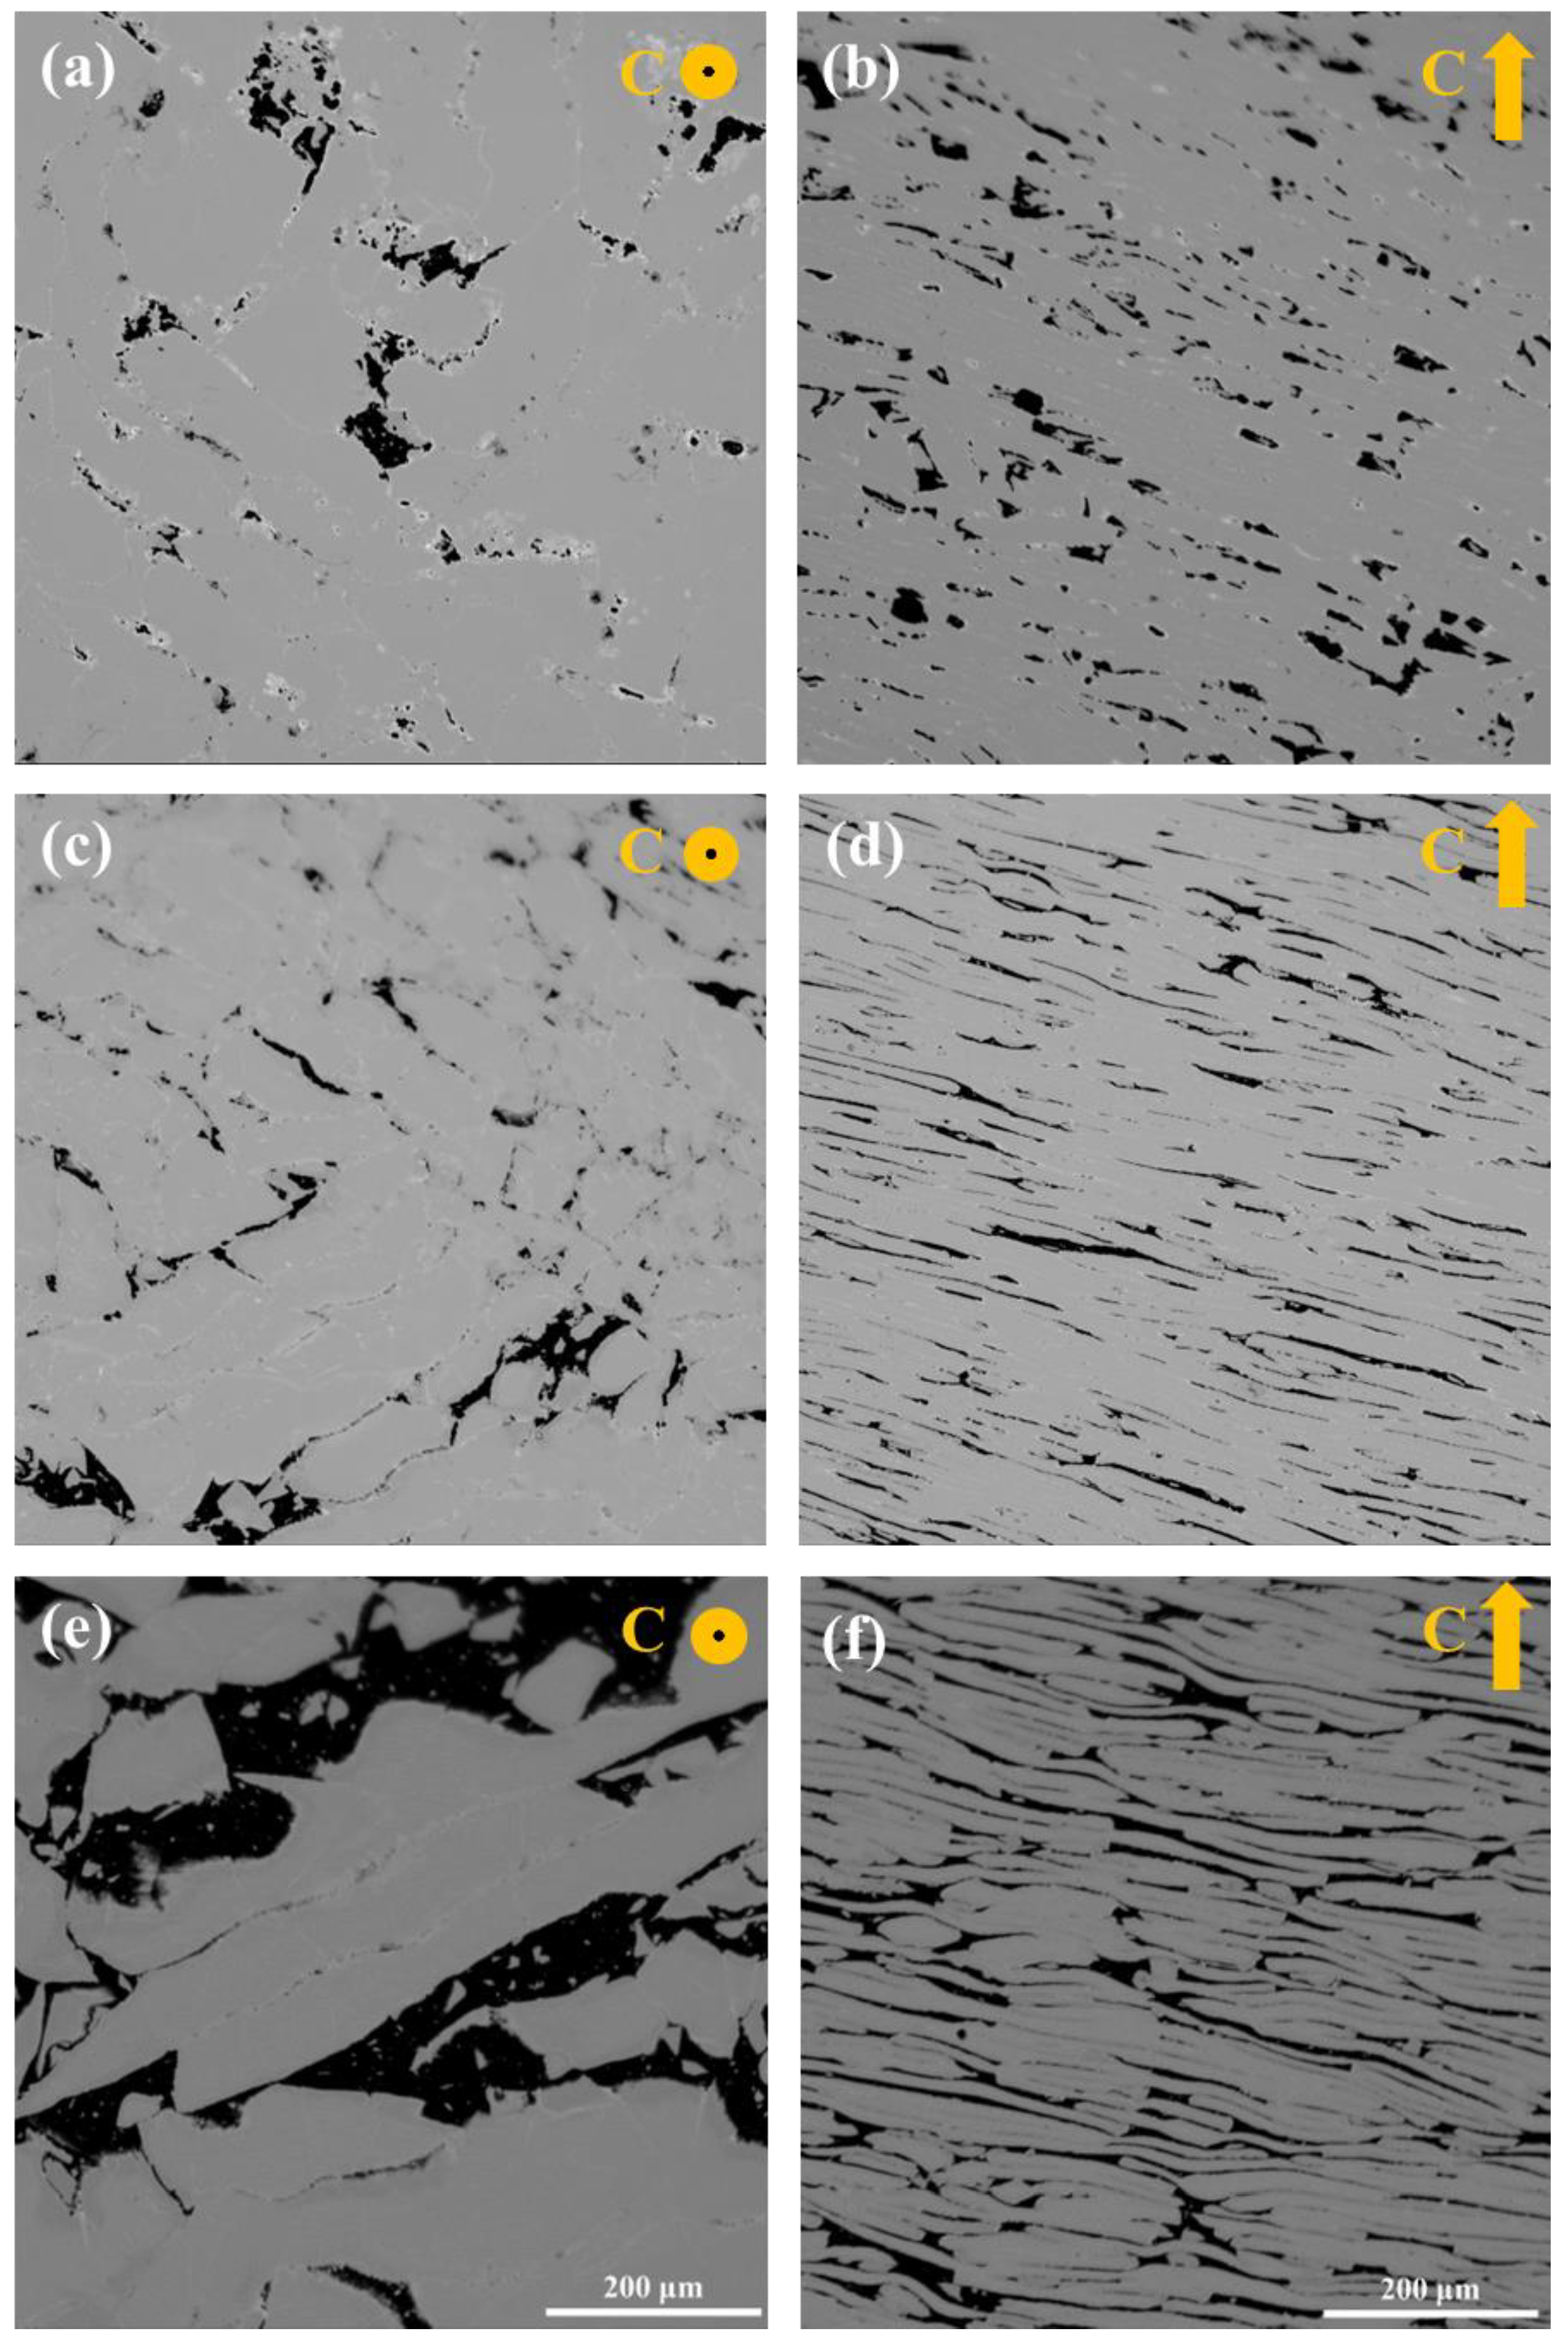
As shown in Figure 2, as the additions increase, the glass fiber tends to coat the main-phase grains. The distribution style of the magnetic flakes and the glass fiber was perpendicular to the c-axis direction, stacked in layers. Meanwhile, the distribution of the glass fiber made the grain boundary more clearly visible with increasing additions.
Figure 3 show the element maps in different directions of the hot deformed magnet. According to the role of element distribution, it is clear that only a small amount of Si atoms diffuse into the boundary of the Nd-Fe-B grains, and Fe atoms diffuse in the opposite direction; thus, the formation of the transitional layers is mainly caused by the mutual diffusion of Fe and Si elements.
Figure 4 shows the XRD of the hot deformed magnet with different glass fiber additions. There are the characteristic peaks of the calcium-containing compound, the peaks and in Figure 4b,e, and the peak (002) in Figure 4d of the CaFe(Si2O6) phase. The diffracted intensity of Ca element and CaO increased obviously with the increase of glass fiber addition, indicating that the glass fiber decomposed during the hot deformation process. This also means that there is a diffusion reaction between the glass fiber and the magnetic powder, which effectively improves the resistivity.
The results of the orthogonal experiment are shown in Table 1 and Table 2. Where Xi is the different measurement, Q is the variation sum of squares, and EOV is the estimator of variance. As shown in Table 2, all three factors are significantly affected. Furthermore, in the variance analysis results, the relationship of the three factors should be ABC, and the optimal analysis condition is A3B1C3.
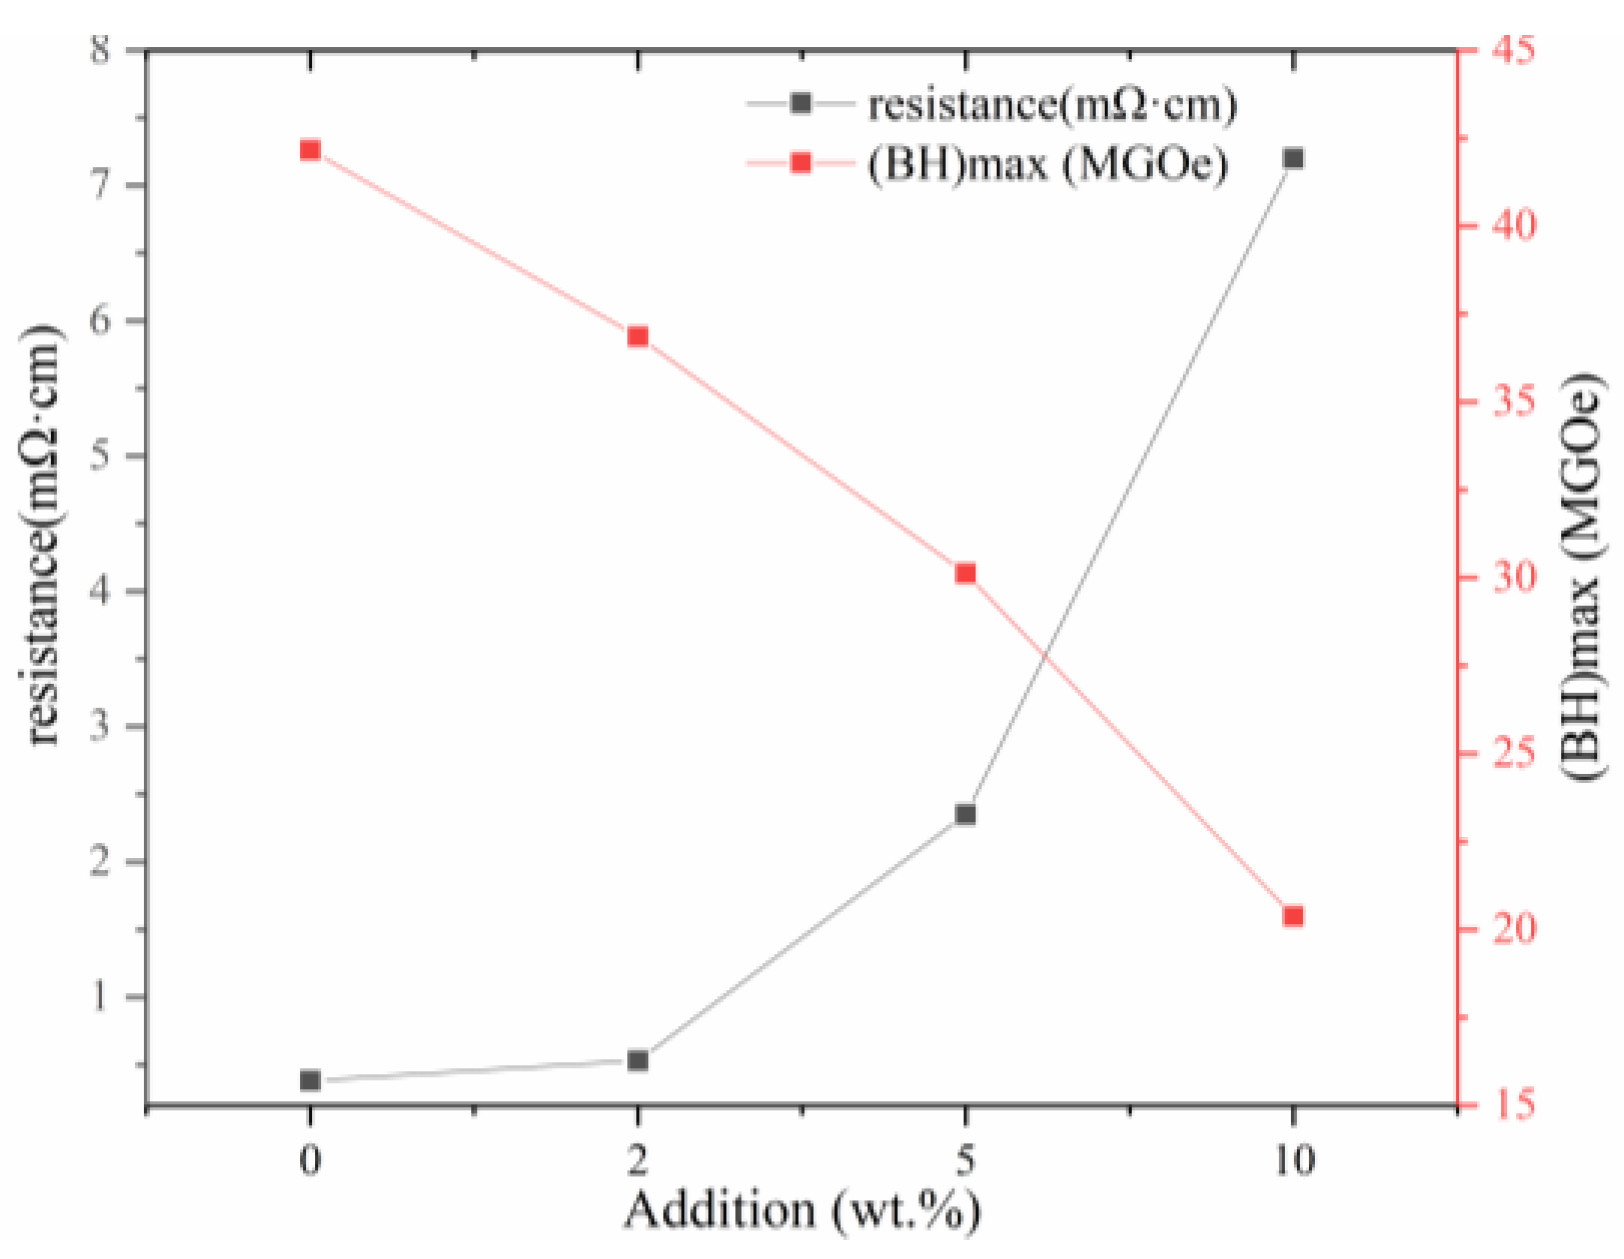
Figure 5 shows the confirmatory experiment results carried out under the explored conditions. The electrical resistivities of the magnets are 0.532, 2.35, and 7.2 mΩ·cm when the amount of glass fiber added is 2 wt.%, 5 wt.%, and 10 wt.%, respectively. Compared to the 0.383 mΩ·cm of the magnet without glass fibers, the resistivities of the magnets are increased by approximately 39%, 513%, and 1780%. It is more than 25 times the resistivity of the magnet with 10 wt.%, in contrast to the nano-silica layer coating magnets [14].
4. Discussion
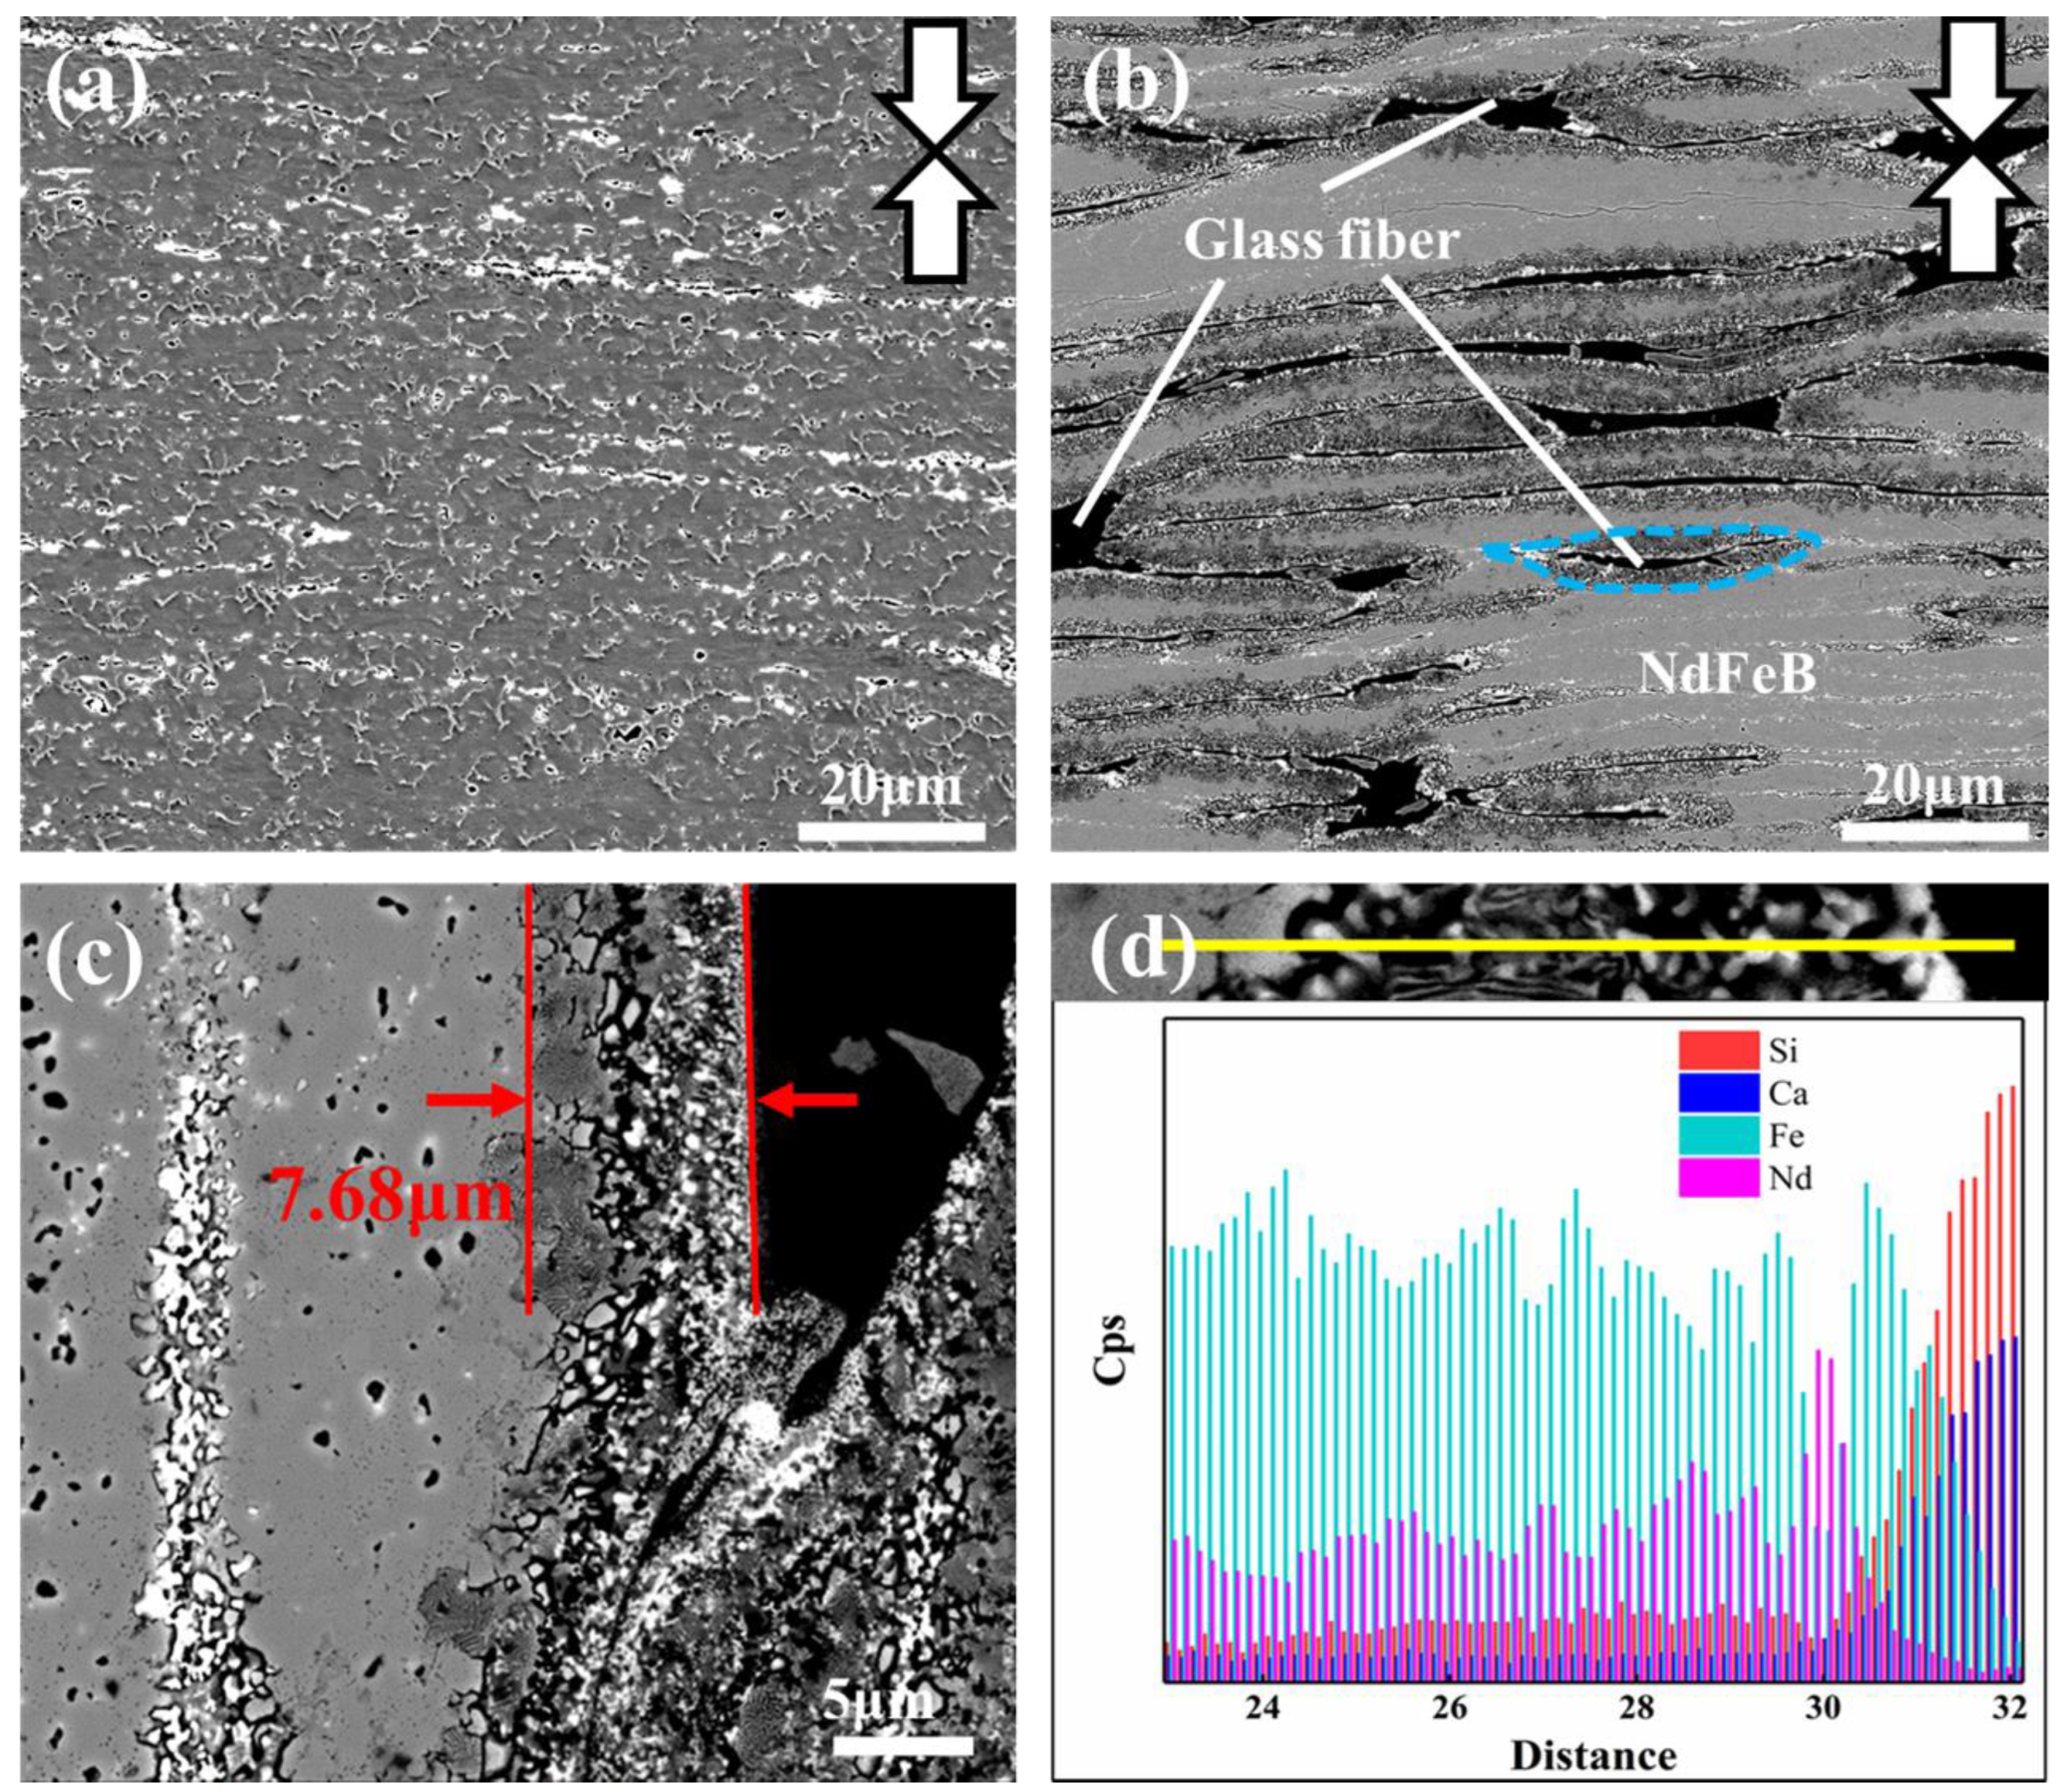
Figure 6a shows the microstructure of the magnet without glass fiber. The gray part in the image is the main Nd-Fe-B phase, and the highlight is the rare-earth rich phase between Nd-Fe-B layers. Nd-Fe-B particles change into sheets due to endure along the direction of pressure (arrow in Figure 6a). Figure 6b shows the microstructure of the magnet with 10wt% glass fiber added. The black part is the glass fiber, and the gray part is the Nd-Fe-B main phase. The dark area between the glass fiber and the Nd-Fe-B sheet is the transition layer (dashed blue area in the image).
EDS line scanning was carried out for the distribution of interface elements between magnetic powder and glass fiber, and the results are drawn in Figure 6c,d. The Fe element kept a high element concentration in the Nd-Fe-B phase, and the concentration decreases step-by-step as the distance approaches the magnetic powder interface. The variation tendency of Nd element concentration is consistent with that of the Fe element. Nevertheless, the mutation occurs in eutectoid tissue, where the Nd element concentration is more than that of Fe element at this mutation position. The Si element, on the contrary, whose concentration emerges gradually, decreases from glass fiber to the Nd-Fe-B phase until the Nd element is in the position of the mutation. The Ca element concentration is almost the same as Si element concentration, with only a small change, simultaneously, and simultaneously disappeared until the Nd element reached the position of the mutation.
According to energy spectrum analysis, the Si element is present in all interface reaction regions, indicating that the Si element is capable of a wide range of diffusion phenomena. Xu et al. [18] investigated the corrosion of Ni-based alloys with various elements added by molten glass and discovered that the metal elements in the alloy could reduce the Si element from glass. Its reduction reaction is:
The Fe element is enriched at the forefront of the interfacial reaction, indicating that it was the first to participate in the reaction process. In their studies on the interface reaction between Kovar alloy/Invar alloy and glass, Luo et al. [19] and Khachatryan et al. [20] discovered that FeO, Fe3O4, and Fe2O3 can be formed sequentially as the O concentration changes. These products can react with the glass indefinitely, eventually forming the Fe2SiO4 phase. As a result, Fe oxidation occurs because:
Finally, the interface reaction process at the forefront of the interface between magnetic particle and glass fiber should begin with the contact of the surface of the magnetic particle and glass fiber, and the elements on both sides should begin to diffuse. Because the Fe element is the first to participate in the reaction, FeO, Fe3O4, and Fe2O3 are produced sequentially. Furthermore, the CaFe(Si2O6) phase is formed in the glass fiber by combining with the CaO, and the reduced Si element diffuses into the magnetic particles. The precise equation is:
It should be pointed out that in this reaction, the O element will be released, so the O element will also diffuse into the interior of the magnetic particle.
As previously stated, the O element was released during the reaction process. Because of the higher activity of RE elements, the Nd element began to combine with the O element at this point to form the Nd2O3 RE-rich phase. This reaction consumes the released O element, and the Fe element that has diffused with it must be diffused further into the glass fiber to keep the reaction going. This explains why there is a mutation in the concentration of Nd elements in this region. The precise equation is:
Nd + O → Nd2O3
In the preparation process of the thermal deformation magnet, the glass fiber was added to the magnetic particle interface reaction, forming a variety of reaction products, and through analysis of the three sections, there was no doubt that the interface reaction between the magnetic particle and the glass fiber was controlled by the diffusion process. At the forefront of the interface, the Fe element substituted the Si element in the glass fiber, forming a series of oxides, for instance, that eventually reacted with each other and formed the CaFe(Si2O6) phase. Analysis of the energy spectrum near the interface indicates that the concentration of the Nd element increases abnormally before the Fe-rich zone, and the Nd element can hardly diffuse through the CaFe(Si2O6) phase, just like a wall blocking the diffusion direction of the RE element. Similarly, the Ca element does not spread beyond the Fe-rich zone into the interior of the magnetic powder. It is inferred that the glass fiber that was added has an important role to form a “Fe-rich wall”, which can effectively block the “leakage” of RE elements from the main-phase grains. This phenomenon can be applied in the process of the diffusion of heavy RE elements in the magnet, or to regulate the diffusion of heavy RE elements into the magnet.
In the above process, CaO and SiO2 decomposed from glass fiber will be pushed into the narrow grain boundary with the softening flow of glass fiber, more fully isolating the ferromagnetic coupling between the main grains, and oxides have a good insulation effect, so the diffusion reaction between the glass fiber and magnetic powder can lead to an increase in resistivity.
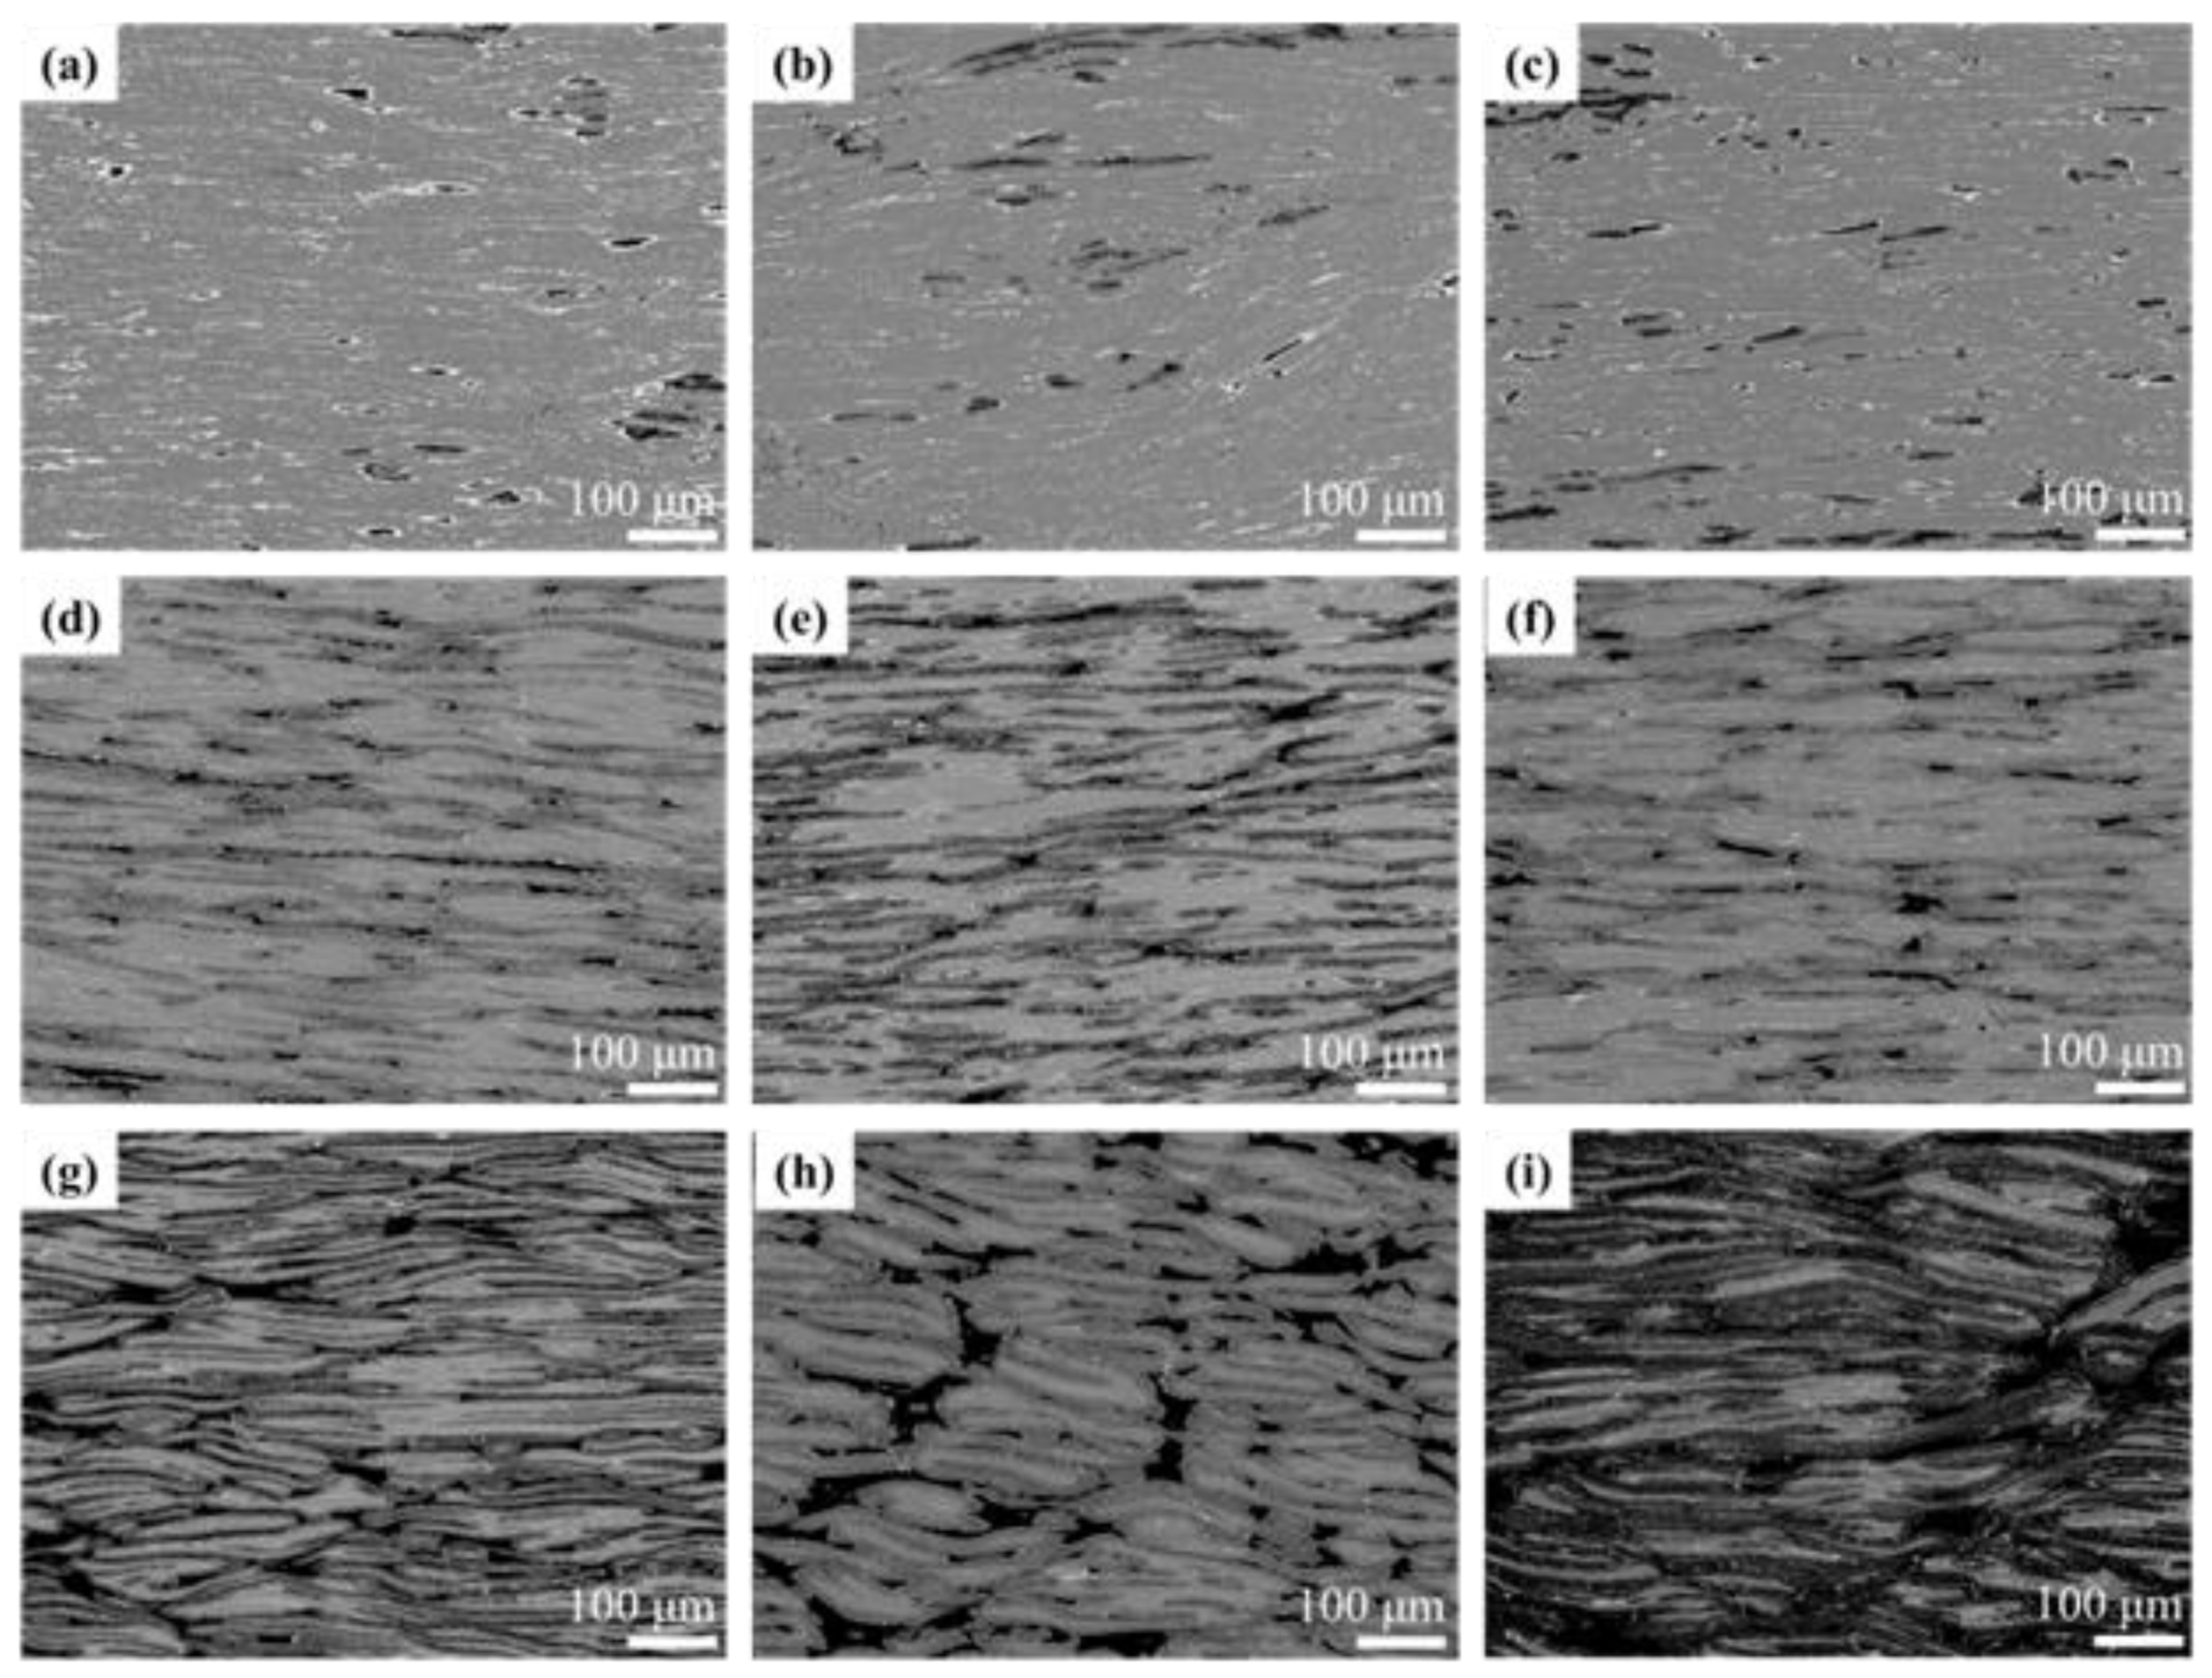
The structure of the above experimental magnets is shown in Figure 3. The black area is glass fiber, the bright white area is the rare-earth rich phase precipitated during the preparation of the magnets, and the gray part is the Nd-Fe-B phase. With the increase in glass fiber addition, the distribution of black glass fiber gradually changed from sporadic distribution to continuous distribution. According to the design of the orthogonal experiment, Figure 7a–c show the morphology of glass fiber with 2 wt.% addition. Due to the small amount of addition, glass fiber is less distributed among Nd-Fe-B grain lamellas and scattered in the matrix structure. Figure 7d–f show the morphology of the glass fiber with the additional amount of 5 wt.%. It can be seen that with the increase in the addition, the distribution of the glass fiber between Nd-Fe-B laminates increases, and, thus, the resistivity of the magnet increases. However, it can be seen that due to the insufficient addition, there is still a large area uncoated between the Nd-Fe-B lamellae. When the addition amount reaches 10 wt.%, as shown in Figure 7g–i, the glass fiber has formed a relatively complete coating layer, and so the resistivity of this group of samples is, relatively, the highest.
By comparing different deformation temperatures, Figure 7a,f,h is 850 °C. Due to the low temperature, the magnetic particle deformation degree is small, the glass fiber deformation degree is also insufficient, and the glass fiber aggregates in the magnet. With the increase in deformation temperature, that is, Figure 7b,d,i are the morphologies at 870 °C, and Figure 7c,e,g are the morphologies at 890 °C. The analysis shows that the deformation of the grain increases gradually, while the aggregation of the glass fiber decreases, indicating that the glass fiber is also deformed in the process of thermal deformation and is squeezed into the grains to form the coating layer. Compared with 9 groups of experimental samples, sample no. 7 (Figure 7g) has the best coating effect, a large deformation degree, uniform distribution of tissue, and, therefore, the highest resistivity.
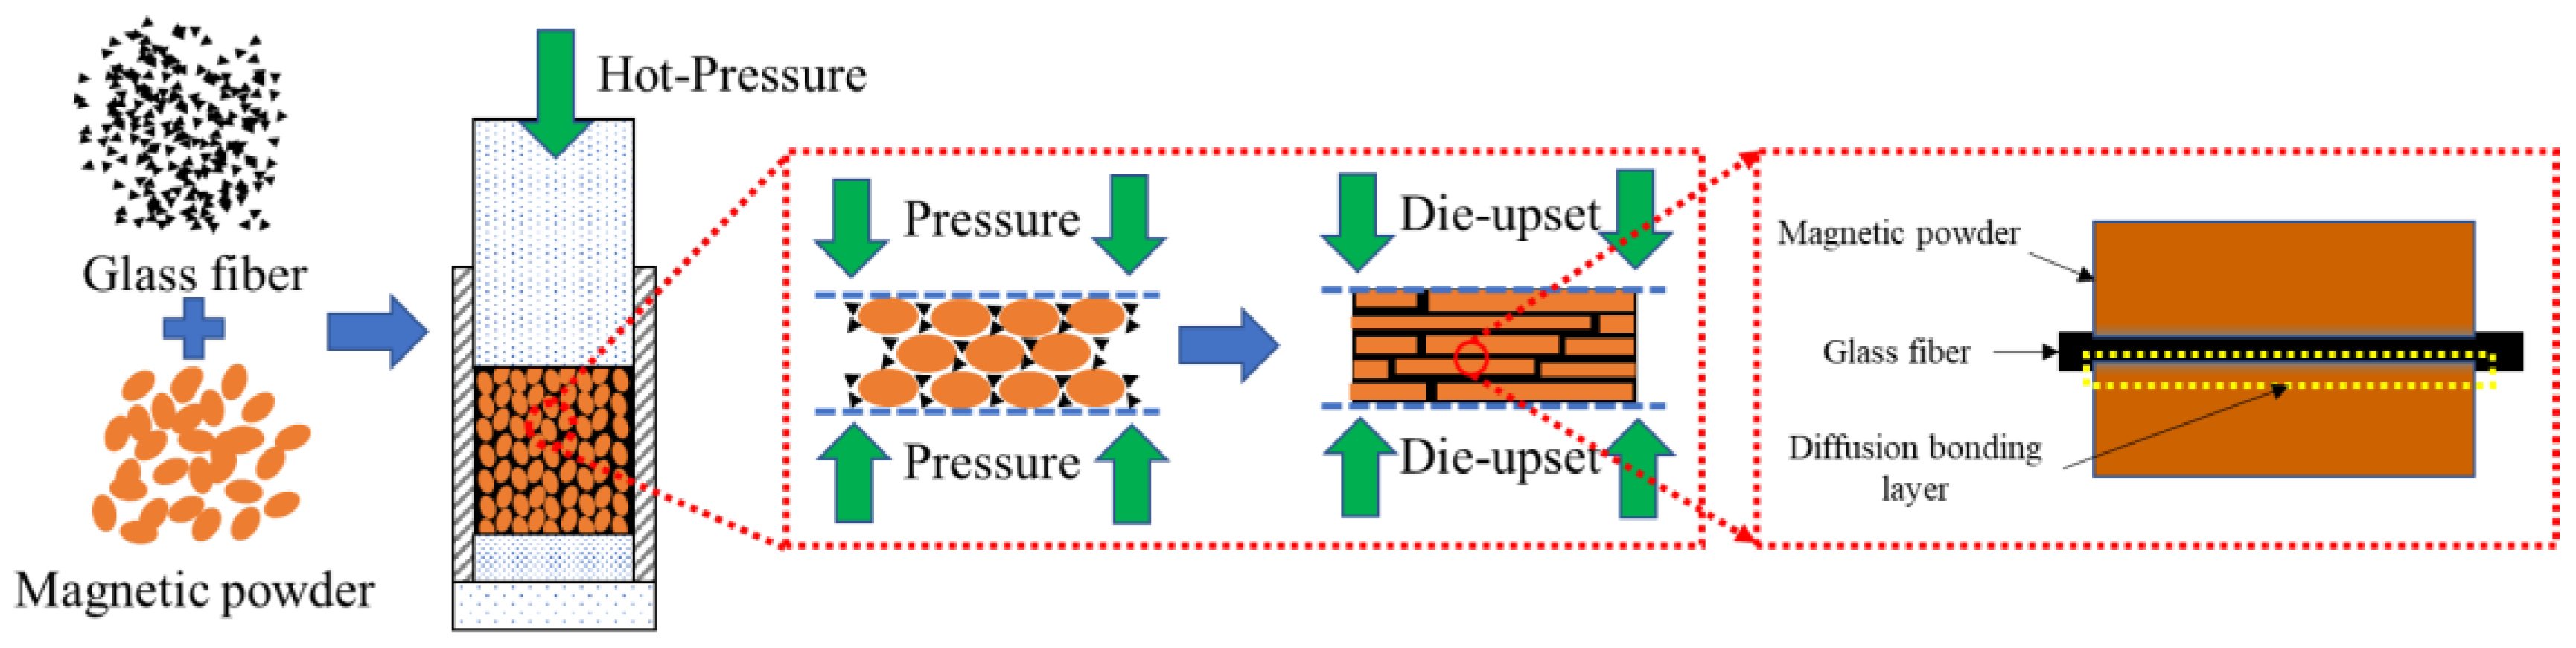
Figure 8 shows the schematic of the preparation process of the magnets with glass fiber. Based on the microstructure, glass fibers are fully embedded around the magnetic particles and maintain the original particle shape during the hot-pressed process. After being hot-deformed, the magnetic flakes change into thin sheets and distribute in parallel to the direction of pressure. The glass fiber particles aggregate with each other and form a thin sheet distributed among the magnetic sheets, effectively separating the magnetic flakes. Moreover, there is a transitional layer at the contact surface between the glass fiber and the magnetic sheets, indicating that there is a mutual diffusion of elements between the two, forming a new phase. Therefore, the magnetic flakes and the glass fiber can be firmly bonded together, thus effectively avoiding the isolation failure caused by peeling, which is beneficial for improving resistivity.
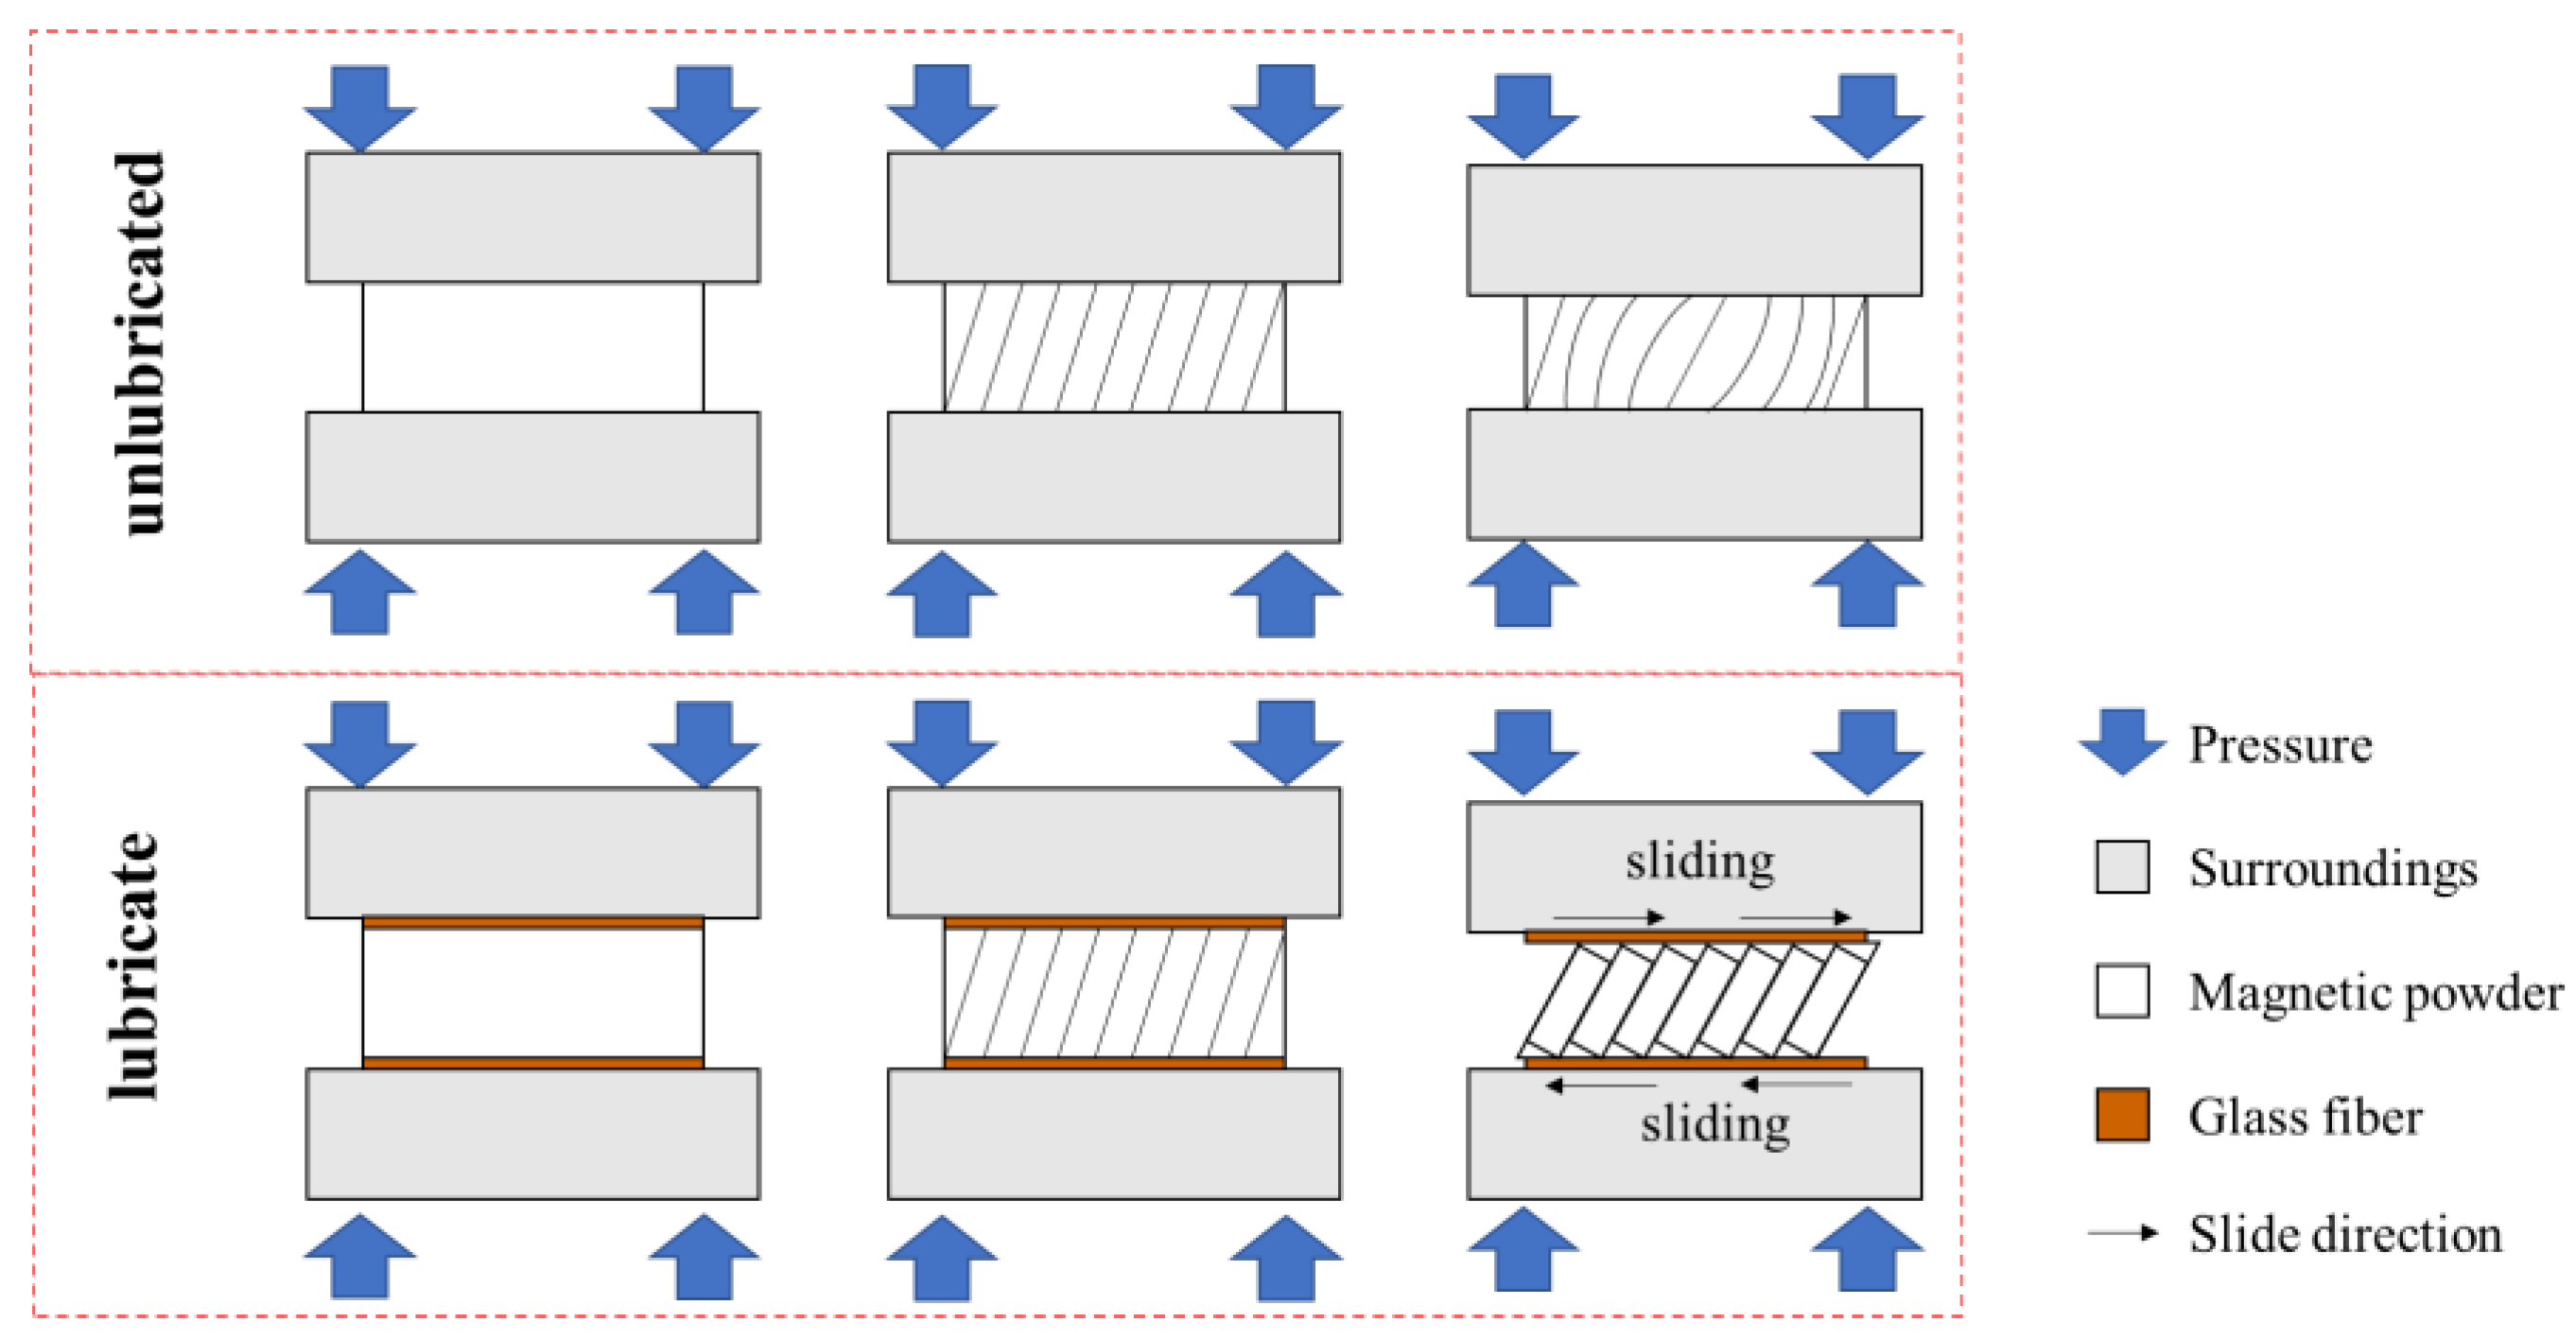
With increasing additions of the glass fiber, the intensity of the main-phase peaks decreases; nevertheless, the intensity of the main-phase peak (006) is abnormal in Figure 4h. There is no doubt that the orientation degree (I(006)/I(105)) increased dramatically, which means that the orientation of the magnet is improved. This is due to the glass fiber collaborative deformation with Nd-Fe-B powders during the hot deformation process. According to Zhu’s theory [21], the grains of magnetic powders slide and rotate in the thermorheological process. Softened glass fiber acts as a lubricant in the gaps of the Nd-Fe-B powders, and the grains of the Nd-Fe-B powders are more likely to slide and rotate under the action of external force, as shown in Figure 9.
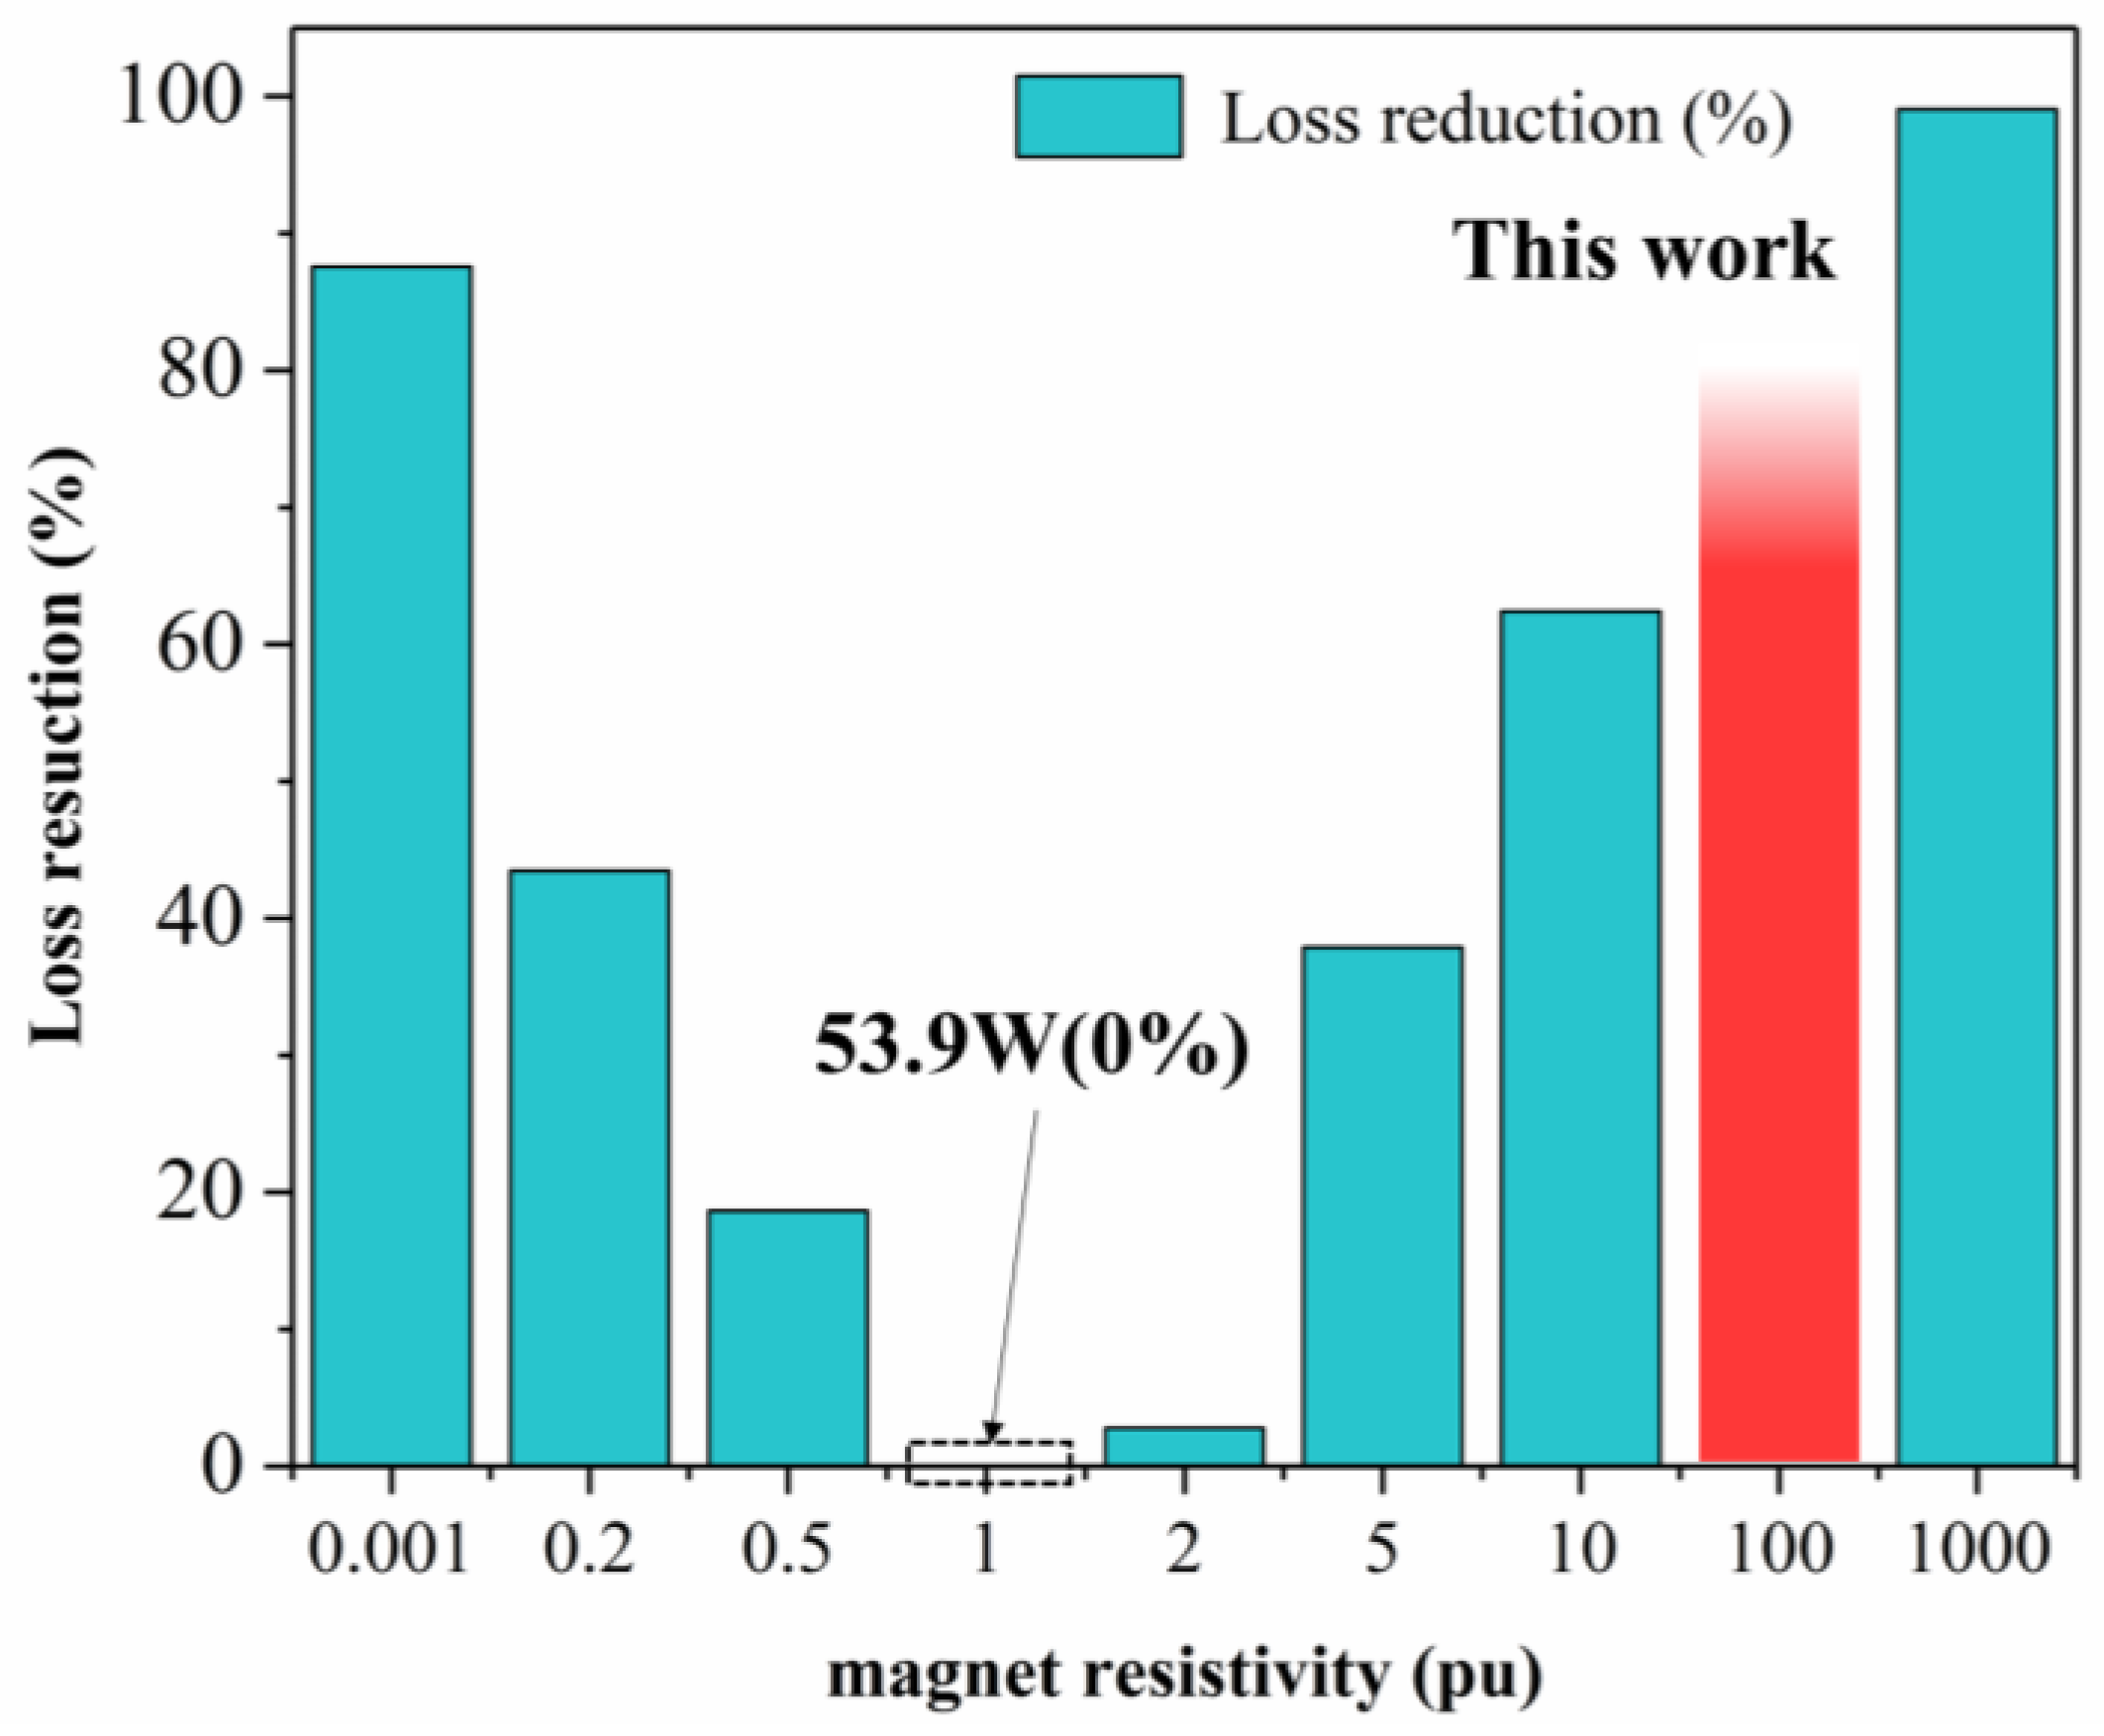
In contrast to other insulating materials, adding amorphous glass fiber to the magnet greatly improves the resistivity. Shen [22] calculated and simulated the relationship between eddy current loss and the resistivity of magnets by FEA models. As shown in Figure 10, the relationship between the resistivity of a magnet and the reduction of the eddy current losses in magnets was shown. It should be pointed out that pu (per unit) is the resistivity of sintered Sm2Co17 magnets (8.503 × 10⁻² mΩ·cm). The resistivity of the magnet prepared in this work is 85 times that of the one in Figure 10. This means that eddy current losses are reduced by at least two thirds, relative to the magnets that have not been treated with high resistivity. Therefore, the addition of the amorphous glass fiber magnet can reduce eddy current loss very effectively.
5. Conclusions
We have shown that the highest resistivity of the obtained magnet was 7.2 mΩ·cm, which is almost 18 times as high as that of the magnet without additions and 25 times higher than that of the nano-silica layer coating Nd-Fe-B magnets. Thus, the eddy current loss of the magnets can be effectively reduced. The continuous coating between the glass fibers and magnet particles is diffusion controlled, which can effectively prevent the incomplete coating phenomenon caused by the peeling of the coating during thermal deformation. At the same time, the analysis results show that the addition of glass fibers can improve the deformation ability of the magnet and thus improve the orientation of the magnet. This work proves that adding amorphous glass fiber is an effective means for improving the resistivity of magnets. The novel design concept of insulation materials provides new insight into the development and application of rare earth permanent magnet materials. Furthermore, the search for additives that can substantially improve the resistivity with an enhanced magnetic energy product should be considered in future work.
Author Contributions
Y.G.: Carrying out measurements and manuscript composition, Writing—Original draft preparation, Writing—Reviewing, and Editing. M.Z.: Conception, Experimental design, Methodology, Investigation, Validation, Project administration, Funding acquisition. Z.W.: Carrying out measurements and manuscript composition, Data curation. Q.S.: Carrying out measurements and manuscript composition, Writing—Reviewing, and Editing. Y.W. and Z.L.: Carrying out measurements and manuscript composition, Formal analysis. All authors have read and agreed to the published version of the manuscript.
Funding
The work was supported by the National Key Research and Development Program of China (Grant No. 2022YFB3505600; 2022YFB3503300; 2022YFB3505200), the National Natural Science Foundation of China (Grant No. 51871063), and Major Projects in Inner Mongolia Autonomous Region (Grant No. 2021ZD0035).
Data Availability Statement
Data sharing not applicable. No new data were created or analyzed in this study. Data sharing is not applicable to this article.
Conflicts of Interest
The authors declare that they have no known competing financial interests or personal relationships that could have appeared to influence the work reported in this paper.
References
- Coey, J.M.D. Perspective and Prospects for Rare Earth Permanent Magnets. Engineering 2020, 6, 119–131. [Google Scholar] [CrossRef]
- Skokov, K.P.; Gutfleisch, O. Heavy rare earth free, free rare earth and rare earth free magnets—Vision and reality. Scr. Mater. 2018, 154, 289–294. [Google Scholar] [CrossRef]
- Herbst, J.F. R2Fe14B materials: Intrinsic properties and technological aspects. Rev. Mod. Phys. 1991, 63, 819–898. [Google Scholar] [CrossRef]
- Sugimoto, S. Current status and recent topics of rare-earth permanent magnets. J. Phys. D Appl. Phys. 2011, 44, 064001. Available online: https://iopscience.iop.org/article/10.1088/0022-3727/44/6/064001 (accessed on 10 March 2023). [CrossRef]
- Xia, W.; He, Y.; Huang, H.; Wang, H.; Shi, X.; Zhang, T.; Liu, J.; Stamenov, P.; Chen, L.; Coey, J.M.D.; et al. Initial Irreversible Losses and Enhanced High-Temperature Performance of Rare-Earth Permanent Magnets. Adv. Funct. Mater. 2019, 29, 1900690. [Google Scholar] [CrossRef]
- Zhu, M.; Li, W.; Wang, J.; Zheng, L.; Li, Y.; Zhang, K.; Feng, H.; Liu, T. Influence of Ce Content on the Rectangularity of Demagnetization Curves and Magnetic Properties of Re-Fe-B Magnets Sintered by Double Main Phase Alloy Method. IEEE Trans. Magn. 2014, 50, 1–4. [Google Scholar] [CrossRef]
- Zhang, L.; Zhu, M.; Guo, Y.; Song, L.; Li, W. Grains orientation and restructure mechanism of Ce-contained magnets processed by reduction diffusion. J. Alloys Compd. 2022, 891, 161921. [Google Scholar] [CrossRef]
- Zhu, M.; Li, Y.; Li, W.; Zheng, L.; Zhou, D.; Feng, H.; Chen, L.; Du, A. Relation between microstructure and magnetic properties of shock wave-compressed Nd–Fe–B magnets. Rare Met. 2022, 41, 2353–2356. [Google Scholar] [CrossRef]
- Haavisto, M.; Tuominen, S.; Santa-nokki, T.; Kankaanpää, H.; Paju, M.; Ruuskanen, P. Magnetic Behavior of Sintered NdFeB Magnets on a Long-Term Timescale. Adv. Mater. Sci. Eng. 2014, 7, 760584. [Google Scholar] [CrossRef]
- Prakht, V.; Dmitrievskii, V. Optimal Design of a High-Speed Flux Reversal Motor with Bonded Rare-Earth Permanent Magnets. Mathematics 2021, 9, 256. [Google Scholar] [CrossRef]
- Ding, H.; Gong, X.; Gong, Y. Estimation of Rotor Temperature of Permanent Magnet Synchronous Motor Based on Model Reference Fuzzy Adaptive Control. Math. Probl. Eng. 2020, 16, 4183706. [Google Scholar] [CrossRef]
- Aoyama, Y.; Miyata, K.; Ohashi, K. Simulations and experiments on eddy current in Nd-Fe-B magnet. IEEE Trans. Magn. 2005, 41, 3790–3792. [Google Scholar] [CrossRef]
- Gabay, A.M.; Marinescu-Jasinski, M.; Liu, J.; Hadjipanayis, G.C. Internally segmented Nd-Fe-B/CaF2 sintered magnets. IEEE Trans. Magn. 2013, 49, 558–561. [Google Scholar] [CrossRef]
- Zheng, L.; Li, W.; Zhu, M.; Ye, L.; Bi, W. Microstructure, magnetic and electrical properties of the composite magnets of Nd-Fe-B powders coated with silica layer. J. Alloys Compd. 2013, 560, 80–83. [Google Scholar] [CrossRef]
- Marinescu, M.; Gabay, A.M.; Liu, J.F.; Hadjipanayis, G.C. Fluoride-added Pr-Fe-B die-upset magnets with increased electrical resistivity. J. Appl. Phys. 2009, 105, 07A711. [Google Scholar] [CrossRef]
- Komuro, M.; Satsu, Y.; Enomoto, Y.; Koharagi, H. High electrical resistance hot-pressed NdFeB magnet for low loss motors. Appl. Phys. Lett. 2007, 91, 102503. [Google Scholar] [CrossRef]
- McLachlan, D.S.; Blaszkiewicz, M.; Newnham, R.E. Electrical Resistivity of Composites. J. Am. Ceram. Soc. 1990, 73, 2187–2203. [Google Scholar] [CrossRef]
- Xu, Y.; Yan, J.; Sun, F.; Gu, Y. Effect of alloyed Al on the corrosion behaviour of Ni-base alloys in molten glass under static condition. Corros. Sci. 2016, 112, 635–646. [Google Scholar] [CrossRef]
- Khachatryan, H.; Baek, S.-H.; Lee, S.-N.; Kim, H.K.; Kim, M.; Kim, K.B. Metal to glass sealing using glass powder: Iron induced crystallization of glass. Mater. Chem. Phys. 2019, 226, 331–337. [Google Scholar] [CrossRef]
- Yang, W.; Zha, L.; Lai, Y.; Qiao, G.; Du, H.; Liu, S.; Wang, C.; Han, J.; Yang, Y.; Hou, Y.; et al. Structural and magnetic properties of the R10Fe90-xSix alloys with R=Y, Ce, Pr, Nd, Sm, Gd, Tb, Dy, Ho, and Er. Intermetallics 2018, 99, 8–17. [Google Scholar] [CrossRef]
- Zhu, M.; Li, W. Texture formation mechanism and constitutive equation for anisotropic thermorheological rare-earth permanent magnets. AIP Adv. 2017, 7, 056236. [Google Scholar] [CrossRef]
- Shen, J.; Han, T.; Yao, L.; Wang, Y. Is Higher Resistivity of Magnet Beneficial to Reduce Rotor Eddy Current Loss in High-Speed Permanent Magnets AC Machines? Trans. CHINA Electrotech. Soc. 2020, 35, 2074–2078. [Google Scholar] [CrossRef]
Disclaimer/Publisher’s Note: The statements, opinions, and data contained in all publications are solely those of the individual author(s) and contributor(s) and not of MDPI and/or the editor(s). MDPI and/or the editor(s) disclaim responsibility for any injury to people or property resulting from any ideas, methods, instructions, or products referred to in the content. |
Figure 1.
BSE-SEM images obtained from magnet with 10 wt.% addition (a) hot-pressed temperature at 550 °C, (b) hot-deformed temperature at 850 °C, and (c) partial enlargement of (b), yellow arrows and circles indicate different C-axis orientations of the magnet.
Figure 1.
BSE-SEM images obtained from magnet with 10 wt.% addition (a) hot-pressed temperature at 550 °C, (b) hot-deformed temperature at 850 °C, and (c) partial enlargement of (b), yellow arrows and circles indicate different C-axis orientations of the magnet.

Figure 2.
The same magnification BSE-SEM images obtained from (a,b) hot-deformed magnet with 2wt.% glass fiber, (c,d) with 5wt.% glass fiber, (e,f) with 10wt.% glass fiber. Furthermore, the direction of images (a,c,e) are parallel to the pressure, and (b,d,f) are perpendicular to the pressure, yellow arrows and circles indicate different C-axis orientations of the magnet.

Figure 3.
EDS mapping in a different direction of hot-deformed magnet with 10%wt glass fiber. (a1–a5) parallel to the pressure direction and (b1–b5) are perpendicular to the pressure direction.
Figure 3.
EDS mapping in a different direction of hot-deformed magnet with 10%wt glass fiber. (a1–a5) parallel to the pressure direction and (b1–b5) are perpendicular to the pressure direction.

Figure 4.
XRD patterns of the hot-deformed magnet with different glass fiber additions: (a) 2 wt.% (indexed as L1), (b) 5 wt.% (indexed as L2), and (c) 10 wt.% (indexed as L3). (a–h) are different main peak areas of XRD, and the height of the peaks was scaled to the same height.
Figure 4.
XRD patterns of the hot-deformed magnet with different glass fiber additions: (a) 2 wt.% (indexed as L1), (b) 5 wt.% (indexed as L2), and (c) 10 wt.% (indexed as L3). (a–h) are different main peak areas of XRD, and the height of the peaks was scaled to the same height.

Figure 5.
Electrical resistivity and magnetic energy products of the hot-deformed ones in confirmatory experiment samples with different additions.
Figure 5.
Electrical resistivity and magnetic energy products of the hot-deformed ones in confirmatory experiment samples with different additions.

Figure 6.
SEM image of hot-deformed magnets, (a) without glass fiber, (b) with 5wt% glass fiber; (c) partial enlarged drawing of (b,d) EDS line scanning near the transition layer.
Figure 6.
SEM image of hot-deformed magnets, (a) without glass fiber, (b) with 5wt% glass fiber; (c) partial enlarged drawing of (b,d) EDS line scanning near the transition layer.

Figure 7.
Sample morphology of orthogonal experiment, (a–i) experiments 1–9, respectively.

Figure 8.
Schematic of the preparation process of the magnets with glass fiber.

Figure 9.
Diagram of the deformation with and without lubrication.

Figure 10.
Magnet resistivity vs. reduction of eddy losses in magnets, where pu (per unit) is the resistivity of sintered Sm2Co17 magnets (8.503 × 10⁻² mΩ·cm), and take the loss of one-time unit as 100%. Data from [22].
Figure 10.
Magnet resistivity vs. reduction of eddy losses in magnets, where pu (per unit) is the resistivity of sintered Sm2Co17 magnets (8.503 × 10⁻² mΩ·cm), and take the loss of one-time unit as 100%. Data from [22].


Table 1.
Resistivity of hot-pressed permanent magnets with different mass fractions of glass fiber-doped.
Table 1.
Resistivity of hot-pressed permanent magnets with different mass fractions of glass fiber-doped.
| Mass Fraction m (wt.%) | Hot-Pressed Temperature T1 (°C) | Hot-Deformed Temperature T2 (°C) | Xi (mΩ·cm) | ||
|---|---|---|---|---|---|
| 1 | 2 | 3 | |||
| A1(2) | B1(550) | C1(850) | 0.99 | 0.97 | 0.97 |
| A1(2) | B2(575) | C2(870) | 1.05 | 1.08 | 1.03 |
| A1(2) | B3(600) | C3(890) | 1.18 | 1.05 | 1.02 |
| A2(5) | B1(550) | C2(870) | 0.86 | 0.86 | 0.86 |
| A2(5) | B2(575) | C3(890) | 0.90 | 0.92 | 0.90 |
| A2(5) | B3(600) | C1(850) | 1.00 | 1.02 | 1.18 |
| A3(10) | B1(550) | C3(890) | 1.84 | 2.35 | 3.01 |
| A3(10) | B2(575) | C1(850) | 0.81 | 0.78 | 0.84 |
| A3(10) | B3(600) | C2(870) | 0.88 | 0.90 | 0.92 |
Table 2.
Analysis of Variance.
| Source of Variation | Q | DOF | EOV | F | f | Significance Level (*, **, ***) | The Optimal Level |
|---|---|---|---|---|---|---|---|
| m (wt.%) | 2.12 | 2 | 1.06 | 10.47 | 3.49 | ** | A3 |
| T1 (°C) | 1.21 | 2 | 0.61 | 6.00 | 3.49 | ** | B1 |
| T2 (°C) | 1.15 | 2 | 0.58 | 5.71 | 3.49 | ** | C3 |
| error | 2.02 | 20 | 0.10 | ||||
| total | 6.50 | 26 |
Significance level: * insignificant, ** significant, *** highly significant.
Disclaimer/Publisher’s Note: The statements, opinions and data contained in all publications are solely those of the individual author(s) and contributor(s) and not of MDPI and/or the editor(s). MDPI and/or the editor(s) disclaim responsibility for any injury to people or property resulting from any ideas, methods, instructions or products referred to in the content. |
© 2023 by the authors. Licensee MDPI, Basel, Switzerland. This article is an open access article distributed under the terms and conditions of the Creative Commons Attribution (CC BY) license (https://creativecommons.org/licenses/by/4.0/).
Share and Cite
MDPI and ACS Style
Guo, Y.; Zhu, M.; Wang, Z.; Sun, Q.; Wang, Y.; Li, Z. Design of Glass Fiber-Doped High-Resistivity Hot-Pressed Permanent Magnets for Reducing Eddy Current Loss. Metals 2023, 13, 808. https://doi.org/10.3390/met13040808
AMA Style
Guo Y, Zhu M, Wang Z, Sun Q, Wang Y, Li Z. Design of Glass Fiber-Doped High-Resistivity Hot-Pressed Permanent Magnets for Reducing Eddy Current Loss. Metals. 2023; 13(4):808. https://doi.org/10.3390/met13040808
Chicago/Turabian StyleGuo, Yingjian, Minggang Zhu, Ziliang Wang, Qisong Sun, Yu Wang, and Zhengxiao Li. 2023. "Design of Glass Fiber-Doped High-Resistivity Hot-Pressed Permanent Magnets for Reducing Eddy Current Loss" Metals 13, no. 4: 808. https://doi.org/10.3390/met13040808
Note that from the first issue of 2016, this journal uses article numbers instead of page numbers. See further details here.