
Study of Corrosion Performance and Mechanisms of P91, 304SS and IN625 Alloys in Molten Nitrate Salts Used for Thermal Energy Storage System

Abstract
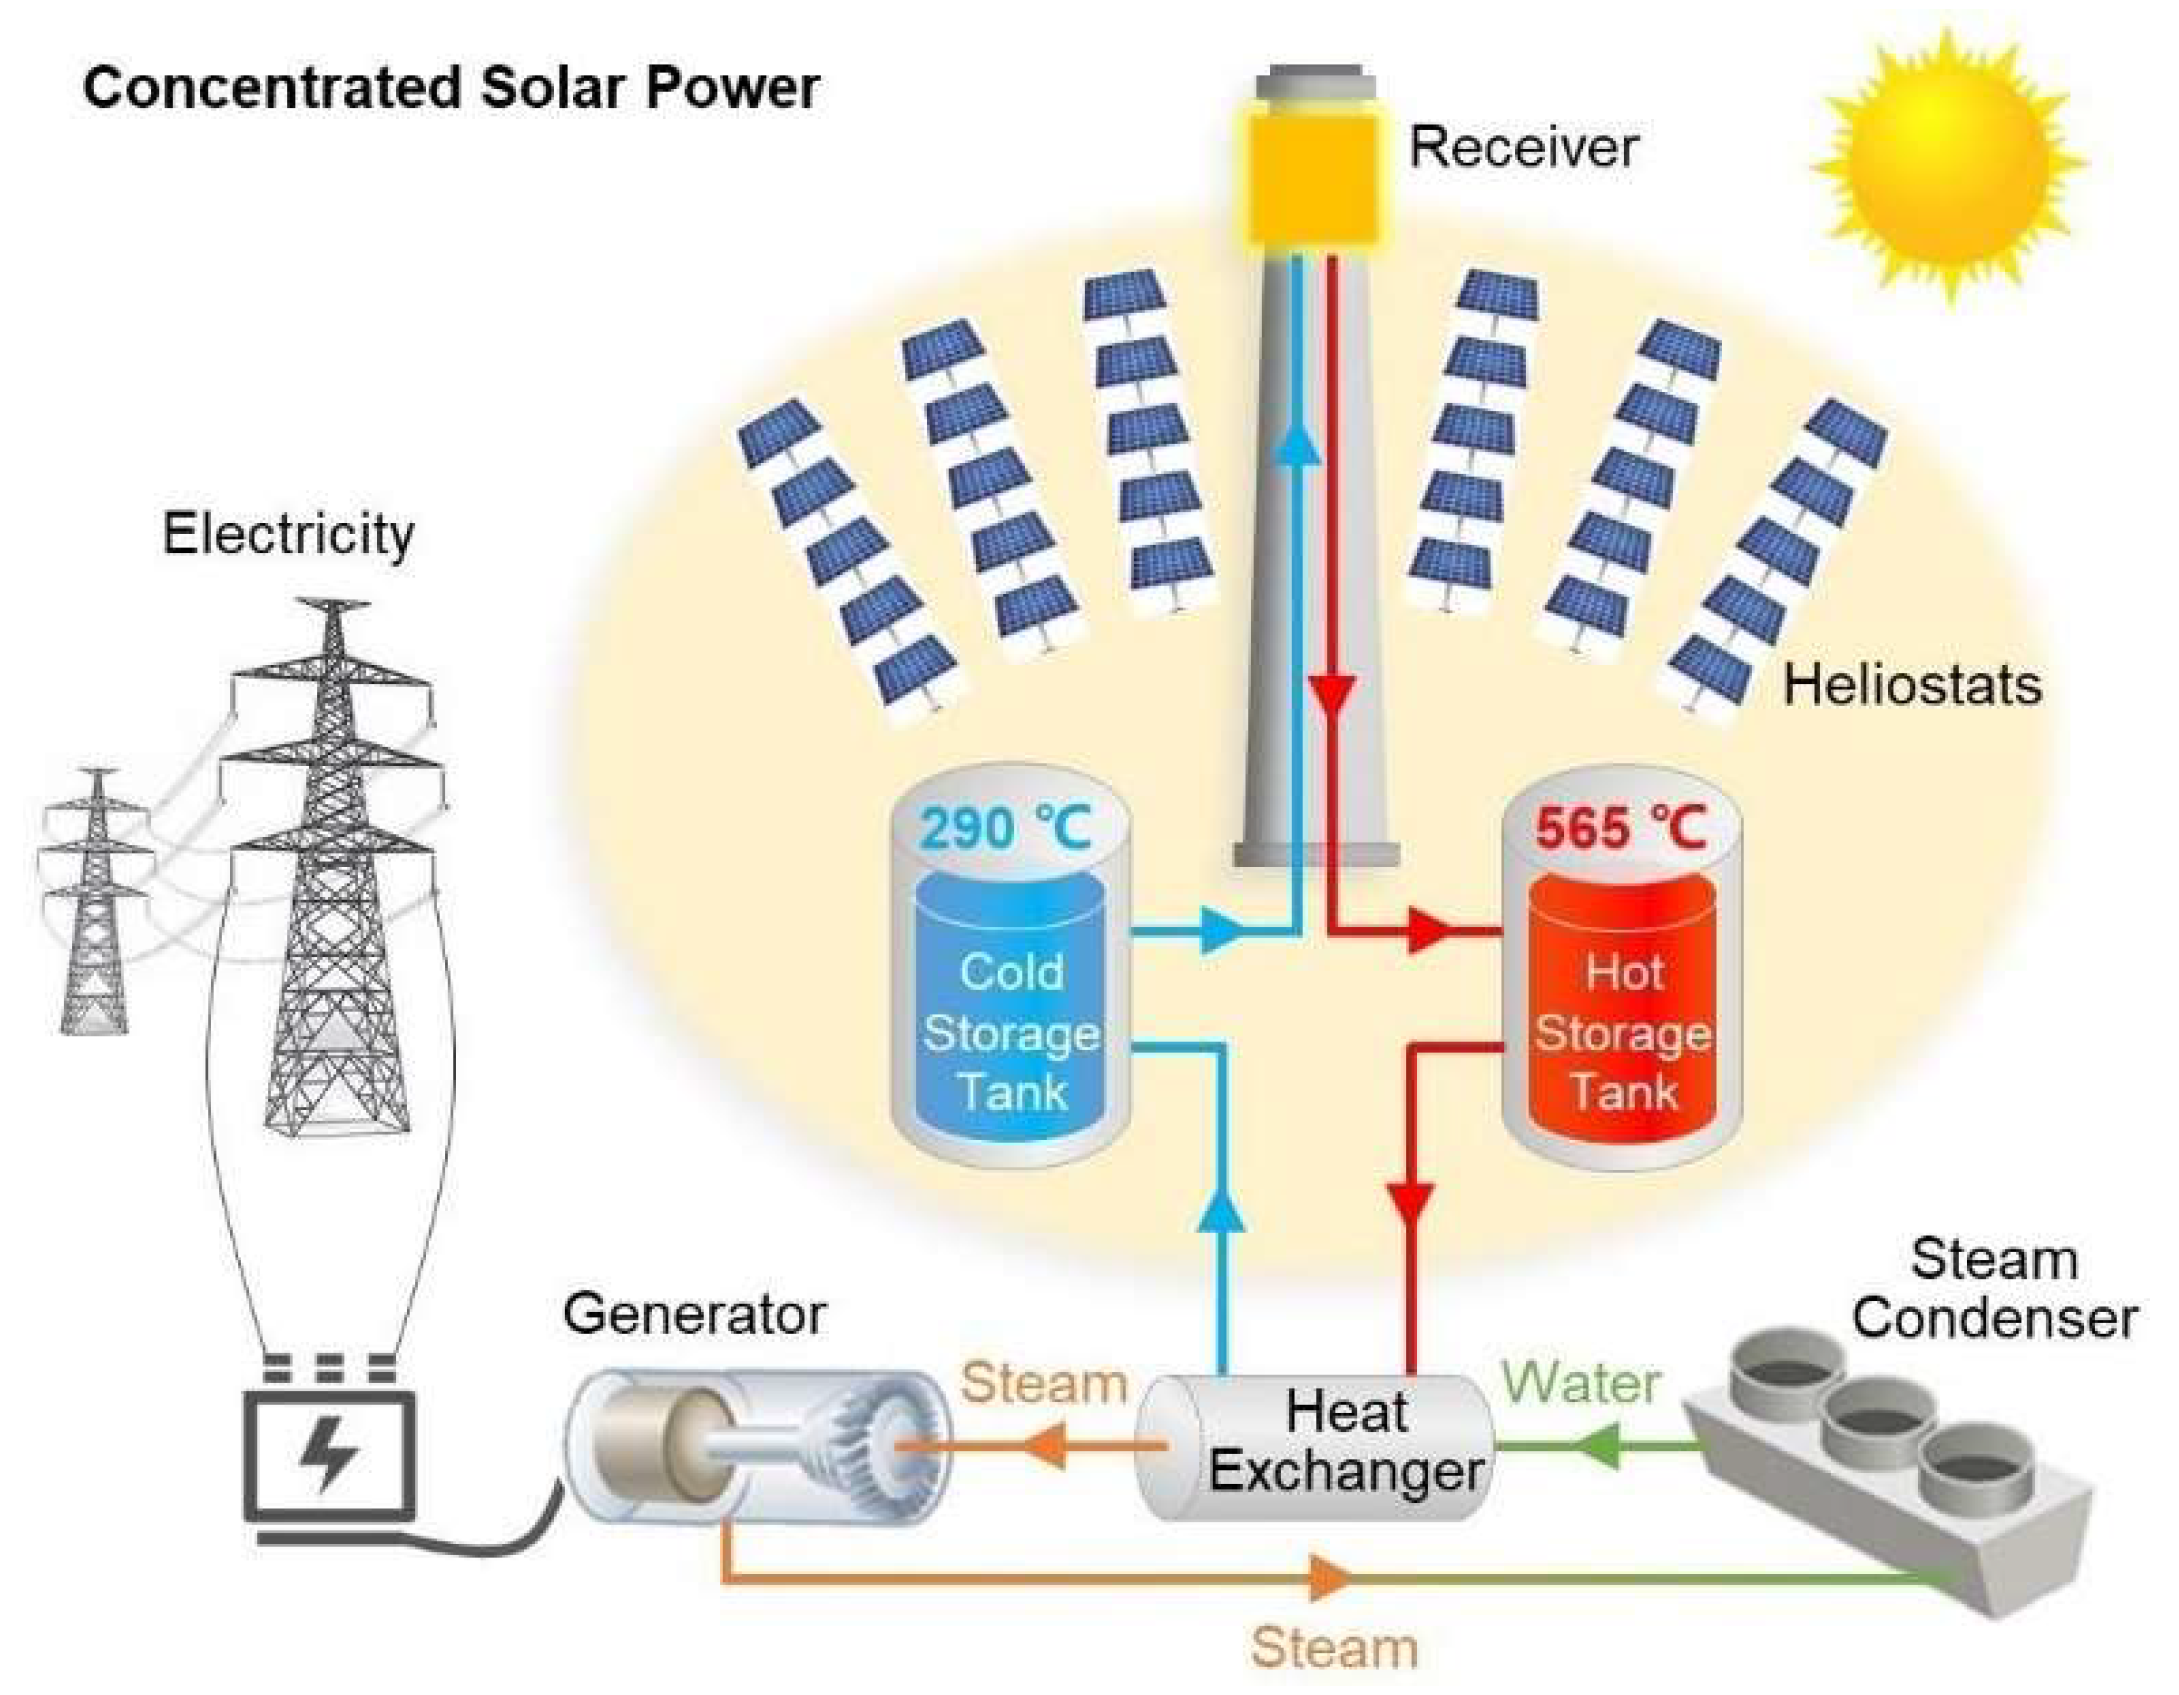
:1. Introduction
2. Materials and Methods
2.1. Preparation of Materials
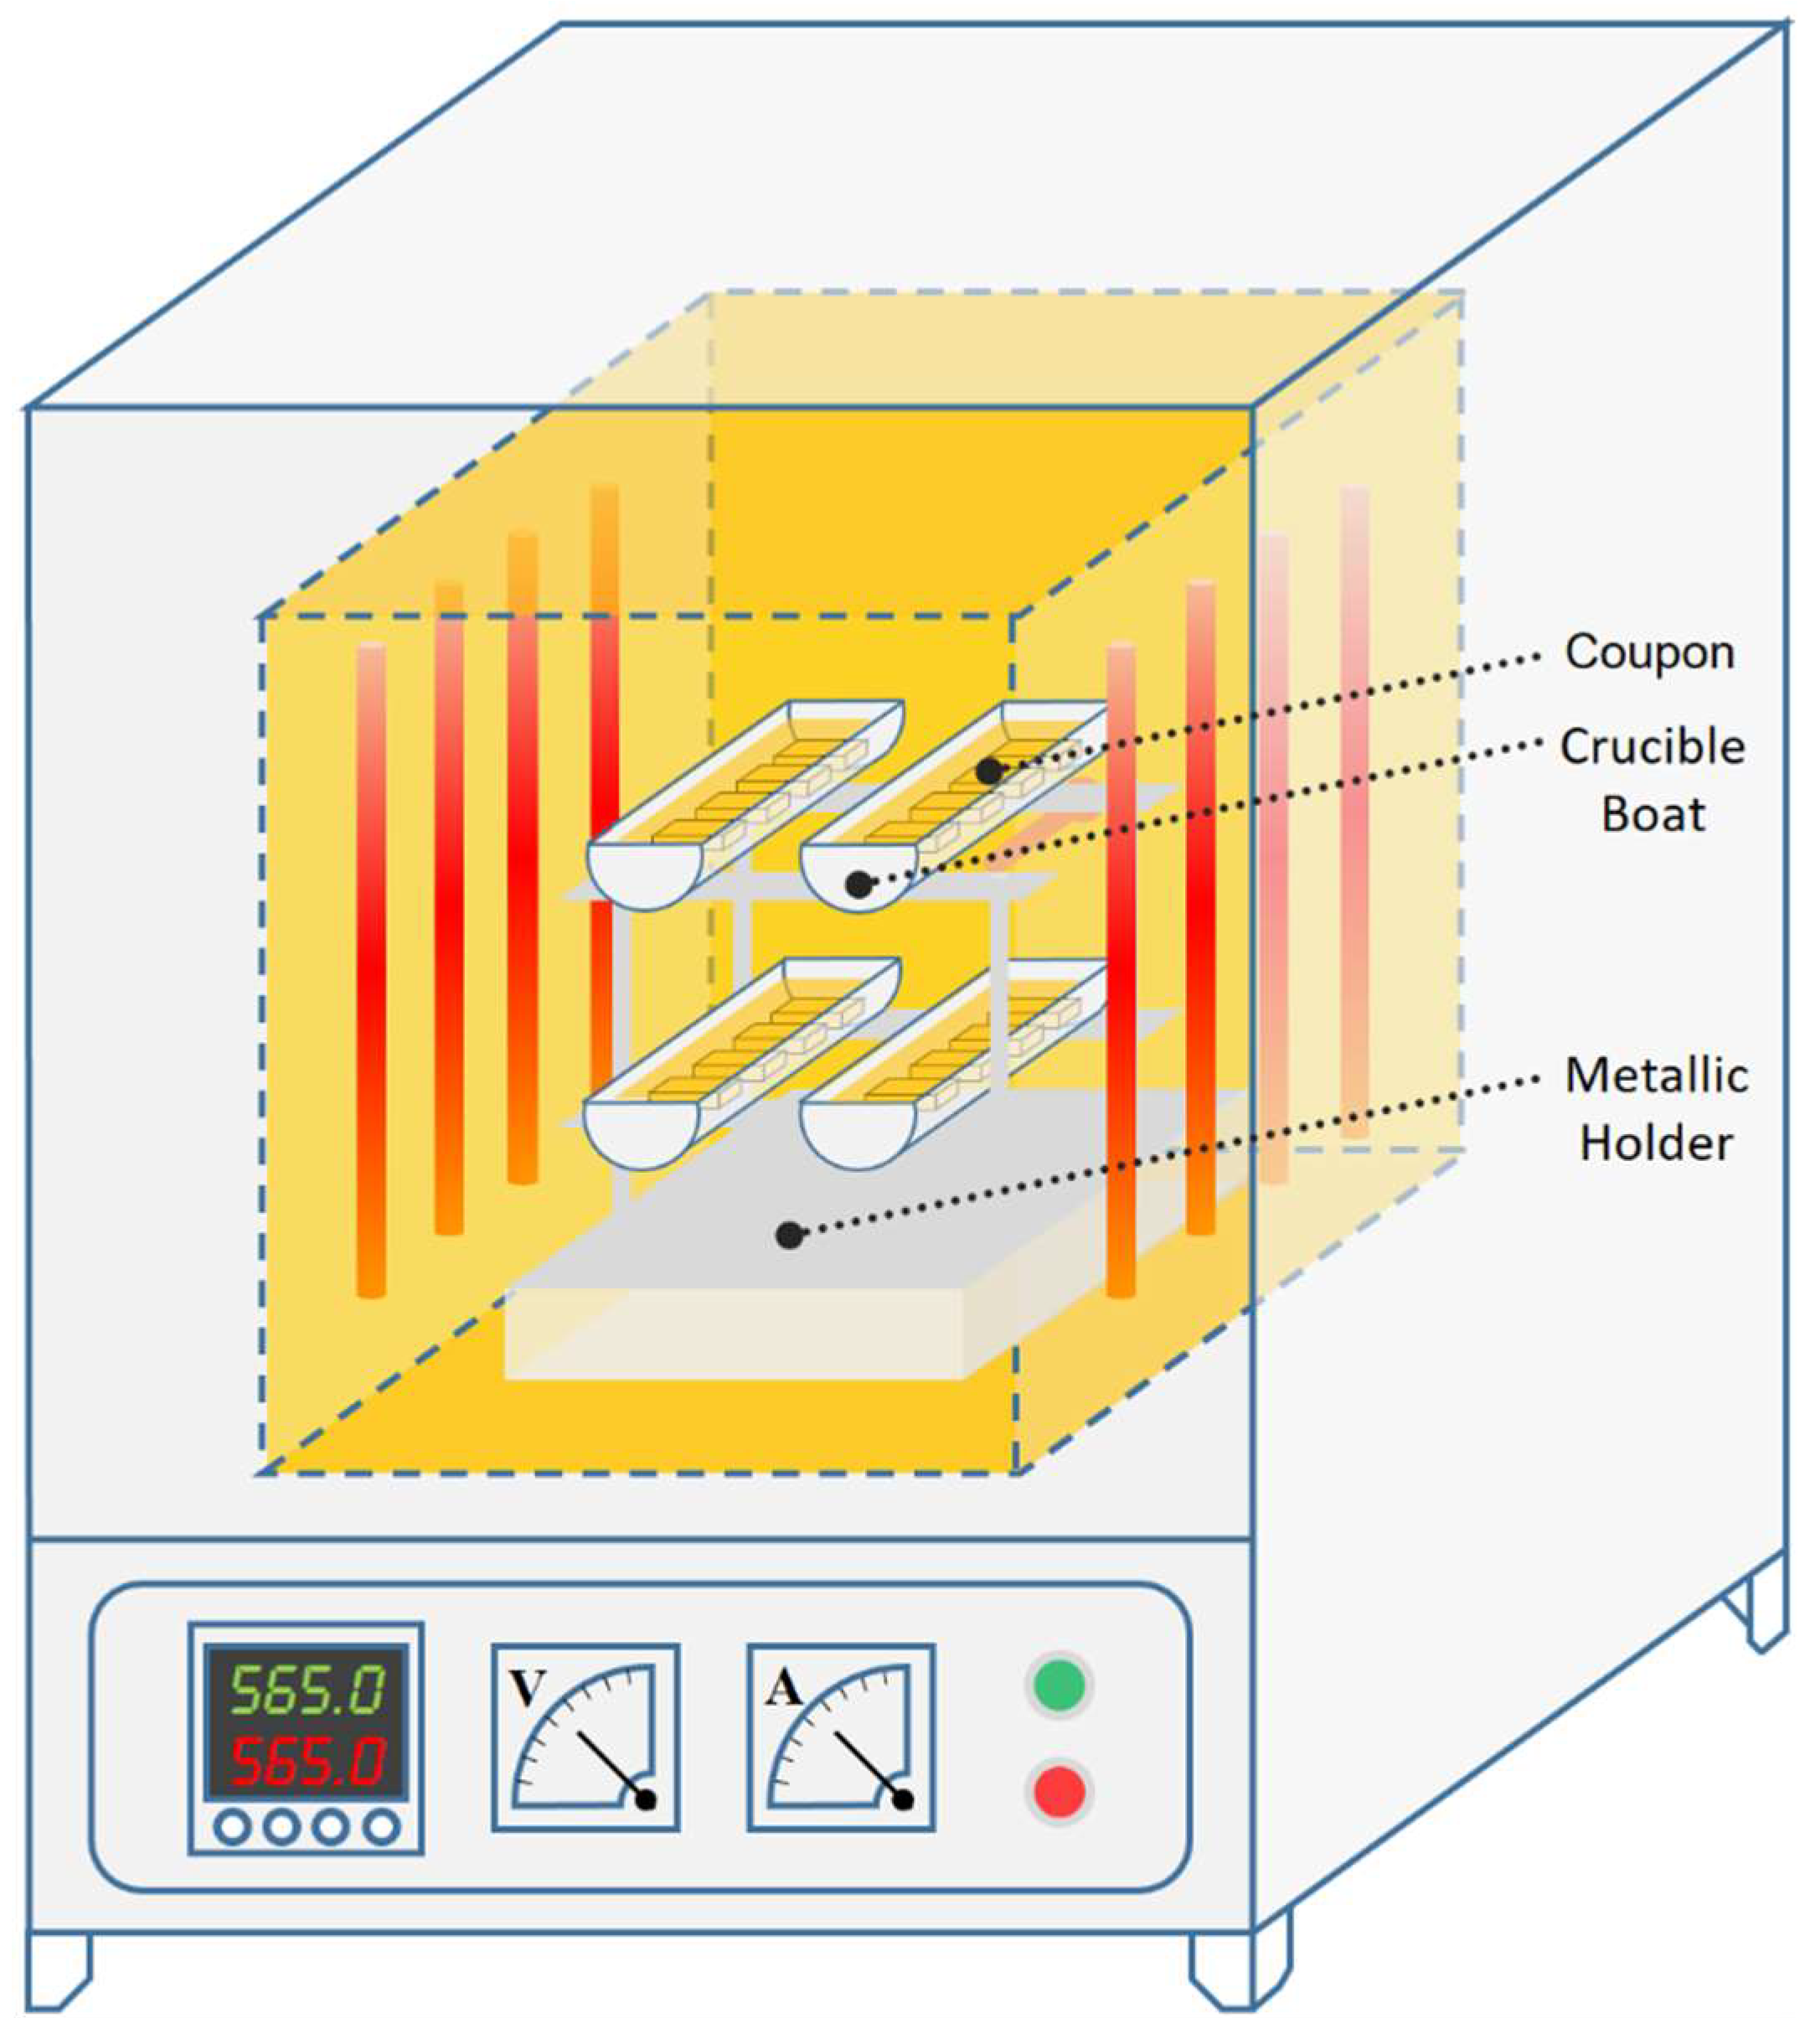
2.2. Corrosion Procedure
2.3. Characterization of Samples and Salts
3. Results and Discussion
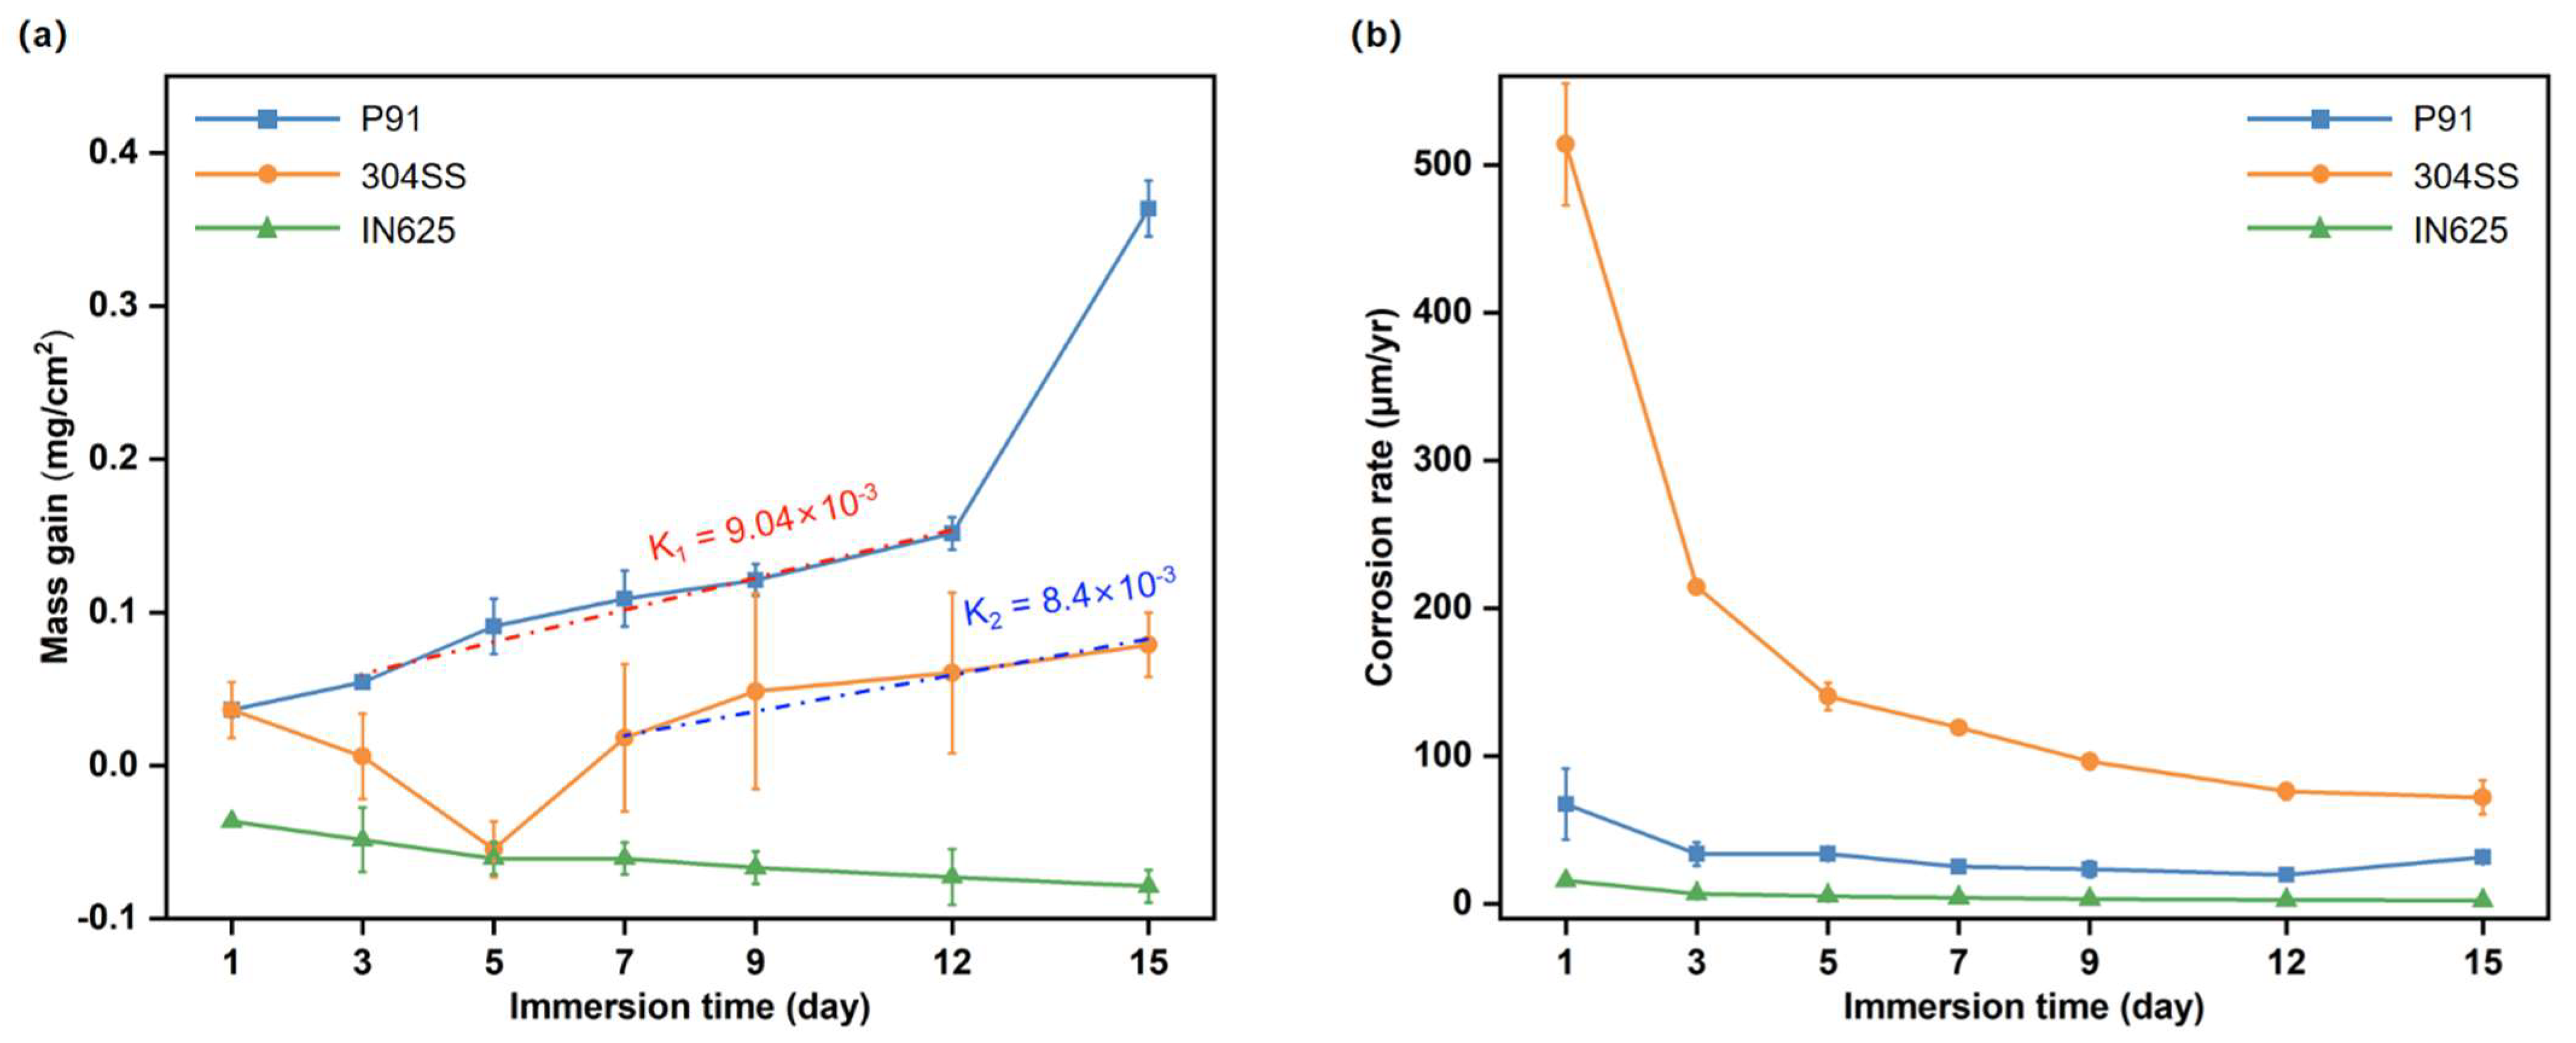
3.1. Gravimetric Analysis
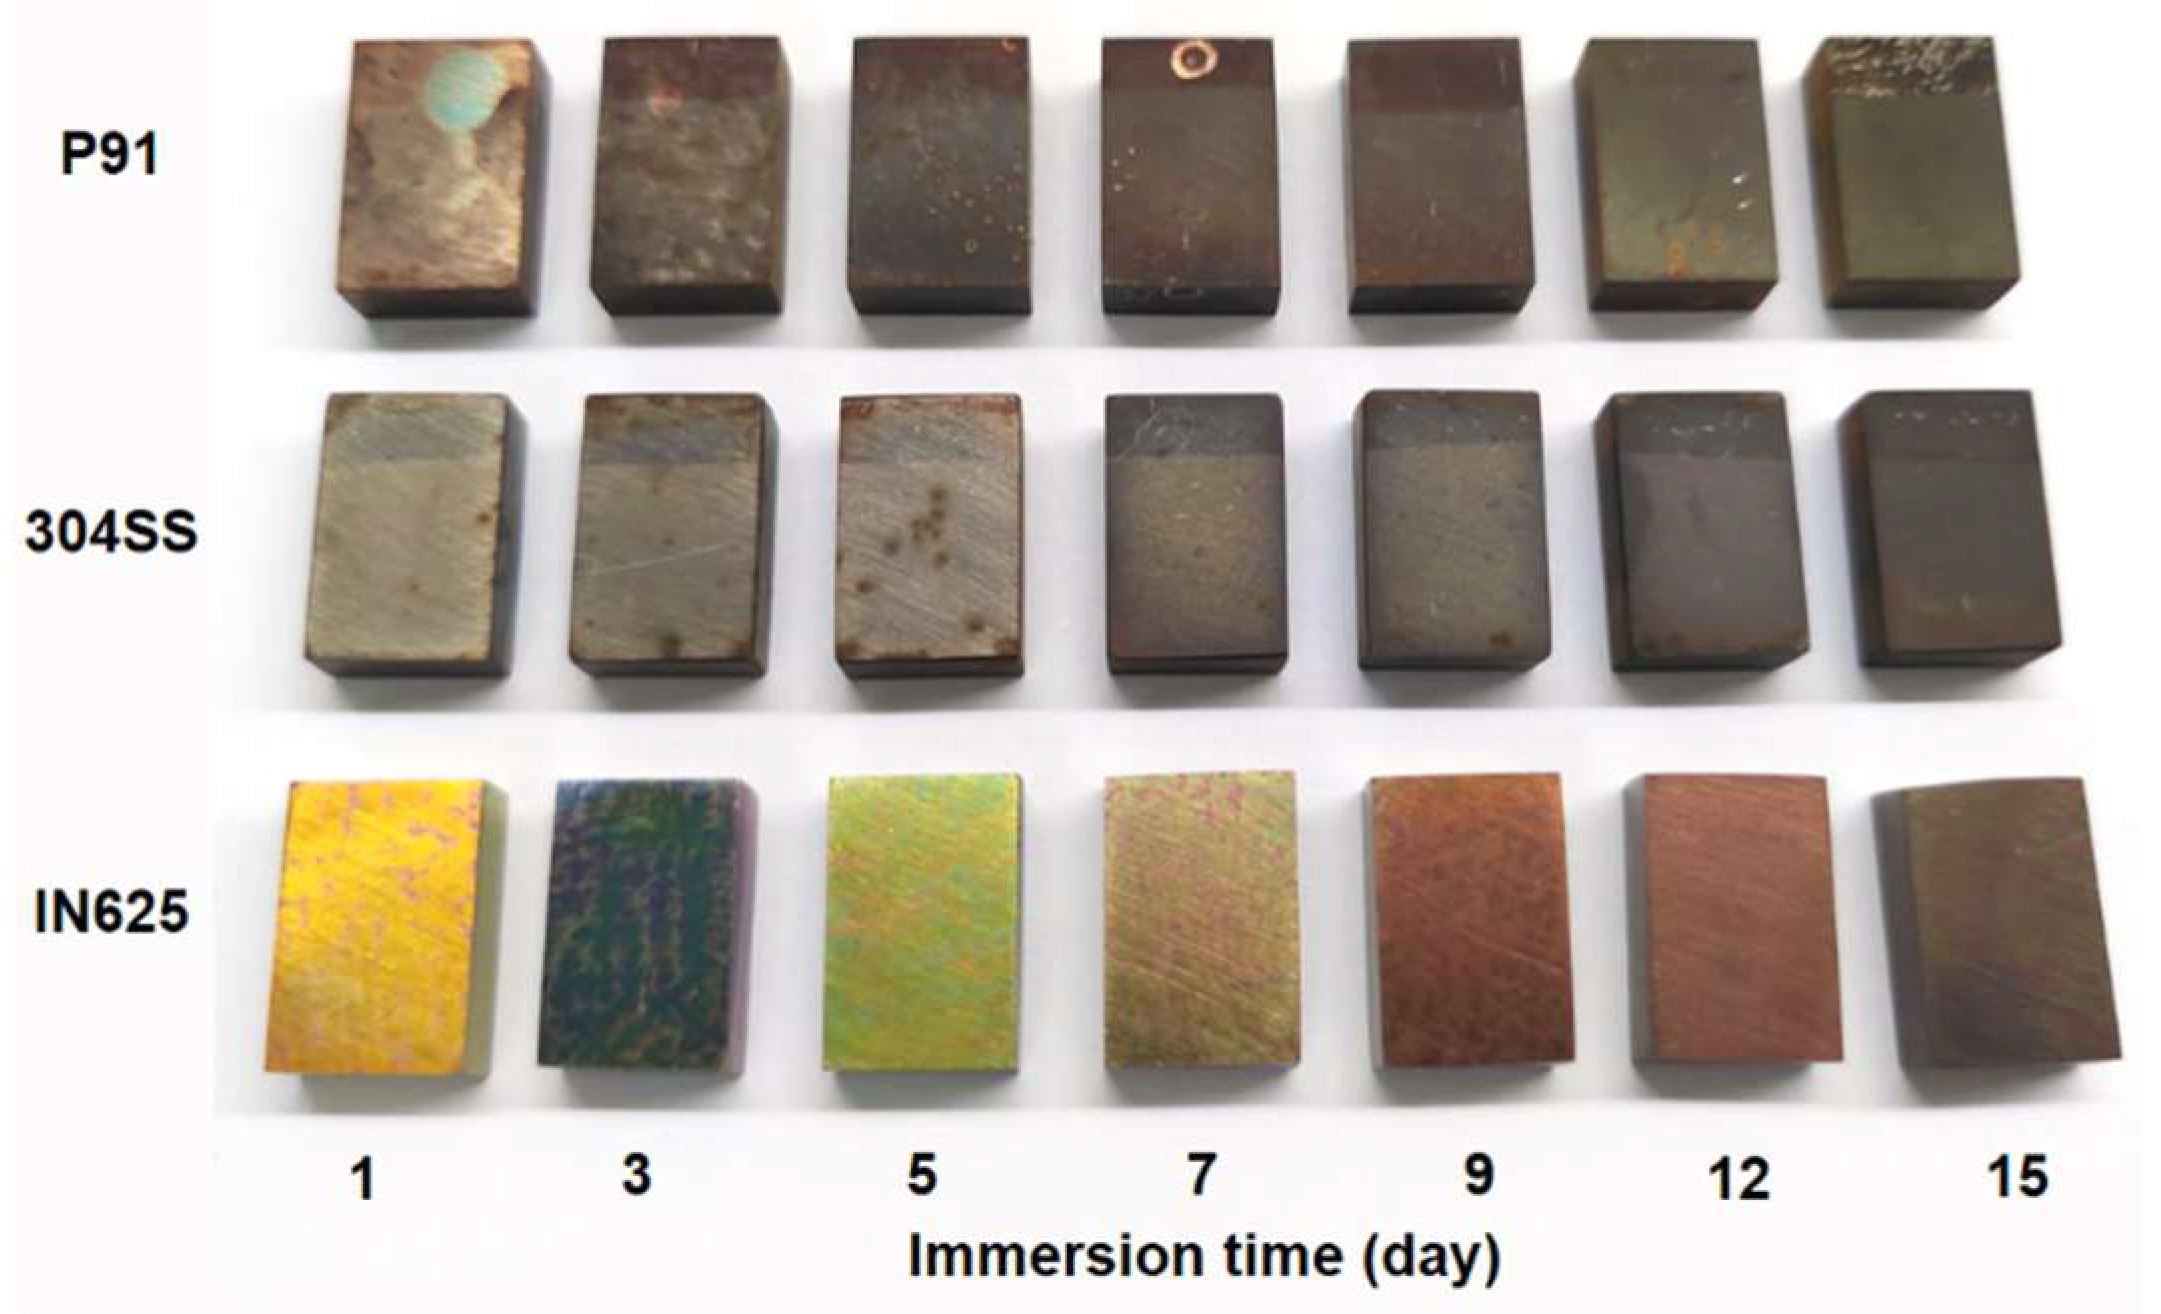
3.2. Macroscopic Observations
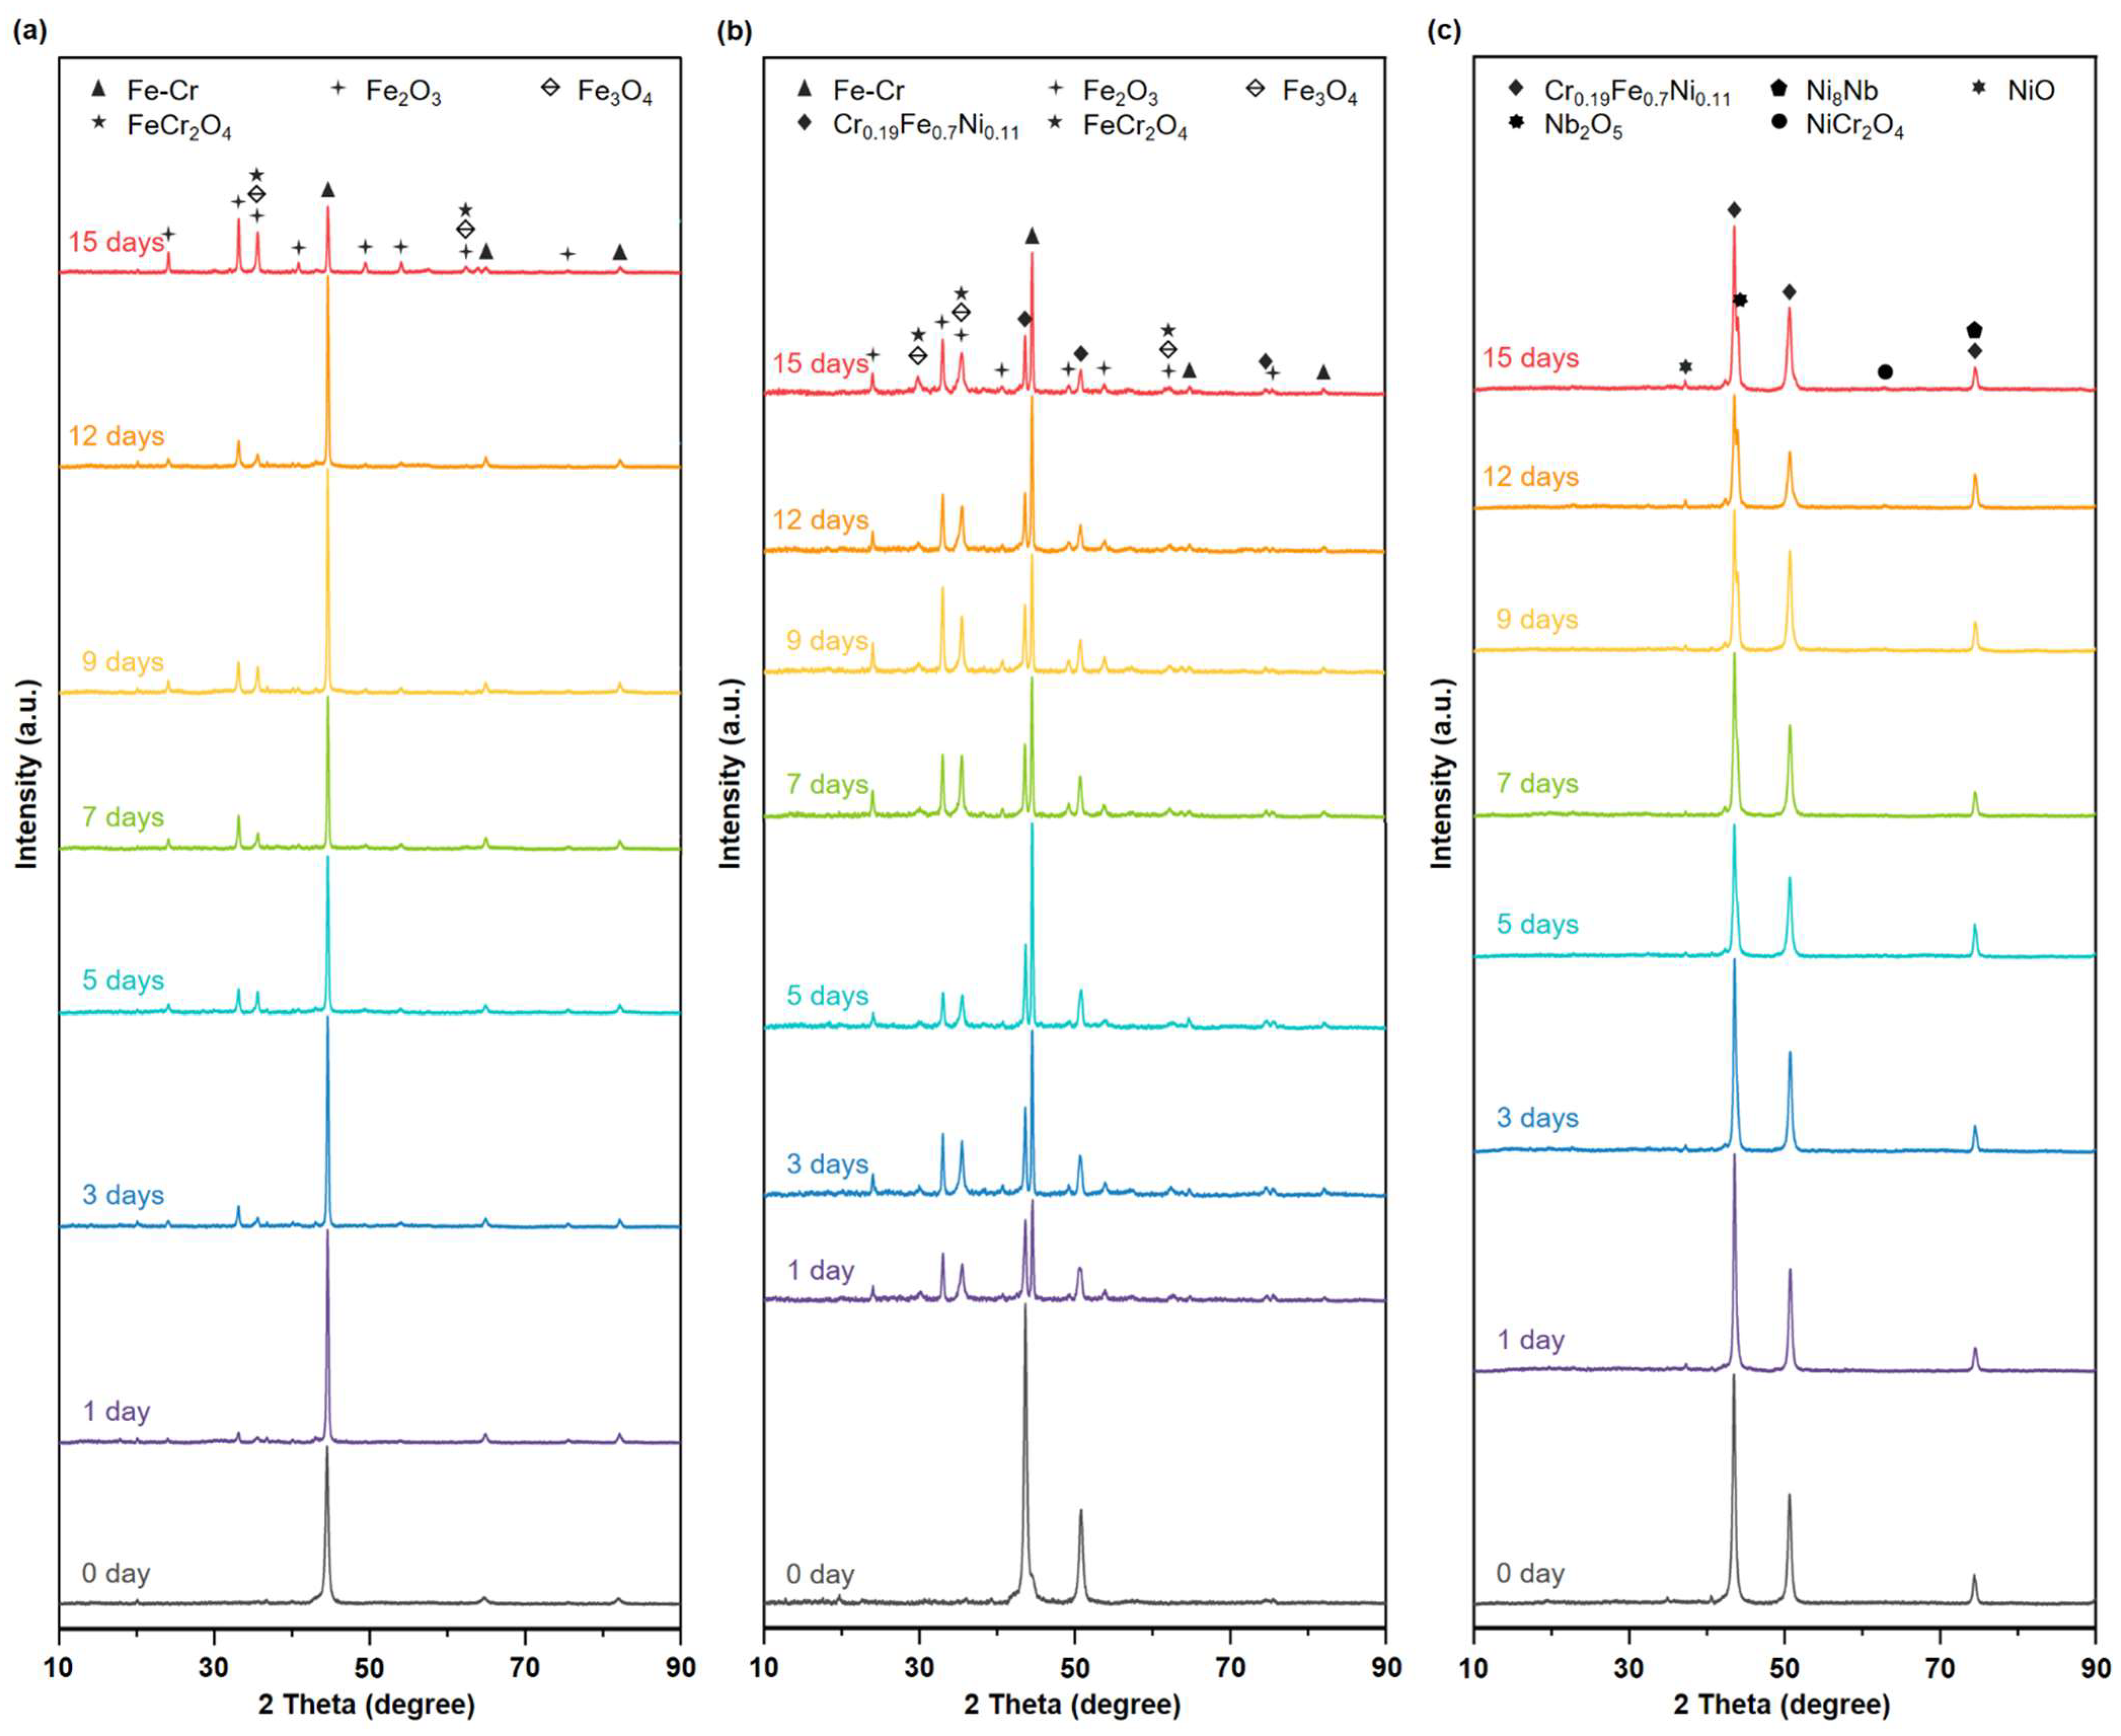
3.3. XRD Analysis
3.4. Microscopic Observations
3.4.1. P91 Alloy
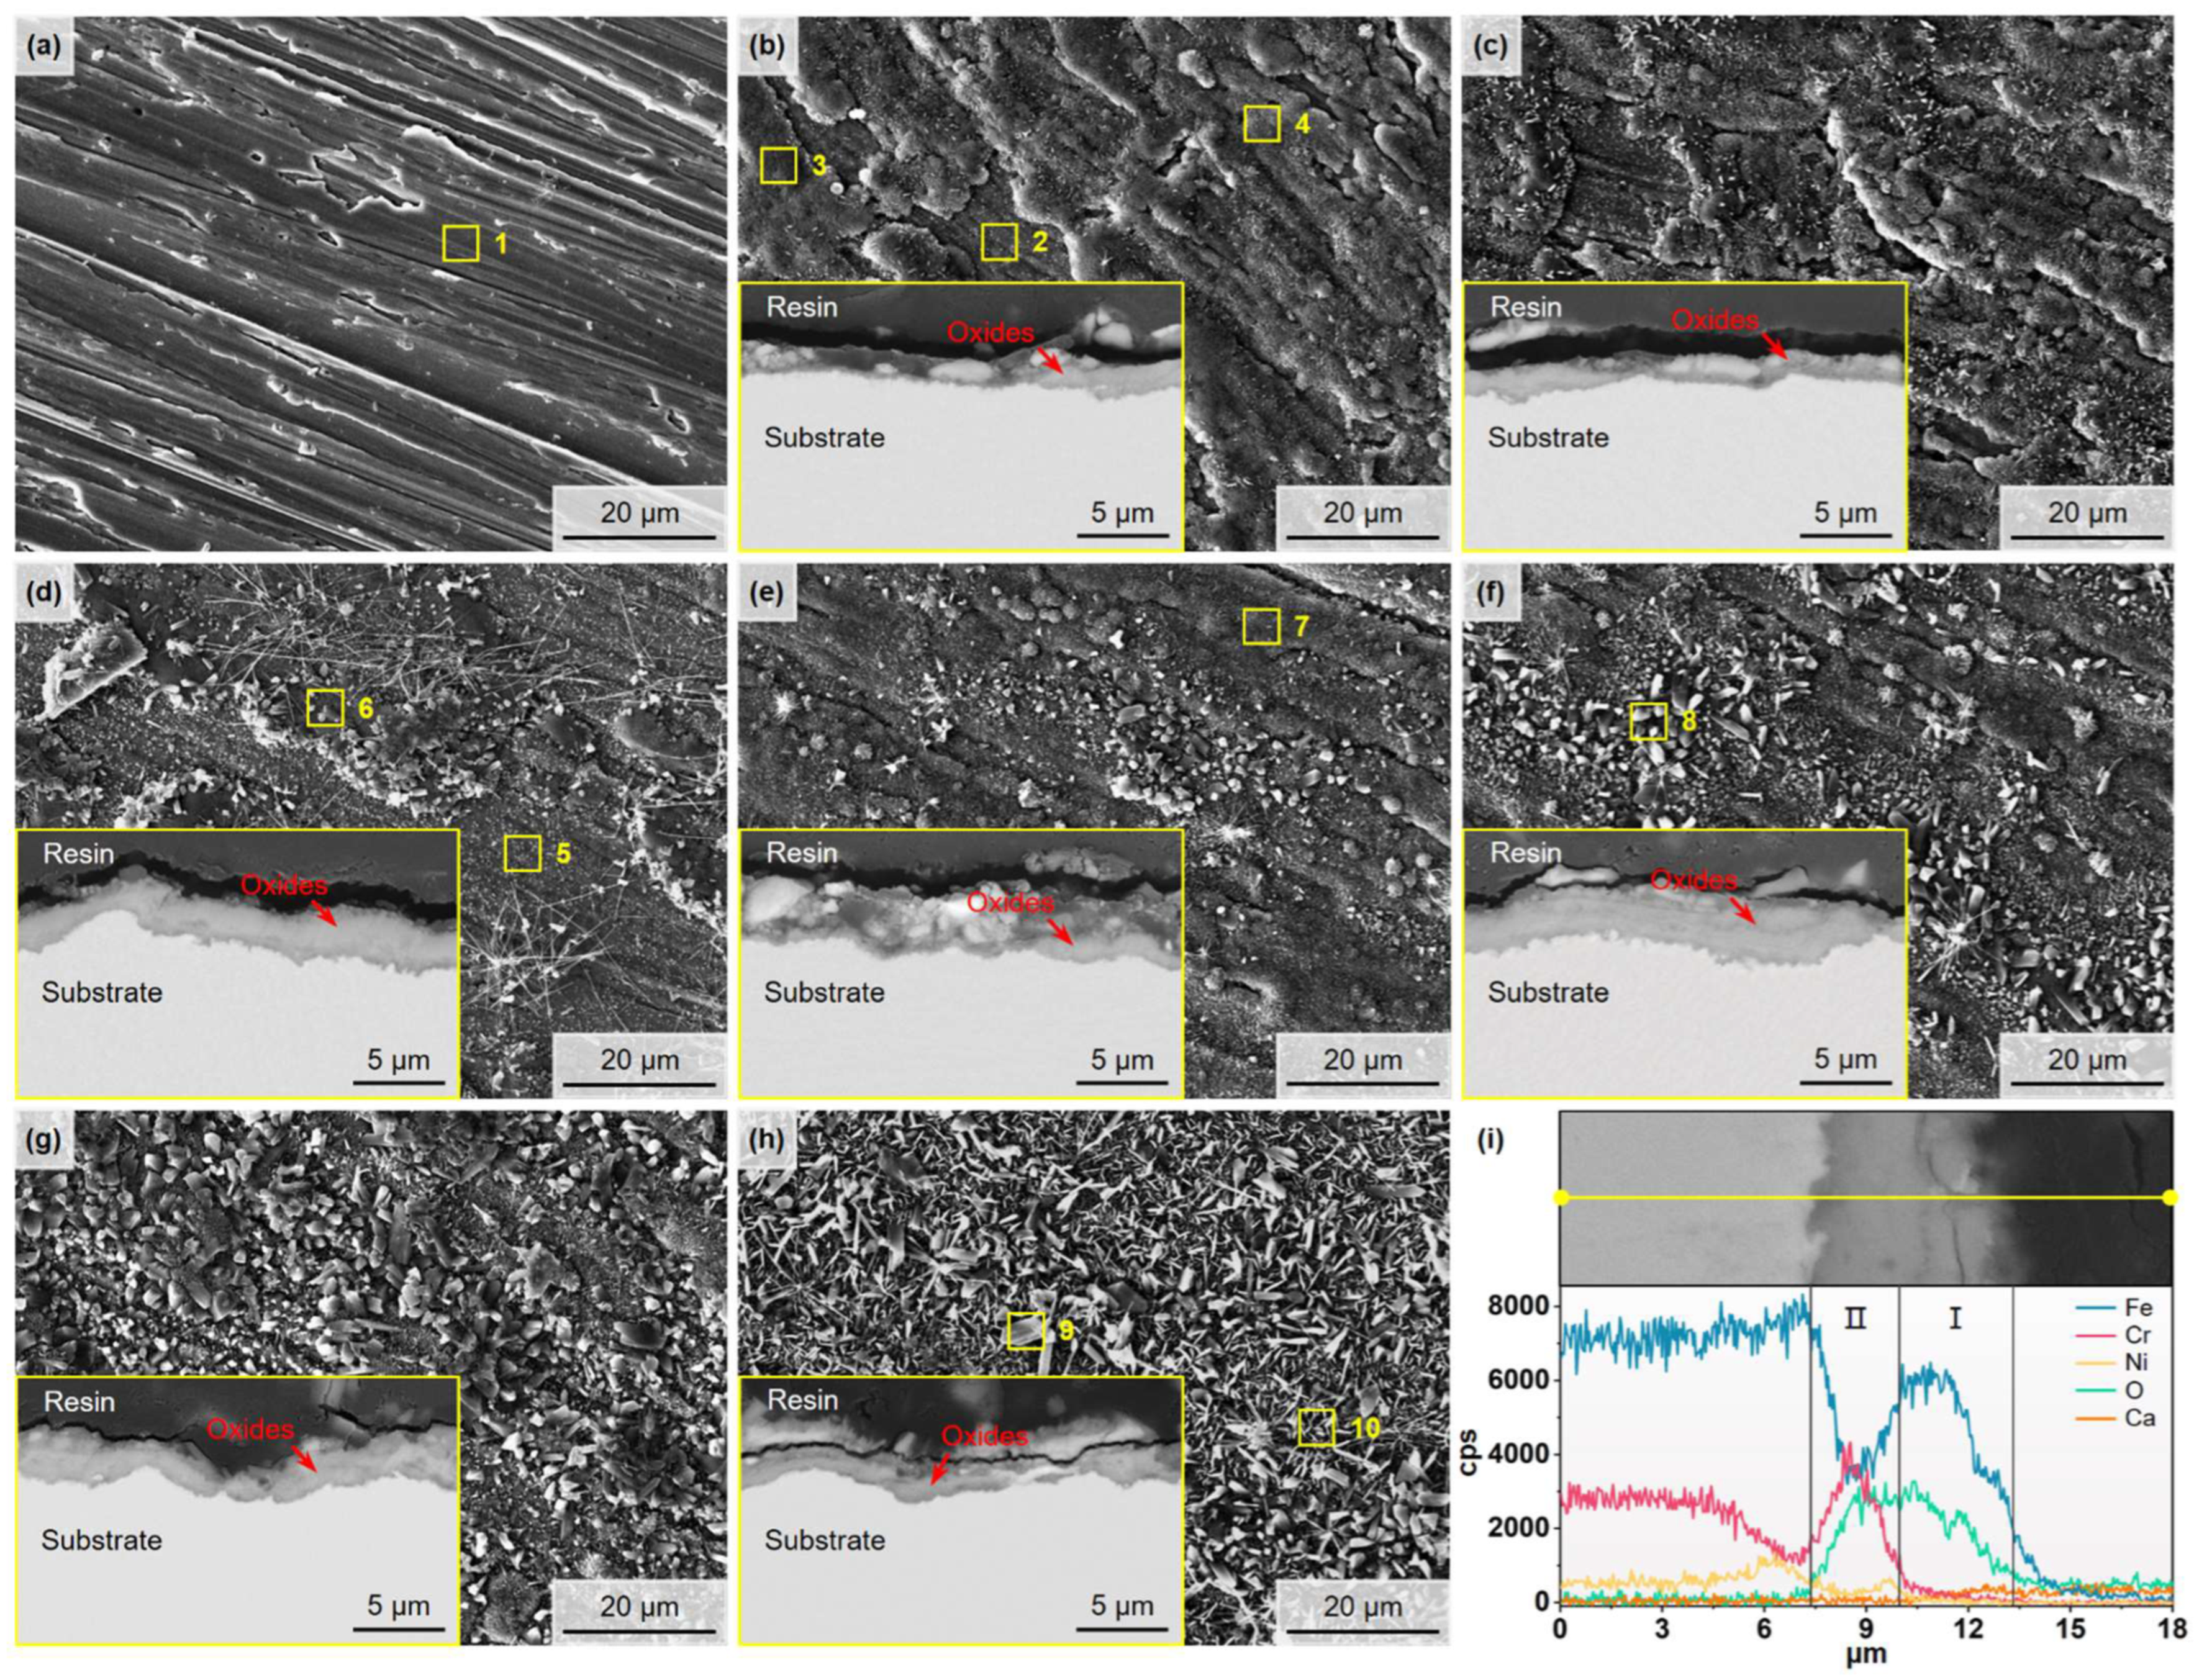
3.4.2. 304SS Alloy
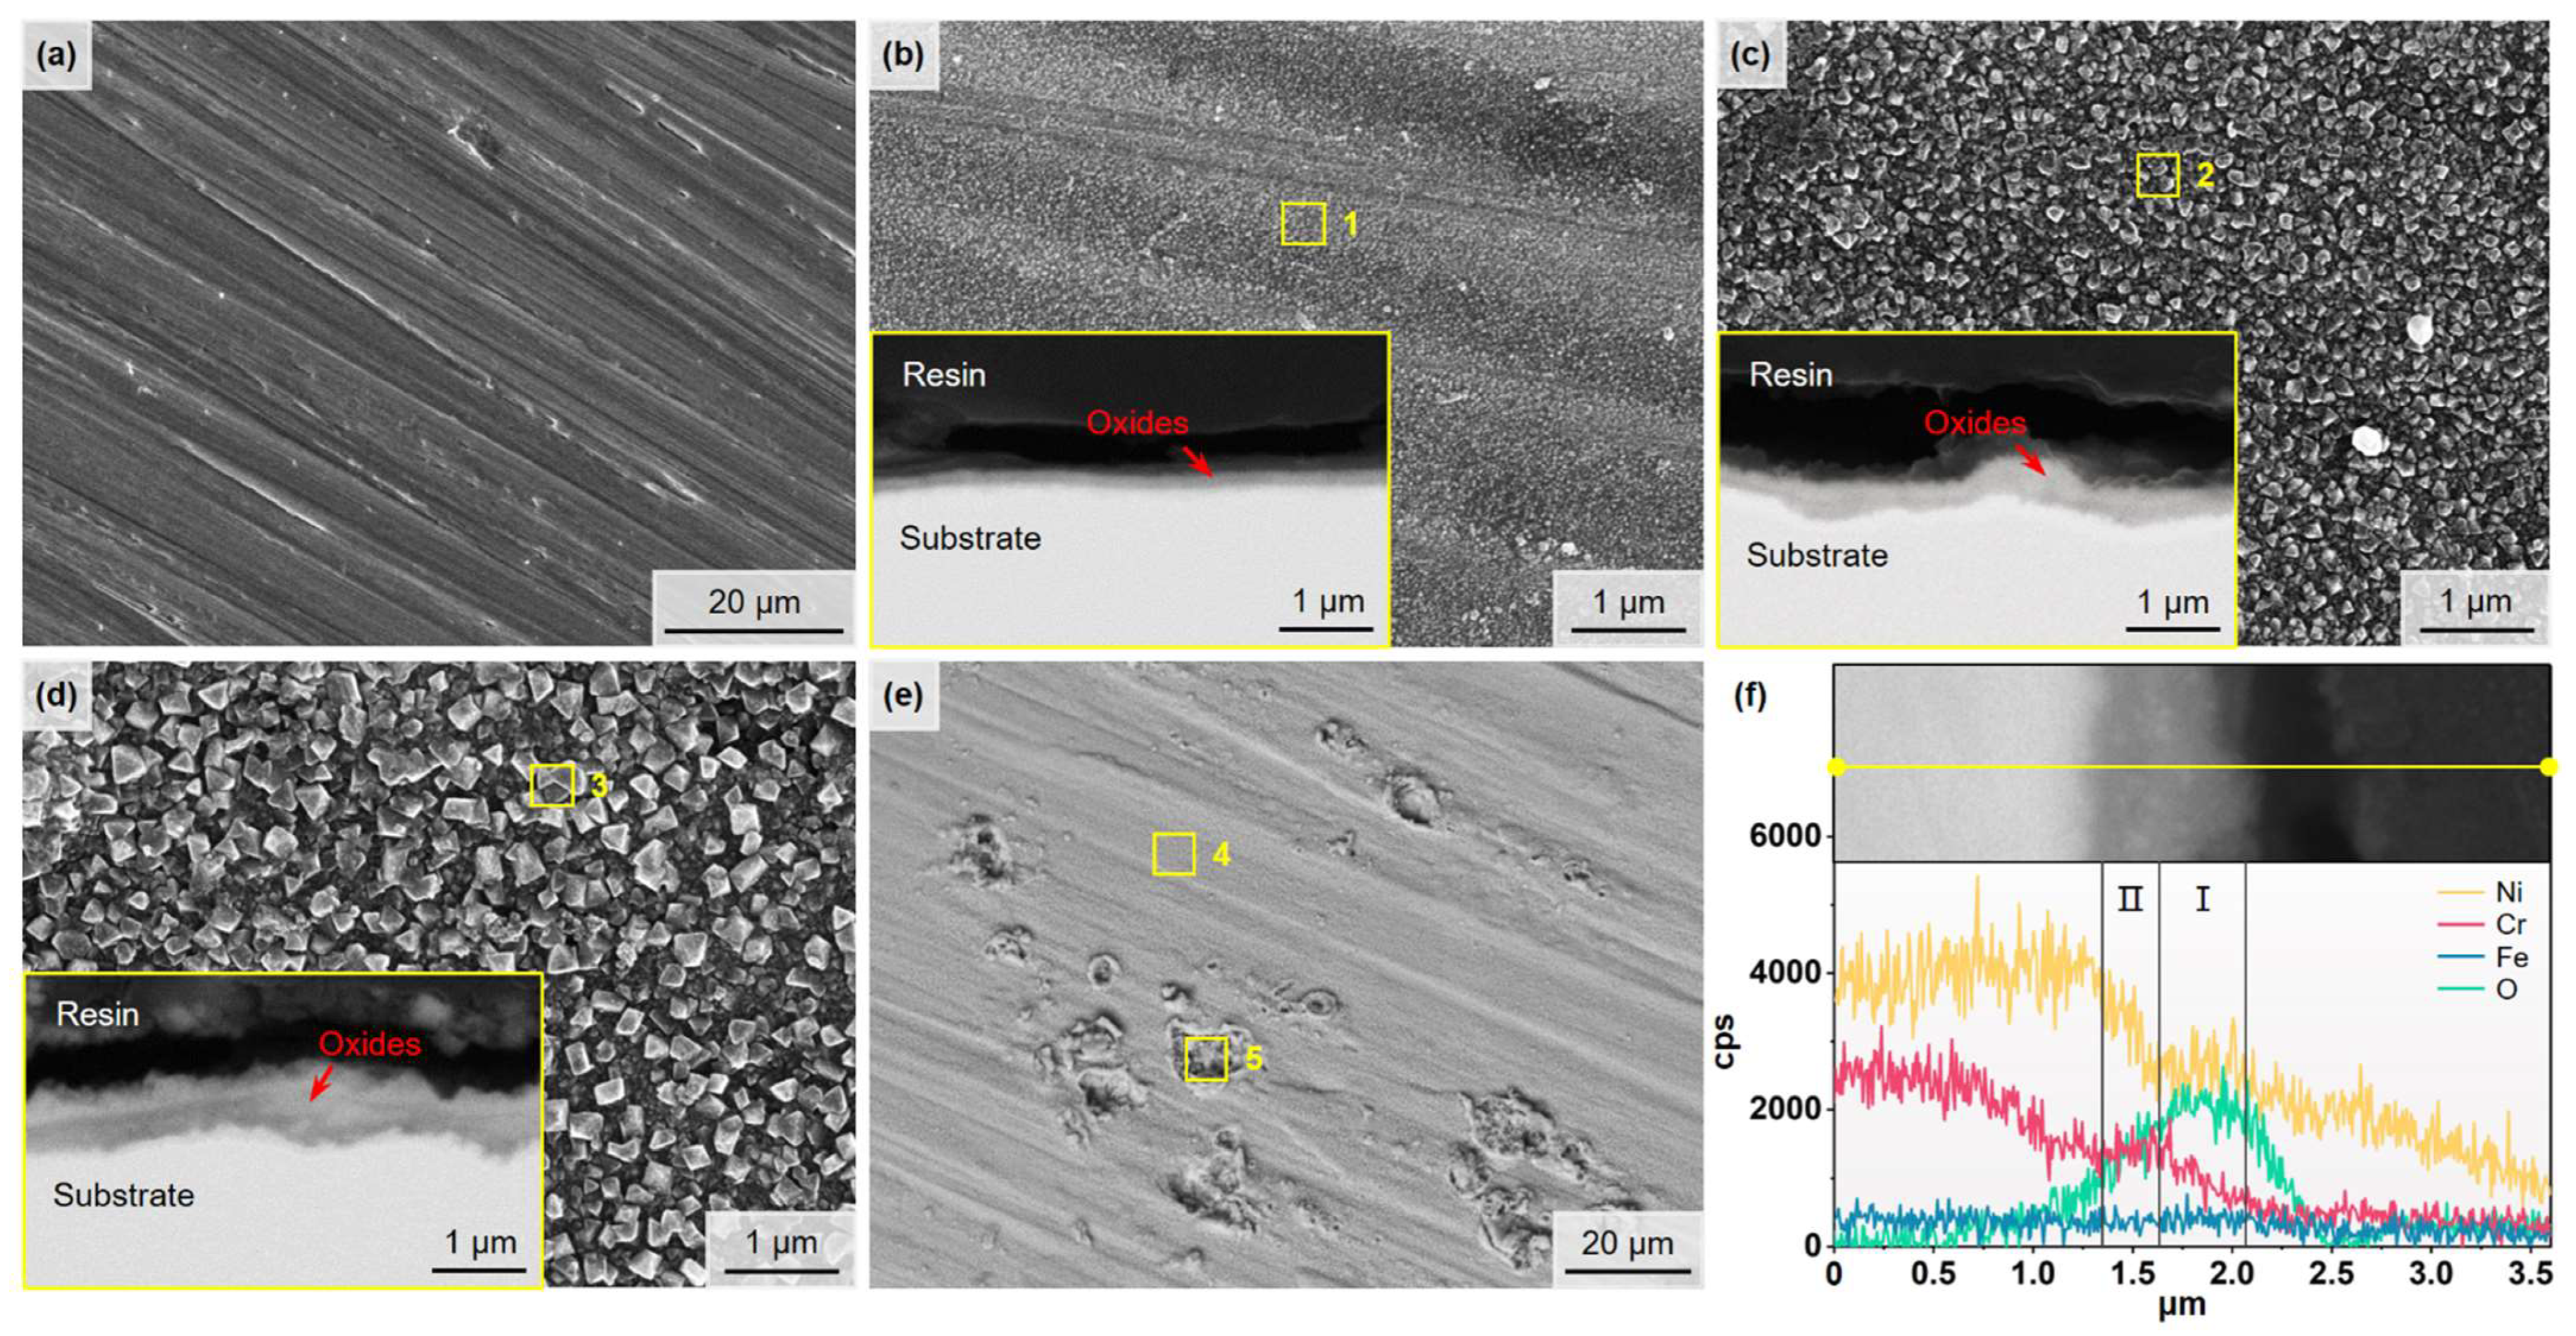
3.4.3. IN625 Alloy
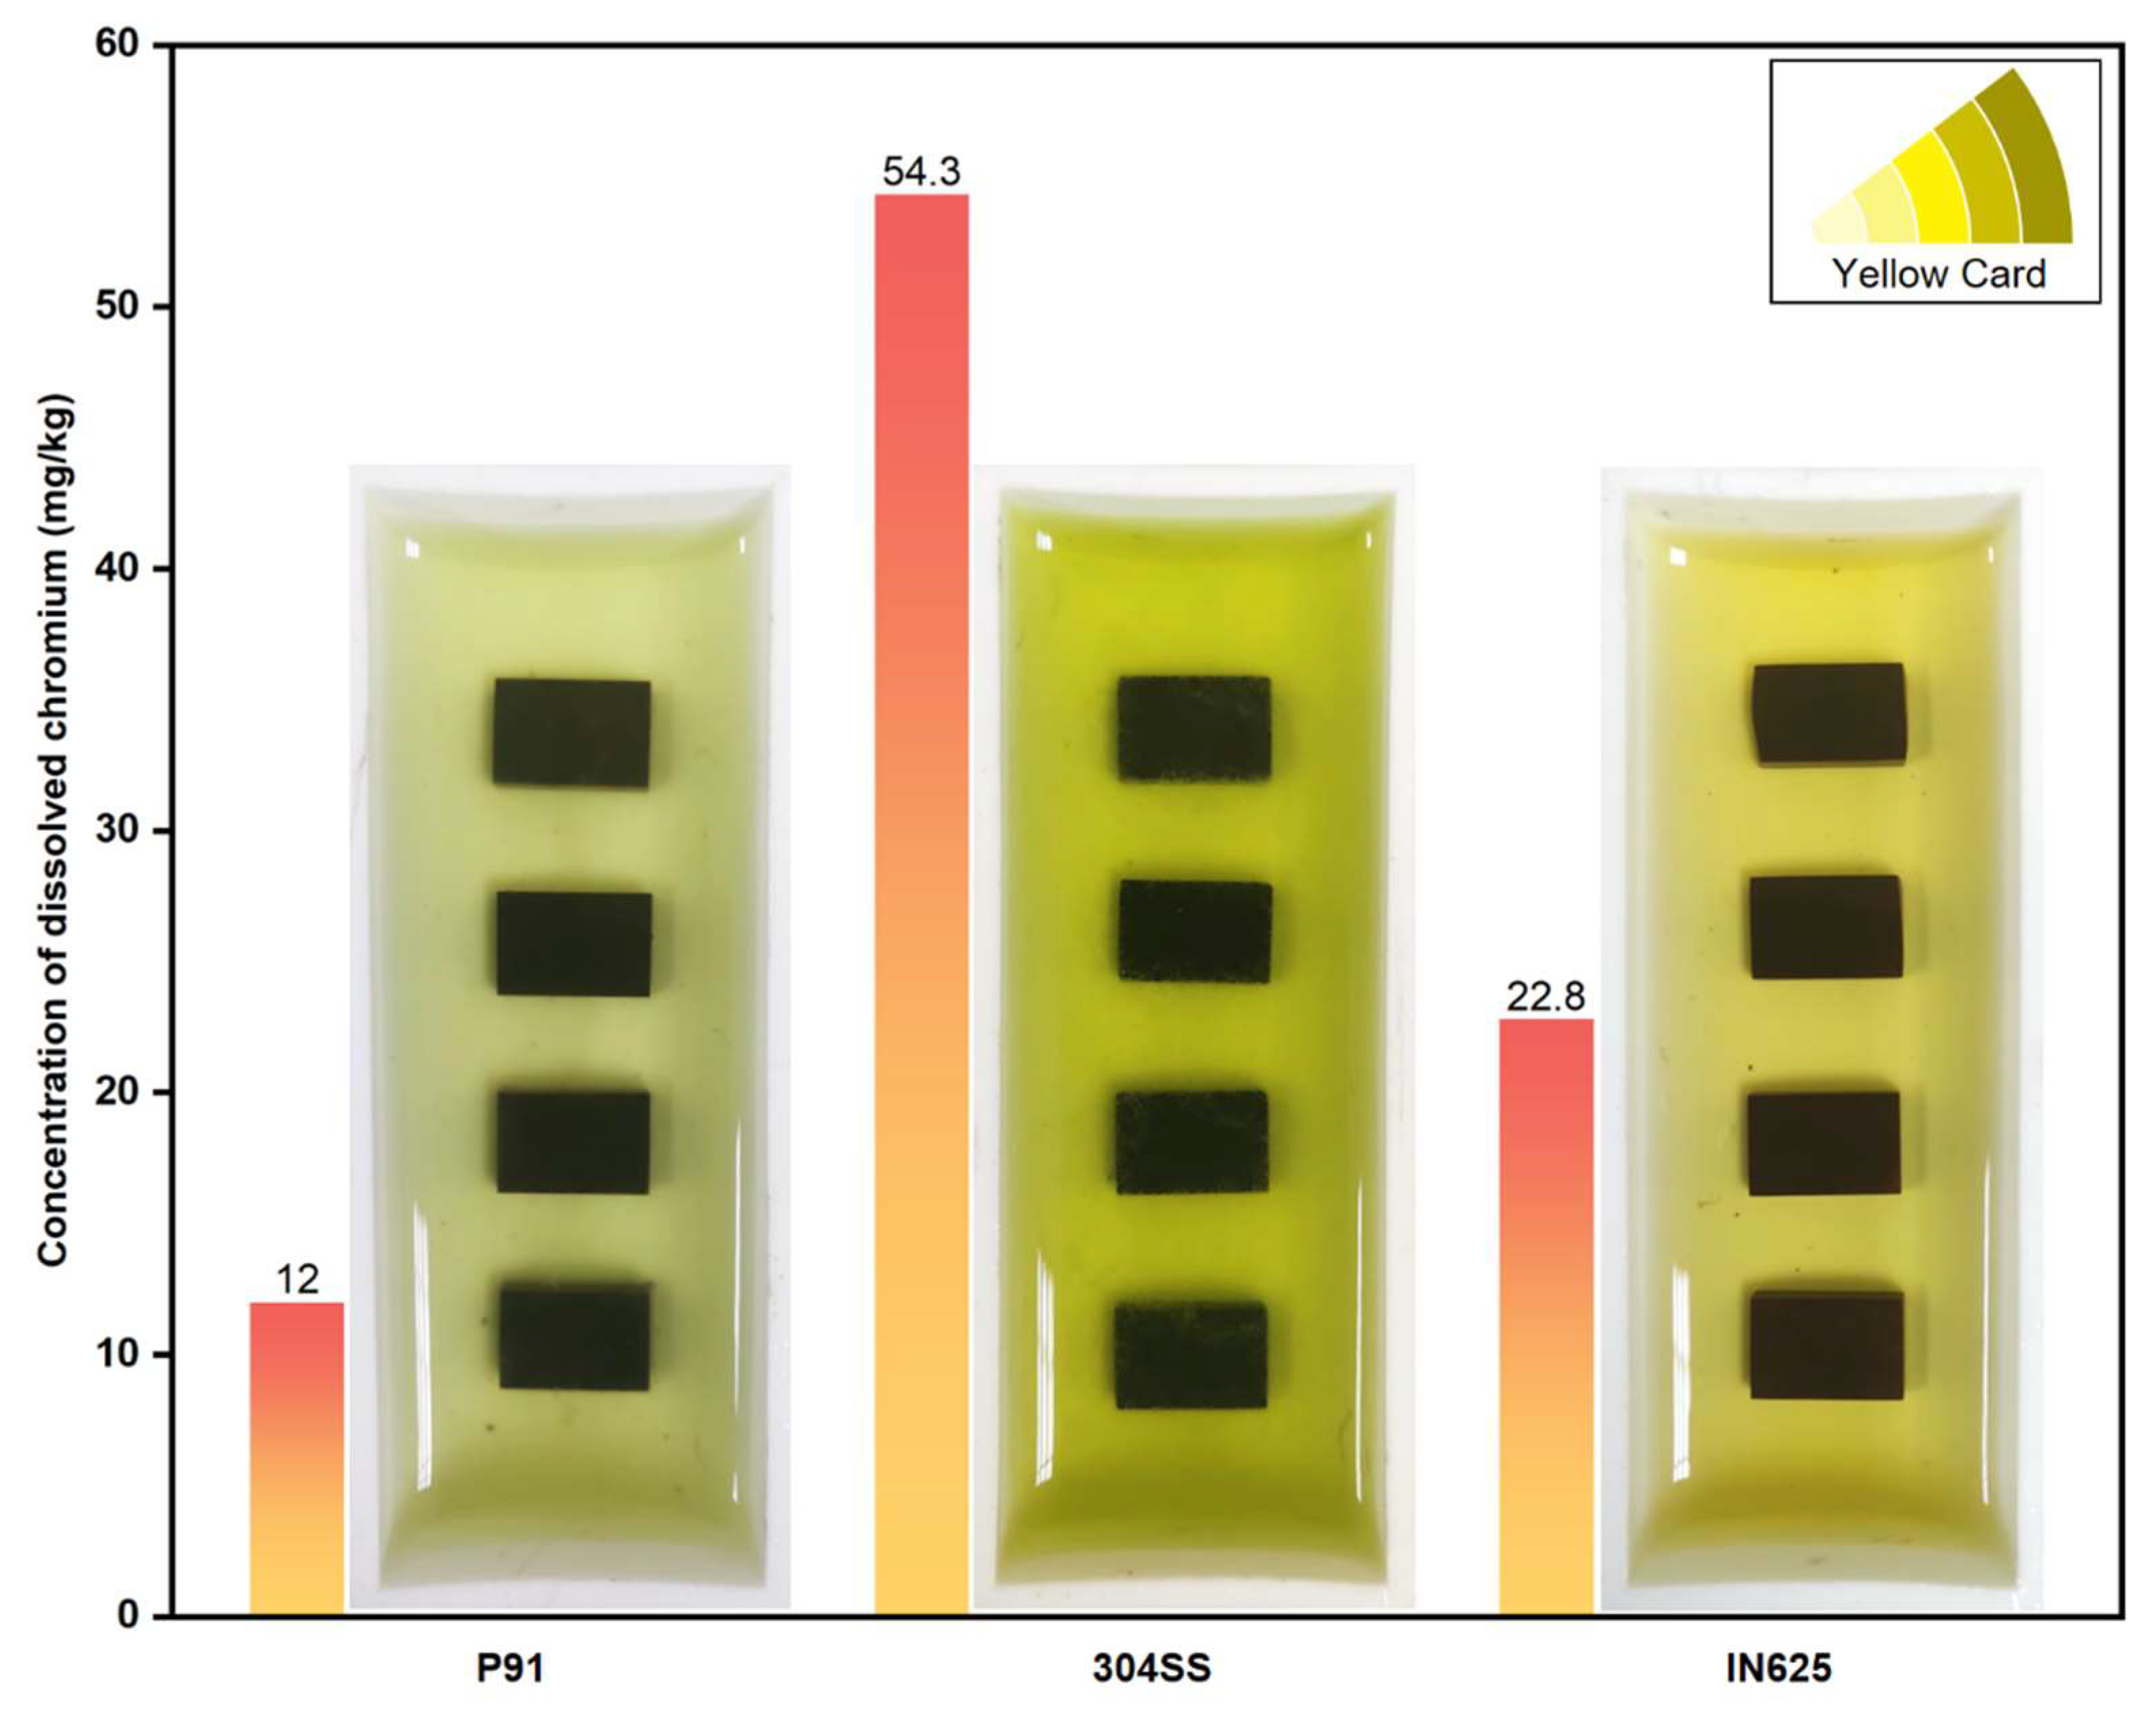
3.5. Salts Analysis
4. Corrosion Mechanisms
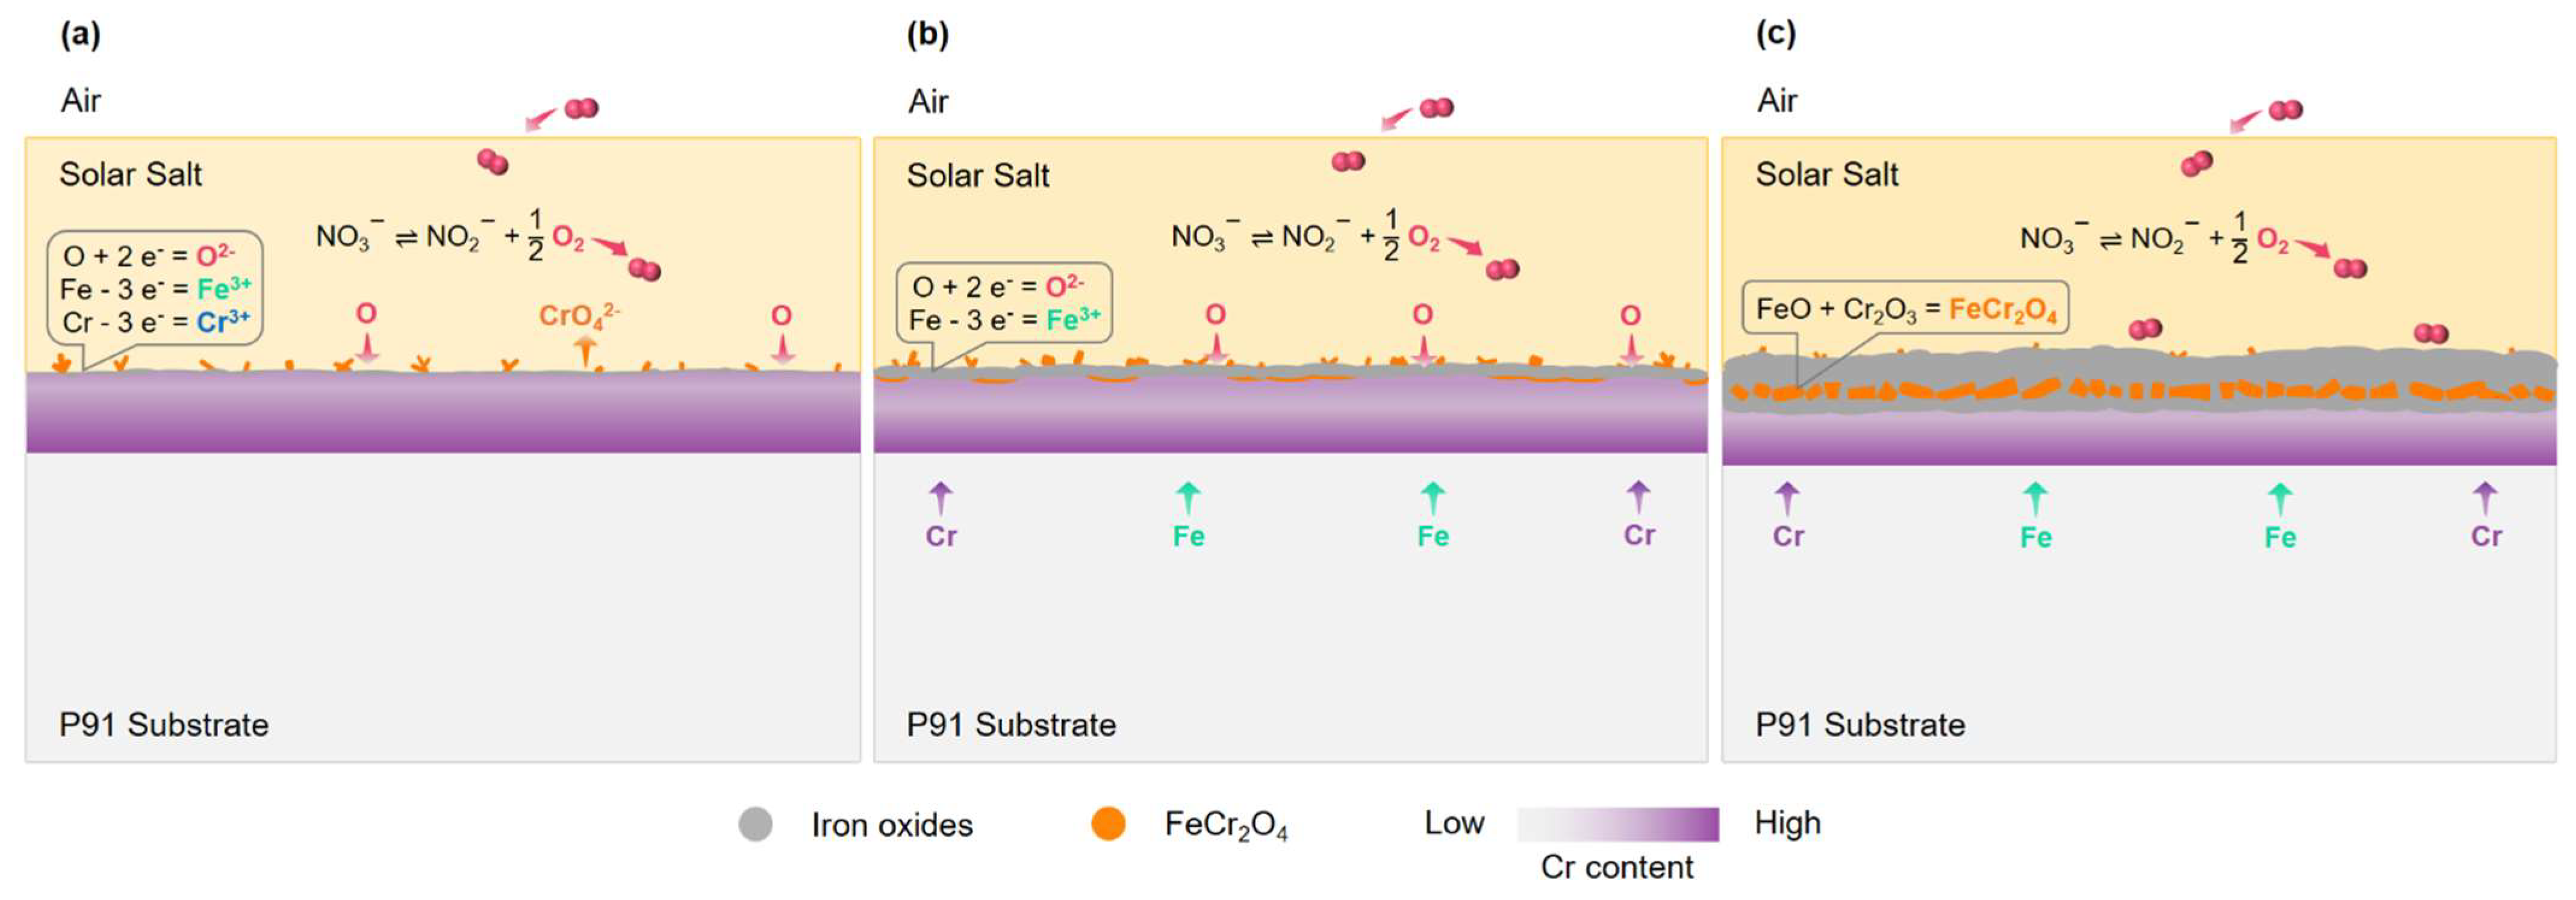
4.1. Corrosion Mechanism of P91 Alloy
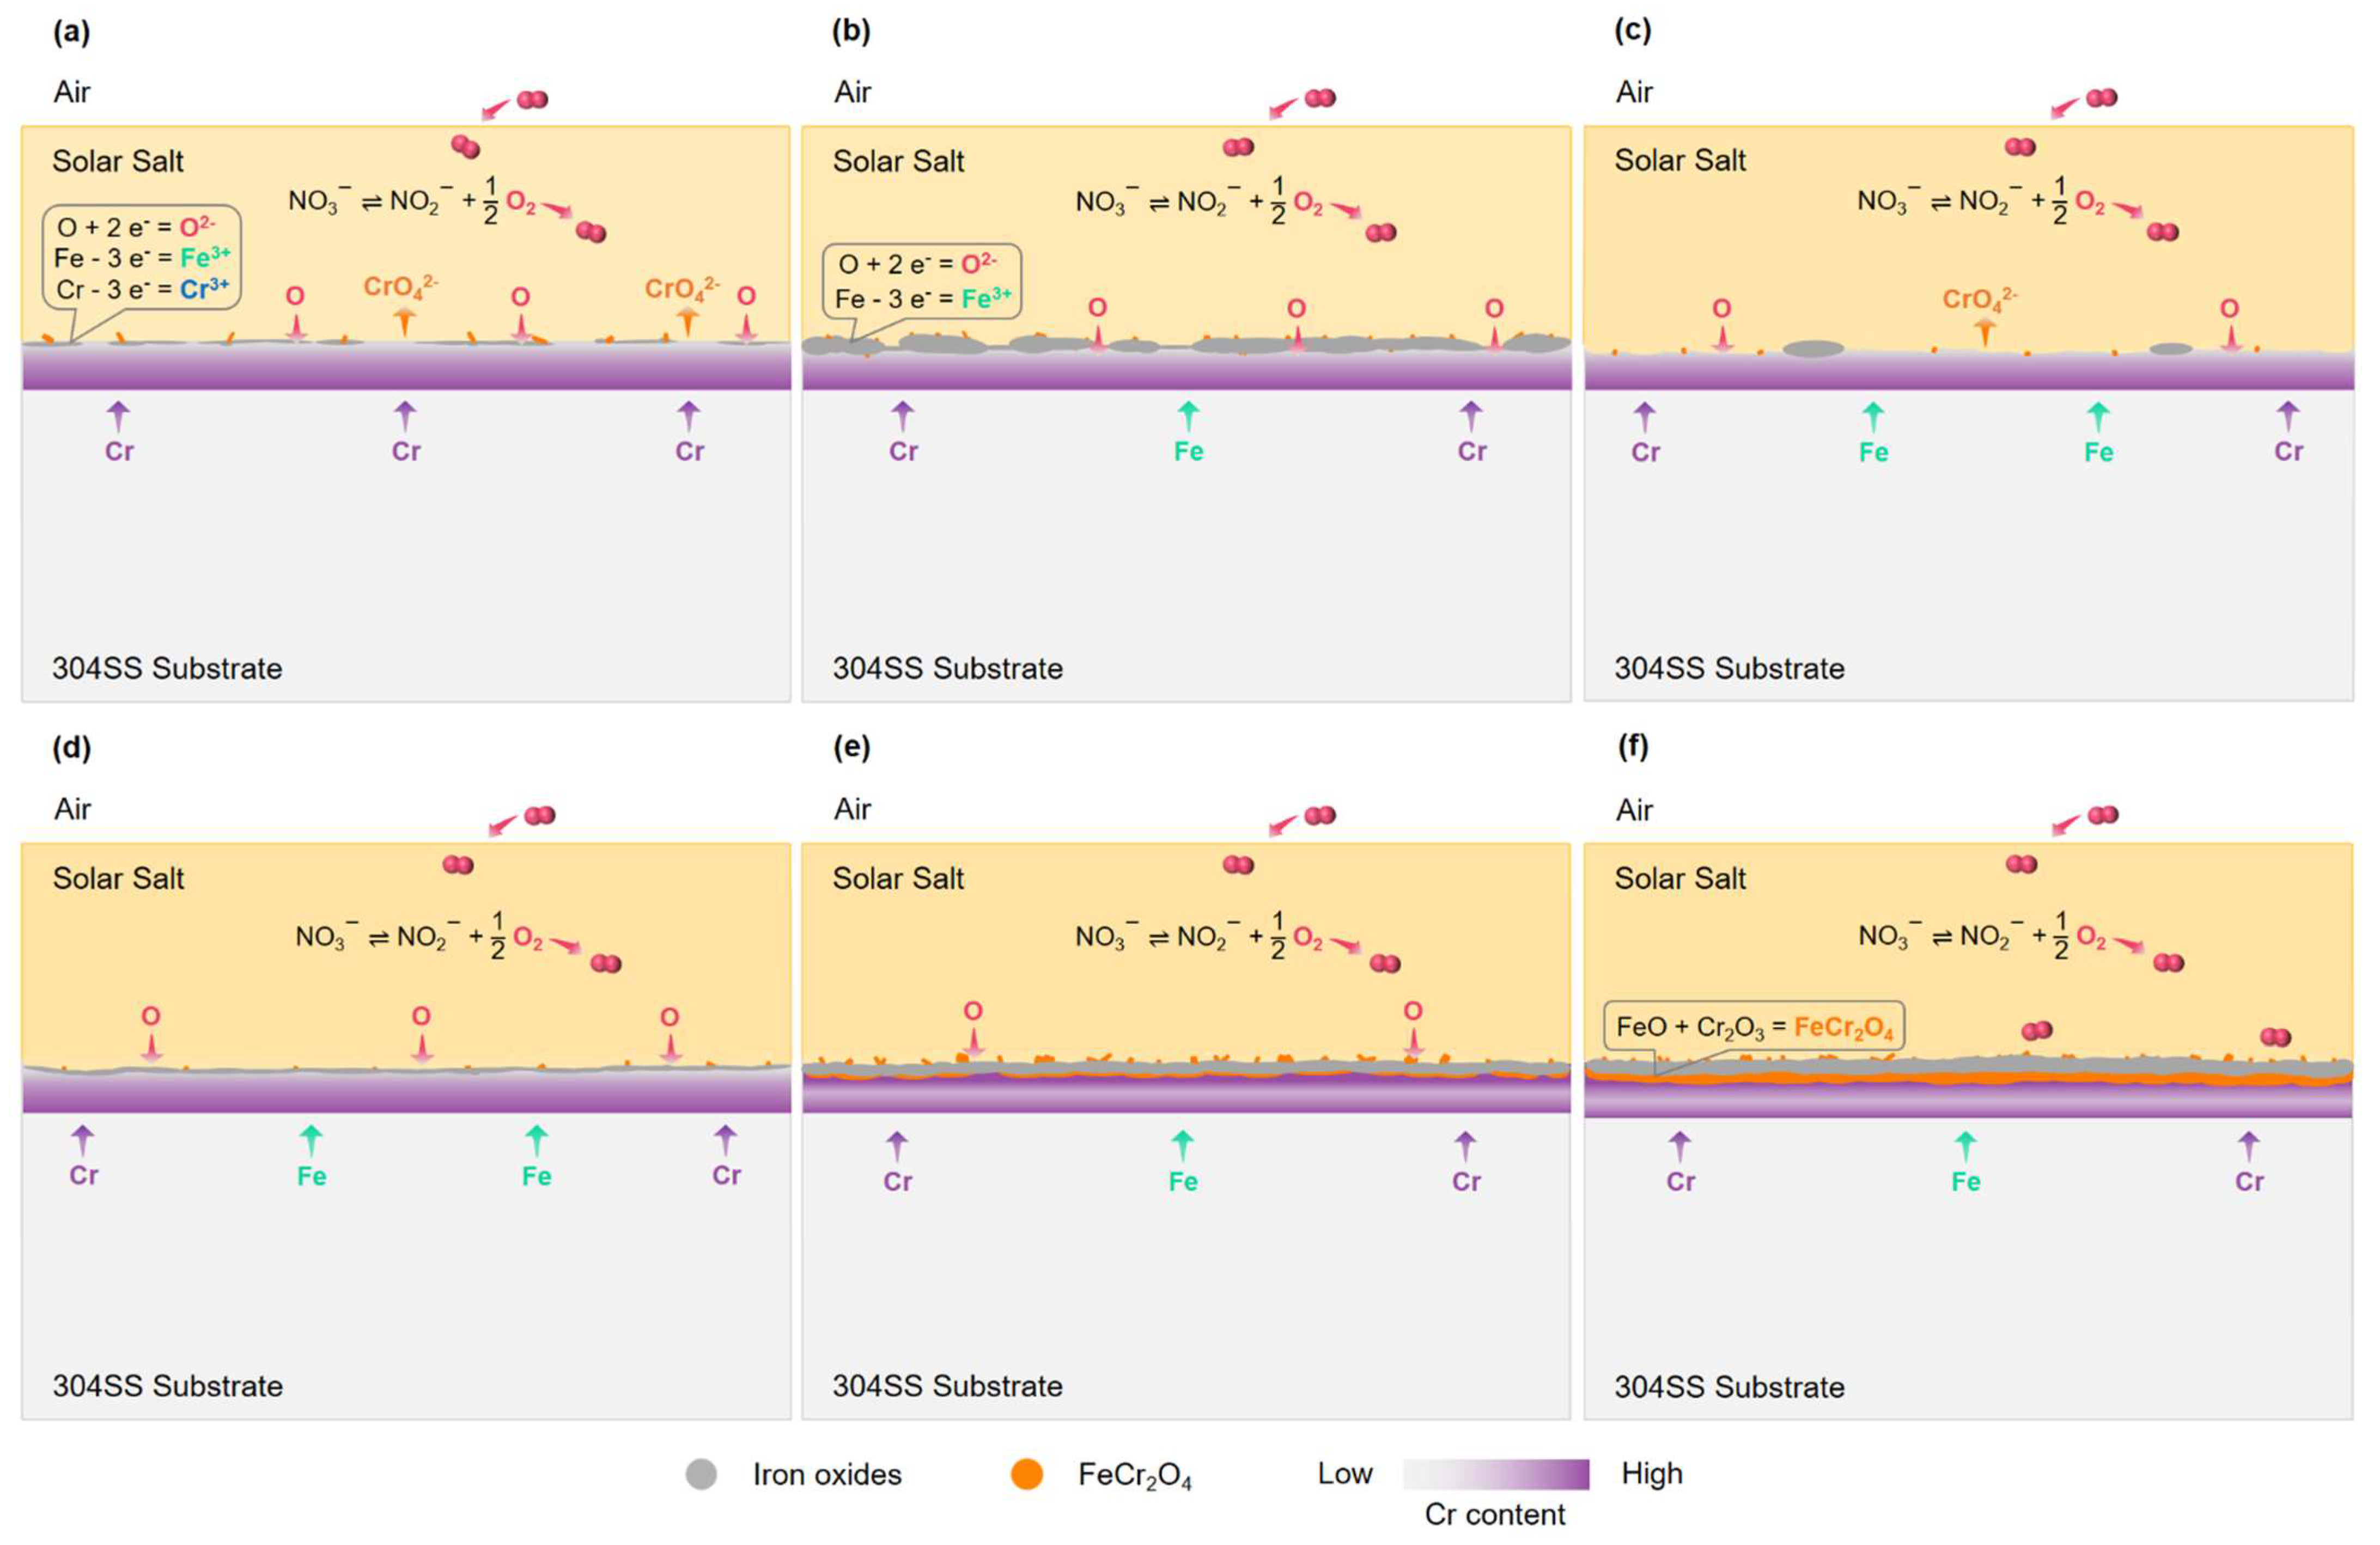
4.2. Corrosion Mechanism of 304SS Alloy
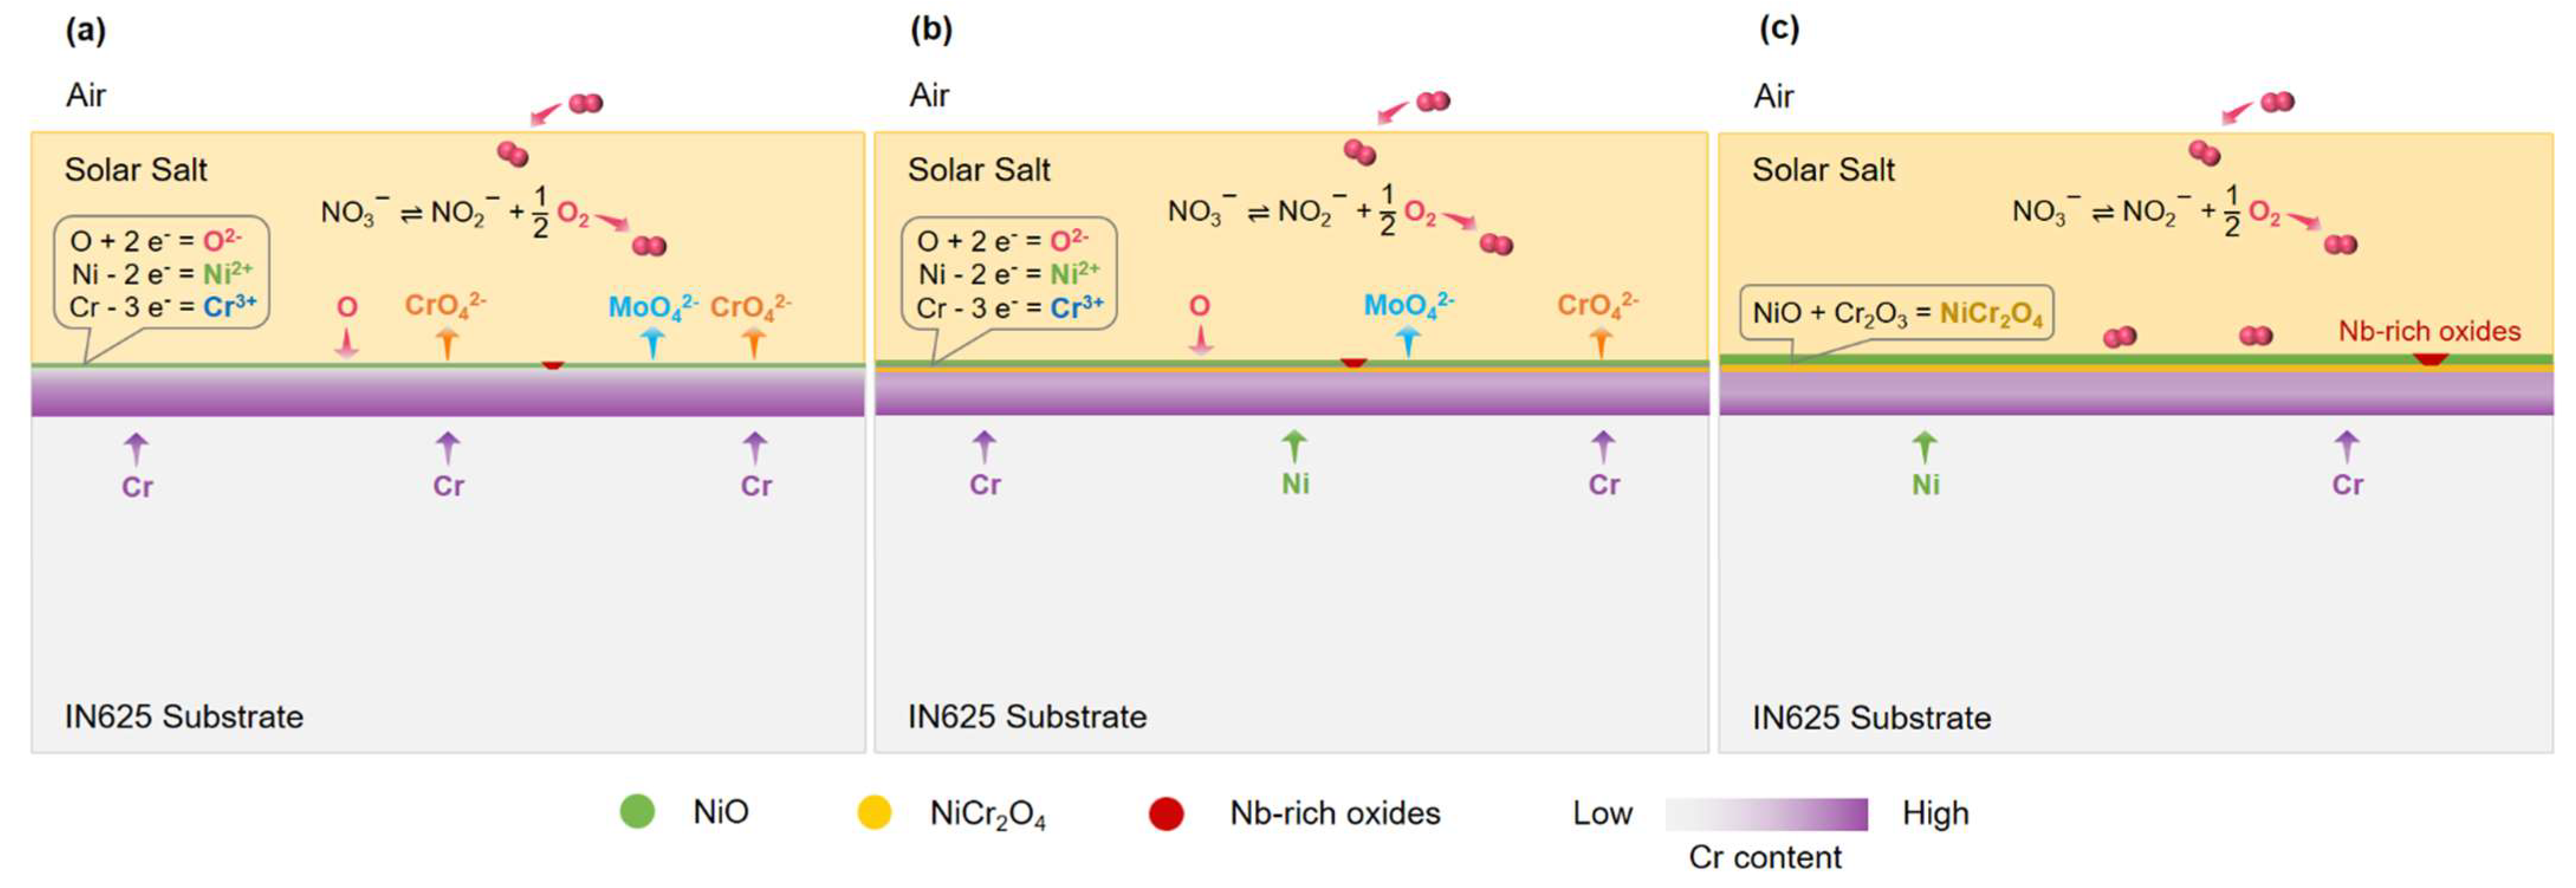
4.3. Corrosion Mechanism of IN625 Alloy
5. Summary and Conclusions
- (1)
- During 15 days of immersion test, IN625 shows the best corrosion resistance with the lowest corrosion rate (2.27 μm/a), followed by P91 (31.84 μm/a) and 304SS (72.16 μm/a). For longer-term immersion, 304SS is expected to be more corrosion-resistant than P91, and the latter may face a risk of breakaway corrosion.
- (2)
- The oxide scale on P91 is composed of an outer iron oxide layer, an inner iron oxide layer, and an intermediate mixed Fe-Cr spinel layer in which Fe-Cr spinel is discontinuous due to less outward diffusion of chromium from the parent alloy. Other low-chromium alloys are expected to exhibit a similar corrosion behavior and are not recommended for direct use as TES components.
- (3)
- 304SS suffered significant dissolution of chromium and rapid growth of iron oxides in the initial period of the immersion test. After early fluctuation, the newly formed oxide scale became thinner and more compact with a duplex structure (Fe2O3 as an outer layer and FeCr2O4 as an inner layer). The corrosion resistance of 304SS is remarkably improved due to the formation of a continuous Fe-Cr spinel layer.
- (4)
- IN625 experienced evident mass loss due to the dissolution of chromium at the beginning. After forming a continuous NiO layer, the dissolution phenomenon was mitigated. Further, Ni-Cr spinel inner layer effectively impeded the internal oxidation. However, pitting corrosion took place in Nb-rich regions which need special attention to avoid local failure.
- (5)
- For P91, oxidation and dissolution of chromium are supposed to occur simultaneously. For 304SS and IN625, rapid dissolution of chromium could cause evident mass loss and change surface structure/composition. Since iron alloys are more economical than nickel alloys, with some surface treatments, e.g., reducing the superficial content of chromium for 304SS or depositing compact and resistant coating (such as Ni-based materials) on P91, the iron alloys may be the superior choice for TES components.
Author Contributions
Funding
Data Availability Statement
Acknowledgments
Conflicts of Interest
References
- Fernández, A.G.; Gomez-Vidal, J.; Oró, E.; Kruizenga, A.; Solé, A.; Cabeza, L.F. Mainstreaming commercial CSP systems: A technology review. Renew. Energy 2019, 140, 152–176. [Google Scholar] [CrossRef]
- Islam, M.T.; Huda, N.; Abdullah, A.B.; Saidur, R. A comprehensive review of state-of-the-art concentrating solar power (CSP) technologies: Current status and research trends. Renew. Sustain. Energy Rev. 2018, 91, 987–1018. [Google Scholar] [CrossRef]
- Gil, A.; Medrano, M.; Martorell, I.; Lázaro, A.; Dolado, P.; Zalba, B.; Cabeza, L.F. State of the art on high temperature thermal energy storage for power generation. Part 1—Concepts, materials and modellization. Renew. Sustain. Energy Rev. 2010, 14, 31–55. [Google Scholar] [CrossRef]
- Palacios, A.; Barreneche, C.; Navarro, M.; Ding, Y. Thermal energy storage technologies for concentrated solar power—A review from a materials perspective. Renew. Energy 2020, 156, 1244–1265. [Google Scholar] [CrossRef]
- Tian, Y.; Zhao, C. A review of solar collectors and thermal energy storage in solar thermal applications. Appl. Energy 2013, 104, 538–553. [Google Scholar] [CrossRef]
- Giaconia, A.; Tizzoni, A.C.; Sau, S.; Corsaro, N.; Mansi, E.; Spadoni, A.; Delise, T. Assessment and Perspectives of Heat Transfer Fluids for CSP Applications. Energies 2021, 14, 7486. [Google Scholar] [CrossRef]
- Bhatnagar, P.; Siddiqui, S.; Sreedhar, I.; Parameshwaran, R. Molten salts: Potential candidates for thermal energy storage applications. Int. J. Energy Res. 2022, 46, 17755–17785. [Google Scholar] [CrossRef]
- Vignarooban, K.; Xu, X.; Arvay, A.; Hsu, K.; Kannan, A. Heat transfer fluids for concentrating solar power systems—A review. Appl. Energy 2015, 146, 383–396. [Google Scholar] [CrossRef]
- Mehos, M.; Turchi, C.; Vidal, J.; Wagner, M.; Ma, Z.; Ho, C.; Kolb, W.; Andraka, C.; Kruizenga, A. Concentrating Solar Power Gen3 Demonstration Roadmap; No. NREL/TP-5500-67464; National Renewable Energy Lab. (NREL): Golden, CO, USA, 2017. [Google Scholar]
- Pacheco, J.E.; Bradshaw, R.W.; Dawson, D.B.; De la Rosa, W.; Gilbert, R.; Goods, S.H.; Hale, M.J.; Jacobs, P.; Jones, S.A.; Kolb, G.J.; et al. Final Test and Evaluation Results from the Solar Two Project; No. SAND2002-0120; Sandia National Lab. (SNL-NM): Albuquerque, NM, USA; Sandia National Lab. (SNL-CA): Livermore, CA, USA, 2002. [Google Scholar]
- Ma, L.; Zhang, C.; Wu, Y.; Lu, Y. Comparative review of different influence factors on molten salt corrosion characteristics for thermal energy storage. Sol. Energy Mater. Sol. Cells 2022, 235, 111485. [Google Scholar] [CrossRef]
- Tortorelli, P.F.; Bishop, P.S.; DiStefano, J.R. Selection of Corrosion-Resistant Materials for Use in Molten Nitrate Salts; No. ORNL/TM-11162; Oak Ridge National Lab.: Oak Ridge, TN, USA, 1989. [Google Scholar]
- Ruiz-Cabañas, F.J.; Prieto, C.; Madina, V.; Fernández, A.I.; Cabeza, L.F. Materials selection for thermal energy storage systems in parabolic trough collector solar facilities using high chloride content nitrate salts. Sol. Energy Mater. Sol. Cells 2017, 163, 134–147. [Google Scholar] [CrossRef]
- Baraka, A.; Abdel-Rohman, A.I.; Hosary, A.A.E. Corrosion of mild steel in molten sodium nitrate–potassium nitrate eutectic. Br. Corros. J. 1976, 11, 44–46. [Google Scholar] [CrossRef]
- García-Martín, G.; Lasanta, M.; Encinas-Sánchez, V.; de Miguel, M.; Pérez, F. Evaluation of corrosion resistance of A516 Steel in a molten nitrate salt mixture using a pilot plant facility for application in CSP plants. Sol. Energy Mater. Sol. Cells 2017, 161, 226–231. [Google Scholar] [CrossRef]
- Ruiz-Cabañas, F.J.; Prieto, C.; Osuna, R.; Madina, V.; Fernández, A.I.; Cabeza, L.F. Corrosion testing device for in-situ corrosion characterization in operational molten salts storage tanks: A516 Gr70 carbon steel performance under molten salts exposure. Sol. Energy Mater. Sol. Cells 2016, 157, 383–392. [Google Scholar] [CrossRef]
- Nieto-Maestre, J.; Muñoz-Sánchez, B.; Fernández, A.G.; Faik, A.; Grosu, Y.; García-Romero, A. Compatibility of container materials for Concentrated Solar Power with a solar salt and alumina based nanofluid: A study under dynamic conditions. Renew. Energy 2020, 146, 384–396. [Google Scholar] [CrossRef]
- Fernández, A.; Galleguillos, H.; Fuentealba, E.; Pérez, F. Corrosion of stainless steels and low-Cr steel in molten Ca(NO3)2–NaNO3–KNO3 eutectic salt for direct energy storage in CSP plants. Sol. Energy Mater. Sol. Cells 2015, 141, 7–13. [Google Scholar] [CrossRef]
- Dorcheh, A.S.; Galetz, M. Slurry aluminizing: A solution for molten nitrate salt corrosion in concentrated solar power plants. Sol. Energy Mater. Sol. Cells 2016, 146, 8–15. [Google Scholar] [CrossRef]
- Encinas-Sánchez, V.; de Miguel, M.; Lasanta, M.; García-Martín, G.; Perez-Trujillo, F.J. Electrochemical impedance spectroscopy (EIS): An efficient technique for monitoring corrosion processes in molten salt environments in CSP applications. Sol. Energy Mater. Sol. Cells 2019, 191, 157–163. [Google Scholar] [CrossRef]
- Mallco, A.; Pineda, F.; Mendoza, M.; Henriquez, M.; Carrasco, C.; Vergara, V.; Fuentealba, E.; Fernandez, A.G. Evaluation of flow accelerated corrosion and mechanical performance of martensitic steel T91 for a ternary mixture of molten salts for CSP plants. Sol. Energy Mater. Sol. Cells 2022, 238, 111623. [Google Scholar] [CrossRef]
- Pineda, F.; Walczak, M.; Vilchez, F.; Guerra, C.; Escobar, R.; Sancy, M. Evolution of corrosion products on ASTM A36 and AISI 304L steels formed in exposure to molten NaNO3–KNO3 eutectic salt: Electrochemical study. Corros. Sci. 2022, 196, 110047. [Google Scholar] [CrossRef]
- Gomes, A.; Navas, M.; Uranga, N.; Paiva, T.; Figueira, I.; Diamantino, T. High-temperature corrosion performance of austenitic stainless steels type AISI 316L and AISI 321H, in molten Solar Salt. Sol. Energy 2019, 177, 408–419. [Google Scholar] [CrossRef]
- Ma, L.; Zhang, C.; Wu, Y.; Lu, Y.; Ma, C. Dynamic corrosion behavior of 316L stainless steel in quaternary nitrate-nitrite salts under different flow rates. Sol. Energy Mater. Sol. Cells 2020, 218, 110821. [Google Scholar] [CrossRef]
- Gao, Q.; Lu, Y.; Yu, Q.; Wu, Y.; Zhang, C.; Zhi, R. High-temperature corrosion behavior of austenitic stainless steel in quaternary nitrate molten salt nanofluids for concentrated solar power. Sol. Energy Mater. Sol. Cells 2022, 245, 111851. [Google Scholar] [CrossRef]
- Elbakhshwan, M.; Lee, D.H.; Anderson, M. Corrosion resistance of high nickel alloys in solar salt at 600 °C for up to 4000 h. Sol. Energy Mater. Sol. Cells 2022, 245, 111837. [Google Scholar] [CrossRef]
- Palacios, A.; Navarro, M.E.; Jiang, Z.; Avila, A.; Qiao, G.; Mura, E.; Ding, Y. High-temperature corrosion behaviour of metal alloys in commercial molten salts. Sol. Energy 2020, 201, 437–452. [Google Scholar] [CrossRef]
- Gomez-Guzman, N.B.; Lopez-Dominguez, D.; Arrieta-Gonzalez, C.D.; Mayen, J.; Porcayo-Palafox, E.; Chacon-Nava, J.G.; Gonzalez-Rodriguez, J.G.; Porcayo-Calderon, J.; Rodriguez-Diaz, R.A. Behavior of Ni20Cr Alloy in Molten Nitrate Salts. Int. J. Mol. Sci. 2022, 23, 7895. [Google Scholar] [CrossRef]
- Liu, C.; Tang, X.; Cheng, L.; Leng, B.; Li, X.; Ye, X.-X.; Huang, H. The characterization of corrosion layers of GH3535 and Inconel 625 alloys in molten KNO3-NaNO3 salts at 500 °C. Corros. Sci. 2022, 204, 110406. [Google Scholar] [CrossRef]
- Dorcheh, A.S.; Durham, R.N.; Galetz, M.C. Corrosion behavior of stainless and low-chromium steels and IN625 in molten nitrate salts at 600 °C. Sol. Energy Mater. Sol. Cells 2016, 144, 109–116. [Google Scholar] [CrossRef]
- Prieto, C.; Ruiz-Cabañas, F.J.; Madina, V.; Fernández, A.I.; Cabeza, L.F. Corrosion performance of alloy 800H and alloy 625 for potential use as molten salts solar receiver materials in concentrating solar power tower plants. J. Energy Storage 2022, 55, 105824. [Google Scholar] [CrossRef]
- Teeter, L.; Adam, B.; Wood, T.; Tucker, J. Comparison of the corrosion of materials in supercritical carbon dioxide, air, and argon environments. Corros. Sci. 2021, 192, 109752. [Google Scholar] [CrossRef]
- Kuang, W.; Wu, X.; Han, E.-H. The oxidation behaviour of 304 stainless steel in oxygenated high temperature water. Corros. Sci. 2010, 52, 4081–4087. [Google Scholar] [CrossRef]
- Jafari, R.; Sadeghi, E. High-temperature corrosion performance of HVAF-sprayed NiCr, NiAl, and NiCrAlY coatings with alkali sulfate/chloride exposed to ambient air. Corros. Sci. 2019, 160, 108066. [Google Scholar] [CrossRef]
- Meißner, T.M.; Oskay, C.; Bonk, A.; Grégoire, B.; Donchev, A.; Solimani, A.; Galetz, M.C. Improving the corrosion resistance of ferritic-martensitic steels at 600 °C in molten solar salt via diffusion coatings. Sol. Energy Mater. Sol. Cells 2021, 227, 111105. [Google Scholar] [CrossRef]
- Summers, K.L.; Chidambaram, D. Corrosion Behavior of Structural Materials for Potential Use in Nitrate Salts Based Solar Thermal Power Plants. J. Electrochem. Soc. 2017, 164, H5357–H5363. [Google Scholar] [CrossRef]
- Walczak, M.; Pineda, F.; Fernández, G.; Mata-Torres, C.; Escobar, R.A. Materials corrosion for thermal energy storage systems in concentrated solar power plants. Renew. Sustain. Energy Rev. 2018, 86, 22–44. [Google Scholar] [CrossRef]
- Standard, ASTM. Standard Practice for Preparing, Cleaning, and Evaluating Corrosion Test Specimens; American Society for Testing and Materials G1-03; ASTM International: West Conshohocken, PA, USA, 2011. [Google Scholar]
- Zhang, X.; Zhang, C.; Wu, Y.; Lu, Y. Experimental research of high temperature dynamic corrosion characteristic of stainless steels in nitrate eutectic molten salt. Sol. Energy 2020, 209, 618–627. [Google Scholar] [CrossRef]
- Rapp, R.A.; Goto, K.S. The hot corrosion of metals by molten salts. ECS Proc. Vol. 1981, 10, 159–177. [Google Scholar] [CrossRef]
- Vanysek, P. Electrochemical series. In CRC Handbook of Chemistry and Physics, 87th ed.; CRC Press: Boca Raton, FL, USA, 1998. [Google Scholar]
- University of Cambridge Website. The Interactive Ellingham Diagram. Available online: https://www.doitpoms.ac.uk (accessed on 24 October 2022).
- Liu, Q.; Barker, R.; Wang, C.; Qian, J.; Neville, A.; Pessu, F. The corrosion behaviour of stainless steels and Ni-based alloys in nitrate salts under thermal cycling conditions in concentrated solar power plants. Sol. Energy 2022, 232, 169–185. [Google Scholar] [CrossRef]
- Parizia, S.; Marchese, G.; Rashidi, M.; Lorusso, M.; Hryha, E.; Manfredi, D.; Biamino, S. Effect of heat treatment on microstructure and oxidation properties of Inconel 625 processed by LPBF. J. Alloys Compd. 2020, 846, 156418. [Google Scholar] [CrossRef]
- Hu, H.; Zhou, Z.; Li, M.; Zhang, L.; Wang, M.; Li, S.; Ge, C. Study of the corrosion behavior of a 18Cr-oxide dispersion strengthened steel in supercritical water. Corros. Sci. 2012, 65, 209–213. [Google Scholar] [CrossRef]
- Gurr, M.; Bau, S.; Burmeister, F.; Wirth, M.; Piedra-Gonzalez, E.; Krebser, K.; Preußner, J.; Pfeiffer, W. Investigation of the corrosion behavior of NiVAl multilayer coatings in hot salt melts. Surf. Coat. Technol. 2015, 279, 101–111. [Google Scholar] [CrossRef]
- Jonsson, T.; Pujilaksono, B.; Heidari, H.; Liu, F.; Svensson, J.-E.; Halvarsson, M.; Johansson, L.-G. Oxidation of Fe–10Cr in O2 and in O2+H2O environment at 600 °C: A microstructural investigation. Corros. Sci. 2013, 75, 326–336. [Google Scholar] [CrossRef]
- Xie, W.; Ding, J.; Wei, X.; Wang, W.; Xia, G.; Xing, J. Corrosion Resistance of Stainless Steel and Pure Metal in Ternary Molten Nitrate for Thermal Energy Storage. Energy Procedia 2019, 158, 4897–4902. [Google Scholar] [CrossRef]
- Sötz, V.A.; Bonk, A.; Forstner, J.; Bauer, T. Microkinetics of the reaction NO3- ⇌ NO2- + 0.5 O2 in molten sodium nitrate and potassium nitrate salt. Thermochim. Acta 2019, 678, 178301. [Google Scholar] [CrossRef]
- Flood, H.; Förland, T. The acidic and basic properties of oxides. Acta Chem. Scand. 1947, 1, 592–606. [Google Scholar] [CrossRef] [PubMed]
- Birks, N.; Meier, G.H.; Pettit, F.S. Introduction to the High-Temperature Oxidation of Metals; Cambridge University Press: Cambridge, UK, 2006; pp. 75–100. [Google Scholar]
- Olivares, R.I. The thermal stability of molten nitrite/nitrates salt for solar thermal energy storage in different atmospheres. Sol. Energy 2012, 86, 2576–2583. [Google Scholar] [CrossRef]


| Salt Composition (in wt.%) | Melting Point (°C) | Stability Limit (°C) | Heat Capacity (J/g/K) | Thermal Conductivity (W/m/K) | Density (kg/L) |
|---|---|---|---|---|---|
| NaNO3 (60)-KNO3 (40) | 220 | 600 | 1.52 | 0.55 | 1.71 |
| NaNO3 (7)-KNO3 (53)-NaNO2 (40) | 142 | 535 | 1.56 | 0.2 | 1.69 |
| NaNO3 (7)-KNO3 (45)-Ca(NO3)2 (48) | 120 | 500 | 1.45 | 0.52 | 1.83 |
| Li2CO3 (32.1)-Na2CO3 (33.4)-K2CO3 (34.5) | 398 | 800–850 | 1.61 | - | 2.00 |
| NaCl (7.5)-KCl (23.9)-ZnCl2 (68.6) | 204 | 850 | 0.81 | 0.325 | 2.40 |
| Alloy | Fe | Cr | Ni | Mo | Mn | Si | Nb | C | Al | Co |
|---|---|---|---|---|---|---|---|---|---|---|
| P91 | Bal. | 9.00 | 0.20 | 0.96 | 0.50 | 0.42 | 0.09 | 0.10 | - | - |
| 304SS | Bal. | 19.28 | 9.06 | - | 2.00 | 1.00 | - | 0.08 | - | - |
| IN625 | 5.00 | 21.88 | Bal. | 8.75 | 0.50 | 0.50 | 3.94 | 0.10 | 0.40 | 1.00 |
| Salt | Purity | Sulfate | Nitrite | Calcium | Magnesium | Total Chlorine |
|---|---|---|---|---|---|---|
| NaNO3 | 99.4 | <0.003 | <0.0005 | 0.003 | - | <0.0015 |
| KNO3 | 99.6 | 0.003 | 0.001 | 0.004 | 0.0002 | 0.003 |
| Region | Fe | Cr | O | Ca | Mn | Si | C | Fe/Cr |
|---|---|---|---|---|---|---|---|---|
| 1 | 83.82 | 8.47 | 0.97 | 0.09 | 0.45 | 0.41 | 5.79 | 9.90 |
| 2 | 76.33 | 5.93 | 16.04 | 0.23 | 0.93 | 0.54 | - | 12.87 |
| 3 | 87.66 | 8.23 | 3.13 | - | 0.50 | 0.48 | - | 10.65 |
| 4 | 73.73 | 5.74 | 19.25 | 0.15 | 0.74 | 0.39 | - | 12.84 |
| 5 | 71.65 | 5.74 | 21.13 | 0.42 | 0.62 | 0.44 | - | 12.48 |
| 6 | 70.91 | 1.60 | 26.23 | 0.81 | - | 0.45 | - | 44.32 |
| Region | Fe | Cr | O | Ni | Mn | Si | Ca | Na | Mg | C | Fe/Cr |
|---|---|---|---|---|---|---|---|---|---|---|---|
| 1 | 67.15 | 17.54 | 1.37 | 7.24 | 1.34 | 0.42 | - | - | - | 4.94 | 3.83 |
| 2 | 70.76 | 5.76 | 12.98 | 4.10 | 0.40 | 1.08 | 0.14 | - | 0.08 | 4.70 | 12.28 |
| 3 | 65.96 | 1.89 | 27.04 | - | 0.48 | 0.26 | 0.65 | - | 0.22 | 3.50 | 34.90 |
| 4 | 60.76 | 4.74 | 26.29 | 2.39 | 1.02 | 0.21 | 0.24 | - | 0.30 | 4.05 | 12.82 |
| 5 | 71.19 | 6.18 | 12.90 | 3.47 | 0.41 | 0.69 | 0.07 | - | 0.21 | 4.88 | 11.52 |
| 6 | 63.67 | 1.85 | 26.22 | - | 0.27 | 0.19 | 1.18 | 1.57 | 0.20 | 4.85 | 34.42 |
| 7 | 57.98 | 4.76 | 27.50 | 1.91 | 1.35 | 0.20 | 0.13 | - | 0.06 | 6.11 | 12.18 |
| 8 | 54.04 | 1.61 | 35.72 | - | 0.07 | 0.20 | 0.71 | - | 0.13 | 7.52 | 33.57 |
| 9 | 49.09 | 1.55 | 37.13 | - | 0.62 | 0.20 | 2.56 | 1.82 | 0.12 | 6.81 | 31.67 |
| 10 | 59.47 | 2.20 | 25.77 | 0.96 | 1.12 | - | 2.24 | 3.14 | - | 5.10 | 27.03 |
| Region | Ni | Cr | O | Mo | Fe | Nb | Ca | Na | Si |
|---|---|---|---|---|---|---|---|---|---|
| 1 | 60.08 | 16.69 | 7.71 | 5.74 | 4.38 | 5.01 | - | - | 0.39 |
| 2 | 58.85 | 14.91 | 9.35 | 5.13 | 5.08 | 5.67 | 0.23 | - | 0.78 |
| 3 | 57.85 | 10.79 | 13.43 | 3.84 | 5.66 | 7.78 | - | - | 0.65 |
| 4 | 54.59 | 10.38 | 20.93 | 4.85 | 4.46 | 4.79 | - | - | - |
| 5 | 15.41 | 1.17 | 32.65 | - | 4.00 | 32.26 | 9.61 | 4.90 | - |
Disclaimer/Publisher’s Note: The statements, opinions and data contained in all publications are solely those of the individual author(s) and contributor(s) and not of MDPI and/or the editor(s). MDPI and/or the editor(s) disclaim responsibility for any injury to people or property resulting from any ideas, methods, instructions or products referred to in the content. |
© 2023 by the authors. Licensee MDPI, Basel, Switzerland. This article is an open access article distributed under the terms and conditions of the Creative Commons Attribution (CC BY) license (https://creativecommons.org/licenses/by/4.0/).
Share and Cite
Li, N.; Tariq, N.u.H.; Han, B.; He, R.; Wang, J.; Cui, X.; Xiong, T. Study of Corrosion Performance and Mechanisms of P91, 304SS and IN625 Alloys in Molten Nitrate Salts Used for Thermal Energy Storage System. Metals 2023, 13, 806. https://doi.org/10.3390/met13040806
Li N, Tariq NuH, Han B, He R, Wang J, Cui X, Xiong T. Study of Corrosion Performance and Mechanisms of P91, 304SS and IN625 Alloys in Molten Nitrate Salts Used for Thermal Energy Storage System. Metals. 2023; 13(4):806. https://doi.org/10.3390/met13040806
Chicago/Turabian StyleLi, Ning, Naeem ul Haq Tariq, Botao Han, Rui He, Jiqiang Wang, Xinyu Cui, and Tianying Xiong. 2023. "Study of Corrosion Performance and Mechanisms of P91, 304SS and IN625 Alloys in Molten Nitrate Salts Used for Thermal Energy Storage System" Metals 13, no. 4: 806. https://doi.org/10.3390/met13040806