Article

Microstructural and Texture Evolution of Pearlite-Drawn Wires for Flexible Marine Pipelines: Investigating the Effect of Heat Treatments on Mechanical Properties

by
Pedro H. Pinheiro
1,
Mohammad Masoumi
1,2,
Luís Flávio G. Herculano
1,
João Victor B. Xavier
1,
Samille Kricia B. de Lima
1,
Eden S. Silva
3,
Gedeon S. Reis
3,
Samuel F. Rodrigues
1,3,* and
Hamilton F. Gomes de Abreu
1
1
Materials Characterization Laboratory (LACAM), Department of Metallurgical and Materials Engineering, Federal University of Ceará, Campus Do Pici, Bloco 729, Fortaleza 60020-181, Brazil
2
Center of Engineering, Modelling and Applied Social Sciences, Federal University of ABC, Santo André 09210-580, Brazil
3
Graduate Program in Materials Engineering, Federal Institute of Maranhão, São Luís 65075-441, Brazil
*
Author to whom correspondence should be addressed.
Metals 2023, 13(4), 805; https://doi.org/10.3390/met13040805
Submission received: 27 March 2023 / Revised: 13 April 2023 / Accepted: 19 April 2023 / Published: 20 April 2023

Abstract

:
Flexible pipelines connect offshore platforms to subsea production systems due to their high flexibility, applicability, and recycling. Flexible armor layers in flexible pipelines are constructed using the parallel helical wrapping of several rectangular wires. The complex stress modes to which pipelines are subjected provide complex failure modes that are mostly unpredictable, requiring expensive pipeline integrity verification methods. This work investigates texture and microstructure evolution in pearlite-drawn wires due to different heat treatments. The material was subjected to annealing and isothermal heat treatments to obtain changes in its microstructure and texture. The changes were characterized using SEM, XRD, and EBSD techniques. Samples were subjected to tensile testing to evaluate their mechanical properties. This work revealed that annealing and isothermal treatments mainly modify the material microstructure, whereas annealing provides a material with grains with ease of deformation. In contrast, isothermal treatment provides grain growth with high internal energy and more deformation resistance. Annealing increases the intensity of all texture components, while isothermal treatment reduces intensity. These findings provide insights into the relationship between material properties and heat treatments, which can be used to optimize the design and performance of flexible pipelines, thereby reducing the need for expensive integrity verification methods.

1. Introduction

Research on pearlitic cold-drawn steel wires over the years has become essential for the development of this kind of material for a variety of applications. These wires present ultra-high strength and ductility, which make them suitable for use as cables for engineering structures, such as suspension for bridges, and for automotive tires cords, springs and so on. The literature has reported that steel wires can achieve very high strength, which makes this material a prominent product [1]. For the manufacturing process of steel wires, hot-rolled bars are subjected to isothermal transformation of the austenitic phase at temperatures of 480–550 °C (patenting process) and drawn [2,3].
After the production process, the metal structure normally presents a very fine lamellar pearlite, with interlamellar spacing less than 150 nm. Therefore, the steel undergoes cold-drawing, in a process of severe plastic deformation, gradually ensuring its strength. Studies have been conducted in order to understand the microstructural evolution and its effects on strength through cold-drawing [4]. Meanwhile, in some kinds of engineering applications, such as power cables and suspension bridges, the produced wires pass through hot-dip galvanizing or black oxidation to improve their corrosion properties [5,6]. Other factors such as thermal stability and the microstructural mechanisms associated with heat treatment of drawn wires are also considered by industry and academia [7].
In general, strong and ductile steel wires are desired, mainly because this last property is essential to prevent abrupt failure of the material under operation. However, when subjected to the cold-drawing process, the wire strength is increased, while ductility concurrently deteriorates. As the drawing tension is increased, the radius of the wire as well as the interlamellar spacing of perlite plates in the microstructure decrease. In this way, the wire strength increases as consequence of smaller interlamellar spacing (following the Hall–Petch relationship) [8]. On the contrary, the ductility of the wire drops due to great restrictions on cementite layer displacements. Some exceptions happen only for wires with high drawing tension [9,10,11,12]. One explanation for such a behavior is that the cementite lamella thickness may be less than 1 nm [11], and fine cementite presents some ductility due to its size effect [13].
Heat treatment can be used to control the mechanical properties by adjusting the microstructure of a wire. It has been reported that a wire’s strength is slightly increased when annealing at low temperatures is employed [6,14,15], but its ductility is reduced [6]. On the other hand, the wire’s strength drops and its ductility is increased at higher temperatures. For instance, a wire with a drawn strength of 6.35 GPa suffers from deteriorated ductility as the temperature increases above 350 °C [16]. When subjected to low-temperature annealing, the wires experience static strain aging (SSA) and microstructure recovery, while at higher temperatures, mechanisms of recrystallization, cementite and ferrite grain growth are favored [17]. However, the microstructure change in wires annealed at low temperatures is difficult to observe through transmission electron microscopy (TEM) [5,16,17], even though the stress (yield stress) may have apparently varied. By means of positron annihilation spectroscopy (PAS), researchers reported that at low temperatures of up to 523 K, the annihilation of carbon vacancy complexes (single or perhaps di-vacancies) is prone to happen, and carbon atoms can diffuse to grain boundaries, interface boundaries, or dislocations [18,19].
It appears that improving both the strength and ductility of wires is a great challenge. However, it has been found that these antagonistic properties in a moderately drawn wire (ε = 2) were slightly improved under low-temperature annealing [20,21]. It is inferred that the increased strength results from the decoration of cementite nanograins on ferrite dislocations, and the increased ductility may originate from unaccomplished recovery when the microstructure of the material remains lamellar. However, the possible strategies for achieving a strength–ductility balance are not explicitly detailed, as attention has been given to other important topics such as cementite crystallization [20] and the torsion property of pearlitic wires [21]. So, the plasticity mechanism and strengthening of cold-drawn pearlitic wires under the annealing process is still not fully understood to date.
Recently, atomistic simulations have been carried out in order to explain the microstructural evolution and mechanical mechanisms of pearlite wires [22,23]. Using molecular statics (MS), the carbon atom and screw or edge dislocations’ binding energy in BCC iron were computed on an atomic scale. The results presented quantitative agreement with elasticity theory [24].
Leão et al. [25] investigated microstructural issues during the manufacturing of flat pearlitic steel wires for tensile armor application. Patenting and cold deformation provided great refinement of pearlite blocks. The study presented the effects of different lab simulated processes on the crack susceptibility of pearlitic steel under different process routes for tensile armor employment. Zhang et al. [26] studied the relationship between the microstructural parameters and mechanical properties of eutectoid steels, prioritizing the impact toughness and nucleation growth mechanism of pearlite colonies, concluding that prior austenite grain size has little or no influence on impact toughness. This study also revealed that pearlite colony size remains constant with changes in austenitizing temperature. This phenomenon occurs because the pearlite colonies randomly nucleate at the grain boundary and grow into the interior of the grains. These nucleation sites increase the chance of the growing pearlite colonies colliding with each other, resulting in consistent sizes of these colonies.
Cai et al. [27] investigated the effects of strain on the microstructure and mechanical properties in pearlitic steels, considering thermal simulation, SEM, HRTEM and EBSD. This study revealed that higher strain rates promote spheroidization of cementite, decreasing the yield and tensile strengths of the steel, while the total elongation increased as the deformation strain increased. Masoumi et al. [28] pointed out that changes occurred during the coiling and uncoiling processes, mainly an increase in strength due to the cementite thinning/fragmentation and texture changes. The study revealed that the fragilization promoted by {001} grains with a low Taylor factor promoted grain fragmentation and micro-crack formation in these brittle orientations.
Yang et al. [29] studied the microstructural evolution of cold-rolled pearlitic steel under EBSD and XRD. This study showed the increase in mechanical properties coupled with the increase in the KAM angle, concluding that the main strengthening mechanism for rolling is dislocation strengthening.
A multiscale simulation and atomistic calculations of a discrete diffusion model were proposed to explain the cementite composition mechanism during wire drawing [30]. The results favor the so-called “dragging mechanism,” whereby a mobile screw dislocation is capable of transporting carbon atoms along its slip plane and shows good agreement with carbon concentration data in ferrite from APT analysis [31]. MD simulations were also performed to investigate the inadequate dislocations at ferrite/cementite interfaces and for various orientation relationships (ORs), and the most likely ORs in pearlite steel were provided by this analysis [32]. Through aberration-corrected MET imaging analysis (CAMET) and density functional theory (DFT), it was discovered that the interface with the Fe-C-Fe end layer in cementite has the lowest energy, due to the formation of interfacial Fe-C bonds [33]. Despite these advances, here, for the first time, investigations of the texture evolution and microstructure trends of this specific pearlitic drawn wire were carried out. These were performed on the as-received, after annealing, and isothermal heat-treated samples of the investigated material. To consolidate the results, the mechanical properties of the metal were explored by means of tensile experiments. In the following sections, the findings—which can serve as tools to improve the design and performance of flexible pipelines—are presented.

2. Materials and Methods

Cold-rolled and drawn pearlitic rods were studied in this work. The dimensions of the material examined in cross-sectional and longitudinal sections are 6 × 14 mm2 and 6 × 10 mm2, respectively. The chemical composition of the samples was obtained using a Shimadzu PDA-7000 optical emission spectrometer.
The study material underwent subcritical annealing and isothermal heat treatments similar to patenting, as described below. Subcritical annealing consisted of heating the material, held for 2 h at 700 °C, followed by quenching in water. This annealing was performed below the A1 (AC1) line so that the material did not undergo austenitization. A temperature of 700 °C was chosen to promote carbon diffusion and a change in the morphology of its aggregates (from acicular to semi-spheroidized). To minimize changes in grain size, a two-hour time was established for this treatment. The sample is referred to as REC.
The isothermal treatment was performed by austenitizing the material at 1100 °C, which is standardized for this type of treatment, for 5 min, which was estimated based on the time–temperature–austenitization (TTA) curve of this material. This step is necessary to heat the sample to the specified temperature and to maintain the temperature for homogenization of the austenite grains, followed by an isothermal bath in salt at 550 °C for 200 s. The salt is composed of 60% KNO3 and 40% NaNO3. The high austenitization temperature ensures that little time is required for austenitization and homogenization of the austenite in the material. The sample is referred to as ISO.
Above the A3 line, proeutectoid ferritic grains transform into austenite, initiating the growth of austenitic grains. However, the austenitic grains are not homogeneous, which increases the likelihood of nucleation and precipitation of undissolved carbides in the microstructure, rather than the lamellar pearlitic structures that occur more easily from homogeneous austenite. After a certain time above the A3 (AC3) line, grain homogenization occurs, as observed in the TTA graph.
The homogenized samples above A3 are then subjected to a salt bath at 550 °C for 200 s, followed by water quenching. These diagrams were obtained using the JMAT Pro software (Version 3.0.2, Sente Software Ltd., Guildford, UK), which provides the composition (wt.%) of the material and the temperature at which the material is to be austenitized. The curves obtained are simulated from the extensive database of the program, simulating the curves from a wide range of material properties for alloys, especially for multicomponent alloys used in industrial practice [34].
The temperature for isothermal transformation (550 °C) was defined according to the manufacturer’s specifications to obtain fine pearlite (the lamellae thickness was found to be below 100 nm) [35]. Therefore, the required temperature was in the temperature range below the knee of the pearlite curve. As observed by Dikic et al. [36], lower temperature transformations stabilize bainite at grain boundaries.
Samples for microstructural analysis were prepared using the standard metallographic preparation method, which involves grinding with SiC paper and subsequent polishing with a 6, 3, and 1 μm diamond suspension. The samples were then etched with 4% Nital for 4–5 s. Microstructural observations were conducted using FEI® Quanta 450 and FEI® Quanta 650 field emission gun scanning electron microscopes, coupled with electron backscatter diffraction (EBSD) detectors, with step size scan grit of 38.8 nm (EBSD). The obtained images were subsequently analyzed using Fiji ImageJ® software [37]. Post-processing EBSD data were analyzed with the software HKL-Channel 5 (Tango) and ATEX ©, and the grain definition was in accordance with ISO 13067:2011 for measurement of the average grain size in EBSD [38].
X-ray diffraction measurements were performed on the cross-sectional area of the samples (SiC paper 400–1200 mesh) using a Philips® XPert Pro diffractometer in scan mode, with a step size of 0.015°, a time per step of 1.5 s, and an angle range of 45–105°. CoKα radiation (0.1789 nm) was used at 40 kV and 45 mA, with a monochromator.
Regarding Rietveld refinement, the density of dislocations (δ), microstrain (ε), and crystallite size (t) were estimated from the diffractograms using the Debye–Scherer relationship [39] combined with the Stoke–Wilson formula [40]. The necessary parameters for the equations (FWHM, diffraction angle) were obtained by refinement through the GSAS-II® software. The density of dislocations (δ) was calculated using Equation (1):
δ = 1 t 2 ,
where t is the crystallite size associated with the diffraction angle relationship and peak curvature, as shown in the Debye–Scherer relationship [40] in Equation (2):
t = 0.92 λ β c o s θ ,
where λ is the wavelength of X-rays, β is the full width at half maximum of the peak (FWHM), and θ is the X-ray diffraction angle in degrees. The microstrain was calculated from the Stoke–Wilson formula, as shown in Equation (3):
ε = β 4 t a n θ ,
To evaluate the mechanical properties, tensile tests were carried out in accordance with ASTM E8, [41], which defines the parameters for this test. The dimensions of the samples are in accordance with the “subsize specimen” classification (55 mm × 3 mm × 1.5 mm). The tests were performed at a deformation rate of 0.005 mm/s using a universal testing machine (MTS®).
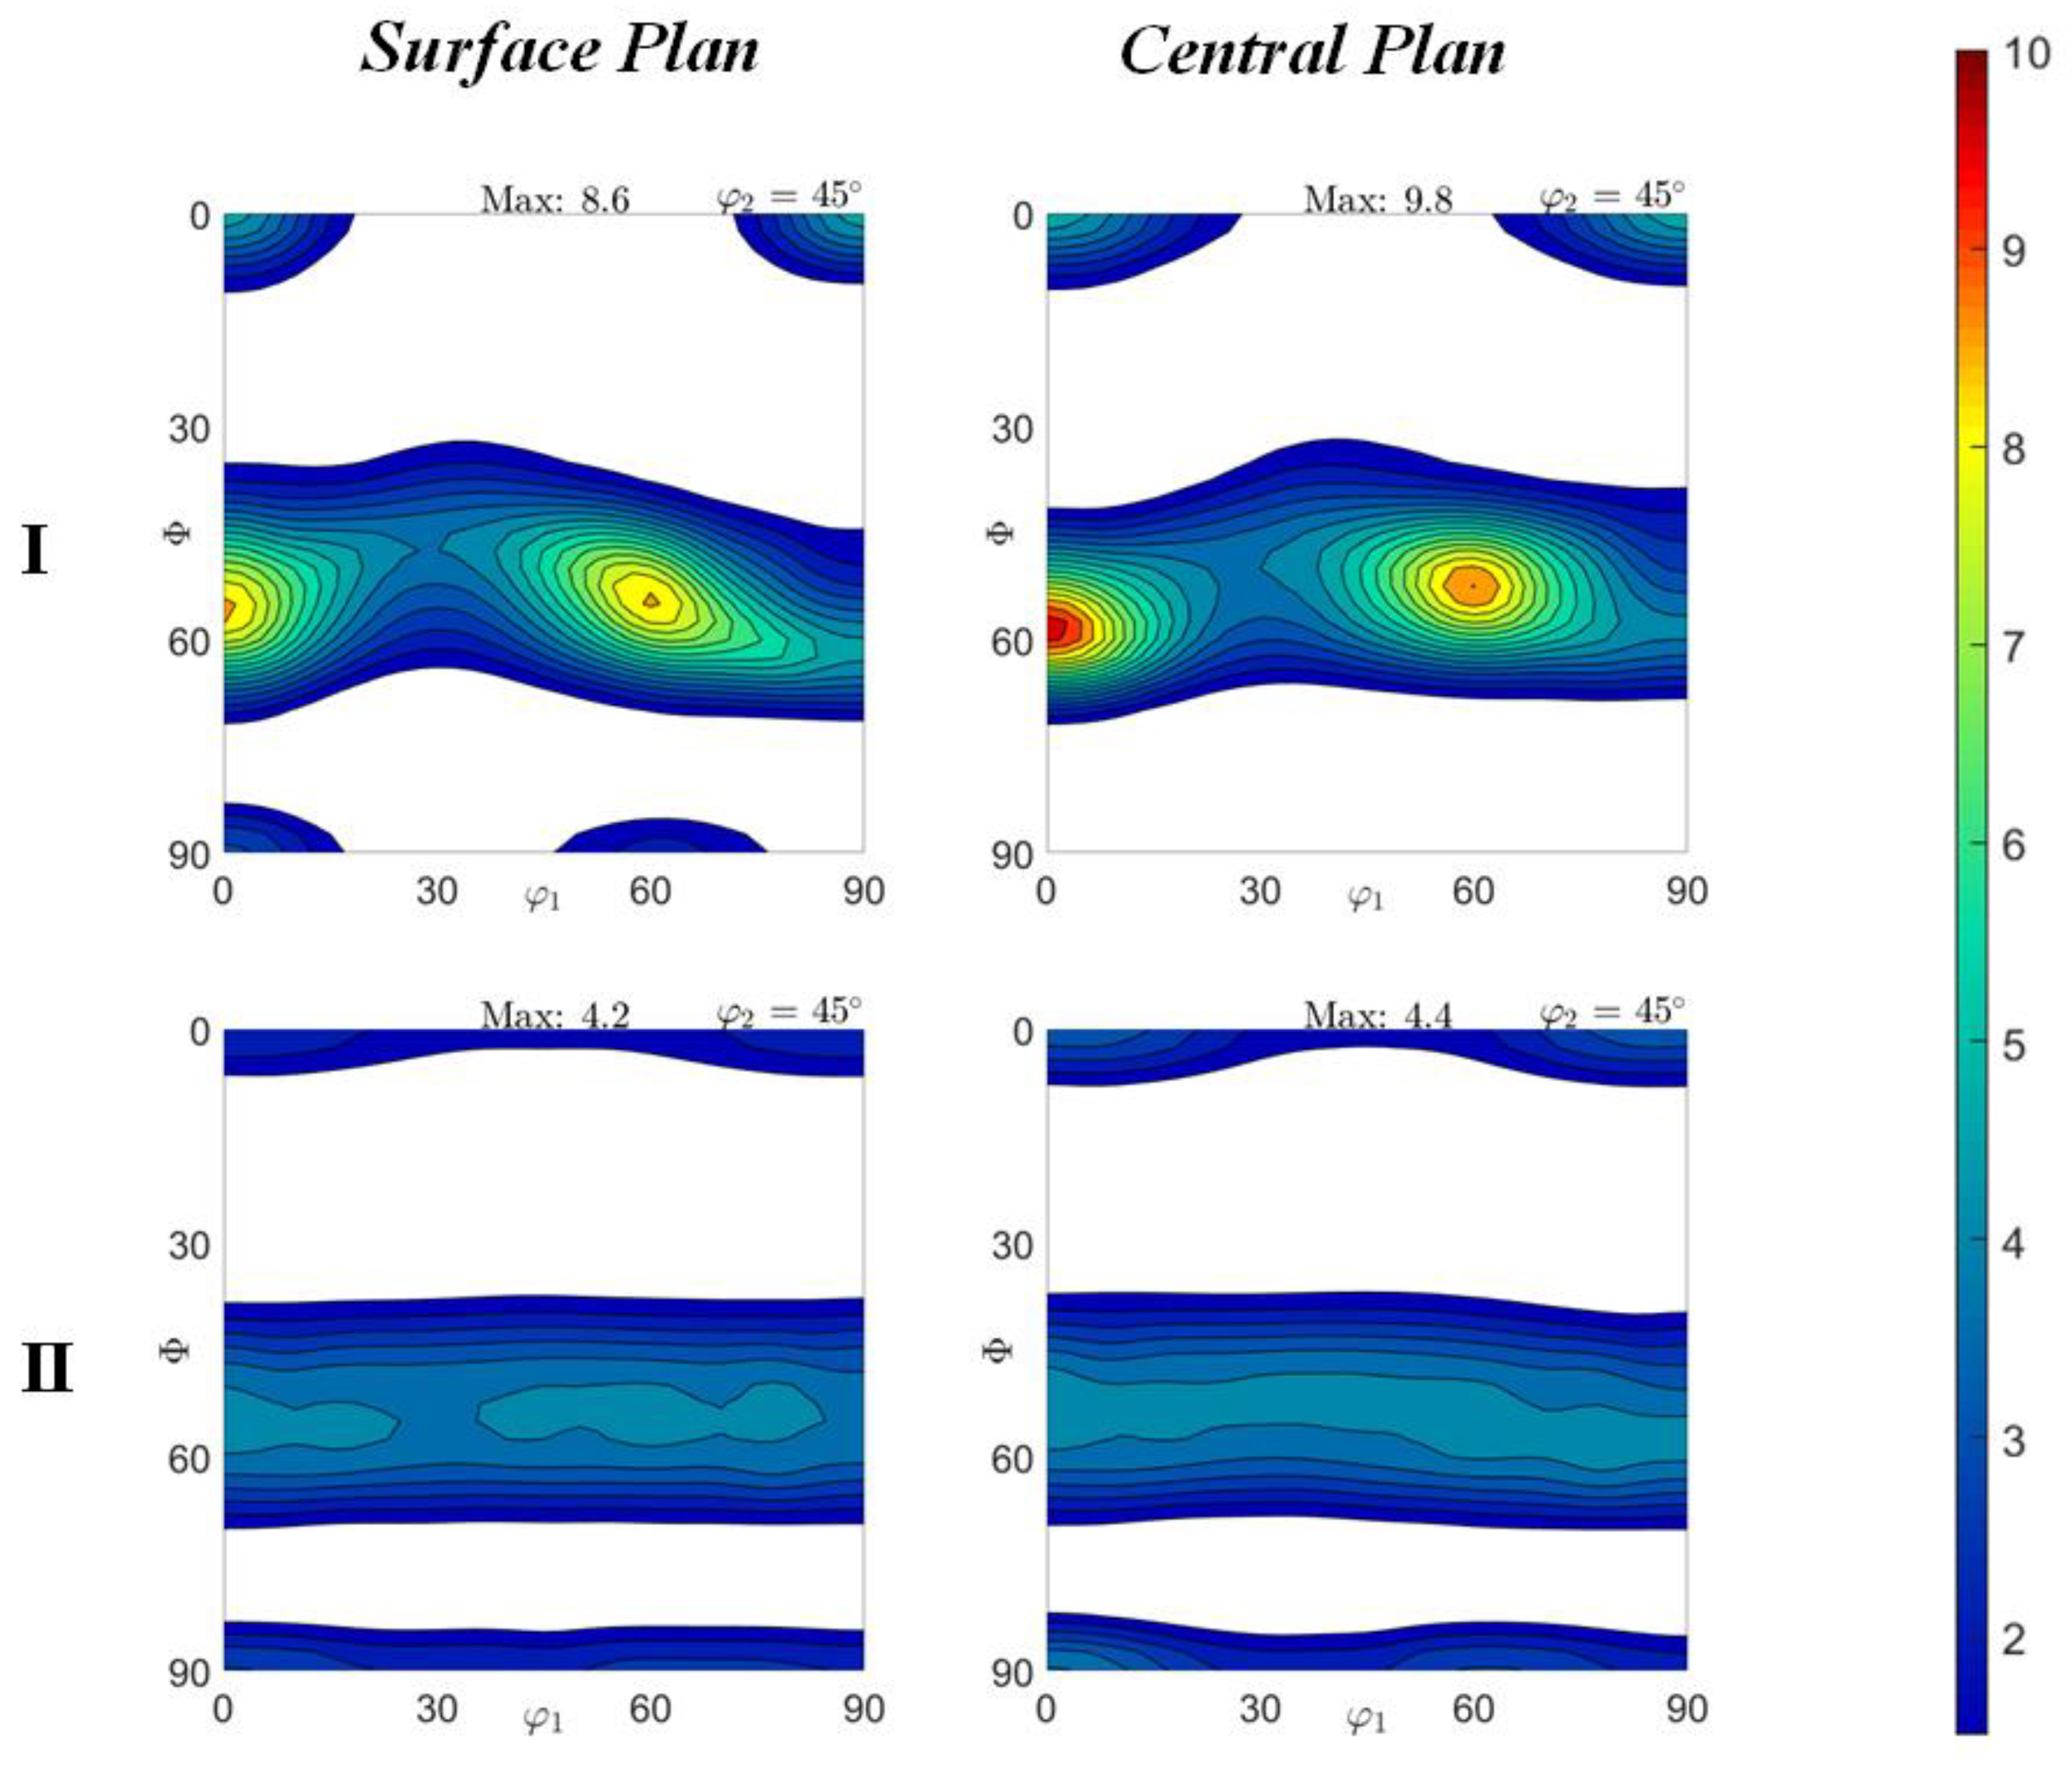
For texture analysis, were performed orientation distribution functions (ODFs), which were obtained for a series expansion method (Imax = 22) based on incomplete pole figures (110), (200) and (211) represented by Bunge’s convention with the three Euler angles (φ1, ϕ, φ2). The MTEX toolbox was utilized in Matlab® software for analysis and data processing.

3. Results

3.1. Structural and Microstructural Characterization

The material presented a chemical composition mainly of 0.74 C–0.76 Mn–0.26 Si (wt.%). For morphological characterization, micrographs of the as-received (AR) sample were obtained and are presented in Figure 1. The as-received material exhibited a partially fine pearlite microstructure (with a lamellar thickness of approximately 62 nm), as well as the presence of a partially spheroidized structure (particle diameter approximately 133 nm) due to the material’s previous processing conditions, which promote the formation of a highly refined microstructure, suggesting that the material was subjected to tempering. The temper is a treatment responsible for stabilizing the cementite in pearlite or martensite microstructures, precipitating the carbon in small nodule-shaped aggregates. The aggregates grow and homogenize at higher temperatures (spheroidization) [42].
In pearlitic steels, their mechanical strength depends on the movement of dislocation boundaries in the material, as dictated by the Hall–Petch relationship. The smaller the lamellar thickness, the smaller the spacing between them, which increases strength of the material. Additionally, cold-drawn pearlite wires have their pearlite colonies align with drawing direction, with the surface prone to lamellae fragmentation [43]. To impede the movement of dislocations, it is necessary to supply more energy for them to move within the material, i.e., plastic deformation, and therefore increase the material’s strength [44]. A quantitative analysis of these micrographs is presented in Table 1.
In Figure 2, an XRD diffractogram of the AR sample and a detailed representation of the peaks are shown. The presence of three distinct peaks can be noted: the peak related to the {110} planes, the peak related to the {200} planes, and the peak related to the {211} planes, corresponding to the ferrite phase. From these diffraction patterns, refinement was carried out, and the obtained parameters are presented in Table 2 and Table 3.
Figure 3 depicts the orientation distribution functions (ODF, φ2 = 45°) derived from the X-ray diffraction of the AR sample on the surface plane of the sample and the central plane (the middle-thickness surface of the sample).
The main texture components in the sample were {111} <110>, {001} <110>, and {110} <110>. In hot-rolled materials, phase transformation textures are typically obtained from those present in the prior austenite, which can be controlled during the process [45]. The {100} <001> component transforms into the {001} <110> component, which promotes crack and failure propagation and is therefore undesirable [46]. This component is mainly present in materials subjected to thermomechanical processing and heat treatment. The {111} <110> component is a cold-rolling texture that arises due to the change in the structure, induced by deformation, from a less stable orientation to this more stable one [47]. Textures formed during hot-rolling are very similar to those of cold-rolling, which typically only stabilize certain orientations. The final rolling structures are usually similar regardless of their composition and processing parameters. Thus, α fibers (RD, parallel to the rolling direction) and γ fibers (ND, parallel to the normal direction) are generated, and tend to be more stable [48]. The {110} <110> component, also known as the Goss-rotated one, is generally associated with shear deformation during hot-rolling, but its origin is uncertain, and therefore there is no applicable theory for its formation [47].
The analysis of ODFs is a statistical and probability analysis. Intensity is related to the number of grains oriented according to the plane and direction shown in the ODF. With the reduction in volume, there is a reduction in sample space and dispersion of results, and therefore an increase in orientation intensities, as observed in the center plan texture. A relatively small increase can be observed in almost all components for the as-received sample, while the components located in the Φ = 90° fiber, i.e., the {110} <110> component (Goss-rotated), are removed.
To analyze the grain properties of this sample, an EBSD analysis was performed, from which the orientation map (OIM) of the analyzed sample was obtained, as well as the kernel average misorientation map (KAM) for the same regions, and the Taylor factor (M) map, as presented in Figure 4. The refinement in the ferritic matrix of the as-received sample indicates a high level of local distortion, indicating the occurrence of work hardening during the manufacturing process. The formation mainly of {111} and {110} planes is noted, with specific directions parallel to the normal direction. The KAM of the region shows well-distributed misorientation within the grains. However, small regions with higher misorientation gradients can be observed in boundary regions.
The Taylor factor (M) analysis shows the predisposition of grains to deform, with grains more prone to deformation appearing in red, and those less prone in blue. [49] This analysis is dependent on the direction of applied load, grain orientation, and dislocation density. In the AR sample, regions with high M are surrounded by regions with low M, and there is a predominance of grains with high M, preferably oriented as {111} and {110}. There are regions with distinct M gradients, especially near grains oriented as {001}. It is already known in the literature that these grains are predisposed to crack generation and propagation [50] due to various factors, such as few slip systems and low planar density. The KAM map highlights the concentration of misorientation in these grains, which aggravates crack generation.
The mechanical properties of this material are significantly affected by its microstructure and texture, as the microstructure predisposes it to good deformation capacity, as supported by the dislocation density and EBSD orientation analysis. However, the KAM and Taylor factor analyses indicate a predisposition of this material to crack formation, which occurs in various ways, mainly through longitudinal cracks on the surface. An example of such a crack occurrence in this material is shown in Figure 5.
As mentioned earlier, drawn wires exhibit high strength combined with low ductility, where this type of crack seems to benefit from this characteristic for its initiation and propagation, thus reducing the mechanical properties and causing potential catastrophic failures. To increase the material’s ductility and reduce its mechanical strength in less impactful ways, thereby making it difficult for these cracks to form, subcritical annealing (REC) and isothermal treatment (ISO) were performed. To better evaluate the effects of these distinct microstructures of the studied material, the treatments were proposed to obtain a specific microstructure. The following section describes the analysis of the changes brought about by these treatments.

3.2. Analysis of Heat Treatments

To study the effects of the distinct microstructures of the study material, heat treatments were performed to obtain a specific cementite microstructure, that is, a globular or spheroidized and lamellar cementite microstructure, using the heat treatments mentioned previously. Micrographs of these microstructures are presented in Figure 6.
With the annealing treatment (REC sample), as shown in Figure 6, a microstructure predominantly composed of globular or spheroidized cementite (average particle diameter approximately 567 nm) was obtained, and with salt bath isothermal treatment (ISO sample), as presented in Figure 6, a microstructure with predominantly fine cementite lamellae (lamella thickness approximately 53 nm) arranged in a ferrite matrix was obtained. This treatment produces thinner lamellae than other industrial processes. [51] In Table 4, a comparison of the particle size distribution and cementite lamella thickness in the as-received and heat-treated samples is presented. The isothermal treatment promoted a 15% reduction in lamellae thickness, directly affecting the material’s mechanical properties and promoting the reduction of ferrite–cementite interfaces. The annealing treatment increases particle size by 427% compared to the as-received sample. This increase in particle size may reduce mechanical strength but increase the material’s ductility. It is worth noting that both treatments also promote the reduction of ferrite–cementite interfaces [52].
In Figure 7 below, a diffractogram of the heat-treated samples is shown, and in Figure 8, a detailed representation of the peaks is presented. Once again, the presence of three distinct peaks can be noted: the peak related to the {110} planes, the peak related to the {200} planes and the peak related to the {211} planes, corresponding to the ferrite phase. Compared to the as-received sample, the peaks related to the {200} and {211} planes are increased in the REC sample and reduced in the ISO sample.
A comparison of peaks was made according to the normalization to peak related to {110} planes of ferrite. Consequently, the {110} peaks have a maximum intensity of 1 (arbitrary unit, a.u.), and the others undergo an adjustment in their size. The {200} and {211} peaks undergo an increase in their size for the REC sample and a reduction for the ISO sample. These peaks are usually related to texture components. The increase in peak intensity lead to an intensification of the texture components, and with the decrease in peak intensity, there is a reduction in texture components.
From these diffractograms, refinement was performed, and the obtained parameters are presented in Table 5 and Table 6. Heat-treated samples showed lower dislocation density compared to the as-received sample, demonstrating a reduction in dislocation density due to thermal treatments. This reduction is mainly caused by diffusion, recovery, and recrystallization mechanisms, which reduce distortions by eliminating dislocations.
It is worth noting that the change in microstructure caused by heat treatments offers predisposition of a reduction in microdeformation due to the reduction in ferrite–cementite interfaces, which are responsible for distortions in the crystal lattice and unit cells. Dislocations also cause distortions in the crystal lattice, with a significant reduction in dislocation density being one of the factors for reducing distortions in the crystal lattice [53].
Figure 9 shows the orientation distribution functions (ODF, φ2 = 45°) derived from the XRD of REC and ISO samples on the surface plan and center plan. As predicted by the diffractogram, there is an increase in texture intensity with annealing heat treatment, and a reduction with isothermal treatment, due to changes in {200} and {211} planes. Compared to the received sample, there is an increase in the Goss-rotated components for both samples, as well as the {001} <110> components originating from hot-rolling, during the manufacturing process of this material. For the annealed sample, there is also an increase in the rolling components, {111} <110>. For the isothermally treated sample, there is a reduction in these cold-rolling components.
Regarding the EBSD analyses, Figure 10 below presents the orientation map (OIM) analyses of the samples analyzed, as well as the kernel average misorientation (KAM) map for the same regions and the Taylor factor (M) map. The effect of the heat treatments on this material is evident due to the reduction in misorientation and reorientation of grains (preferably to {112} and {111} in the REC sample and {110} in the ISO sample).
The presented results were focused preferably on ferrite phase due to amount of this structure spread over the superficial area compared to the cementite phase. Although the REC sample presented a higher cementite superficial area (gray-colored nodules), it did not form a standard pattern that influenced in the overall processing of EBSD data.
According to the Taylor factor map, the reorientation and the reduction of misorientation caused by the heat treatments provides reduction of the M (Taylor factor) in the grains, which is responsible for increasing mechanical resistance. The grains did not undergo an intensive reduction until the predominance of the blue-colored level, which is related to fragilization.

3.3. Tensile Properties

The tensile tests are presented in Figure 11, and the values of the quantities related to these tests are presented in Table 7. The graphs show an increase in the material’s ductility as a result of the heat treatments, consistent with the results of SEM, XRD, and EBSD. The REC sample shows the phenomenon of “discontinuous yielding”. According to Rastegari et al. [54], this phenomenon is not well interpreted in pearlitic steels, although it is more common in spheroidized microstructures, which usually have a high density of ferritic grain boundaries, with coalesced cementite near the boundaries.

4. Discussion

The presence of a dispersed spheroidized microstructure within the ferrite grains is responsible for increasing ductility without interfering with the yield strength, as noted by Oyama et al. [
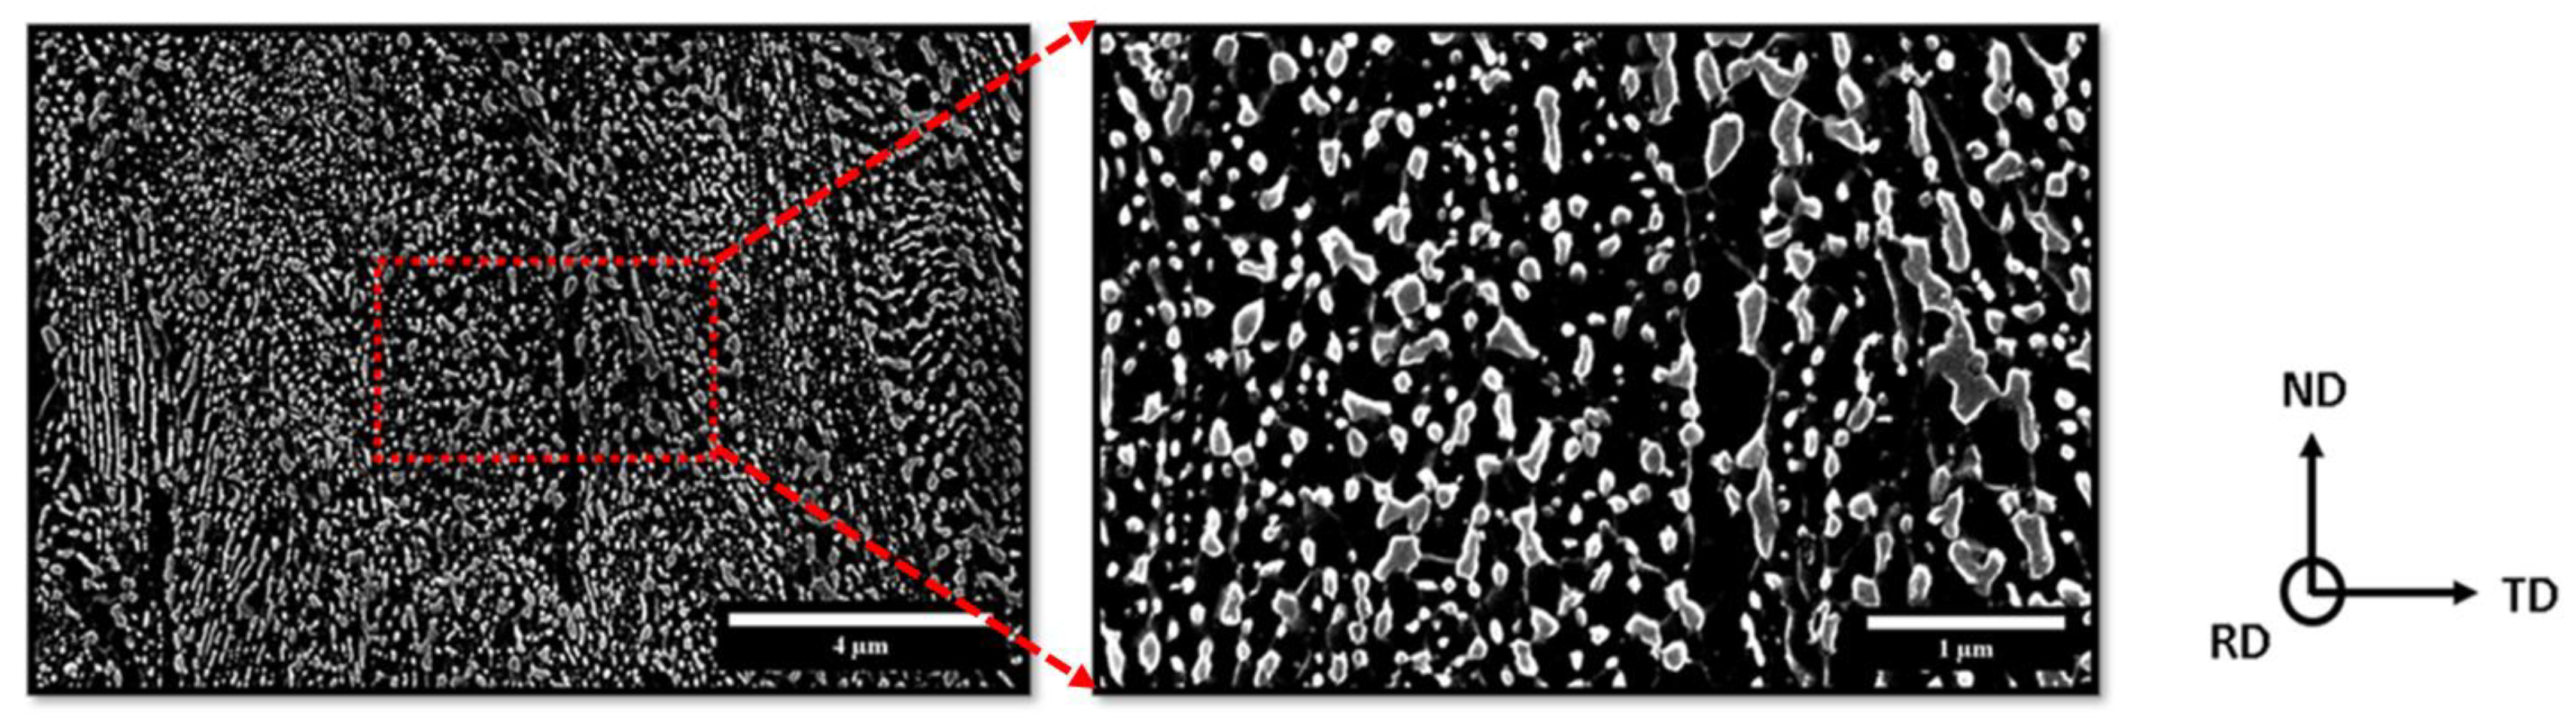
52] This is because the yield strength depends on both the lamellar spacing and the previous austenite grain size. Initially, the studied material presents a deviation of the lamellae towards RD (in this case, the direction of application of the tensile load) of approximately 53°. It is known that in materials under tensile loading, the planes in which the flow occurs are deviated by 45° in relation to the deformation direction. Due to this phenomenon and considering that the cementite lamellae are regions that hinder deformation, it is possible to affirm that the lamellae of the as-received material facilitate the shear effect under tension, as they are slightly deviated in relation to the shearing direction.
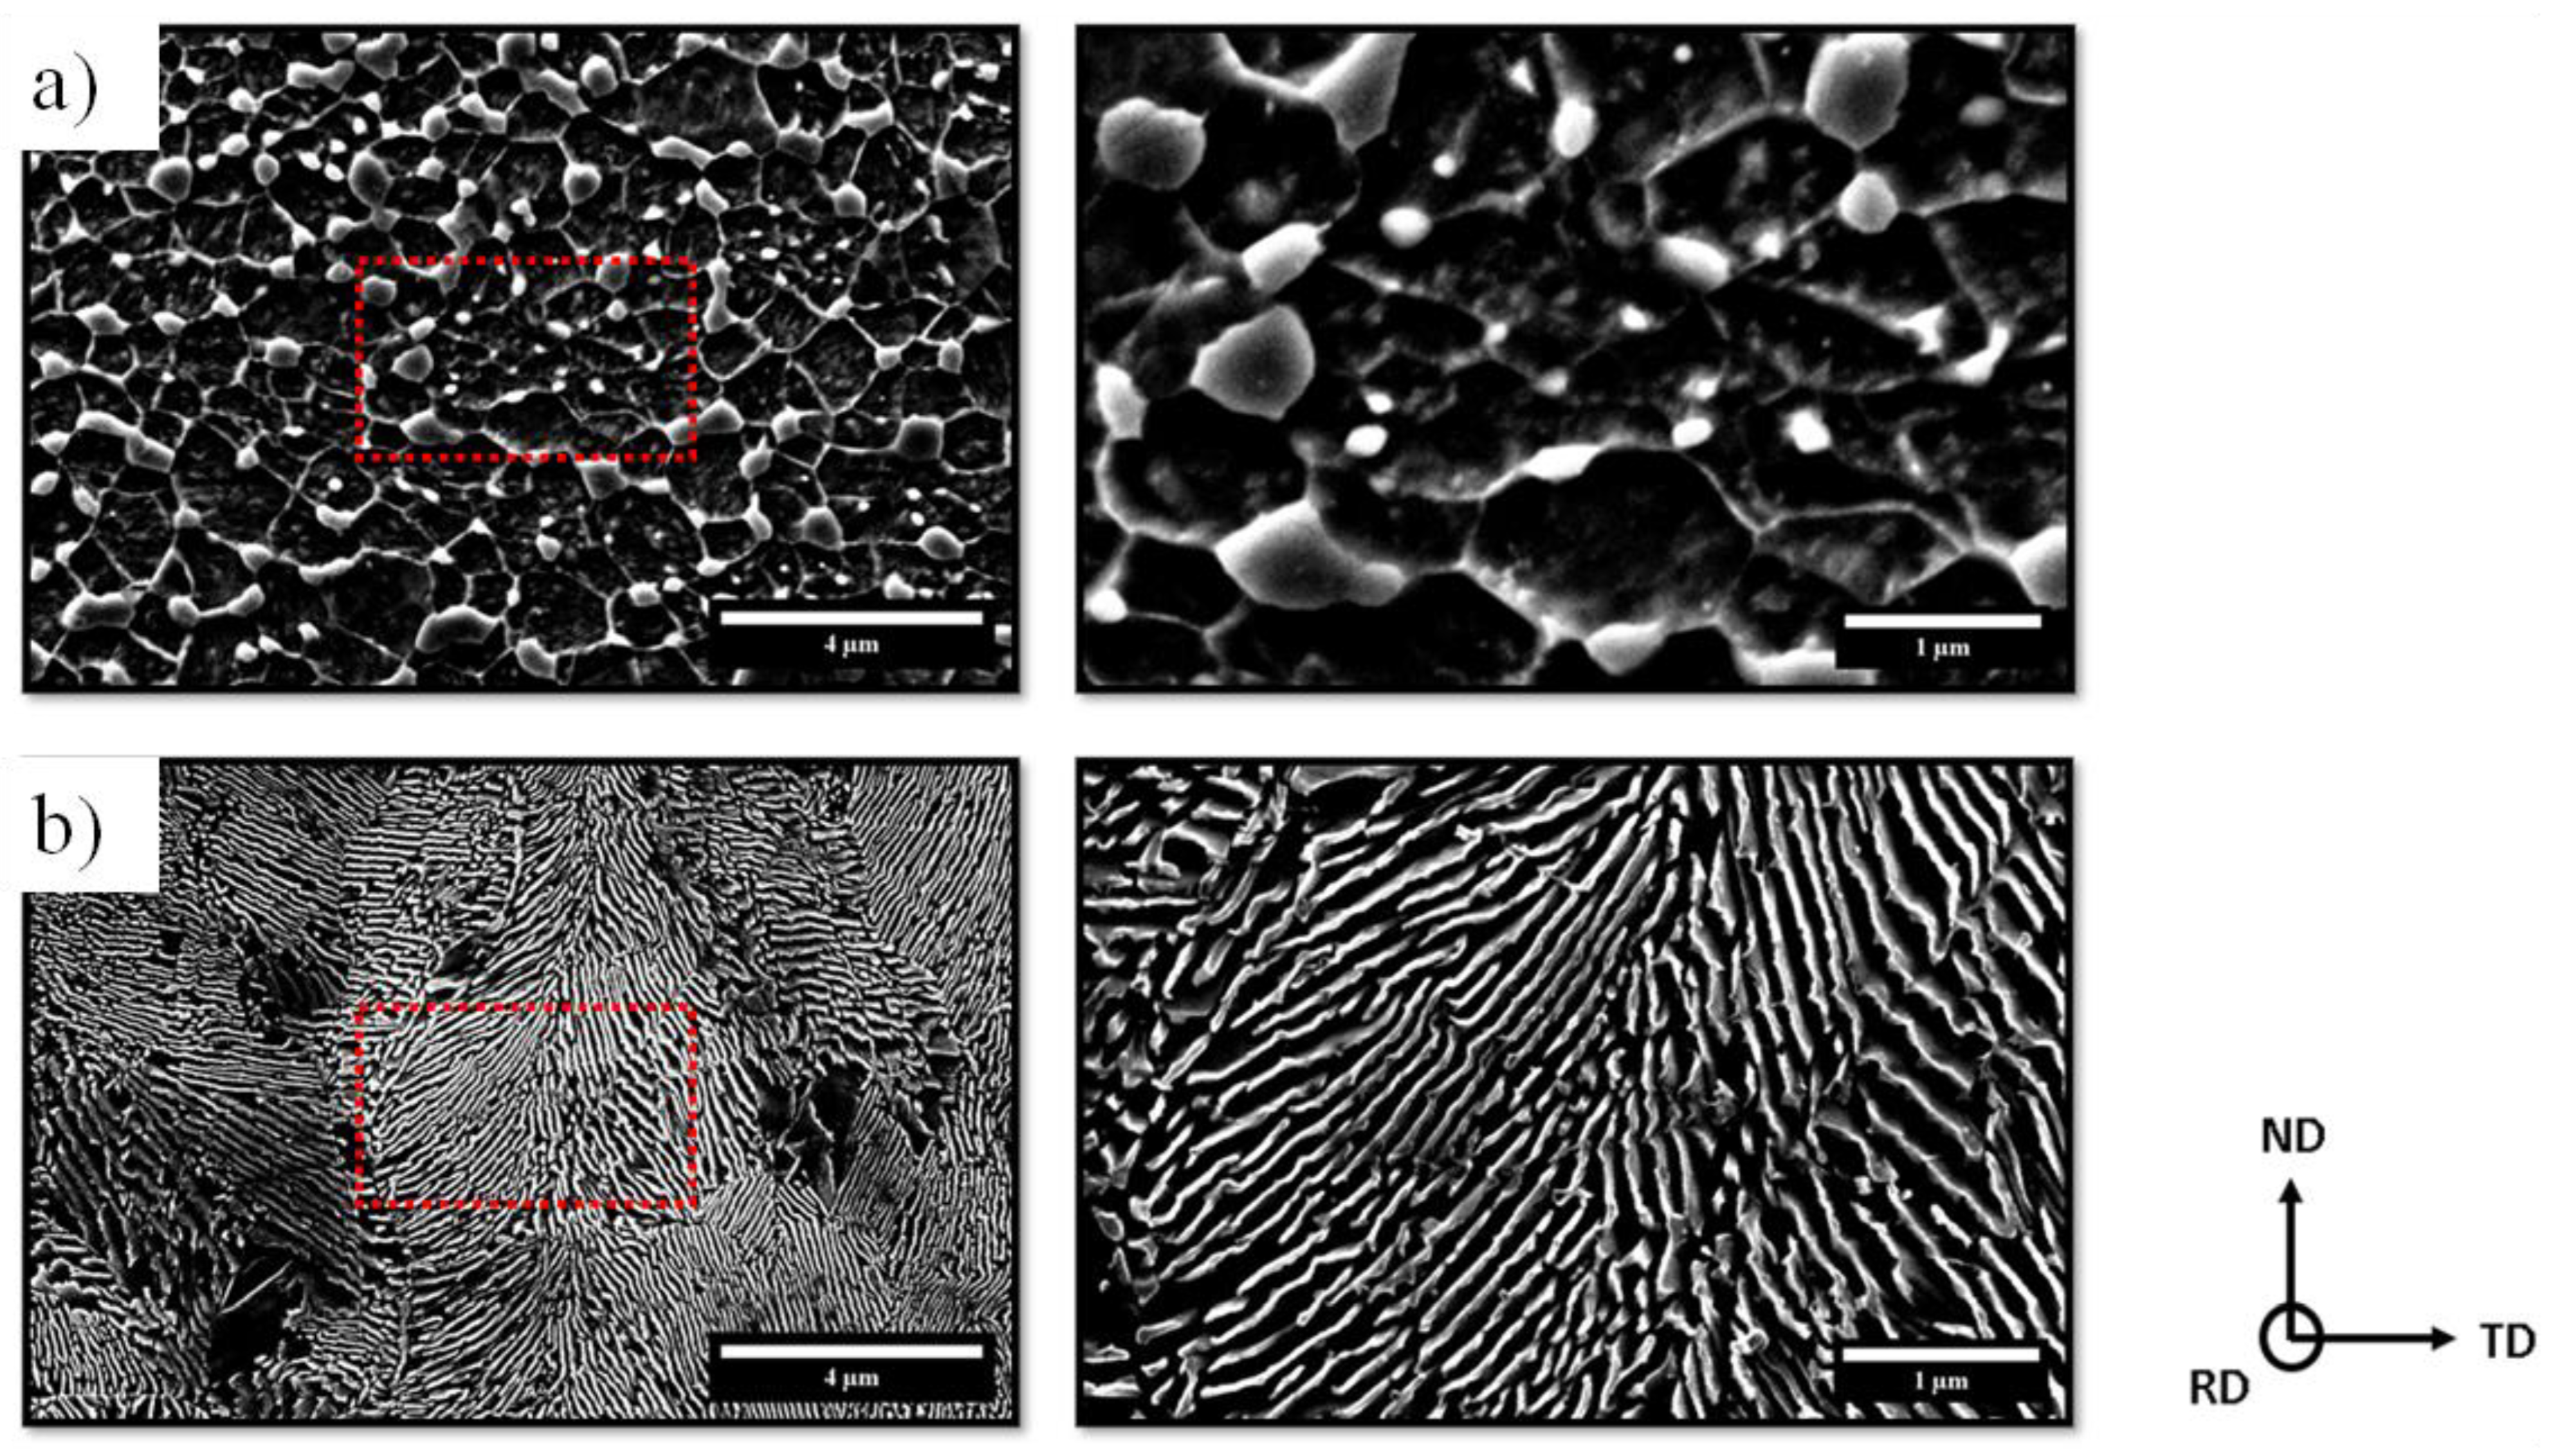
Due to phase transformation processes caused by the heat treatments, the initial local equilibrium has been altered, favoring the fragmentation of lamellae and deforming these fragments, forming a microstructure composed of spherical particles in sample REC [55] and the lamellae microstructure in sample ISO. It can be stated that these treatments directly influence the yield strength, since sample austenitization occurred, thereby generating large or small austenite grains; additionally, the spacing between lamellae can increase or decrease.
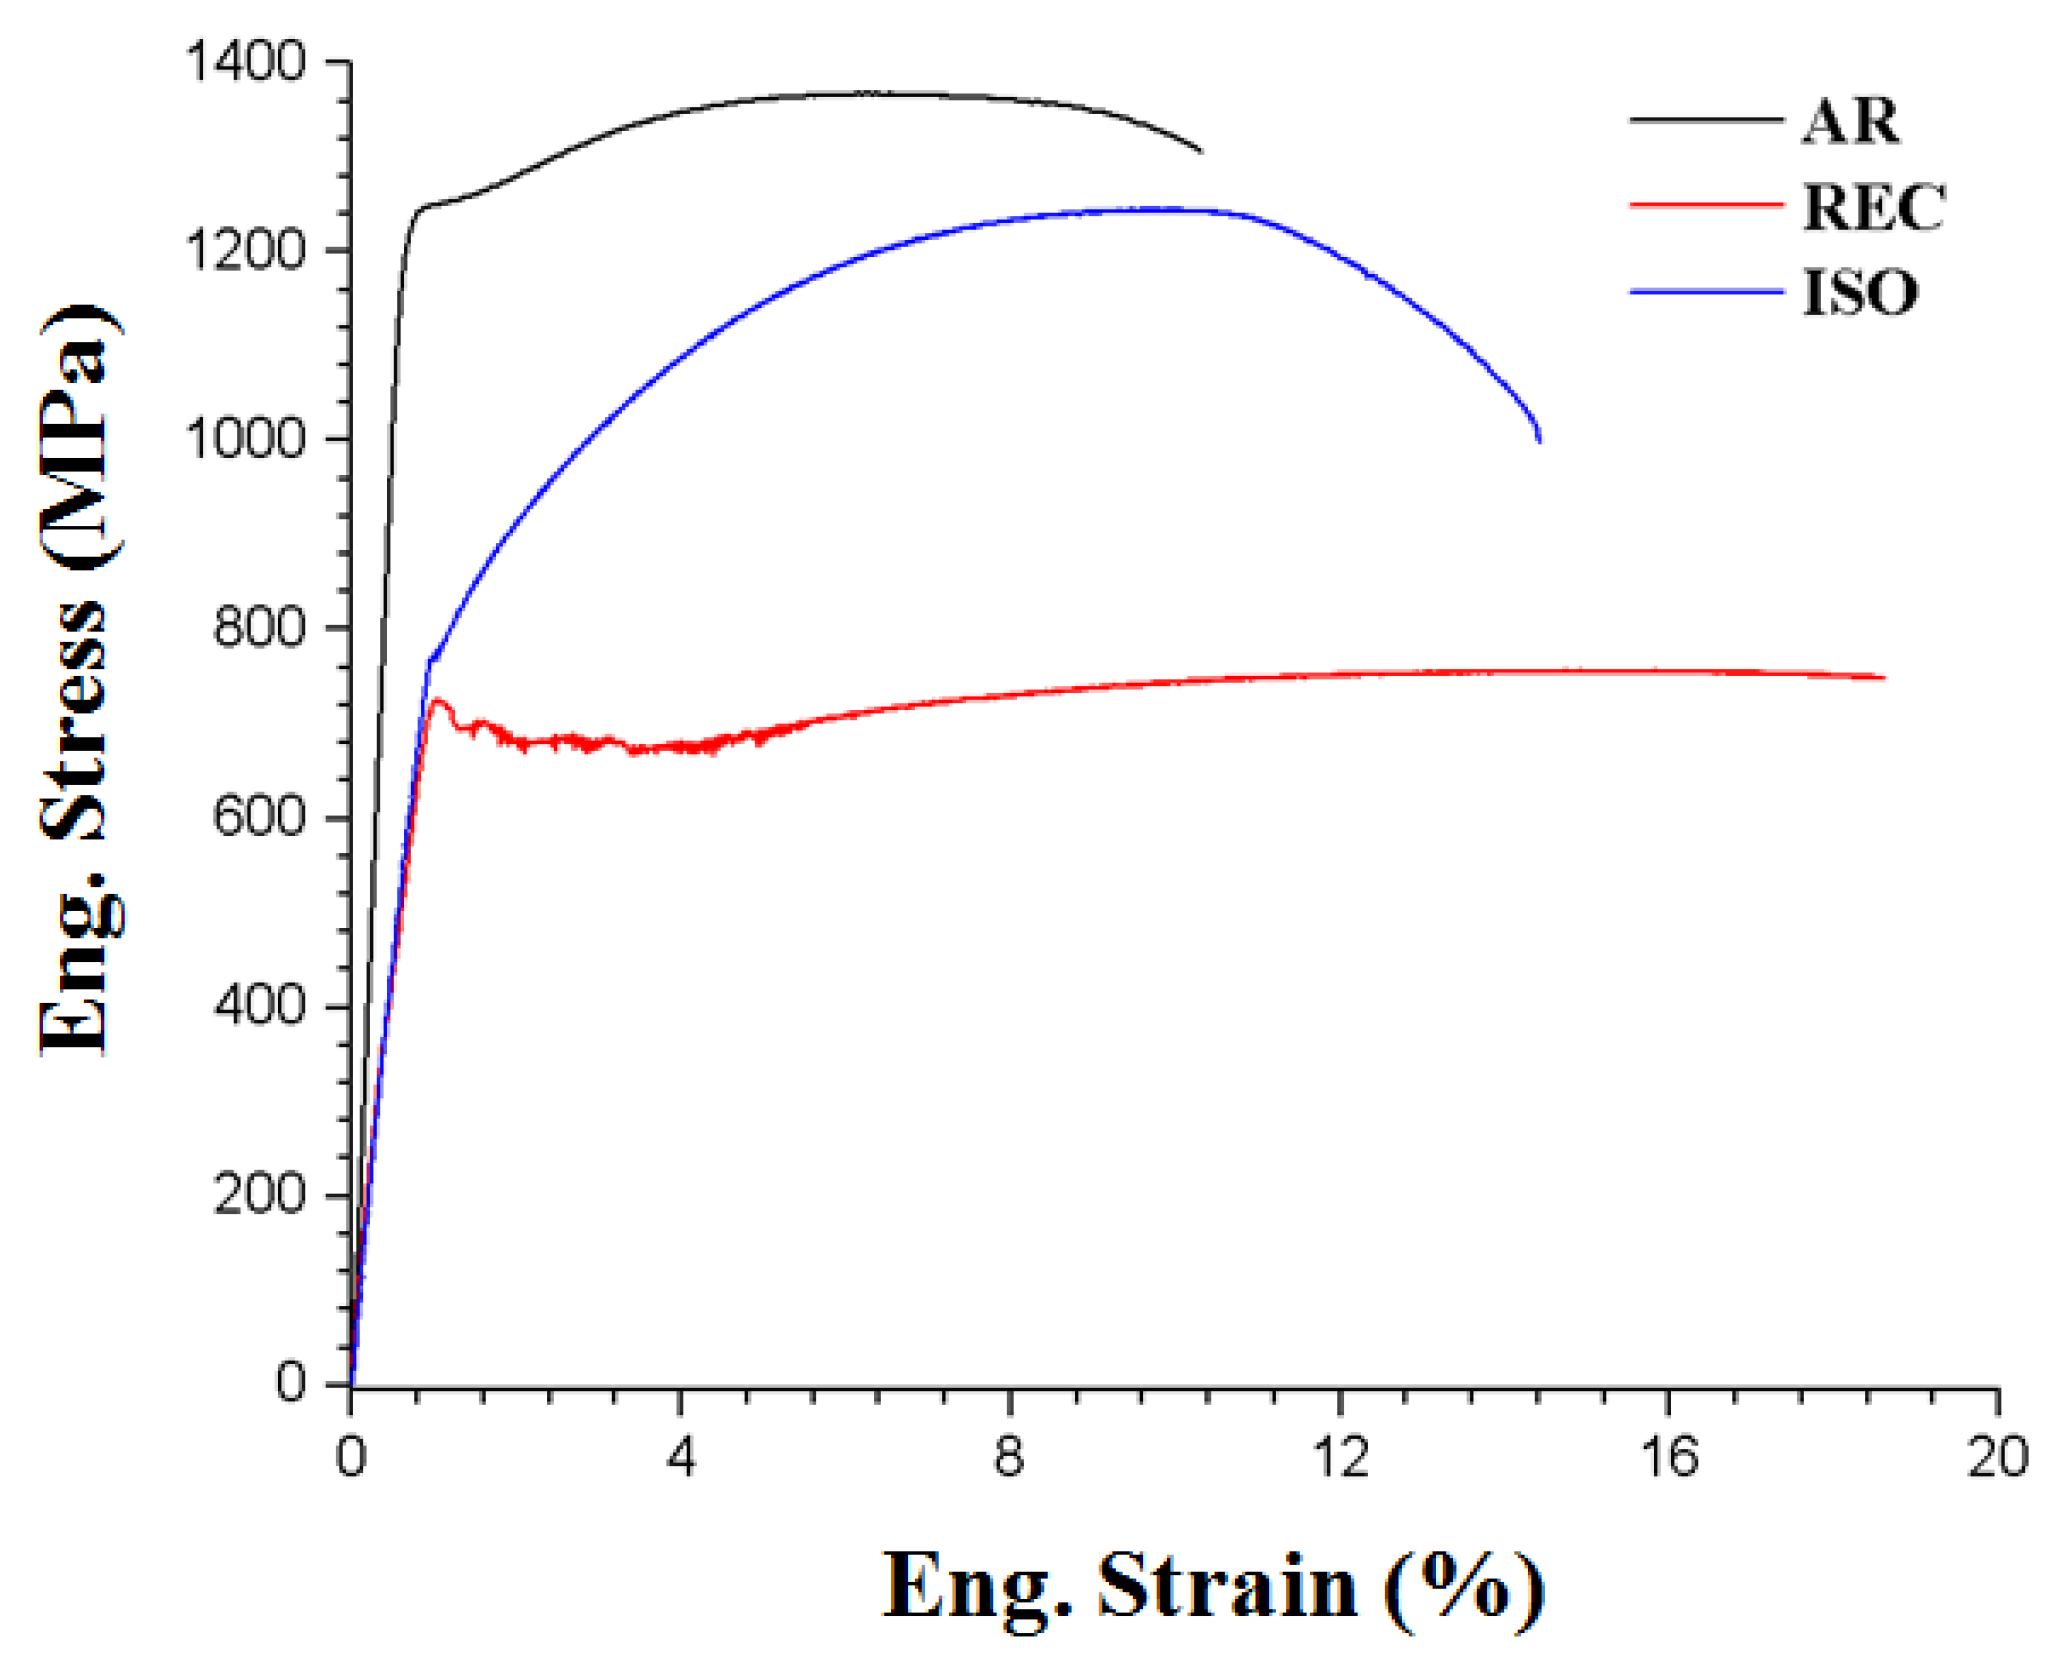
A more rigorous analysis of these microstructures indicates that the REC sample, compared to the as-received sample, undergoes a loss of mechanical strength but an increase in ductility, since this increase in particle size is indicative of a reduction in the barriers to dislocation movement. In the ISO sample, however, the reduction in lamella thickness was indicative of an increase in the material’s mechanical strength, according to the Hall–Petch relationship. The deviation angle in relation to the applied tensile load direction is also altered, and compared to the as-received sample, this is a beneficial change, since the deviation angle of 45°, which predisposes to shearing, is distant. Those appointments were confirmed on the tensile tests performed, wherein the heat treatments promote a reduction in yield strength and mechanical resistance (a reduction in mechanical resistance of 44.7% for the REC sample and 9% for the ISO sample), but a considerable increase in ductility (an increase of 80.37% for the REC sample and 40% for the ISO sample). The toughness of the samples is also modified (a reduction of 0.41% for the REC sample and an increase of 17.71% for the ISO sample).
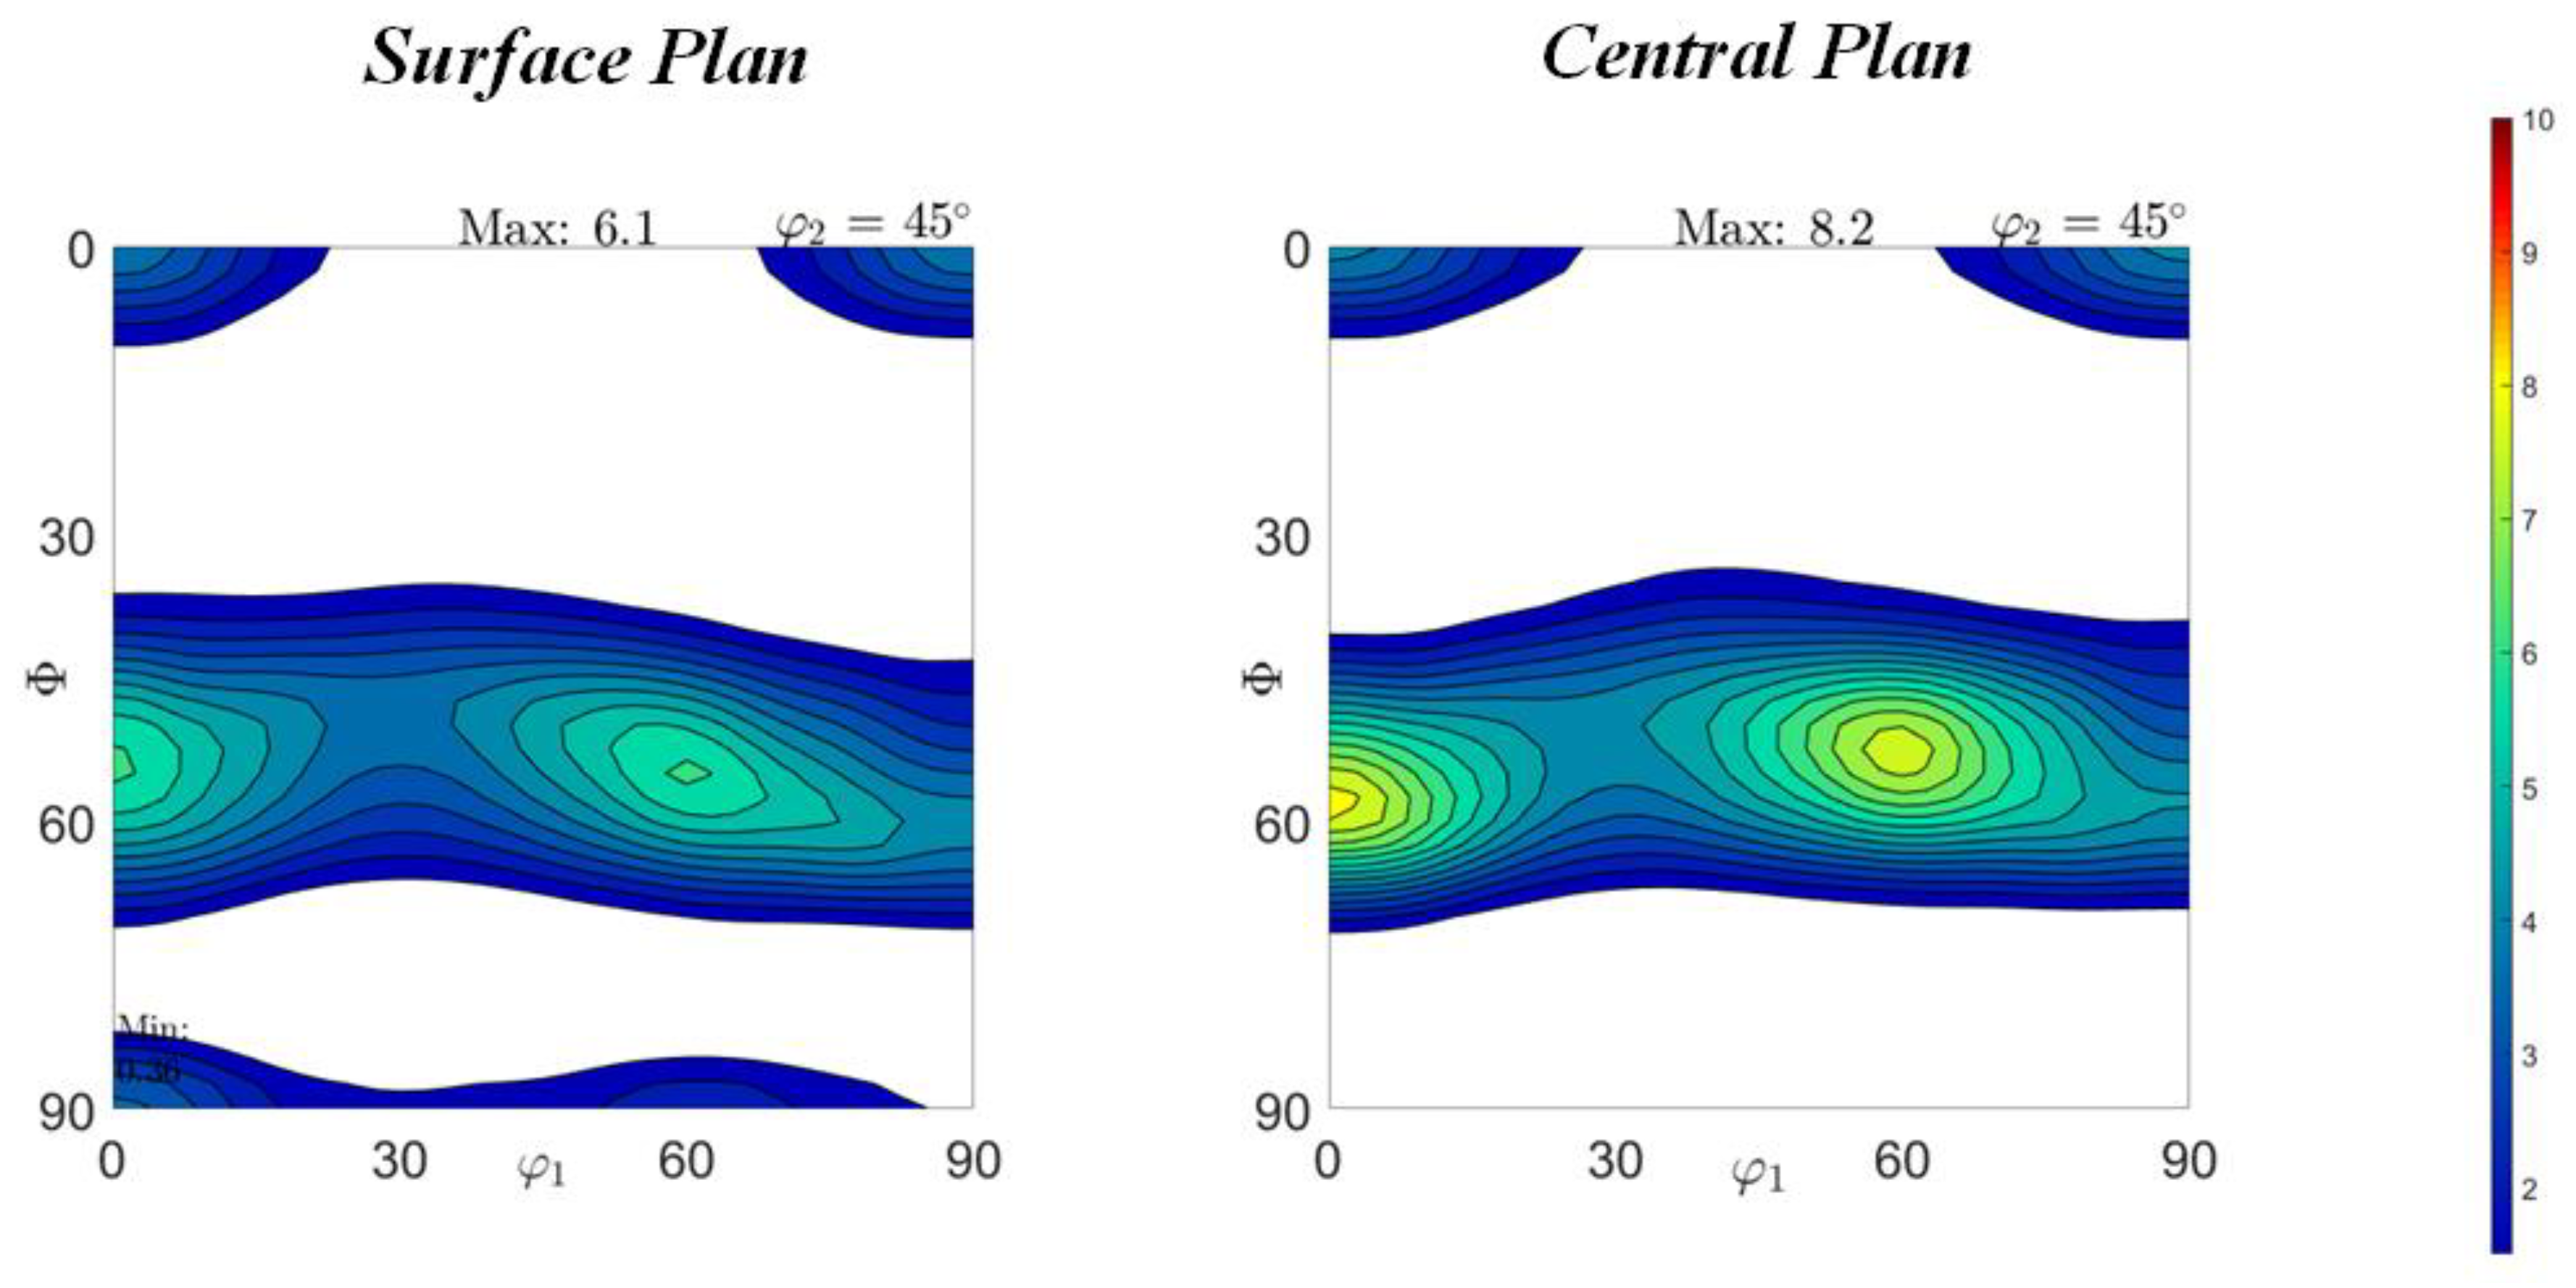
The highest intensity texture component in the as-received sample is the {111} <110>, which is a beneficial texture for the material as it does not favor crack and failure propagation. The {110} <110> component appears with lower intensity in all samples. The {001} <110> component, which is undesirable, slightly increases with annealing heat treatments. According to Mehdi et al. [48], rolling predisposes the rotation of grains oriented as Goss-rotated to a more stable orientation, such as the {111} <110> orientation, thus forming the γ fiber. As explained earlier, the presence of a Goss-rotated component is of uncertain origin, but is probably related to shear occurring in the material [47].
Upon removal of Goss-rotated components in the center plan textures, it can be assumed that the grains oriented accordingly are located close to the surface of the samples, meaning that shear occurs in the proximity of the material’s surface under study. In recrystallization treatments, Goss and Brass-oriented grains are nucleated within deformed grains oriented as {111} in regions with shear bands. Consequently, the peripheral regions of these materials exhibit strong {110} textures, with a texture gradient in this orientation throughout the thickness, whereby the center region shows less intensity of this orientation but with greater intensities for other fibers and orientations, such as rolling ({111} // RD) and recrystallization ({100} // RD) [56].
As observed in the as-received sample, a relatively small increase also occurs in the components of the annealed sample (central plan), along with the removal of the rotated Goss components. In the sample subjected to isothermal treatment, however, there is a reduction in the {001} <110> components, as well as the Goss-rotated components, again validating the assumption of grains related to these components on the surface, in this case. It should be noted that the intensity of the {111} // RD fiber after the heat treatments in the samples continues to be the most significant of the components.
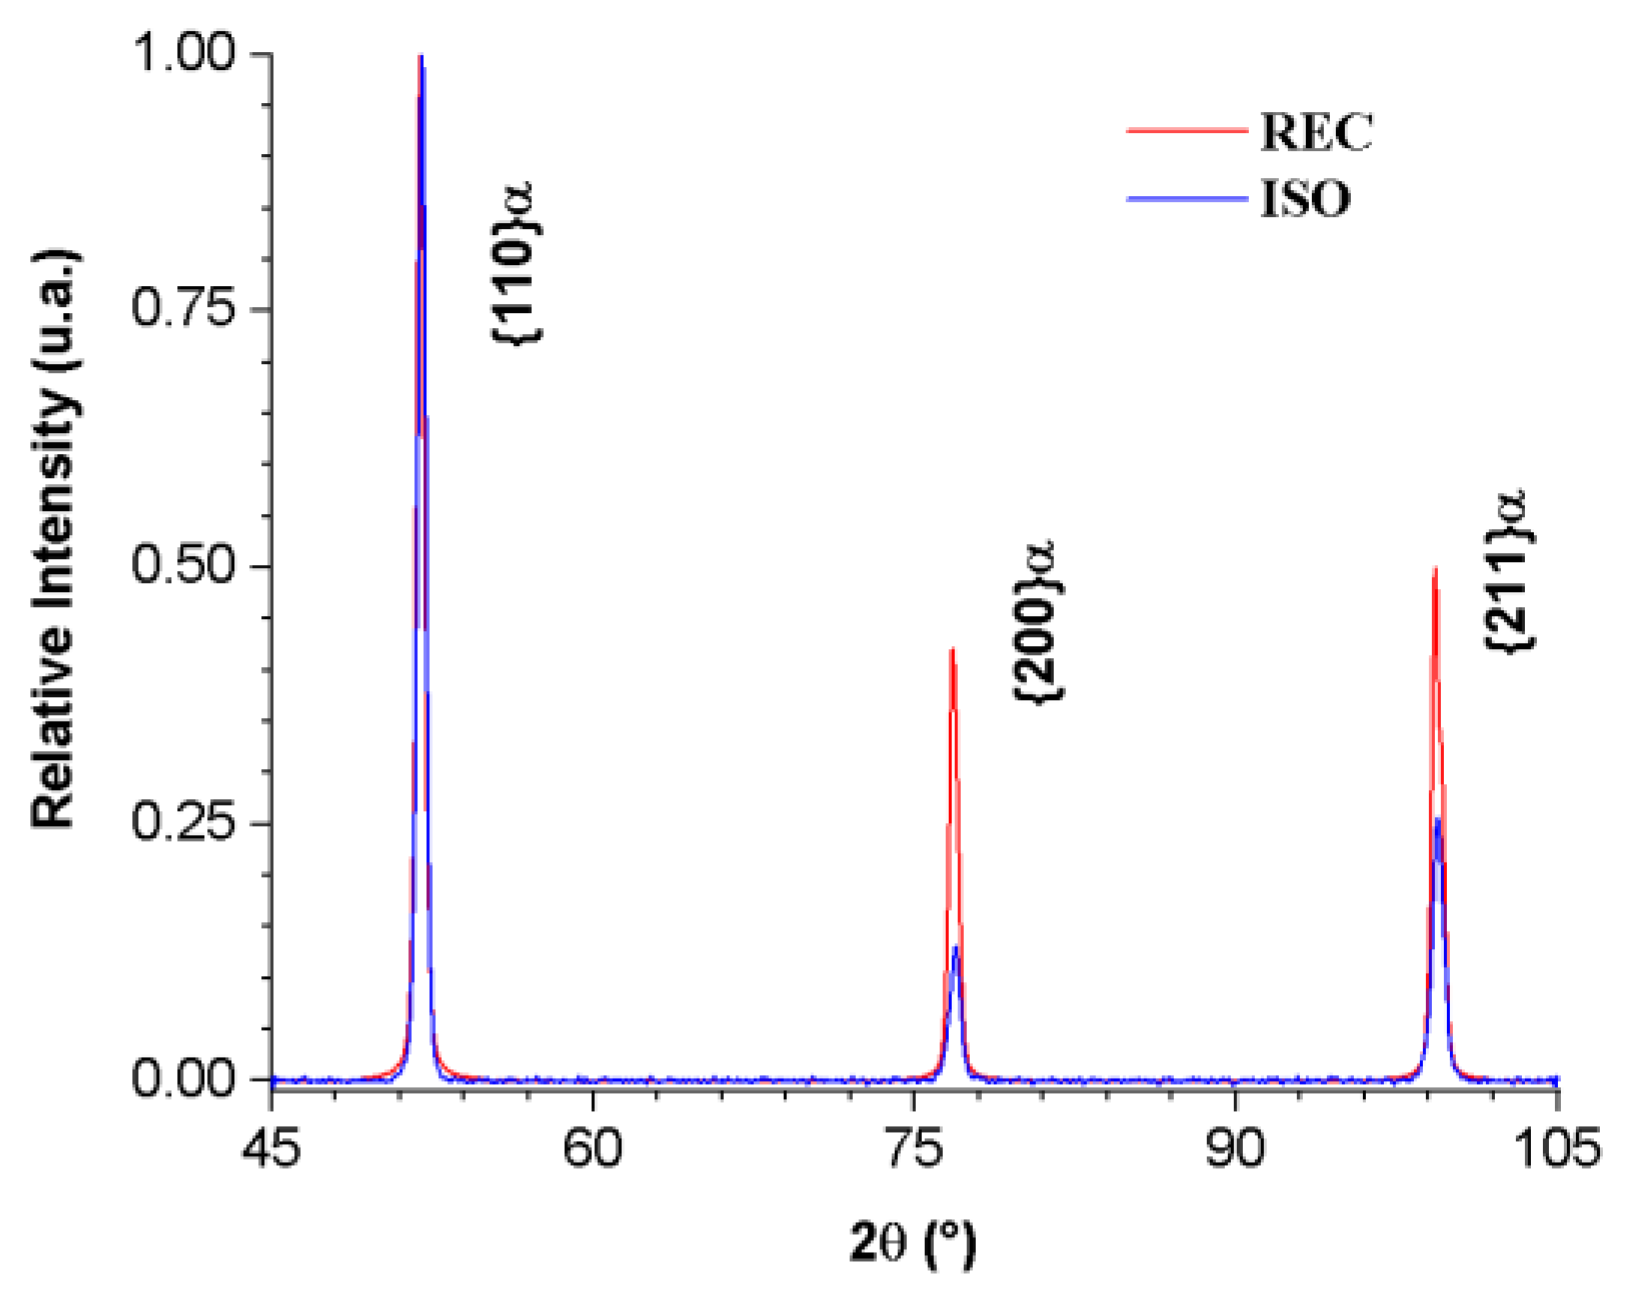
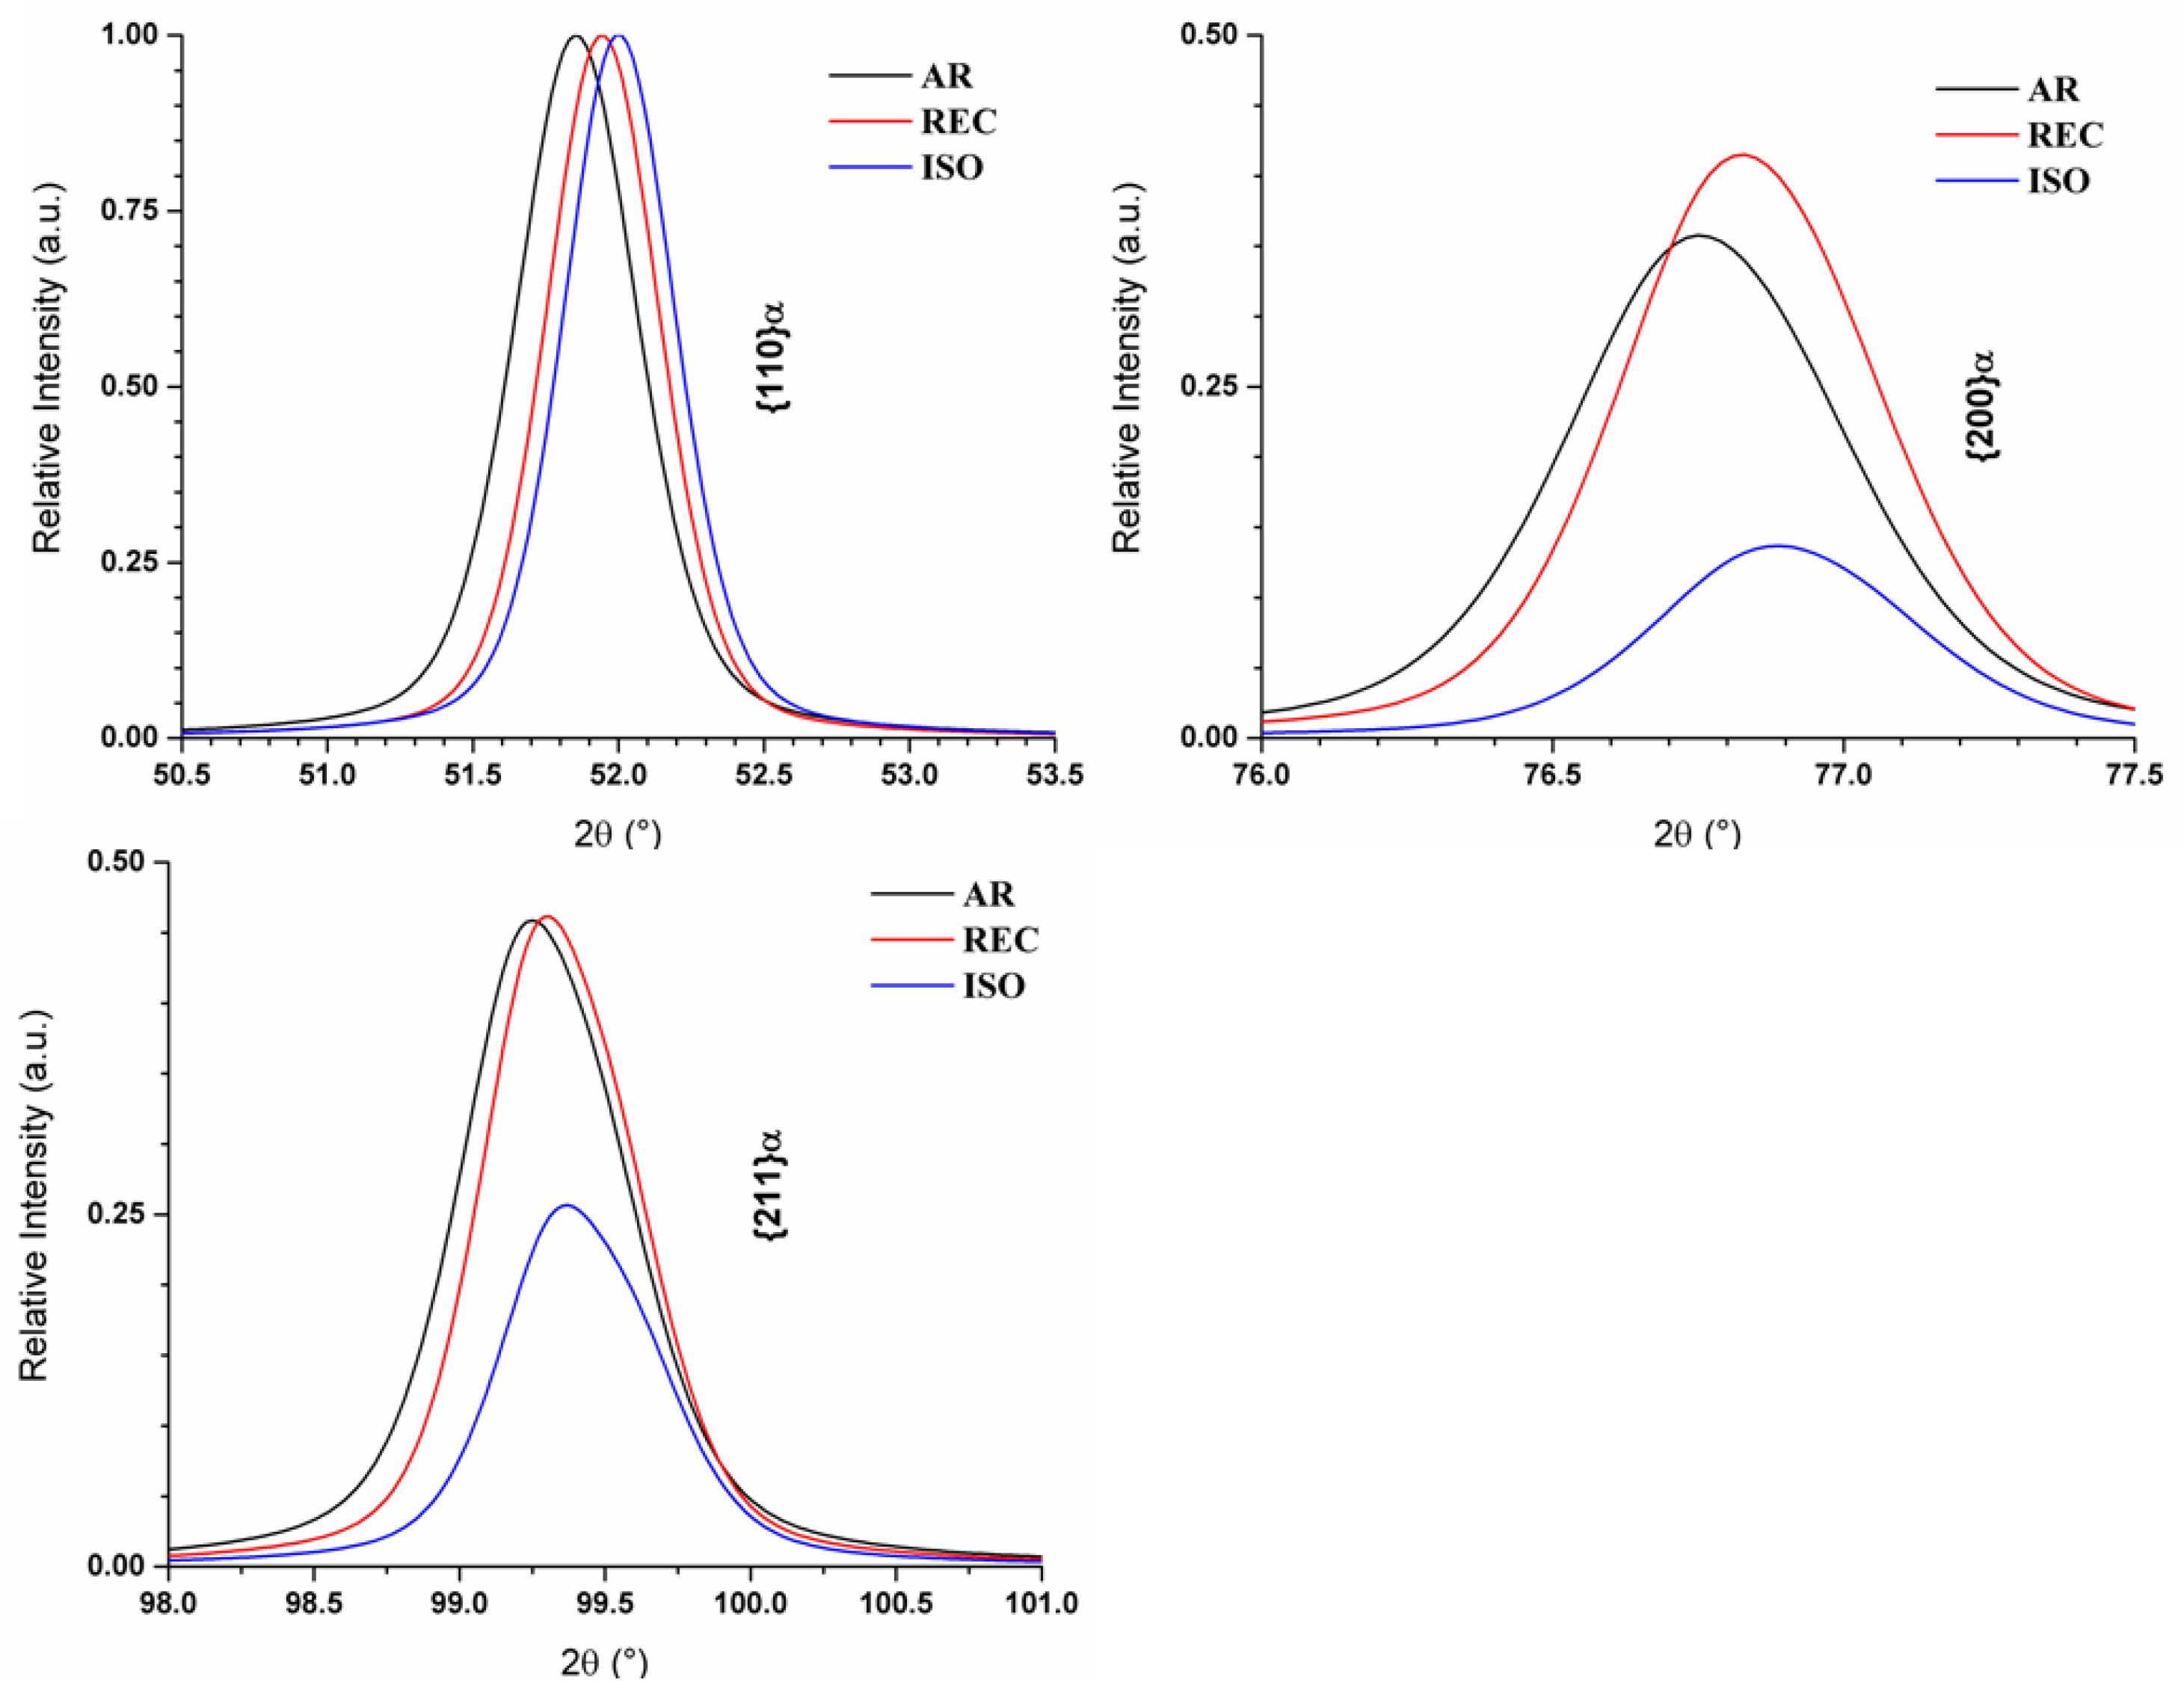
With the refinement of XRD results, the microstrain and dislocation density of samples are obtained. According to Santos [53], the density of dislocations in the samples are consistent with the literature, ranging from 10^
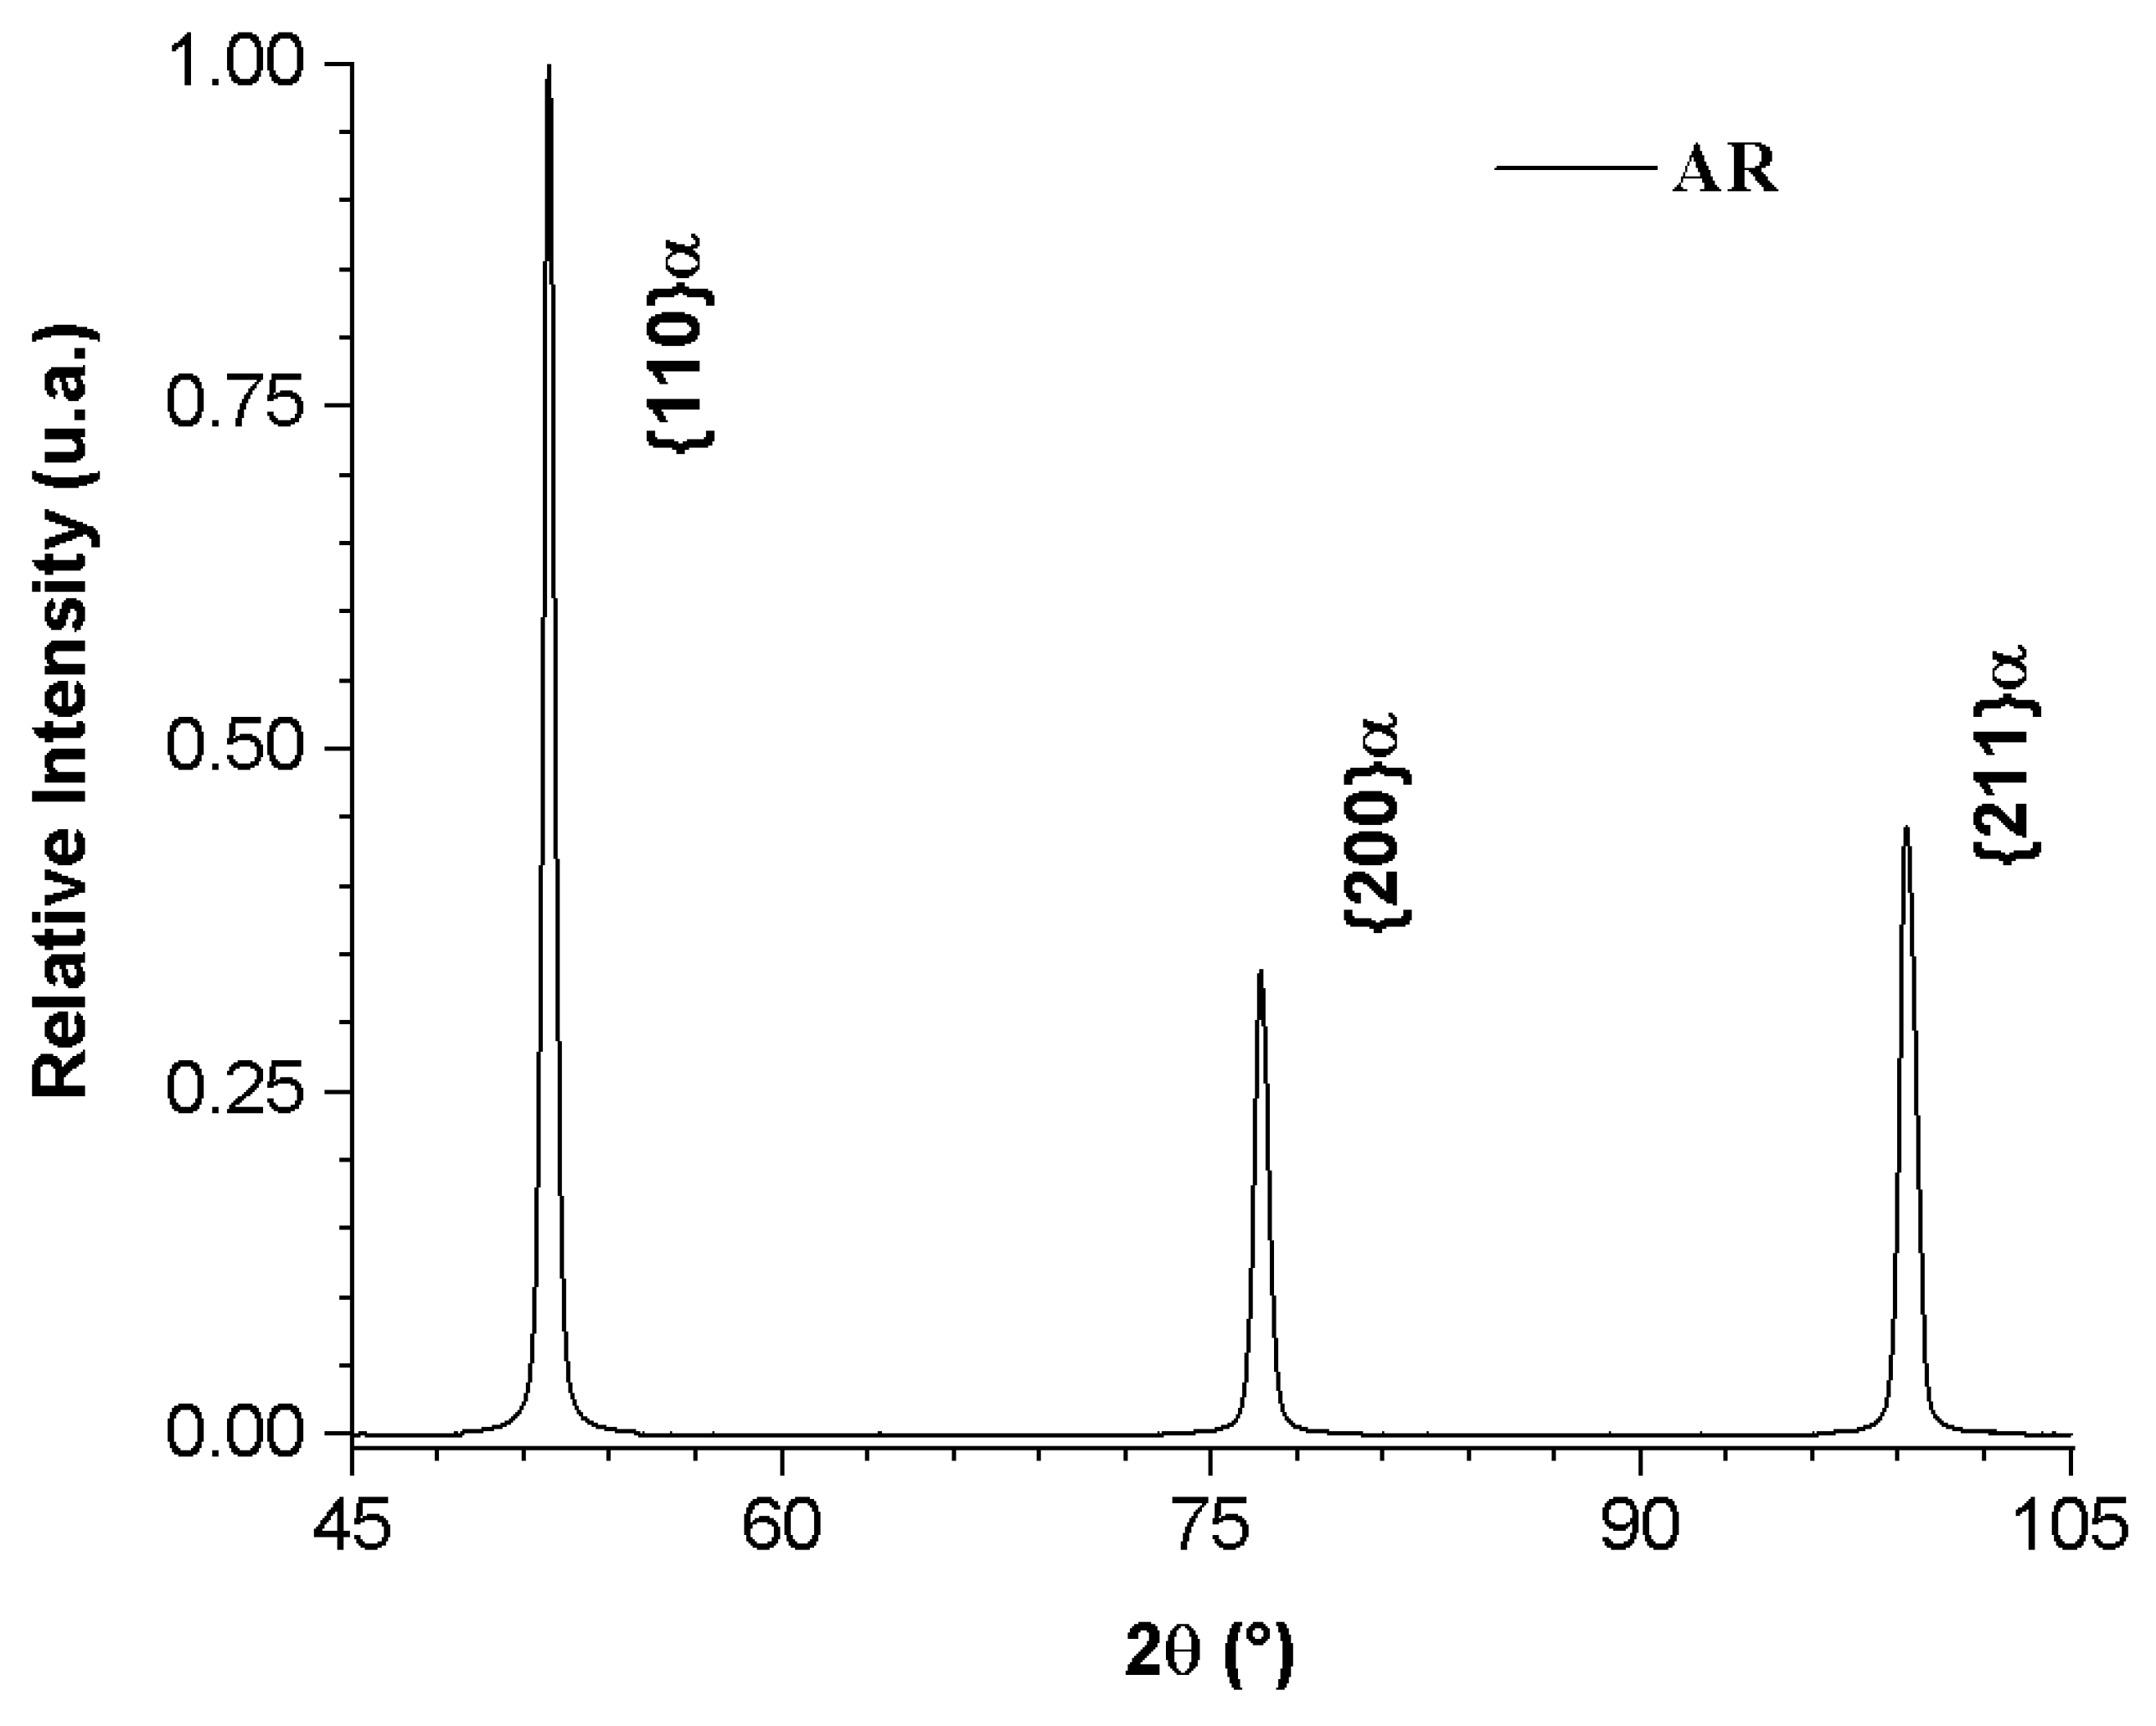
15 units per square meter for the as-received sample, which is indicative of mildly deformed samples. With respect to the peaks, those associated with the {200} and {211} planes families exhibit considerable intensity compared to the others. This configuration is due to the presence of texture in the material. Texture in rolled sheets is generally represented by {h k l} <u v w>, which indicates that the {h k l} planes of grains are parallel to the surface of the sheet (rolling plane), and that the <u v w> directions are oriented parallel to the rolling direction. These descriptions and X-ray methods can be found in various authors, such as Cullity [57]. Microdeformation decreases due to thermal treatments, because of the reorientations and elimination of dislocations that occurred in these samples when compared to the as-received material. The peaks of the {200} and {211} families in the heat-treated samples increase (for the REC sample) and decrease (for the ISO sample), which supports the alterations in the texture of these samples, compared to the as-received material.
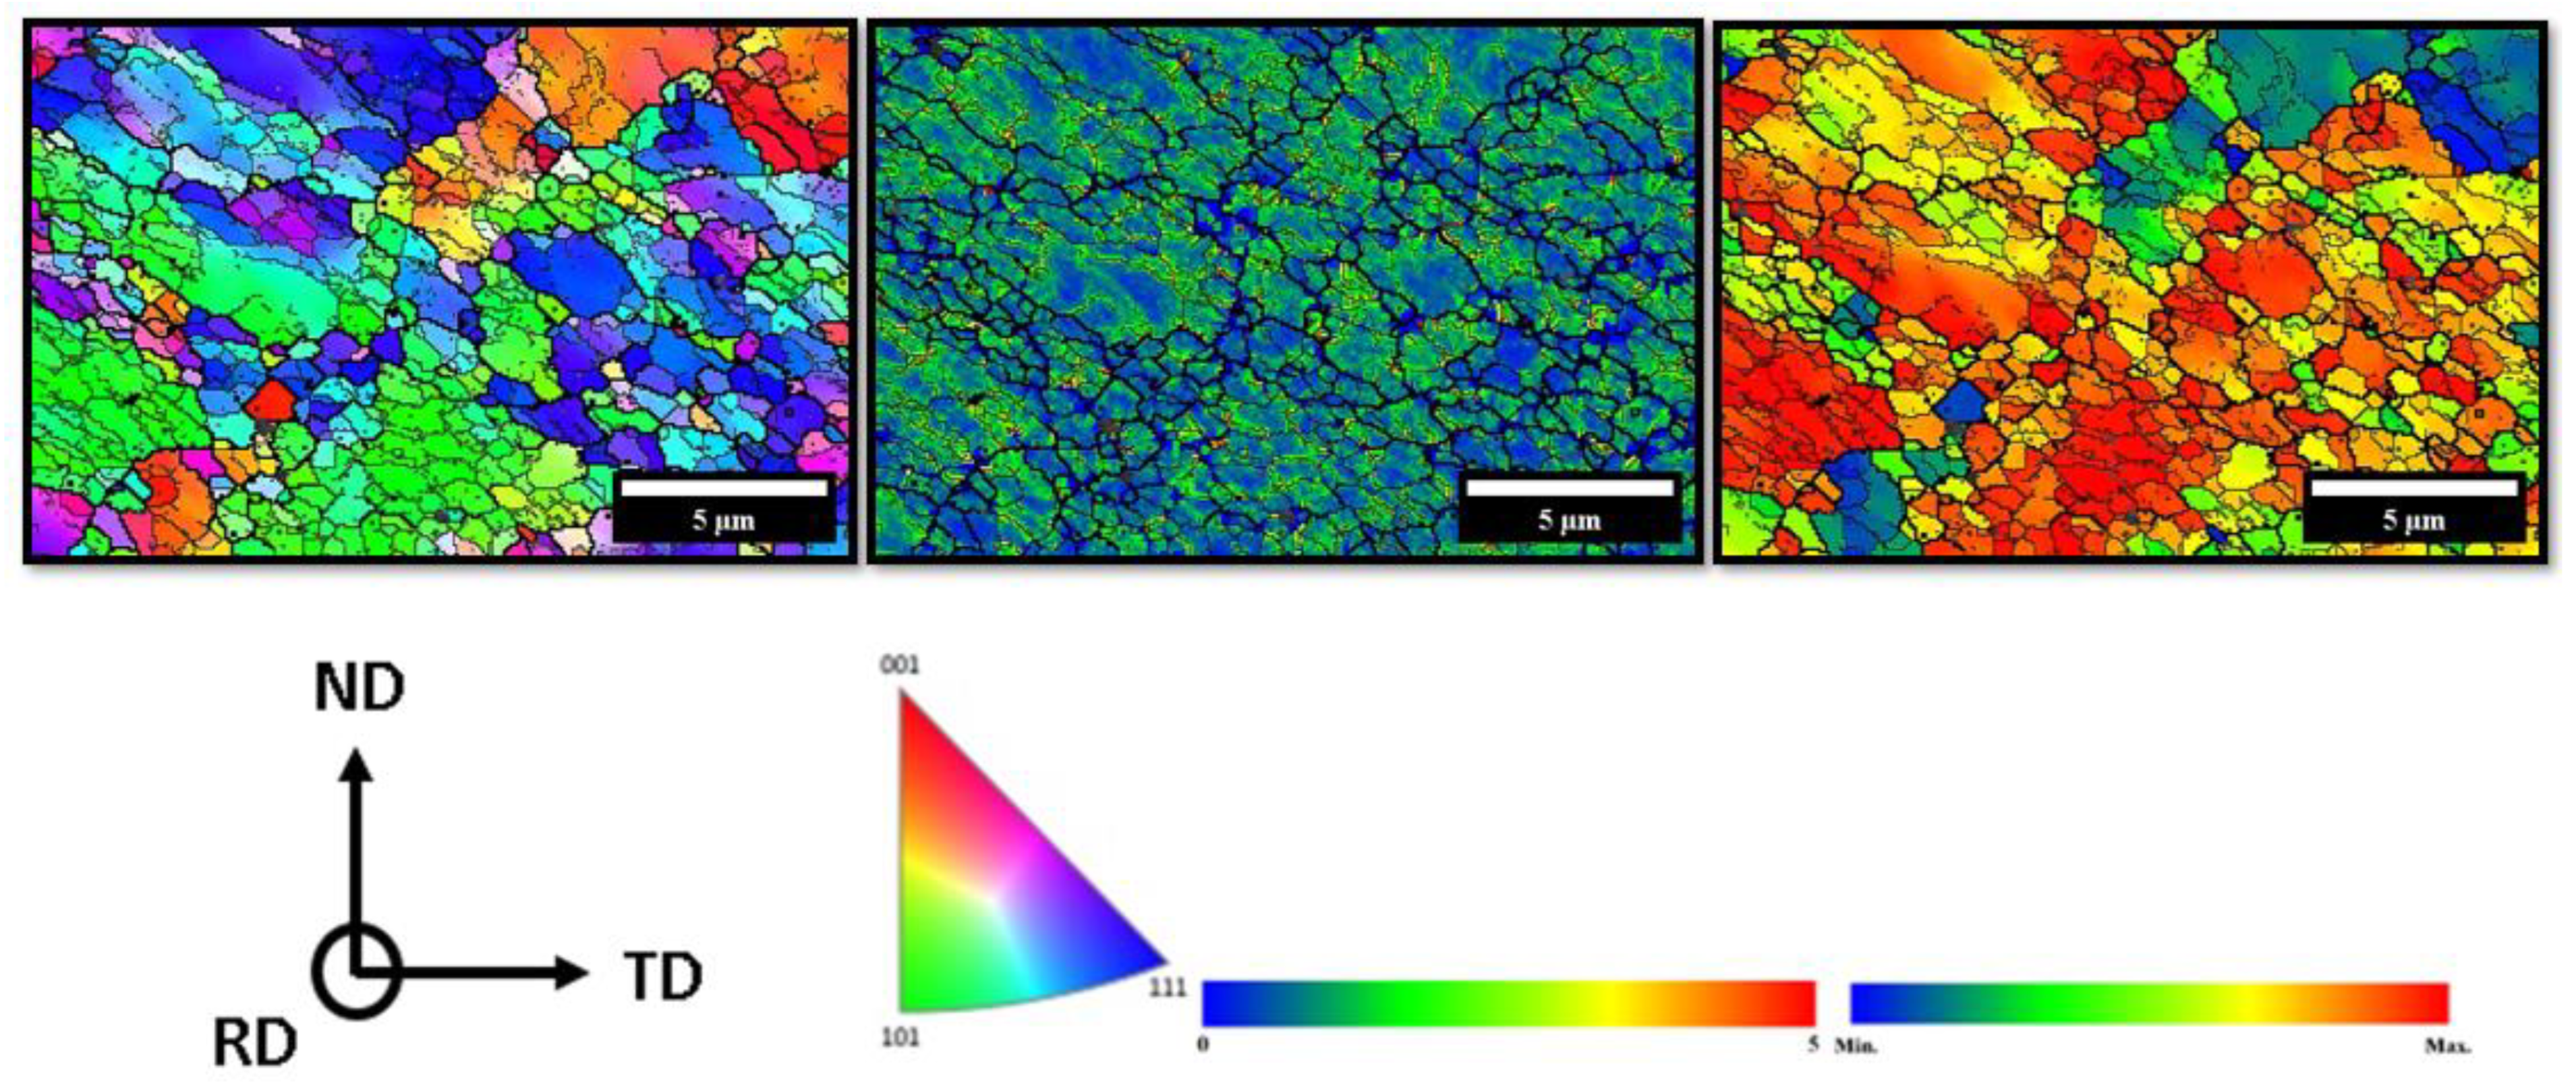
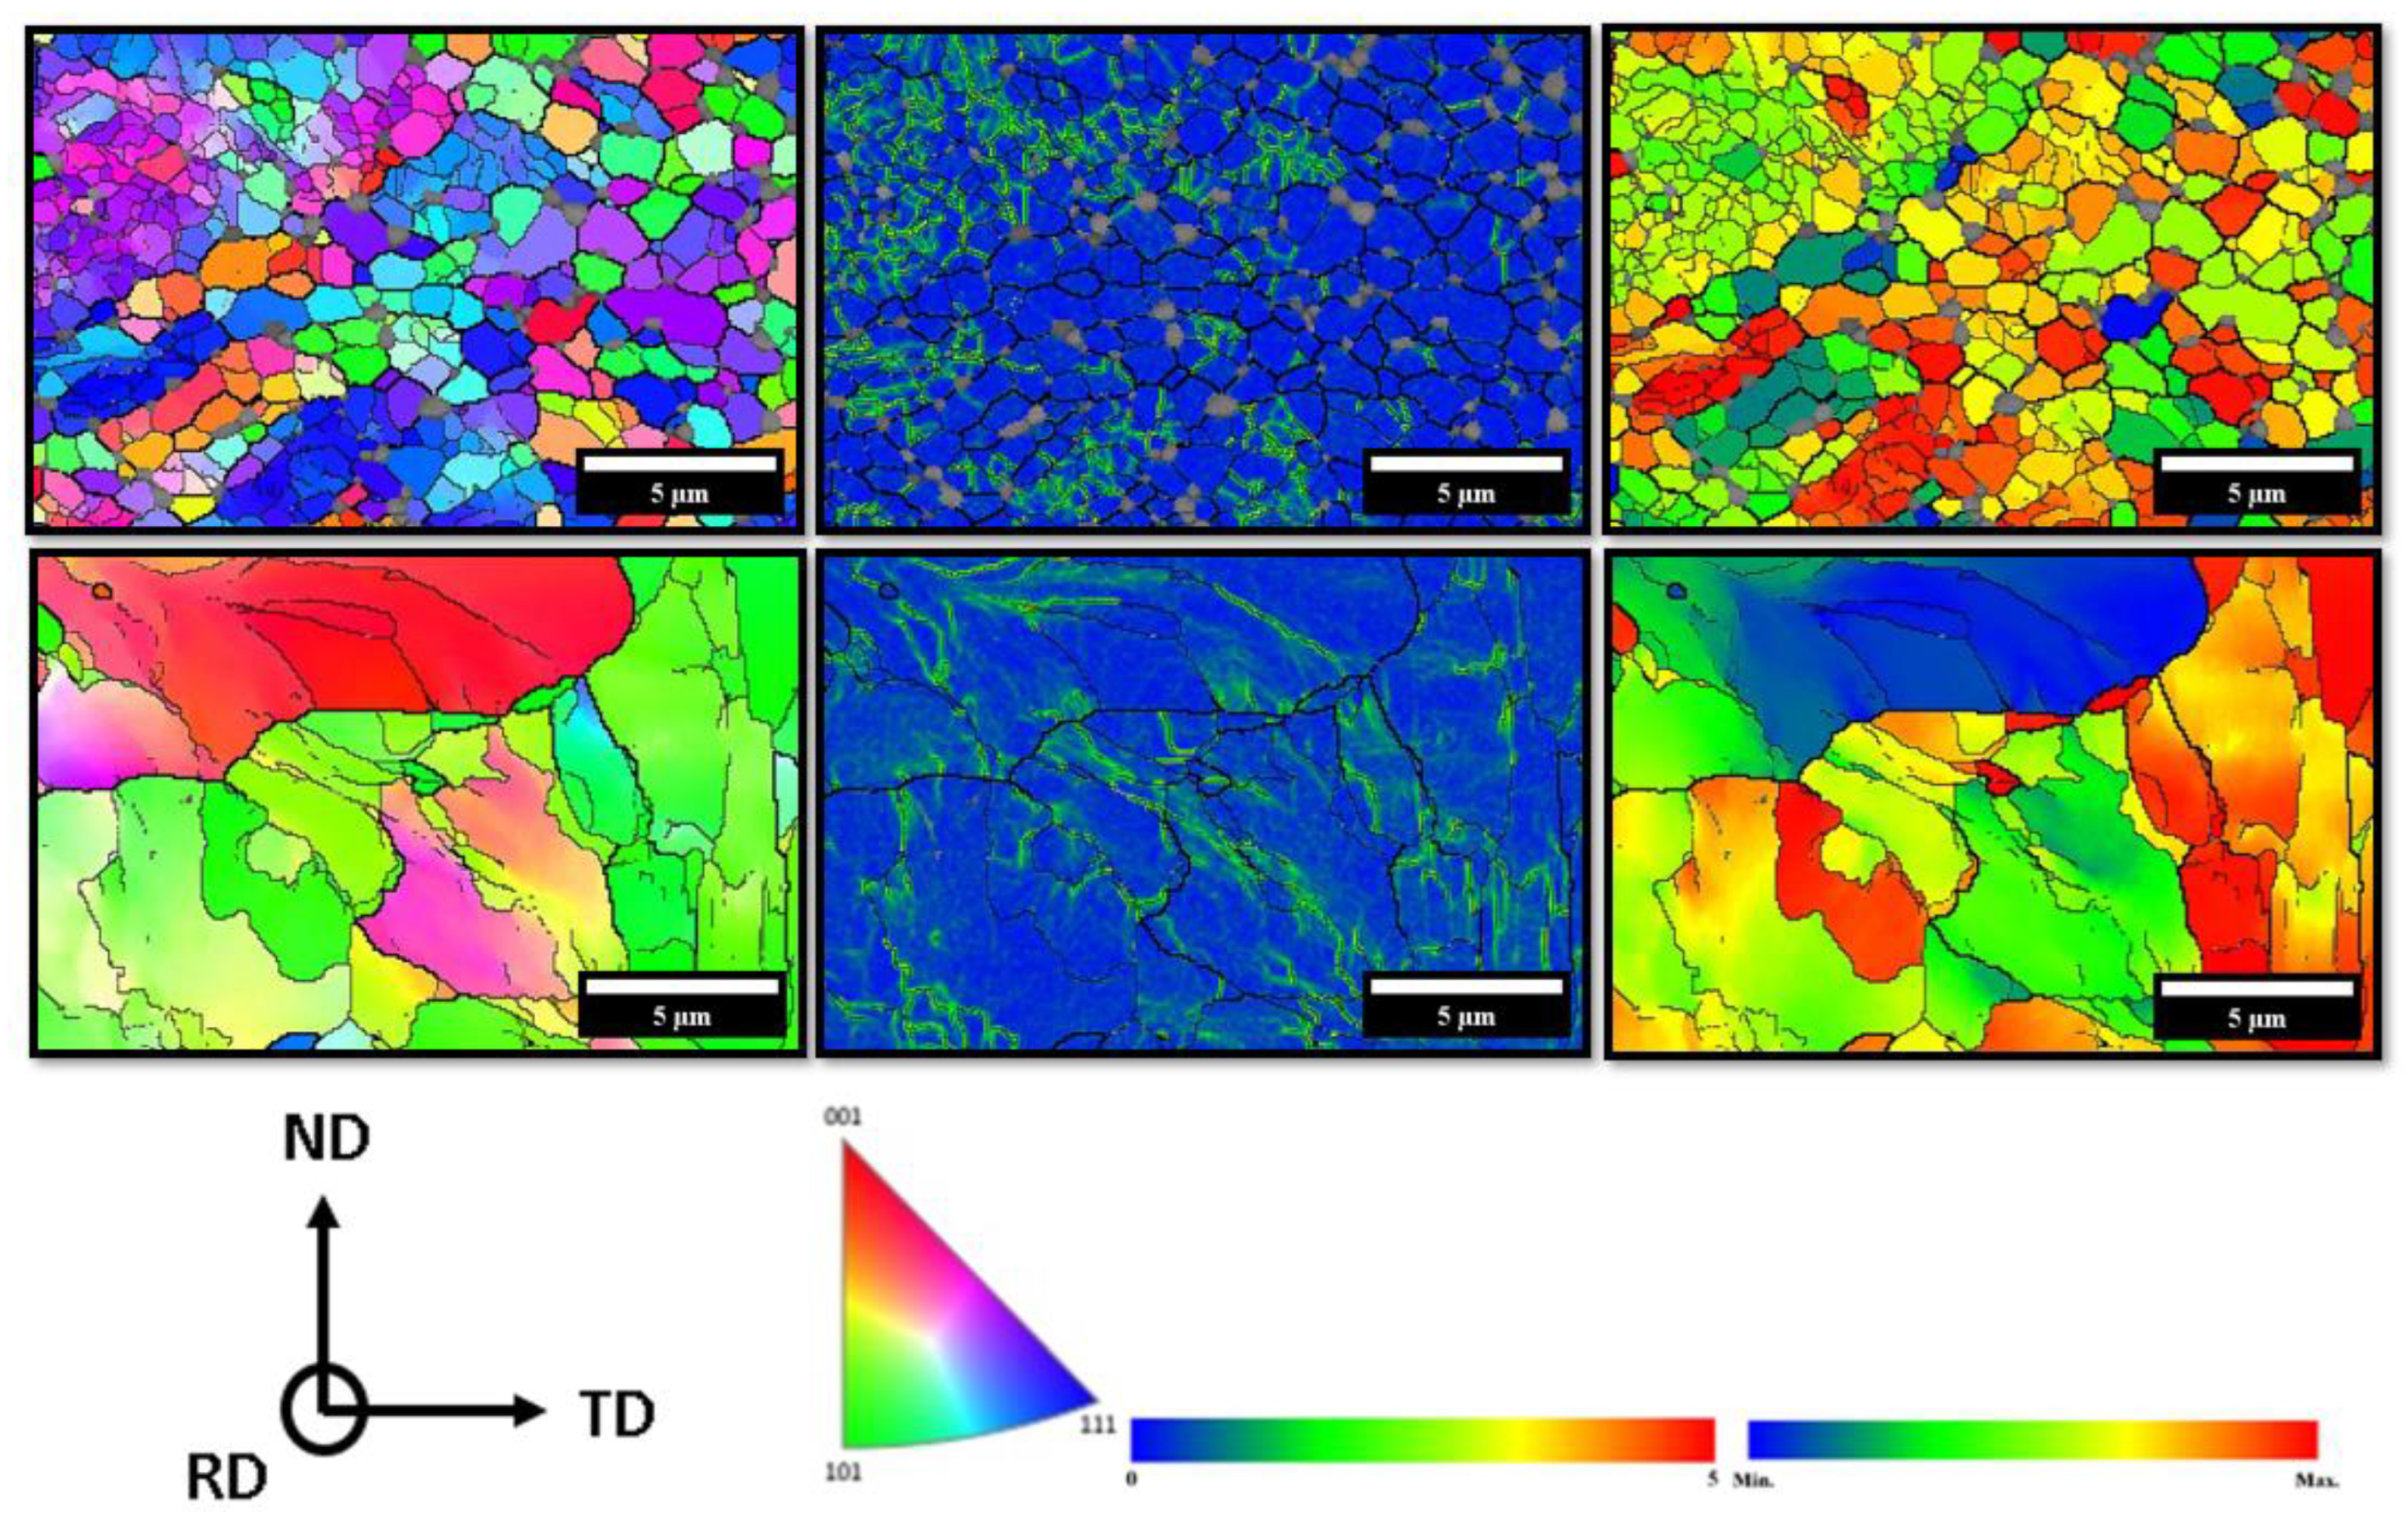
As of EBSD analyses, the annealing treatment promotes an increase in grain size, as observed in Figure 10. {110} grains with specific directions parallel to ND reorient themselves, changing to {111}, {001}, and {112} planes (indicated by the pink coloring). The KAM of the region highlights the poorly distributed misorientation within the grains, which is concentrated in planes oriented as {111} and {112}. The isothermal treatment promotes an even greater increase in grain size compared to the other samples, as observed in Figure 10. There is a significant reduction in the grain boundary density of this sample compared to the previous ones. {111} oriented grains reorient themselves, preferably changing to {110} and {001} planes, but the presence of {112} oriented grains can also be observed. The KAM of the region highlights the well-distributed misorientation within the grains, preferably as subgrain boundaries. The regions with higher misorientation gradients observed in the AR sample are also not present in these samples.
With annealing treatment, in the REC sample, the grains have a higher M index, which is predominantly observed in grains oriented as {110}. The grains oriented as {111} and {112} also exhibit high M values for this sample. The isothermal treatment in the ISO sample also increases the M index, which is predominantly observed in grains oriented as {110} and {112}. The thermal treatments lead to an increase in M, indicating that these treatments produce grains with a greater propensity for deformation. The grains oriented as {001} are mostly configured with low M, and this configuration, according to Masoumi et al. [50] provides resistance to the movement of dislocations. The microstructural changes occurring during thermal treatments lead to partial restoration of the material properties, which can be evaluated by variations in mechanical properties, electrical resistivity, density, and residual stresses [58]. Recrystallization can be treated as a phase transformation that occurs in two stages: nucleation and growth. The microstructural changes that occur during annealing of a cold-deformed material aim to decrease the energy stored in deformation by mechanisms of rearrangement and elimination of crystal defects, such as dislocations [42].
According to Haessner [59], the main microstructural changes that occur during recrystallization are as follows:
  • Reactions between point defects, leading to a decrease in their quantity;
  • Annihilation of dislocations of opposite signs and shrinkage of dislocation loops;
  • Rearrangement of dislocations to form configurations of lower energy (e.g., low-angle boundaries);
  • Formation of high-angle boundaries;
  • Absorption of point defects and dislocations by migrating high-angle boundaries;
  • Reduction in the total area of grain boundaries.
According to Padilha [42], the stages 1–4 define the ‘recovery’ treatment, and the entire process defines the ‘recrystallization’; since the distribution of crystalline defects after deformation is generally heterogeneous, each region of the material can go through the sequence of microstructural changes at different times. Taking these phenomena into consideration, 
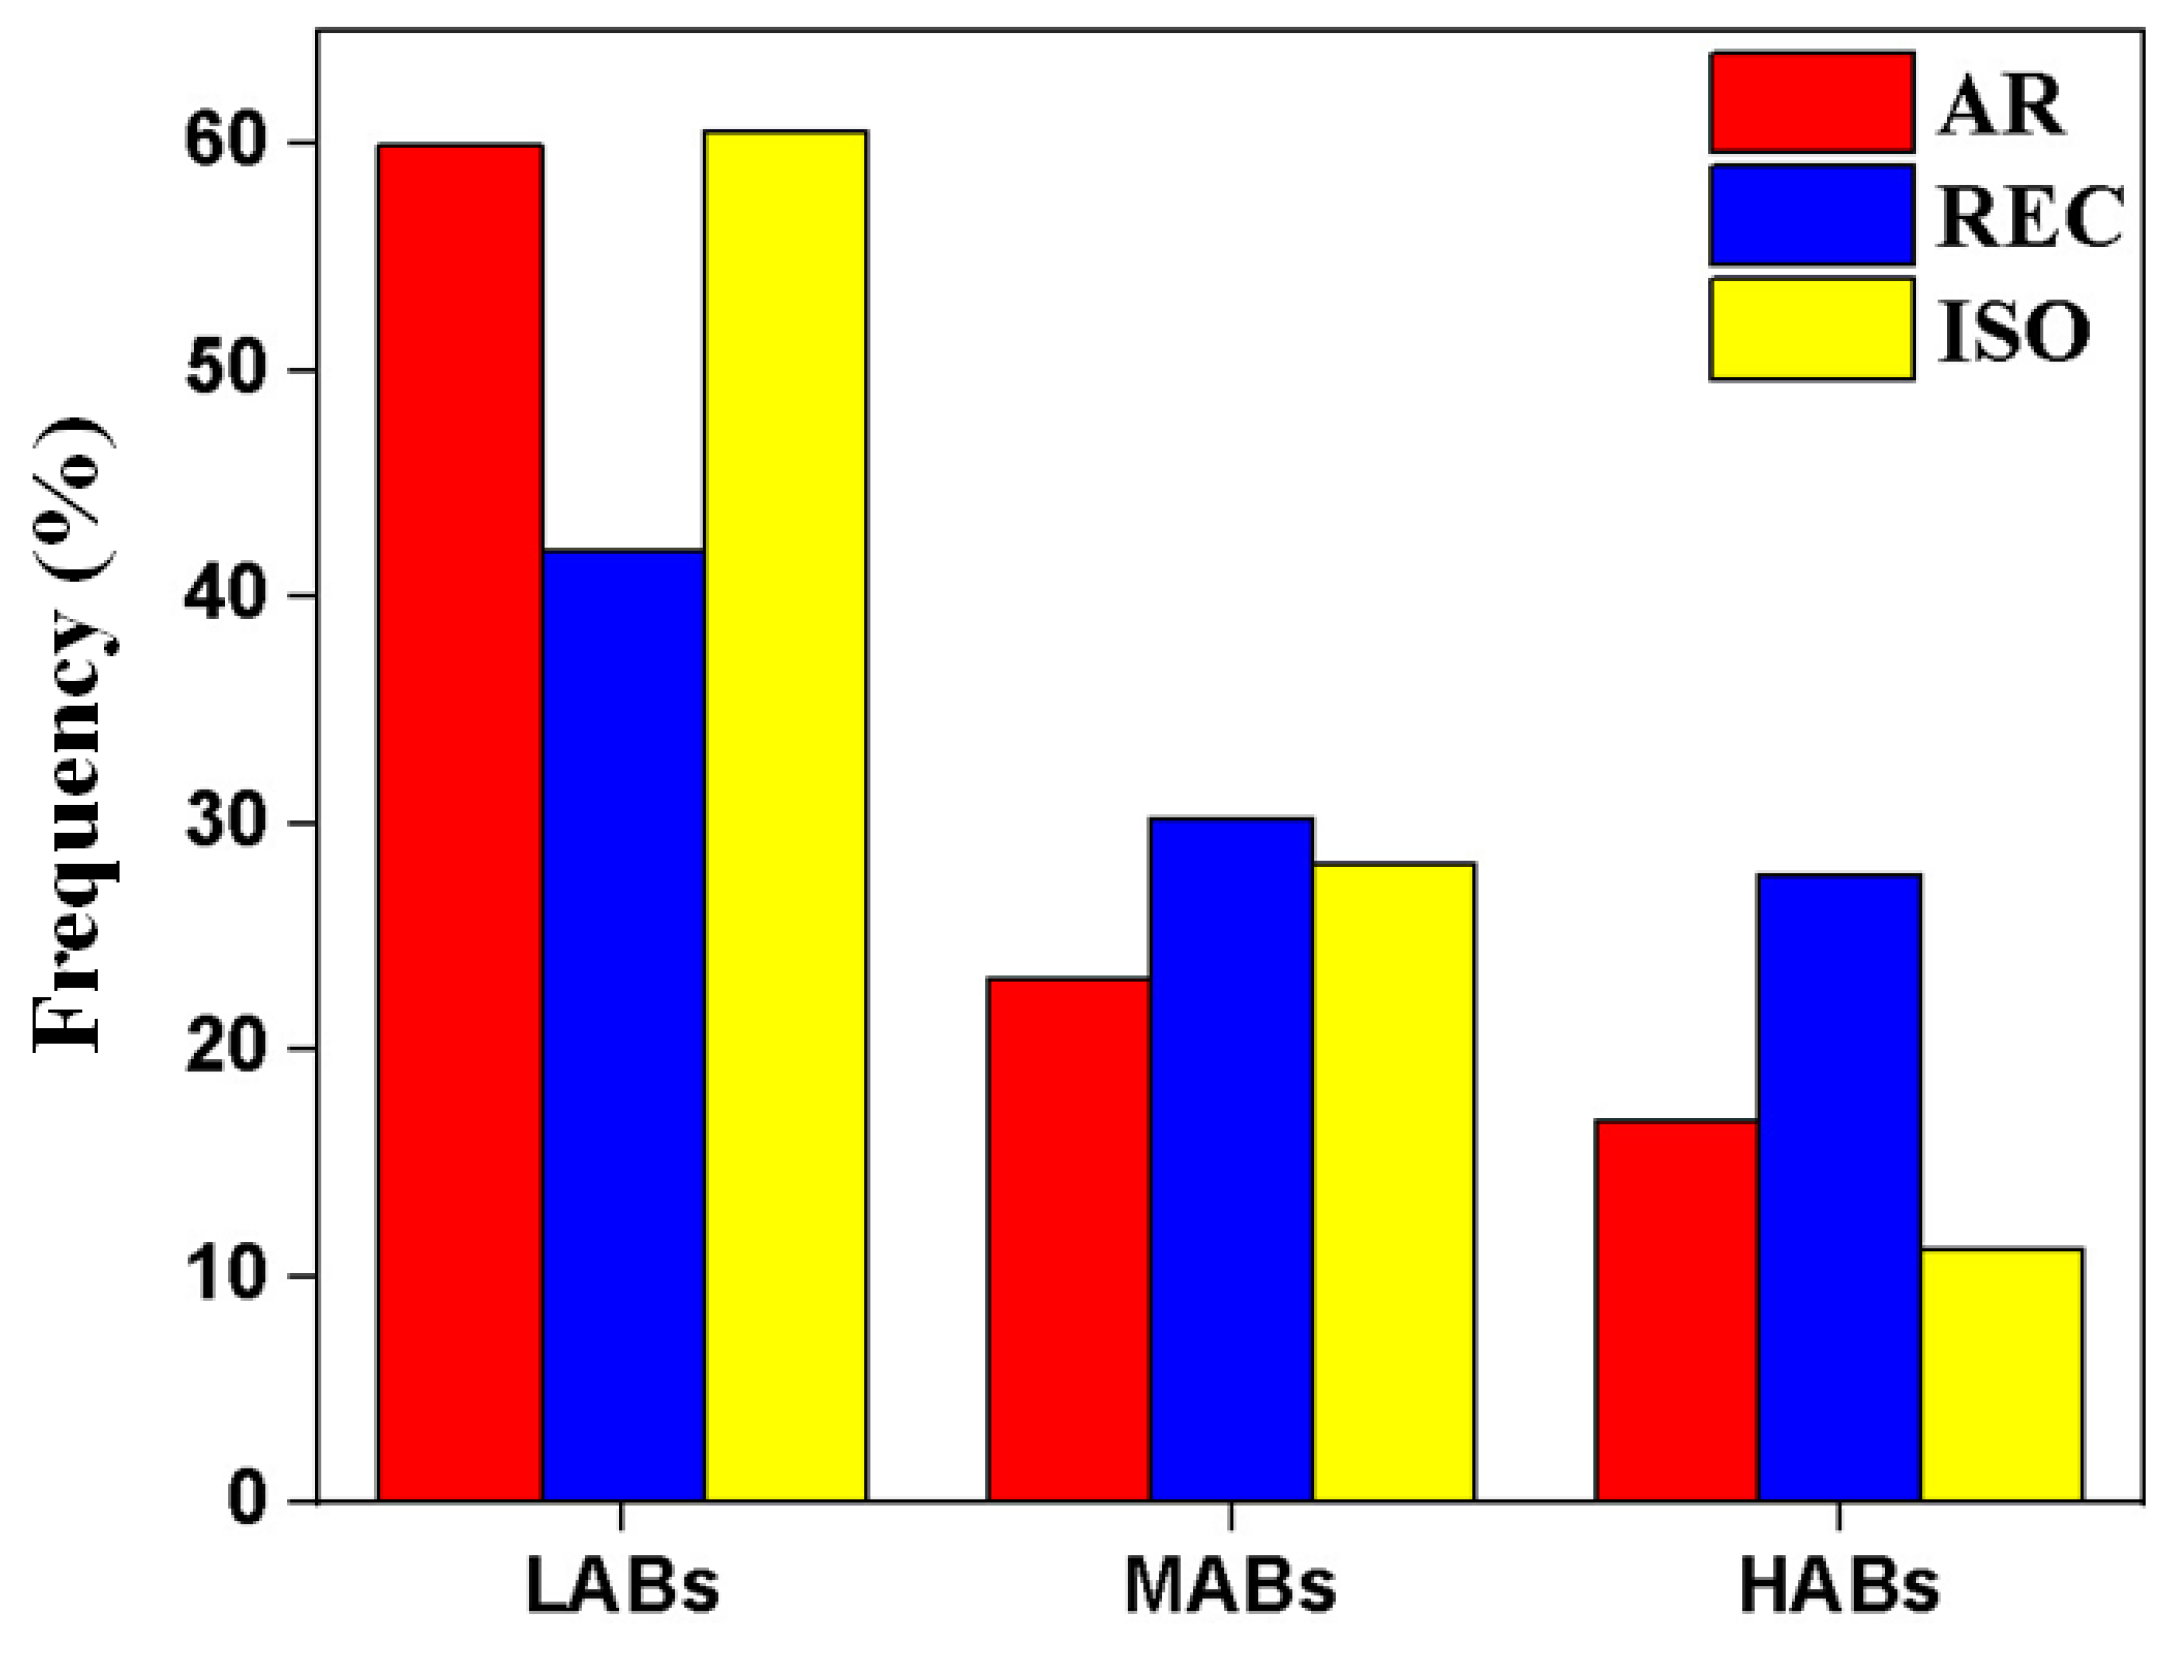
Figure 12 shows the distribution of grain boundaries relative to the OIMs in Figure 4 and Figure 10, which are LABs (low-angle boundaries, or grain boundaries with low angles, with 0° < θ < 5°); MABs (medium-angle boundaries, or grain boundaries with medium angles, with 5° < θ < 15°); and HABs (high-angle boundaries, or grain boundaries with high angles, with 15° < θ).
In this distribution, the annealing treatment, represented by the REC sample, shows a reduction in LAGBs to generate larger angle boundaries (MAGBs and HAGBs), as expected for recovery effects in this sample. However, in the isothermal treatment, represented by the ISO sample, there is a reduction in high-angle boundaries to form low- and medium-angle boundaries, but there is a significant reduction in the total area of boundaries, as observed in the recrystallized samples. So, the mechanism dominant for each treatment is recovery for REC sample and recrystallization for ISO sample.
As reported by Masoumi et al. [50], this configuration of the ISO sample is more ideal due to the greater difficulty in nucleating defects and propagating cracks compared to the AR and REC samples. The REC sample, on the other hand, with the increased number of medium and high-angle boundaries, has greater stored energy due to greater structural distortion and greater grain misorientation, leading to the opposite of what is observed in the ISO sample.
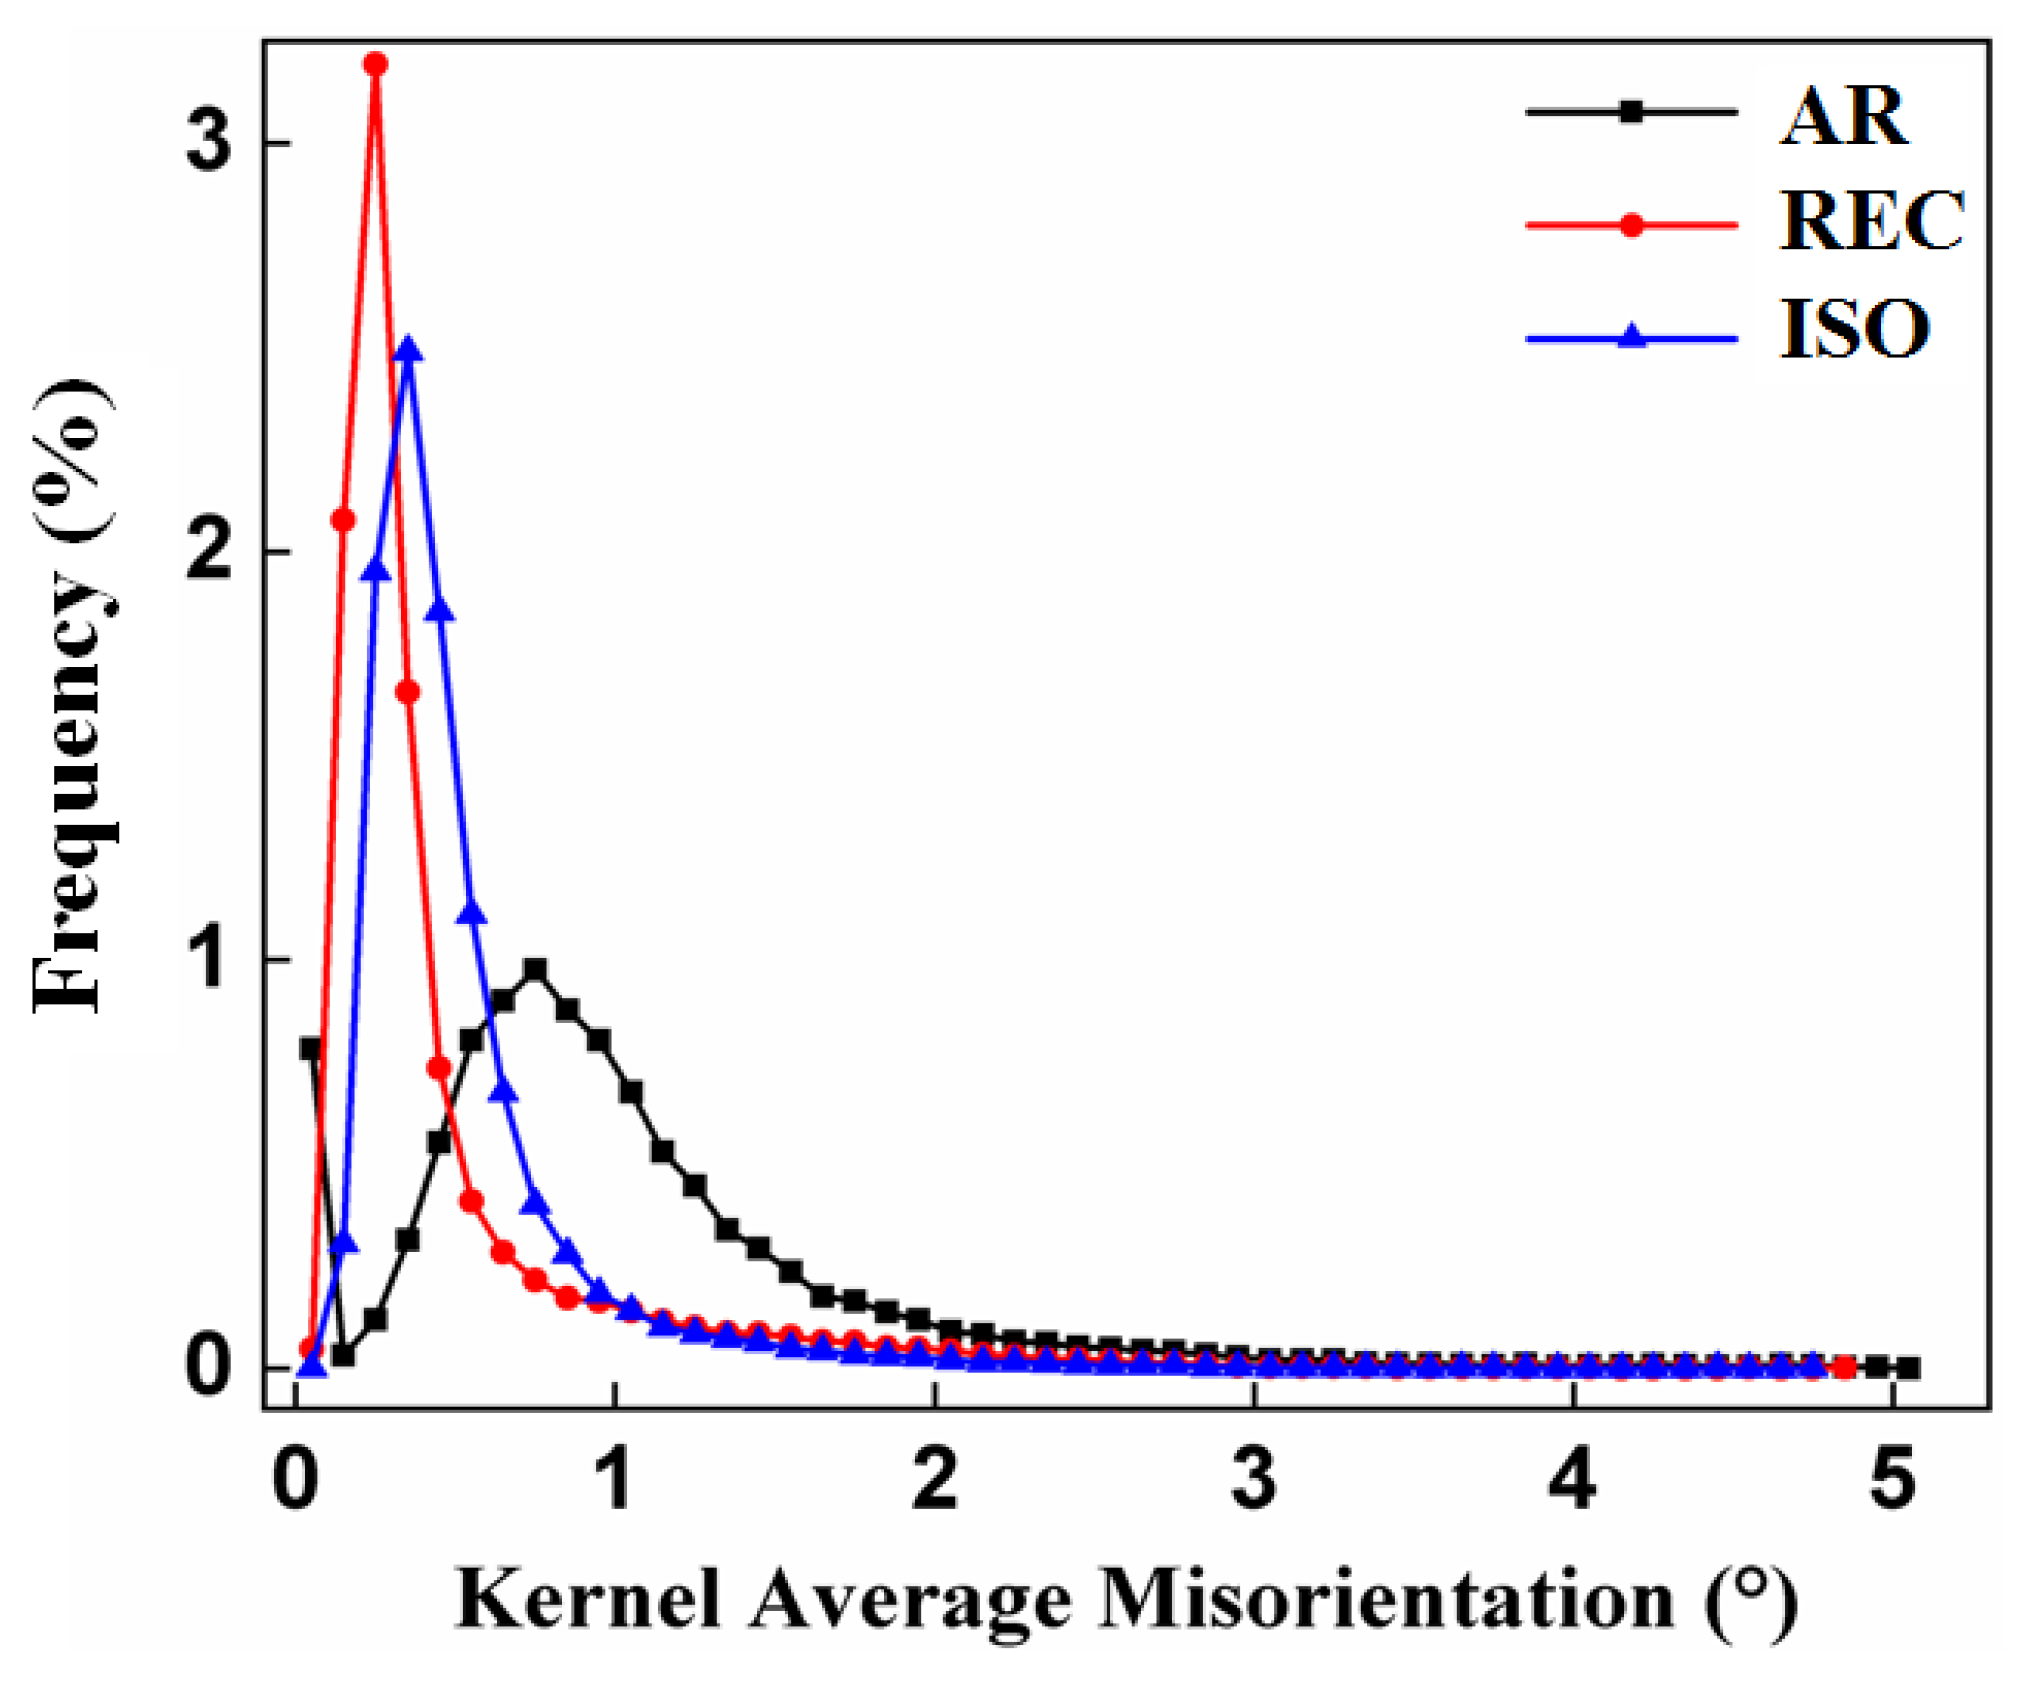
Based on the KAM analyses, it can be seen that the AR sample shows greater structural heterogeneity compared to the REC and ISO samples. To better understand the evolution of the microstructure, KAM analysis was used to measure the misorientation of a reference point and its three closest neighbors (third-order KAM). An angle limit of 5° was imposed to eliminate the effects of subgrain boundaries [60,61]. Figure 13 shows a distribution of the levels of misorientation in the samples.
The results confirm that the KAM values were reduced from the AR sample to the heat-treated samples due to the thermal treatments applied. This reduction represents less discrepancy between the orientations of reference points and their neighbors. This phenomenon can be explained by the reorientations and stress relief caused by the recovery and recrystallization of the heat-treated samples.
As observed in the refinement of the diffractograms, the removal of dislocations during the treatments has effects on the tensile tests, since the work hardening region is greatly increased in the graphs (this is the region defined between the beginnings of yielding until the U.T.S.). This increase is defined by the generation of new dislocations and the agglomeration of existing ones, increasing the resistance for the onset of necking during the test. Due to the as-received sample already having a high density of dislocations, and these dislocations being homogeneously distributed throughout the material structure, this region of the graph is smaller in this case. The yield strength is severely reduced by the heat treatments. As previously evidenced, this reduction is caused by the change in the spacing of cementite lamellae (or removal of the lamellar structure), as well as the increase in the grain size of the samples. Although the mechanical strength is partially reduced by the heat treatments, the observed increase in toughness is evident. Considering the evaluated criteria (toughness, ductility, and mechanical strength), the ISO sample has better properties in the pre-established criteria for the failure prevention condition of this material.

5. Conclusions

In the present research, a pearlite-drawn wire used for flexible marine pipelines was investigated, in both the as-received form and after the application of heat treatments, by means of microstructural characterization. The results and analysis presented here led to the following conclusions:
  • Isothermal treatment, through the mechanisms of morphology change and according to the Hall–Petch relationship, increases the material’s mechanical strength, while annealing reduces the mechanical strength but greatly increases the material’s ductility.
  • The treatments reduce the density of dislocations and the level of local distortion and modify the internal energy of the grains. Annealing provides the material with easily deformable grains, while isothermal treatment provides the growth of grains with high internal energy, with more resistance to deformation.
  • Annealing increases the intensity of all texture components, while isothermal treatment reduces this intensity. However, both treatments make the desired components more significant.
  • Isothermal treatment is more suitable to optimize the design and performance of flexible pipelines, reducing the need for expensive pipeline integrity verification methods.

Author Contributions

Conceptualization, P.H.P., M.M., S.K.B.d.L., L.F.G.H. and H.F.G.d.A.; Investigation, P.H.P., M.M., L.F.G.H., J.V.B.X., S.F.R. and H.F.G.d.A.; Visualization, P.H.P., M.M., L.F.G.H., E.S.S., G.S.R., S.F.R. and H.F.G.d.A. Data curation, P.H.P., M.M., L.F.G.H., S.K.B.d.L., J.V.B.X. and H.F.G.d.A.; Writing—Original Draft, P.H.P., S.K.B.d.L. and J.V.B.X.; Writing—Review and Editing, P.H.P., M.M., L.F.G.H., E.S.S., G.S.R. and H.F.G.d.A.; Software, P.H.P., M.M., L.F.G.H., S.F.R., E.S.S., G.S.R. and H.F.G.d.A.; Validation, P.H.P., M.M., L.F.G.H., S.F.R. and H.F.G.d.A.; Supervision, M.M., L.F.G.H., S.F.R. and H.F.G.d.A.; Funding acquisition, M.M., L.F.G.H., S.F.R. and H.F.G.d.A. All authors have read and agreed to the published version of the manuscript.

Funding

This study was supported by Research and Support Foundation of Maranhão (FAPEMA), Coordenação de Aperfeiçoamento de Pessoal de Nível Superior—Brasil (CAPES) and Brazilian National Council for Scientific and Technological Development (CNPq).

Data Availability Statement

Not applicable.

Acknowledgments

The authors acknowledge with gratitude the team of the Materials Characterization Laboratory (LACAM), Analytical Central from Federal University of Ceará (UFC), Laboratório de Pesquisa e Tecnologia em Soldagem (LPTS), Research and Support Foundation of Maranhão (FAPEMA), Coordenação de Aperfeiçoamento de Pessoal de Nível Superior—Brasil (CAPES) and Brazilian National Council for Scientific and Technological Development (CNPq).

Conflicts of Interest

The authors declare that they have no known competing financial interest or personal relationships that could have appeared to influence the work reported in this paper.

References

  1. Toribio:, J.; Lorenzo, M. Reduction of Residual Stresses in Cold Drawn Pearlitic Steel by a Soft Secondary Wire Diameter Reduction. Metals 2023, 13, 433. [Google Scholar] [CrossRef]
  2. Schastlivtsev, V.M.; Yakovleva, I.L. Fine-Lamellar Pearlite: The First Bulk Nanomaterial in Carbon Steel. Bull. Russ. Acad. Sci. Phys. 2015, 79, 1077–1080. [Google Scholar] [CrossRef]
  3. Li, L.; Virta, J. Ultrahigh Strength Steel Wires Processed by Severe Plastic Deformation for Ultrafine Grained Microstructure. Mater. Sci. Technol. 2011, 27, 845–862. [Google Scholar] [CrossRef]
  4. Yuan, L.; Gou, F.; Sun, D.; Li, Z.; Xue, Y. The Effects of Cold Rolling and Annealing on the Microstructure Evolution of Ordered C-2000 Alloy during Metallic Wire Preparation. Metals 2023, 13, 651. [Google Scholar] [CrossRef]
  5. Hong, M.H.; Reynolds, W.T.; Tarui, T.; Hono, K. Atom Probe and Transmission Electron Microscopy Investigations of Heavily Drawn Pearlitic Steel Wire. Metall. Mater. Trans. A Phys. Metall. Mater. Sci. 1999, 30, 717–727. [Google Scholar] [CrossRef]
  6. Fang, F.; Hu, X.J.; Chen, S.H.; Xie, Z.H.; Jiang, J.Q. Revealing Microstructural and Mechanical Characteristics of Cold-Drawn Pearlitic Steel Wires Undergoing Simulated Galvanization Treatment. Mater. Sci. Eng. A 2012, 547, 51–54. [Google Scholar] [CrossRef]
  7. Radionova, L.V.; Gromov, D.V.; Svistun, A.S.; Lisovskiy, R.A.; Faizov, S.R.; Glebov, L.A.; Zaramenskikh, S.E.; Bykov, V.A.; Erdakov, I.N. Mathematical Modeling of Heating and Strain Aging of Steel during High-Speed Wire Drawing. Metals 2022, 12, 1472. [Google Scholar] [CrossRef]
  8. Zhang, X.; Godfrey, A.; Huang, X.; Hansen, N.; Liu, Q. Microstructure and Strengthening Mechanisms in Cold-Drawn Pearlitic Steel Wire. Acta Mater. 2011, 59, 3422–3430. [Google Scholar] [CrossRef]
  9. Li, Y.; Raabe, D.; Herbig, M.; Choi, P.P.; Goto, S.; Kostka, A.; Yarita, H.; Borchers, C.; Kirchheim, R. Segregation Stabilizes Nanocrystalline Bulk Steel with near Theoretical Strength. Phys. Rev. Lett. 2014, 113, 106104. [Google Scholar] [CrossRef]
  10. Zhang, X.; Hansen, N.; Godfrey, A.; Huang, X. Dislocation-Based Plasticity and Strengthening Mechanisms in Sub-20 Nm Lamellar Structures in Pearlitic Steel Wire. Acta Mater. 2016, 114, 176–183. [Google Scholar] [CrossRef]
  11. Toribio, J.; Valiente, A. Failure Analysis of Cold Drawn Eutectoid Steel Wires for Prestressed Concrete. Eng. Fail. Anal. 2006, 13, 301–311. [Google Scholar] [CrossRef]
  12. Hwang, Y.-M.; Tsui, H.S.R.; Lin, M.-R. Investigations on Effects of Forming Parameters on Product Dimensions in Cold Drawing of AISI-316 Stainless Steel Rods. Metals 2022, 12, 690. [Google Scholar] [CrossRef]
  13. Raabe, D.; Choi, P.P.; Li, Y.; Kostka, A.; Sauvage, X.; Lecouturier, F.; Hono, K.; Kirchheim, R.; Pippan, R.; Embury, D. Metallic Composites Processed via Extreme Deformation: Toward the Limits of Strength in Bulk Materials. MRS Bull. 2010, 35, 982–991. [Google Scholar] [CrossRef]
  14. Takahashi, J.; Kosaka, M.; Kawakami, K.; Tarui, T. Change in Carbon State by Low-Temperature Aging in Heavily Drawn Pearlitic Steel Wires. Acta Mater. 2012, 60, 387–395. [Google Scholar] [CrossRef]
  15. Joung, S.W.; Kang, U.G.; Hong, S.P.; Kim, Y.W.; Nam, W.J. Aging Behavior and Delamination in Cold Drawn and Post-Deformation Annealed Hyper-Eutectoid Steel Wires. Mater. Sci. Eng. A 2013, 586, 171–177. [Google Scholar] [CrossRef]
  16. Li, Y.J.; Kostka, A.; Choi, P.; Goto, S.; Ponge, D.; Kirchheim, R.; Raabe, D. Mechanisms of Subgrain Coarsening and Its Effect on the Mechanical Properties of Carbon-Supersaturated Nanocrystalline Hypereutectoid Steel. Acta Mater. 2015, 84, 110–123. [Google Scholar] [CrossRef]
  17. Li, Y.J.; Choi, P.; Goto, S.; Borchers, C.; Raabe, D.; Kirchheim, R. Evolution of Strength and Microstructure during Annealing of Heavily Cold-Drawn 6.3 GPa Hypereutectoid Pearlitic Steel Wire. Acta Mater. 2012, 60, 4005–4016. [Google Scholar] [CrossRef]
  18. Borchers, C.; Chen, Y.; Deutges, M.; Goto, S.; Kirchheim, R. Carbon-Defect Interaction during Recovery and Recrystallization of Heavily Deformed Pearlitic Steel Wires. Philos. Mag. Lett. 2010, 90, 581–588. [Google Scholar] [CrossRef]
  19. Borchers, C.; Lehmberg, A.; Deutges, M.; Cižek, J.; Kirchheim, R. Effect of Annealing on Point Defect Population in Cold-Drawn Pearlitic Steel Wires. Scr. Mater. 2014, 86, 17–19. [Google Scholar] [CrossRef]
  20. Zhou, L.; Fang, F.; Zhou, X.; Tu, Y.; Xie, Z.; Jiang, J. Cementite Nano-Crystallization in Cold Drawn Pearlitic Wires Instigated by Low Temperature Annealing. Scr. Mater. 2016, 120, 5–8. [Google Scholar] [CrossRef]
  21. Zhou, L.; Fang, F.; Wang, L.; Chen, H.; Xie, Z.; Jiang, J. Torsion Delamination and Recrystallized Cementite of Heavy Drawing Pearlitic Wires after Low Temperature Annealing. Mater. Sci. Eng. A 2018, 713, 52–60. [Google Scholar] [CrossRef]
  22. Zhao, Y.; Tan, Y.; Ji, X.; He, Y.; Liang, Y.U.; Xiang, S. Effect of Microstructure and Microtexture on the Mechanical Properties of Small-Strain Cold-Drawn Pearlite Steel Wires. Miner. Met. Mater. Soc. 2019, 71, 4041–4049. [Google Scholar] [CrossRef]
  23. Guelton, N.; Ois, M.F. Microstructure-Property Relationship in Cold-Drawn Pearlitic Steel Wires. Miner. Met. Mater. Soc. ASM Int. 2020, 51, 1543–1566. [Google Scholar] [CrossRef]
  24. Clouet, E.; Garruchet, S.; Nguyen, H.; Perez, M.; Becquart, C.S. Dislocation Interaction with C in α-Fe: A Comparison between Atomic Simulations and Elasticity Theory. Acta Mater. 2008, 56, 3450–3460. [Google Scholar] [CrossRef]
  25. Leão, P.B.P.; Zhang, S.; Neto, J.R.B.; Freire, S.A.; Loureiro, R.d.C.P.; Ramirez, A.J.; de Abreu, H.F.G. Microstructure, Microtexture, and Crack Susceptibility in Pearlitic Steel during Lab-Simulated Processes Aiming Tensile Armor Application in Flexible Pipelines. J. Mater. Process. Technol. 2023, 316, 117950. [Google Scholar] [CrossRef]
  26. Zhang, F.; Zhao, Y.; Tan, Y.; Ji, X.; Xiang, S. Study on the Nucleation and Growth of Pearlite Colony and Impact Toughness of Eutectoid Steel. Metals 2019, 9, 1133. [Google Scholar] [CrossRef]
  27. Cai, Z.; Gan, X.; Li, Y.; Liu, S.; Bao, S.; Xu, G. Influences of Strain on the Microstructure and Mechanical Properties of High-Carbon Steel. Metals 2022, 12, 1518. [Google Scholar] [CrossRef]
  28. Masoumi, M.; de Carvalho Paes Loureiro, R.; Pinheiro, P.; Cardoso, J.L.; Béreš, M.; de Abreu, H.F.G. Effect of Pre-Strain on Microstructure, Texture, and Strengthening of Fully Pearlitic Steel. J. Mater. Eng. Perform. 2022, 31, 4642–4654. [Google Scholar] [CrossRef]
  29. Yang, C.-D.; Liu, Y.; Zhou, G.-Y.; Zou, X.-L.; Lu, X.-G.; Cao, G.-H. Microstructural Evolution of SK85 Pearlitic Steel Deformed by Heavy Cold Rolling. Materials 2022, 15, 8405. [Google Scholar] [CrossRef]
  30. Nematollahi, G.A.; Grabowski, B.; Raabe, D.; Neugebauer, J. Multiscale Description of Carbon-Supersaturated Ferrite in Severely Drawn Pearlitic Wires. Acta Mater. 2016, 111, 321–334. [Google Scholar] [CrossRef]
  31. Li, Y.J.; Choi, P.; Borchers, C.; Westerkamp, S.; Goto, S.; Raabe, D.; Kirchheim, R. Atomic-Scale Mechanisms of Deformation-Induced Cementite Decomposition in Pearlite. Acta Mater. 2011, 59, 3965–3977. [Google Scholar] [CrossRef]
  32. Kim, J.; Kang, K.; Ryu, S. Characterization of the Misfit Dislocations at the Ferrite/Cementite Interface in Pearlitic Steel: An Atomistic Simulation Study. Int. J. Plast. 2016, 83, 302–312. [Google Scholar] [CrossRef]
  33. Zhou, Y.T.; Zheng, S.J.; Jiang, Y.X.; Zhao, T.Z.; Wang, Y.J.; Ma, X.L. Atomic Structure of the Fe/Fe3C Interface with the Isaichev Orientation in Pearlite. Philos. Mag. 2017, 97, 2375–2386. [Google Scholar] [CrossRef]
  34. Saunders, N.; Guo, Z.; Miodownik, A.P.; Schillé, J.-P. The Calculation of TTT and CCT Diagrams for General Steels. JMatPro Softw. Lit. 2004, 1–12. [Google Scholar]
  35. Izotov, V.I.; Pozdnyakov, V.A.; Luk’yanenko, E.V.; Usanova, O.Y.; Filippov, G.A. Influence of the Pearlite Fineness on the Mechanical Properties, Deformation Behavior, and Fracture Characteristics of Carbon Steel. Phys. Met. Metallogr. 2007, 103, 519–529. [Google Scholar] [CrossRef]
  36. Dikić, S.; Glišić, D.; Fadel, A.; Jovanović, G.; Radović, N. Structure and Strength of Isothermally Heat-Treated Medium Carbon Ti-v Microalloyed Steel. Metals 2021, 11, 1011. [Google Scholar] [CrossRef]
  37. Bankole, S.A.; Buckman, J.; Stow, D.; Lever, H. Grain-Size Analysis of Mudrocks: A New Semi-Automated Method from SEM Images. J. Pet. Sci. Eng. 2019, 174, 244–256. [Google Scholar] [CrossRef]
  38. ISO 13067:2011; Microbeam Analysis—Electron Backscatter Diffraction—Measurement of Average Grain Size. Ansi International Standard: Washington, DC, USA, 2011.
  39. Chan, K.S. Changes in Fatigue Life Mechanism Due to Soft Grains and Hard Particles. Int. J. Fatigue 2010, 32, 526–534. [Google Scholar] [CrossRef]
  40. Wilson, G.J.; Matijasevich, A.S.; Mitchell, D.R.G.; Schulz, J.C.; Will, G.D. Modification of TiO2 for Enhanced Surface Properties: Finite Ostwald Ripening by a Microwave Hydrothermal Process. Langmuir 2006, 22, 2016–2027. [Google Scholar] [CrossRef]
  41. American Society for Testing and Materials. ASTM E8/E8M Standard Test Methods for Tension Testing of Metallic Materials 1. In Annual Book of ASTM Standards 4; ASTM: West Conshohocken, PA, USA, 2010; pp. 1–27. [Google Scholar]
  42. Padilha, A.F.; Siciliano, F., Jr. Encruamento, Recristalização, Crescimento de Grão e Textura, 3rd ed.; Blucher: São Paulo, Brazil, 2005; Volume 1, ISBN 858677880X. [Google Scholar]
  43. Toribio, J.; Ayaso, F.J.; Rodríguez, R. Drawing-Induced Evolution of Inclusions in Cold-Drawn Pearlitic Steel. Metals 2021, 11, 1272. [Google Scholar] [CrossRef]
  44. Hyzak, J.M.; Bernstein, I.M. The Role of Microstructure on the Strength and Toughness of Fully Pearlitic Steels. Metall. Trans. A 1976, 7, 1217–1224. [Google Scholar] [CrossRef]
  45. Ray, R.K.; Jonas, J.J. Transformation Textures in Steels. Int. Mater. Rev. 1990, 35, 1–36. [Google Scholar] [CrossRef]
  46. Tian, Y.; Wang, H.T.; Ye, Q.B.; Wang, Q.H.; Wang, Z.D.; Wang, G.D. Effect of Rolling Reduction below γ Non-Recrystallization Temperature on Pancaked γ, Microstructure, Texture and Low-Temperature Toughness for Hot Rolled Steel. Mater. Sci. Eng. A 2020, 794, 139640. [Google Scholar] [CrossRef]
  47. Xu, Y.B.; Zhang, Y.X.; Wang, Y.; Li, C.G.; Cao, G.M.; Liu, Z.Y.; Wang, G.D. Evolution of Cube Texture in Strip-Cast Non-Oriented Silicon Steels. Scr. Mater. 2014, 87, 17–20. [Google Scholar] [CrossRef]
  48. Mehdi, M.; He, Y.; Hilinski, E.J.; Kestens, L.A.I.; Edrisy, A. The Evolution of Cube ({001}<100>) Texture in Non-Oriented Electrical Steel. Acta Mater. 2020, 185, 540–554. [Google Scholar] [CrossRef]
  49. Mohtadi-Bonab, M.A.; Ariza-Echeverri, E.A.; Masoumi, M. A Comparative Investigation of the Effect of Microstructure and Crystallographic Data on Stress-Oriented Hydrogen Induced Cracking Susceptibility of API 5L X70 Pipeline Steel. Metals 2022, 12, 414. [Google Scholar] [CrossRef]
  50. Masoumi, M.; Silva, C.C.; de Abreu, H.F.G. Effect of Crystallographic Orientations on the Hydrogen-Induced Cracking Resistance Improvement of API 5L X70 Pipeline Steel under Various Thermomechanical Processing. Corros. Sci. 2016, 111, 121–131. [Google Scholar] [CrossRef]
  51. Taleff, E.M.; Lewandowski, J.J.; Pourladian, B. Microstructure-Property Relationships in Pearlitic Eutectoid and Hypereutectoid Carbon Steels. JOM 2002, 54, 25–30. [Google Scholar] [CrossRef]
  52. Oyama, T.; Sherby, O.D.; Wadsworth, J.; Walser, B. Application of the Divorced Eutectoid Transformation to Tee Development. Scr. Metall. 1984, 18, 799–804. [Google Scholar] [CrossRef]
  53. Santos, R.G.d. Transformações de Fases Em Materiais Metálicos; Editora UNICAMP: Campinas, São Paulo, Brazil, 2006; ISBN 85-268-0714-5. [Google Scholar]
  54. Rastegari, H.; Kermanpur, A.; Najafizadeh, A. Effect of Initial Microstructure on the Work Hardening Behavior of Plain Eutectoid Steel. Mater. Sci. Eng. A 2015, 632, 103–109. [Google Scholar] [CrossRef]
  55. Tian, Y.L.; Wayne, K.R. Mechanisms of Pearlite Spheroidization. Met. Trans. A 1987, 18A, 1403. [Google Scholar] [CrossRef]
  56. Park, J.T.; Szpunar, J.A. Evolution of Recrystallization Texture in Nonoriented Electrical Steels. Acta Mater. 2003, 51, 3037–3051. [Google Scholar] [CrossRef]
  57. Cullity, B. Elements of X-ray Diffraction; Addison-Wesley Publishing: Boston, MA, USA, 1956. [Google Scholar]
  58. Cahn, R.W. Recovery and Recrystallization. Phys. Metall. 1970, 2. [Google Scholar]
  59. Haessner, F. Recrystallization of Metallic Materials. In Proceedings of the Seminar of the Institut Fuer Metallkunde of the University of Stuttgart and the Max-Planck-Institut fuer Metallforschung, Stuttgart, Germany, 1971. [Google Scholar]
  60. Lehto, P. Adaptive Domain Misorientation Approach for the EBSD Measurement of Deformation Induced Dislocation Sub-Structures. Ultramicroscopy 2021, 222, 113203. [Google Scholar] [CrossRef] [PubMed]
  61. Rui, S.S.; Han, Q.N.; Wang, X.; Li, S.; Ma, X.; Su, Y.; Cai, Z.; Du, D.; Shi, H.J. Correlations between Two EBSD-Based Metrics Kernel Average Misorientation and Image Quality on Indicating Dislocations of near-Failure Low Alloy Steels Induced by Tensile and Cyclic Deformations. Mater. Today Commun. 2021, 27, 102445. [Google Scholar] [CrossRef]
Figure 1. Micrographs of the as-received sample, labeled as AR.
Metals 13 00805 g001
Figure 2. X-ray diffraction pattern of the AR sample.
Metals 13 00805 g002
Figure 3. Orientation distribution functions (ODF, φ2 = 45°) of the AR sample.
Metals 13 00805 g003
Figure 4. Orientation maps (OIM) of the as-received (AR) sample in the normal direction (ND), third-order kernel average misorientation (KAM) map, and Taylor factor map.
Metals 13 00805 g004
Figure 5. Longitudinal crack on the surface of the material.
Metals 13 00805 g005
Figure 6. Micrographs of the heat-treated samples, labeled as (a): REC (spheroidized) and (b): ISO (lamellar).
Metals 13 00805 g006
Figure 7. XRD pattern of REC and ISO samples.
Metals 13 00805 g007
Figure 8. Comparison of peaks with AR sample.
Metals 13 00805 g008
Figure 9. Texture of REC (I) and ISO samples (II).
Metals 13 00805 g009
Figure 10. Orientation maps (OIM) of heat-treated samples in the normal direction (ND), third-order kernel average misorientation (KAM) map, and Taylor factor map.
Metals 13 00805 g010
Figure 11. Tensile test graphs of the samples.
Metals 13 00805 g011
Figure 12. Types of grain boundaries presented in the EBSD analysis.
Metals 13 00805 g012
Figure 13. Quantitative distribution of the misorientation levels in the samples.
Metals 13 00805 g013
Table 1. Quantitative analysis of the microstructures: average particle diameter (PD), average lamellae thickness (LT) and preferred deviation in relation to RD (Dev.).
SamplePD (nm)LT (nm)Dev. (°)
AR132.6961.7552.98
Table 2. Parameters obtained from the XRD analysis in the sample AR.
2θ (°)FWHM (°)d (Å)hkl
51.8170.333042.02904110
76.7010.380061.43475200
99.1970.444571.17147211
Table 3. Parameters obtained from the refinement of the XRD analysis in the sample AR.
a (A)t (A)δ × 1015 (m−2)ε × 103
2.86950319.486770.979702.24618
Table 4. Quantitative analysis of heat treated microstructures compared to AR sample: average particle diameter (PD), average lamellae thickness (LT) and preferred deviation in relation to RD (Dev.).
SamplePD (nm)LT (nm)Dev. (°)
AR132.6961.7552.98
REC566.59--
ISO-52.9932.65
Table 5. Parameters obtained from the XRD analysis in the heat-treated samples.
2θ (°)FWHM (°)d (A)hkl
REC Sample
51.9070.306332.02921110
76.7760.333821.43487200
99.2540.371501.17157211
ISO Sample
51.9640.300722.02862110
76.8380.335181.43445200
99.3220.382611.17123211
Table 6. Parameters obtained from refinement of the XRD analysis in the heat-treated samples.
a (A)t (A)δ × 1015 (m−2)ε × 103
REC Sample
2.86974364.884010.751091.98763
ISO Sample
2.86891362.900660.759321.98471
Table 7. Parameters obtained from the tensile test: E—Elastic modulus, Y.S.—Yield strength, U.T.S.—Ultimate tensile strength and K—Toughness.
E (GPa)Y.S. (MPa)UTS (MPa)K × 106 (J/m³)Elongation (%)
AR
204.201243.301368.46133.1110.31
REC
71.24715.02756.48132.5718.59
ISO
78.77805.001245.24156.6914.43
Disclaimer/Publisher’s Note: The statements, opinions and data contained in all publications are solely those of the individual author(s) and contributor(s) and not of MDPI and/or the editor(s). MDPI and/or the editor(s) disclaim responsibility for any injury to people or property resulting from any ideas, methods, instructions or products referred to in the content.

