Review

Phase Equilibrium Studies of the CaO-MgO-Al2O3-SiO2 System for Iron Blast Furnace Slag: A Review

1
International Institute for Innovation, Jiangxi University of Science and Technology, Nanchang 330013, China
2
Shougang Research Institute of Technology, Beijing 100043, China
3
Sustainable Minerals Institute, University of Queensland, Brisbane 4072, Australia
*
Author to whom correspondence should be addressed.
Metals 2023, 13(4), 801; https://doi.org/10.3390/met13040801
Submission received: 31 March 2023 / Revised: 14 April 2023 / Accepted: 17 April 2023 / Published: 19 April 2023
(This article belongs to the Section Extractive Metallurgy)

Abstract

:
More and larger blast furnaces have been constructed for ironmaking across the world in recent years due to the advantages of high productivity, high energy efficiency and low cost. Slag plays important role in a blast furnace to produce high-quality hot metal and maintain smooth operations. Liquidus temperatures are the essential information of the slag to avoid the formation of the solid phase during the ironmaking process and slag tapping. The principal components of the iron blast furnace slags can be described by the system CaO-MgO-Al2O3-SiO2. With the significant changes in the raw materials and different requirements of the blast furnace operations, phase equilibria in this slag system have been extensively investigated from different directions. Phase diagrams were presented in various pseudo-ternary and pseudo-binary forms to meet the requirements of wide applications. Reliable thermodynamic modelling is the target of the researchers which can predict accurate liquidus temperatures of the slag. Development of the reliable thermodynamic modelling relies on systematic and accurate experimental data including liquidus temperatures and compositions of the solid solutions. Experimental data on the phase equilibria of the system CaO-MgO-Al2O3-SiO2 are summarised and compared with the thermodynamic predictions which can provide systematic information for the researchers and blast furnace operators.

1. Introduction

The blast furnace (BF) with hundreds of years of history is still the major technology for ironmaking. Feeds to a BF include metallic ore, coke and flux. The recent developments in BF including the injection of coal and the growing size make the BF operation more complex and challenging. The products from a BF include hot metal (Fe-C alloy), slag and off gas. The slag plays important roles in a BF: (1) collection of the impurities from the feeds; (2) complete separation of hot metal from the slag; (3) efficient removal of sulphur from the hot metal and alkali from the BF and (4) smooth tapping of the hot metal and slag from the BF. The chemical compositions of a BF slag can be represented by the system CaO-MgO-Al2O3-SiO2 where SiO2 and Al2O3 are mainly from iron-bearing materials, coke and coal. CaO and MgO are the flux used to adjust the slag composition [1,2].
Being fully liquid is an essential requirement for both hot metal and slag because the solid phase can significantly increase the bulk viscosity of hot metal or slag. The hot metal bearing carbon has a liquidus temperature below 1200 °C which is much lower than the liquidus temperature of the slag. Therefore, control of the slag temperature inside the BF and on tapping above the liquidus temperature to avoid the formation of a solid phase is always the focus of the fundamental studies for BF slags. Phase diagrams in the system CaO-MgO-Al2O3-SiO2 can be used to predict the liquidus temperature of the BF slags [3,4]. However, it is impossible to describe the liquidus temperatures of the slag in a single-phase diagram for this four-component system. Different forms of the pseudo-ternary and pseudo-binary phase diagrams have been produced and used to meet the requirements of different BF operations, e.g., utilization of low-grade iron ore and poor-quality coke to reduce the cost, minimized slag mass and low operating temperature to reduce energy consumption and greenhouse gas emission, high basicity slag to remove sulphur and low basicity slag to remove alkali.
The phase equilibrium in the system CaO-MgO-Al2O3-SiO2 has been studied extensively by many researchers [5,6,7,8,9,10,11,12,13,14,15,16,17,18,19,20,21,22,23] and the phase diagrams were presented in different forms. Muan et al. [24] and the Slag Atlas [25] collected and summarised most of the existing data. Significant discrepancies were reported from these studies that affect the direct use of the phase diagrams. High-temperature experiments to construct multicomponent phase diagrams are time- and cost-consuming. Development of reliable thermodynamic modelling to predict liquidus temperatures is always the target of researchers and metallurgists. In recent years, thermodynamic software such as FactSage 8.2 [26], MTDATA [27] and Thermo-Calc [28] have been developed to predict the liquidus temperatures of the slags. Accurate and systematic experimental data are required to develop and optimize the thermodynamic databases and evaluate the reliability of the predictions.
In this paper, the experimental techniques used in phase equilibrium studies related to the BF slags and the produced phase diagrams are critically reviewed. Applications of different forms of the pseudo-ternary and pseudo-binary phase diagrams are demonstrated to support the metallurgists to properly use these phase diagrams on the BF operations. The predictions of the FactSage 8.2 are compared with the experimental results to evaluate the accuracy of the current thermodynamic software.

2. Research Techniques Used in Phase Equilibria Studies of BF Slag

The components of the BF slag CaO-MgO-Al2O3-SiO2 do not have valence changes in the condensed system. High-temperature experiments for the determination of the phase equilibria in this system can be carried out in air. Accurate temperature and phase compositions are the essential data to characterize the phase equilibria of the slag. Different techniques have been used to obtain the liquidus temperatures and compositions of the solid solutions. Various thermodynamic models have also been developed to predict the phase equilibria of the slags.

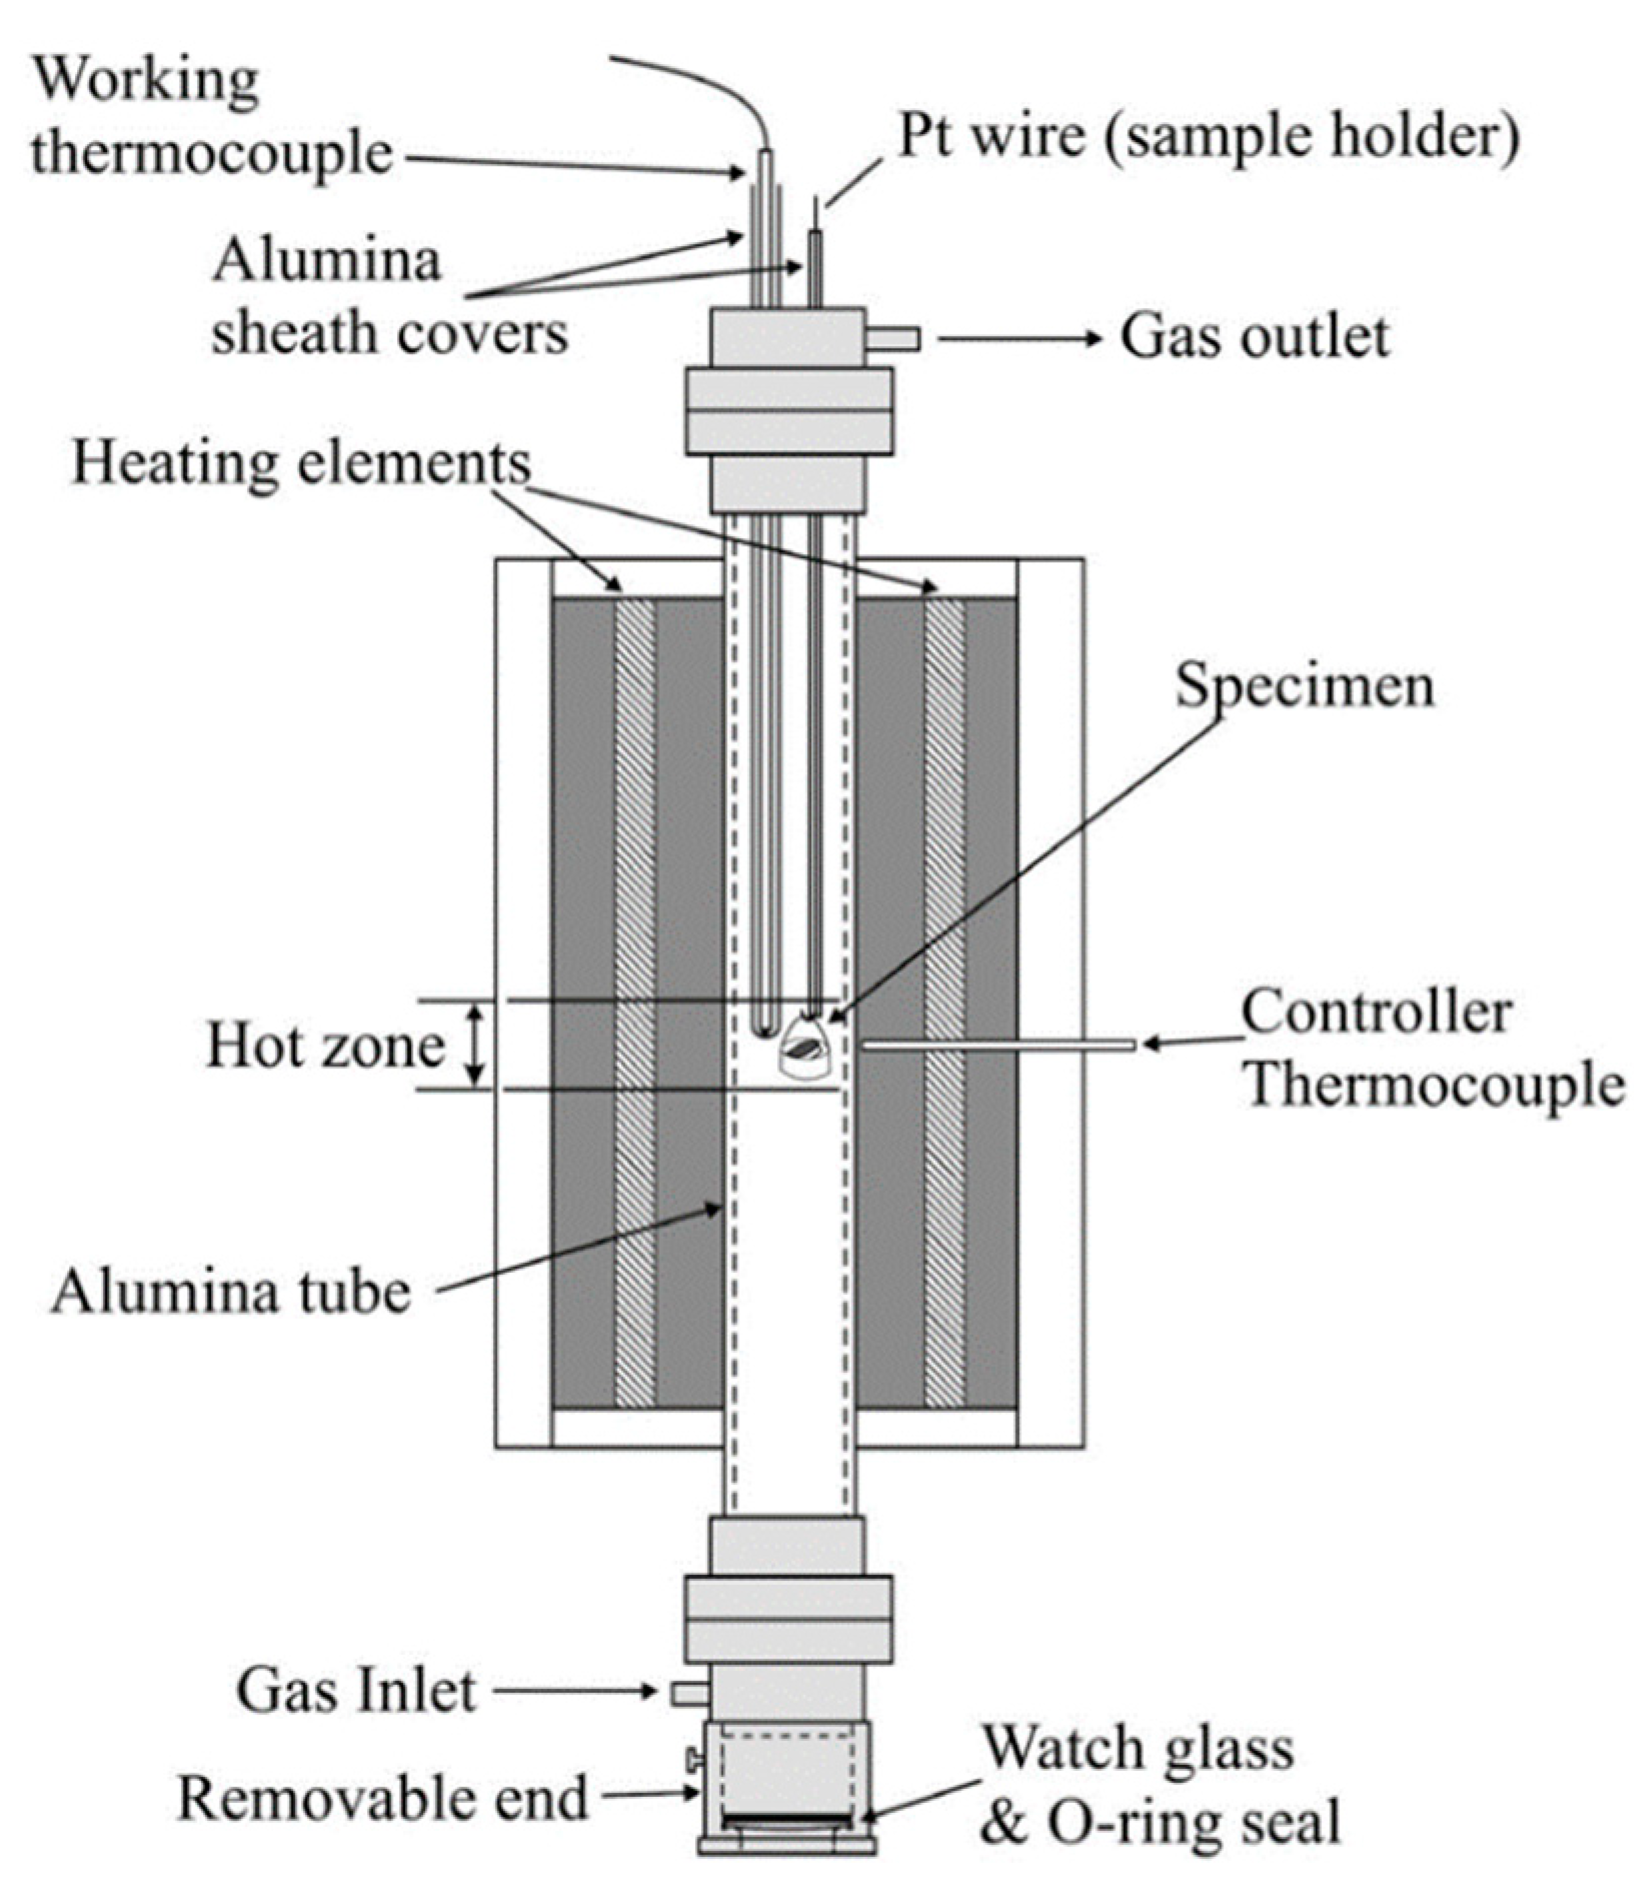
2.1. Liquidus Temperature

As a silicate-based slag system, the quenching technique was usually used in phase equilibria studies of the BF slags. This technique involves high-temperature equilibration followed by rapid cooling. On quenching, the liquid phase is converted to glass and the solid phases are retained in their shapes and properties. The microstructure of the quenched sample can be observed and the phase compositions can be measured at room temperature.
In earlier studies [5,7], the conventional quenching technique was used to construct the pseudo-ternary phase diagrams. From pure chemicals of CaCO3, MgO, Al2O3 and SiO2, 10 g homogeneous mixtures with accurate compositions were prepared by repeatedly fusing in a Pt crucible, quenching and crushing. The obtained glass was completely crystallized at a temperature of the order of 1000 °C for sufficient time. Approximately 20 mg of the powdered crystalline material was enclosed in a Pt envelope, held at a desired temperature for a sufficient time to attain equilibrium, and quenched in mercury. The phases present in the quenched sample were identified by means of a petrographic microscope and X-ray diffraction techniques. The liquidus temperature was determined between the temperature at which the mixture is all liquid and some lower temperature at which crystals are present in the liquid. Therefore, the liquidus temperature can be approached as closely as desired within the limits of error of the temperature measuring and controlling equipment. Usually, each liquidus temperature determined by this technique is followed by a plus or minus value, indicating the closeness of bracketing of the liquidus temperature by runs. In the studies by Prince [6,8], a similar quenching technique was used. CaCO3, MgCO3, Al2O3·xH2O and silicic acid were used as the starting materials. The carbonates were oven dried and kept in a desiccator. The Al2O3·xHzO was calcined to 1250 °C for several hours and used immediately after calcination. The silicic acid was leached with 1:1 HC1 in an extractor to remove traces of impurities. After three or four fusions, about 20 mg of powdered glass enclosed in a Pt foil envelope was suspended in a vertical tube furnace for equilibration. A maximum of 90 min at temperatures slightly above 1400 °C, to 10 min at temperatures near 1600 °C were used for the samples to attain equilibrium. Most of the quenching experiments were carried out for 30 to 60 min. The sample was dropped into water or mercury to achieve rapid quenching. A petrographic microscope was used to identify the phases present in the quenched sample by Prince [8] and the refractive index for each primary phase was given in the results tables. The liquidus composition determined in this technique is the same as that prepared at the beginning of the experiment by assuming the composition does not change during the fusion and equilibration. The accuracy of the liquidus temperature relies on the number of equilibration experiments at different temperatures. A single liquidus point requires several days of careful experiments and the resulting liquidus temperature is usually not located directly on an isotherm.
Gutt et al. [10] and Cavalier et al. [11] used a hot-stage microscope to investigate phase equilibria of BF slags. Several milligrams of the fused slag was used as starting material. The liquidus temperature was determined by direct observation of the primary phase precipitation on cooling or dissolution of the solid phase on heating. Where possible, both the primary phase and the secondary phase crystallizing could be identified by their characteristic crystal growth in the melt. The viscosity of the slag and its slow crystallization/dissolution is one of the limitations of the method.
An improved quenching technique was developed with the application of electron probe microanalysis (EPMA) [17,18,19,20,21,22,23,29]. In this technique, pure oxides or carbonates were weighed and mixed according to the experimental plan and pelletized. Then, a 0.1–0.5 g pellet was placed in a Pt or graphite crucible and equilibrated for enough time to achieve equilibrium. The experiments were usually carried out in a vertical tube furnace to enable the samples to drop directly into water after the equilibration. A schematic of the vertical tube furnace is shown in Figure 1. The sample is placed in the hot zone of the furnace next to a thermocouple so that the equilibration temperature can be accurately monitored [13].
The equilibrated sample was dropped into water directly to attain rapid cooling. The quenched samples were mounted, polished and carbon-coated for electron probe microanalysis (EPMA). An EPMA with Wavelength Dispersive Spectroscopy (WDS) was used for microstructural and compositional analyses. The EPMA was operated at an accelerating voltage of 15 kV and a probe current of 15–50 nA. The probe diameter of 1 μm was set to accurately measure the composition of an area larger than 1 μm. The ZAF (Z is atomic number correction factor, A is absorption correction factor, and F is fluorescence correction factor) correction procedure was applied for the data analysis. The standards used for EPMA included alumina (Al2O3) for Al, magnesia (MgO) for Mg, and wollastonite (CaSiO3) for Ca and Si. The average accuracy of the EPMA measurements was within ±1 wt%. On rapid cooling, the liquid phase in the equilibrated sample was converted to glass and the solid phases were retained in their shapes and compositions. The homogeneity of the phases can be confirmed by the EPMA measurements in different areas of the quenched sample. Usually, 8–20 points of the liquid phase and 3–5 points of the solid phase were measured from different areas by EPMA. The average was taken as the phase composition and the standard deviation was less than 1%. If only the liquid phase is present in the quenched sample, the equilibration temperature needs to be decreased to obtain the which contains both liquid and solid phases. Figure 2 shows examples of the typical microstructures from the quenched samples [22].
The improved technique has several advantages over the conventional quenching technique. The mixture prepared from pure chemicals can be used directly for equilibration without pre-fusion and crystallization. The equilibration temperature can be fixed to obtain the required isotherms. The compositions of the liquid and solid phases can be measured directly after high-temperature equilibration. Bulk composition change of the sample during the preparation and equilibration does not affect the compositions of the liquid and solid that are used for the construction of the phase diagram. The same mixture can be used to obtain several liquidus points by equilibration at different temperatures. These advantages substantially increased the efficiency and accuracy of phase equilibria determination.

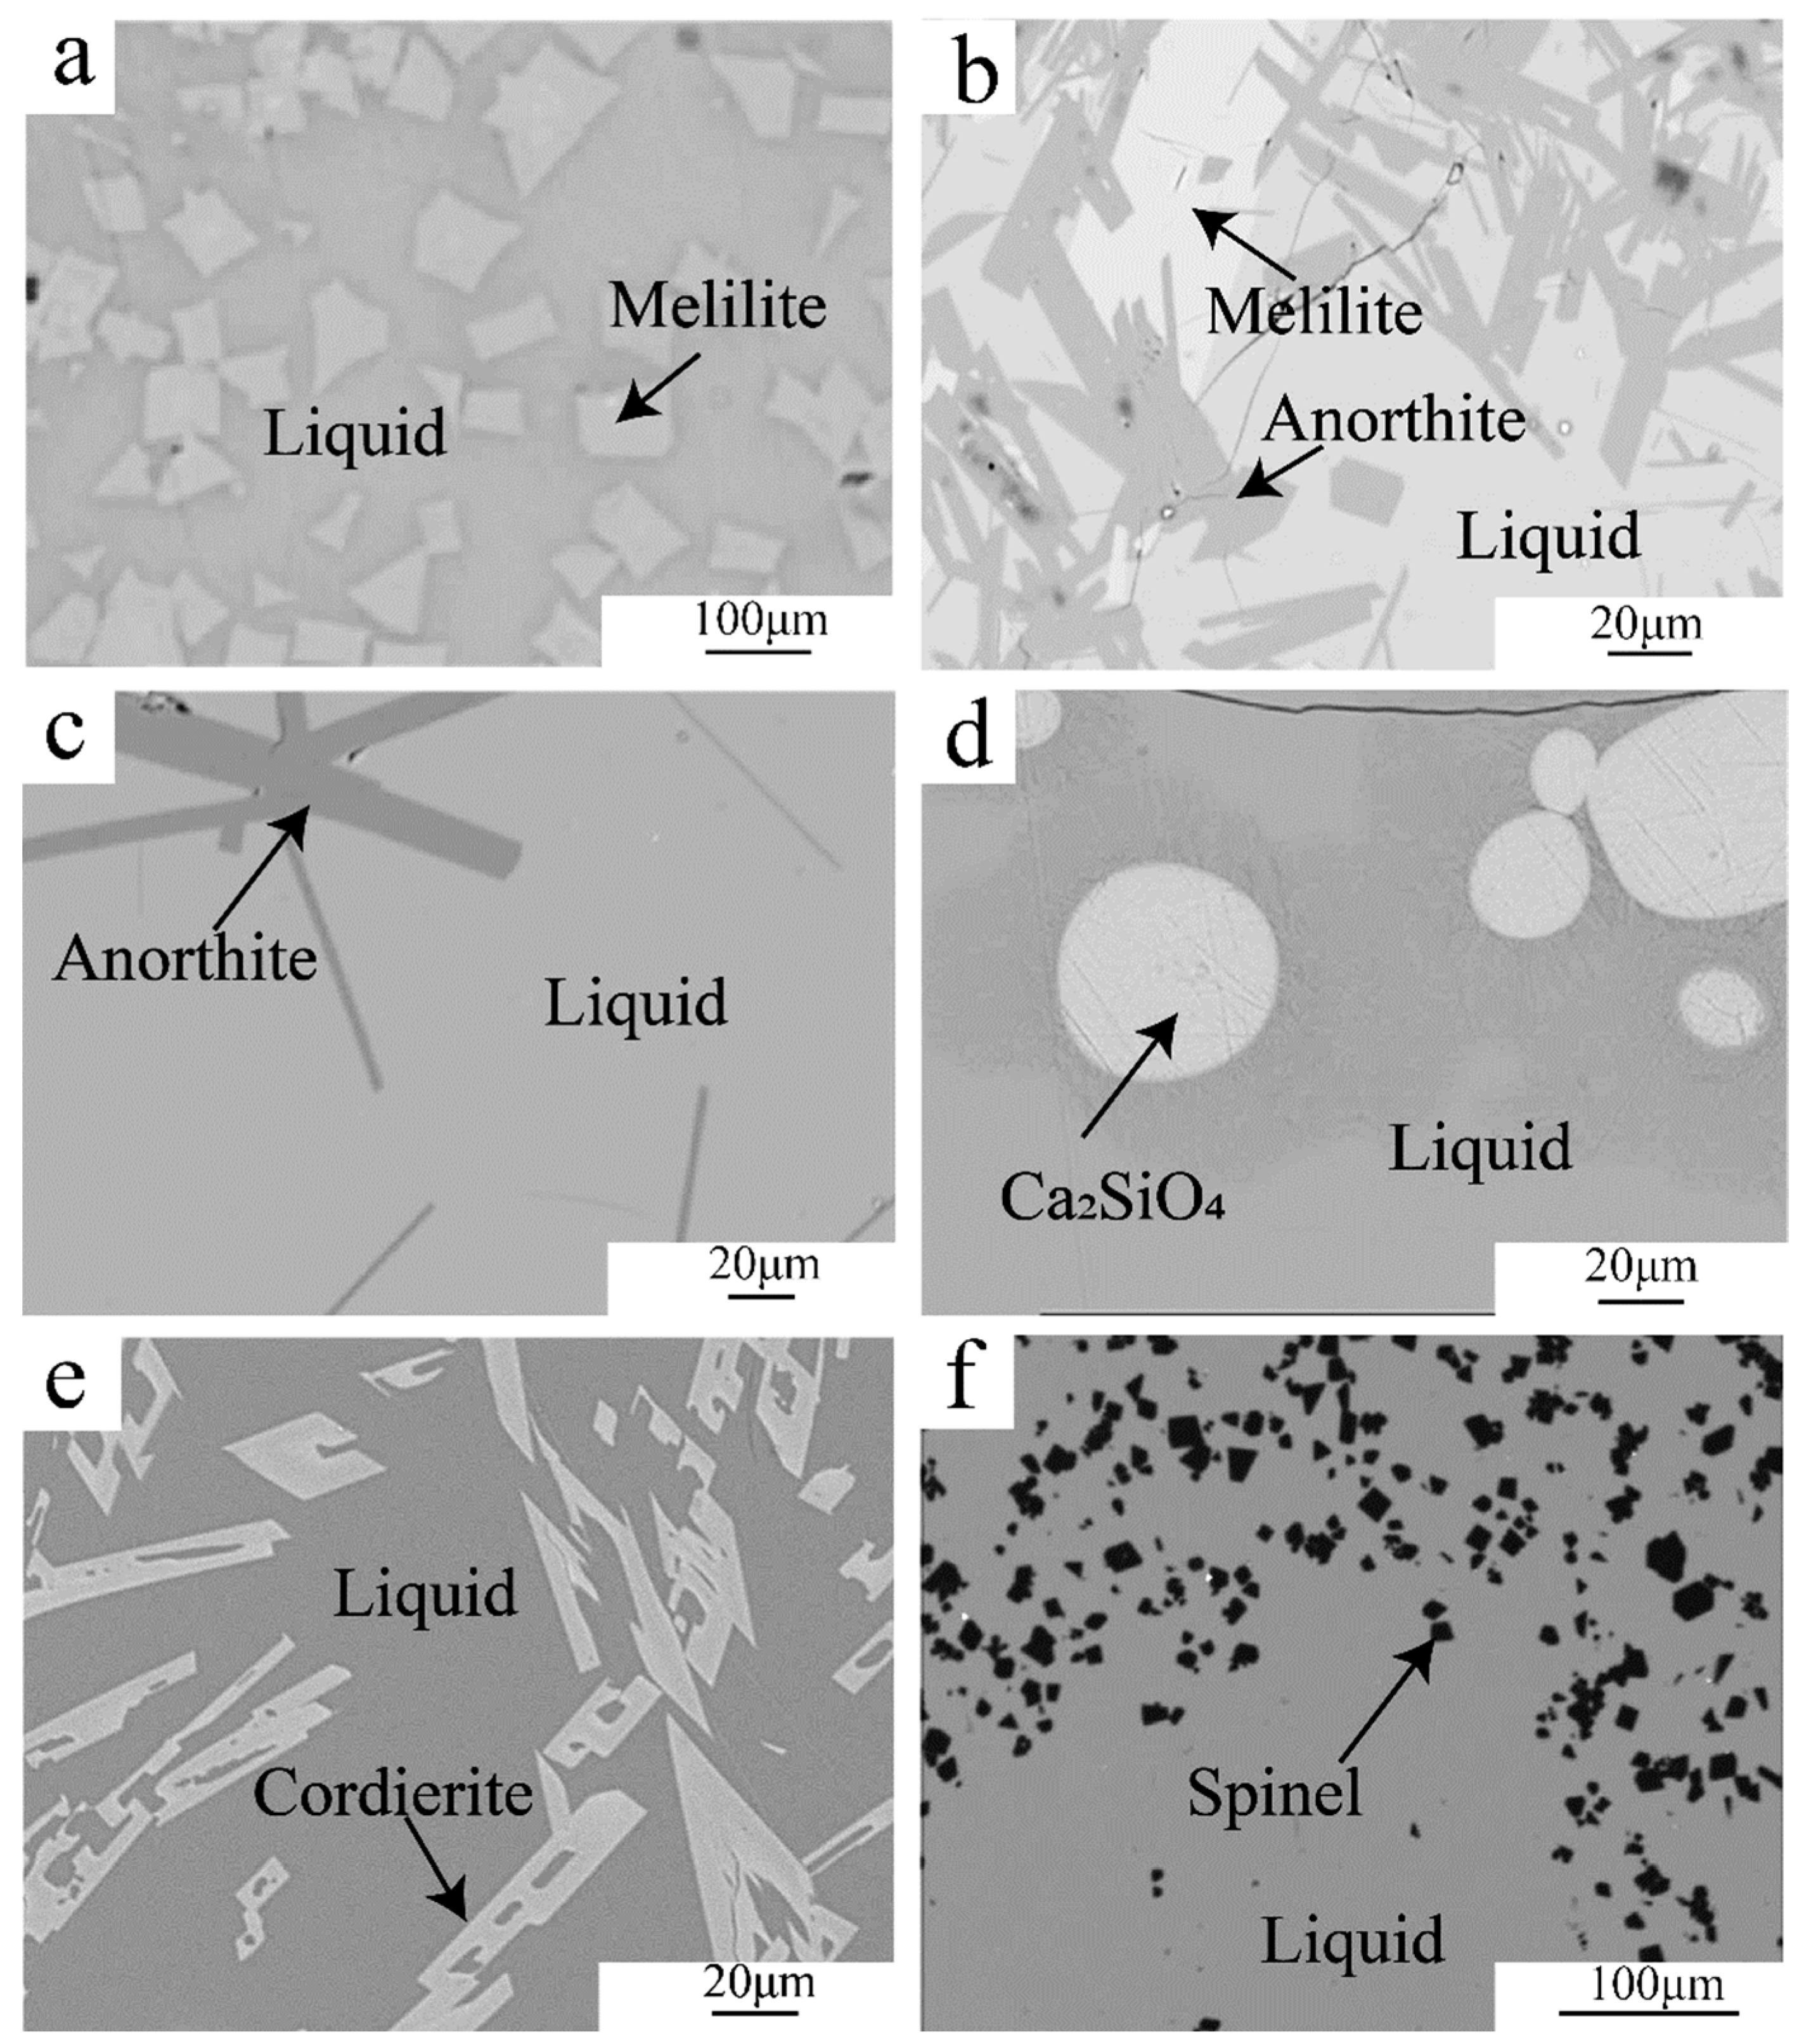
2.2. Solid Solutions

Solid solution data are important for the crystallization and development of thermodynamic modelling. Osborn and Schairer [5] investigated the solid solution between akermanite and gehlemite by petrographic microscope. They observed that the melilite solid solution with 55% akermanite is isotropic in sodium light. Crystals close to this point on the gehlenite side show abnormal blue interference colours in white light. As the proportion of gehlenite is increased, the interference colour continuously changes from bluish-grey to silver-grey to white. By using this technique, the composition of a melilite solid solution with 40–70% akermanite can be estimated from its interference colour with an error of less than ±5% akermanite. Bowen et al. [30] described the detailed procedure to measure the solid solution by petrographic microscope for the system Ca2SiO4-Fe2SiO4. They also used the X-ray powder diffraction (XRD) method to measure the solubilities of Ca2SiO4 in Fe2SiO4. Starting from pure Fe2SiO4, equal steps of the Ca2SiO4 content were added and heated at a temperature for enough time. The solubility of Ca2SiO4 in Fe2SiO4 at a given temperature was determined where the maximum displacement of Fe2SiO4 by Ca2SiO4 did not change the general characteristics of the diffraction pattern. However, XRD has a limited capacity to detect a trace amount of the second phase which affects the accuracy of the solubility determined by the XRD method.
As seen in Figure 2, rapidly quenched samples contain well-crystallized solid phases together with glass (liquid at the equilibrium temperature). EPMA can accurately measure the compositions of any phases greater than 2 μm. In the improved quenching technique, the compositions of liquid with the corresponding solids from the sample are measured simultaneously by EPMA. Accurate liquidus and solidus lines are determined more efficiently than those methods mentioned above where the solubilities were measured in separate experiments.

2.3. Thermodynamic Software

High-temperature experiments are time-consuming and expensive as the construction of a multi-component phase diagram requires a large number of experiments. Thermodynamic modelling has been actively developed and used in recent years to predict the phase equilibria information and understand the chemical reactions more broadly and deeply. As summarized by Jung et al. [31]. A thermodynamic package is developed based on Gibbs energy minimization with continuously improved computational techniques and optimized databases. All available thermodynamic and phase equilibrium data for a given system are critically evaluated simultaneously to obtain one self-consistent set of model equations which can best reproduce the data for all phases as functions of temperature and composition. The accuracy and capacity of a thermodynamic model rely on the number and reliable experimental data available. Where data are lacking for a multicomponent system, the optimized model parameters for low-order (binary and ternary) subsystems can be used to provide initial estimation and the parameters can be evaluated and further optimized when the experimental data of multicomponent systems are available.
The well-known thermochemical software packages used for slag systems include FactSage [26], MTDATA [27] and Thermo-Calc [28]. The user-friendly software enables researchers to perform versatile thermodynamic calculations for wide ranges of slag compositions and temperatures. The latest version of FactSage is 8.2 which is one of the most powerful thermodynamic packages for the thermodynamic calculations of the BF slags [32,33]. The databases of “FactPS” and “FToxid” are usually used in the “Equilib” module. The solution phases selected in the calculations of BF slag phase equilibria include “FToxide-SLAGA”, “FToxide-SPINC”, “FToxide-MeO_A”, “FToxide-bC2S”, “FToxide-aC2S”, “FToxide-Mel_A”, “FToxide-WOLLA”, and “FToxide-Mull”.

3. Experimentally Determined Phase Diagrams

A phase diagram for the four-component system CaO-MgO-Al2O3-SiO2 needs to be presented in a triangular form of a pseudo-ternary section on a plane. Four major sets of pseudo-ternary phase diagrams have been reported for BF slags. The first set was reported by Osborn et al. [6] and the phase diagrams were presented in the form of pseudo-ternary sections CaO-MgO-SiO2 at constant Al2O3 concentrations. The second set of phase diagrams for BF slags was reported to be the Al2O3-CaO-SiO2 pseudo-ternary sections at constant MgO concentrations [8,10,11]. In these early studies, the effects of CaO/SiO2 ratio and MgO (or Al2O3) concentration on liquidus temperatures of the BF slags were discussed and the optimum slag compositions were proposed. In the modern iron BF operation, CaO/SiO2 ratio is usually fixed for a specific blast furnace. The third set of pseudo-ternary phase diagrams (CaO + SiO2)-Al2O3-MgO with constant CaO/SiO2 ratios of 0.9, 1.1, 1.3 and 1.5 were experimentally determined [13,14,15,16]. However, to face the increasing challenge of complex ironmaking raw feeds, the published phase diagrams could not provide enough information. New phase diagrams have been requested from the industry. The pseudo-ternary phase diagrams (CaO + MgO)-Al2O3-SiO2 with constant MgO/CaO ratio of 0.2 and CaO-MgO-(Al2O3 + SiO2) with constant Al2O3/SiO2 ratio of 0.4 were constructed by experiments. The examples of the phase diagrams and their applications are reviewed below.

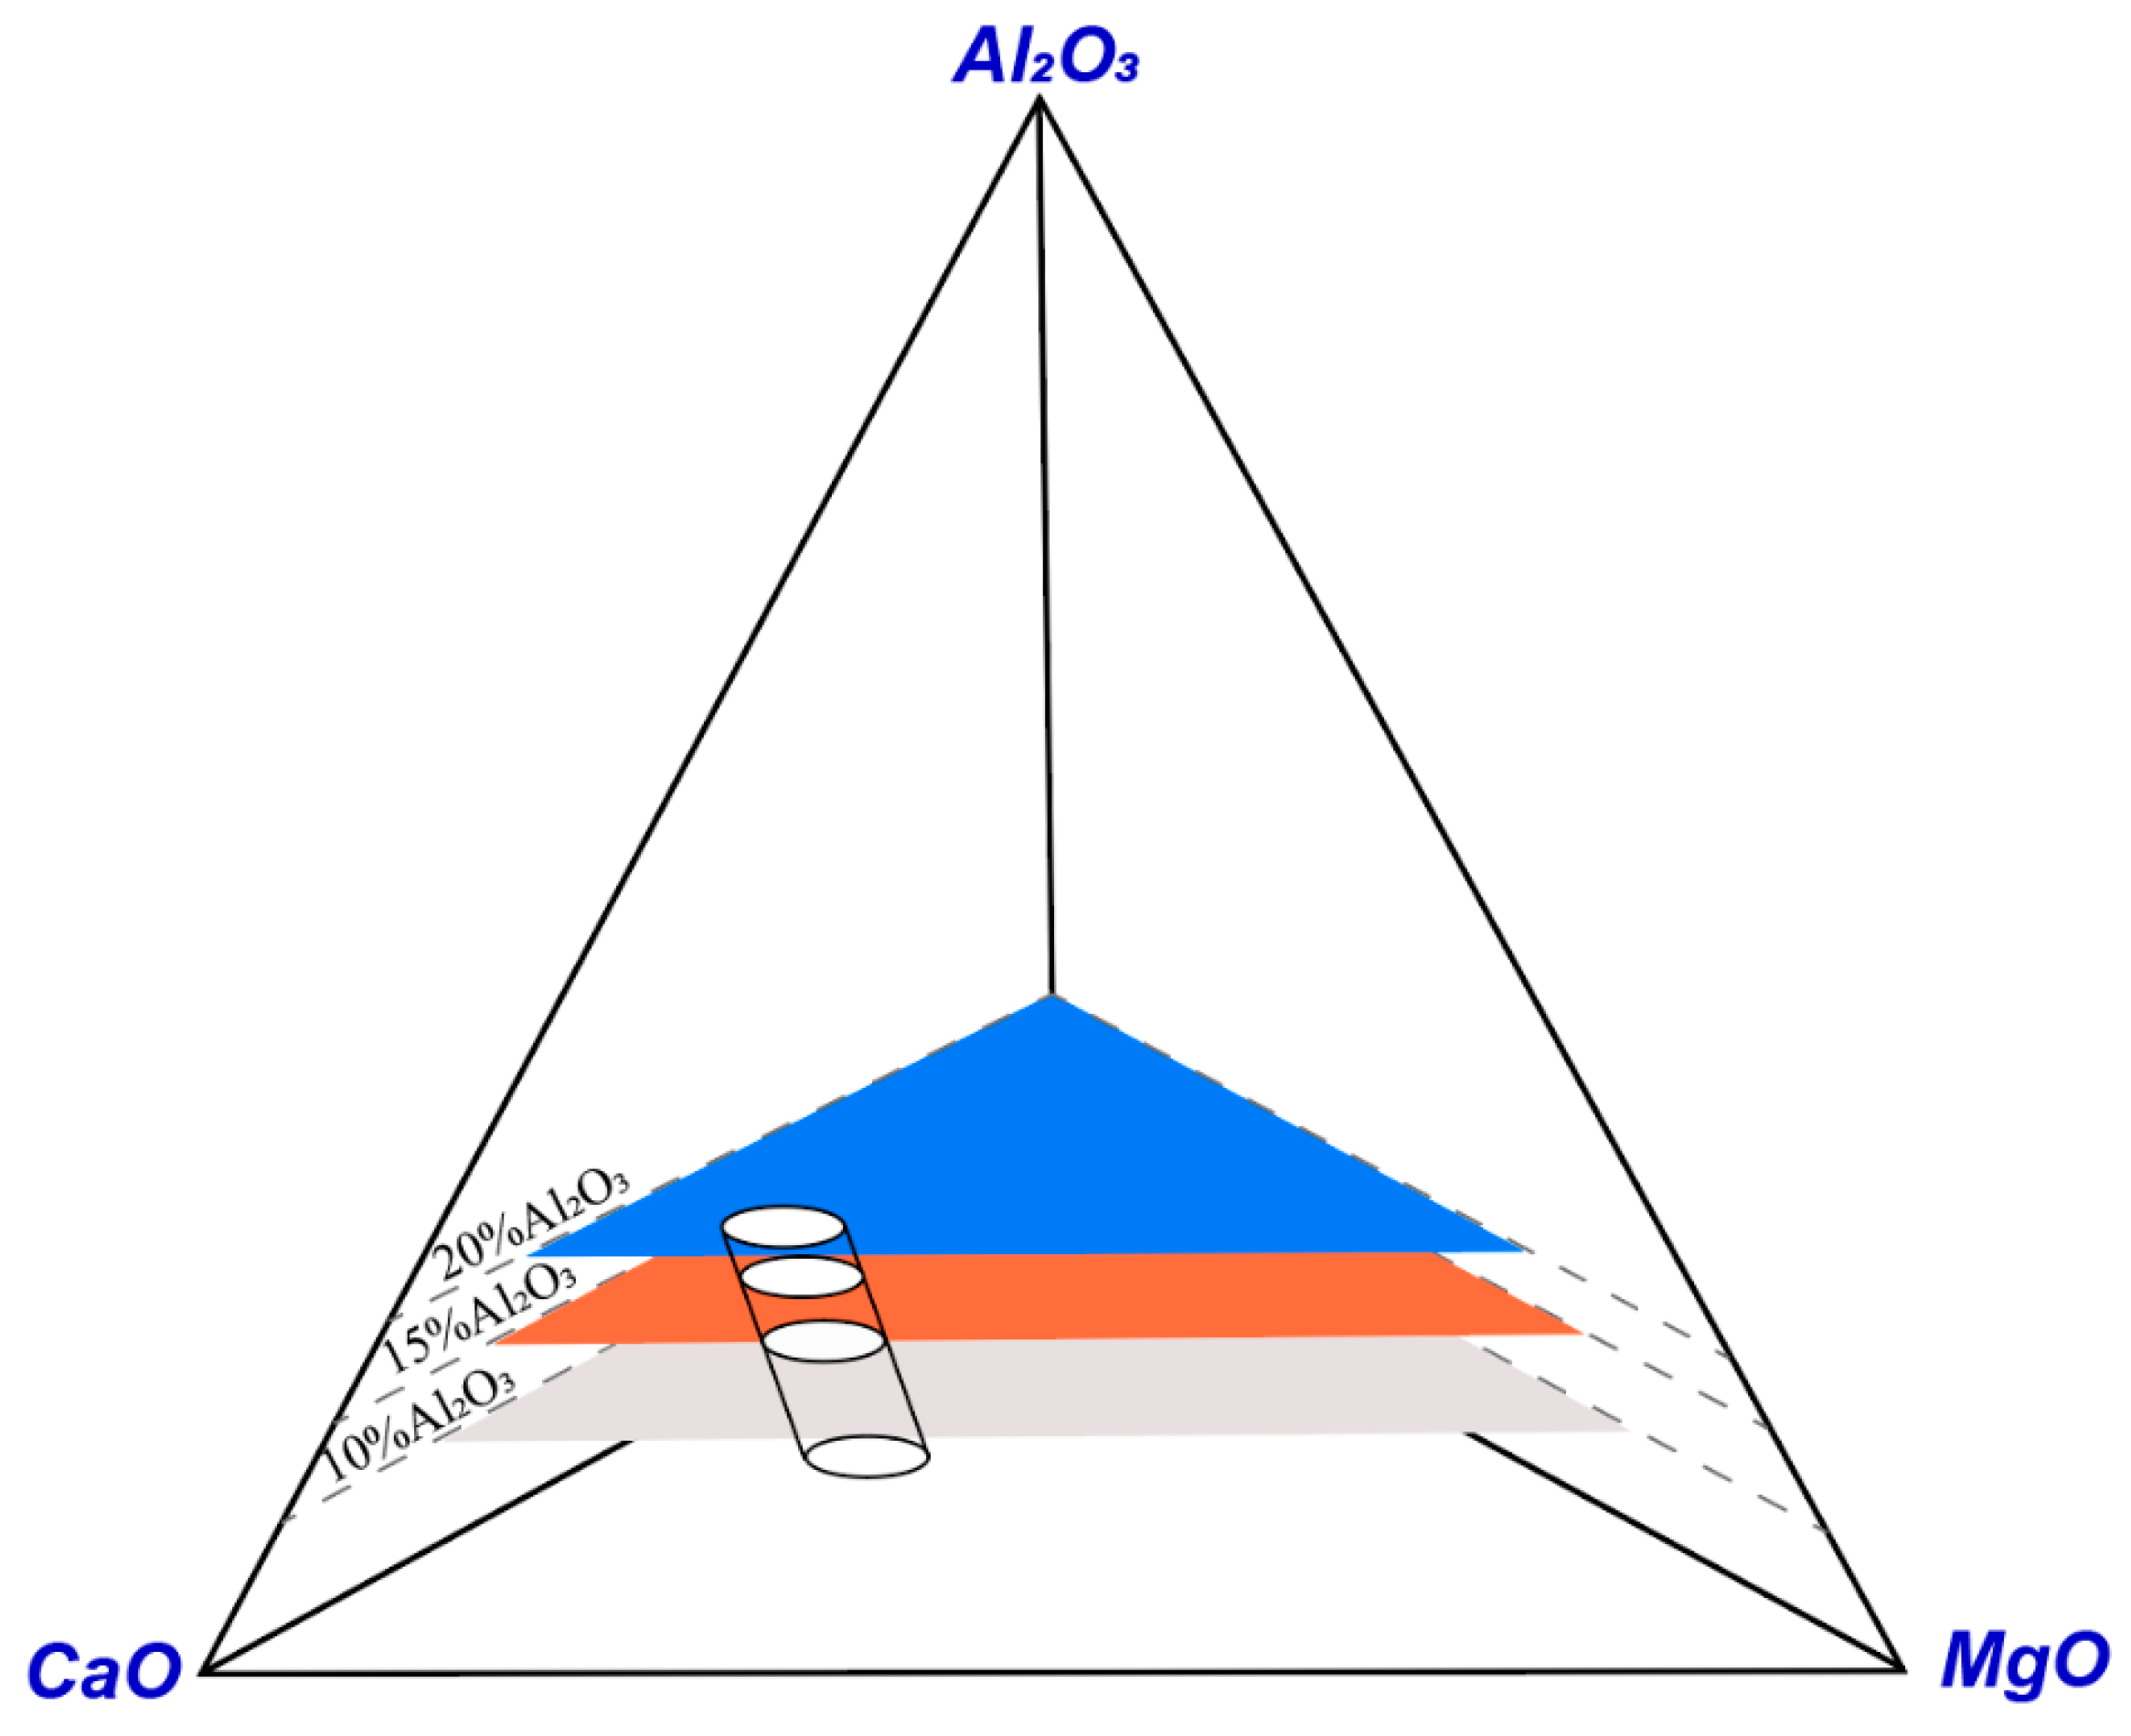
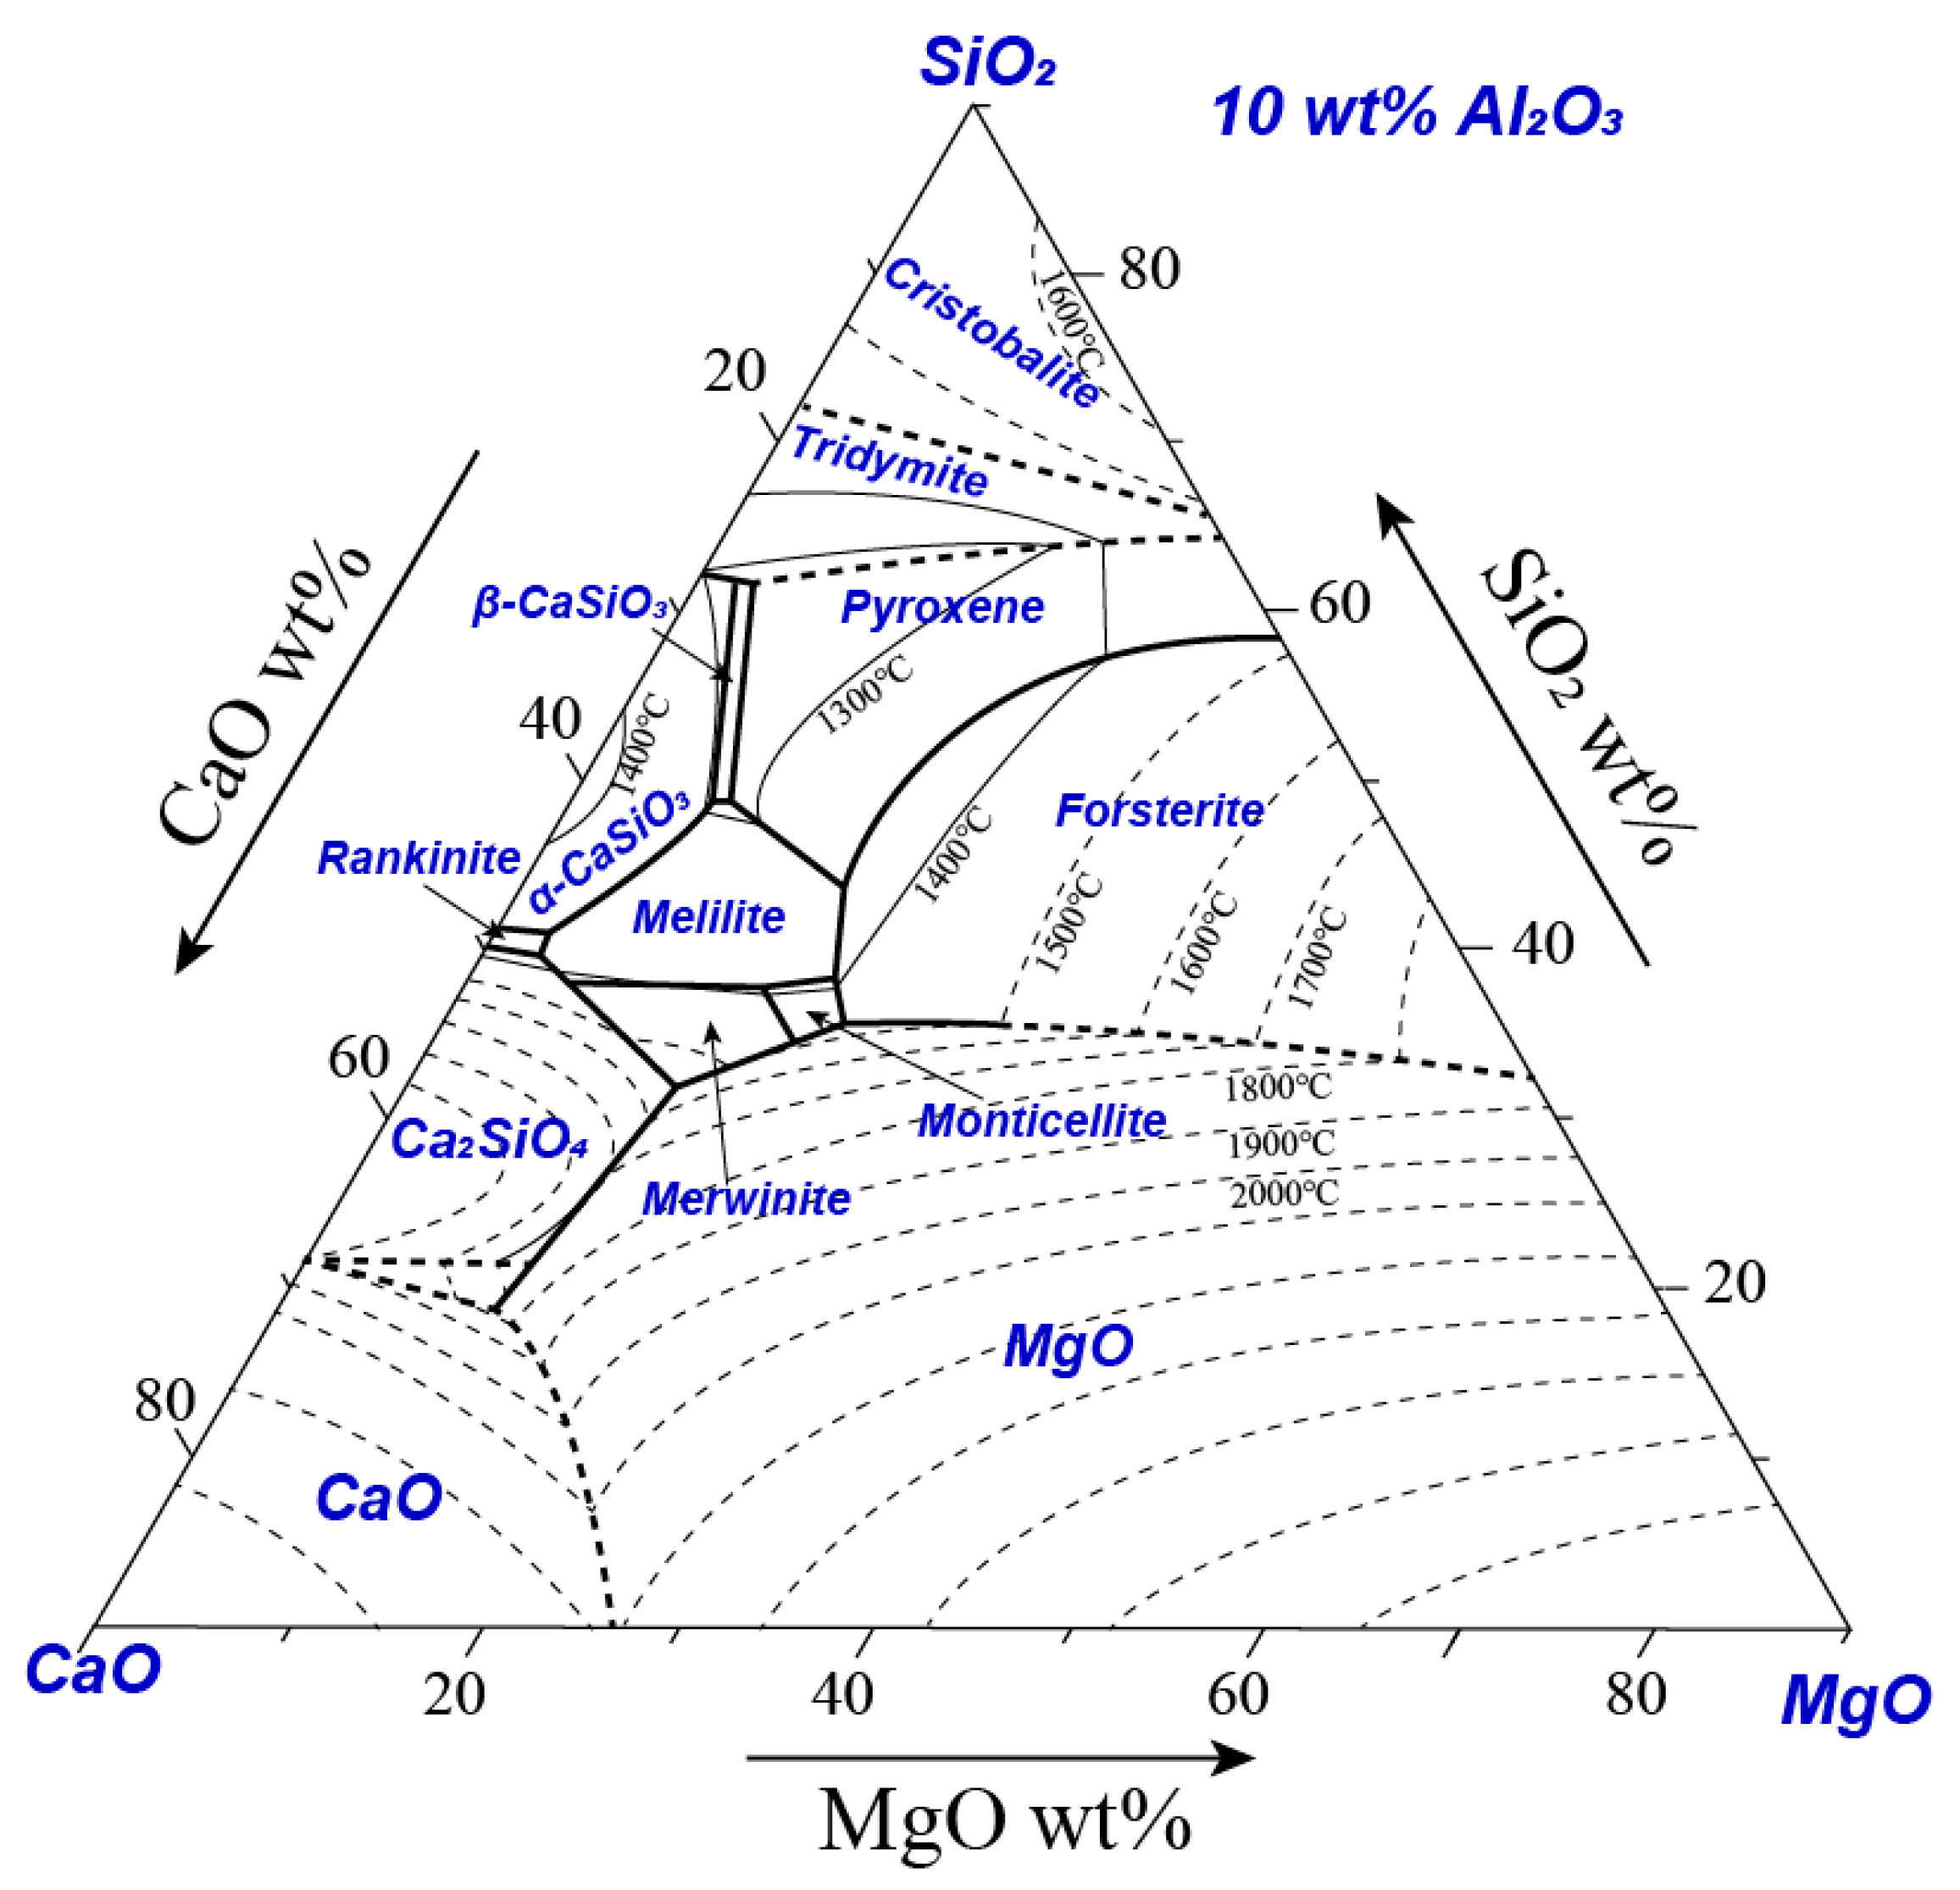
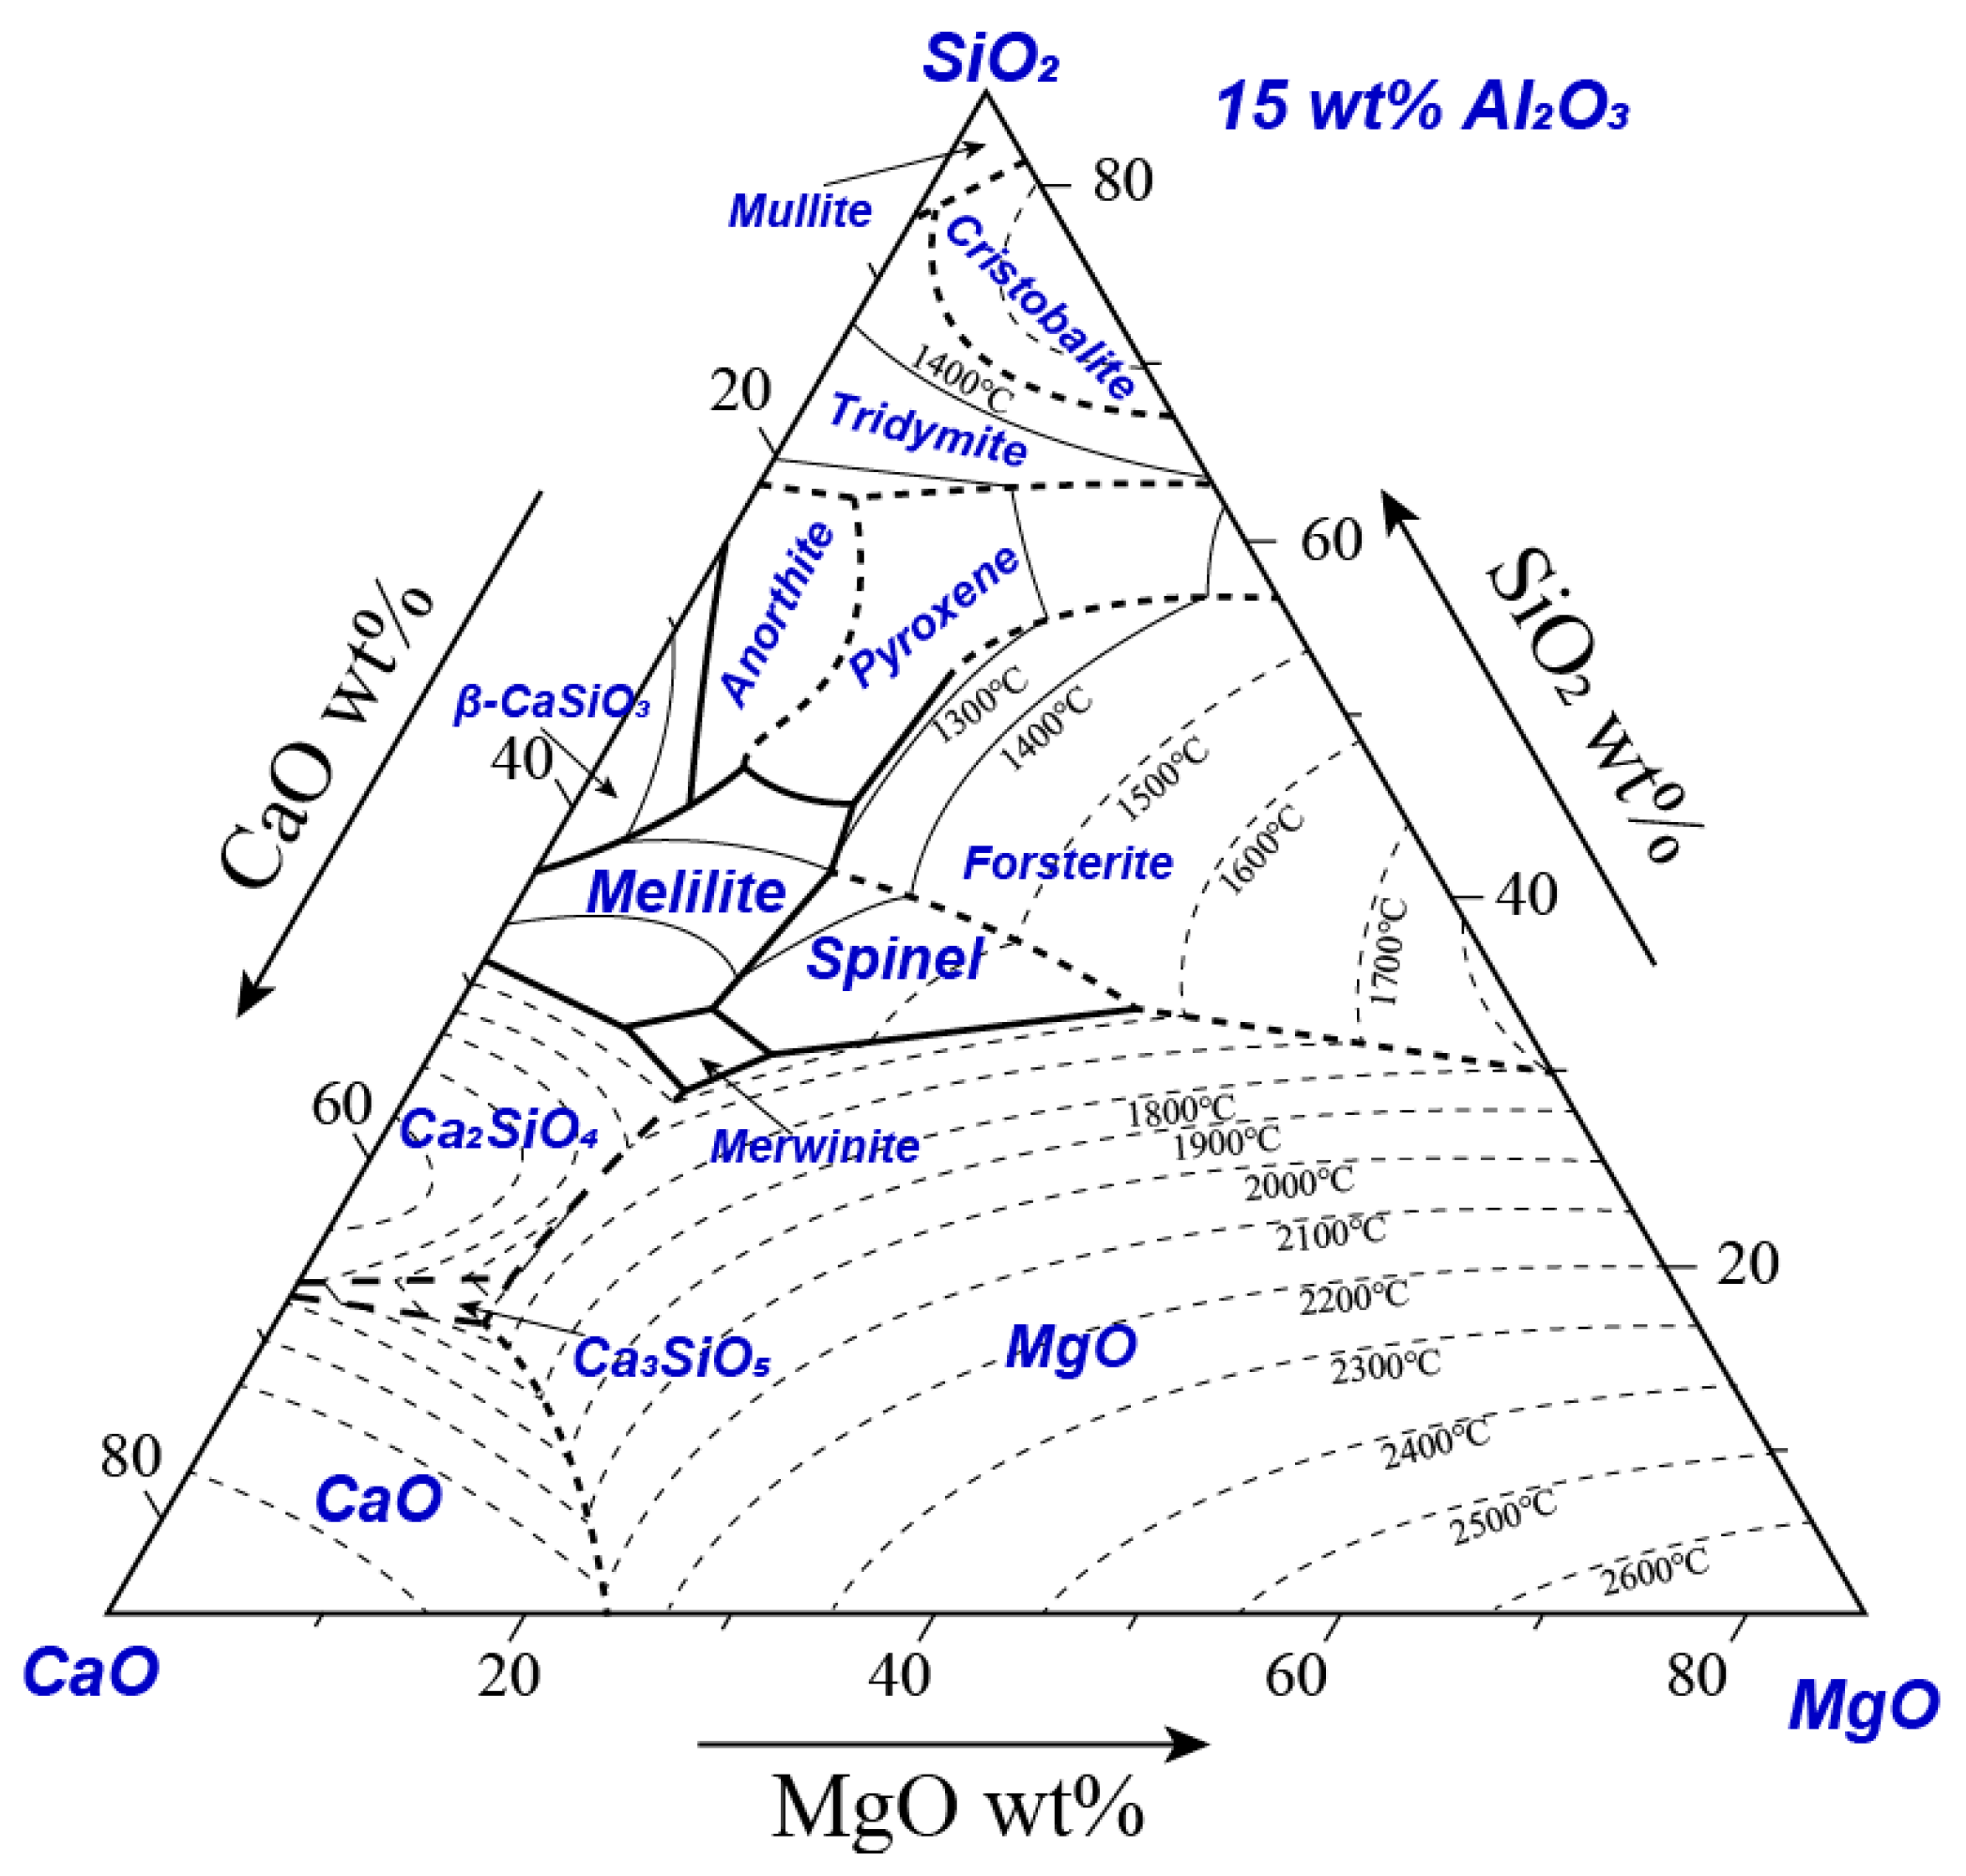
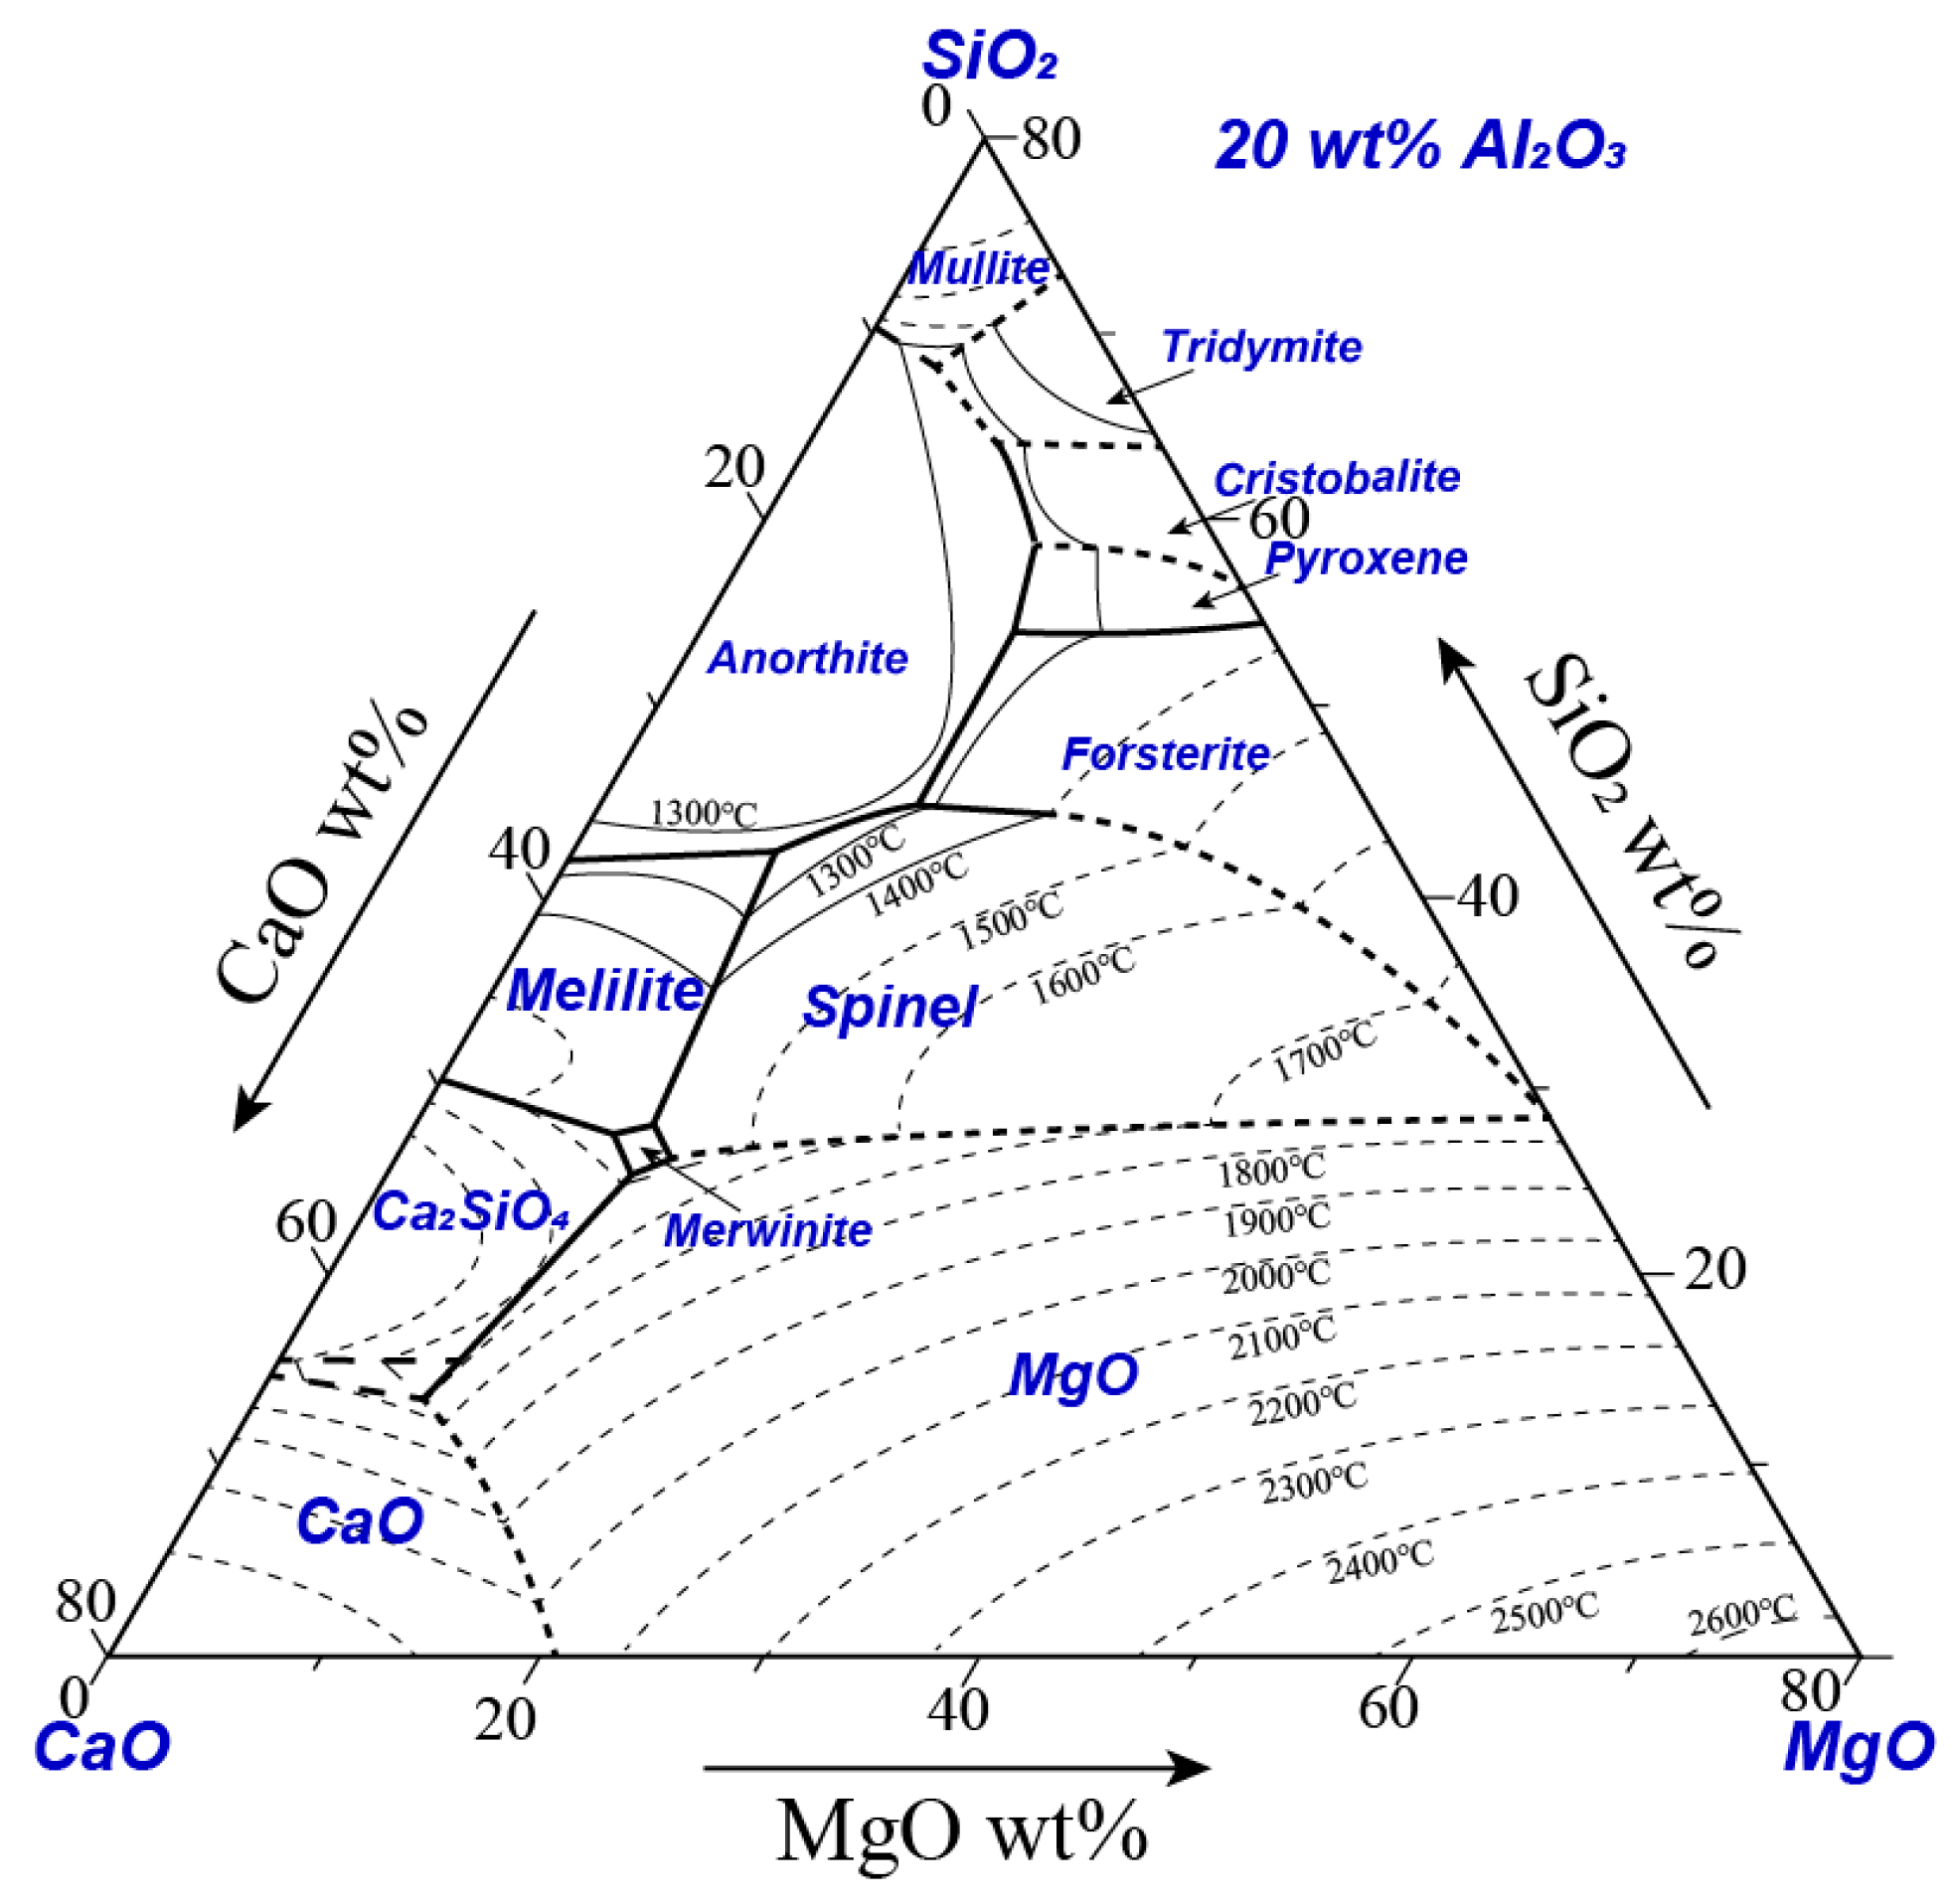
3.1. CaO-MgO-Al2O3-SiO2 System at Constant Al2O3 Content

446 compositions were studied by Osborn et al. [6] to construct pseudo-ternary sections CaO-MgO-SiO2 with constant Al2O3 concentrations of 5 to 35% at 5% intervals. The conventional quenching experiments followed by the metallographic analysis were used in this study. Figure 3 shows the representation of the pseudo-ternary phase diagrams CaO-MgO-SiO2 with constant Al2O3 concentrations of 10, 15 and 20%.
Figure 4, Figure 5 and Figure 6 show the experimentally determined pseudo-ternary phase diagrams CaO-MgO-SiO2 at constant Al2O3 concentrations of 10, 15 and 20%, respectively. In these phase diagrams, the solid thick lines and thin lines represent the boundary lines and isotherms, respectively, determined by the experimental results. The dashed lines thick lines and thin lines represent the boundary lines and isotherms, respectively, by estimations. The primary phases identified in the composition range investigated include spinel (MgAl2O4), merwinite (Ca3MgSi2O8), dicalcium silicate (Ca2SiO4), periclase (MgO), melilites (solid solutions of akermanite, Ca2MgSi2O7, and gehlenite, Ca2Al2SiO7), pseudo-wollastonite (CaSiO3), anorthite (CaAl2Si2O8), pyroxenes (predominantly solid solutions of clinoenstatite, MgSiO3, and diopside, CaMgSi2O6), monticellite (CaMgSiO4) and forsterite (Mg2SiO4). The Al2O3 in a BF slag is mainly from iron ores. A slag with 10% Al2O3 represents the use of high-quality iron ores which is rare at present. Then, 15% Al2O3 is an average for most of the current BF slag compositions. When low-quality and cheap iron ores are used, a BF slag containing 20% Al2O3 is generated. When Al2O3 in the slag is increased from 10 to 15%, the monticellite primary phase field is replaced by the spinel. Further, increase in Al2O3 to 20%, the size of the spinel primary phase field is expanded significantly. By considering liquidus temperature, desulphurization potential and viscosity, Osborn et al. proposed an “optimum” BF slag composition for each pseudo-ternary section. For example, at 10% Al2O3, the “optimum” slag contains 14% MgO, 44% CaO and 32% SiO2. When the Al2O3 is increased to 20%, the “optimum” slag composition is changed to 11% MgO, 45% CaO and 24% SiO2. However, these suggested “optimum” slag compositions were not used by the BF operators as they are too close to the MgO and Ca2SiO4 primary phase fields where the liquidus temperatures are very sensitive to the slag composition. A small increase in CaO or MgO concentration can increase the liquidus temperature significantly. Another issue is a higher slag rate for the “optimum” slag compositions because more CaO and MgO fluxes need to be added. In fact, each blast furnace has its own feed structure, hot metal quality requirement and operating parameters. The purpose of a phase diagram is to provide systematic information for all BF operators to select the composition suitable for their operations. It is not necessary for the researchers to recommend an “optimum” composition for BF slag.

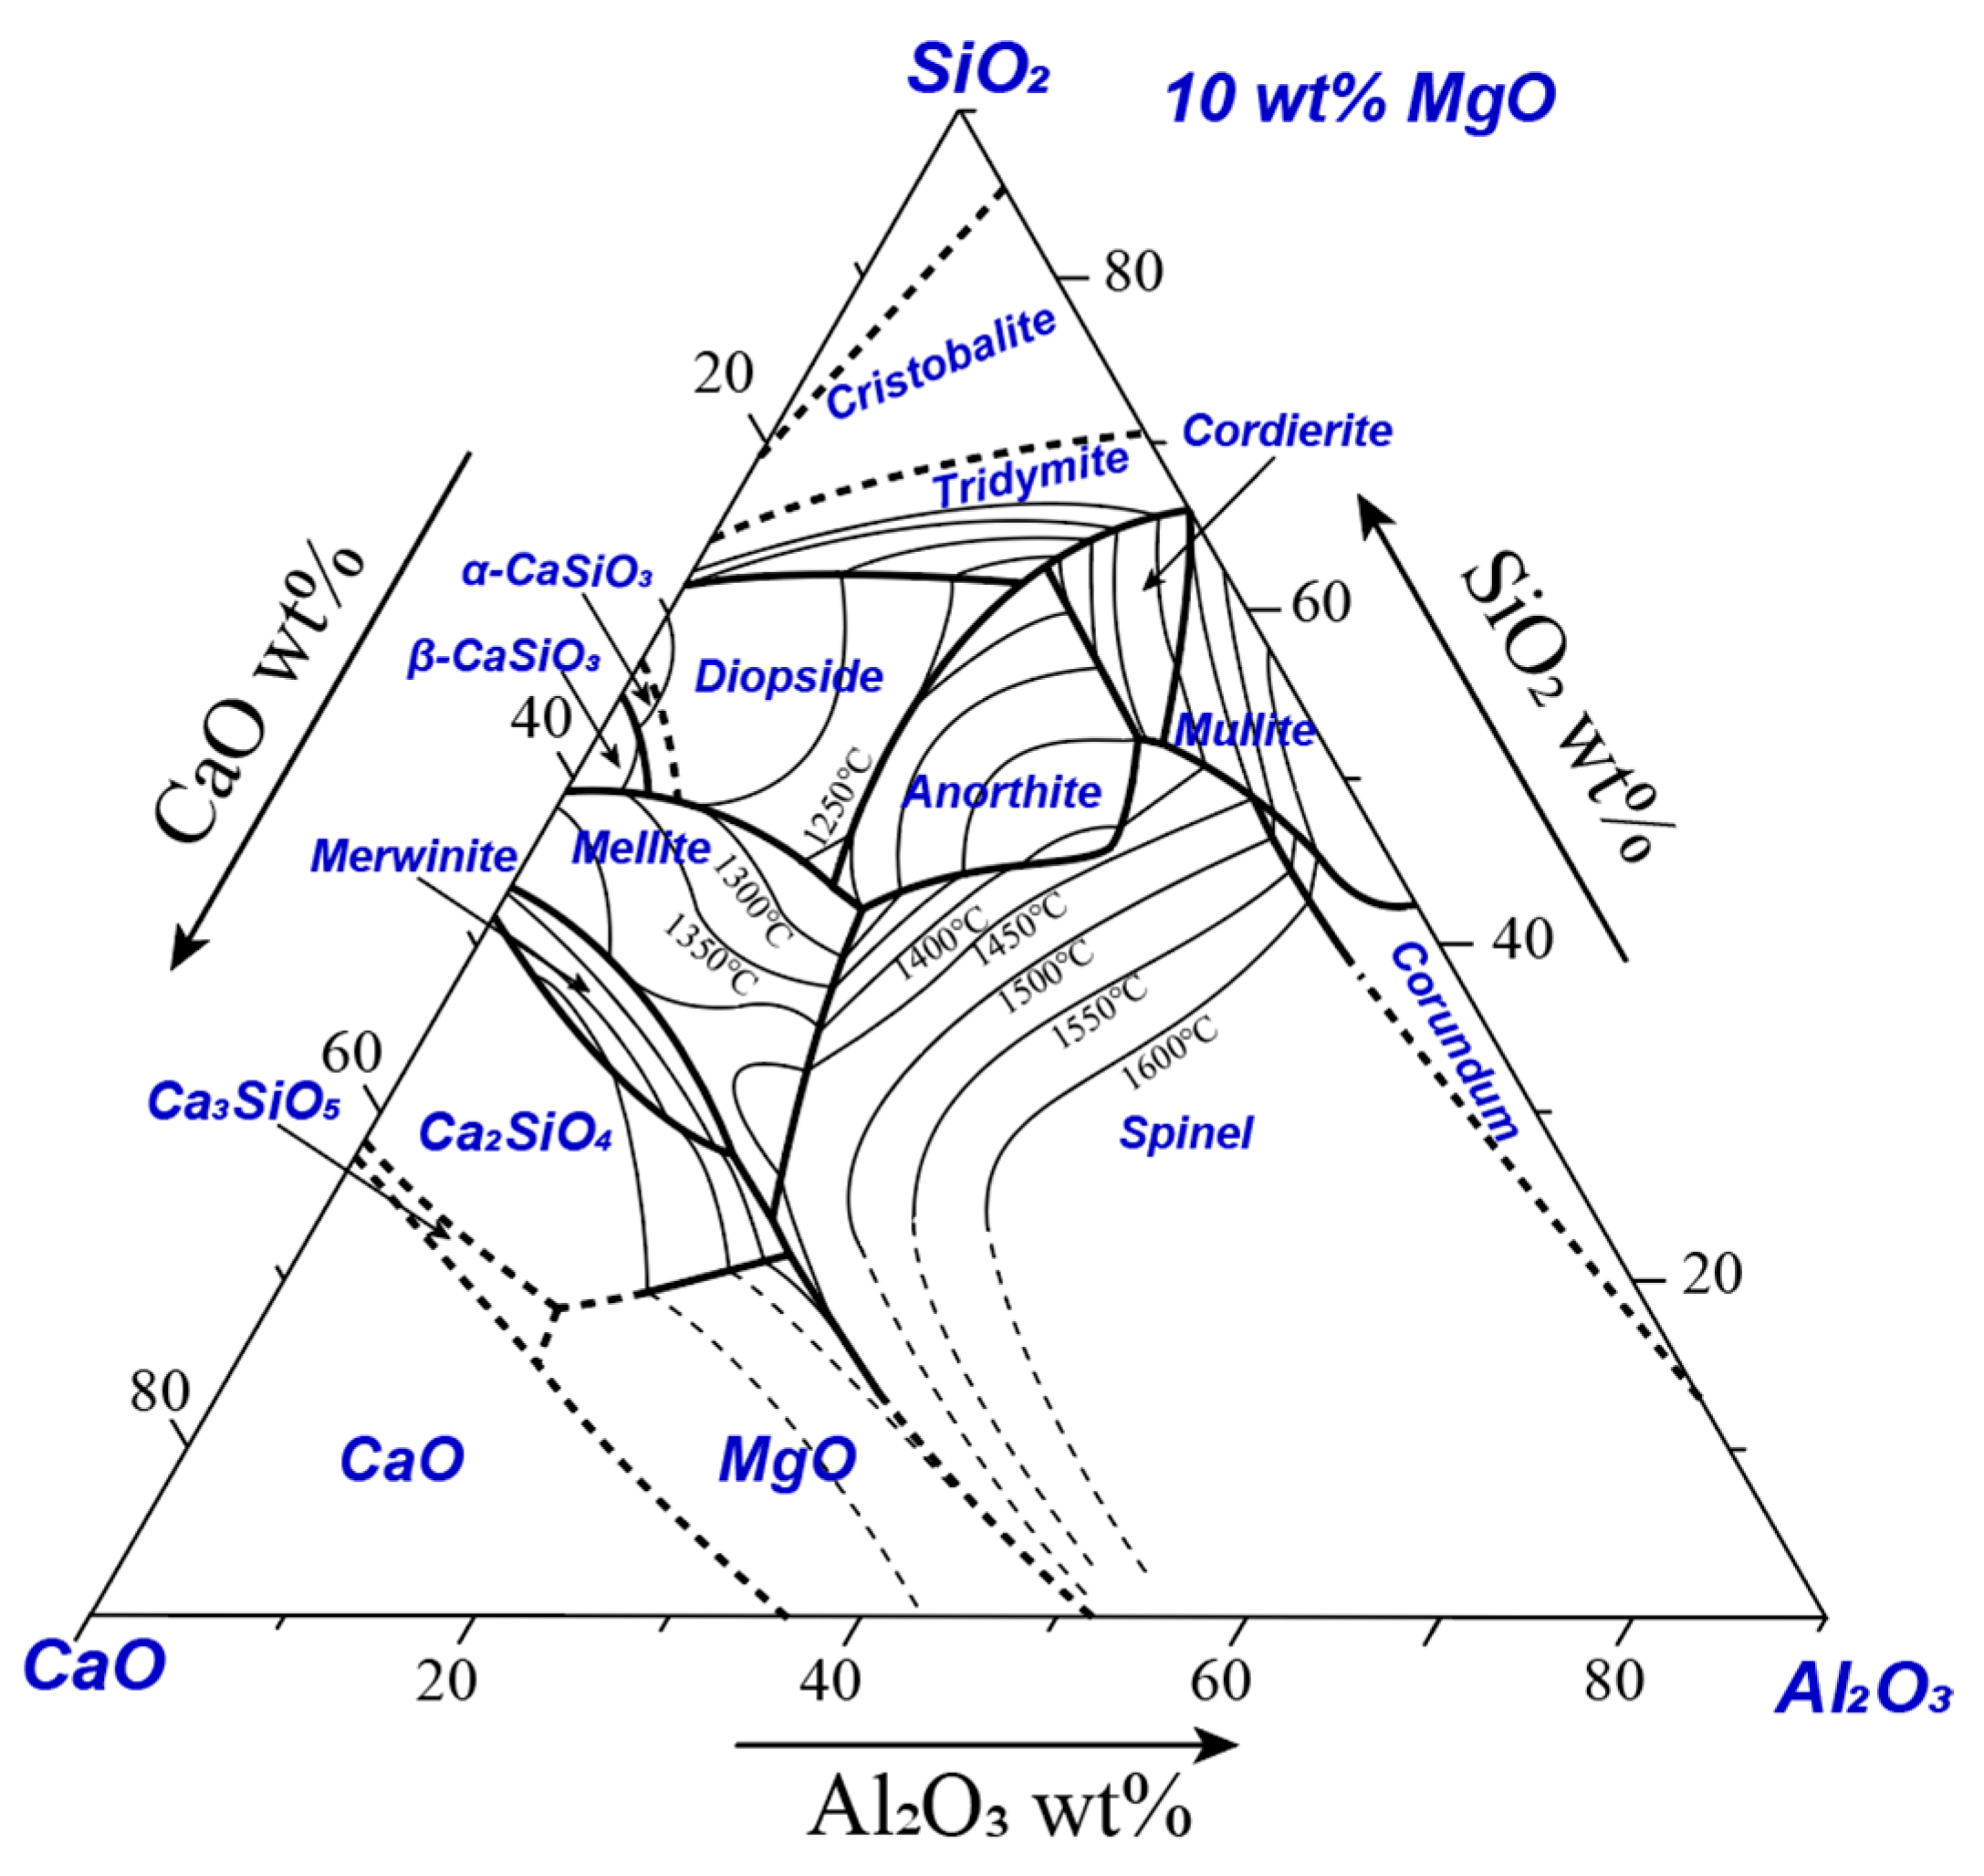
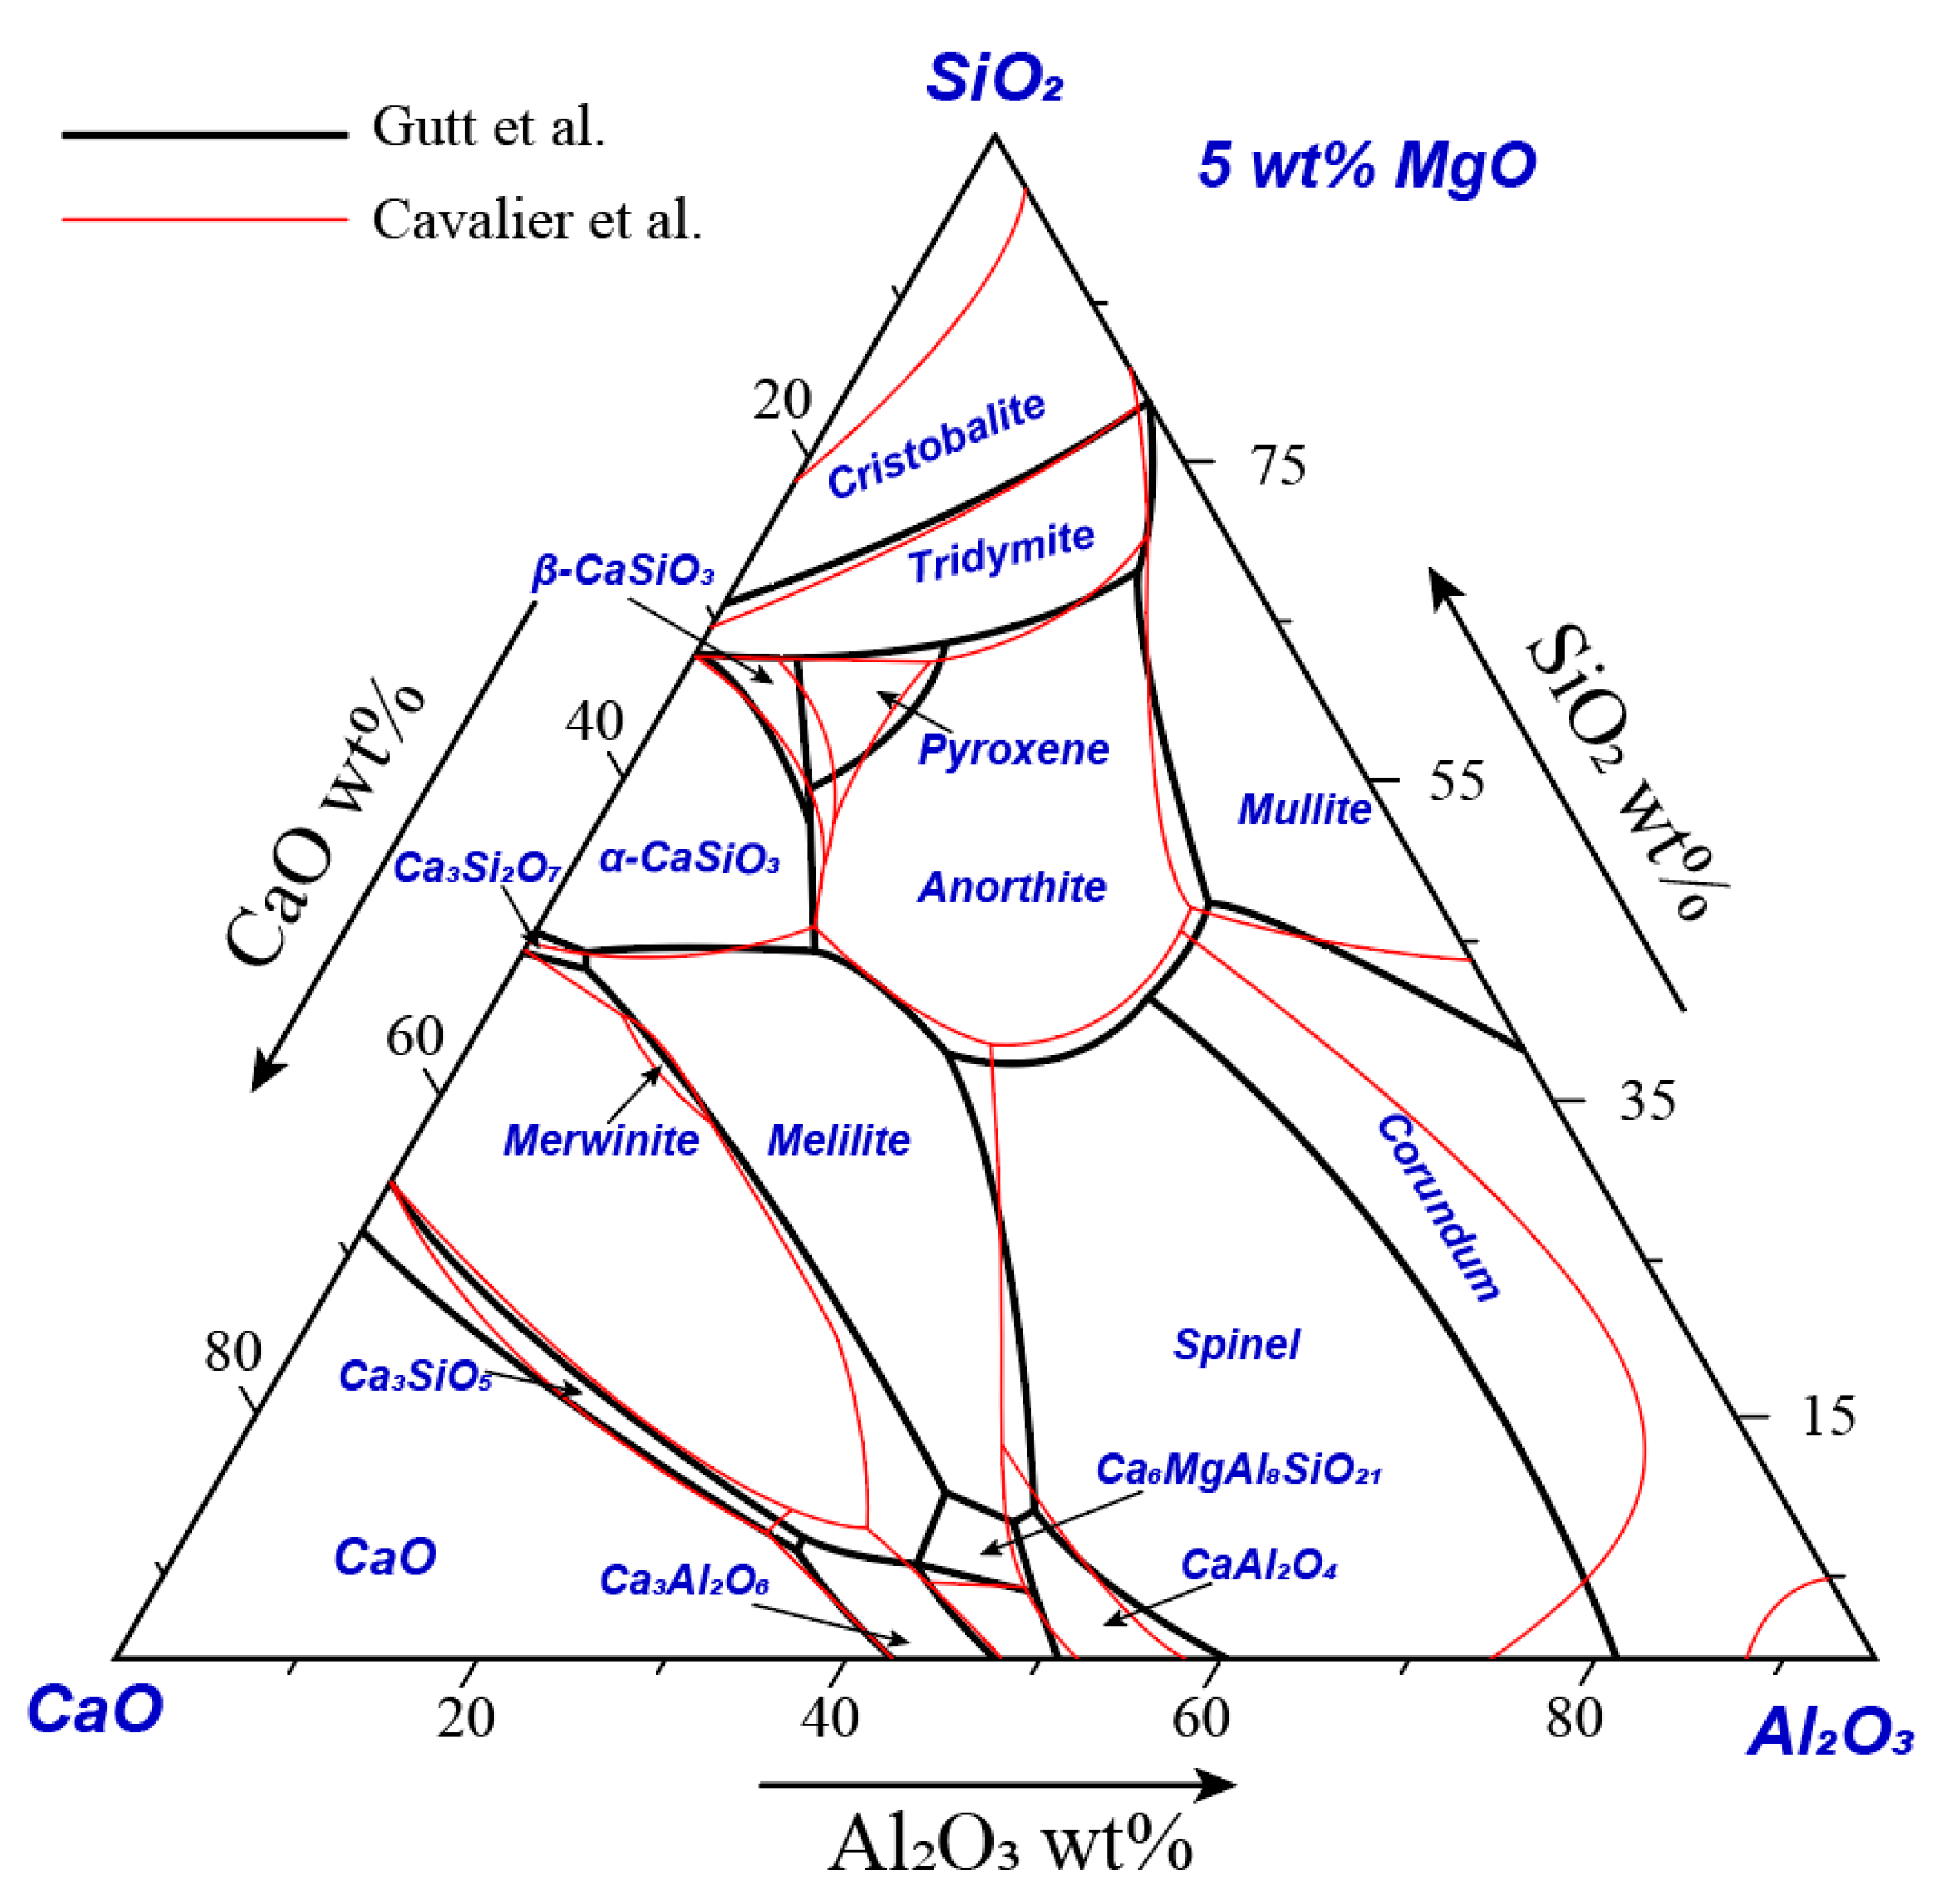
3.2. CaO-MgO-Al2O3-SiO2 System with Fixed MgO

To add knowledge to the phase equilibria of the system CaO-MgO-Al2O3-SiO2 relevant to BF slags, Prince et al. [8] constructed a pseudo-ternary phase diagram CaO-MgO-Al2O3-SiO2 at constant 10% MgO. He used conventional quenching and petrographic microscope technique to investigate the primary phase fields and liquidus temperatures as a function of composition. Figure 7 shows the pseudo-ternary phase diagram CaO-MgO-Al2O3-SiO2 for the 10% MgO plane. It can be seen that the melilite primary phase field, which is usually the primary phase of a BF slag, is surrounded by the primary phase fields of spinel, merwinite, pseudo-wollastonite, diopside and anorthite. Unusual shapes of the isotherms in the melilite primary phase field indicate that the melilite solid solution is formed by two endmembers: akermanite Ca2MgSi2O7, and gehlenite Ca2Al2SiO7. By using this diagram, at a constant MgO concentration in the slag, the effects of the CaO/SiO2 ratio and Al2O3 on the liquidus temperature of the BF slag can be discussed by pseudo-binary phase diagrams from different directions.
In a late study, Cavalier and Sandrea-Deudon [10] reported three pseudo-ternary sections CaO-MgO-Al2O3-SiO2 at constant 5, 10 and 15% MgO, respectively. They used a high-temperature microscopy technique to determine the liquidus temperature of a fused slag. The precipitation and growth of the primary and secondary phases can be observed directly by the hot-stage microscope. Their focus was to determine the phase boundaries and the isotherms were mainly estimated from the limited number of experiments. The high viscosity of the silicate slag could delay the precipitation of the solid phases and affect the accuracy of the results. The 10% MgO plane reported by Cavalier and Sandrea-Deudon [10] is slightly below that reported by Prince [8]. For example, it can be seen from Figure 7 that the dicalcium silicate primary phase field joins with the melilite primary phase field. In the phase diagram reported by Cavalier and Sandrea-Deudon [10], the dicalcium silicate primary phase field is separated from the melilite primary phase field by the merwinite primary phase field. The dicalcium silicate primary phase field in Figure 7 does not join with CaO primary phase field. However, in the phase diagram reported by Prince [8]. The dicalcium silicate primary phase field joins with CaO primary phase field at the low-Al2O3 area.
Gutt and Russell [11] reinvestigated the system CaO-MgO-Al2O3-SiO2 at a constant 5% MgO using a hot-stage microscope technique. Figure 8 compares the results between Cavalier and Sandrea-Deudon [10] and Gutt and Russell [11]. It can be seen that even though the same experimental technique was used, different primary phases and sizes of the primary phases were reported by the two groups. The C6MA4S phase reported by Gutt and Russell [11] is not present on the plane reported by Cavalier and Sandrea-Deudon [10]. On the other hand, the merwinite primary phase field was not mentioned by Cavalier and Sandrea-Deudon [10].

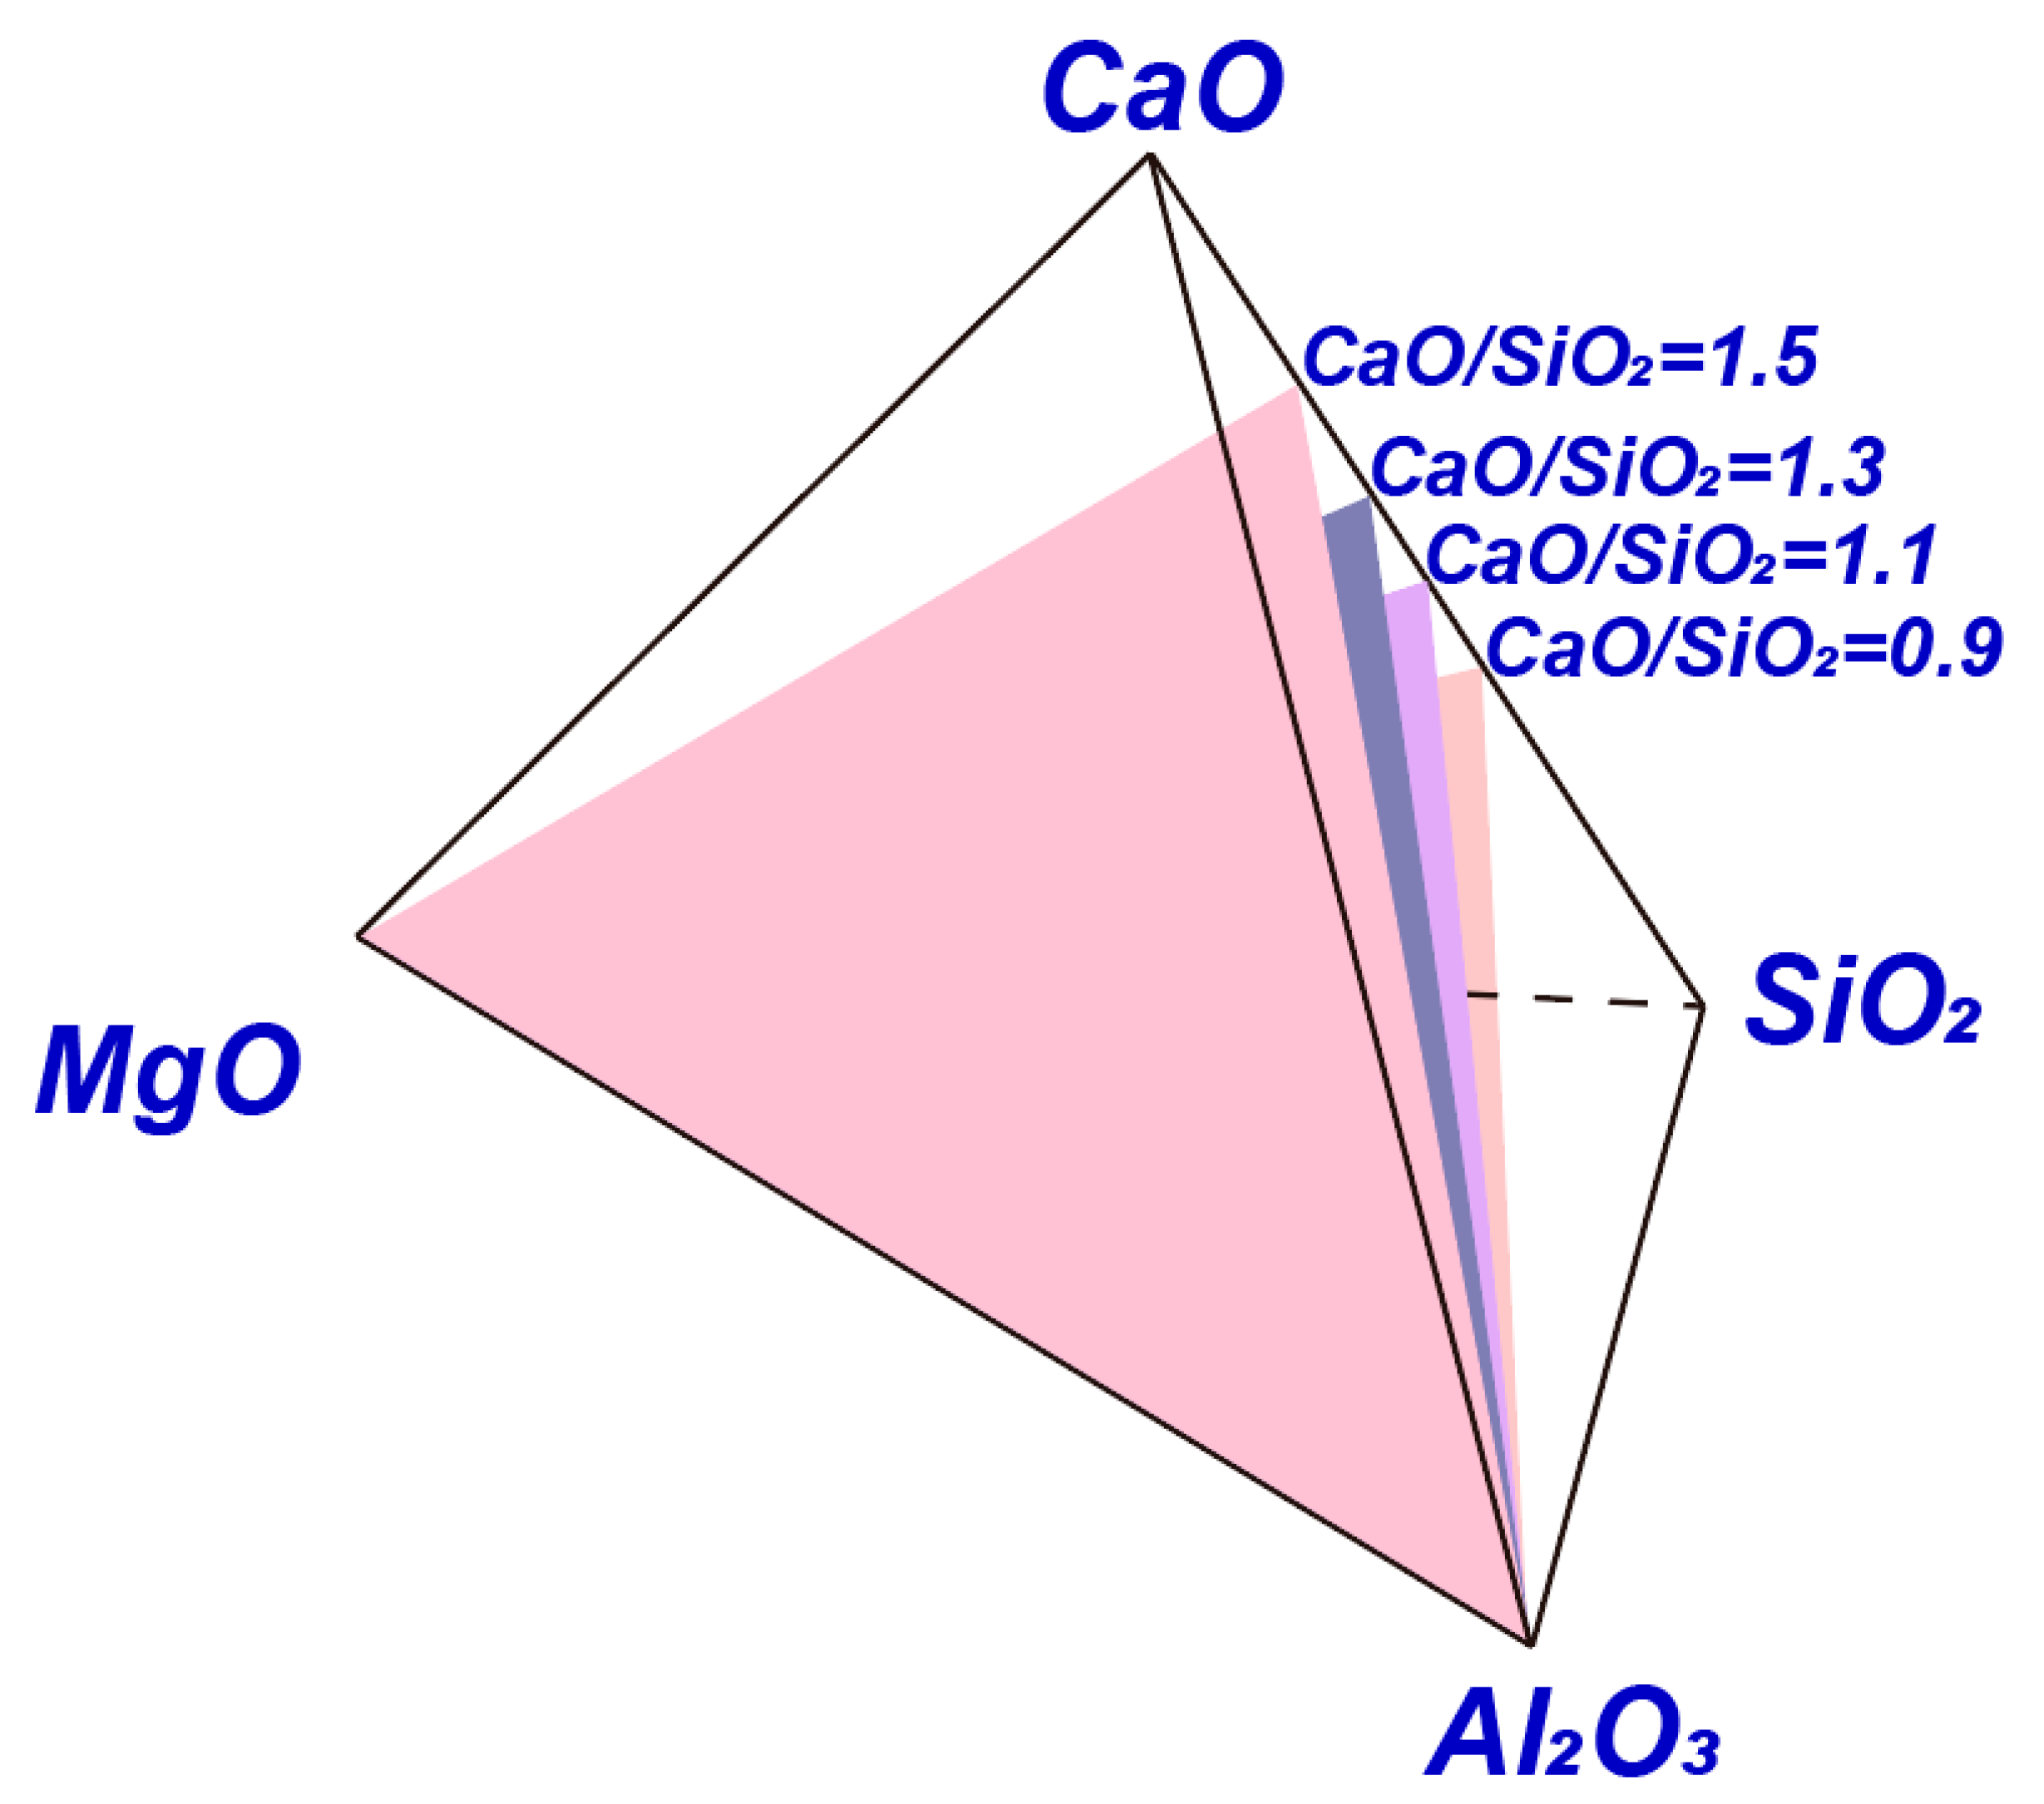
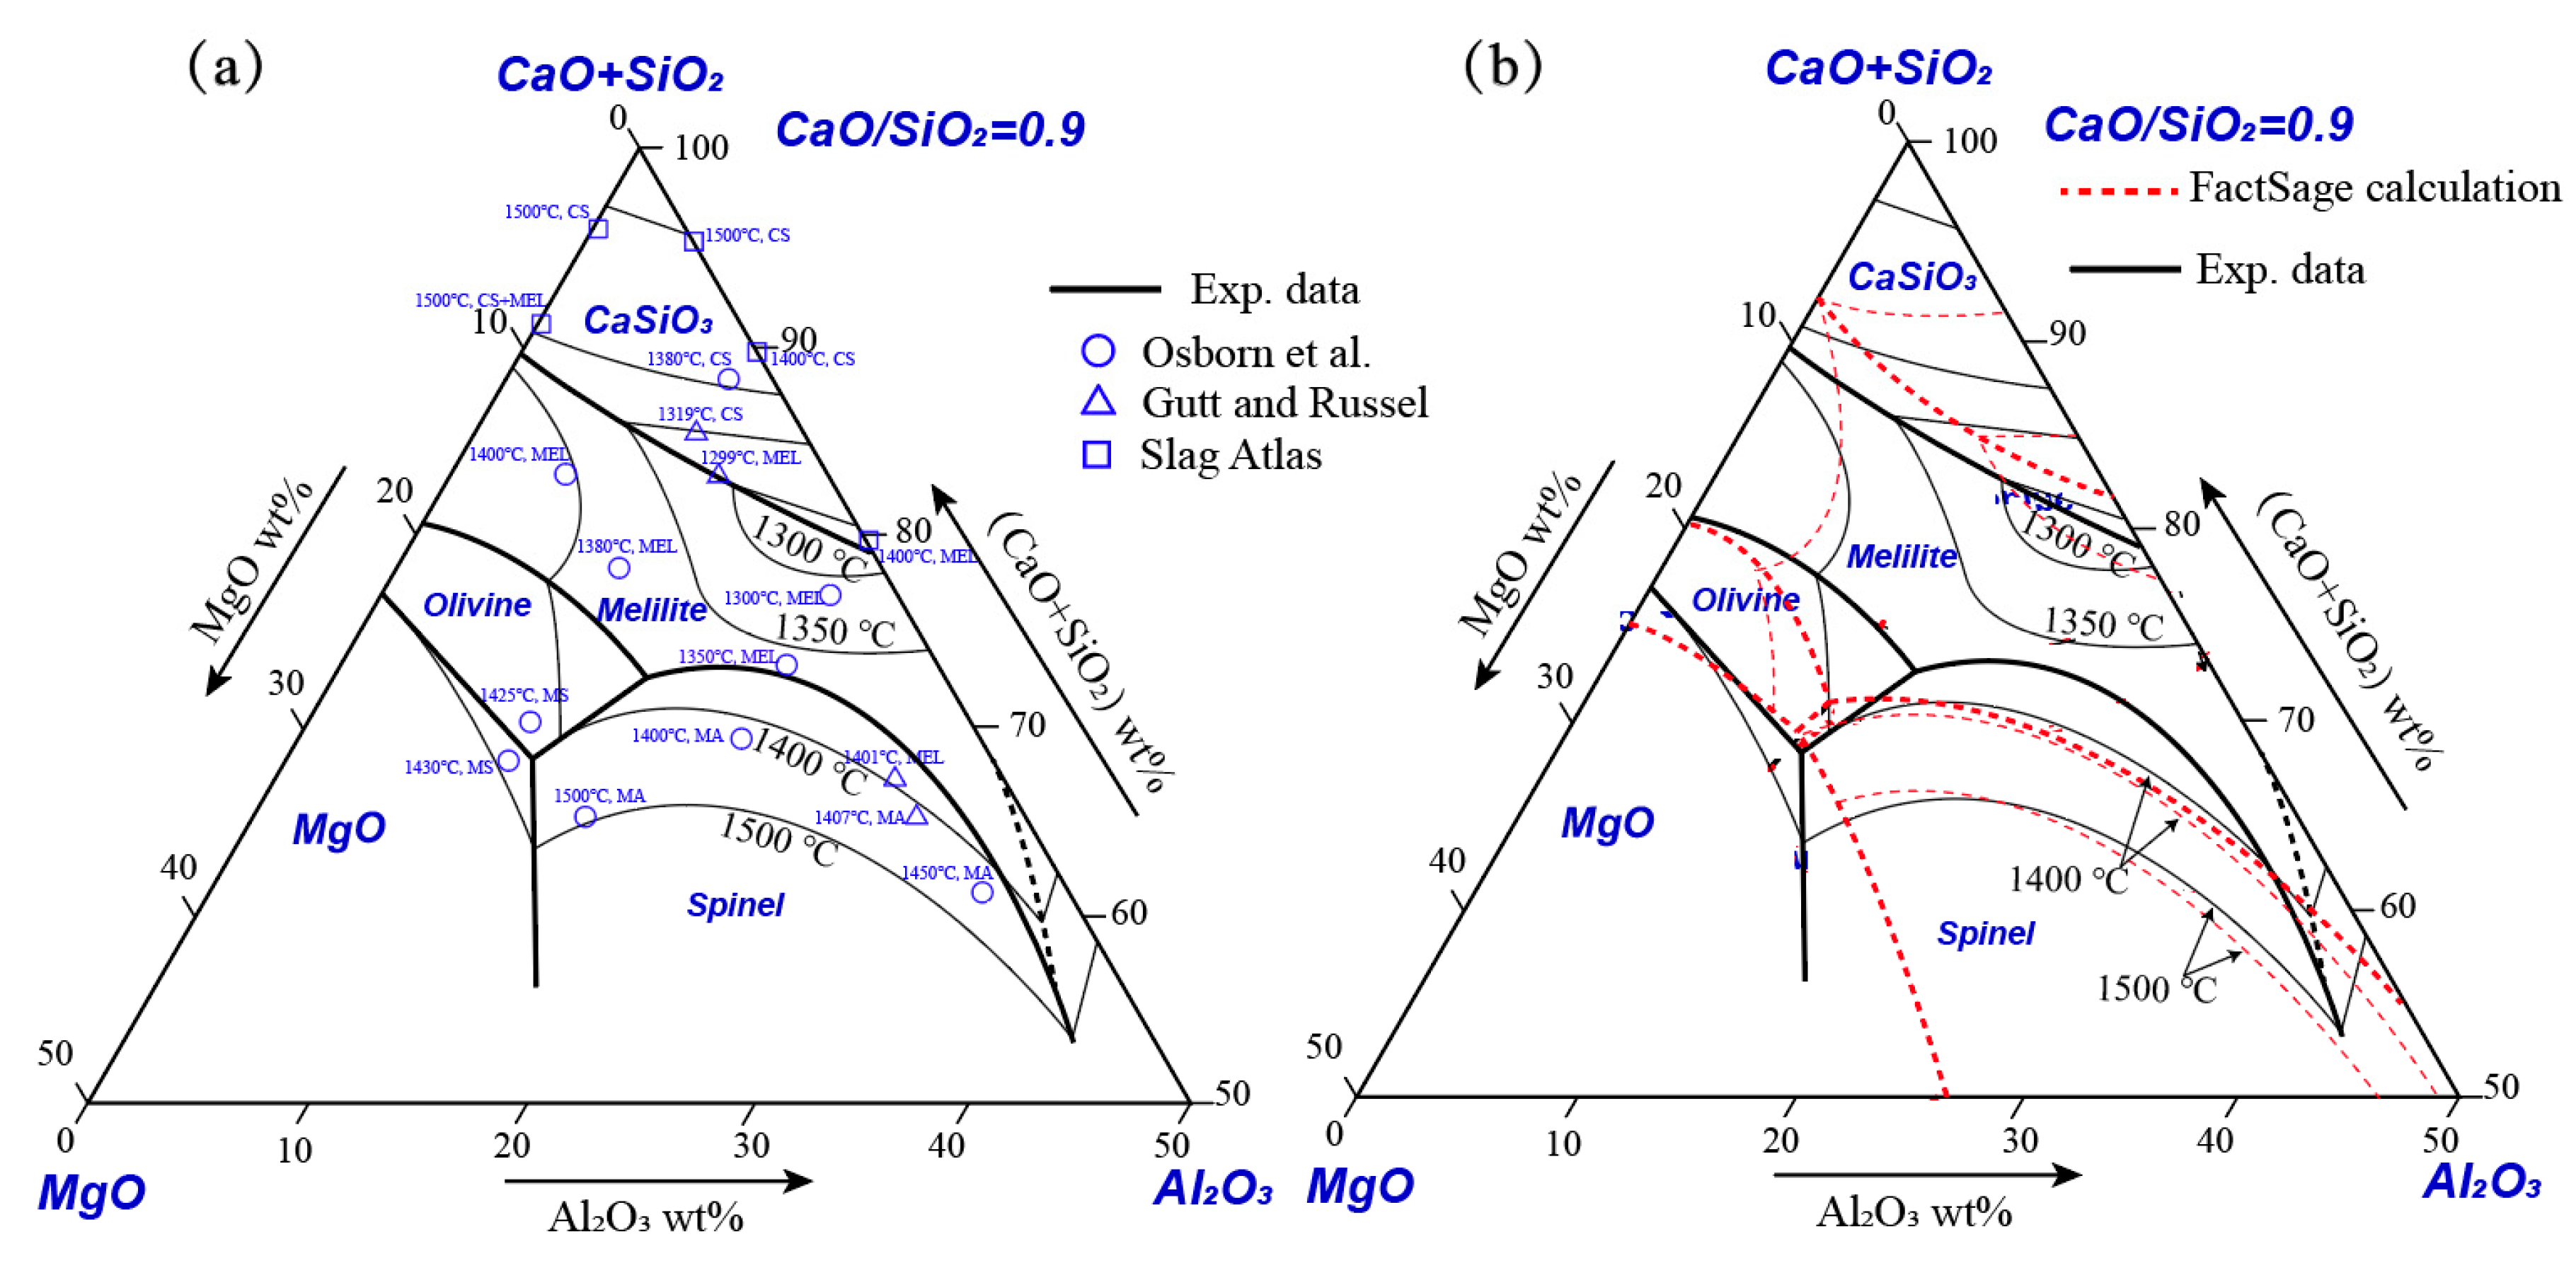
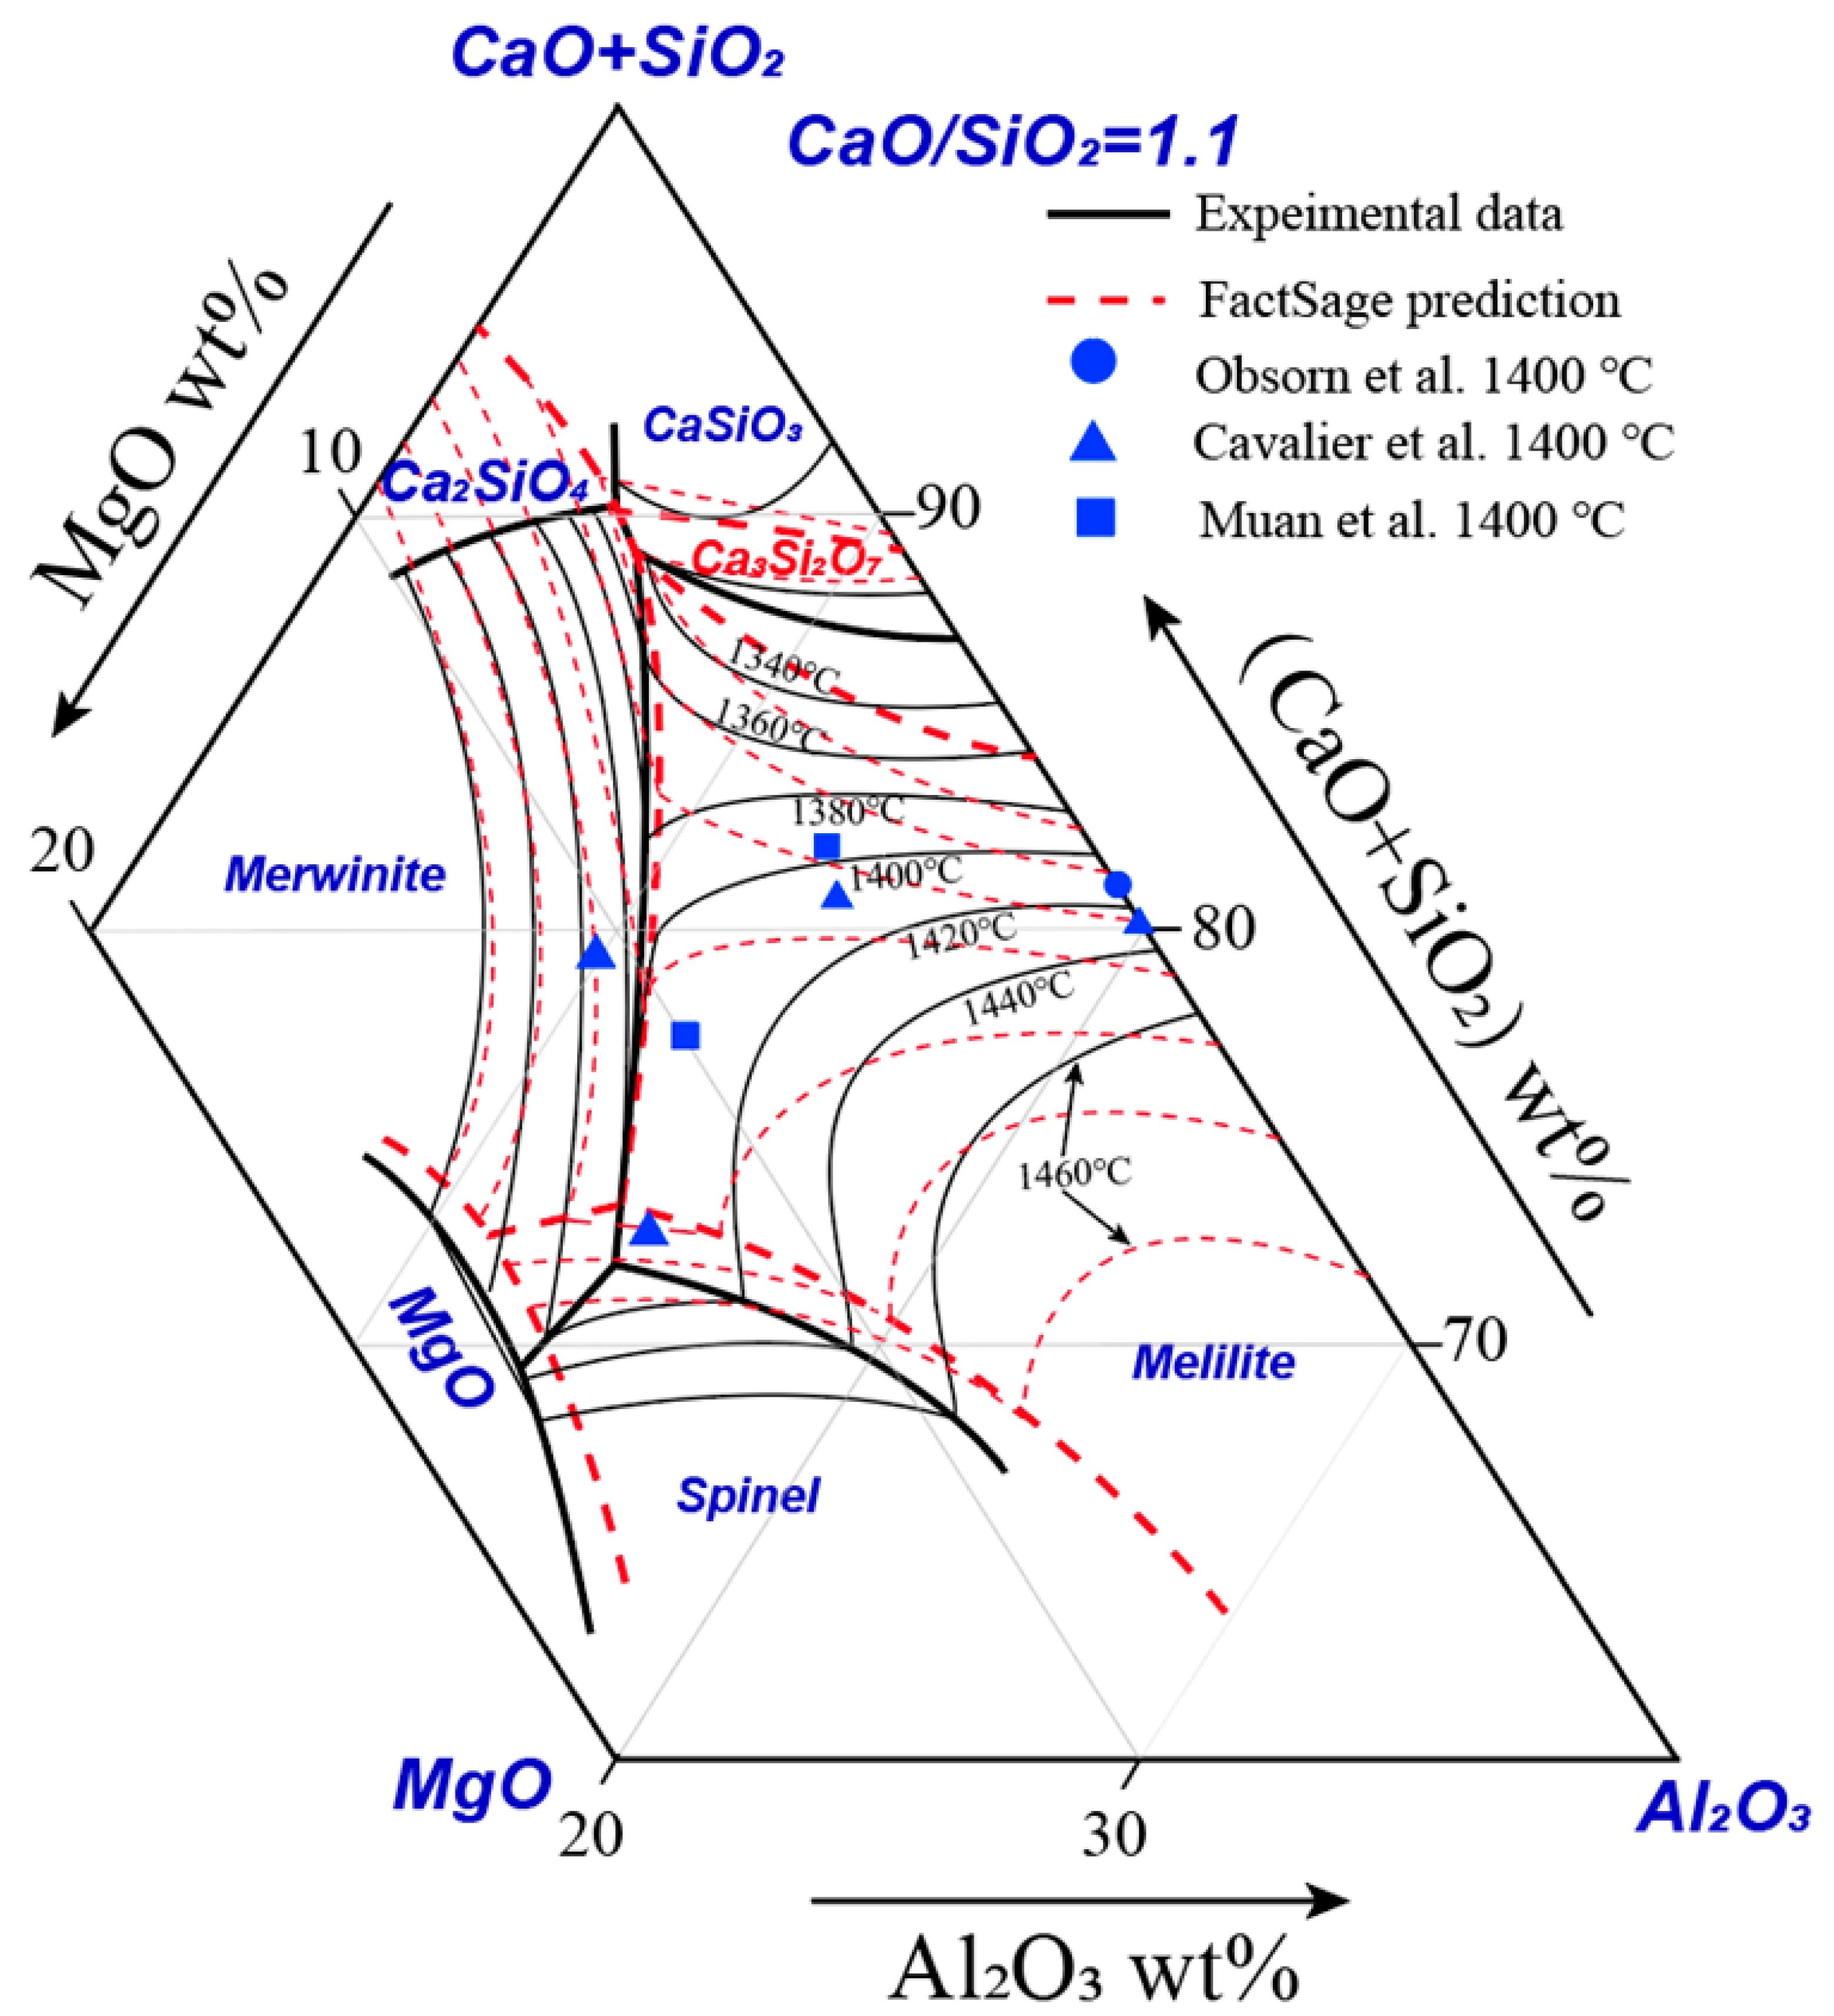
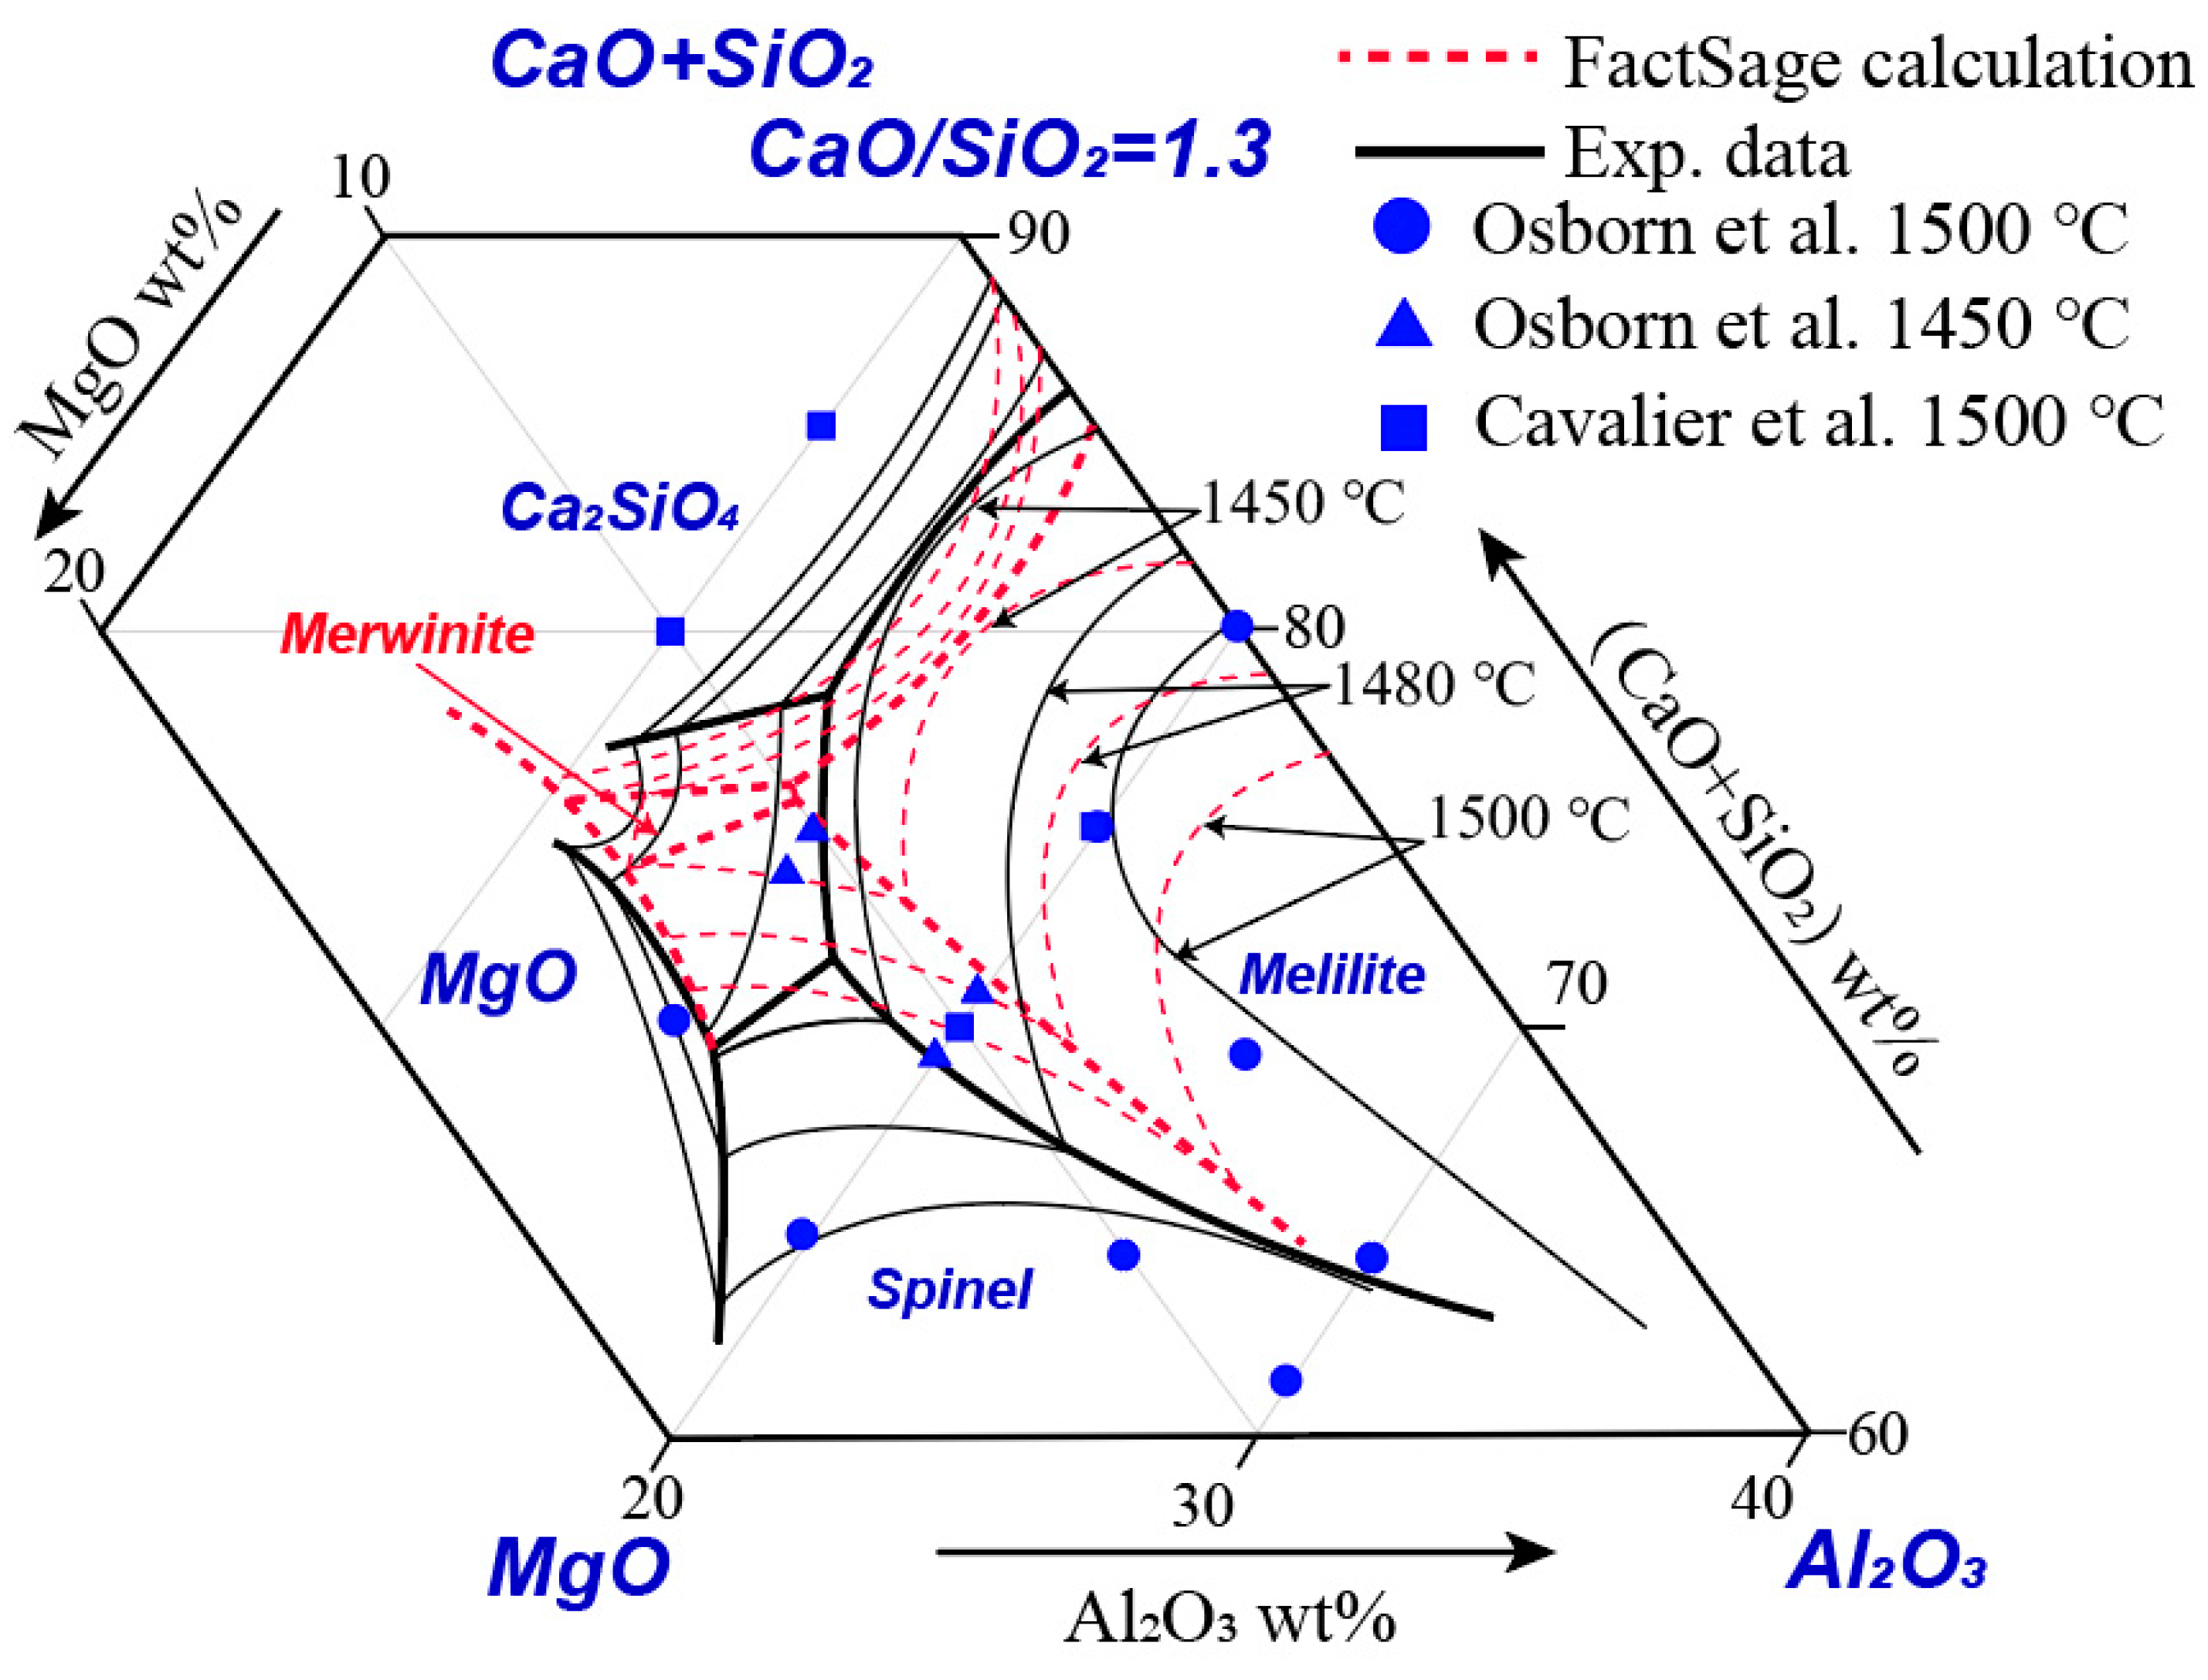
3.3. (CaO + SiO2)-Al2O3-MgO System at Constant CaO/SiO2

Binary basicity CaO/SiO2 is a key parameter to determine the desulphurization capacity and viscosity of the BF slag, and the quality of hot metal. For a given BF, CaO/SiO2 is usually kept constant to maintain a stable operation and hot metal quality. Following the requirements from BF operators, a series of pseudo-ternary phase diagrams (CaO + SiO2)-Al2O3-MgO at constant CaO/SiO2 ratio were constructed by using the quenching-EPMA technique [13,14,15,16]. Figure 9 shows the representation of the pseudo-ternary phase diagrams CaO + SiO2)-Al2O3-MgO at constant CaO/SiO2 ratios. When CaO/SiO2 ratio is fixed, (CaO/SiO2) can be taken as one of the end members in a pseudo-ternary phase diagram. Four pseudo-ternary sections with the CaO/SiO2 ratios of 0.9, 1.1, 1.3 and 1.5 were constructed experimentally. The sections with the CaO/SiO2 ratios 0.9-1.3 represent the composition range for the final BF slags and the section with the CaO/SiO2 ratio of 1.5 represents the compositions of the bosh slag.
Figure 10, Figure 11 and Figure 12 show three pseudo-ternary phase diagrams (CaO + SiO2)-Al2O3-MgO at constant CaO/SiO2 ratios of 0.9, 1.1 and 1.3, respectively. It can be seen from Figure 10a that the melilite primary phase field in the new diagram shifted toward the low CaO + SiO2 direction and the wollastonite primary phase field expands compared to the results from Slag Atlas [25]. It should be mentioned that the corundum primary phase field was revealed in the CaO-SiO2-Al2O3 system which agrees with the present study, although the corundum primary phase field expands toward the high CaO + SiO2 direction and the liquidus temperature from the previous study shows a large discrepancy with the current results. The liquidus temperatures obtained from Slag Atlas deviate largely from the present measurements in both ternary systems.
The calculated phase diagram by FactSage thermodynamic software is used to compare with the present results and is shown in Figure 10b. The comparisons of primary phase fields in Figure 9 show that FactSage reproduced the wollastonite, melilite, olivine, periclase, and spinel primary phase fields in the phase diagram, while the corundum primary phase field was not shown in the FactSage calculation. The area of the melilite primary phase field in the present study is narrowed by the expansion of wollastonite, olivine, and spinel primary phase fields compared to the calculated diagram. Good agreements of isotherms were only found in the spinel primary field, while all the isotherms in periclase, olivine, melilite, and wollastonite changed significantly. The prediction also shows that the olivine primary phase field would become fully liquid at a temperature of 1400 °C; however, the present measurements identified a small area with a liquidus temperature higher than 1400 °C.
It can be seen in Figure 11 that the experimental results have a good agreement with previous work reported by Osborn et al. [7], Cavalier and Sandrea-Deudon [10] and Muan and Osborn [24] at 1400 °C. FactSage predictions show similar overall trends as the experimental results, but the locations of the isotherms can be found significantly different. The FactSage software used the published data to optimize the databases and the accuracy of FactSage calculations relies on the accuracy of the experimental data used. The deviation of FactSage can be attributed to the limitation of the previous research techniques so the accuracy of the data was not enough, in particular the solid solutions. Generally, the experimentally determined liquidus temperatures in the present study are approximately 20 °C higher than those FactSage predictions in the melilite primary phase field. In MgO and spinel primary phase fields, the experimentally determined liquidus temperatures in the present study are usually 20 °C lower than the predictions. In the merwinite primary phase field, the experimentally determined liquidus temperatures agree well with the prediction values. It is noted that there is a small Ca3Si2O7 primary phase field according to the FactSage predictions. However, the Ca3Si2O7 primary phase was not observed in the present study. Instead, the wollastonite (CaSiO3) primary phase field is present in the composition range. Additionally, the Ca2SiO4 primary phase was observed by the present experiments at the high (CaO + SiO2) corner, which is not shown by FactSage predictions.
Figure 12 shows the experimentally determined pseudo-ternary phase diagram (CaO + SiO2)-Al2O3-MgO at a constant CaO/SiO2 ratio of 1.3 [15] compared with the data reported by Osborn et al. [7], Cavalier and Sandrea-Deudon [10] and FactSage prediction. The experimental results show general agreement with previous works. The liquidus temperatures in the Ca2SiO4 primary phase field reported by Osborn et al. [7] are much higher than the present results. In addition, predictions of FactSage are also shown in the figure for comparison. FactSage predictions show similar trends as the experimental results, but the locations of the isotherms are significantly different. Experimentally determined liquidus temperatures in the spinel and Ca2SiO4 primary phase fields are approximately 50 °C lower than those predicted by FactSage. However, in the merwinite primary phase field, the experimentally determined liquidus temperatures are approximately 50 °C higher than the predictions. A significant difference is that the experimentally determined merwinite phase area is larger than the FactSage predictions. This significant difference may come from the lack of thermodynamics data in the merwinite primary phase field. In the melilite primary phase field, the experimentally determined liquidus temperatures are usually 20 °C different from predicted values.

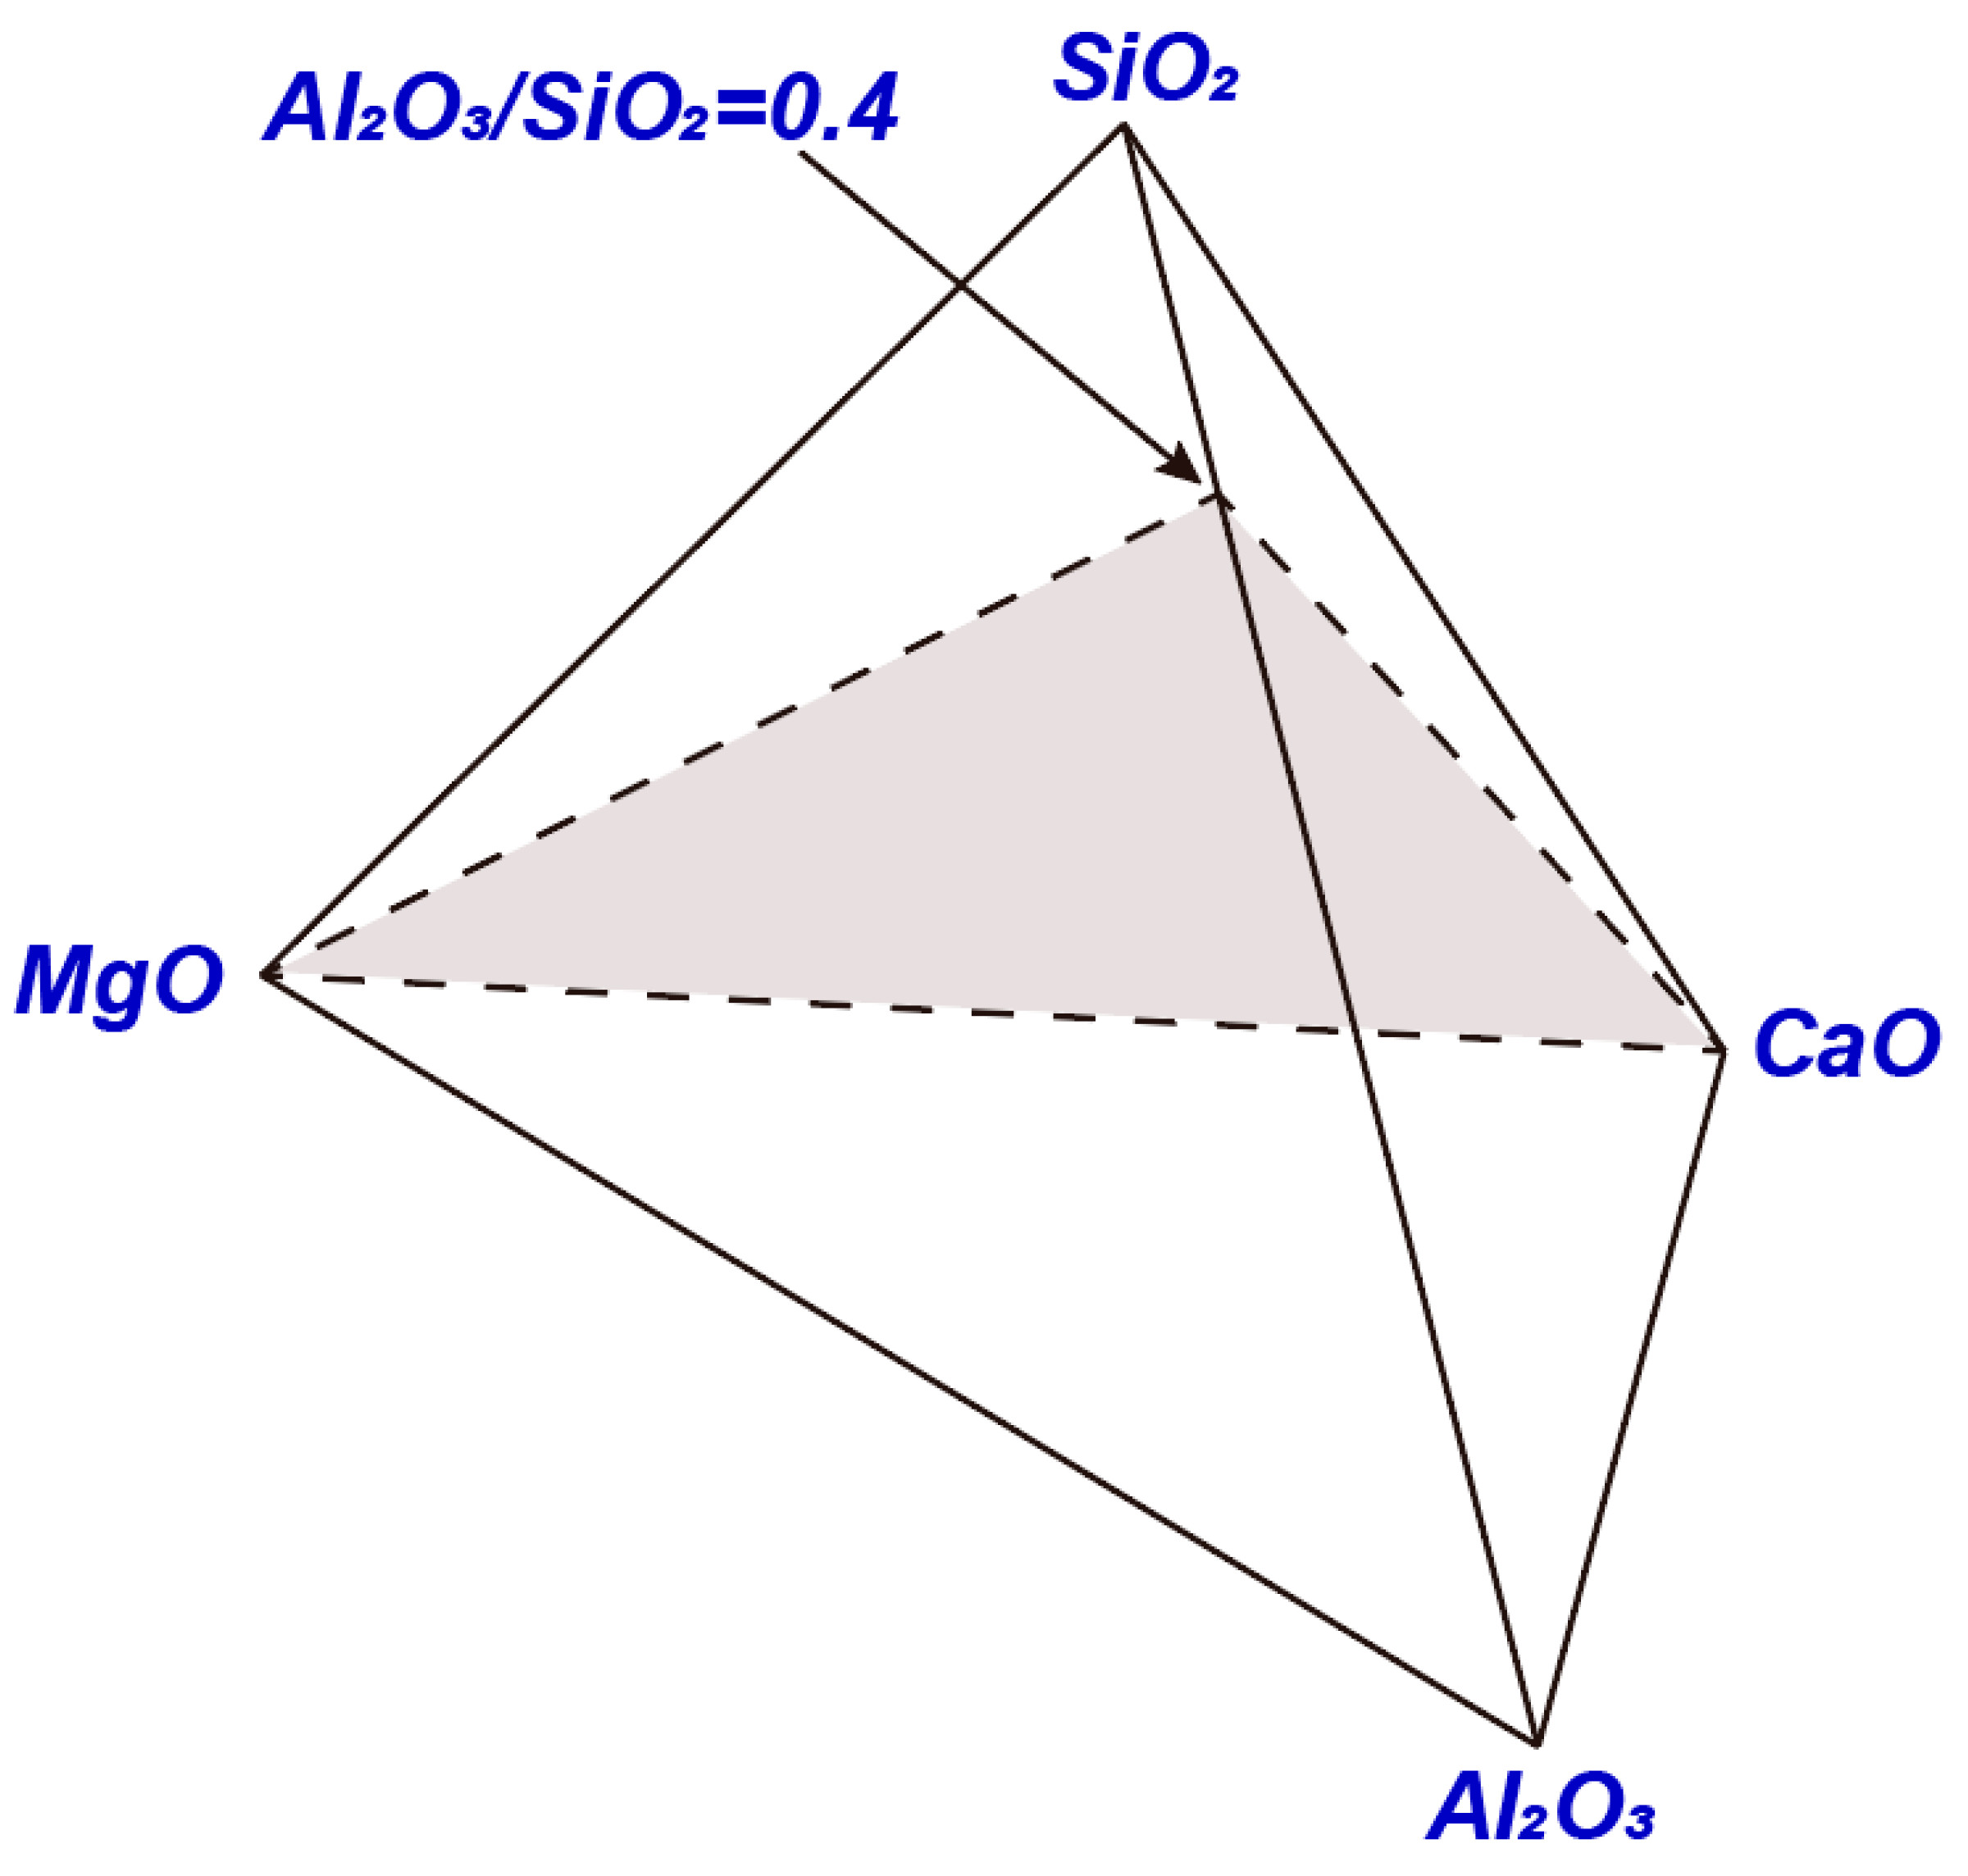
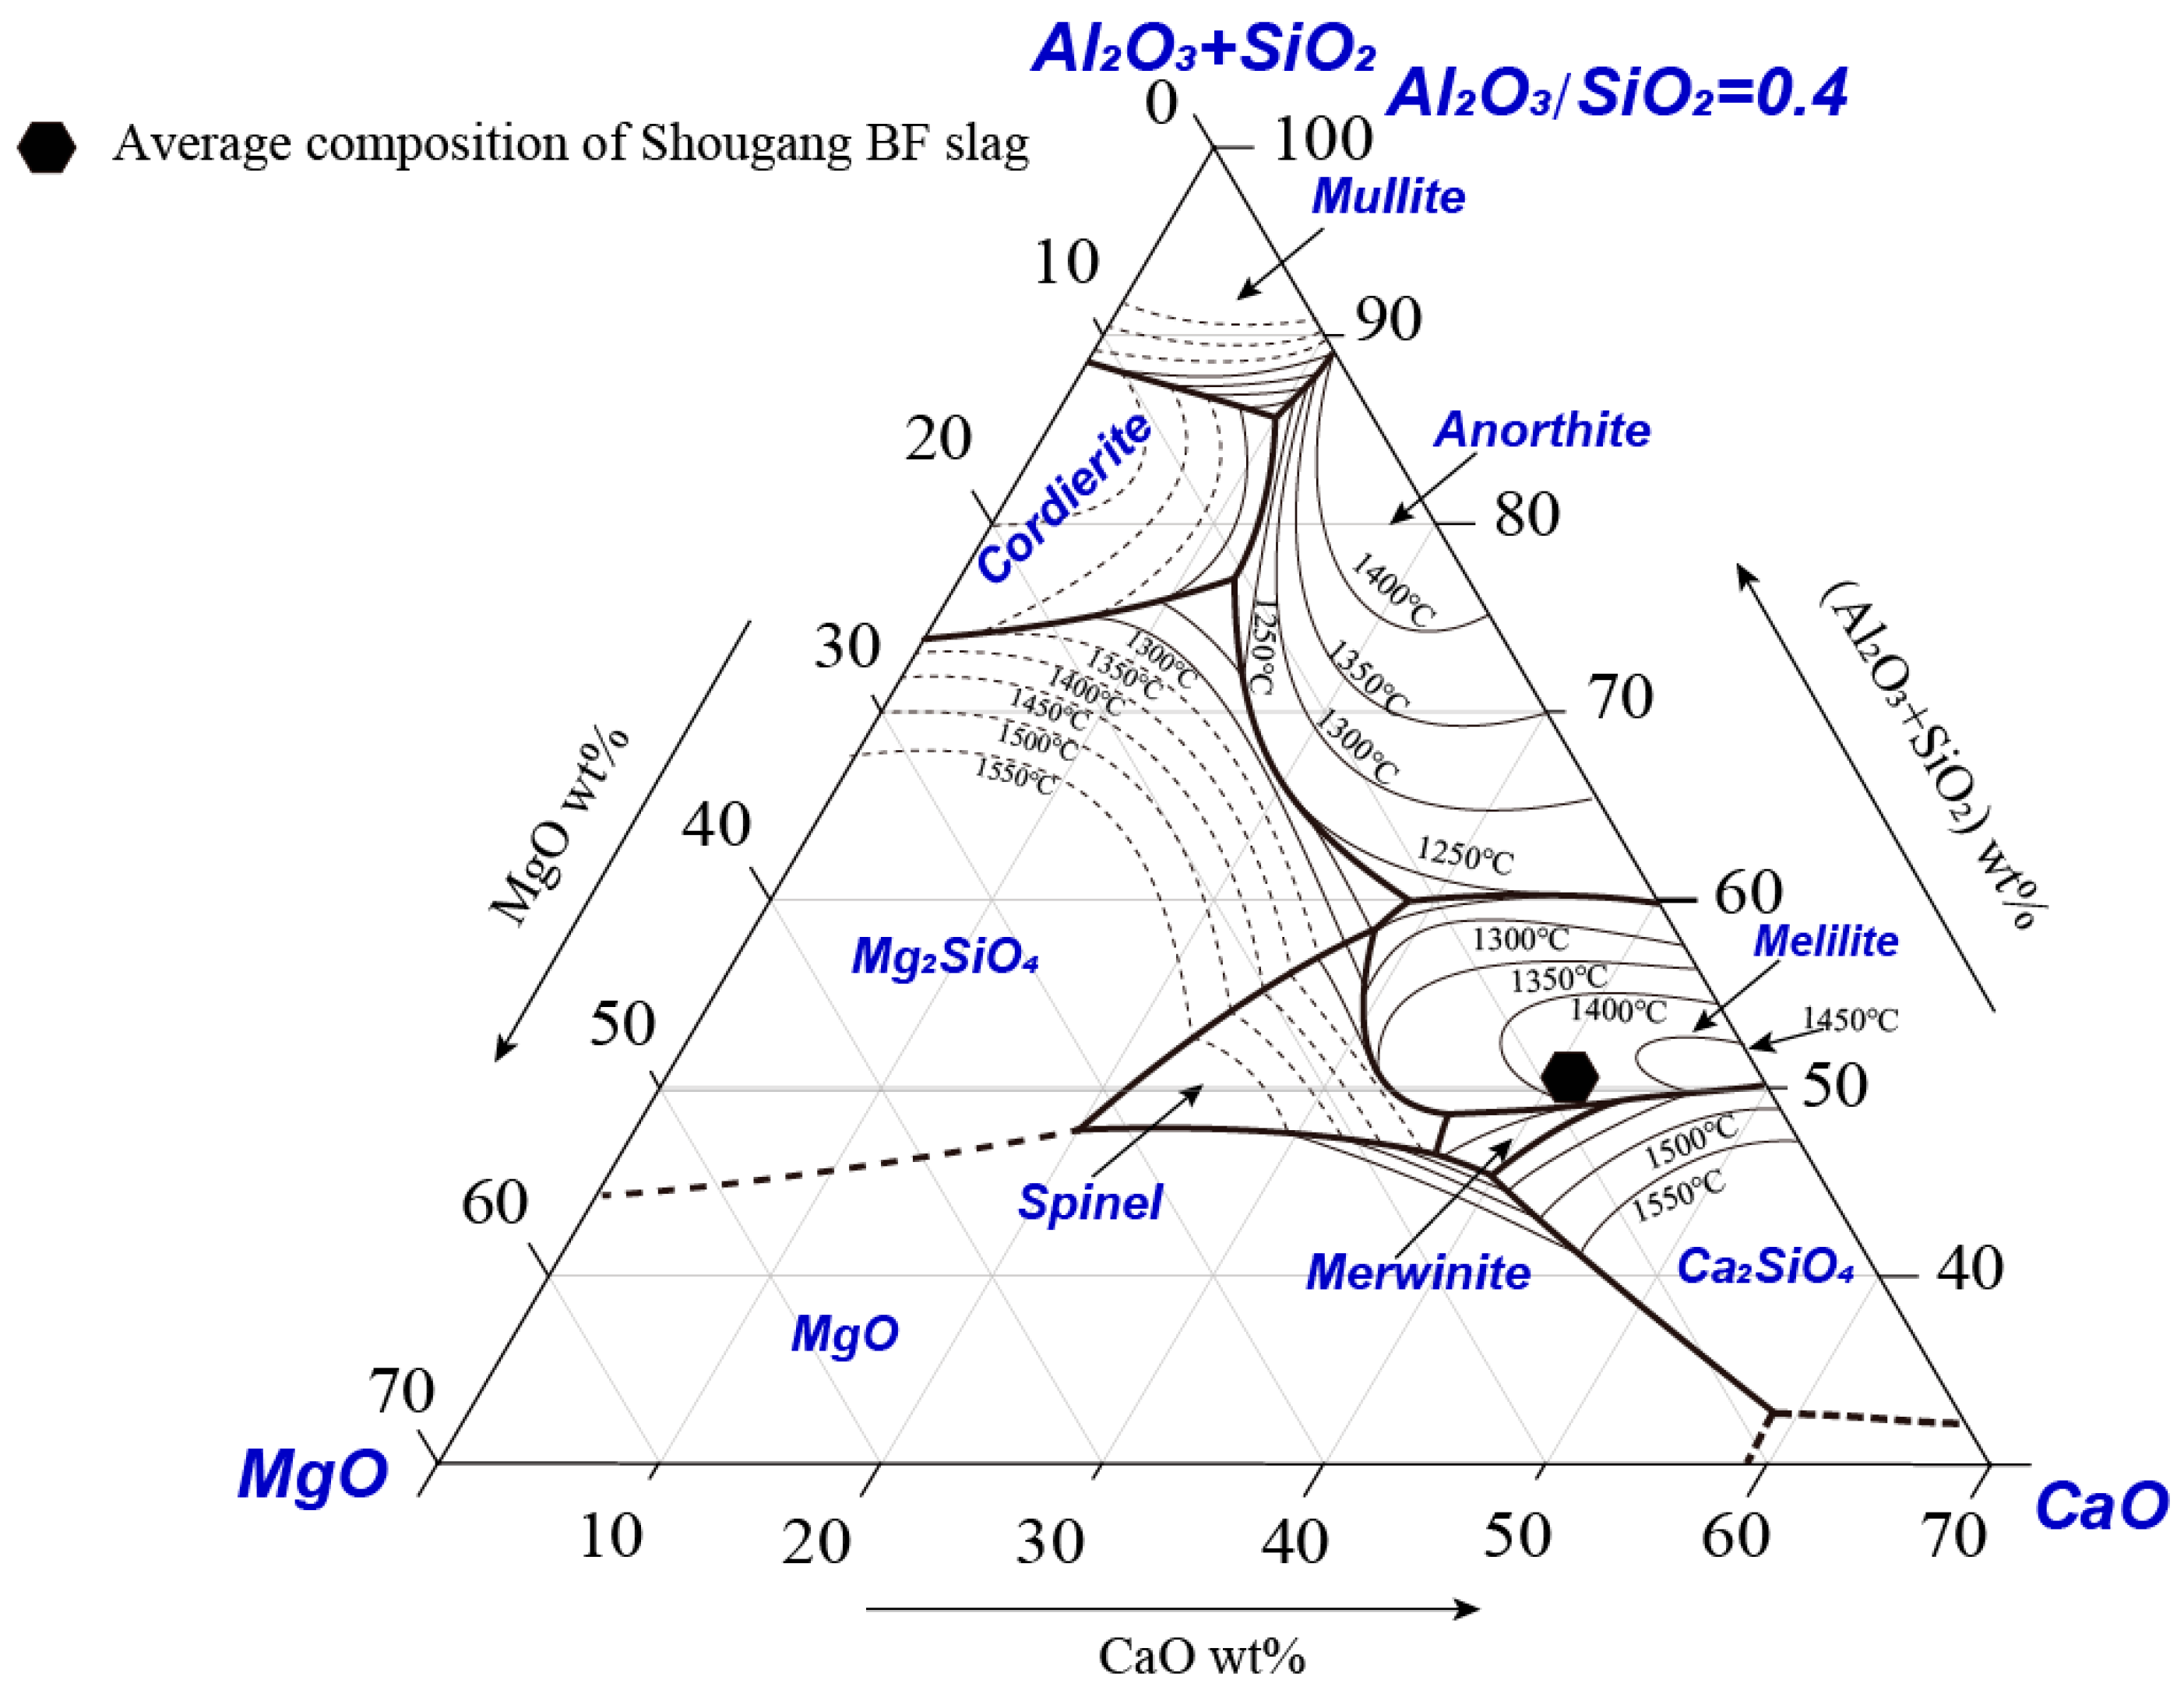
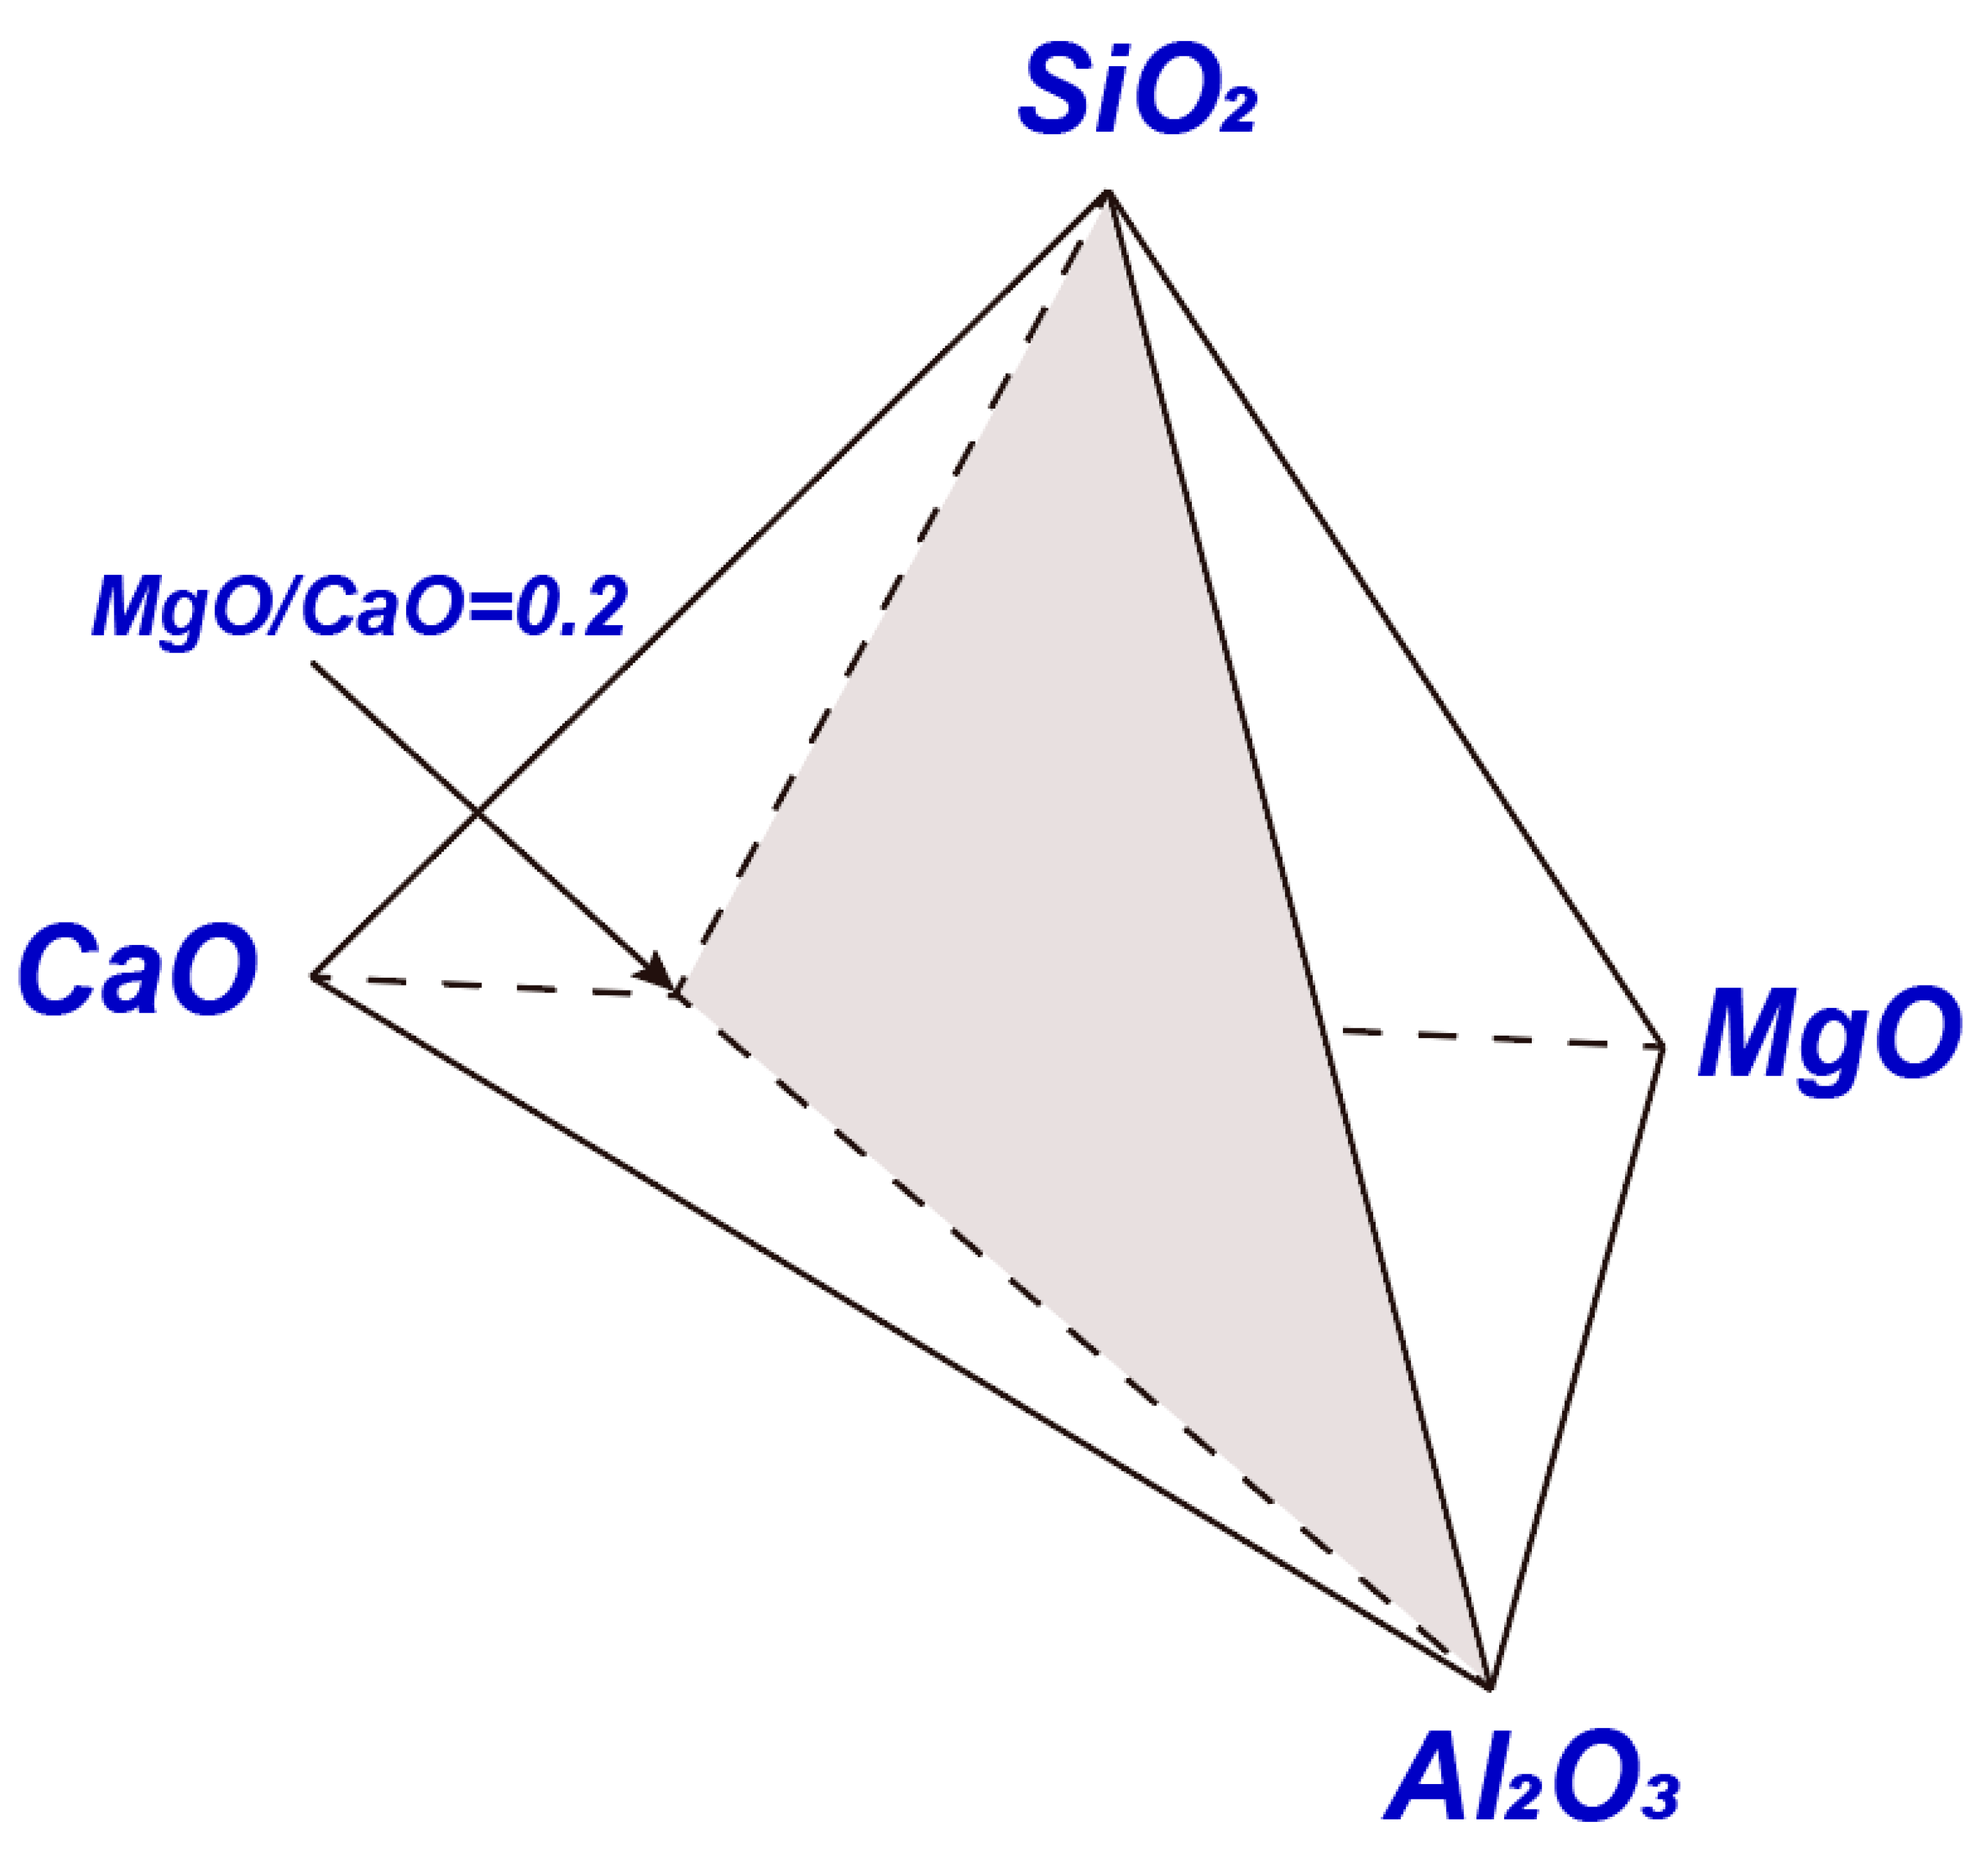
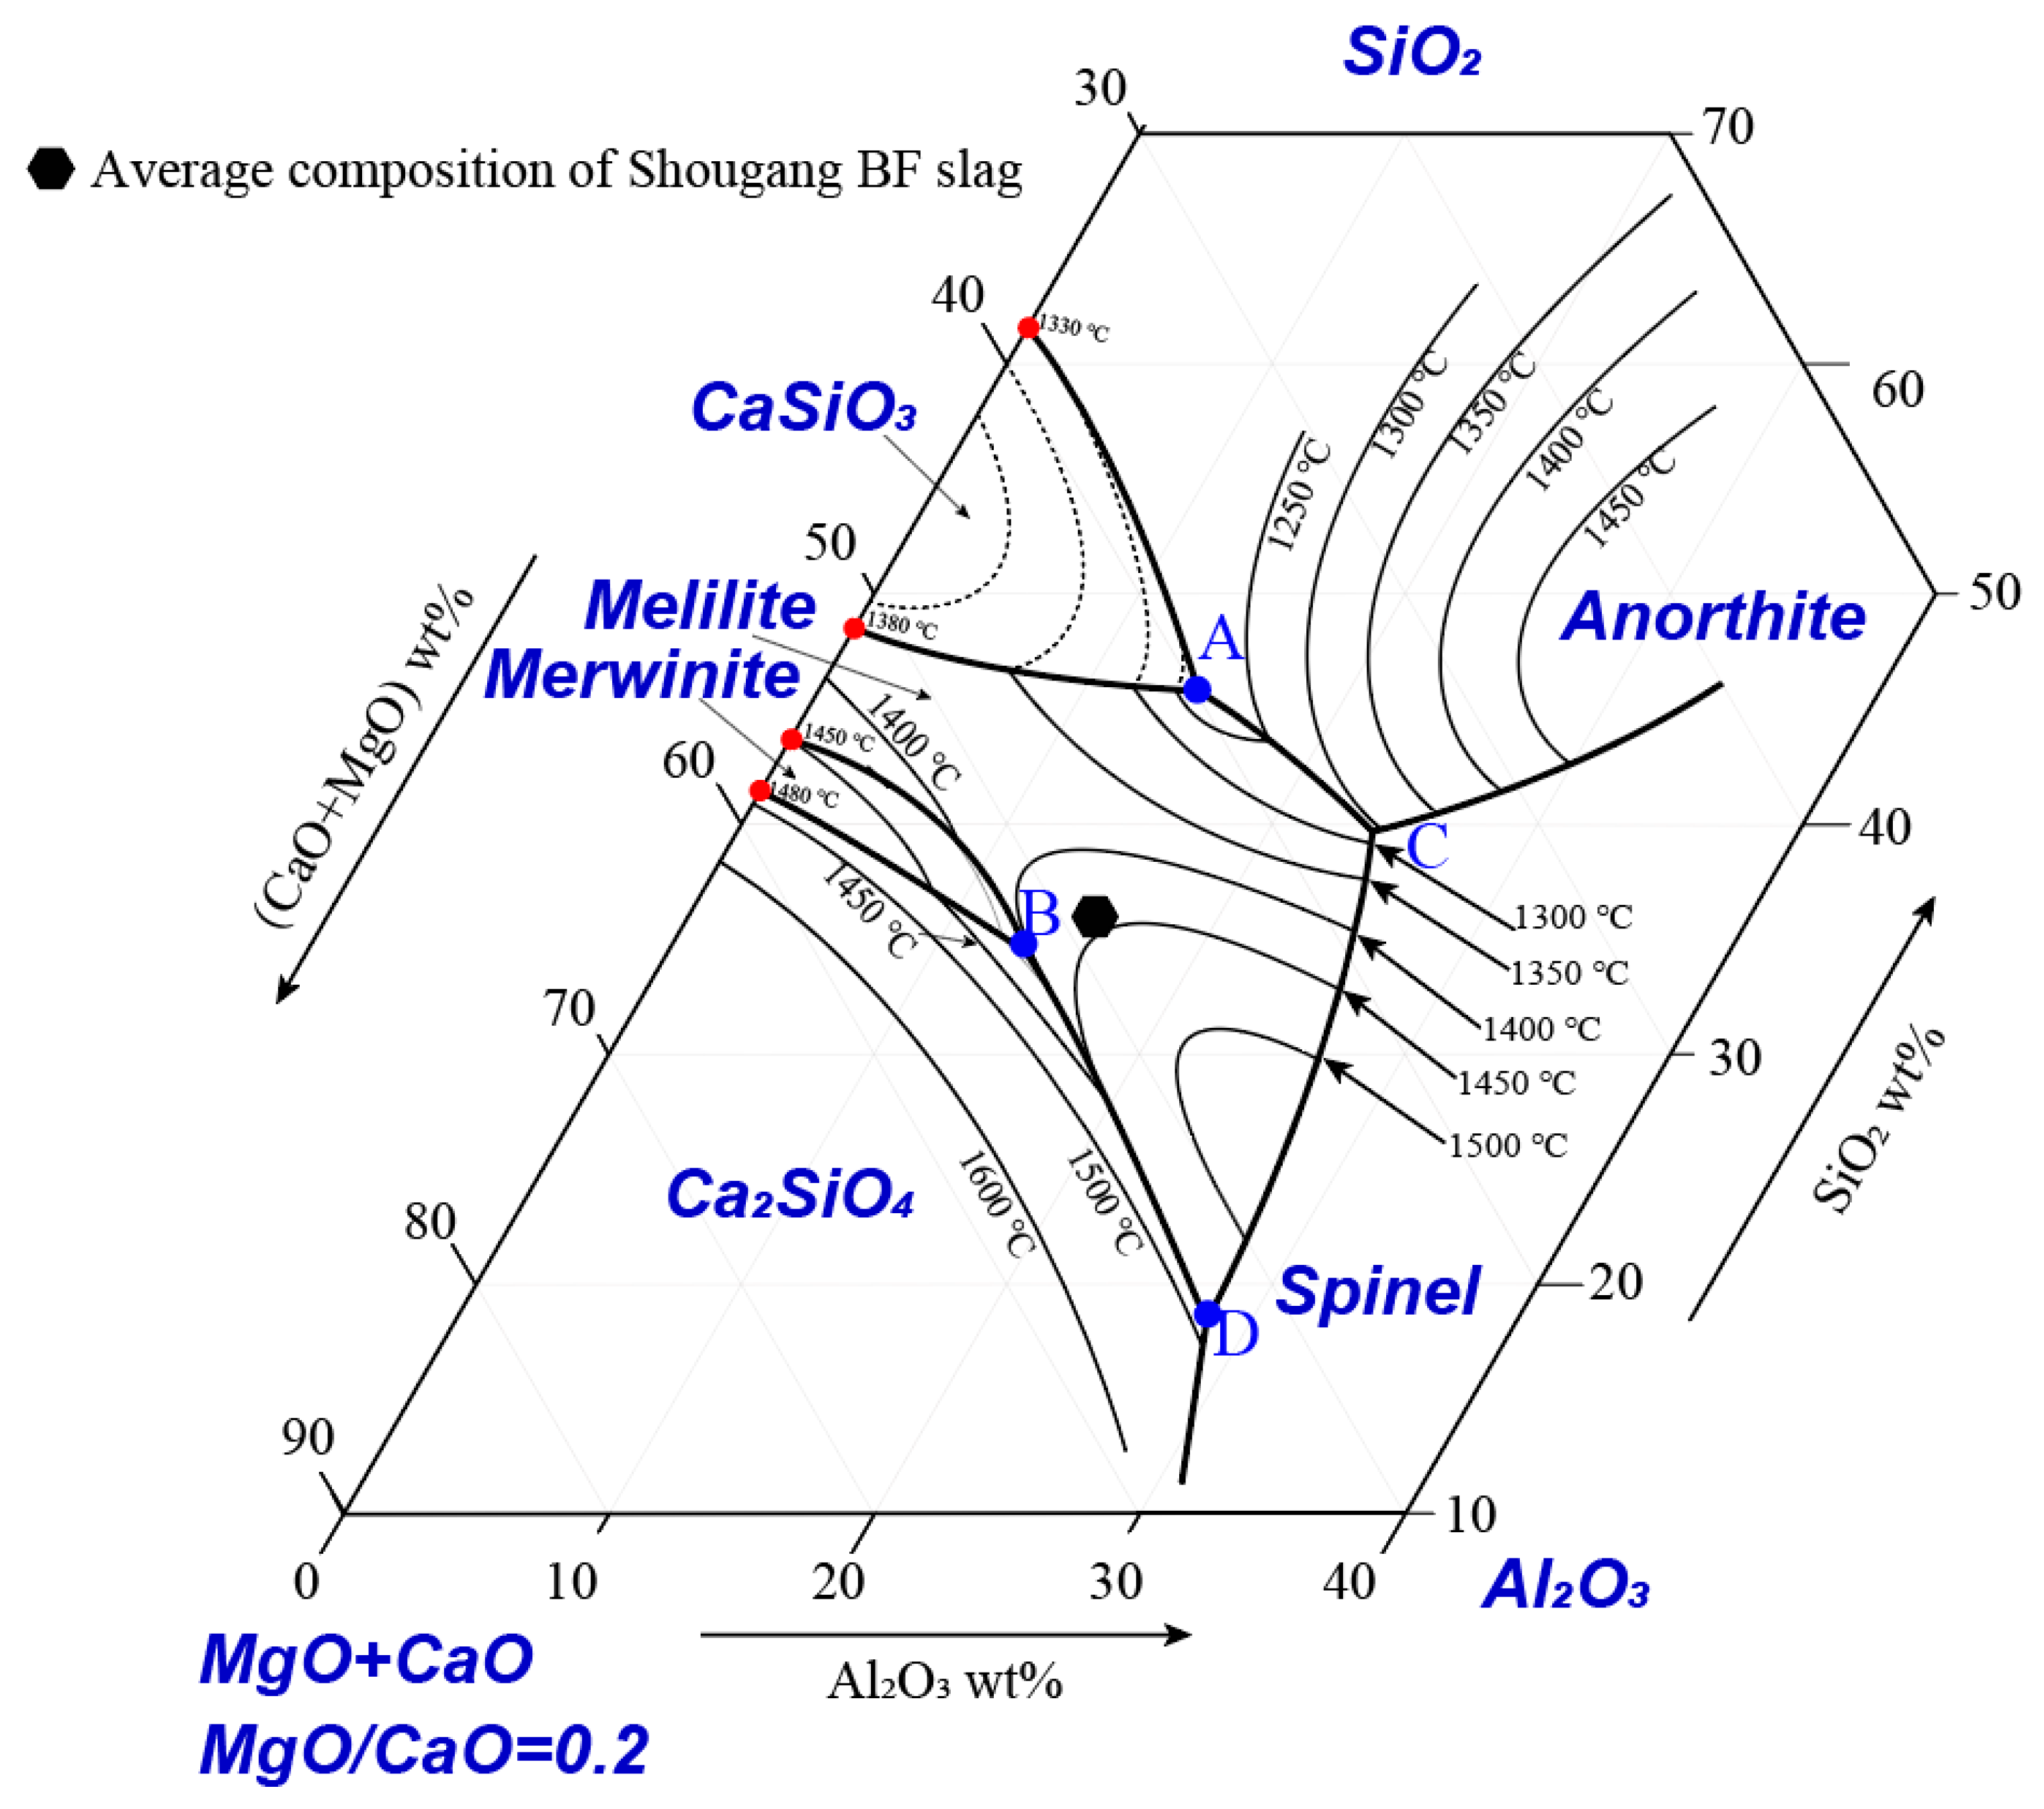
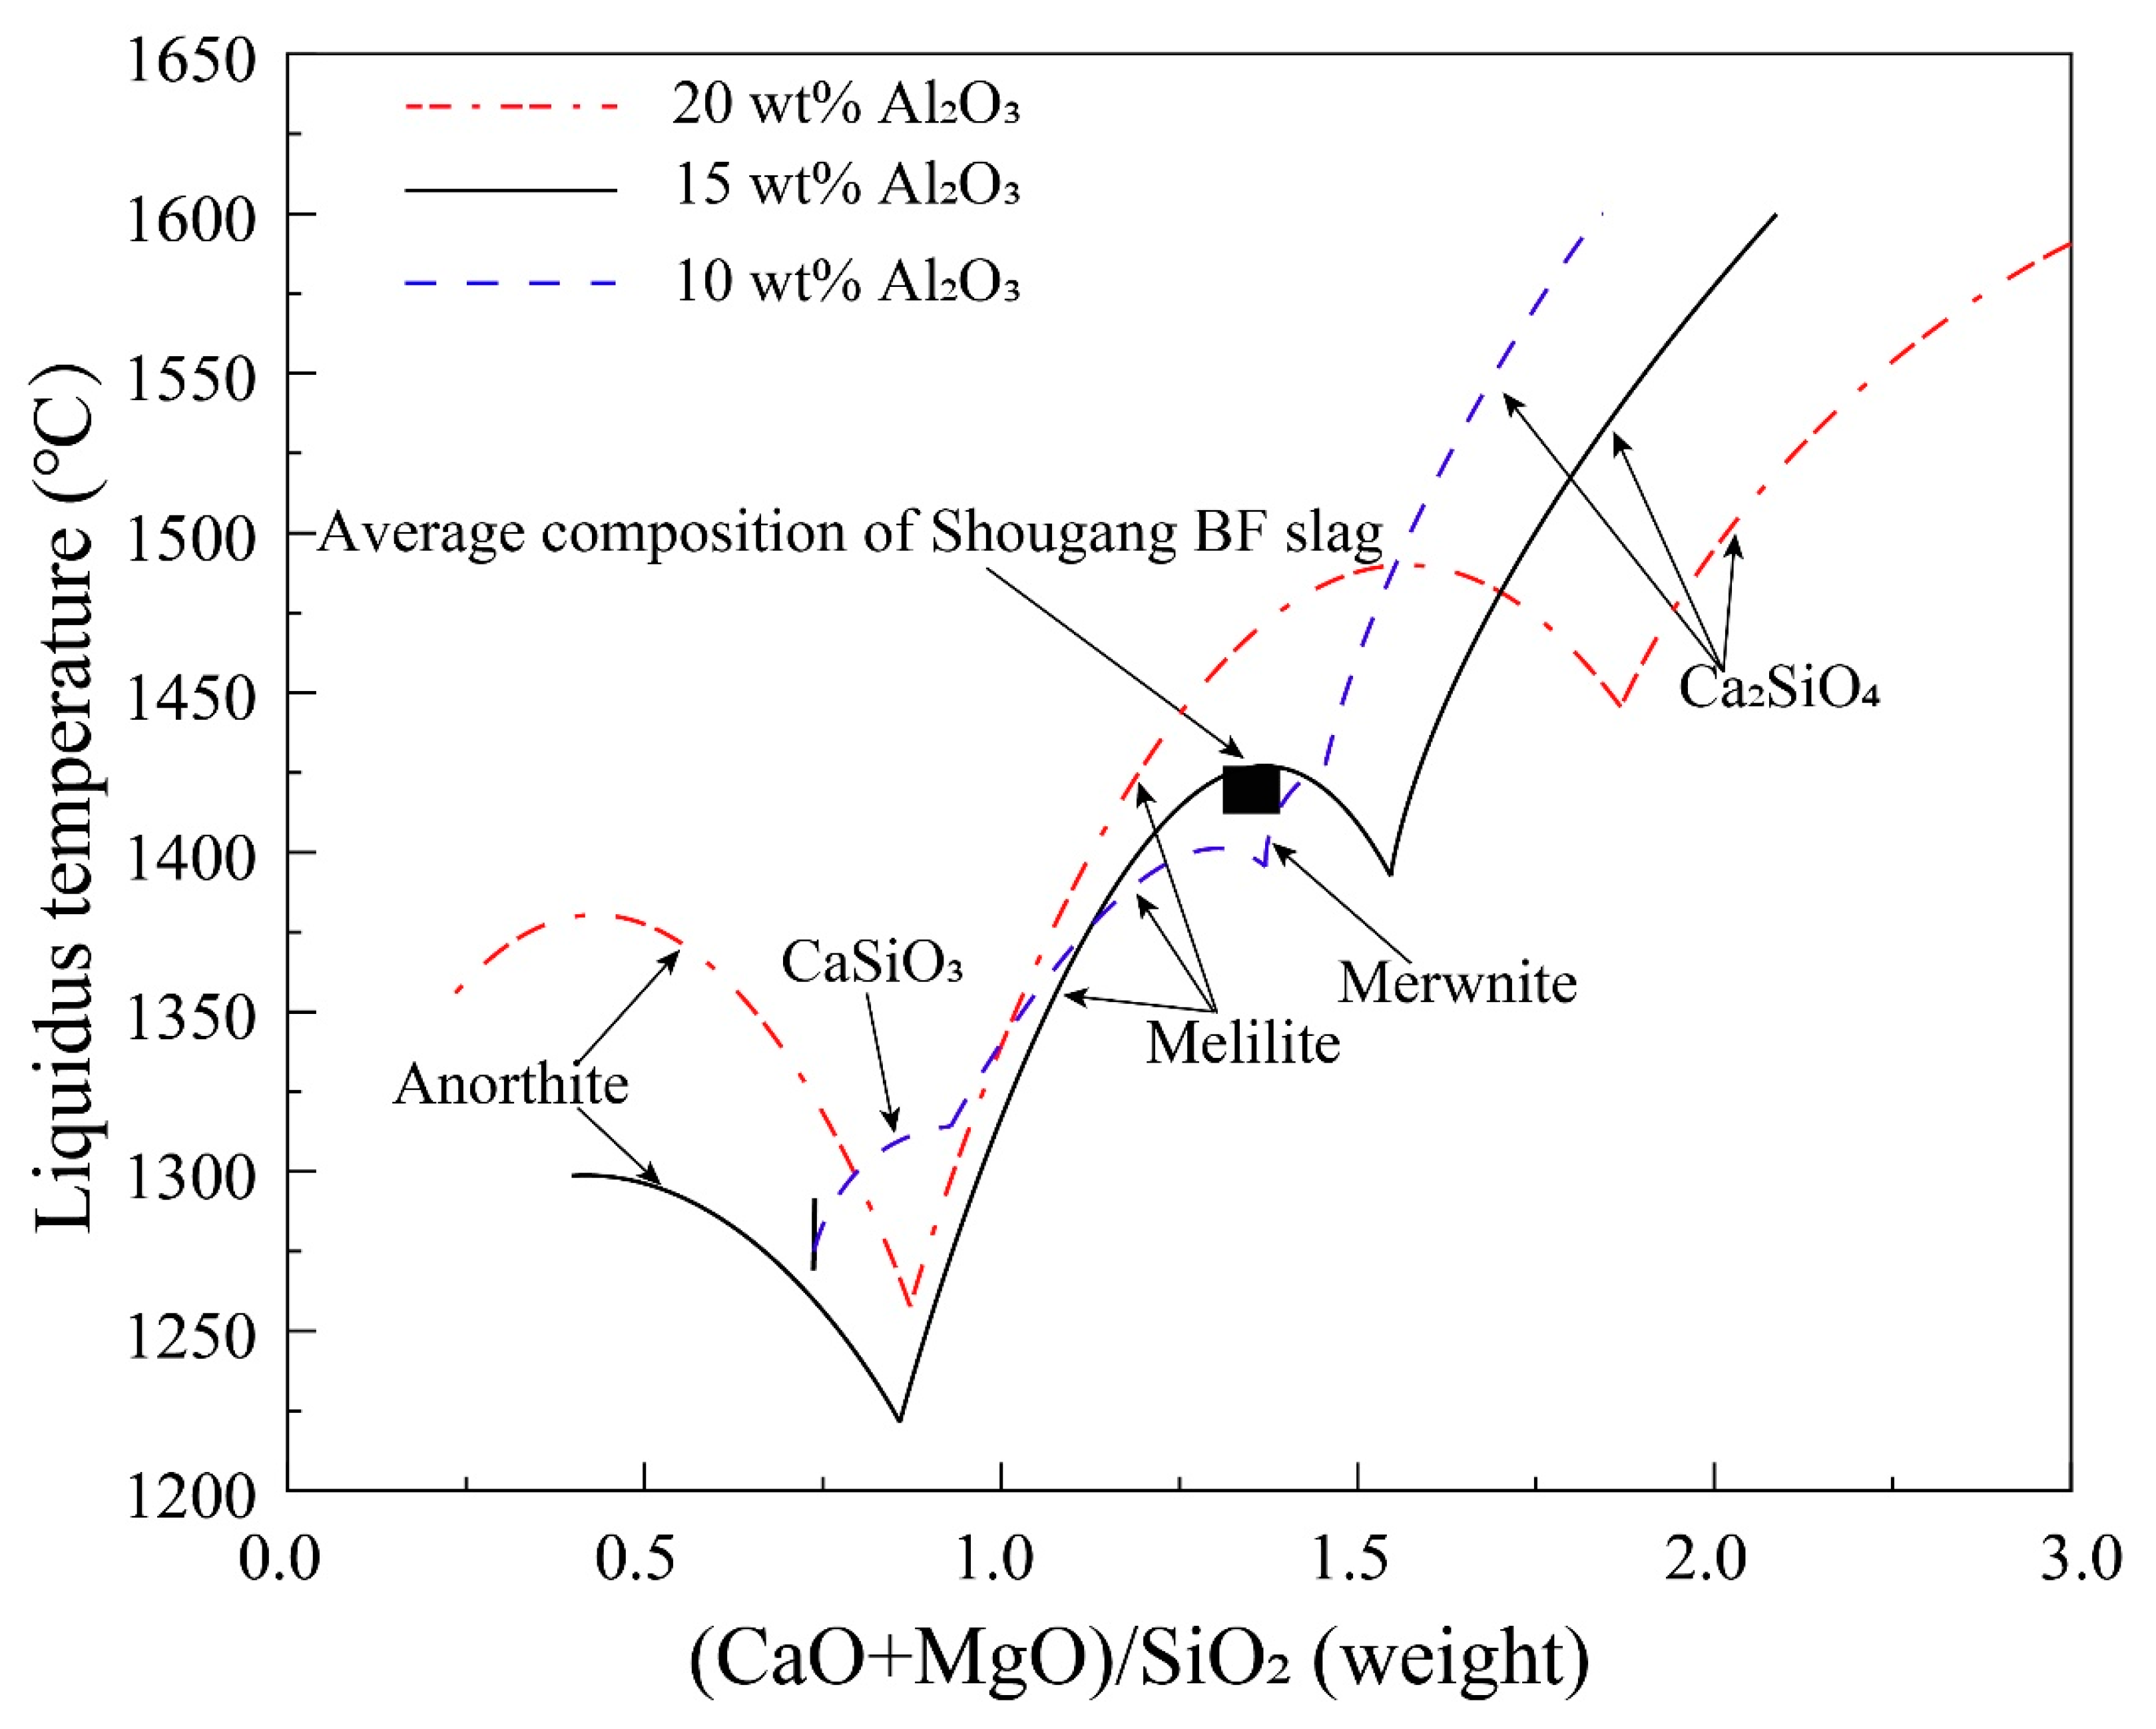
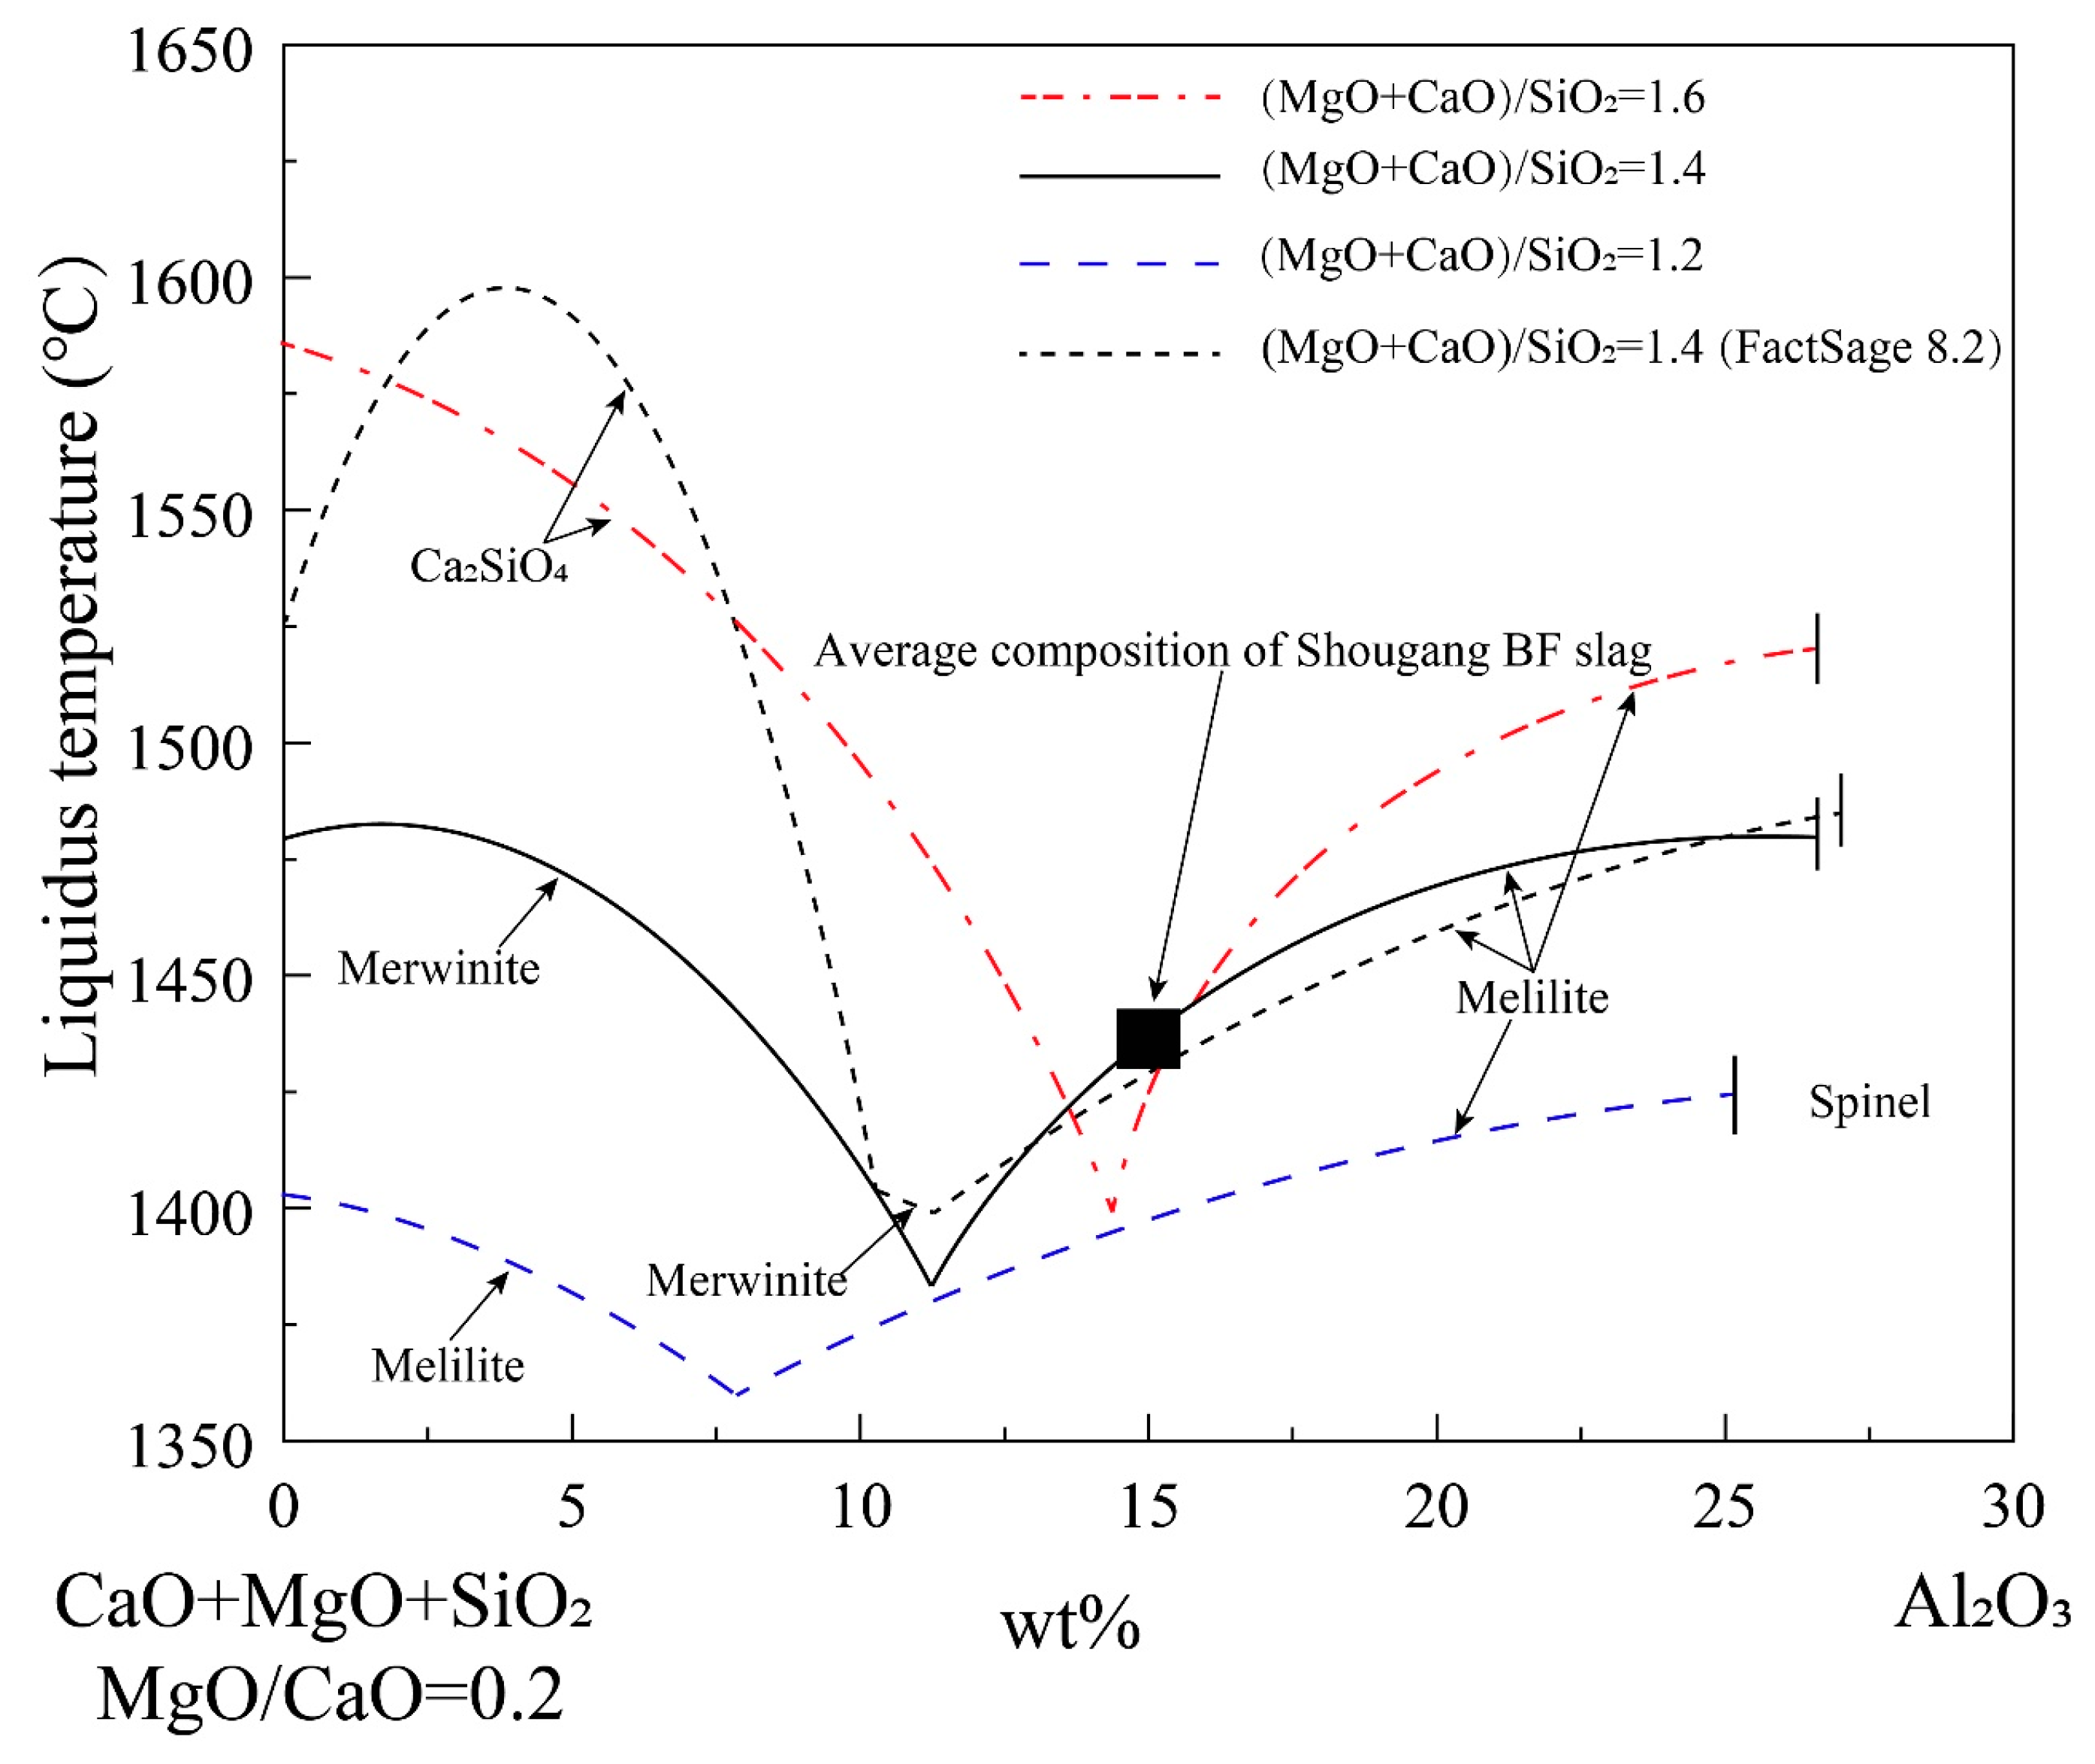
3.4. CaO-MgO-Al2O3-SiO2 System at Constant Al2O3/SiO2 or MgO/CaO

Al2O3 and SiO2 in a BF slag come from raw materials that are usually fixed as the suppliers are relatively stable. The important variable parameter to adjust the slag properties is MgO/CaO which is added as flux. A pseudo-ternary phase diagram CaO-MgO- (Al2O3 + SiO2) at a constant Al2O3/SiO2 ratio was reported by Liao et al. [22]. The quenching and EPMA technique was used to construct the pseudo-ternary plane as indicated in Figure 13. CaO, MgO and (Al2O3 + SiO2) are the end members of the plane. A constant Al2O3/SiO2 ratio of 0.4 enables the (Al2O3 + SiO2) to be considered as one component.
The experimentally determined pseudo-ternary phase diagram is shown in Figure 14. A typical BF slag composition is also shown in the figure. It can be seen that this BF slag is in the melilite primary phase field with a liquidus temperature of approximately 1420 °C. A series of the pseudo-binary phase diagrams have been constructed from the pseudo-ternary to discuss the effects of MgO/CaO ratio and quaternary basicity (CaO + MgO)/(Al2O3 + SiO2) on liquidus temperatures of the BF slags.
Figure 15 shows an example of the pseudo-binaries where the liquidus temperatures are presented as a function of the MgO/CaO ratio at constant (Al2O3 + SiO2) of 50 and 55 wt%, respectively. FactSage predictions are also shown in the figure for comparison. The figure shows that melilite is the primary phase at a low MgO/CaO ratio and spinel is the primary phase at a high MgO/CaO ratio. The liquidus temperatures decrease in the melilite primary phase field and increase in the spinel primary phase field with increasing MgO/CaO ratio. The liquidus temperatures at high (Al2O3 + SiO2) concentration (55 wt%) are always higher than those at low (Al2O3 + SiO2) concentration (50 wt%). It is possible to decrease the liquidus temperature of the BF slag by increasing the MgO/CaO until it reaches the spinel primary phase field. The sizes of the melilite and spinel primary phase fields from the experimental results are much larger than those predicted by FactSage. In some areas, a 100 °C difference in the liquidus temperature is present between the experimental results and FactSage predictions.
The raw materials for a BF are not always fixed, in particular for the small BFs. It is important to understand the effect of variation in the raw materials on liquidus temperatures of the BF slags. Figure 16 indicates a pseudo-ternary phase diagram (CaO + MgO)-SiO2-Al2O3 system at a constant MgO/CaO = 0.2. The end members are Al2O3, SiO2 and (CaO + MgO) which enable the effect of raw material composition on liquidus temperatures of the BF slags to be discussed [23].
An experimentally determined pseudo-ternary phase diagram (CaO + MgO)-Al2O3-SiO2 with a constant MgO/CaO ratio of 0.2 is shown in Figure 17. A typical BF slag composition and four special points are also shown in the figure. When the compositions of the iron ores and coke/coal vary, the Al2O3 and SiO2 contents in the BF slag will change accordingly. Based on Figure 17, the effects of Al2O3 concentration, ternary and quaternary basicity and Al2O3/SiO2 on the liquidus temperature of the BF slags were discussed from different directions.
Figure 18 shows the liquidus temperatures of the BF slag as a function of (CaO + MgO)/SiO2 at content 10, 15 and 20 wt% Al2O3. Melilite and Ca2SiO4 are the main primary phases present around the typical BF slag. When high-grade feeds are available, the Al2O3 content in the BF slag is low (10%), and the liquidus temperatures increase continuously with increasing (CaO + MgO)/SiO2 in all primary phase fields investigated. In the sections with 15 and 20% Al2O3, the liquidus temperatures first increase and then decrease with increasing (CaO + MgO)/SiO2 in the anorthite and melilite primary phase fields. In the Ca2SiO4 primary phase field, the liquidus temperatures increase sharply with increasing (CaO + MgO)/SiO2. High basicity BF slag can decrease the sulphur content in the hot metal. However, the basicity is limited by the formation of the Ca2SiO4 phase where the liquidus temperatures are sensitive to the slag composition. At ternary basicity 1.32–1.40 which is the most common one in the current BF operation, the slag composition with 10% Al2O3 is close to the Ca2SiO4 primary phase field with the liquidus temperature below 1414 °C. At the same basicity, the BF slag has a liquidus temperature of 1427 and 1475 °C, respectively, corresponding to 15 and 20% Al2O3. It can be seen from the figure that the ternary basicity can be further increased up to 1.6 at 15% Al2O3 with lower liquidus temperatures. When 20% Al2O3 is present in the slag, the ternary basicity can be further increased up to 1.8 without the formation of the Ca2SiO4 phase.

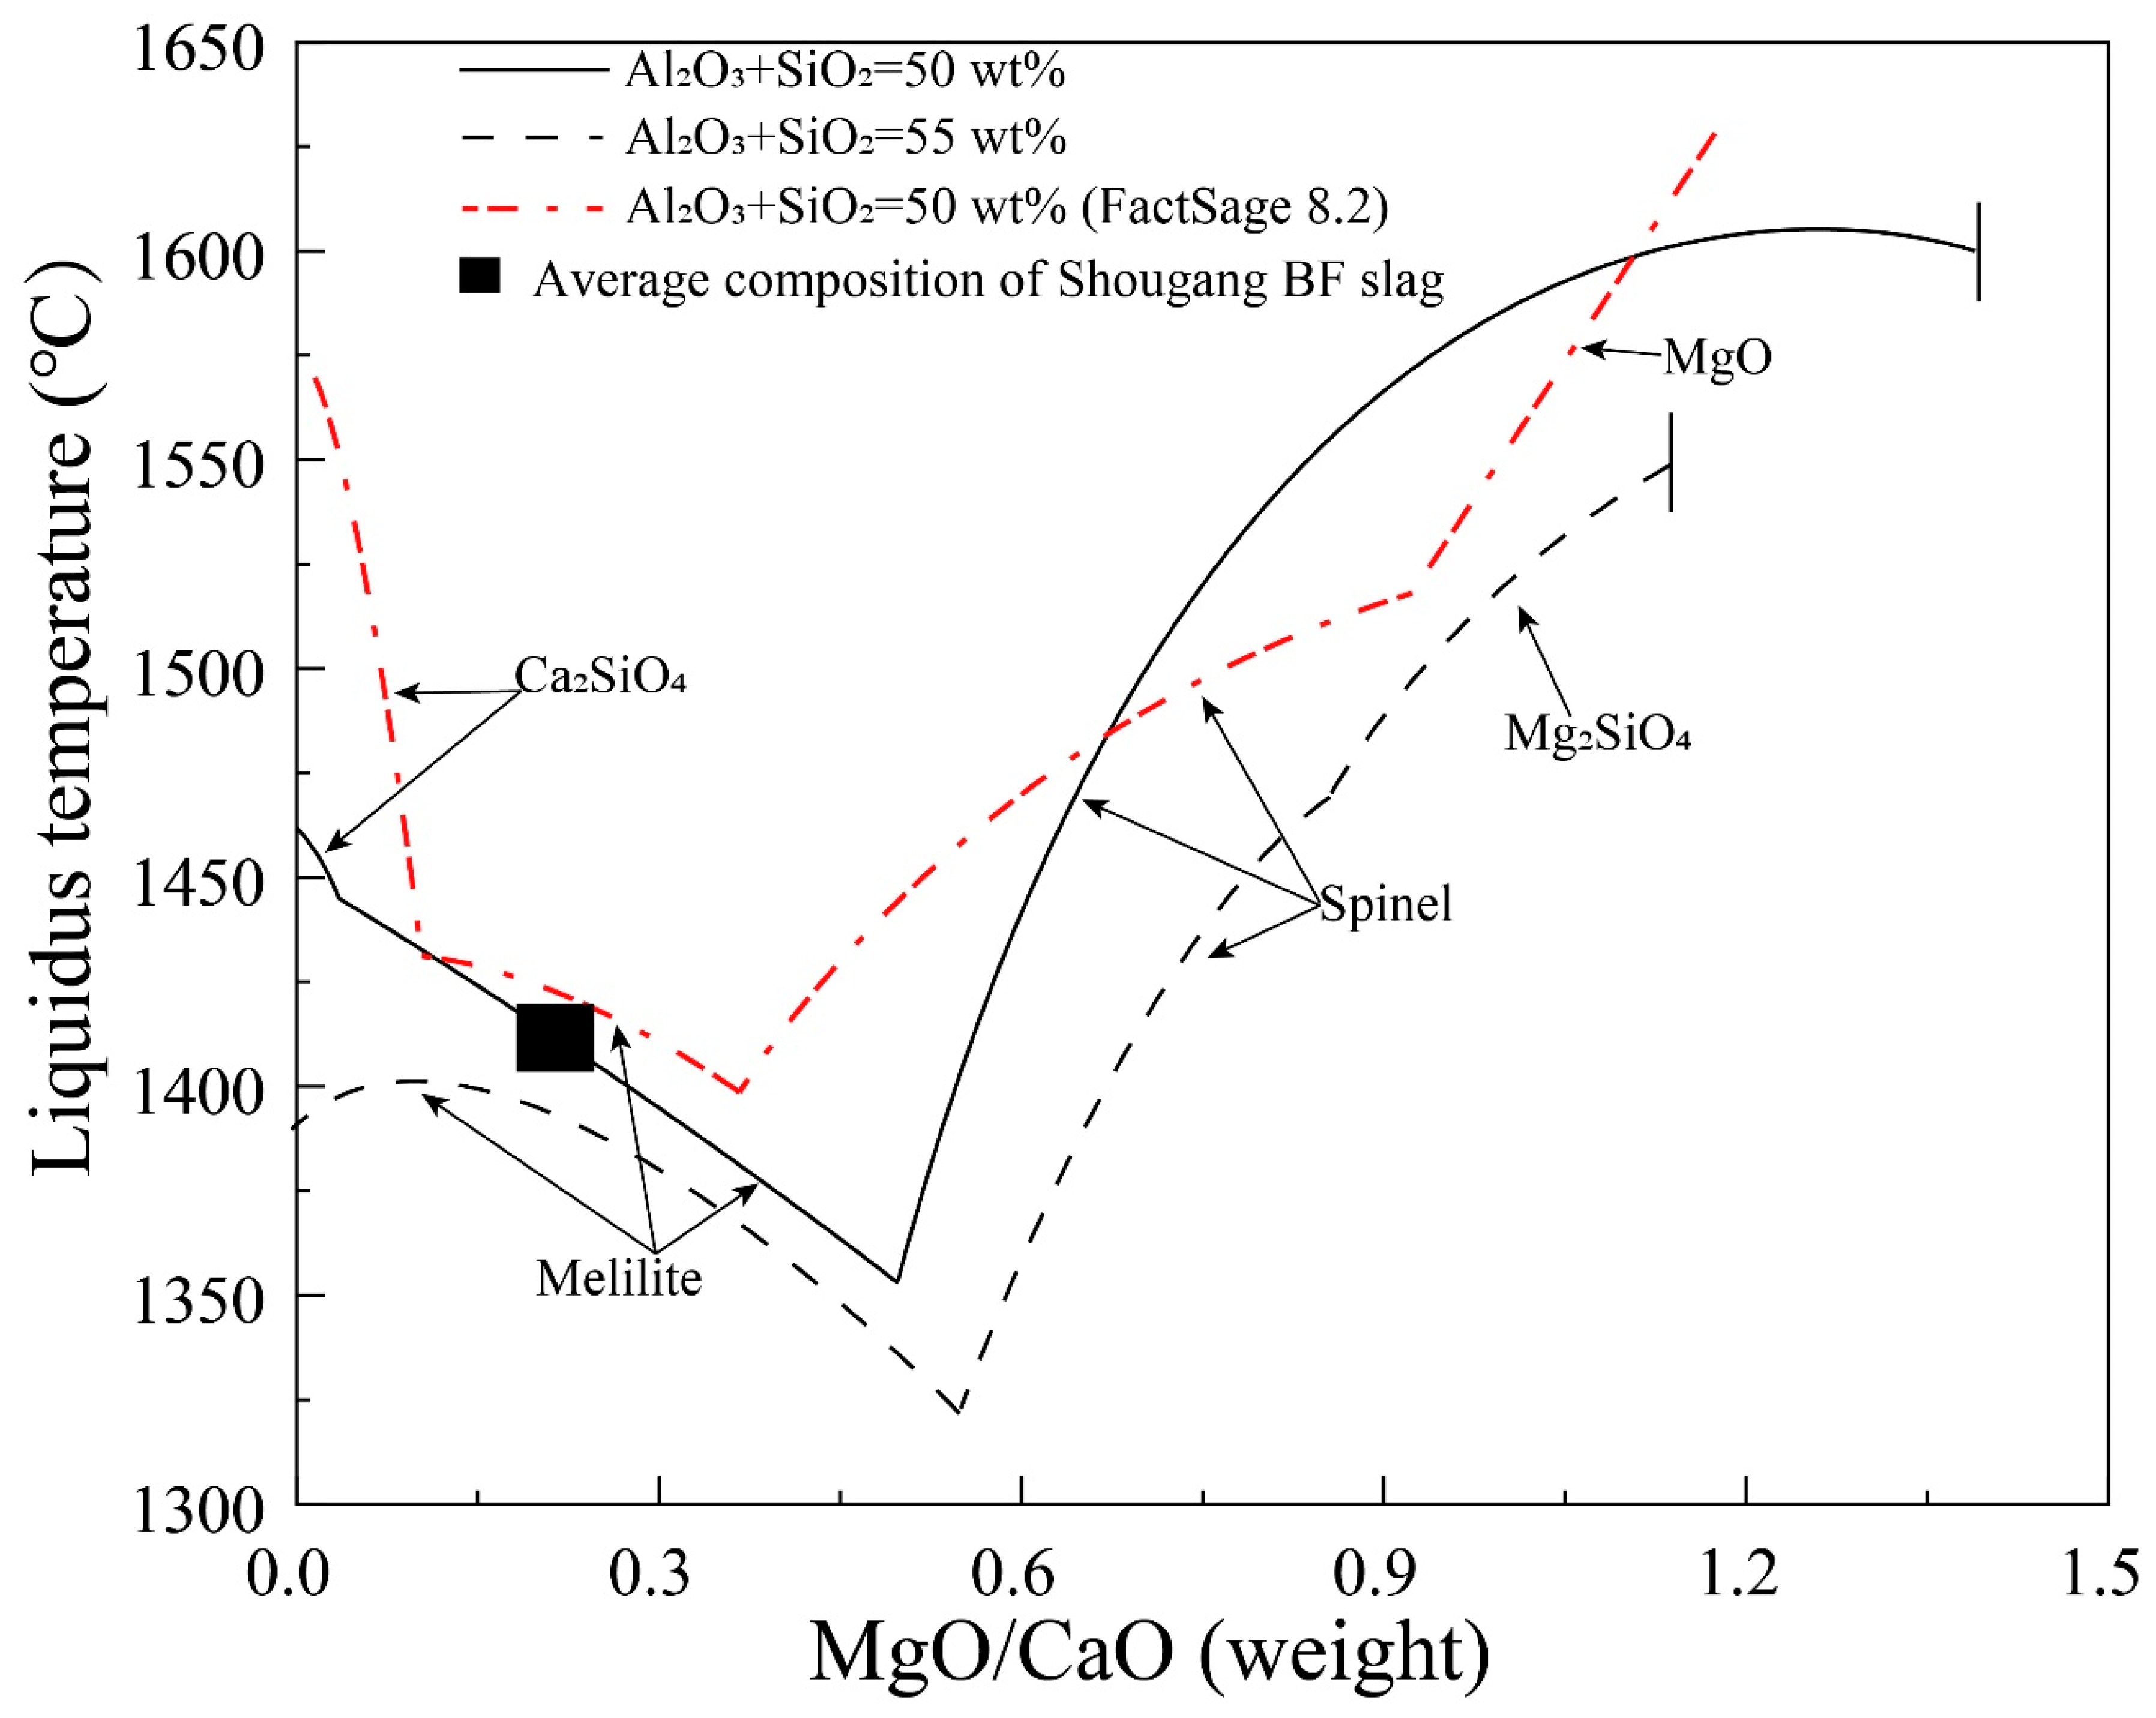
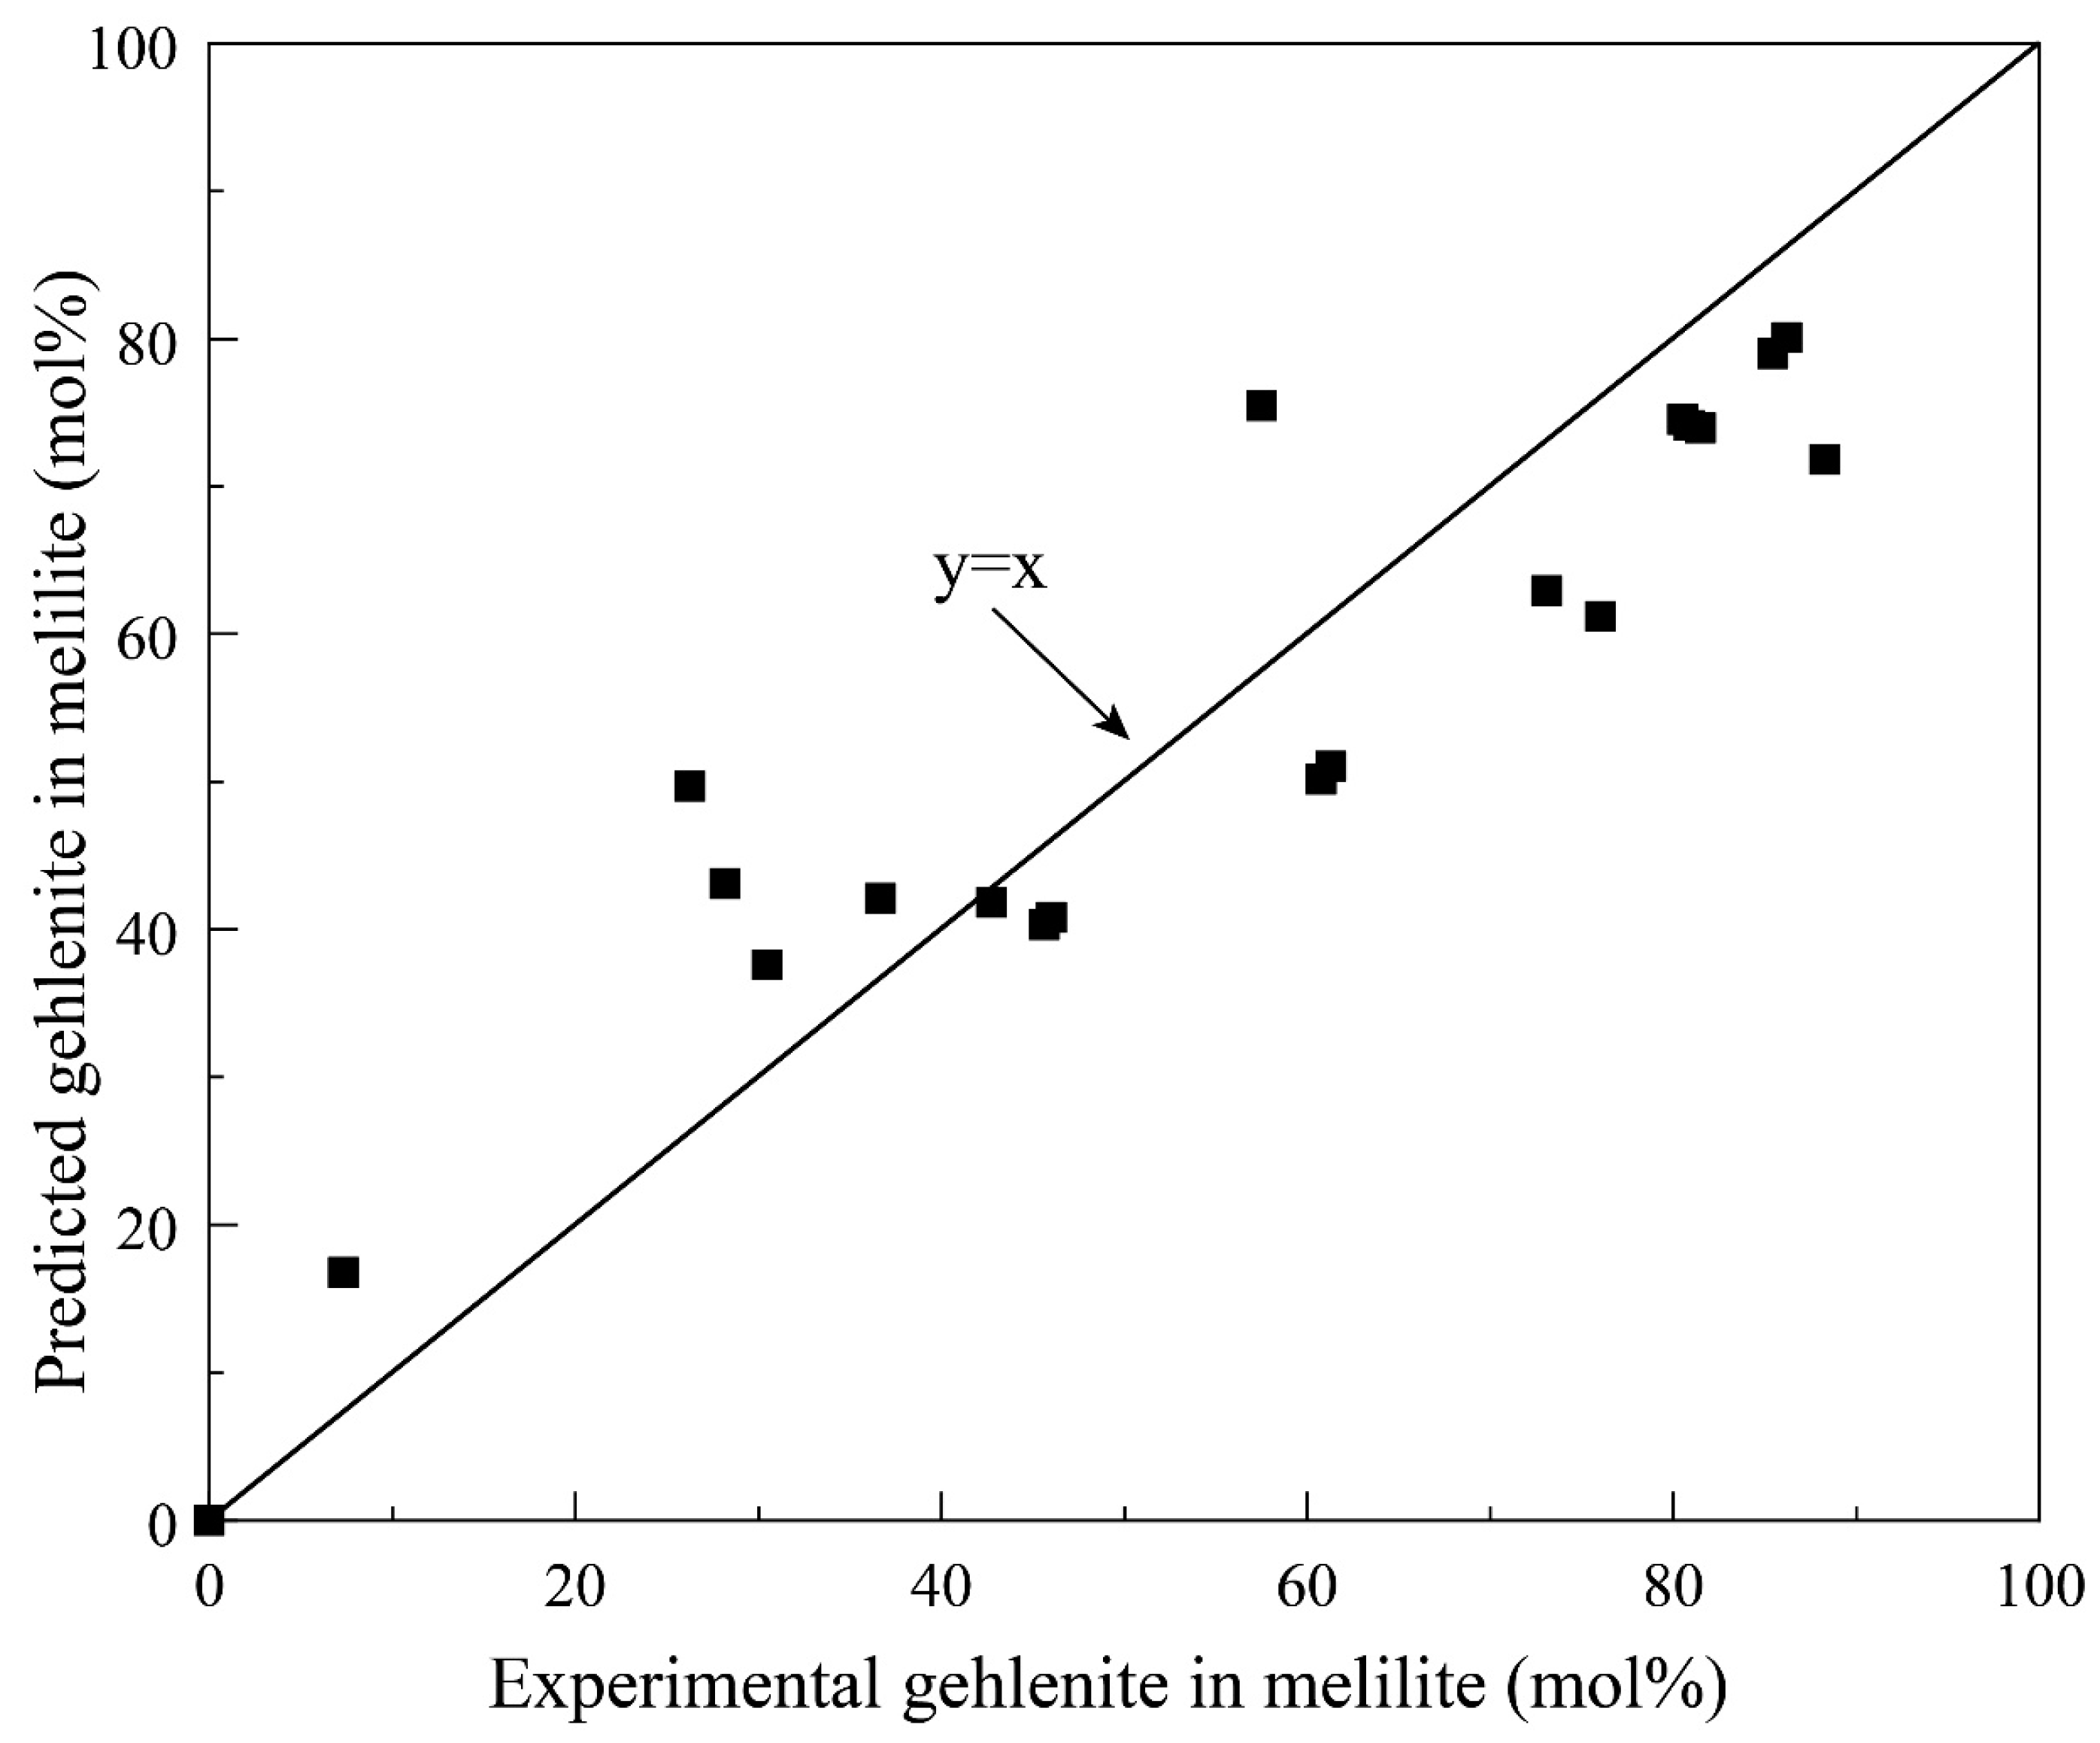
4. Comparison between Experimental Results and Thermodynamic Predictions

CALPHAD (CALculation of PHAse Diagram) approach is the future to predict liquidus temperatures for metallurgical slags. FactSage is one of the most powerful thermodynamic packages for the BF slags. The accuracy of the thermodynamic predictions relies on the reliable experimental data used for the optimization of the database. Evaluation of the thermodynamic predictions by experimental data is of great significance for optimizing thermodynamic databases and avoiding misleading industrial practices. Figure 19 shows the liquidus temperatures of the BF slag as a function of Al2O3 concentration at constant ternary basicity of 1.2, 1.4 and 1.6. FactSage predicted liquidus temperatures at a ternary basicity of 1.4 are also shown in the figure for comparison. Melilite, merwinite and dicalcium silicate are the primary phases in the composition range investigated. An optimum Al2O3 concentration exists for constant ternary basicity. The lowest liquidus temperatures of 1360, 1380 and 1398 °C can be obtained at 8, 11.5 and 14.4% Al2O3, respectively, for the ternary basicity of 1.2, 1.4 and 1.6. The predicted section of (MgO + CaO)/SiO2 = 1.4 by FactSage 8.2 is significantly different from the experimental results at the low Al2O3 area. Dicalcium silicate is predicted to be the primary phase at low Al2O3 concentrations. However, merwinite was reported to be the primary phase in the same composition range by experiments [23]. The liquidus temperatures predicted by FactSage are up to 120 °C higher than that of experimental results. The difference between the predictions and experimental data indicates that the current thermodynamic databases need to be further optimised. The possible reasons causing the inaccurate predictions were discussed by Liao et al. [23].
The compositions of the BF slag are usually located in the melilite primary phase field. Melilite is the solid solution between akermanite (2CaO·MgO·2SiO2) and gehlenite (2CaO·Al2O3·SiO2). It can be seen from Figure 20 that the mol% of gehlenite (2CaO·Al2O3·SiO2) in predicted melilite is different from that in the experimentally measured melilite. It seems that the predicted mol fractions of gehlenite in melilite have the same trend as the experimental data. However, a maximum difference of 23.4 mol% is observed between the predictions and experimental results. Unfortunately, there is no clear correlation between the difference of the gehlenite in melilite and the difference in the liquidus temperature.

5. Conclusions

Research techniques and results of the phase equilibria for blast furnace ironmaking slags have been critically reviewed and summarised. Improved research techniques can produce complex phase diagrams more efficiently and accurately. The accurate solid solution measurements enabled the thermodynamic databases to be developed and optimised. Reduced quality of the raw materials and increased blast furnace technologies require more detailed phase diagrams to support the accurate control of the operations. Experimentally determined pseudo-ternary and pseudo-binary phase diagrams in the system CaO-MgO-Al2O3-SiO2 have provided useful information to support industrial operations. With the development of ironmaking technologies and variations of the feed structures, more phase diagrams in different presentations could be required. More and more accurate experimental data will also support the thermodynamic databases to be optimised to a high level.

Author Contributions

Methodology, B.Z.; Validation, B.Z.; Formal analysis, J.L.; Resources, G.Q.; Data curation, J.L.; Writing—original draft, J.L. and G.Q.; Writing—review and editing, B.Z.; Supervision, B.Z.; Project administration, B.Z. All authors have read and agreed to the published version of the manuscript.

Funding

This research received no external funding.

Data Availability Statement

Not applicable.

Acknowledgments

The authors would like to acknowledge Shougang Research Institute of Technology for providing financial support.

Conflicts of Interest

The authors declare no conflict of interest.

References

  1. Wang, Y.; Zuo, H.; Zhao, J. Recent progress and development of ironmaking in China as of 2019: An overview. Ironmak. Steelmak. 2020, 47, 640–649. [Google Scholar] [CrossRef]
  2. Geerdes, M.; Chaigneau, R.; Lingiardi, O. Modern Blast Furnace Ironmaking: An Introduction, Chapter XI- Operation Challenges, 4th ed.; IOS Press: Amsterdam, The Netherlands, 2020. [Google Scholar]
  3. Zhang, X.; Jiao, K.; Zhang, J.; Guo, Z. A review on low carbon emissions projects of steel industry in the world. J. Clean. Prod. 2021, 306, 127259. [Google Scholar] [CrossRef]
  4. Mousa, E. Modern blast furnace ironmaking technology: Potentials to meet the demand of high hot metal production and lower energy consumption. Metall. Mater. Eng. 2019, 25, 69–104. [Google Scholar] [CrossRef] [PubMed]
  5. Osborn, E.F.; Schairer, J.F. The ternary system pseudo wollastonite-akermanite-gehlenite. Am. J. Sci. 1941, 239, 715–763. [Google Scholar] [CrossRef]
  6. Prince, A. Phase equilibrium relationships in a portion of the system MgO–Al2O3–2CaO·SiO2. J. Am. Ceram. Soc. 1951, 34, 44–51. [Google Scholar] [CrossRef]
  7. Osborn, E.F.; DeVries, R.C.; Gee, K.H.; Kraner, H.M. Optimum composition of blast furnace slag as deduced for the quaternary system CaO-MgO-Al2O3-SiO2. Trans. AIME 1954, 6, 33–45. [Google Scholar] [CrossRef]
  8. Prince, A. Liquidus relationships on 10% MgO plane of the system lime-magnesia-alumina-silica. J. Am. Ceram. Soc. 1954, 37, 402–408. [Google Scholar] [CrossRef]
  9. DeVries, R.C.; Osborn, E.F. Phase equilibria in High-alumina part of the system CaO-MgO-Al2O3-SiO2. J. Am. Ceram. Soc. 1957, 40, 6–15. [Google Scholar] [CrossRef]
  10. Cavalier, G.; Sandrea-Deudon, M. Quaternary slags CaO-MgO-Al2O3-SiO2: Liquidus surfaces and crystallization paths for constant magnesia concentrations. Rev. Metall. 1960, 5, 1143–1157. [Google Scholar] [CrossRef]
  11. Gutt, W.; Russel, A.D. Studies of the system CaO-SiO2-Al2O3-MgO in relation to the stability of blast furnace slag. J. Mater. Sci. 1977, 12, 1869–1878. [Google Scholar] [CrossRef]
  12. Dahl, F.; Brandberg, J.; Du, S. Characterization of melting of some slags in the Al2O3-CaO-MgO-SiO2 quaternary system. ISIJ Int. 2006, 46, 614–616. [Google Scholar] [CrossRef]
  13. Wang, D.; Chen, M.; Jiang, Y.; Wang, S.; Zhao, Z.; Evans, T.; Zhao, B. Phase equilibria studies in the CaO–SiO2–Al2O3–MgO system with CaO/SiO2 ratio of 0.9. J. Am. Ceram. Soc. 2020, 103, 7299–7309. [Google Scholar] [CrossRef]
  14. Ma, X.; Zhang, D.; Zhao, Z.; Evans, T.; Zhao, B. Phase equilibria studies in the CaO–SiO2–Al2O3–MgO system with CaO/SiO2 ratio of 1.10. ISIJ Int. 2016, 56, 513–519. [Google Scholar] [CrossRef]
  15. Ma, X.; Wang, G.; Wu, S.; Zhu, J.; Zhao, B. Phase equilibria in the CaO–SiO2–Al2O3–MgO System with CaO/SiO2 ratio of 1.3 relevant to iron blast furnace slags. ISIJ Int. 2015, 55, 2310–2317. [Google Scholar] [CrossRef]
  16. Kou, M.; Wu, S.; Ma, X.; Wang, L.; Chen, M.; Cai, Q.; Zhao, B. Phase equilibrium studies of CaO–SiO2–Al2O3–MgO system with binary basicity of 1.5 related to blast furnace slag. Metall. Mater. Trans. B 2016, 47, 1093–1102. [Google Scholar] [CrossRef]
  17. Gran, J.; Wang, Y.; Du, S. Experimental determination of the liquidus in the high basicity region in the Al2O3 (30 mass%)-CaO-MgO-SiO2 system. Calphad 2011, 35, 249–254. [Google Scholar] [CrossRef]
  18. Gran, J.; Yan, B.; Du, S. Experimental determination of the liquidus in the high-basicity region in the Al2O3 (25 mass pct)-CaO-MgO-SiO2 and Al2O3 (35 mass pct)-CaO-MgO-SiO2 systems. Metall. Mater. Trans. B 2011, 42, 1008–1016. [Google Scholar] [CrossRef]
  19. Lyu, S.; Ma, X.; Chen, M.; Huang, Z.; Wang, G. Application of phase equilibrium studies of CaO–SiO2–Al2O3–MgO system for oxide inclusions in Si-deoxidized steels. Calphad 2020, 68, 101721. [Google Scholar] [CrossRef]
  20. Lyu, S.; Ma, X.; Huang, Z.; Yao, Z.; Lee, H.; Jiang, Z.; Wang, G.; Zou, J.; Zhao, B. Inclusion characterization and formation mechanisms in spring steel deoxidized by silicon. Metall. Mater. Trans. B 2019, 5, 732–747. [Google Scholar] [CrossRef]
  21. Yao, Z.; Ma, X.; Lyu, S. Phase equilibria of the Al2O3–CaO–SiO2-(0%, 5%, 10%) MgO slag system for non-metallic inclusions control. Calphad 2021, 72, 102227. [Google Scholar] [CrossRef]
  22. Liao, J.; Qing, G.; Zhao, B. Phase equilibria studies in the CaO-MgO-Al2O3-SiO2 system with Al2O3/SiO2 weight ratio of 0.4. Metals 2023, 13, 224. [Google Scholar] [CrossRef]
  23. Liao, J.; Qing, G.; Zhao, B. Phase equilibrium studies in the CaO–SiO2–Al2O3–MgO system with MgO/CaO ratio of 0.2. Metall. Mater. Trans. B 2023, 54, 793–806. [Google Scholar]
  24. Muan, A.; Osborn, E.F. Phase Equilibria Among Oxides in Steelmaking; Addison-Wesley Publishing Company: Boston, MA, USA, 1965; pp. 148–157. [Google Scholar]
  25. Verein Duetscher Eisenhuttenleute: Slag Atlas; Verlag Sthaleisen GmbH: Düsseldorf, Germany, 1995; Volume 156.
  26. Bale, C.W.; Bélisle, E.; Chartrand, P.; Decterov, S.; Eriksson, G.; Gheribi, A.; Hack, K.; Jung, I.H.; Kang, Y.B.; Melançon, J.; et al. Reprint of: FactSage thermochemical software and databases, 2010–2016. Calphad 2016, 55, 1–19. [Google Scholar] [CrossRef]
  27. Davies, R.; Dinsdale, A.; Gisby, J.; Robinson, J.; Martin, S. MTDATA-thermodynamic and phase equilibrium software from the national physical laboratory. Calphad 2002, 26, 229–271. [Google Scholar] [CrossRef]
  28. Andersson, J.; Helander, T.; Höglund, L.; Shi, P.; Sundman, B. Thermo-Calc & DICTRA, computational tools for materials science. Calphad 2002, 26, 273–312. [Google Scholar]
  29. Jak, E.; Hayes, P.; Lee, H. Improved methodologies for the determination of high temperature phase equilibria. Met. Mater. 1995, 1, 1–8. [Google Scholar] [CrossRef]
  30. Bowen, N.L.; Schairer, J.F.; Posnjak, E.B. The System Ca2SiO4-Fe2SiO4. Am. J. Sci. 1933, 25, 273–297. [Google Scholar] [CrossRef]
  31. Bowen, S. The system FeO-SiO2. Am. J. Sci. 1932, 24, 177–213. [Google Scholar] [CrossRef]
  32. Jung, I.V.; Ende, M. Computational thermodynamic calculations: FactSage from CALPHAD thermodynamic database to virtual process simulation. Metall. Mater. Trans. B 2020, 51, 1851–1874. [Google Scholar] [CrossRef]
  33. Centre for Research in Computational Thermochemistry. FactSage 8.2 News. 2022. Available online: https://www.factsage.com/FS82_news.HTM (accessed on 5 December 2022).
Figure 1. Schematic of tube furnace with specimen for quenching experiments [13].
Metals 13 00801 g001
Figure 2. Typical microstructures of the quenched samples showing the equilibrium of liquid with solid phases [22]. (a) melilite, (b) melilite and anorthite, (c) anorthite, (d) Ca2SiO4, (e) cordierite and (f) spinel.
Metals 13 00801 g002
Figure 3. Representation of the pseudo-ternary phase diagrams CaO-MgO-SiO2 with constant Al2O3 concentrations of 10, 15 and 20% [7].
Metals 13 00801 g003
Figure 4. Pseudo-ternary phase diagram CaO-MgO-Al2O3-SiO2 for the 10% Al2O3 plane [7].
Metals 13 00801 g004
Figure 5. Pseudo-ternary phase diagram CaO-MgO-Al2O3-SiO2 for the 15% Al2O3 plane [7].
Metals 13 00801 g005
Figure 6. Pseudo-ternary phase diagram CaO-MgO-Al2O3-SiO2 for the 20% Al2O3 plane [7].
Metals 13 00801 g006
Figure 7. The 10% MgO plane of the system CaO-MgO-Al2O3-SiO2 [8].
Metals 13 00801 g007
Figure 8. Comparison of the phase boundaries between Cavalier and Sandrea-Deudon [10] and Gutt and Russell [11].
Metals 13 00801 g008
Figure 9. Representation of the pseudo-ternary phase diagrams (CaO + SiO2)-Al2O3-MgO at constant CaO/SiO2 ratios.
Metals 13 00801 g009
Figure 10. Experimentally determined pseudo-ternary phase diagram (CaO + SiO2)-Al2O3-MgO at a constant CaO/SiO2 ratio of 0.9 [13]. (a) Compare with the data reported by Osborn et al. [7], Gutt and Russell [11], and Slag Atlas [25], (b) compare with the FactSage prediction.
Metals 13 00801 g010
Figure 11. Experimentally determined pseudo-ternary phase diagram (CaO + SiO2)-Al2O3-MgO at a constant CaO/SiO2 ratio of 1.1 [14] compare with the data reported by Osborn et al. [7], Cavalier et al. [10], Muan et al. [24] and FactSage prediction.
Metals 13 00801 g011
Figure 12. Experimentally determined pseudo-ternary phase diagram (CaO + SiO2)-Al2O3-MgO at a constant CaO/SiO2 ratio of 1.3 [15] compare with the data reported by Osborn et al. [7], Cavalier et al. [10] and FactSage prediction.
Metals 13 00801 g012
Figure 13. Representation of the pseudo-ternary phase diagram CaO-MgO-(Al2O3 + SiO2) at constant Al2O3/SiO2 ratios [22].
Metals 13 00801 g013
Figure 14. Experimentally determined pseudo-ternary phase diagram CaO-MgO-(Al2O3 + SiO2) at a constant Al2O3/SiO2 ratio of 0.4 [22].
Metals 13 00801 g014
Figure 15. Liquidus temperature as a function of MgO/CaO in liquids at fixed (Al2O3 + SiO2) of 50 and 55 wt% in the CaO-MgO-SiO2-Al2O3 system with Al2O3/SiO2 weight ratio of 0.4 [22].
Metals 13 00801 g015
Figure 16. Representation of the pseudo-ternary phase diagrams (CaO + MgO)-Al2O3 + SiO2 at a constant MgO/CaO ratio of 0.2 [23].
Metals 13 00801 g016
Figure 17. Experimentally determined pseudo-ternary phase diagram (CaO + MgO)-Al2O3-SiO2 at a constant MgO/CaO ratio of 0.2 [23].
Metals 13 00801 g017
Figure 18. Liquidus temperature as a function of quaternary basicity at fixed MgO/CaO and Al2O3/SiO2 ratios [23].
Metals 13 00801 g018
Figure 19. Liquidus temperature as a function of Al2O3 concentration at fixed ternary basicity (MgO + CaO)/SiO2 = 1.2, 1.4 and 1.6 [23].
Metals 13 00801 g019
Figure 20. Comparison of the melilite composition between experimental data and FactSage predictions [23].
Metals 13 00801 g020
Disclaimer/Publisher’s Note: The statements, opinions and data contained in all publications are solely those of the individual author(s) and contributor(s) and not of MDPI and/or the editor(s). MDPI and/or the editor(s) disclaim responsibility for any injury to people or property resulting from any ideas, methods, instructions or products referred to in the content.

