
Research and Application of the Original Position Statistical Distribution Analysis Method for Non-Metallic Inclusions in P91 Steel

 ,
,
Abstract
:1. Introduction
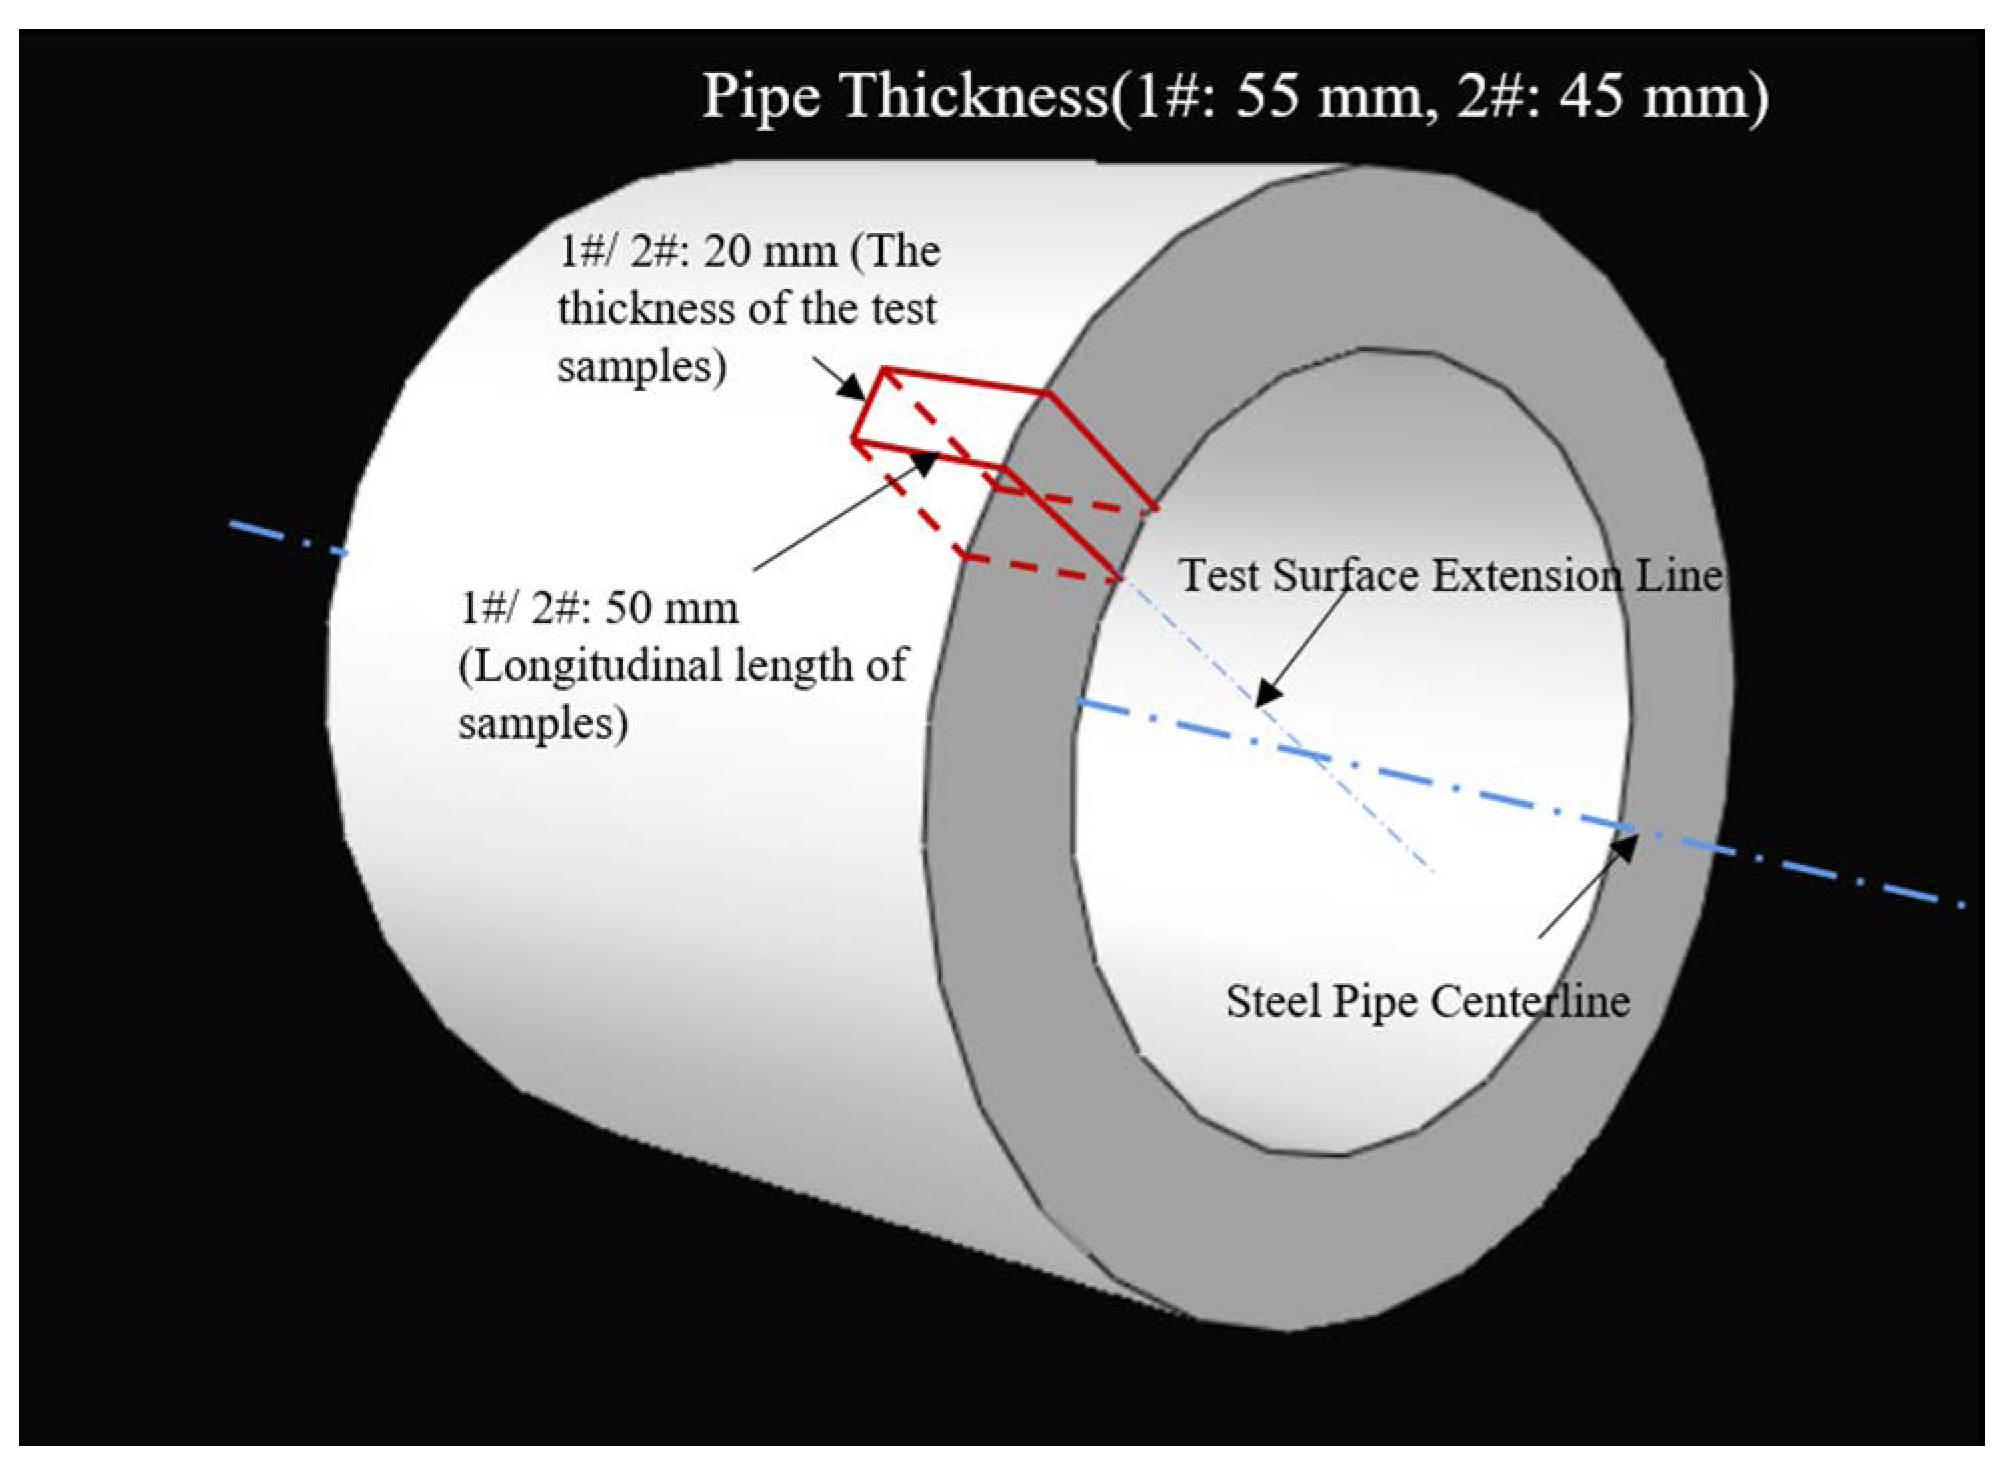
2. Materials and Methods
3. Results and Discussion
3.1. Classification of Non-Metallic Inclusions
3.2. Statistical Analysis
3.3. Size Distribution of Inclusions
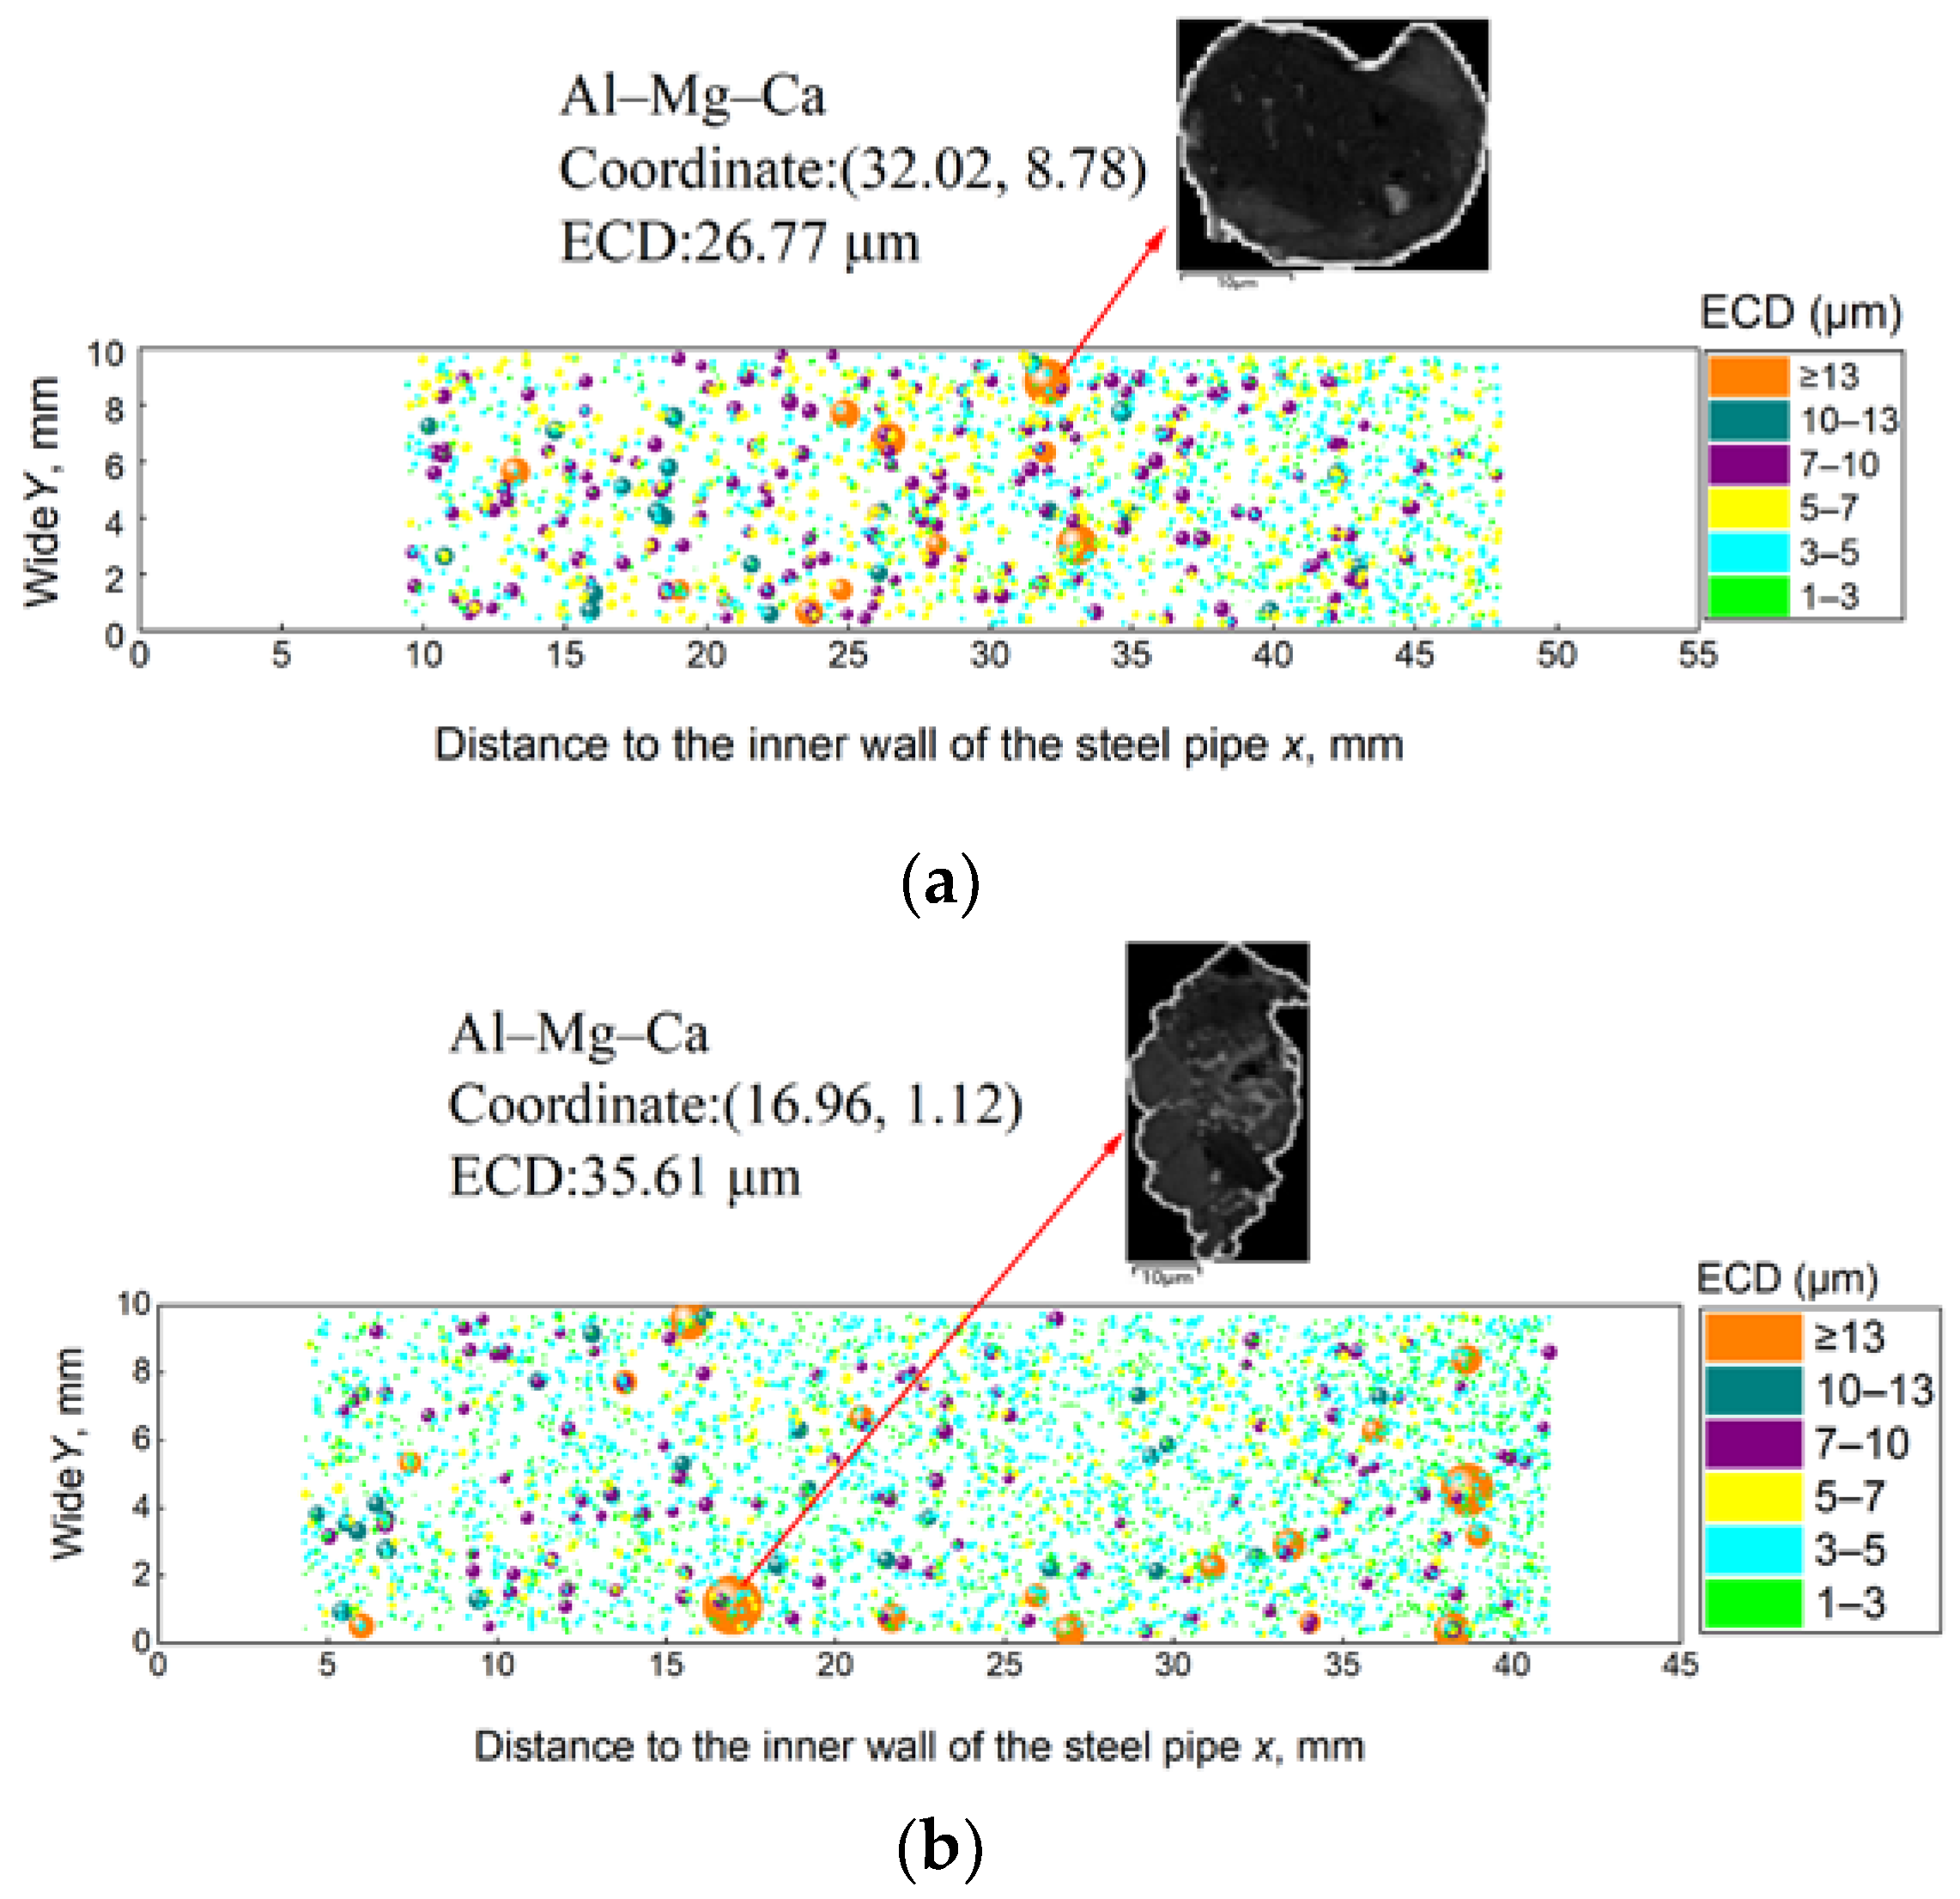
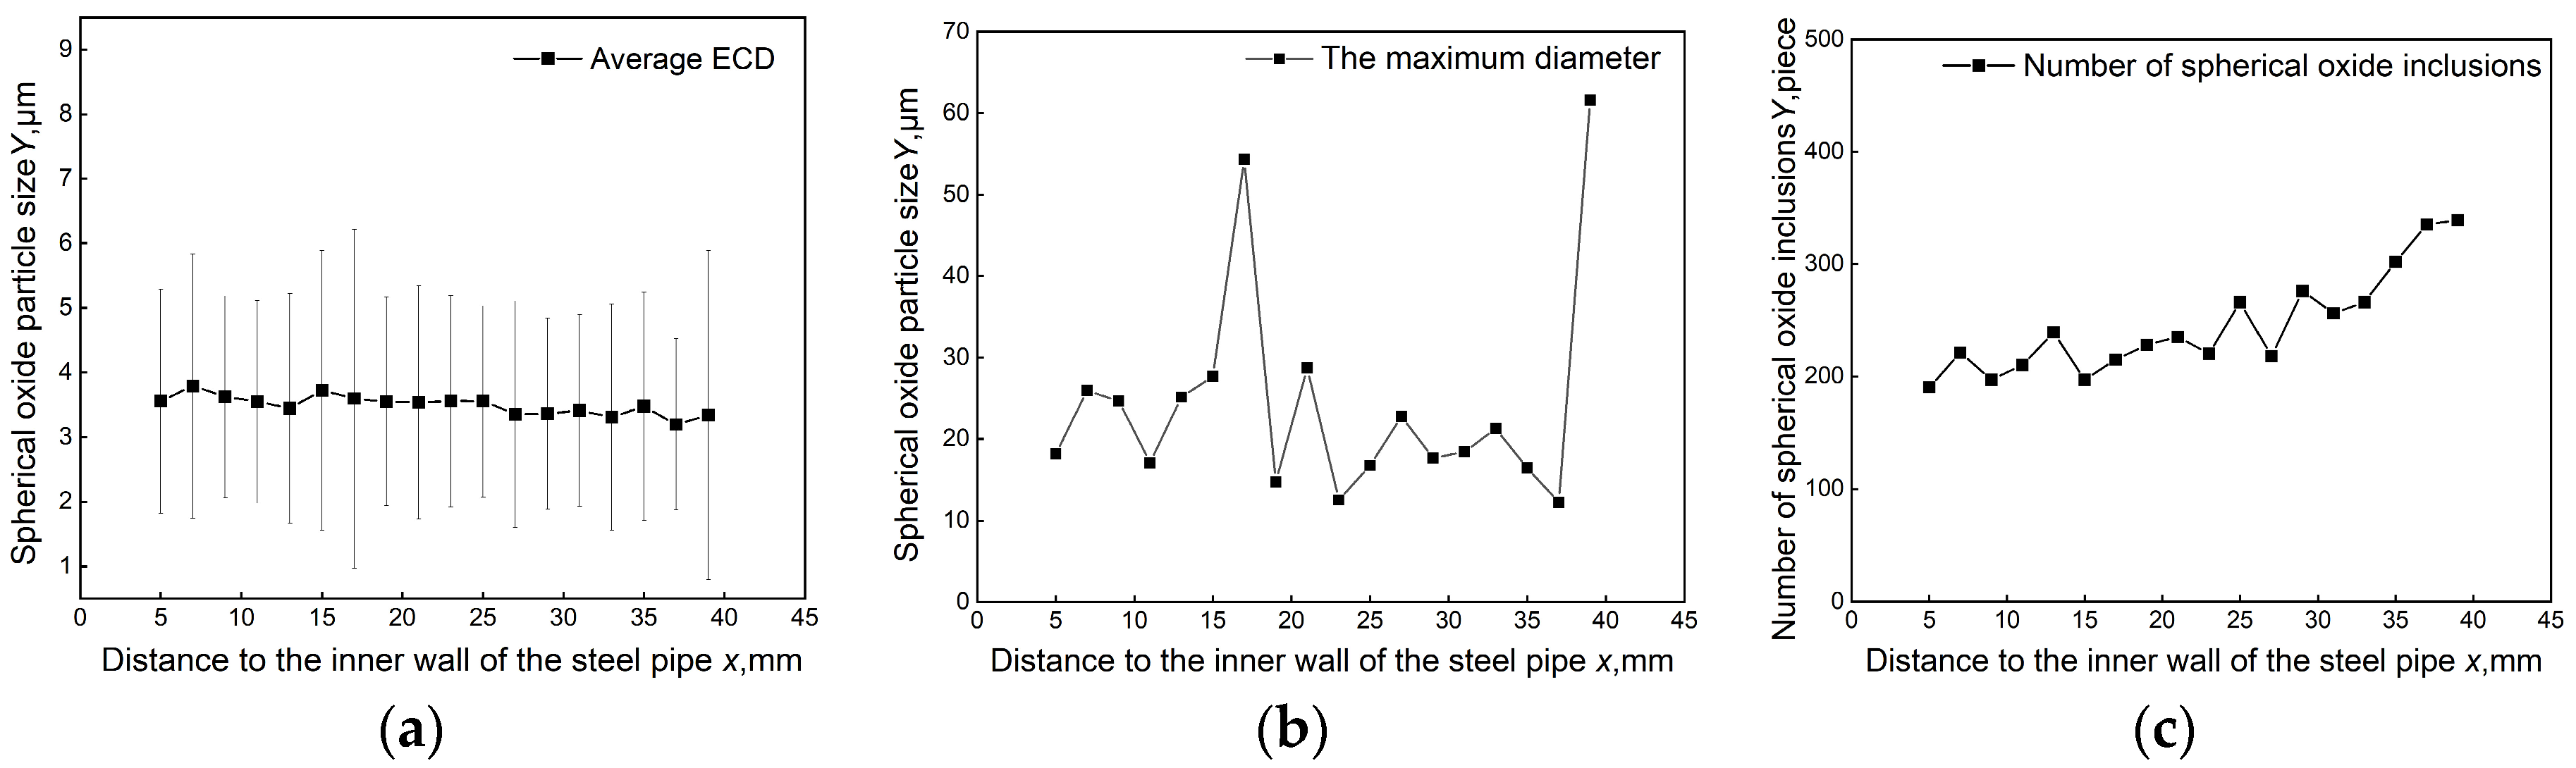
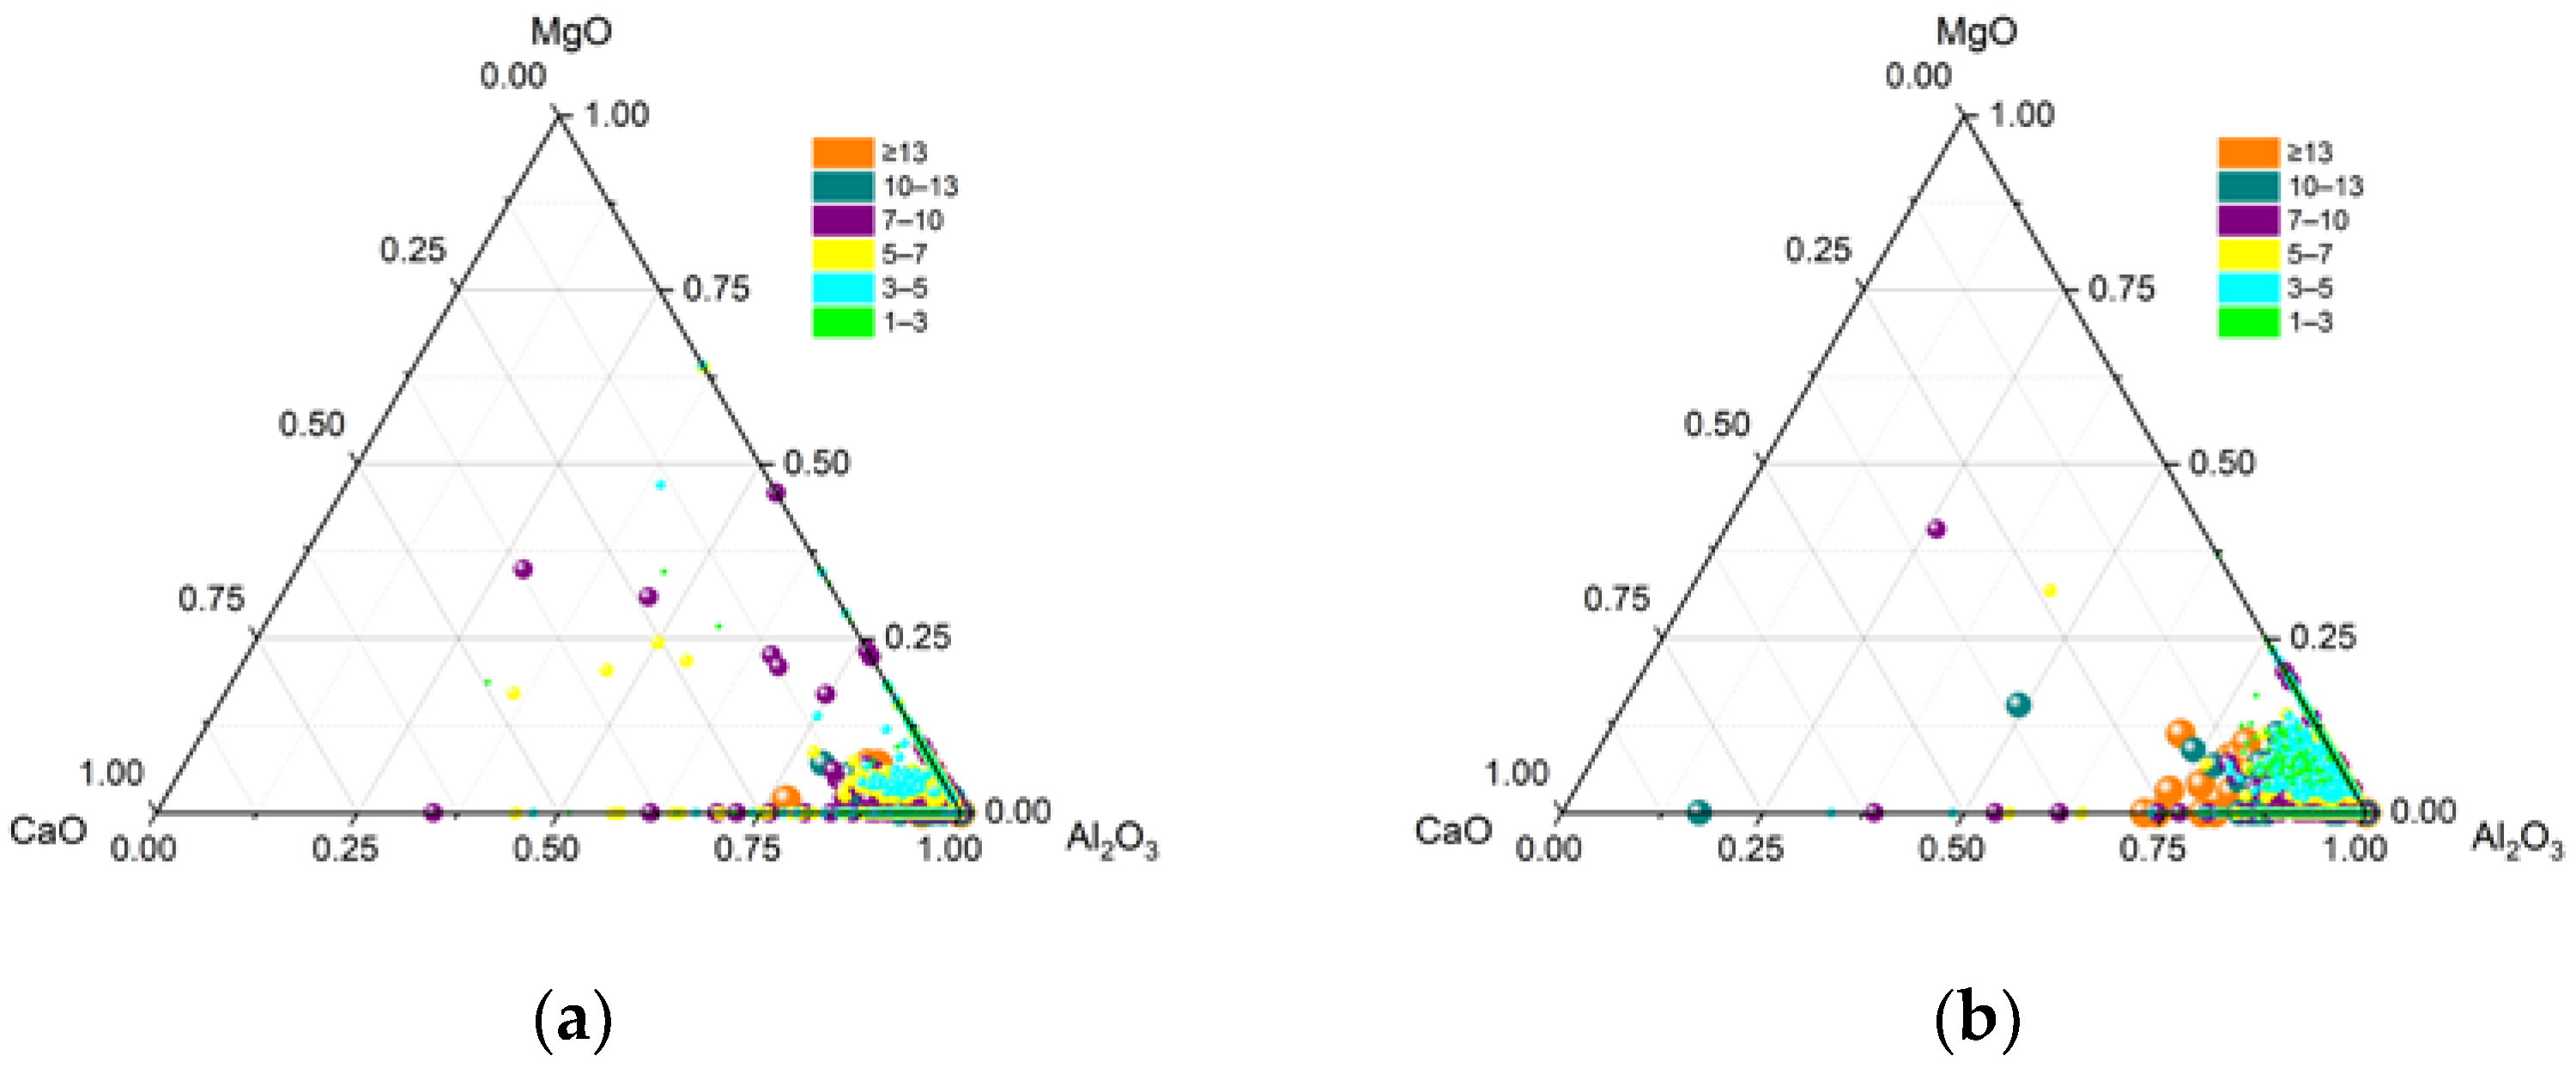
3.4. Original Statistical Distribution Analysis of Spherical Oxides
3.5. Formation Mechanism and the Effect of the Inclusions
4. Conclusions
Author Contributions
Funding
Data Availability Statement
Conflicts of Interest
References
- Guo, Y.; Wu, H. Research progress on localization of P91 seamless steel pipe. Steel Pipes 2008, 39, 22–27. [Google Scholar]
- Weng, L.; Chen, F.; Zhang, Y.; Xue, H.; De, L. Analysis of microstructure and mechanical properties of T/P91 high temperature furnace tube after service. Hot Work. Technol. 2020, 49, 133–135. [Google Scholar]
- Kim, W.; Lee, H.; Hong, H. Evaluation of tension and creep rupture behaviors of long-term exposed P91 steel in a supercritical plant. Eng. Fail. Anal. 2020, 116, 104736. [Google Scholar] [CrossRef]
- Yu, S.; Yang, K.; Lei, Y.; Yang, H. Grain refinement in heat affected zone of high strength low alloy steel welded with high heat input. Trans. Chin. Weld. Instiute 2008, 17–20, 153–154. [Google Scholar]
- Chu, Y.; Li, W.; Ren, Y.; Zhang, L. Transformation of inclusions in linepipe steels during heat treatment. Metall. Mate. Trans. B 2019, 50, 2047–2062. [Google Scholar] [CrossRef]
- Zhang, Y.; Wu, J.; Miu, L. Analysis and research progress of non-metallic inclusions in steel. Baosteel. Technol. 2008, 02, 35–40. [Google Scholar]
- Lyu, S.; Ma, X.; Huang, Z.; YAO, Z.; Lee, H.; Jiang, Z.; Wang, G.; Zou, J.; Zhao, B. Inclusion characterization and formation mechanisms in spring steel deoxidized by silicon. Metall. Mater. Trans. B 2019, 50, 732–747. [Google Scholar] [CrossRef]
- Zhang, S.; Wang, H.; Wang, C. Discussion on classification method of non-metallic inclusions measured by scanning electron microscope. Metal. Anal. 2020, 40, 7–16. [Google Scholar]
- Wang, Z.; Xing, Z.; Wang, H.; Shan, X. Research progress on the effect of non-metallic inclusion characteristics on fatigue properties of iron and steel materials. J. Mater. Eng. 2020, 48, 1–12. [Google Scholar]
- Zhitenev, A.; Salynova, M.; Shamshurin, A.; Ryaboshuk, S.; Kolnyshenko, V. Database Clustering after Automatic Feature Analysis of Nonmetallic Inclusions in Steel. Metals 2021, 11, 1650. [Google Scholar] [CrossRef]
- Yuan, X.; Zhong, M.; Wu, Y.; Wang, C. Characterizing Inclusions in the Weld Metal of EH36 Shipbuilding Steel Processed by CaF2-30 Wt Pct TiO2 Flux. Metall. Mater. Trans. B 2022, 53, 656–661. [Google Scholar] [CrossRef]
- Nabeel, M.; Alba, M.; Karasev, A.; Jönsson, P.; Dogan, N. Characterization of inclusions in 3rd generation advanced high-strength steels. Metall. Mater. Trans. B 2019, 50, 1674–1685. [Google Scholar] [CrossRef]
- LI, D.; SI, H.; Li, M.; Jia, Y.; Wang, H. In situ statistical distribution analysis of silicon inclusions in steel. Metal. Anal. 2009, 29, 1–7. [Google Scholar]
- Wang, H.; Jia, Y.; Li, Y.; Zhao, L.; Yang, C.; Cheng, D. Rapid analysis of content and particle sizes of aluminum inclusions in low and middle alloy steel by laser-induced breakdown spectroscopy. Spectrochimica. Acta. B 2020, 171, 105927. [Google Scholar] [CrossRef]
- ASTM E2412-08; Standard Test Methods for Rating and Classifying Inclusions in Steel Using the Scanning Electron Microscope. ASTM: West Conshohocken, PA, USA, 2015; 14p.
- Yan, C.; Yin, L.; Ren, Q.; Meng, Y.; Qi, Q. Discussion on influencing factors of SEM automatic statistical analysis results of inclusions in steel. Metall. Anal. 2018, 38, 1–10. [Google Scholar]
- Peng, Y.; Li, D.; Zhou, Q.; Zhao, L.; Wang, H. Study and application of in-situ statistical distribution characterization method of inclusions in wheel profile of large-size EMU. Meta. Anal. 2021, 41, 1–8. [Google Scholar]
- Yu, H.; Shao, X.; Zhang, J.; Wang, X. Study on the quantitative relationship between total oxygen and non-metallic inclusions in steel by ASPEX scanning electron microscope. Chin. J. Eng. 2015, 37, 35–44. [Google Scholar]
- He, X.; Hu, C.; Xu, L.; Wang, M. Effect of total oxygen content on non-metallic inclusions in gear steel. Chin. J. Eng. 2021, 43, 537–544. [Google Scholar]
- Fang, Z.; Sun, Y.; Zhang, X.; Wang, C. Formation and modification of magnesia alumina spinel in oil casing steel. Iron Steel Vanadium Titan. 2014, 35, 136–141. [Google Scholar]
- Ji, S.; Zhang, L.; Luo, Y.; Wang, W.; Wang, X. Effect of calcium treatment on non-metallic inclusions in 20CrMnTiH gear steel. Chin. J. Eng. 2021, 43, 825–834. [Google Scholar]
- Wang, X.; Li, X.; Li, Q.; Huang, F.; Li, H. Control of string CaO-Al2O3 non-metallic inclusions in X80 pipeline steel plate. Acta Metall. Sin. 2013, 49, 553–561. [Google Scholar] [CrossRef]
- Wang, F. Reoxidation Phenomenon and Inhibition Mechanism of Aluminum-Deoxidized Steel in Tangsteel; University of Science and Technology Beijing: Beijing, China, 2019. [Google Scholar]
- Amezhnov, A.; Rodionova, I. Effect of Non-Metallic Inclusion Chemical and Phase Composition on Corrosion Resistance of Carbon and Low Alloy Steels in Water Media Typical for Oilfield Pipeline Operating Conditions. Metallurgist 2019, 63, 717–726. [Google Scholar] [CrossRef]
- Hou, Z.; Jiang, M.; Yang, E.; Gao, S.; Wang, X. Inclusion characterization in aluminum-deoxidized special steel with certain sulfur content under combined influences of slag refining, calcium treatment, and reoxidation. Metall. Mater. Trans. B 2018, 49B, 3056–3066. [Google Scholar] [CrossRef]
- Murakami, Y.; Endo, M. Effects of defects, inclusions and inhomogeneities on fatigue strength. Int. J. Fatigue 1994, 16, 163–182. [Google Scholar] [CrossRef]
- Li, S.; Zeng, Y.; Tong, K. Micro behavior of inclusions in X80 pipeline steel under fatigue load. Acta Petrol. 2012, 33, 506–512. [Google Scholar]
- Ito, Y.; Masumitsu, N.; Matsubara, K. Formation of manganese sulfide in steel. ISIJ Int. 1981, 21, 477–484. [Google Scholar] [CrossRef]
- Takada, H.; Bessho, I.; Ito, I. Effect of sulfur content and solidification variables on morphology and distribution of sulfide in steel ingots. ISIJ Int. 2019, 18, 564–573. [Google Scholar] [CrossRef]
- He, X.; Xu, L.; Wang, M.; Wang, Z. Effect of calcium and magnesium treatment on sulfide inclusions in 38MnVS steel. Heat Treat. Met. 2019, 44, 90–95. [Google Scholar]
- Ruan, Q.; Qian, G.; Pan, J.; Chen, X.; Cheng, G. Effect of titanium containing stainless steel inclusions on submerged nozzle blockage. Steelmak 2016, 32, 39–43. [Google Scholar]
- Zhang, H.; Cheng, W.; Wu, D.; Zheng, H. Study on nodulation mechanism of submerged nozzle for continuous casting of titanium bearing ferritic stainless steel. Iron Steel Vanadium Titan. 2010, 31, 63–66. [Google Scholar] [CrossRef]
- Zhang, H.; Chen, W.; Zheng, H. Study on the control of titanium oxide inclusions in titanium bearing ferritic stainless steel. ShangHai Met. 2010, 32, 20–23. [Google Scholar]


| Samples No. | C | Si | Mn | P | S | Cr | Ni | Cu | Mo | V | Nb | Al | Ti | N | O | Fe |
|---|---|---|---|---|---|---|---|---|---|---|---|---|---|---|---|---|
| 1# | 0.11 | 0.28 | 0.42 | 0.012 | 0.0024 | 8.72 | 0.14 | 0.035 | 0.91 | 0.20 | 0.078 | <0.005 | <0.001 | 0.048 | 0.0018 | Bal. |
| 2# | 0.12 | 0.30 | 0.37 | 0.011 | 0.0010 | 8.67 | 0.16 | 0.031 | 0.93 | 0.20 | 0.074 | <0.005 | <0.001 | 0.044 | 0.0022 | Bal. |
| Instrument Parameters | Numerical Value |
|---|---|
| Electron microscope high voltage (kV) | 20 |
| First pass residence time (μs) | 5 |
| Analysis mode | Particle detection |
| Energy range (keV) | 40 |
| Number of channels | 1024 |
| Acquisition time (s) | 0.50 |
| Image scan size | 2048 |
| Image magnification | 300 |
| Image pixel resolution (μm) | 0.90 |
| Working distance (mm) | 10 |
| Beam intensity (μA) | 15 |
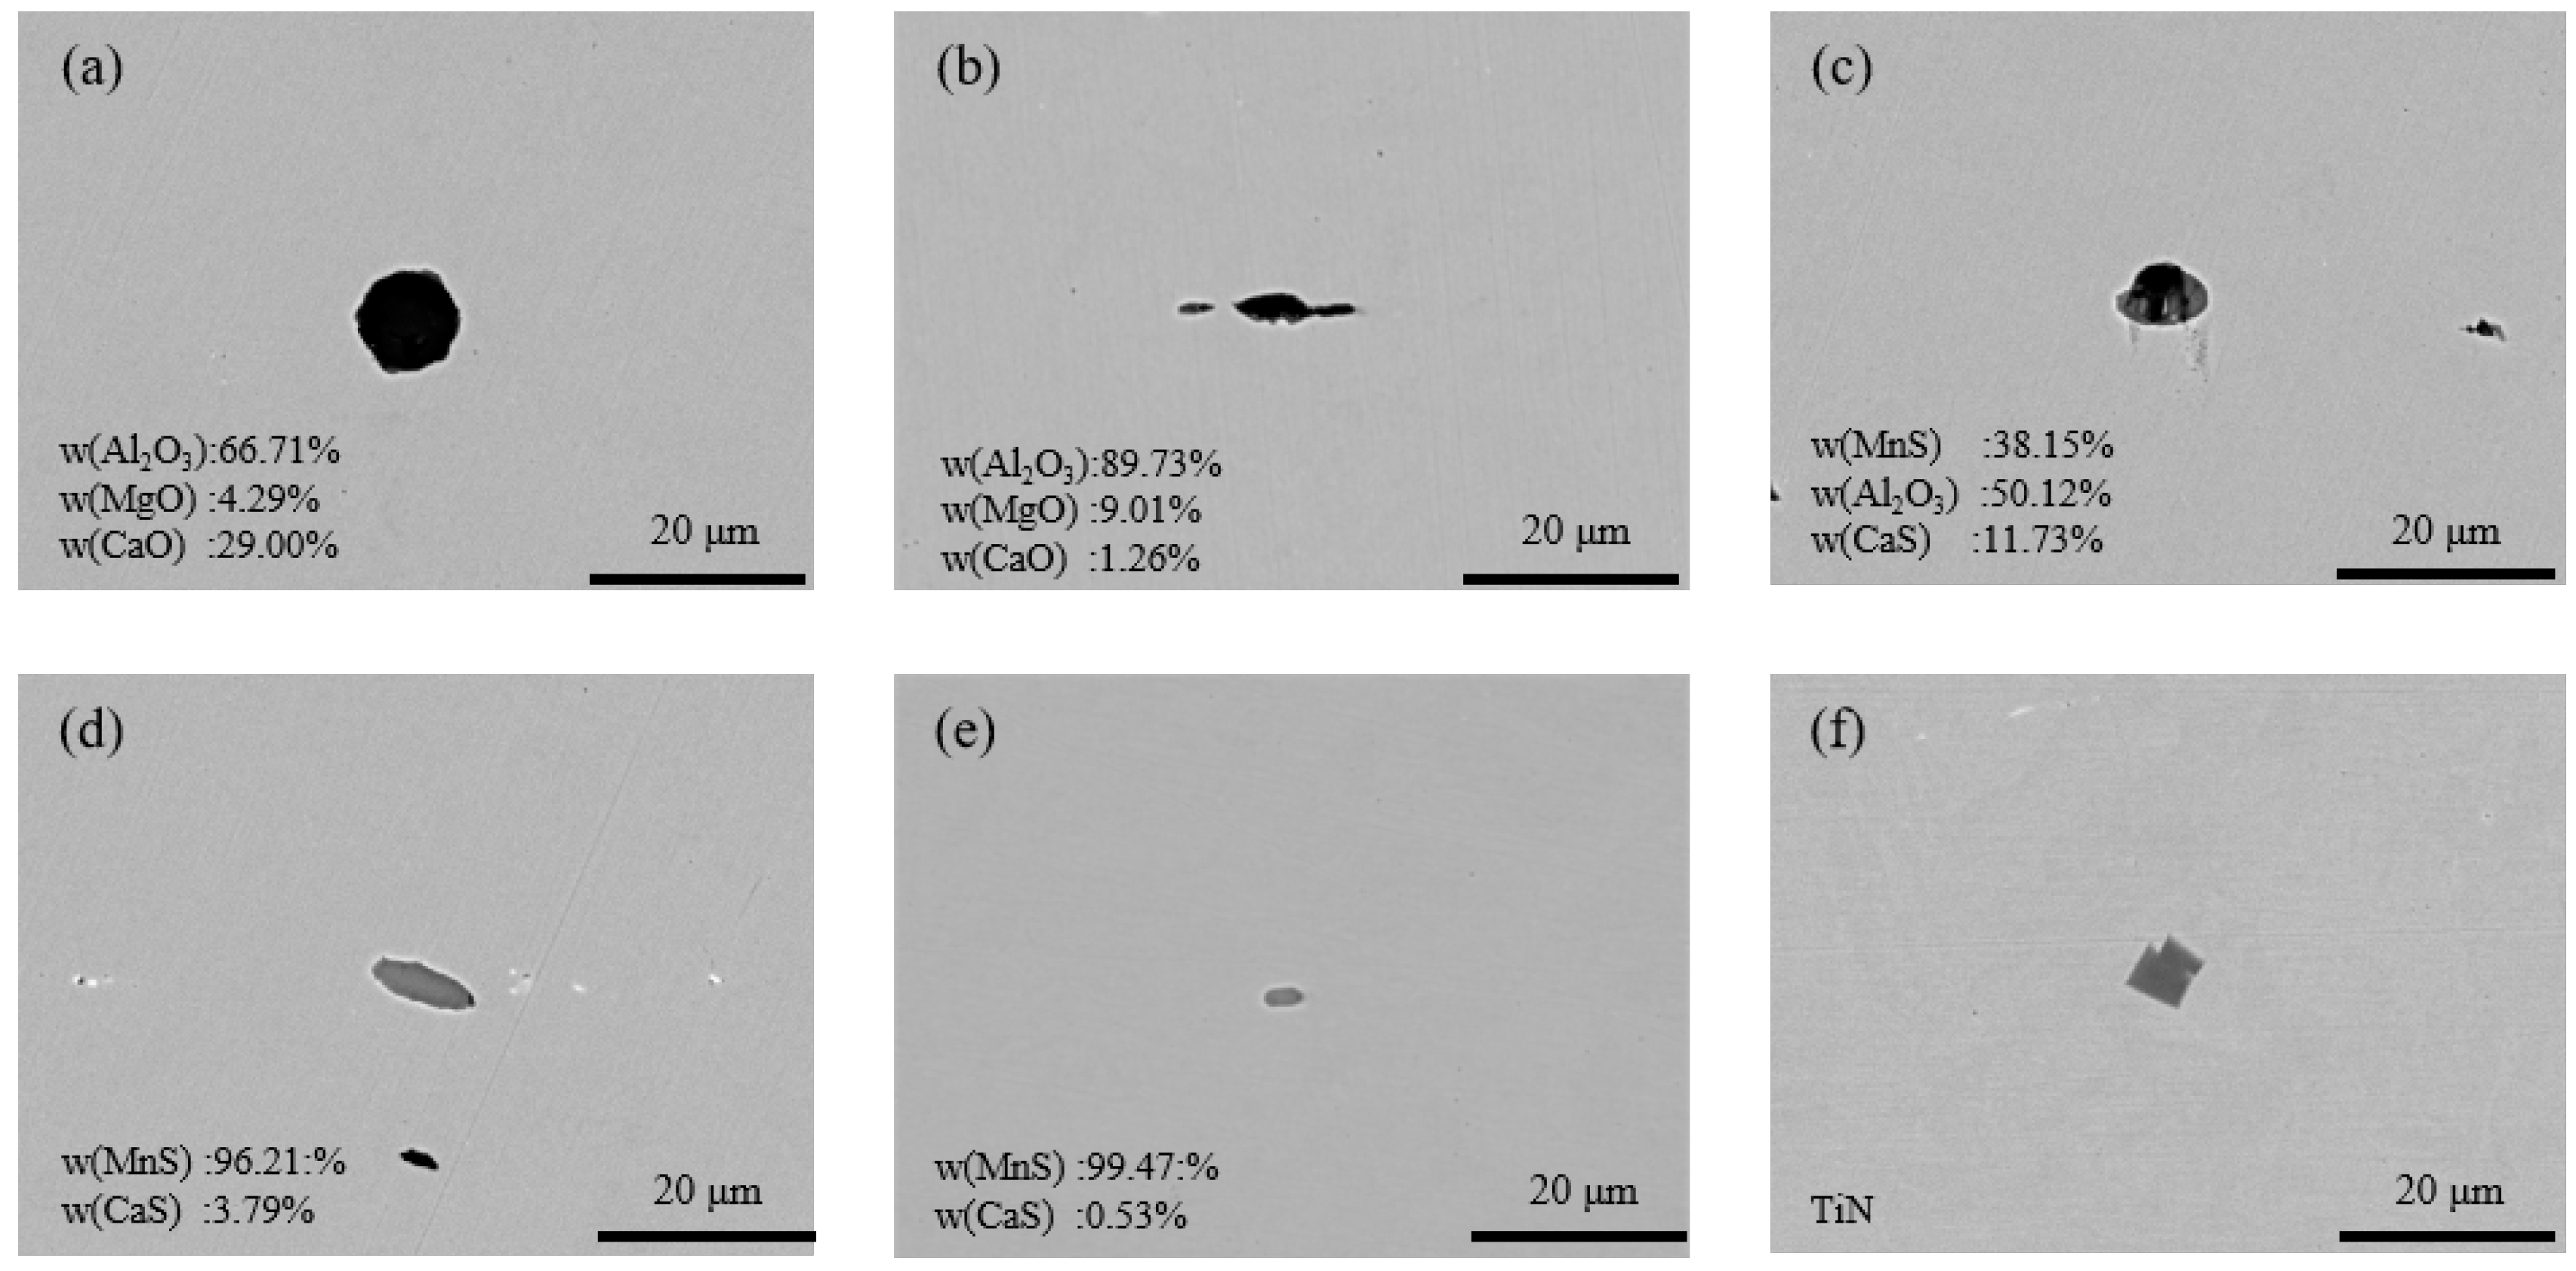
| Inclusion Characteristics | (a) | (b) | (c) | (d) | (e) | (f) |
|---|---|---|---|---|---|---|
| Inclusion morphology |  |  |  |  |  |  |
| Area(μm2) | 12.52 | 12.93 | 26.16 | 24.61 | 4.44 | 28.90 |
| Length(μm) | 9.88 | 15.35 | 8.19 | 9.82 | 3.48 | 9.77 |
| Aspect ratio | 1.09 | 4.76 | 1.43 | 3.03 | 2.15 | 1.59 |
| ECD(μm) | 3.99 | 4.06 | 5.77 | 16.28 | 2.38 | 6.07 |
| Chemical composition (wt.%) | O:50.8 Al:29.2 Ca:17.1 Mg:2.1 S:0.8 | O:51.3 Al:37.0 Ca:5.7 Mg:0.7 S:4.2 | O:31.6 Al:23.1 Mn:21.0 Ca:7.2 S:16.9 | Al:0.4 Mn:56.3 Ca:2.5 S:40.7 | Mn:65.5 Ca:0.4 S:34.1 | Ti:54.4 N:31.7 Nb:8.1 V:5.8 |
| Number | Inclusion Type | Identifying Elements | Element Mass Percentage (wt.%) | Aspect Ratio |
|---|---|---|---|---|
| 1 | Spherical oxide (Al2O3) | Al/S | 0 ≤ S/Al < 1 | 1 ≤ AR < 3 |
| 2 | Strand oxide (Al2O3) | Al/S | 0 ≤ S/Al < 1 | AR ≥ 3 |
| 3 | Spherical sulfide (MnS, CaS) | Al/S | S/Al ≥ 3 | 1 ≤ AR < 3 |
| 4 | Strip sulfide (MnS, CaS) | Al/S | S/Al ≥ 3 | AR ≥ 3 |
| 5 | Spherical oxygen–sulfur compounds (Al2O3, MnS, CaS) | Al/S | 1 ≤ S/Al < 3 | 1 ≤ AR < 3 |
| 6 | Titanium-bearing inclusions | Ti, excluding Al and S | / | / |
| Samples | Spherical Oxide | Strand Oxide | Striped Sulfide | Spherical Sulfide | Spherical Oxygen–Sulfur Compounds | Ti-Bearing Inclusions | Total |
|---|---|---|---|---|---|---|---|
| Proportion of Quantity (%) | |||||||
| 1# | 64.75 | 0.99 | 2.97 | 22.82 | 8.41 | 0.06 | 1 |
| 2# | 96.31 | 0.92 | 0.17 | 1.75 | 0.81 | 0.04 | 1 |
| Samples | Spherical Oxide | Strand Oxide | Striped Sulfide | Spherical Sulfide | Spherical Oxygen–Sulfur Compounds | Ti Inclusions | Total |
|---|---|---|---|---|---|---|---|
| Area Proportion (%) | |||||||
| 1# | 77.52 | 2.26 | 5.74 | 9.42 | 4.91 | 0.15 | 1 |
| 2# | 91.29 | 6.61 | 0.41 | 1.10 | 0.58 | 0.01 | 1 |
| Particle Size/μm | Spherical Oxide | Strand Oxide | Striped Sulfide | Spherical Sulfide | Spherical Oxygen–Sulfur Compounds |
|---|---|---|---|---|---|
| Quantity | |||||
| 1~3 | 166 | 1 | 2 | 163 | 38 |
| 3~5 | 264 | 0 | 0 | 49 | 38 |
| 5~7 | 139 | 0 | 1 | 7 | 5 |
| 7~10 | 48 | 2 | 8 | 2 | 1 |
| 10~13 | 6 | 2 | 7 | 0 | 0 |
| >13 | 3 | 4 | 10 | 0 | 0 |
| Total | 627 | 9 | 28 | 221 | 82 |
| Maximum ECD/μm | 27.0 | 28.9 | 35.9 | 14.5 | 7.1 |
| Particle Size/μm | Spherical Oxide | Strand Oxide | Striped Sulfide | Spherical Sulfide | Spherical Oxygen–Sulfur Compounds |
|---|---|---|---|---|---|
| Quantity (%) | |||||
| 1~3 | 615 | 0 | 1 | 19 | 9 |
| 3~5 | 639 | 0 | 0 | 4 | 2 |
| 5~7 | 88 | 0 | 0 | 2 | 0 |
| 7~10 | 34 | 2 | 0 | 1 | 0 |
| 10~13 | 8 | 3 | 1 | 0 | 0 |
| >13 | 5 | 8 | 1 | 0 | 0 |
| Total | 1389 | 13 | 2 | 25 | 12 |
| Maximum ECD/μm | 35.6 | 43.9 | 18.1 | 8.8 | 10.6 |
| Inclusions Type | Quantity/Unit | Percentage/% |
|---|---|---|
| Al-bearing inclusions | 2855 | 80.8 |
| Mg-bearing inclusions | 869 | 24.6 |
| Si-bearing inclusions | 184 | 5.2 |
| Ca-bearing inclusions | 1301 | 36.8 |
| Inclusions Type | Quantity/Unit | Percentage/% |
|---|---|---|
| Al-bearing inclusions | 4722 | 98.3 |
| Mg-bearing inclusions | 2182 | 45.4 |
| Si-bearing inclusions | 195 | 4.1 |
| Ca-bearing inclusions | 1175 | 24.5 |
Disclaimer/Publisher’s Note: The statements, opinions and data contained in all publications are solely those of the individual author(s) and contributor(s) and not of MDPI and/or the editor(s). MDPI and/or the editor(s) disclaim responsibility for any injury to people or property resulting from any ideas, methods, instructions or products referred to in the content. |
© 2023 by the authors. Licensee MDPI, Basel, Switzerland. This article is an open access article distributed under the terms and conditions of the Creative Commons Attribution (CC BY) license (https://creativecommons.org/licenses/by/4.0/).
Share and Cite
Zhu, C.; Yang, L.; Zhao, L.; Ma, Y.; Wang, Y.; Shen, X.; Wang, H. Research and Application of the Original Position Statistical Distribution Analysis Method for Non-Metallic Inclusions in P91 Steel. Metals 2023, 13, 793. https://doi.org/10.3390/met13040793
Zhu C, Yang L, Zhao L, Ma Y, Wang Y, Shen X, Wang H. Research and Application of the Original Position Statistical Distribution Analysis Method for Non-Metallic Inclusions in P91 Steel. Metals. 2023; 13(4):793. https://doi.org/10.3390/met13040793
Chicago/Turabian StyleZhu, Changwang, Lixia Yang, Lei Zhao, Yue Ma, Yang Wang, Xuejing Shen, and Haizhou Wang. 2023. "Research and Application of the Original Position Statistical Distribution Analysis Method for Non-Metallic Inclusions in P91 Steel" Metals 13, no. 4: 793. https://doi.org/10.3390/met13040793