

Process Parameter Optimization of 2507 Super Duplex Stainless Steel Additively Manufactured by the Laser Powder Bed Fusion Technique

Abstract
:1. Introduction
2. Materials and Methods
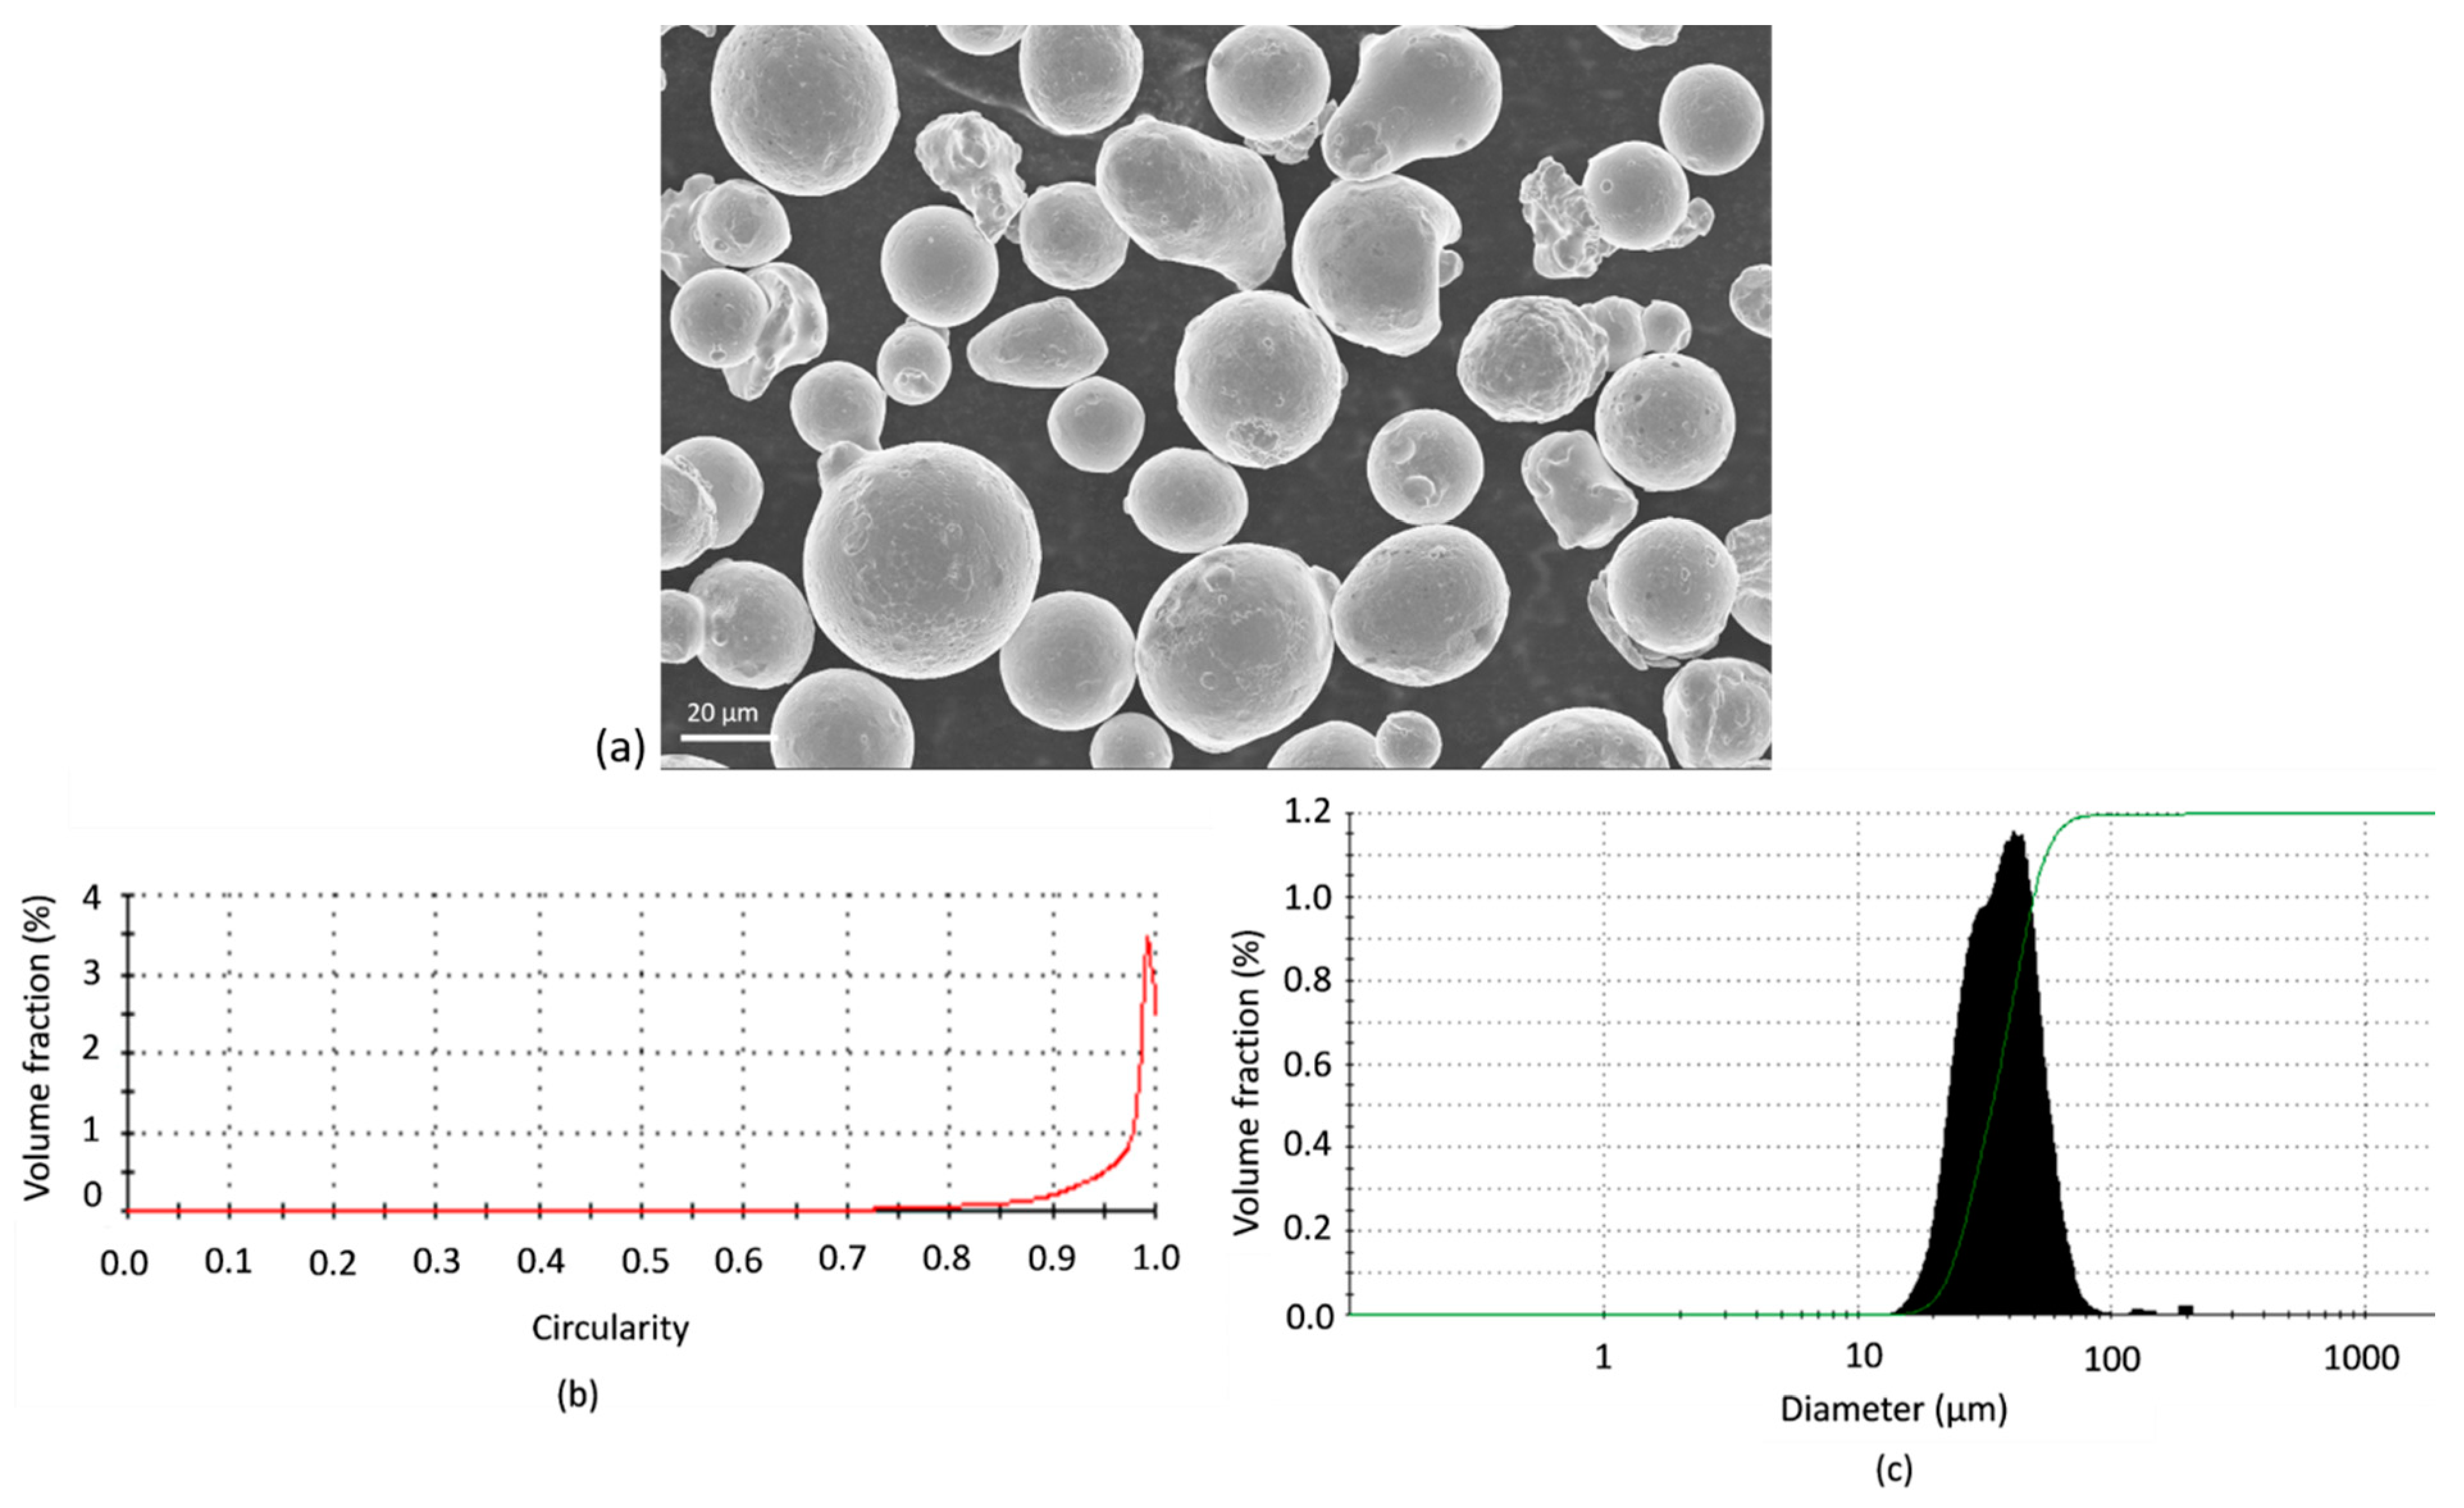
2.1. Material and Equipment
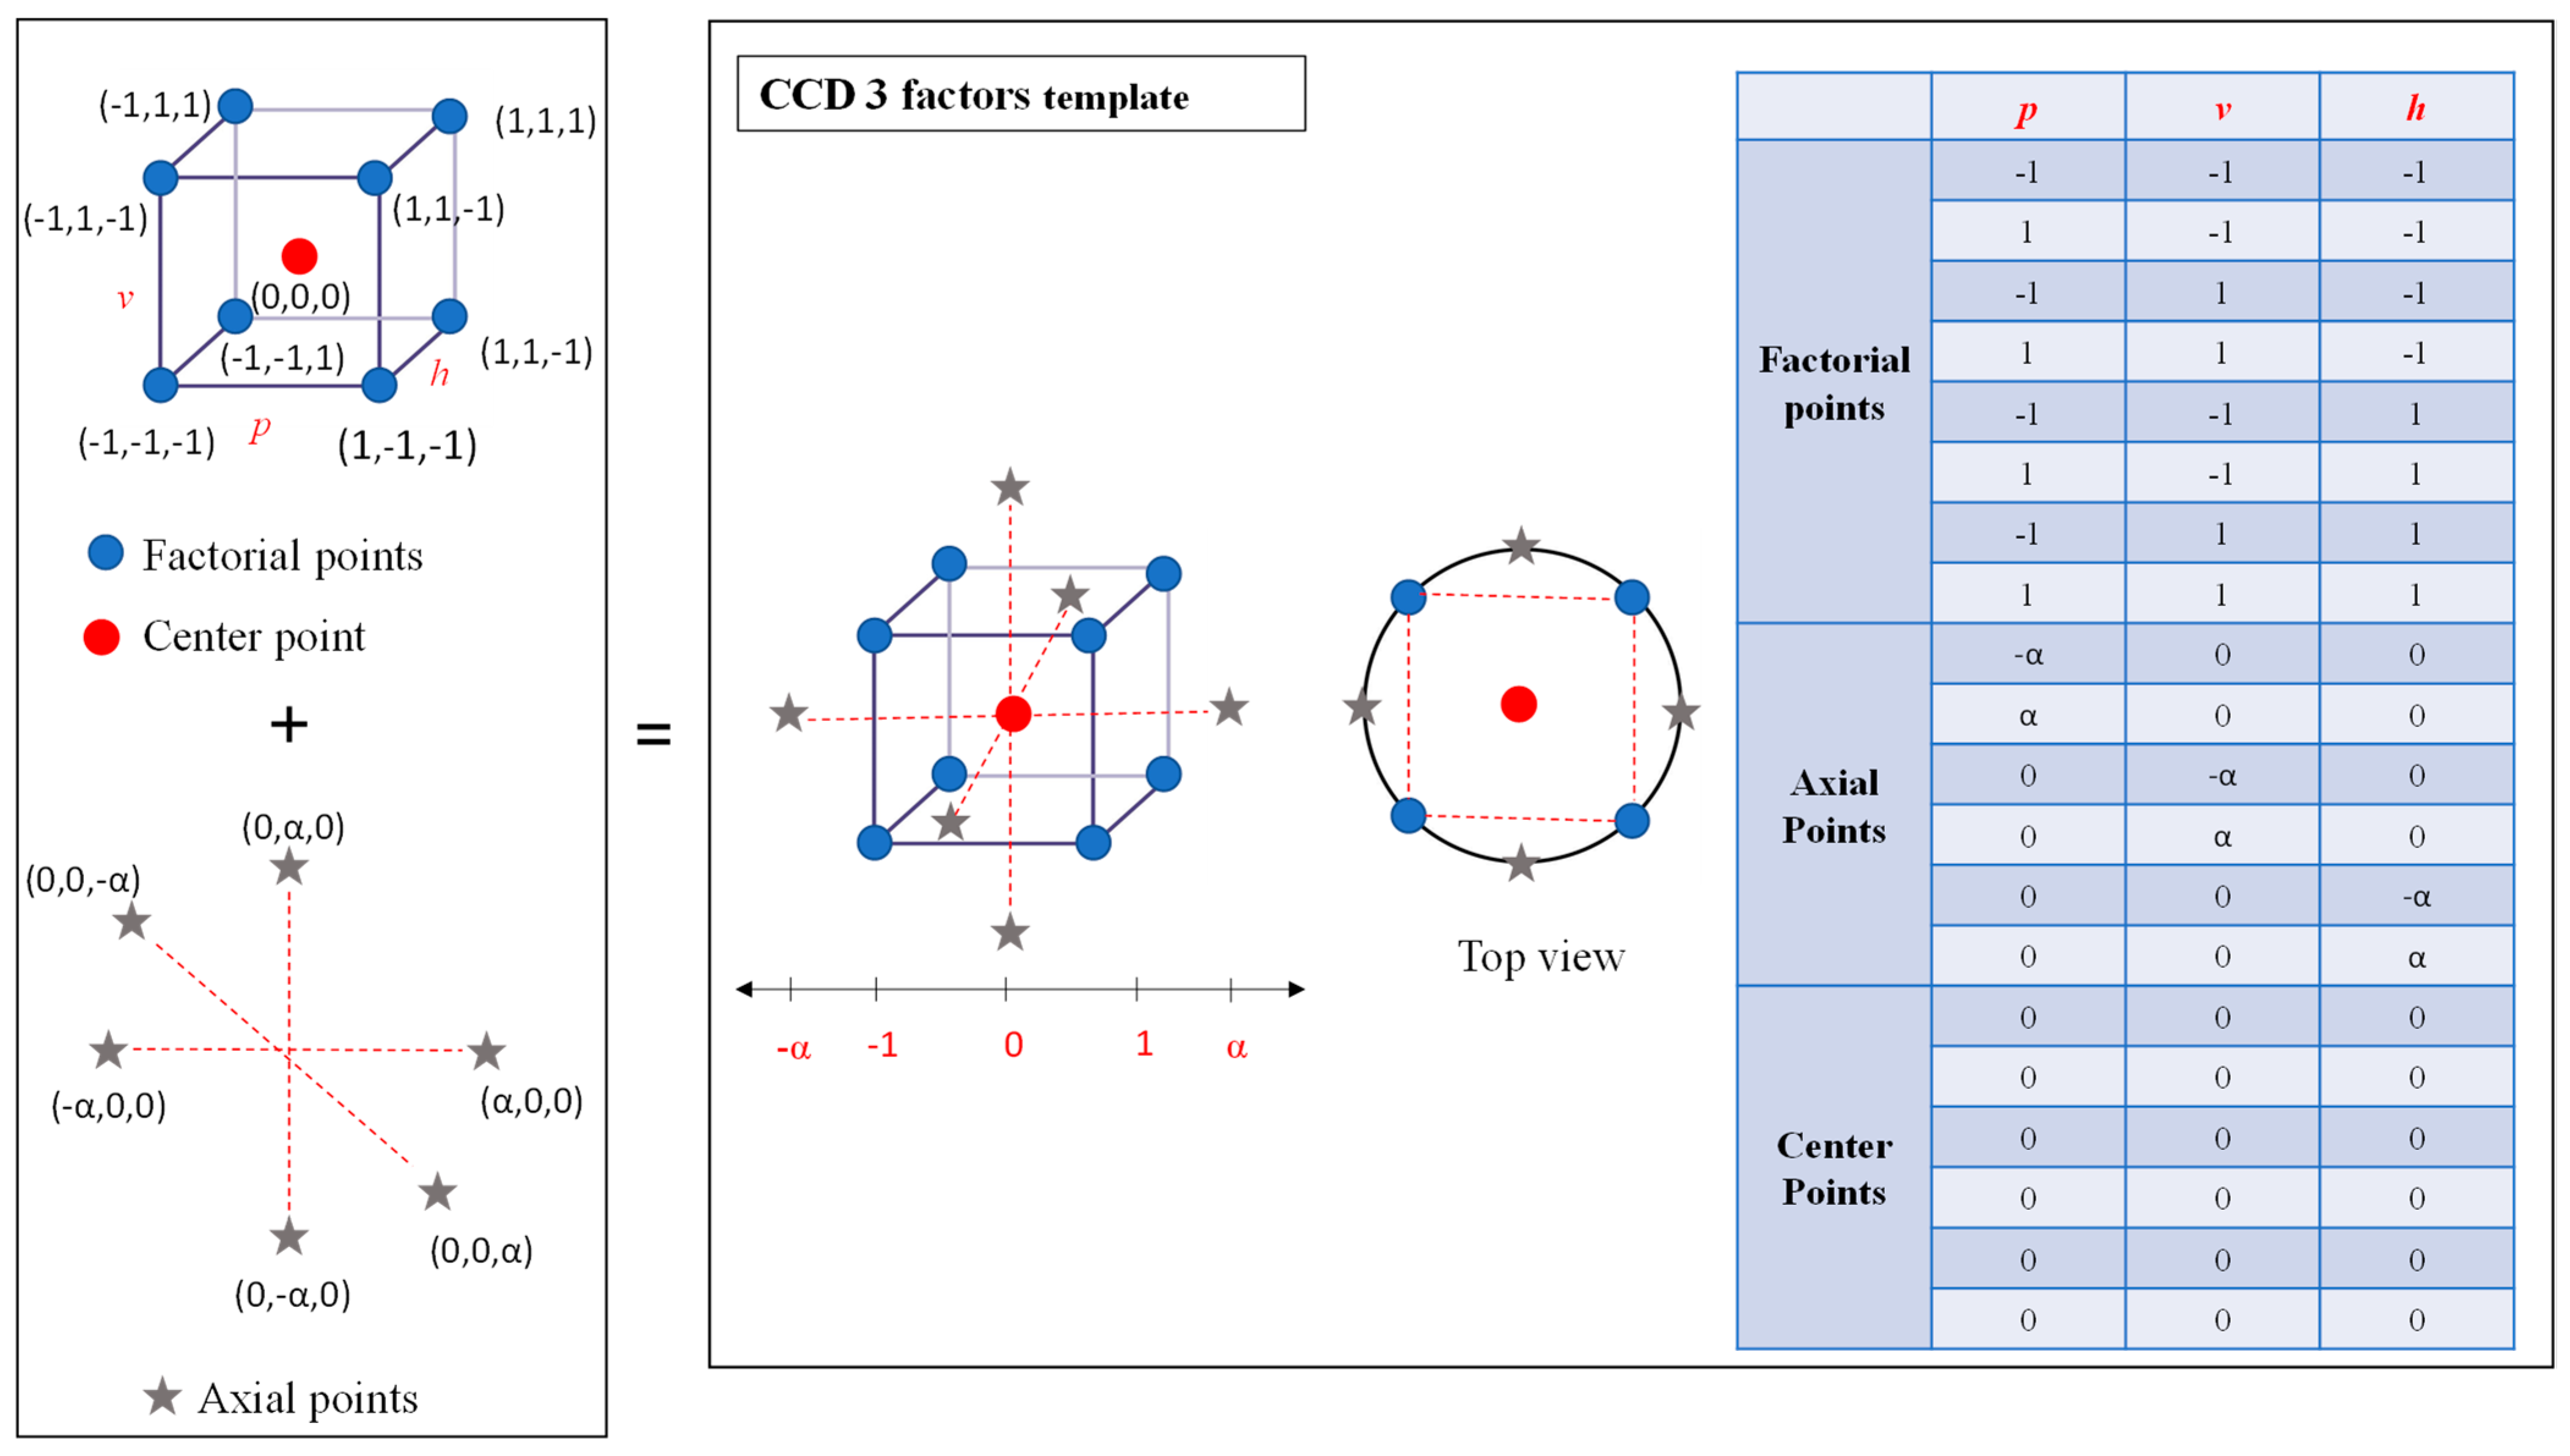
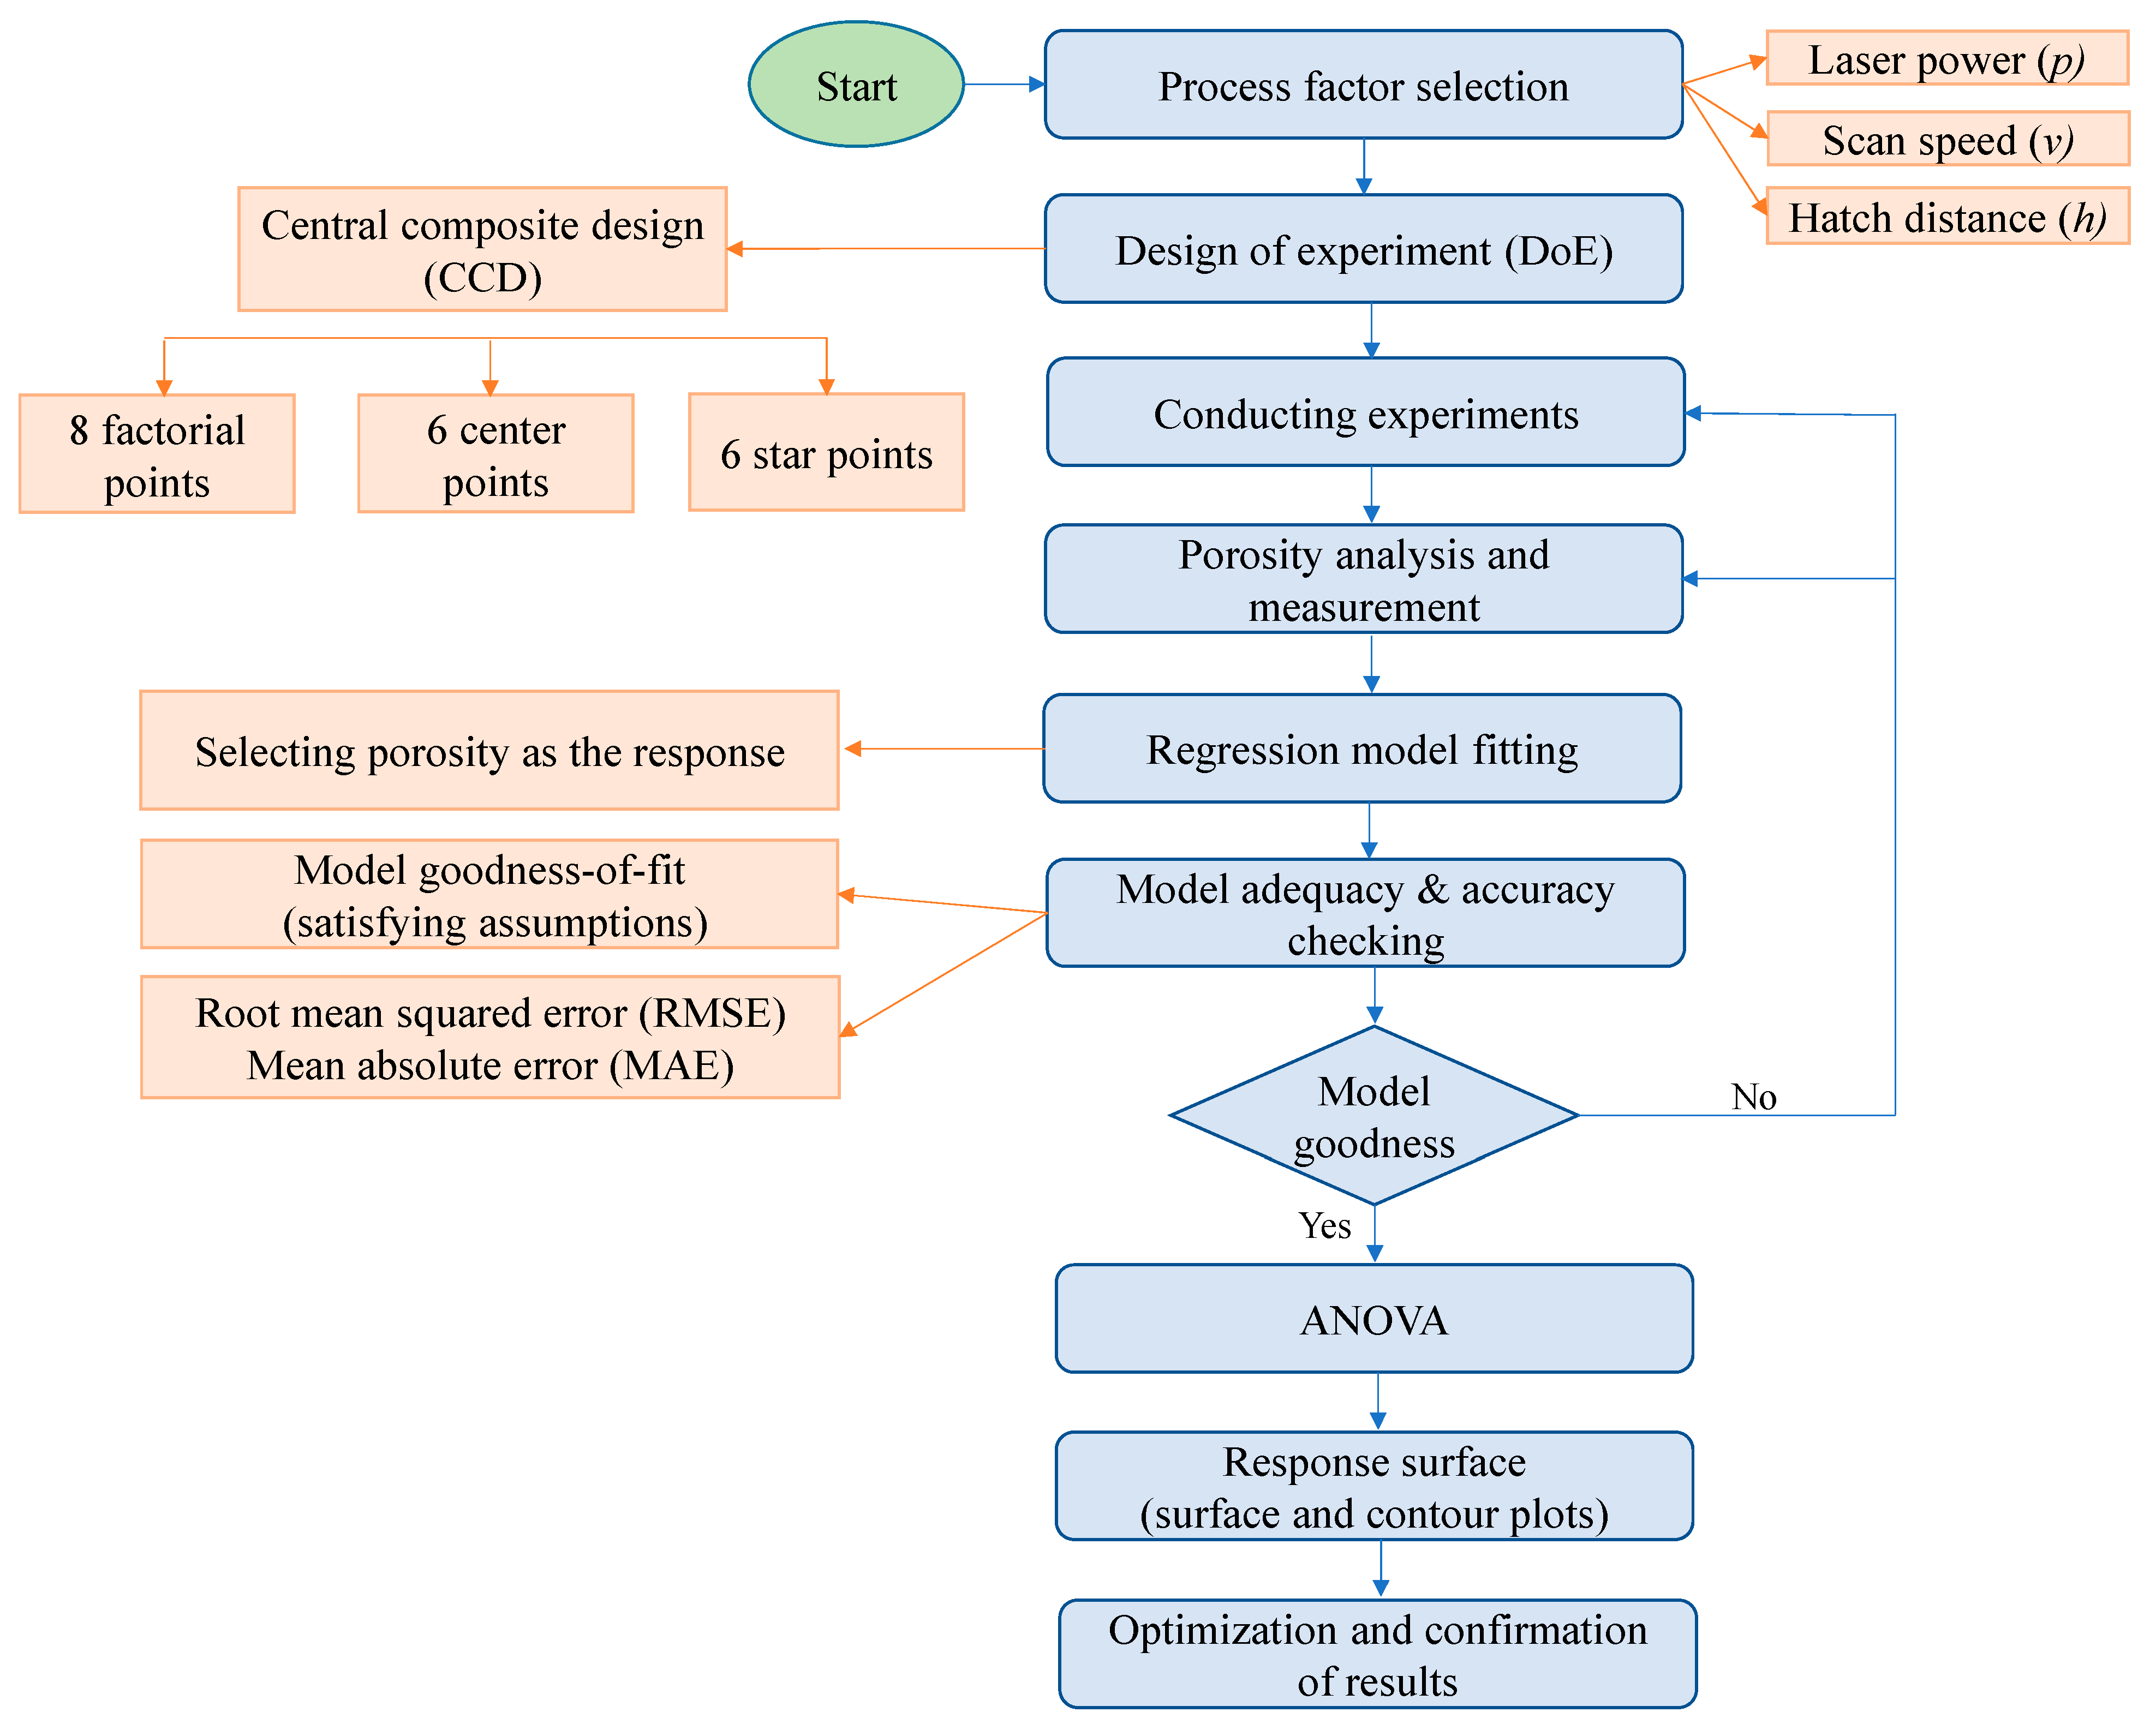
2.2. Response Surface Methodology
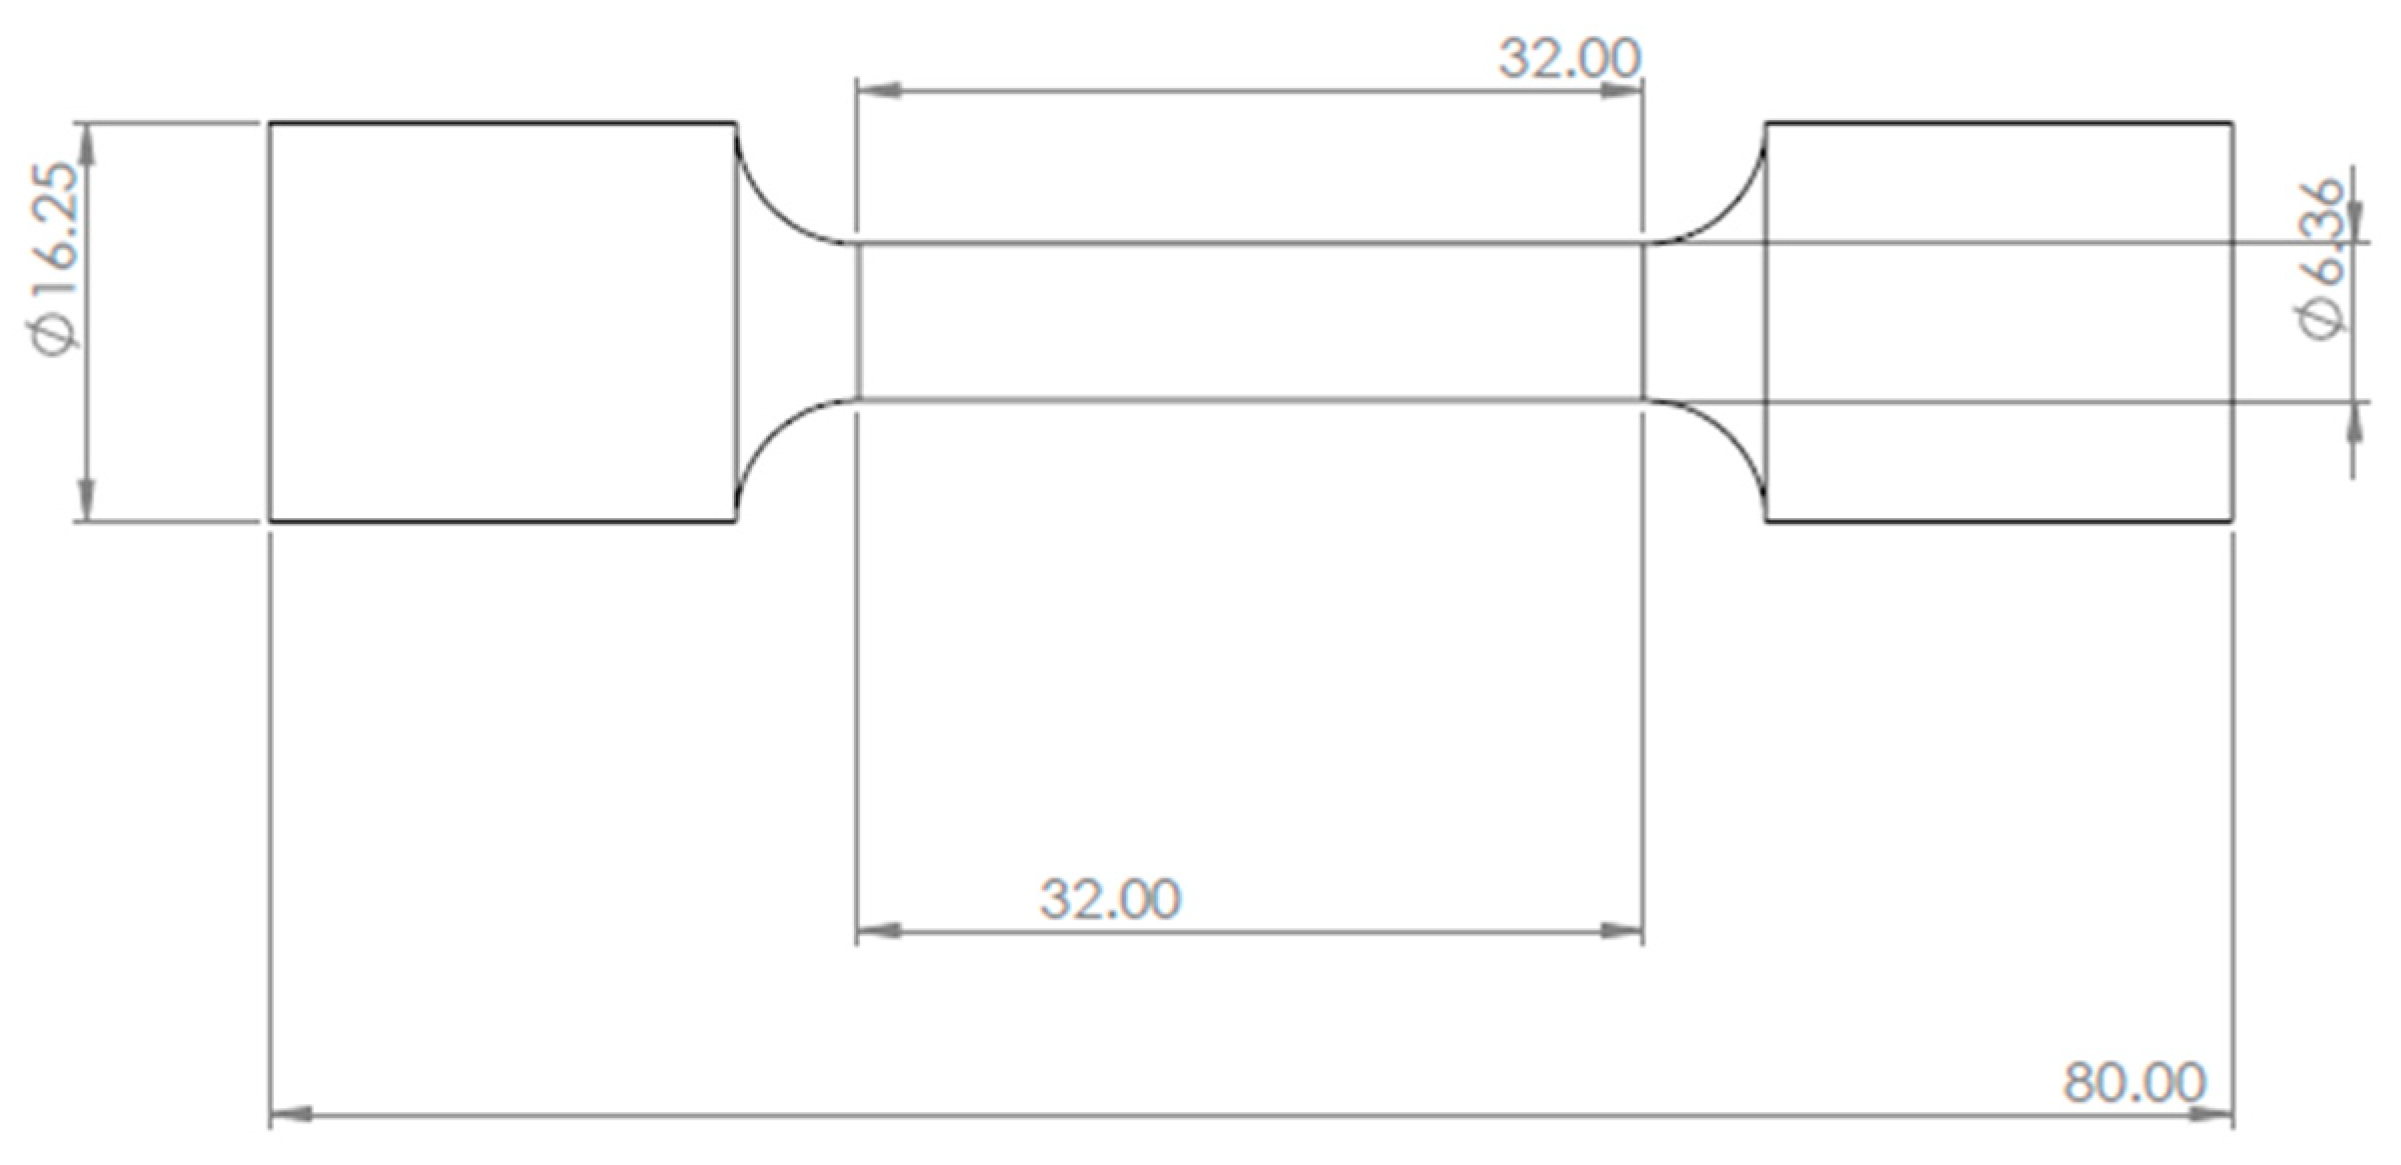
2.3. Mechanical Testing
2.4. Characterization Methods
3. Results and Discussions
3.1. Porosity Characterization Analysis
3.2. Response Surface Methodology Analysis
3.2.1. Regression Model Equation
3.2.2. Model Adequacy and Accuracy Checking
3.2.3. ANOVA and Response Surface Analysis
3.2.4. Parameter Optimization for Porosity
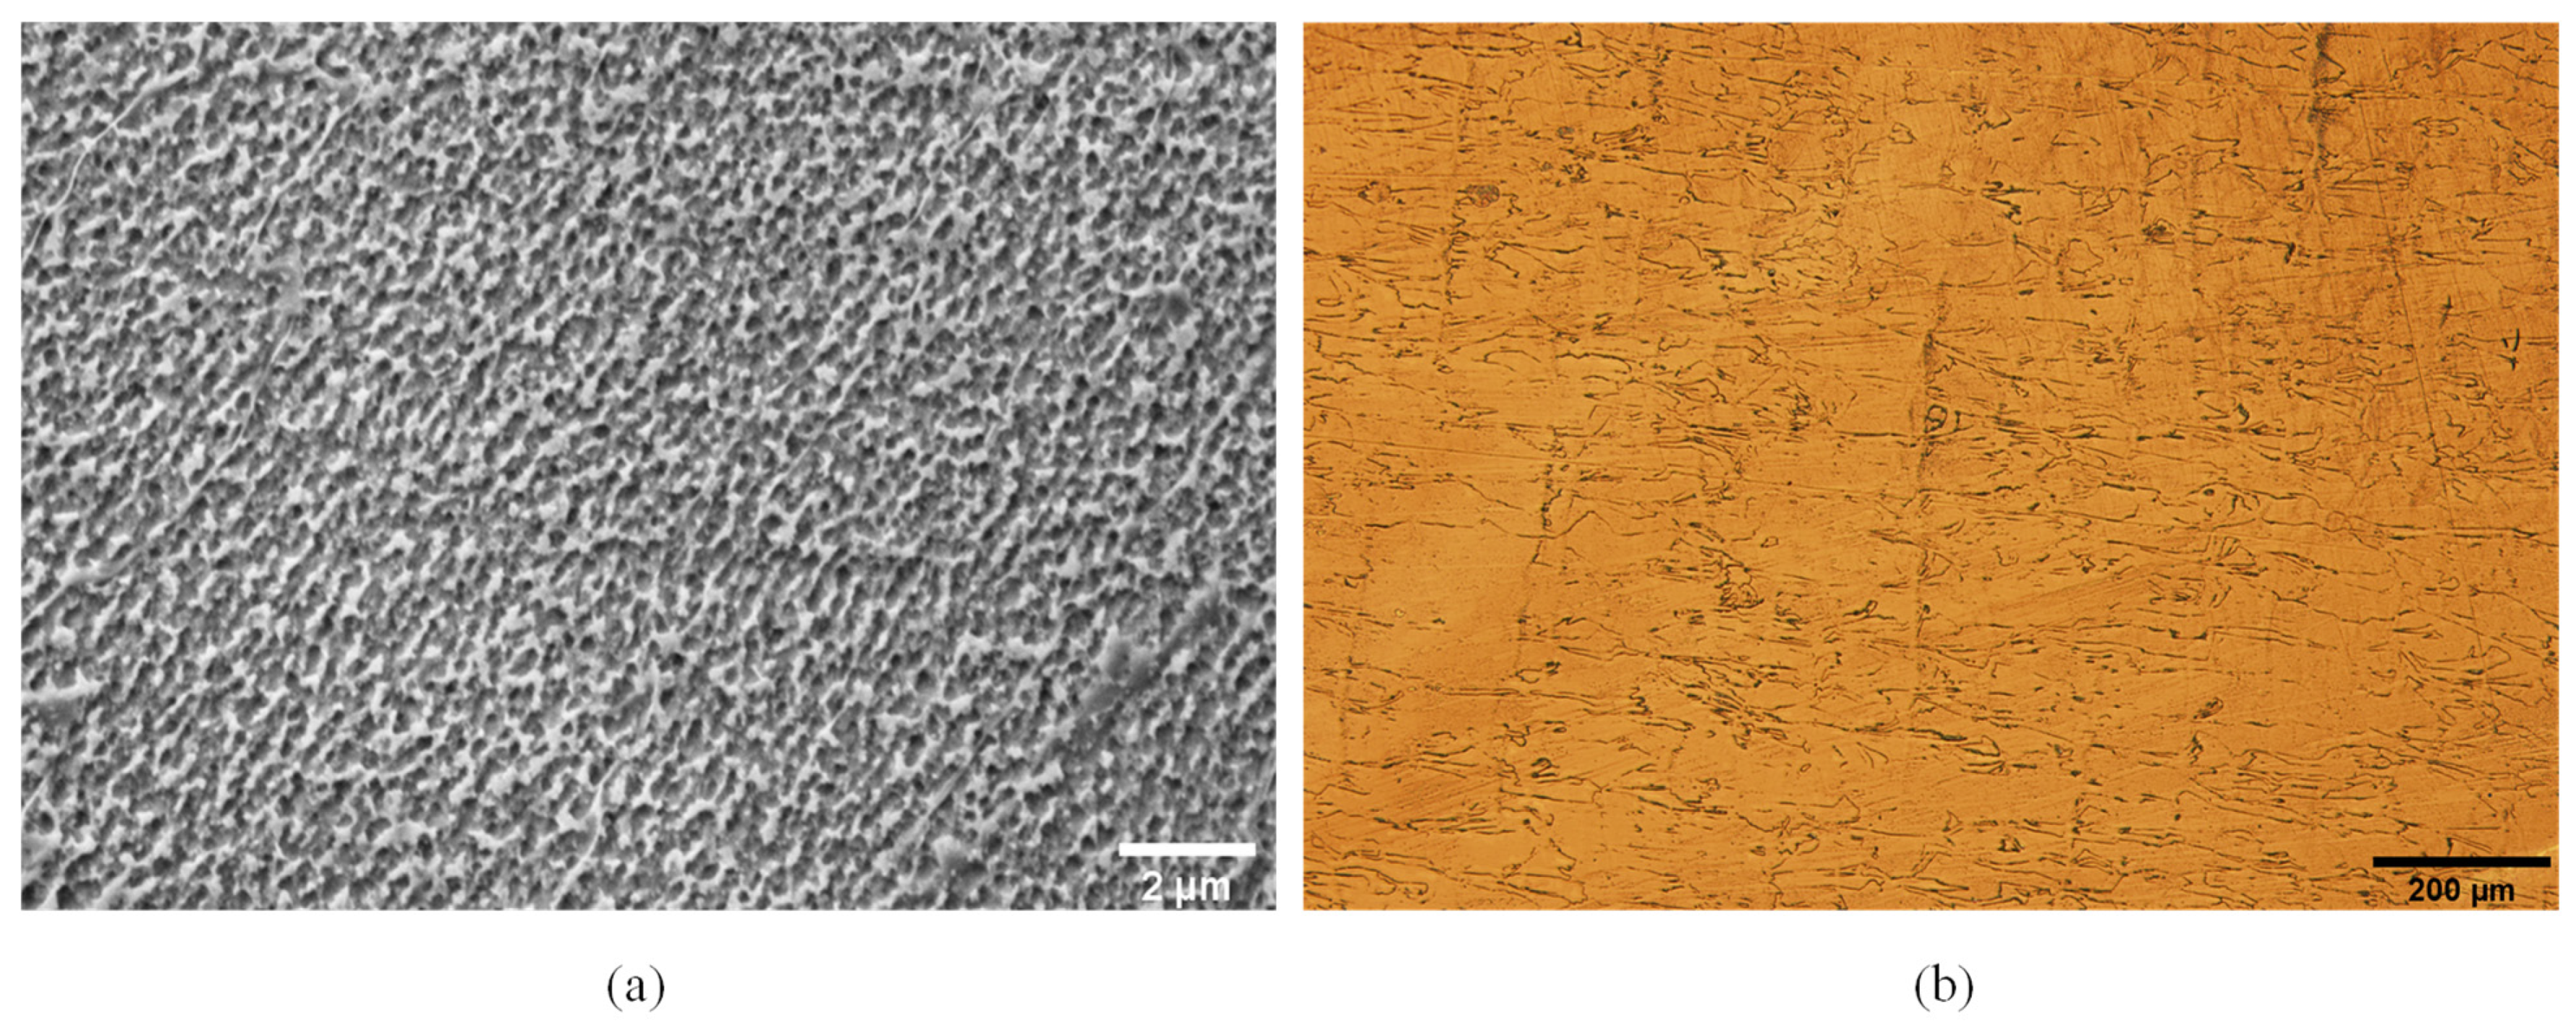
3.3. Microstructure Analysis
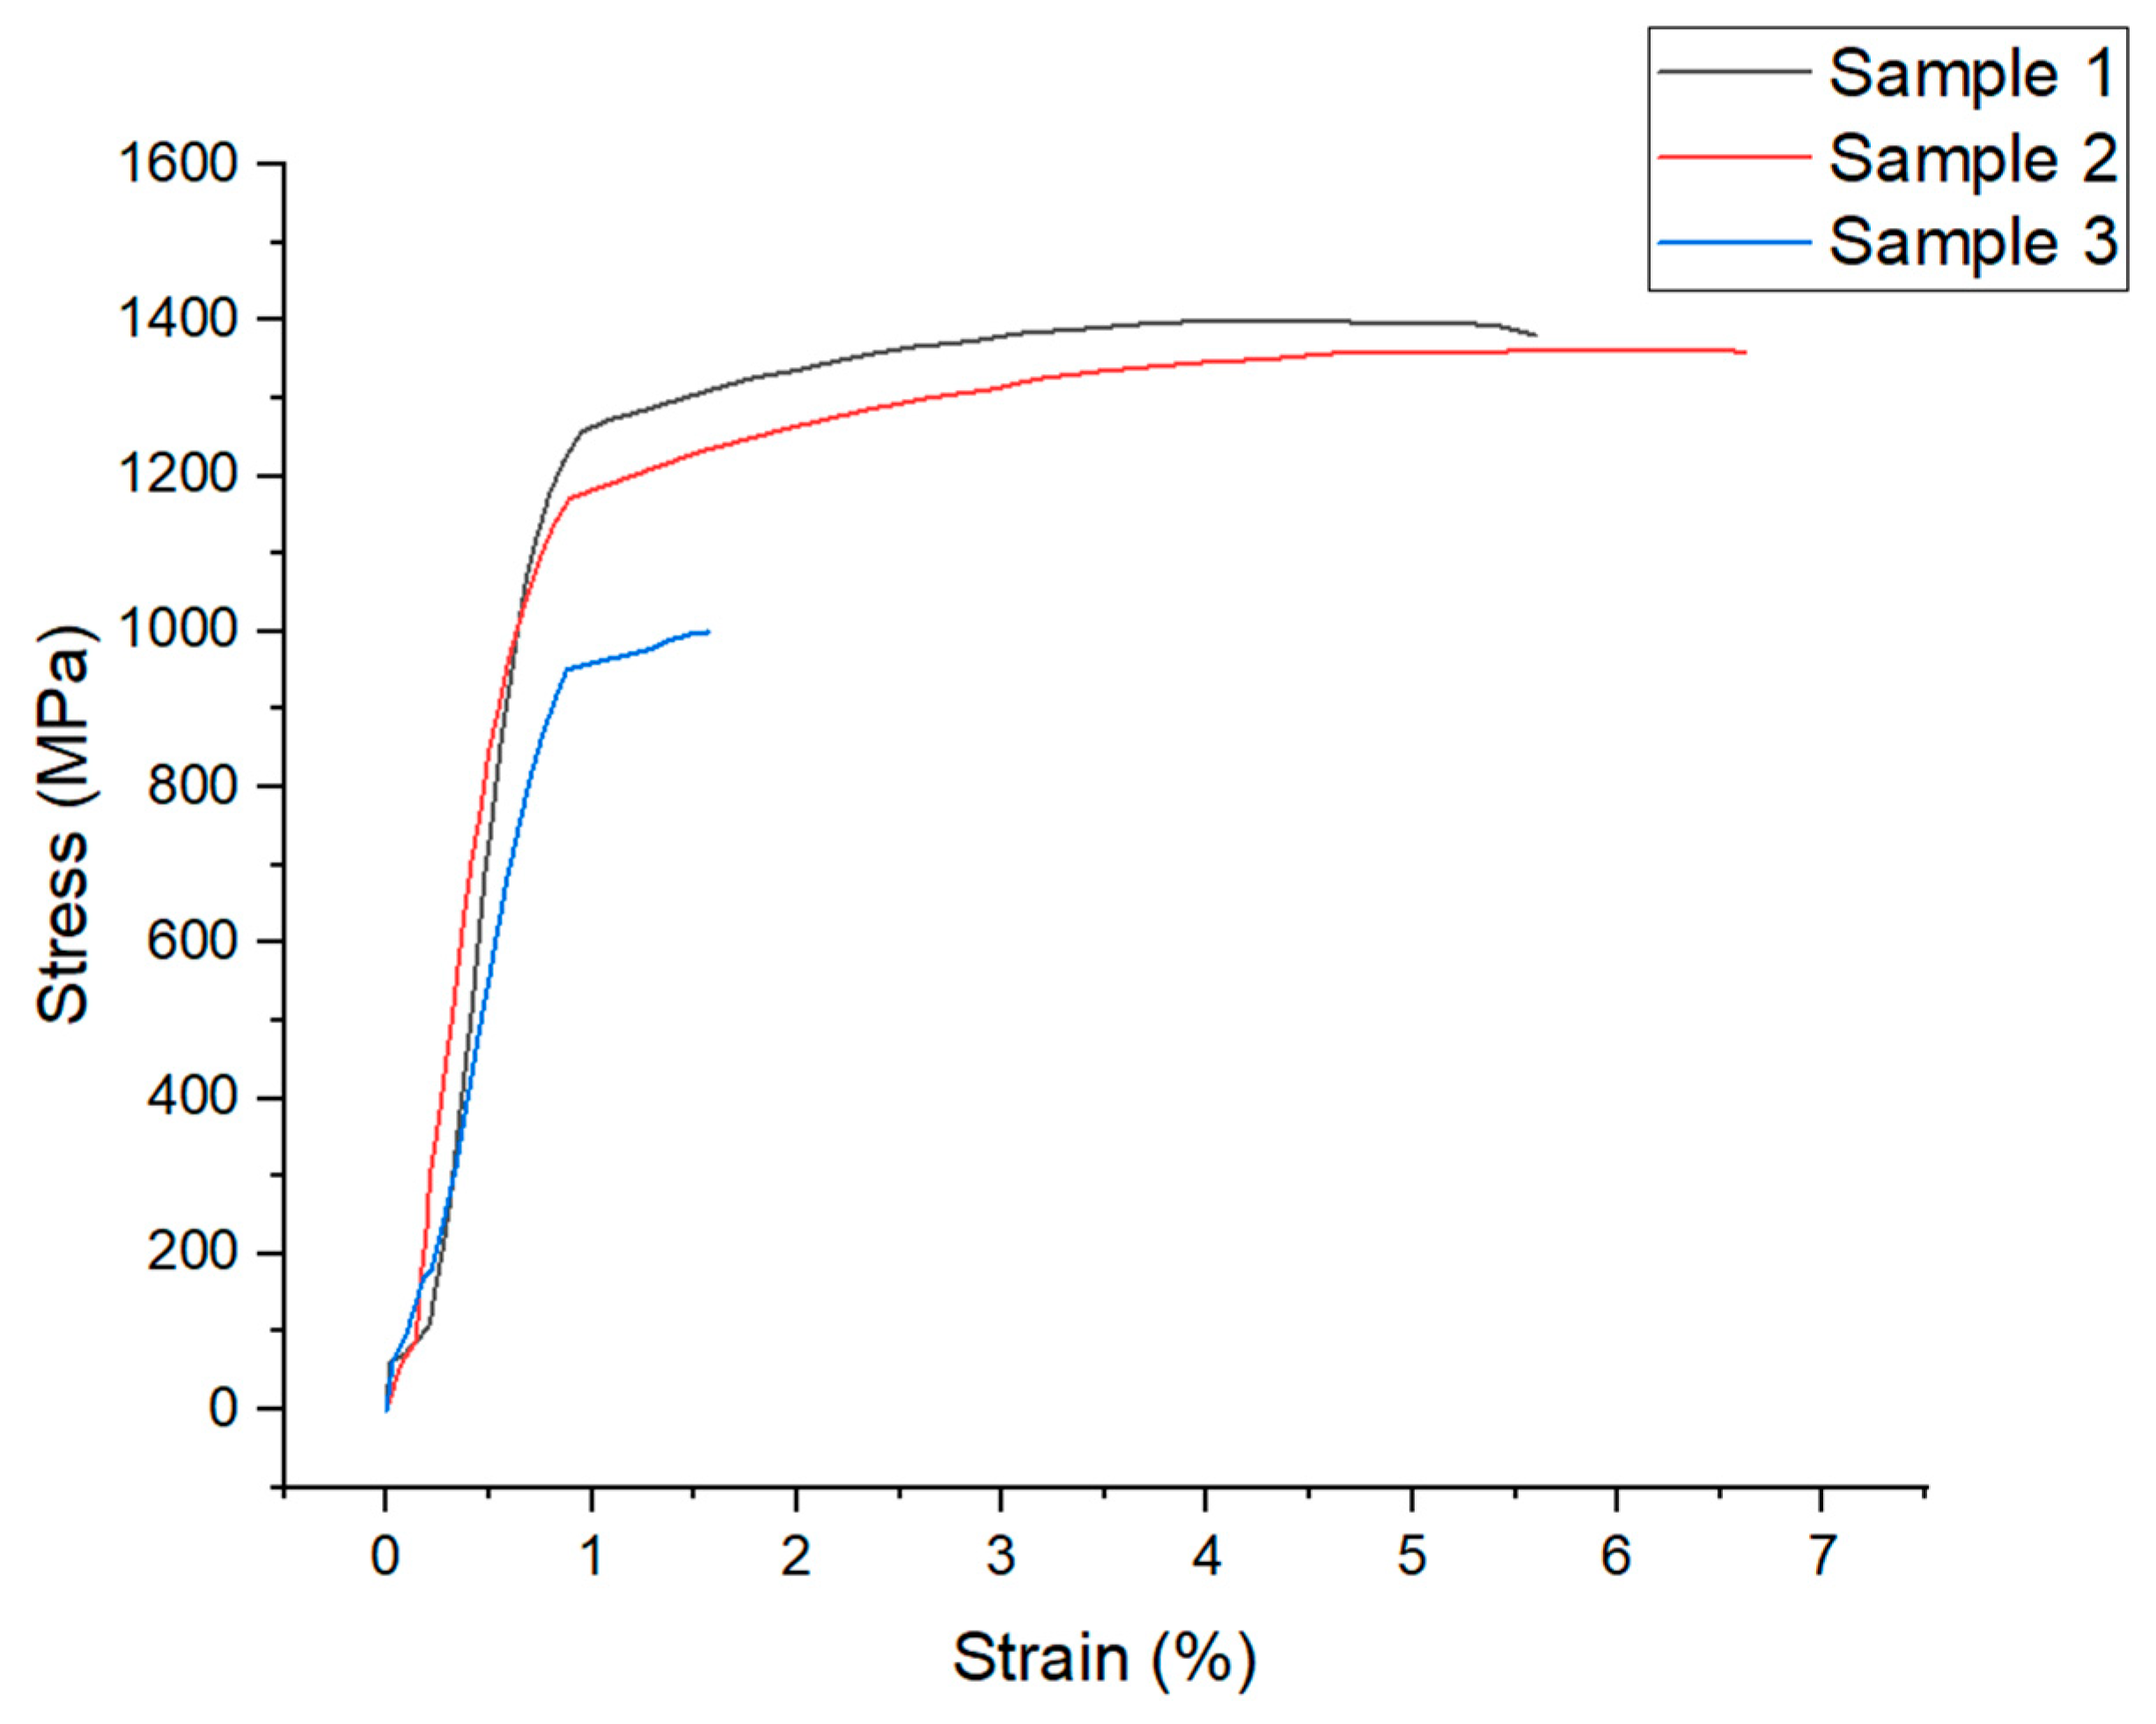
3.4. Tensile Strength Analysis
4. Conclusions
- (1)
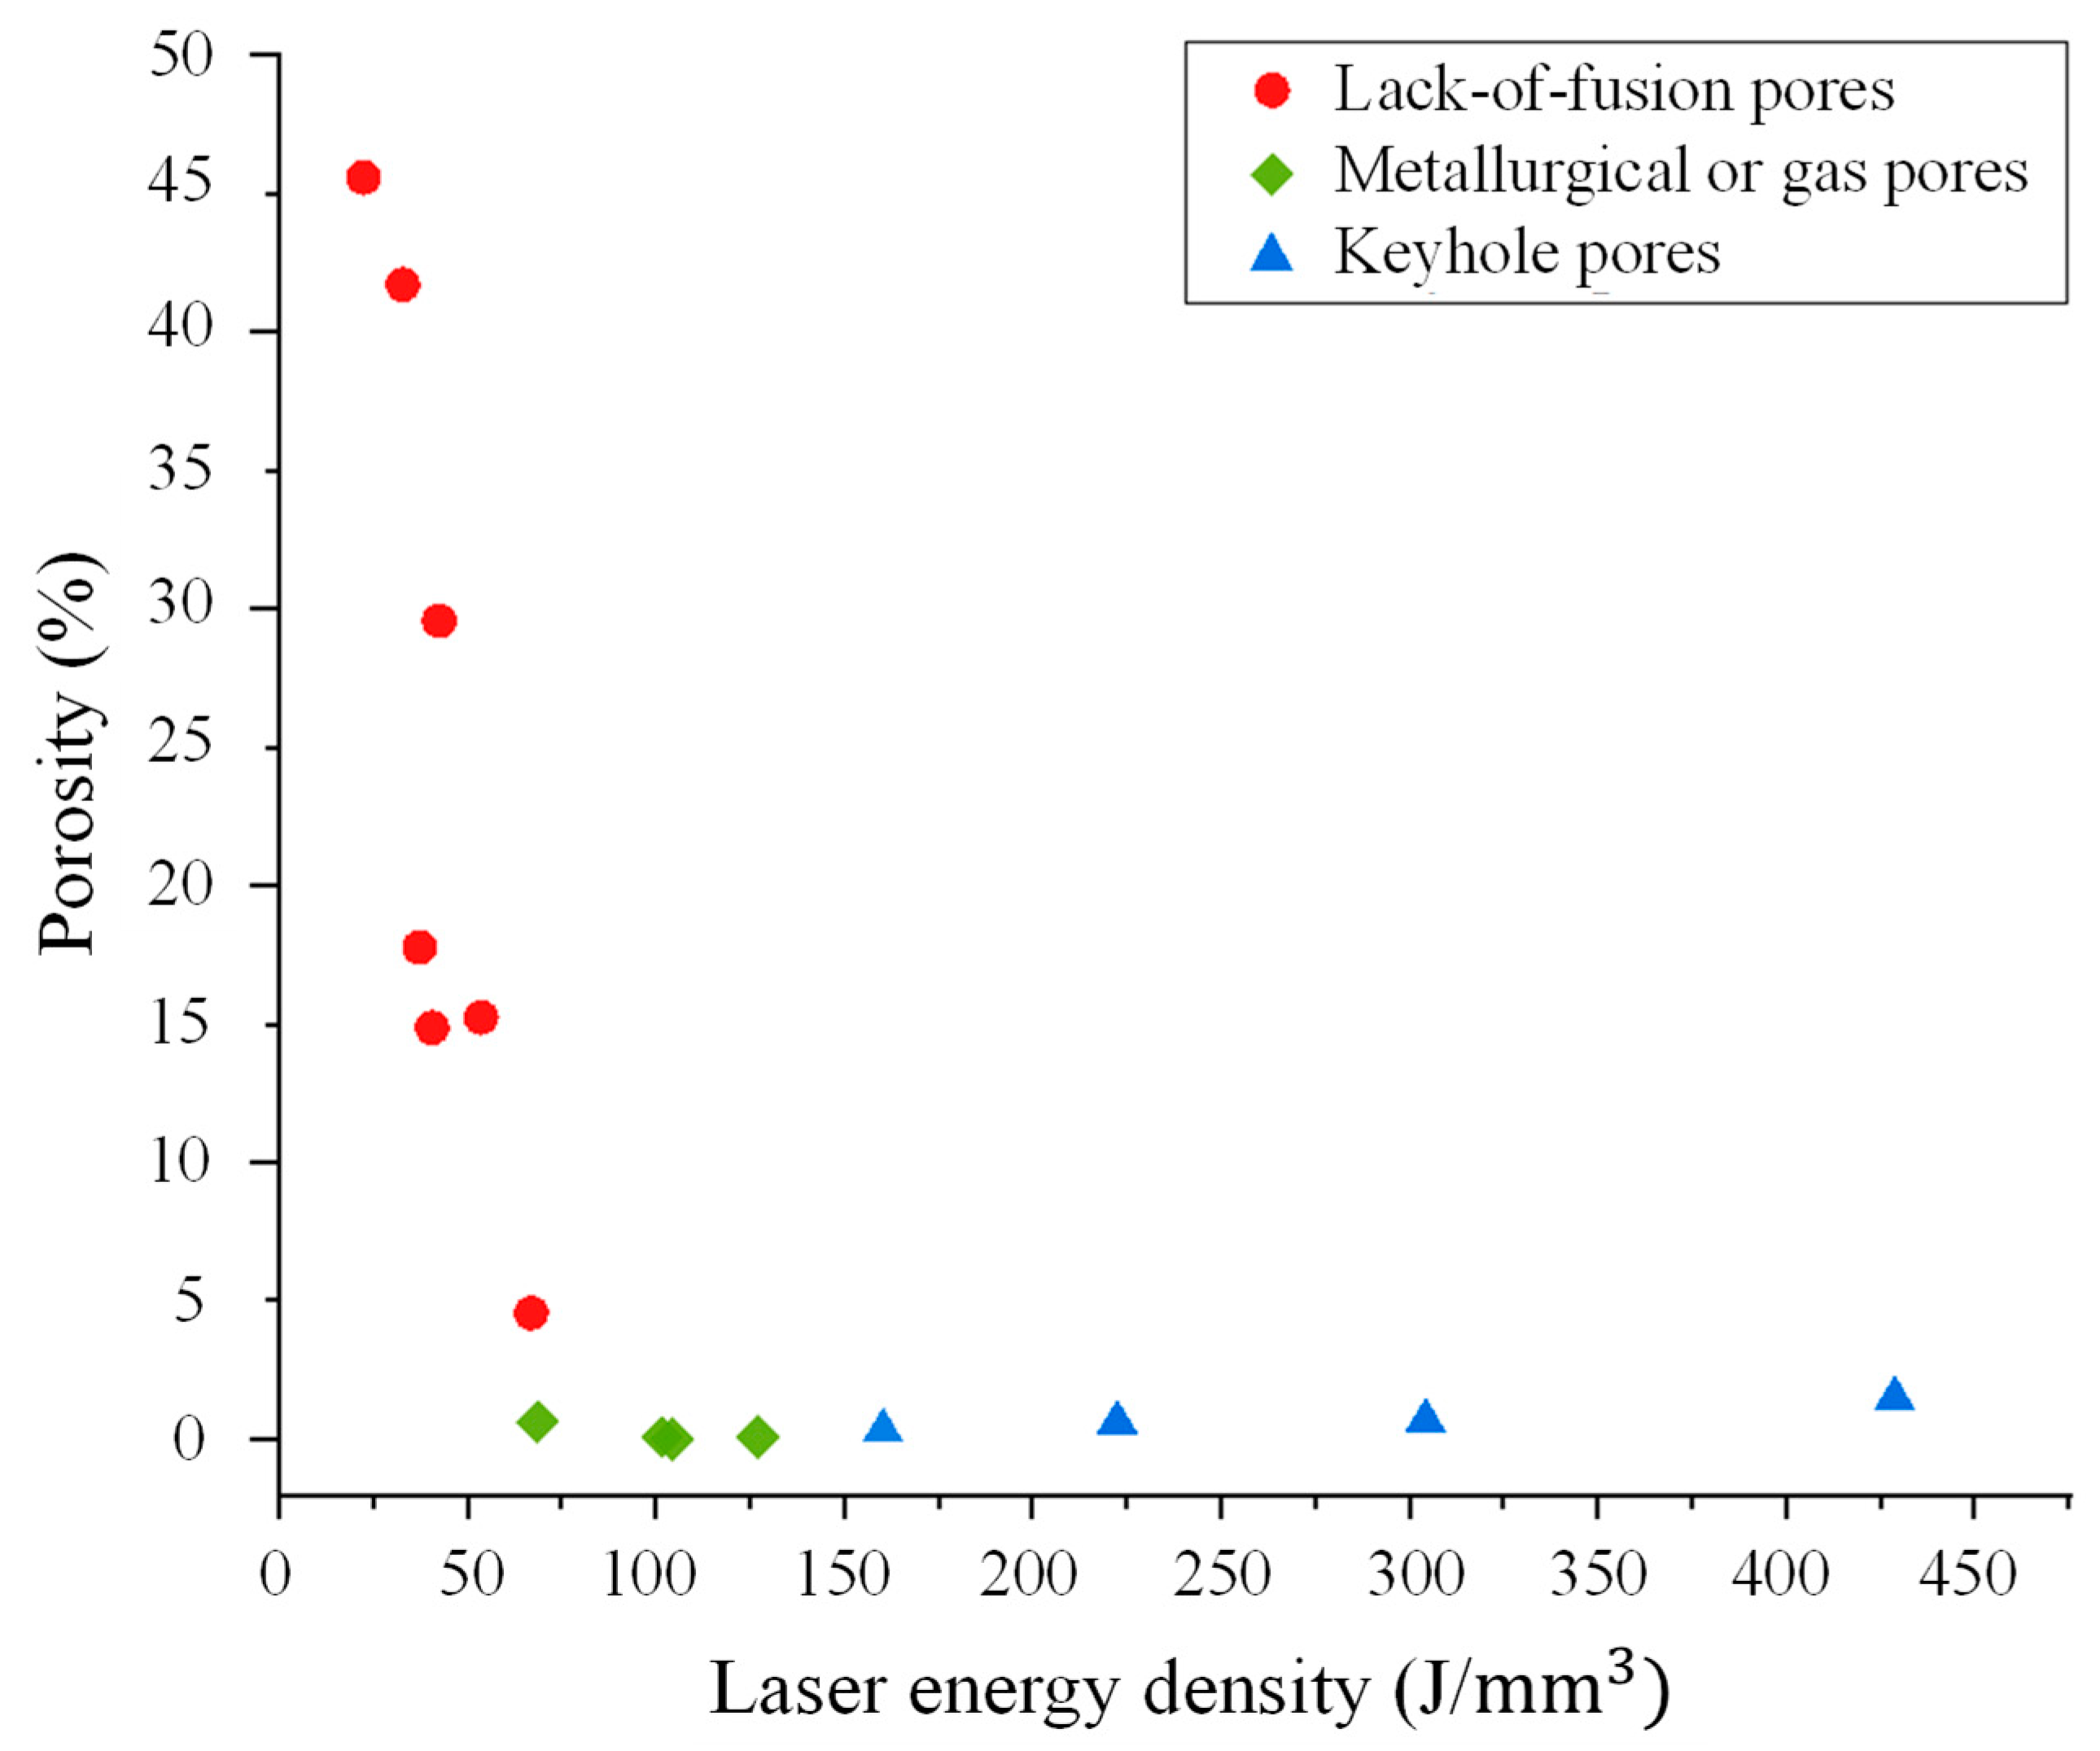
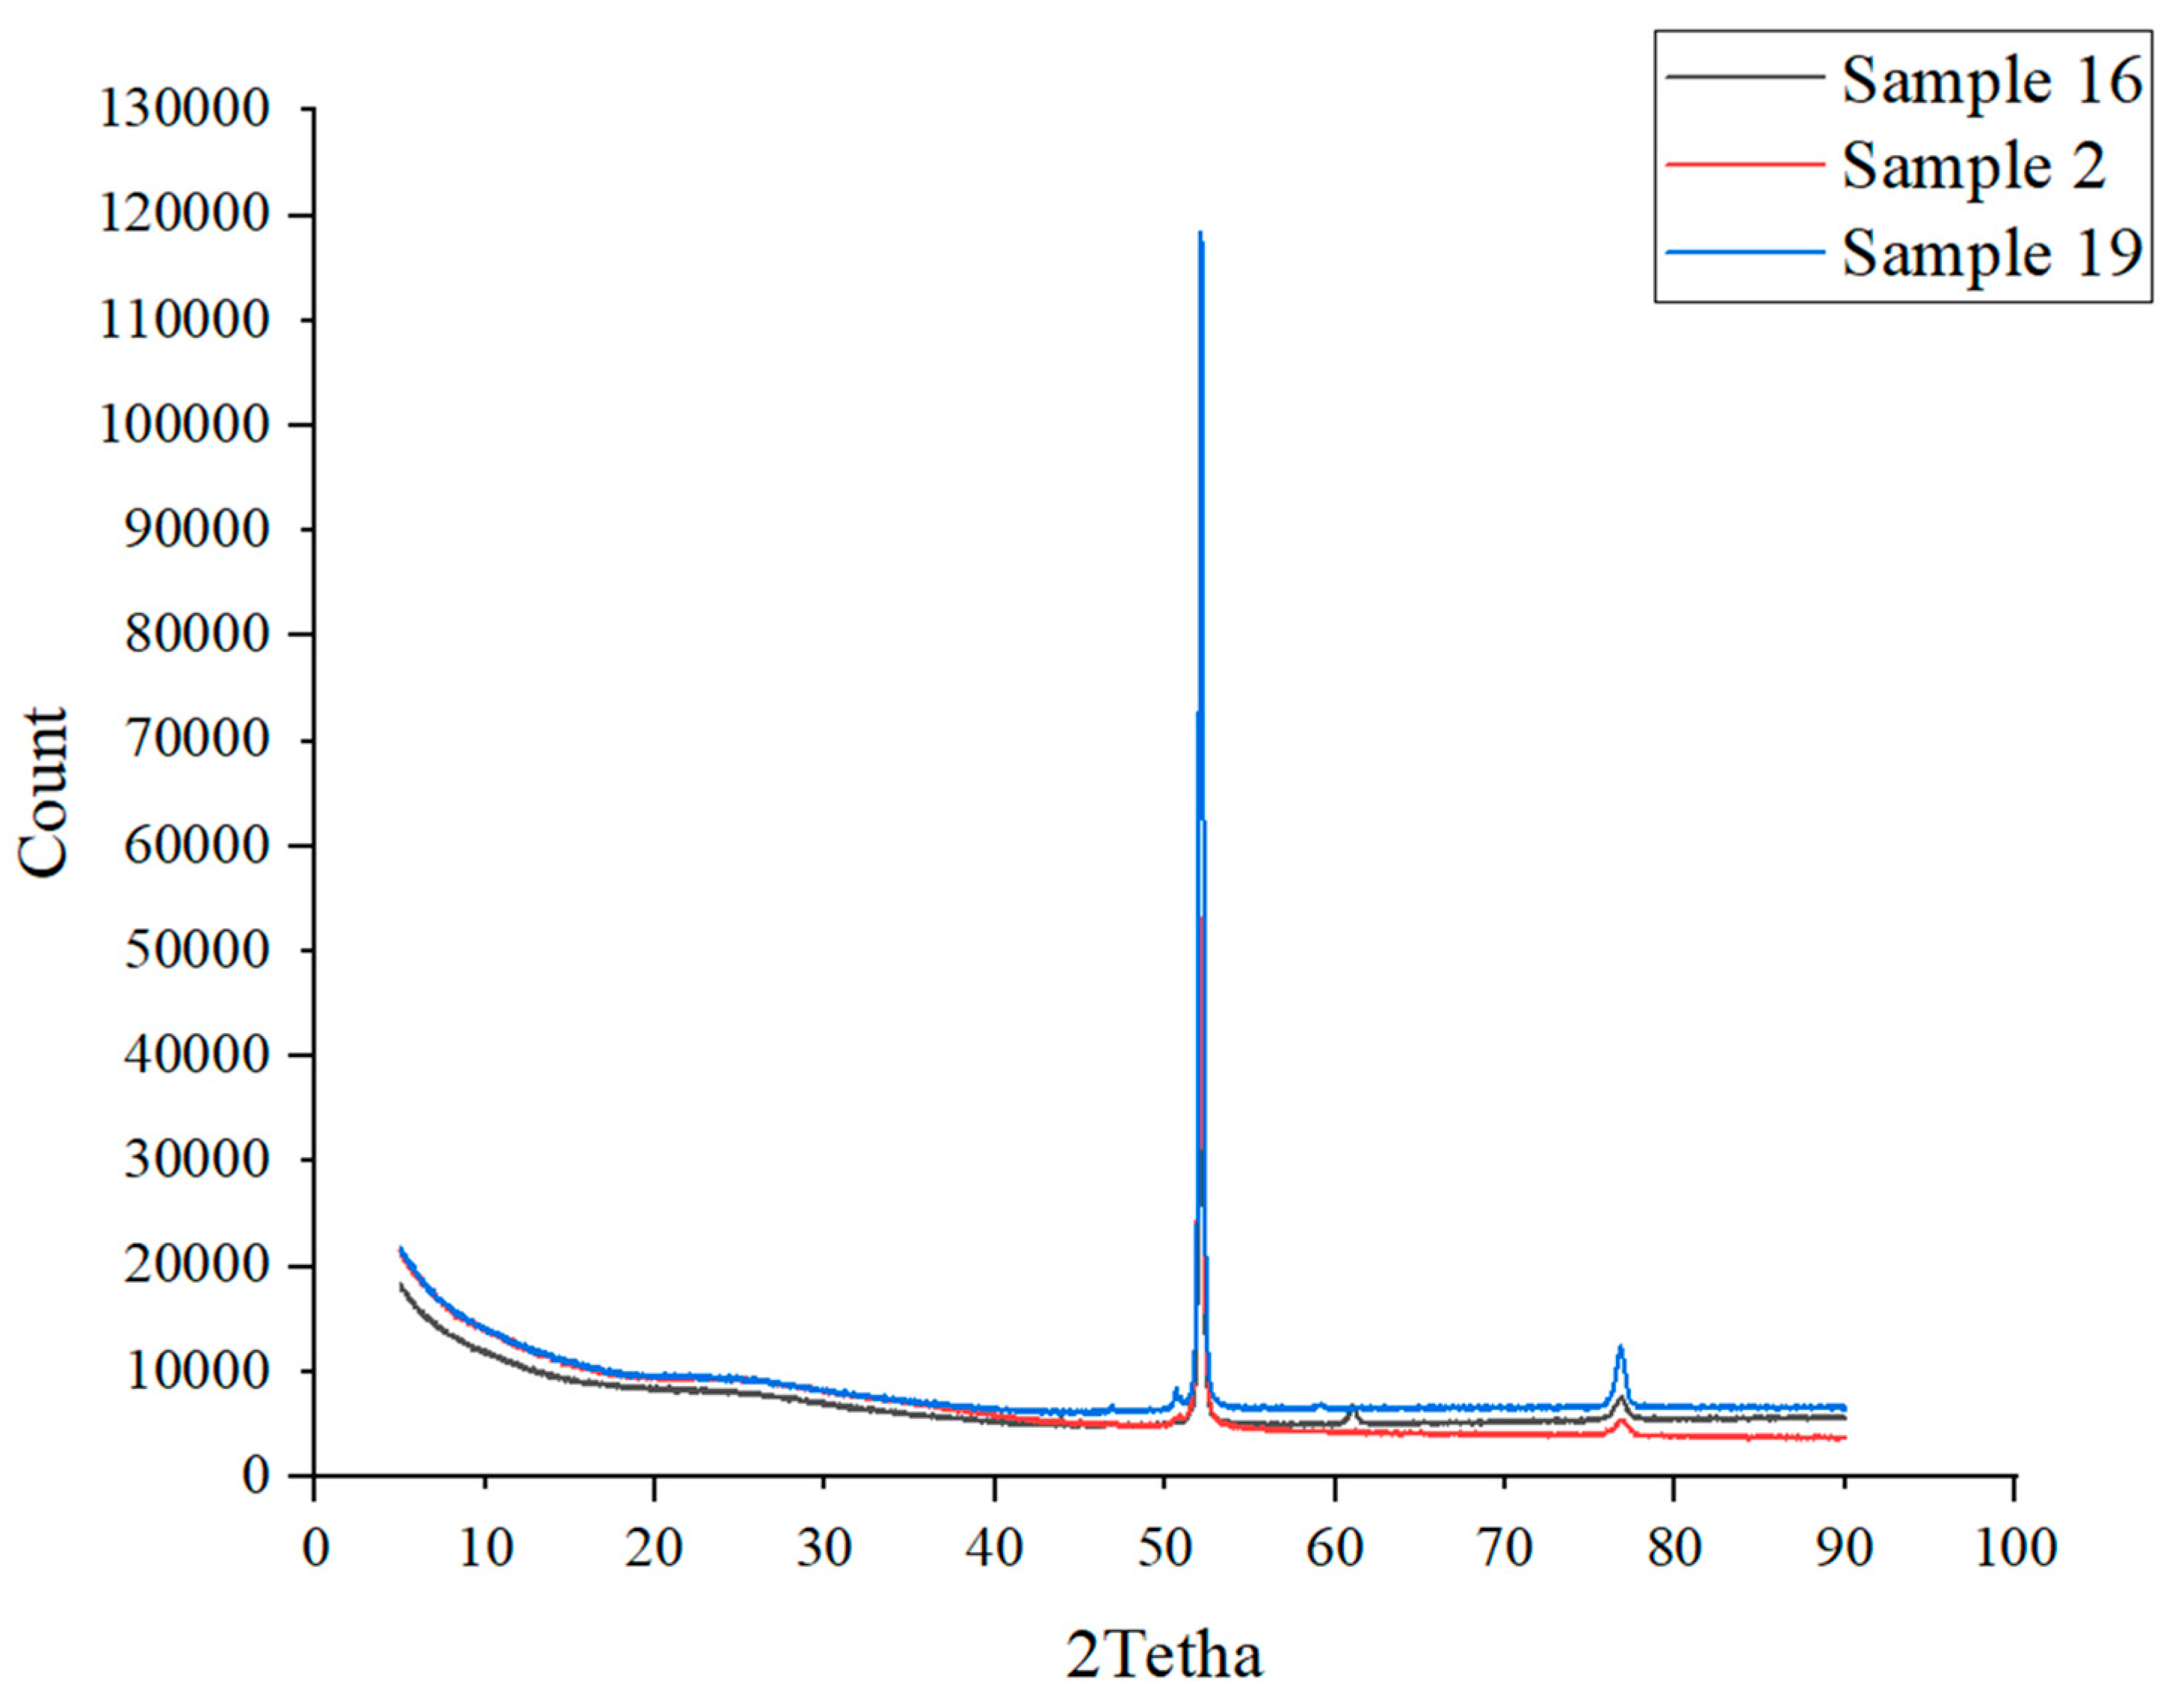
- Being the most prevalent pore types associated with the printing process parameters—the lack-of-fusion, gas or metallurgical, and keyhole pore regimes were identified for 2507 SDSS at energy density ranges from 22.22 J/mm3 to 68.24 J/mm3, 68.24 J/mm3 to 126.67 J/mm3, and 126.67 J/mm3 to 428.87 J/mm3, respectively, with corresponding porosity ranges from 45.60% to 4.61%, 0.33% to 0.04%, and 0.15% to 1.56%.
- (2)
- A sharp decrease in the lack-of-fusion porosity is observed at low energy densities, where increasing the energy density from 22.22 J/mm3 to 68.24 J/mm3 resulted in a porosity decrease from 45.60% to 0.33%. Conversely, a gradual increase in the keyhole porosity from 0.15% to 1.56% is observed at higher energy densities from 126.67 J/mm3 to 428.87 J/mm3, respectively.
- (3)
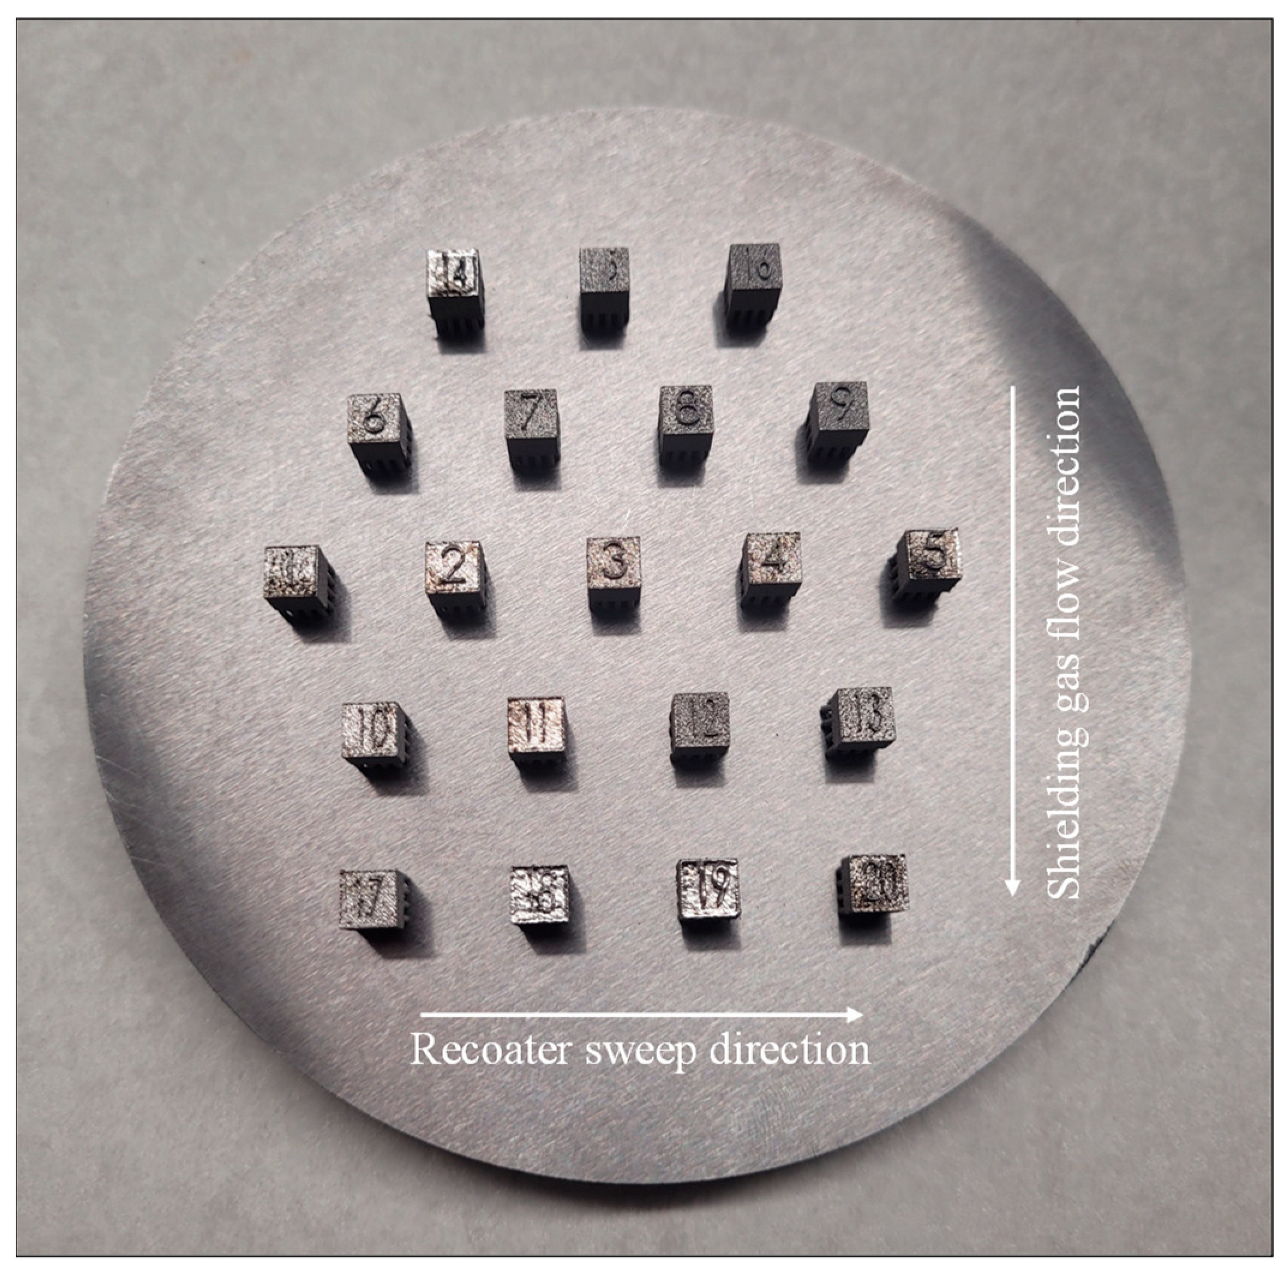
- The sample’s position from the shielding gas and coater sweep directions can influence the resulting sample porosity. Positioning the samples far from both directions can adversely influence the sample’s density. However, the position influence seems to be more significant from the shielding gas than the coater sweep.
- (4)
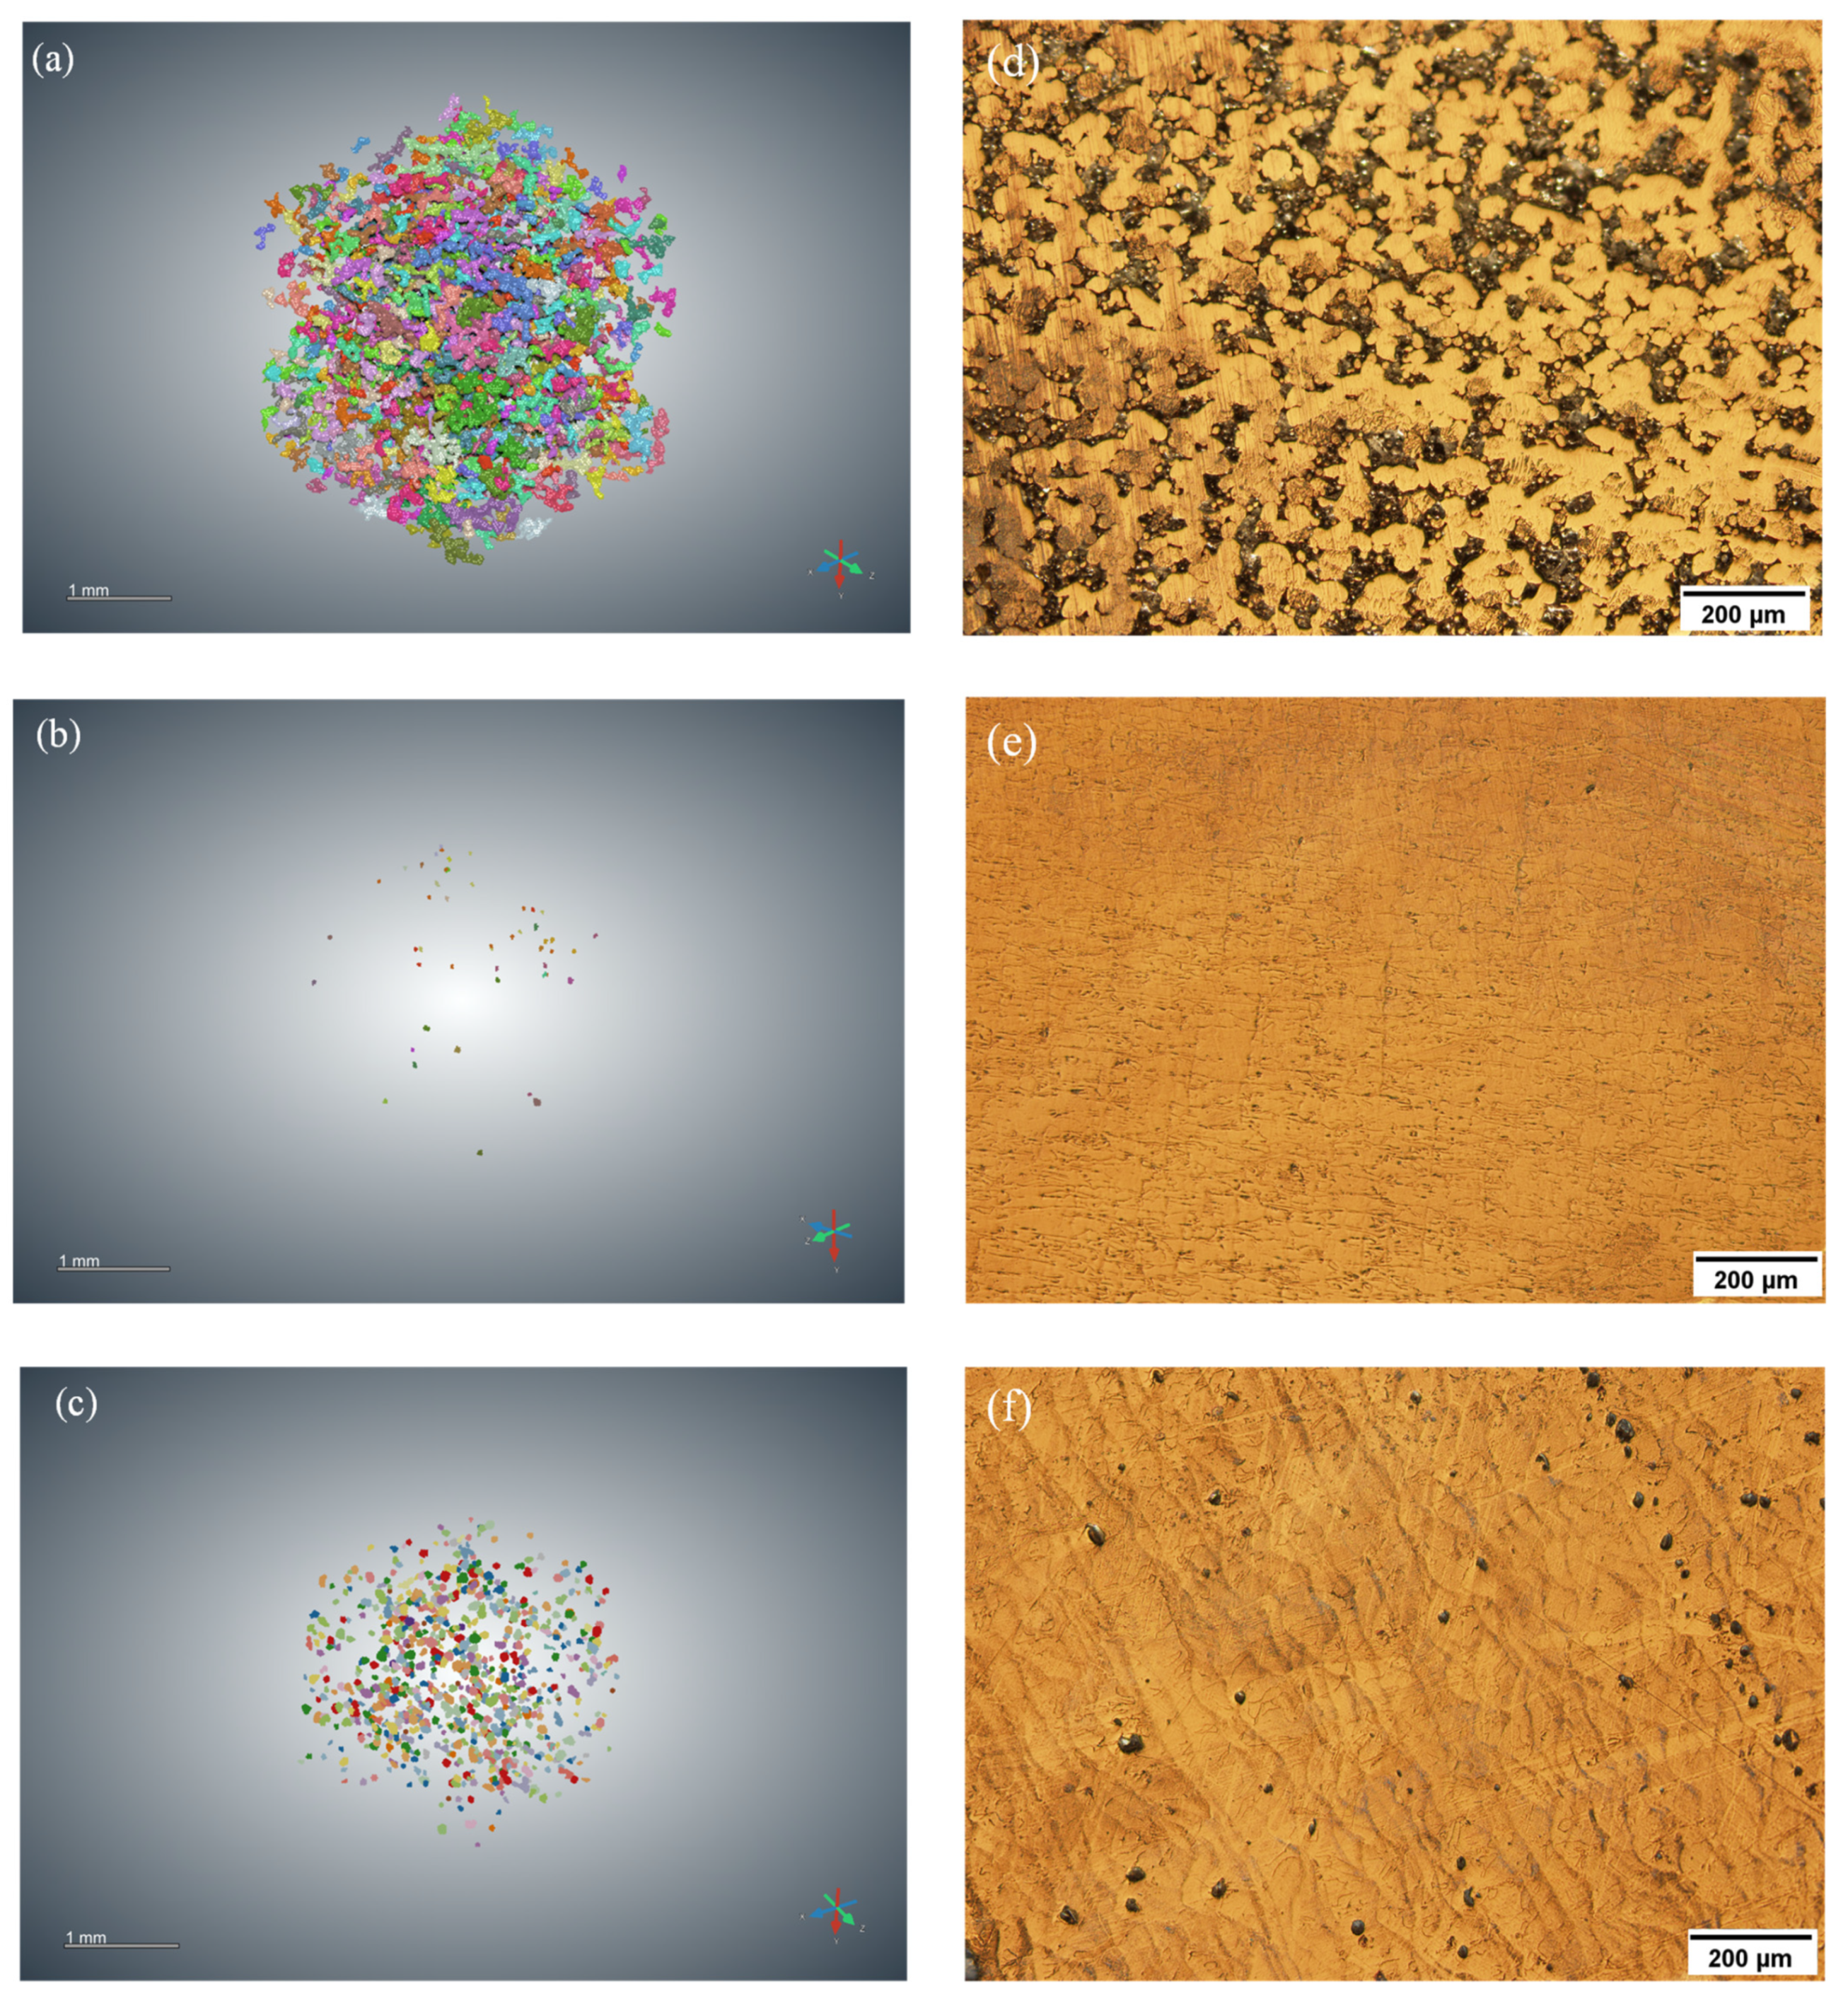
- The lack-of-fusion pores are relatively larger in size than the gas/metallurgical and keyhole pores, with mean ferret diameters of 0.26 mm, 0.05 mm, and 0.09 mm, respectively. Moreover, regarding the pore shape, the lack-of-fusion pores were observed to be irregular, with a mean aspect ratio of 0.33. Although the gas/metallurgical and keyhole pores showed roundish shapes. However, the gas/metallurgical pores were observed to be more spherical than keyhole pores, with, respectively, mean aspect ratios of 0.65 and 0.57.
- (5)
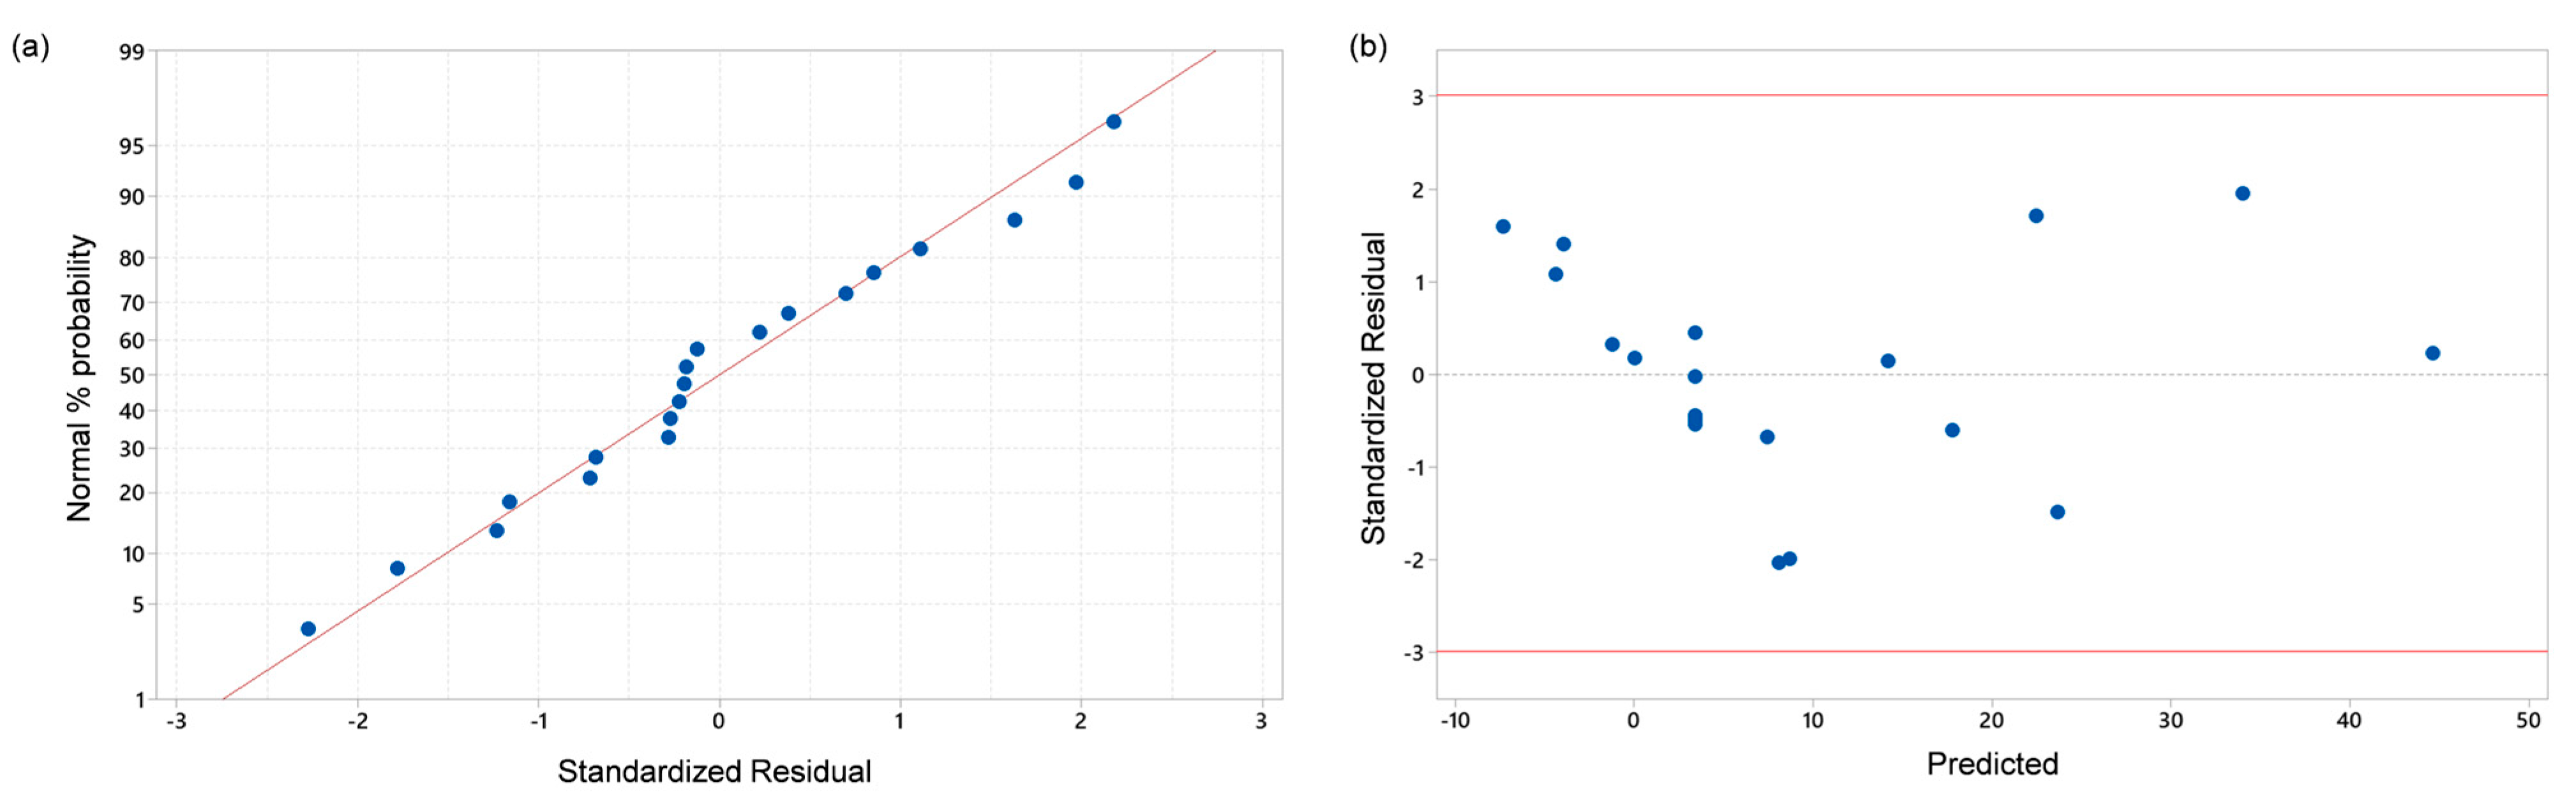
- A quadratic regression model between the input factors and the resulting porosity has been developed using the RSM. Model adequacy and accuracy checking has been conducted which indicated that the model satisfies the residual normality and constant variance assumptions with an RMSE and MAE of 4.735% and 3.917%, respectively.
- (6)
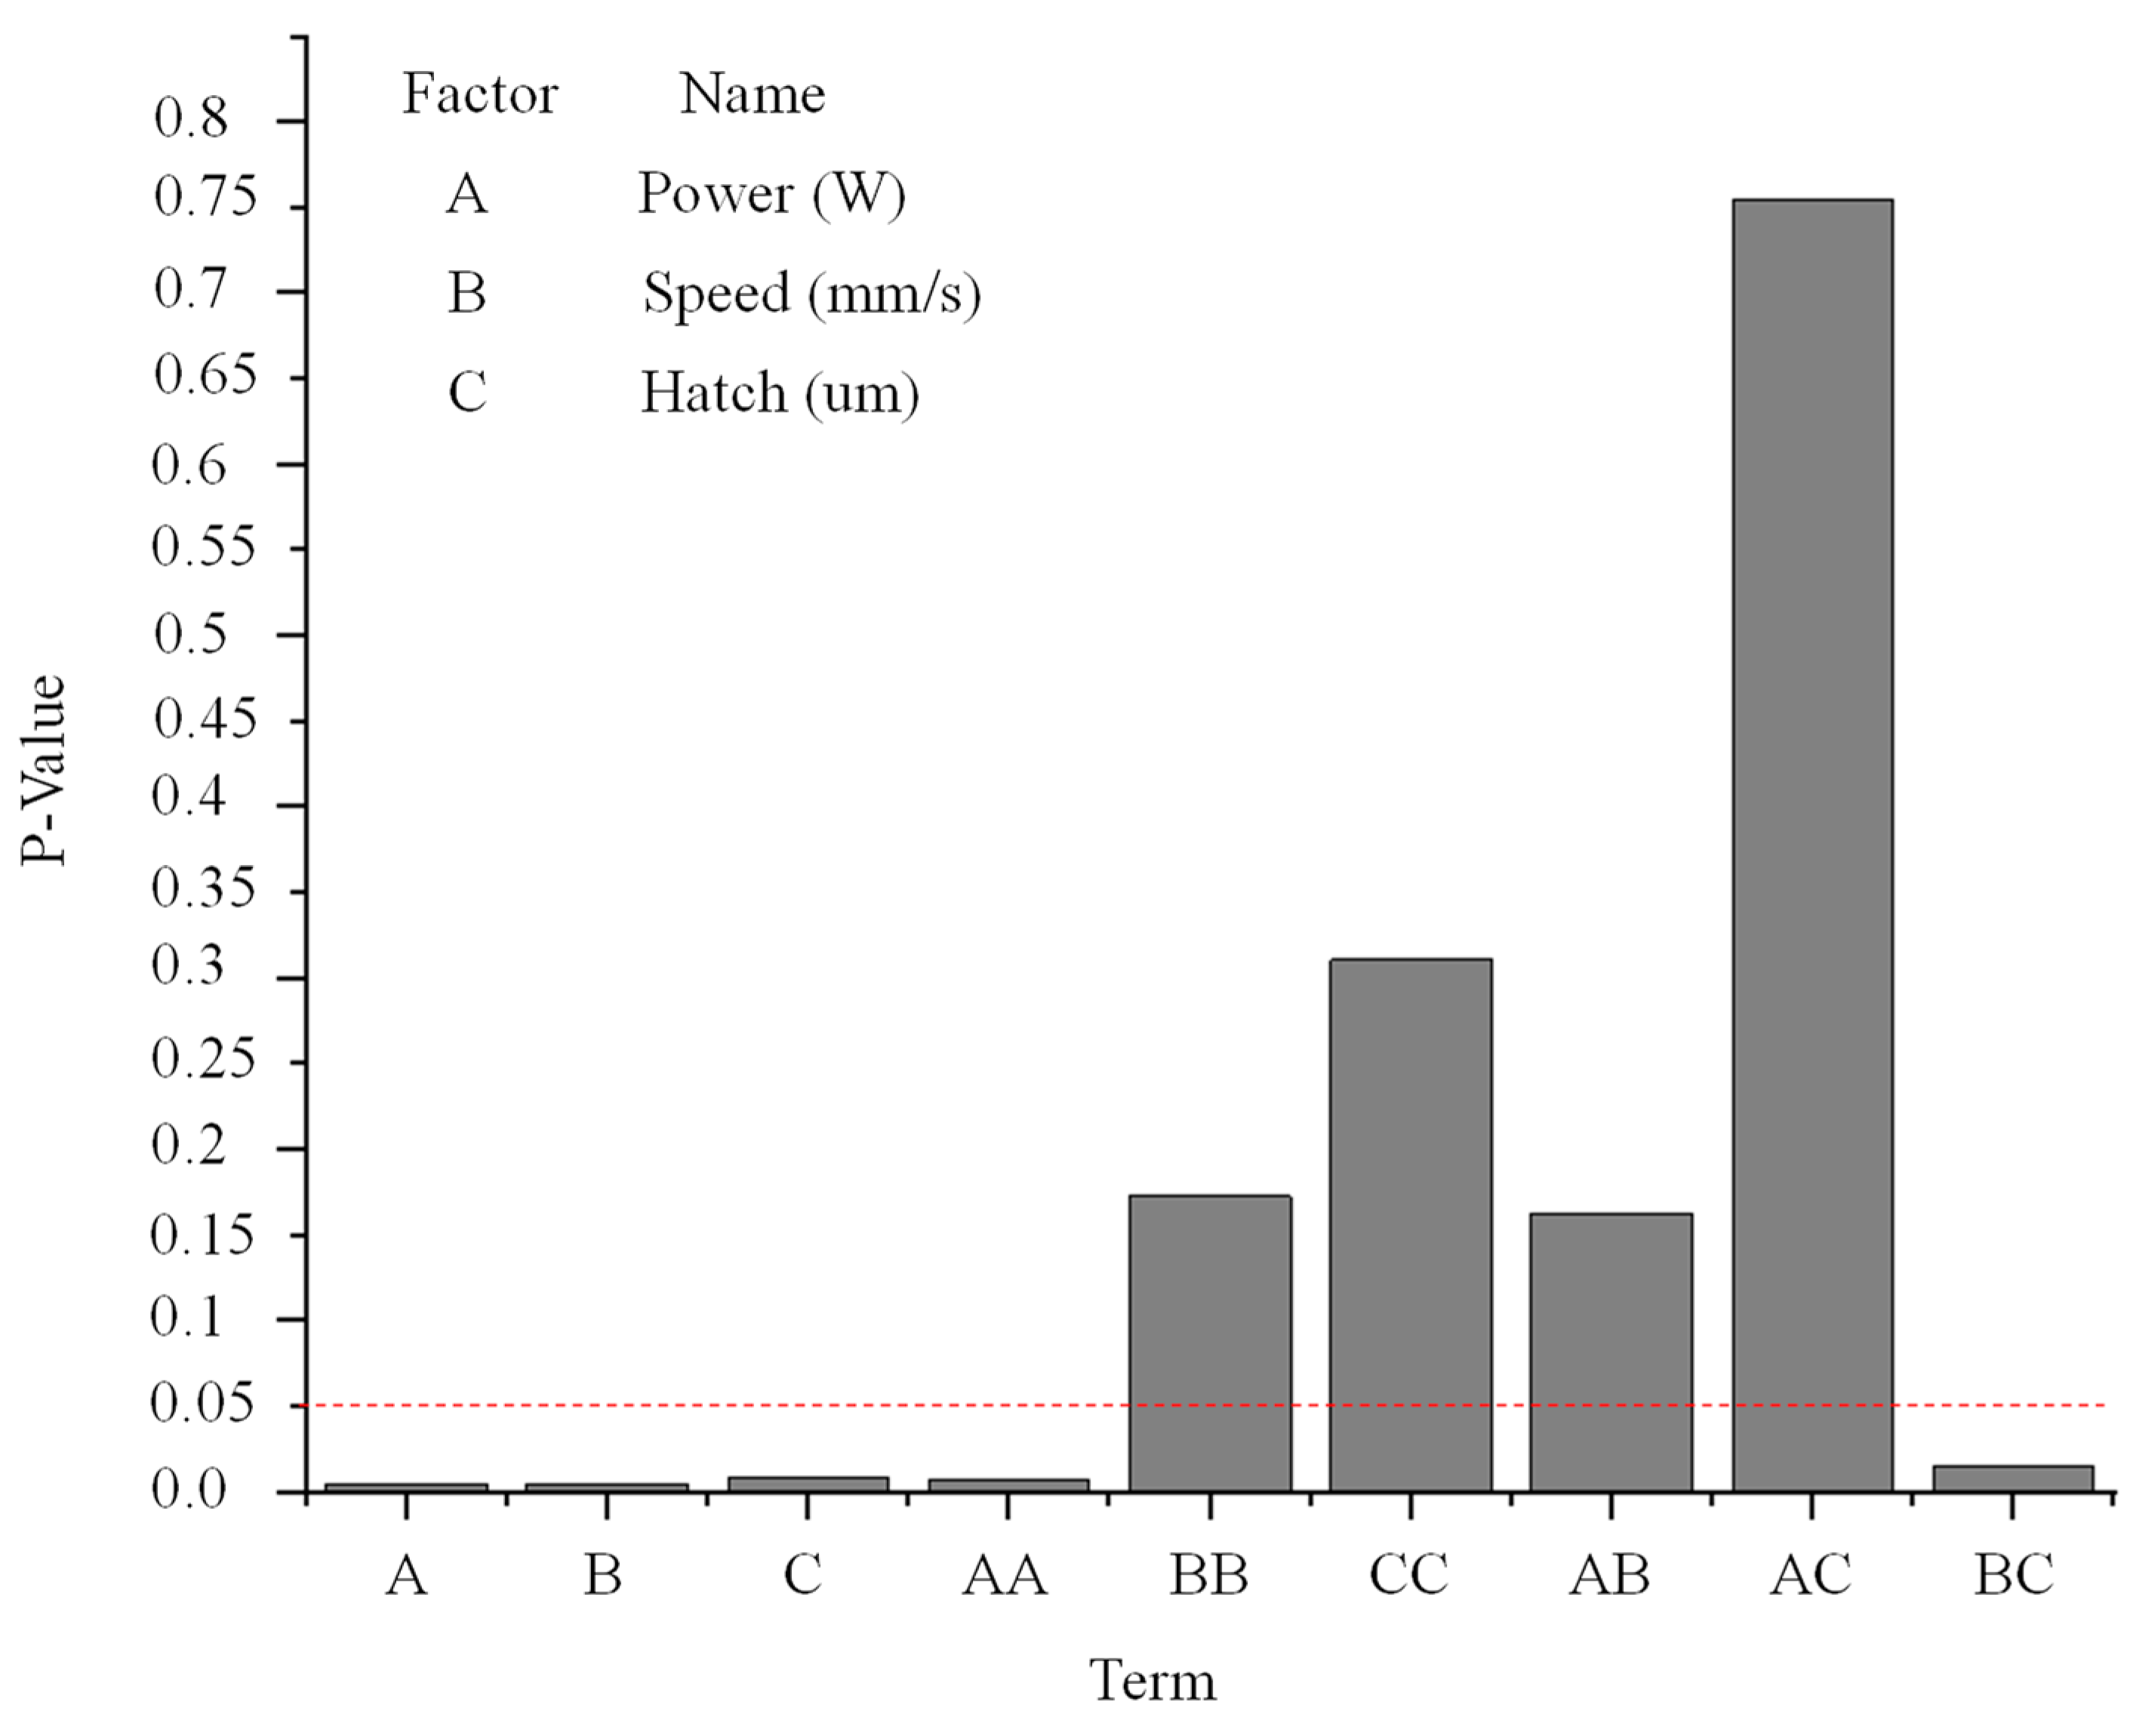
- The ANOVA analysis results showed that the linear terms of laser power, scan speed, and hatch distance were statistically significant, with p-values of 0.001, 0.001, and 0.004, respectively. However, the input factor non-linear effects were only observed to be significant for the laser power with a p-value of 0.003. Moreover, the factor interaction influence on the porosity was only observed to be significant for speed and hatch factors with a p-value of 0.011.
- (7)
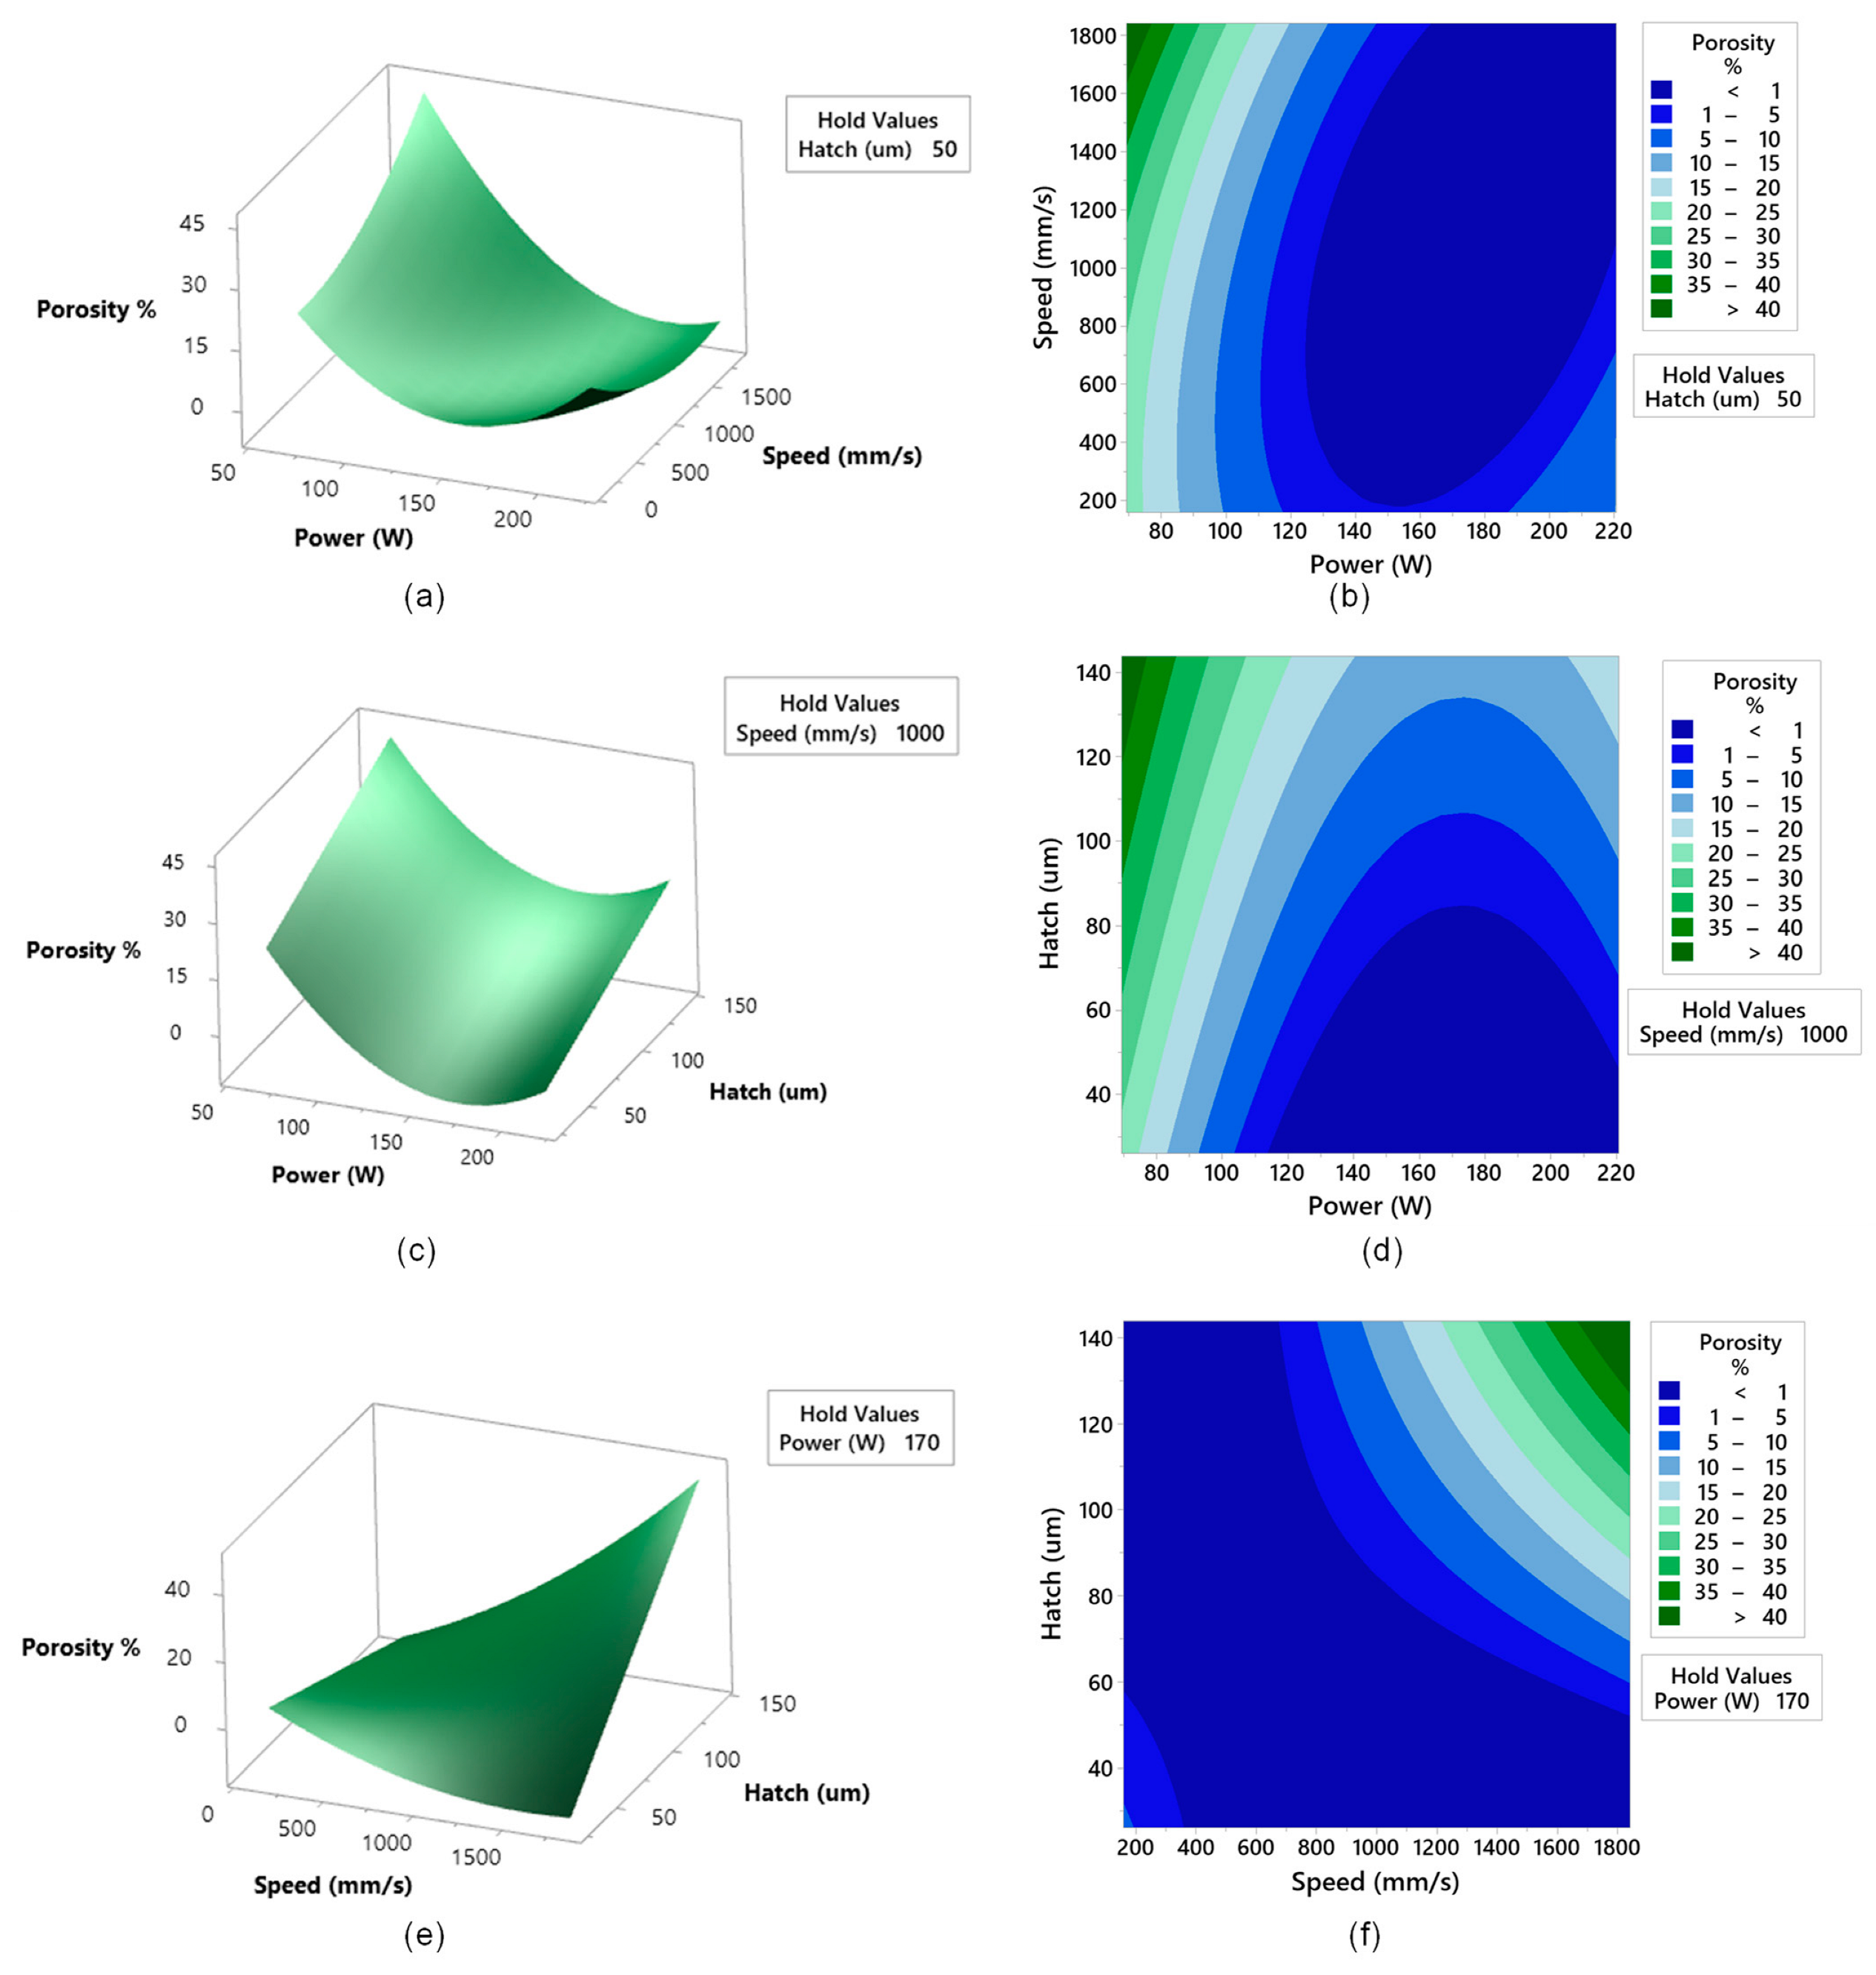
- The influence of each input parameter on the porosity was investigated using 3D surface and contour plots. Regarding power vs. speed plots, it was observed that low laser powers coupled with high scan speeds resulted in a high porosity profile. Although a reduction in the porosity is seen with increasing the laser power while decreasing the scan speed; however, extreme high laser powers coupled with low scan speeds were observed to increase the porosity due to the formation of keyhole pores at higher energy densities.
- (8)
- The power vs. hatch plots showed that high porosities are present when having a combination of low laser power and high hatch distance. Moreover, it was observed that higher hatch distances should be avoided to prevent insufficient laser overlap leading to poor melting of the powder.
- (9)
- The speed vs. hatch plots indicated that higher porosities are seen when having higher scan speeds coupled with high hatch distances. Although decreasing the scan speed and hatch distance results in a reduction in the porosity; however, setting extremely low scan speeds and hatching distances is observed to increase the porosity, which is attributed to the resulting high energy densities.
- (10)
- The optimized parameters for laser power, scan speed, and hatch distance were 217.4 W, 1735.7 mm/s, and 51.3 µm, respectively, which were able to print samples with a relative density of 99.961%.
- (11)
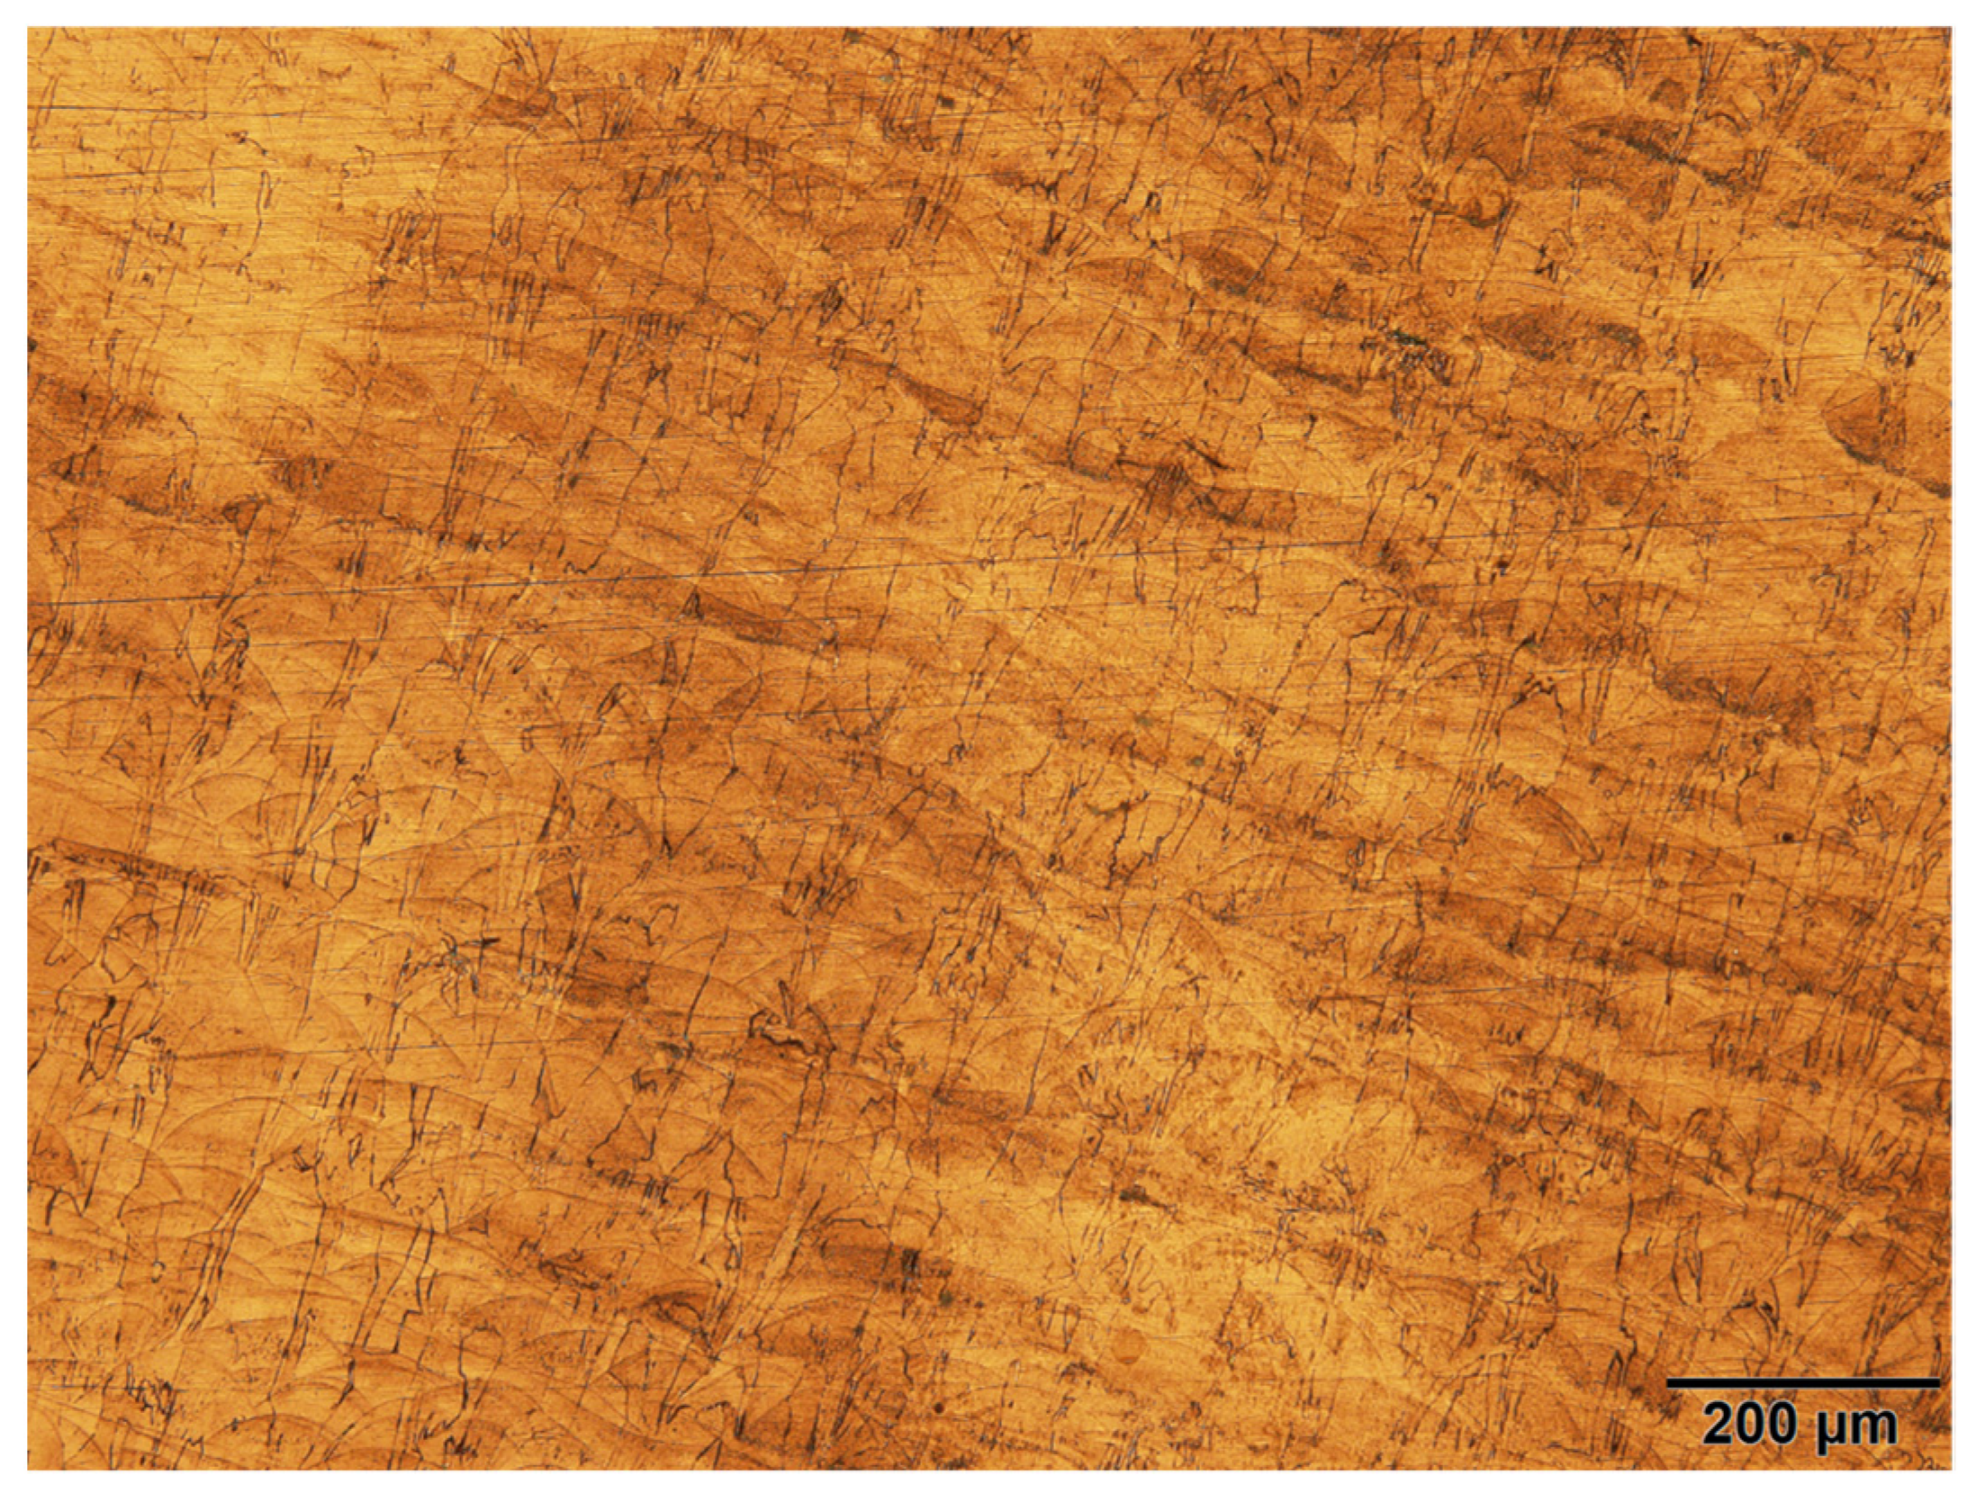
- Using the optimized parameter set, the as-built 2507 SDSS sample had a ferrite phase fraction of 89.3% with a yield and ultimate tensile strength of 1115.4 ± 120.7 MPa and 1256.7 ± 181.9 MPa, respectively.
Author Contributions
Funding
Data Availability Statement
Conflicts of Interest
References
- Tan, J.H.; Wong, W.L.E.; Dalgarno, K.W. An overview of powder granulometry on feedstock and part performance in the selective laser melting process. Addit. Manuf. 2017, 18, 228–255. [Google Scholar] [CrossRef] [Green Version]
- DebRoy, T.; Wei, H.L.; Zuback, J.S.; Mukherjee, T.; Elmer, J.W.; Milewski, J.O.; Beese, A.M.; Wilson-Heid, A.; De, A.; Zhang, W. Additive manufacturing of metallic components–Process, structure and properties. Prog. Mater. Sci. 2018, 92, 112–224. [Google Scholar] [CrossRef]
- Gu, D.D.; Meiners, W.; Wissenbach, K.; Poprawe, R. Laser additive manufacturing of metallic components: Materials, processes and mechanisms. Int. Mater. Rev. 2012, 57, 133–164. [Google Scholar] [CrossRef]
- Herzog, D.; Seyda, V.; Wycisk, E.; Emmelmann, C. Additive manufacturing of metals. Acta Mater. 2016, 117, 371–392. [Google Scholar] [CrossRef]
- Bourell, D.; Kruth, J.P.; Leu, M.; Levy, G.; Rosen, D.; Beese, A.M.; Clare, A. Materials for additive manufacturing. CIRP Ann. 2017, 66, 659–681. [Google Scholar] [CrossRef]
- Schmidt, M.; Merklein, M.; Bourell, D.; Dimitrov, D.; Hausotte, T.; Wegener, K.; Overmeyer, L.; Vollertsen, F.; Levy, G.N. Laser based additive manufacturing in industry and academia. CIRP Ann. 2017, 66, 561–583. [Google Scholar] [CrossRef]
- Afazov, S.; Denmark, W.A.; Toralles, B.L.; Holloway, A.; Yaghi, A. Distortion prediction and compensation in selective laser melting. Addit. Manuf. 2017, 17, 15–22. [Google Scholar] [CrossRef]
- Yap, C.Y.; Chua, C.K.; Dong, Z.L.; Liu, Z.H.; Zhang, D.Q.; Loh, L.E.; Sing, S.L. Review of selective laser melting: Materials and applications. Appl. Phys. Rev. 2015, 2, 041101. [Google Scholar] [CrossRef]
- Andani, M.T.; Dehghani, R.; Karamooz-Ravari, M.R.; Mirzaeifar, R.; Ni, J. A study on the effect of energy input on spatter particles creation during selective laser melting process. Addit. Manuf. 2018, 20, 33–43. [Google Scholar] [CrossRef]
- Slotwinski, J.A.; Garboczi, E.J.; Stutzman, P.E.; Ferraris, C.F.; Watson, S.S.; Peltz, M.A. Characterization of Metal Powders Used for Additive Manufacturing. J. Res. Natl. Inst. Stand. Technol. 2014, 119, 460–493. [Google Scholar] [CrossRef]
- Qu, S.; Ding, J.; Song, X. Achieving Triply Periodic Minimal Surface Thin-Walled Structures by Micro Laser Powder Bed Fusion Process. Micromachines 2021, 12, 705. [Google Scholar] [CrossRef]
- Kempen, K. Expanding the Materials Palette for Selective Laser Melting of Metals. 2015. Available online: https://lirias.kuleuven.be/1673720?limo=0 (accessed on 10 August 2022).
- Zhang, B.; Li, Y.; Bai, Q. Defect Formation Mechanisms in Selective Laser Melting: A Review. Chin. J. Mech. Eng. 2017, 30, 515–527. [Google Scholar] [CrossRef] [Green Version]
- Gong, H.; Rafi, K.; Gu, H.; Starr, T.; Stucker, B. Analysis of defect generation in Ti–6Al–4V parts made using powder bed fusion additive manufacturing processes. Addit. Manuf. 2014, 1, 87–98. [Google Scholar] [CrossRef]
- Liu, J.; Wen, P. Metal vaporization and its influence during laser powder bed fusion process. Mater. Des. 2022, 215, 110505. [Google Scholar] [CrossRef]
- Tang, M.; Pistorius, P.C.; Beuth, J.L. Prediction of lack-of-fusion porosity for powder bed fusion. Addit. Manuf. 2017, 14, 39–48. [Google Scholar] [CrossRef]
- Cunningham, R.; Narra, S.P.; Ozturk, T.; Beuth, J.; Rollett, A.D. Evaluating the Effect of Processing Parameters on Porosity in Electron Beam Melted Ti-6Al-4V via Synchrotron X-ray Microtomography. JOM 2016, 68, 765–771. [Google Scholar] [CrossRef]
- Cunningham, R.; Narra, S.P.; Montgomery, C.; Beuth, J.; Rollett, A.D. Synchrotron-Based X-ray Microtomography Characterization of the Effect of Processing Variables on Porosity Formation in Laser Power-Bed Additive Manufacturing of Ti-6Al-4V. JOM 2017, 69, 479–484. [Google Scholar] [CrossRef]
- du Plessis, A.; Yadroitsev, I.; Yadroitsava, I.; Le Roux, S.G. X-Ray Microcomputed Tomography in Additive Manufacturing: A Review of the Current Technology and Applications. 3D Print. Addit. Manuf. 2018, 5, 227–247. [Google Scholar] [CrossRef] [Green Version]
- Zhao, C.; Fezzaa, K.; Cunningham, R.W.; Wen, H.; De Carlo, F.; Chen, L.; Rollett, A.D.; Sun, T. Real-time monitoring of laser powder bed fusion process using high-speed X-ray imaging and diffraction. Sci. Rep. 2017, 7, 3602. [Google Scholar] [CrossRef]
- Leung, C.L.A.; Marussi, S.; Atwood, R.C.; Towrie, M.; Withers, P.J.; Lee, P.D. In situ X-ray imaging of defect and molten pool dynamics in laser additive manufacturing. Nat. Commun. 2018, 9, 1355. [Google Scholar] [CrossRef] [Green Version]
- Cunningham, R.; Zhao, C.; Parab, N.; Kantzos, C.; Pauza, J.; Fezzaa, K.; Sun, T.; Rollett, A.D. Keyhole threshold and morphology in laser melting revealed by ultrahigh-speed x-ray imaging. Science 2019, 363, 849–852. [Google Scholar] [CrossRef] [PubMed]
- du Plessis, A. Effects of process parameters on porosity in laser powder bed fusion revealed by X-ray tomography. Addit. Manuf. 2019, 30, 100871. [Google Scholar] [CrossRef]
- Ter Haar, G.M.; Becker, T.H. Selective Laser Melting Produced Ti-6Al-4V: Post-Process Heat Treatments to Achieve Superior Tensile Properties. Materials 2018, 11, 146. [Google Scholar] [CrossRef] [PubMed] [Green Version]
- Suryawanshi, J.; Prashanth, K.G.; Scudino, S.; Eckert, J.; Prakash, O.; Ramamurty, U. Simultaneous enhancements of strength and toughness in an Al-12Si alloy synthesized using selective laser melting. Acta Mater. 2016, 115, 285–294. [Google Scholar] [CrossRef]
- Iturrioz, A.; Gil, E.; Petite, M.M.; Garciandia, F.; Mancisidor, A.M.; Sebastian, M.S. Selective laser melting of AlSi10Mg alloy: Influence of heat treatment condition on mechanical properties and microstructure. Weld. World 2018, 62, 885–892. [Google Scholar] [CrossRef]
- Spierings, A.; Dawson, K.; Kern, K.; Palm, F.; Wegener, K. SLM-processed Sc- and Zr- modified Al-Mg alloy: Mechanical properties and microstructural effects of heat treatment. Mater. Sci. Eng. A 2017, 701, 264–273. [Google Scholar] [CrossRef]
- Takaichi, A.; Suyalatu; Nakamoto, T.; Joko, N.; Nomura, N.; Tsutsumi, Y.; Migita, S.; Doi, H.; Kurosu, S.; Chiba, A.; et al. Microstructures and mechanical properties of Co–29Cr–6Mo alloy fabricated by selective laser melting process for dental applications. J. Mech. Behav. Biomed. Mater. 2013, 21, 67–76. [Google Scholar] [CrossRef] [PubMed]
- Tomus, D.; Rometsch, P.A.; Heilmaier, M.; Wu, X. Effect of minor alloying elements on crack-formation characteristics of Hastelloy-X manufactured by selective laser melting. Addit. Manuf. 2017, 16, 65–72. [Google Scholar] [CrossRef]
- Deng, D.; Peng, R.L.; Brodin, H.; Moverare, J. Microstructure and mechanical properties of Inconel 718 produced by selective laser melting: Sample orientation dependence and effects of post heat treatments. Mater. Sci. Eng. A 2018, 713, 294–306. [Google Scholar] [CrossRef]
- Choo, H.; Sham, K.-L.; Bohling, J.; Ngo, A.; Xiao, X.; Ren, Y.; Depond, P.J.; Matthews, M.J.; Garlea, E. Effect of laser power on defect, texture, and microstructure of a laser powder bed fusion processed 316L stainless steel. Mater. Des. 2018, 164, 107534. [Google Scholar] [CrossRef]
- Yang, K.-T.; Kim, M.-K.; Kim, D.; Suhr, J. Investigation of laser powder bed fusion manufacturing and post-processing for surface quality of as-built 17-4PH stainless steel. Surf. Coat. Technol. 2021, 422, 127492. [Google Scholar] [CrossRef]
- Zhang, Z.; Zhang, H.; Hu, J.; Qi, X.; Bian, Y.; Shen, A.; Xu, P.; Zhao, Y. Microstructure evolution and mechanical properties of briefly heat-treated SAF 2507 super duplex stainless steel welds. Constr. Build. Mater. 2018, 168, 338–345. [Google Scholar] [CrossRef]
- Martins, M.; Casteletti, L.C. Heat treatment temperature influence on ASTM A890 GR 6A super duplex stainless steel microstructure. Mater. Charact. 2005, 55, 225–233. [Google Scholar] [CrossRef]
- Davidson, K.; Singamneni, S. Selective Laser Melting of Duplex Stainless Steel Powders: An Investigation. Mater. Manuf. Process. 2016, 31, 1543–1555. [Google Scholar] [CrossRef]
- Saeidi, K.; Kevetkova, L.; Lofaj, F.; Shen, Z. Novel ferritic stainless steel formed by laser melting from duplex stainless steel powder with advanced mechanical properties and high ductility. Mater. Sci. Eng. A 2016, 665, 59–65. [Google Scholar] [CrossRef]
- Kunz, J.; Boontanom, A.; Herzog, S.; Suwanpinij, P.; Kaletsch, A.; Broeckmann, C. Influence of hot isostatic pressing post-treatment on the microstructure and mechanical behavior of standard and super duplex stainless steel produced by laser powder bed fusion. Mater. Sci. Eng. A 2020, 794, 139806. [Google Scholar] [CrossRef]
- Wang, G.; Huang, L.; Liu, Z.; Qin, Z.; He, W.; Liu, F.; Chen, C.; Nie, Y. Process optimization and mechanical properties of oxide dispersion strengthened nickel-based superalloy by selective laser melting. Mater. Des. 2019, 188, 108418. [Google Scholar] [CrossRef]
- Terner, M.; Ricordel, T.; Cho, J.-H.; Lee, J.-S. The Response Surface Methodology for Optimizing the Process Parameters of Selective Laser Melting. J. Weld. Join. 2019, 37, 27–39. [Google Scholar] [CrossRef] [Green Version]
- Deng, Y.; Mao, Z.; Yang, N.; Niu, X.; Lu, X. Collaborative Optimization of Density and Surface Roughness of 316L Stainless Steel in Selective Laser Melting. Materials 2020, 13, 1601. [Google Scholar] [CrossRef] [Green Version]
- Montgomery, D.C. Design and Analysis of Experiments, 8th ed.; Arizona State University: Tempe, AZ, USA, 2013. [Google Scholar]
- Hyer, H.C.; Petrie, C.M. Effect of powder layer thickness on the microstructural development of additively manufactured SS316. J. Manuf. Process. 2022, 76, 666–674. [Google Scholar] [CrossRef]
- Ferrar, B.; Mullen, L.; Jones, E.; Stamp, R.; Sutcliffe, C.J. Gas flow effects on selective laser melting (SLM) manufacturing performance. J. Mater. Process. Technol. 2012, 212, 355–364. [Google Scholar] [CrossRef]
- Hosseini, V.A.; Wessman, S.; Hurtig, K.; Karlsson, L. Nitrogen loss and effects on microstructure in multipass TIG welding of a super duplex stainless steel. Mater. Des. 2016, 98, 88–97. [Google Scholar] [CrossRef]
- Haghdadi, N.; Laleh, M.; Chen, H.; Chen, Z.; Ledermueller, C.; Liao, X.; Ringer, S.; Primig, S. On the pitting corrosion of 2205 duplex stainless steel produced by laser powder bed fusion additive manufacturing in the as-built and post-processed conditions. Mater. Des. 2021, 212, 110260. [Google Scholar] [CrossRef]
- Nigon, G.N.; Isgor, O.B.; Pasebani, S. The effect of annealing on the selective laser melting of 2205 duplex stainless steel: Microstructure, grain orientation, and manufacturing challenges. Opt. Laser Technol. 2020, 134, 106643. [Google Scholar] [CrossRef]


| Element | Fe | Cr | Ni | Mo | Mn | N | Si | Cu | C | P | S |
|---|---|---|---|---|---|---|---|---|---|---|---|
| Content (wt%) | Balance | 24.6–25.4 | 6.8–7.2 | 3.76–4.24 | 0.7–1.1 | 0.26–0.31 | 0.2–0.6 | 0.20 | 0.02 | 0.025 | 0.008 |
| Levels | Laser Power (W) | Scan Speed (mm/s) | Hatch Distance (µm) |
|---|---|---|---|
| Lowest (−α) | 69.3 | 159.1 | 26.1 |
| Lower (−1) | 100 | 500 | 50 |
| Center point (0) | 145 | 1000 | 85 |
| Higher (1) | 190 | 1500 | 120 |
| Highest (α) | 220.7 | 1840.9 | 143.9 |
| Range | 69.3–220.7 | 159.1–1840.9 | 26.1–143.9 |
| Run | Laser Power (W) | Scan Speed (mm/s) | Hatch Distance (µm) |
|---|---|---|---|
| 1 | 100 | 500 | 50 |
| 2 | 220.7 | 1000 | 85 |
| 3 | 145 | 1000 | 85 |
| 4 | 145 | 1000 | 85 |
| 5 | 190 | 1500 | 50 |
| 6 | 145 | 1000 | 85 |
| 7 | 145 | 1000 | 143.9 |
| 8 | 100 | 1500 | 50 |
| 9 | 69.3 | 1000 | 85 |
| 10 | 145 | 1000 | 85 |
| 11 | 190 | 500 | 120 |
| 12 | 190 | 1500 | 120 |
| 13 | 145 | 1000 | 85 |
| 14 | 190 | 500 | 50 |
| 15 | 145 | 1840.9 | 85 |
| 16 | 100 | 1500 | 120 |
| 17 | 100 | 500 | 120 |
| 18 | 145 | 1000 | 26.1 |
| 19 | 145 | 159.1 | 85 |
| 20 | 145 | 1000 | 85 |
| Run | Laser Power (W) | Scan Speed (mm/s) | Hatch Distance (µm) | Layer Thickness (µm) | Laser Energy Density (J/mm3) | Experimental Porosity (%) |
|---|---|---|---|---|---|---|
| 1 | 100 | 500 | 50 | 25 | 160.00 | 0.36 |
| 2 | 220.7 | 1000 | 85 | 25 | 103.85 | 0.04 |
| 3 | 145 | 1000 | 85 | 25 | 68.24 | 0.69 |
| 4 | 145 | 1000 | 85 | 25 | 68.24 | 0.85 |
| 5 | 190 | 1500 | 50 | 25 | 101.33 | 0.13 |
| 6 | 145 | 1000 | 85 | 25 | 68.24 | 0.33 |
| 7 | 145 | 1000 | 143.9 | 25 | 40.32 | 14.92 |
| 8 | 100 | 1500 | 50 | 25 | 53.33 | 15.28 |
| 9 | 69.3 | 1000 | 85 | 25 | 32.62 | 41.74 |
| 10 | 145 | 1000 | 85 | 25 | 68.24 | 0.40 |
| 11 | 190 | 500 | 120 | 25 | 126.67 | 0.15 |
| 12 | 190 | 1500 | 120 | 25 | 42.22 | 29.60 |
| 13 | 145 | 1000 | 85 | 25 | 68.24 | 2.26 |
| 14 | 190 | 500 | 50 | 25 | 304.00 | 0.73 |
| 15 | 145 | 1840.9 | 85 | 25 | 37.07 | 17.80 |
| 16 | 100 | 1500 | 120 | 25 | 22.22 | 45.60 |
| 17 | 100 | 500 | 120 | 25 | 66.67 | 4.61 |
| 18 | 145 | 1000 | 26.1 | 25 | 221.91 | 0.66 |
| 19 | 145 | 159.1 | 85 | 25 | 428.87 | 1.56 |
| 20 | 145 | 1000 | 85 | 25 | 68.24 | 3.01 |
| Sample | 16 | 2 | 19 | ||||||
|---|---|---|---|---|---|---|---|---|---|
| Power (w) | 100 | 220.7 | 145 | ||||||
| Scan speed (mm/s) | 1500 | 1000 | 159.1 | ||||||
| Hatch distance (µm) | 120 | 85 | 85 | ||||||
| Layer thickness (µm) | 25 | ||||||||
| Laser energy density (J/mm3) | 22.22 | 103.85 | 428.87 | ||||||
| Pore type | Lack of fusion | Metallurgical or gas | Keyhole | ||||||
| Feret diameter (mm) | Min. | Max. | Mean | Min. | Max. | Mean | Min. | Max. | Mean |
| 0.12 | 0.77 | 0.26 ± 0.12 | 0.04 | 0.06 | 0.05 ± 0.01 | 0.04 | 0.13 | 0.09 ±0.02 | |
| Aspect ratio | Min. | Max. | Mean | Min. | Max. | Mean | Min. | Max. | Mean |
| 0.05 | 0.76 | 0.33 ± 0.14 | 0.59 | 1 | 0.65 ± 0.08 | 0.20 | 0.81 | 0.57 ± 0.17 | |
| Porosity % | 45.60 | 0.06 | 1.56 | ||||||
| Source | DF | Adj SS | ADJ MS | F-Value | p-Value |
|---|---|---|---|---|---|
| Model | 9 | 3438.74 | 382.082 | 9.53 | 0.001 |
| Linear | 3 | 2294.29 | 764.762 | 19.07 | 0.000 |
| A-Power (W) | 1 | 814.20 | 814.198 | 20.30 | 0.001 |
| B-Speed (mm/s) | 1 | 920.97 | 920.971 | 22.97 | 0.001 |
| C-Hatch (µm) | 1 | 559.12 | 559.118 | 13.94 | 0.004 |
| Square | 3 | 654.37 | 218.123 | 5.44 | 0.018 |
| AA | 1 | 592.51 | 592.508 | 14.78 | 0.003 |
| BB | 1 | 86.42 | 86.424 | 2.16 | 0.173 |
| CC | 1 | 45.62 | 45.622 | 1.14 | 0.311 |
| 2-Way interaction | 3 | 490.08 | 163.360 | 4.07 | 0.039 |
| AB | 1 | 91.09 | 91.091 | 2.27 | 0.163 |
| AC | 1 | 4.14 | 4.143 | 0.10 | 0.755 |
| BC | 1 | 394.85 | 394.847 | 9.85 | 0.011 |
| Error | 10 | 401.02 | 40.102 | ||
| Lack-of-fit | 5 | 375.03 | 75.006 | ||
| Pure Error | 5 | 25.99 | 5.198 | ||
| Total | 19 | 3839.76 |
| Set/Sample | Power (W) | Speed (mm/s) | Hatch (µm) | Predicted Porosity (%) |
|---|---|---|---|---|
| 1 | 209.6 | 1022.9 | 57.4 | 0.141 |
| 2 | 217.4 | 1735.7 | 51.3 | 0.039 |
| 3 | 145 | 1000.0 | 87.16 | 0.047 |
| Set/Sample | Power (W) | Speed (mm/s) | Hatch (µm) | Experimental Porosity | Predicted Porosity | Residual | |||
|---|---|---|---|---|---|---|---|---|---|
| Left | Mid | Right | Avg. | ||||||
| 1 | 209.6 | 1022.9 | 57.4 | 0.167 | 0.055 | 0.266 | 0.163 | 0.141 | 0.022 |
| 2 | 217.4 | 1735.7 | 51.3 | 0.029 | 0.030 | 0.011 | 0.023 | 0.039 | −0.016 |
| 3 | 145 | 1000.0 | 87.16 | 0.040 | 0.139 | 0.058 | 0.079 | 0.047 | 0.032 |
| Sample | 1 | 2 | 3 |
|---|---|---|---|
| Yield strength (MPa) | 1254.50 | 1131.70 | 960.10 |
| Ultimate tensile strength (MPa) | 1403.10 | 1366.70 | 1000.30 |
| Elongation (%) | 10.2 | 13.0 | 6.0 |
| Material | Condition | Number of Samples | Yield Strength (MPa) | UTS (MPa) | Elongation (%) |
|---|---|---|---|---|---|
| 2507 SDSS | DIN EN 10088-3 standard | - | >500 | 700–900 | >25 |
| LPBF | 3 | 1115.4 ± 120.7 | 1256.7 ± 181.9 | 10.7 ± 1.7 |
Disclaimer/Publisher’s Note: The statements, opinions and data contained in all publications are solely those of the individual author(s) and contributor(s) and not of MDPI and/or the editor(s). MDPI and/or the editor(s) disclaim responsibility for any injury to people or property resulting from any ideas, methods, instructions or products referred to in the content. |
© 2023 by the authors. Licensee MDPI, Basel, Switzerland. This article is an open access article distributed under the terms and conditions of the Creative Commons Attribution (CC BY) license (https://creativecommons.org/licenses/by/4.0/).
Share and Cite
Mulhi, A.; Dehgahi, S.; Waghmare, P.; Qureshi, A.J. Process Parameter Optimization of 2507 Super Duplex Stainless Steel Additively Manufactured by the Laser Powder Bed Fusion Technique. Metals 2023, 13, 725. https://doi.org/10.3390/met13040725
Mulhi A, Dehgahi S, Waghmare P, Qureshi AJ. Process Parameter Optimization of 2507 Super Duplex Stainless Steel Additively Manufactured by the Laser Powder Bed Fusion Technique. Metals. 2023; 13(4):725. https://doi.org/10.3390/met13040725
Chicago/Turabian StyleMulhi, Ali, Shirin Dehgahi, Prashant Waghmare, and Ahmed J. Qureshi. 2023. "Process Parameter Optimization of 2507 Super Duplex Stainless Steel Additively Manufactured by the Laser Powder Bed Fusion Technique" Metals 13, no. 4: 725. https://doi.org/10.3390/met13040725