Article

Utilization of Renewable Carbon in Electric Arc Furnace-Based Steel Production: Comparative Evaluation of Properties of Conventional and Non-Conventional Carbon-Bearing Sources

1
Department of Ferrous Metallurgy, Montanuniversitaet Leoben, 8700 Leoben, Austria
2
Department of Chemistry, Dnipro University of Technology, 49005 Dnipro, Ukraine
3
Department of Geology and Economic Geology, Montanuniversitaet Leoben, 8700 Leoben, Austria
4
G.V. Kurdyumov Institute for Metal Physics of the National Academy of Sciences of Ukraine, 02000 Kyiv, Ukraine
5
Department of Ceramics, Montanuniversitaet Leoben, 8700 Leoben, Austria
*
Author to whom correspondence should be addressed.
Metals 2023, 13(4), 722; https://doi.org/10.3390/met13040722
Submission received: 29 January 2023 / Revised: 3 March 2023 / Accepted: 4 April 2023 / Published: 6 April 2023
(This article belongs to the Special Issue Reuse and Recycling of By-Products in the Steel Sector)

Abstract

:
Conventional (anthracite, calcined petroleum coke, and coke) and non-conventional (biochar, and biocokes (3 wt.% torrefied wood, and 3 wt.% petroleum coke + 3 wt.% charcoal)) carbon-bearing sources have been studied for their use in electric arc furnace (EAF)-based steel production. Commonly, for the use of carbon sources in EAFs, one of the important properties is the content of fixed carbon, the release of volatiles as well as the elemental composition of inorganics. The properties of six carbon sources were analyzed by determining the proximate analysis, X-ray fluorescence analysis (XRF), coke reactivity index (CRI), and strength after reaction with CO2 (CSR), Brunauer–Emmett–Teller (BET) specific surface area and Barrett–Joyner–Halenda (BJH) pore size and volume analysis, ash chemical analysis, optical and scanning microscopy, Raman spectroscopy and X-ray diffraction (XRD) analysis. The results indicate biocoke as a promising option to replace conventional carbon-bearing sources. In the sample set, the fixed carbon, volatiles, and ash content of the biocokes were similar despite the total difference in additives. Additionally, the use of additives did not significantly affect the biocoke reactivity indices, but slightly decreased the strength after the reaction with CO2. Carbon-bearing sources have been characterized in terms of their structural properties. XRD analysis revealed that the amount of disordered carbon increased in the order: coke < calcined petroleum coke ~ biocoke (3 wt.% torrefied wood) < biocoke (3 wt.% petroleum coke + 3 wt.% charcoal) < biochar. The results obtained on the physical, chemical, and structural properties of carbon sources are the basis for further research on the behavior of slag foaming.

1. Introduction

Operating an electric arc furnace (EAF) is a well-established way of steel production [1,2,3,4]. EAF-based steel production accounts for approximately 26% [5,6] of the global output (~42% in the EU), according to the World Steel Association [7]. More than 40% of the energy in the current EAFs originates from natural gas and coal [8,9,10], corresponding to about 5 to 15 kg/t of liquid steel [11]. Usually, anthracite, coke (metallurgical or petroleum), or graphite is used as the source of carbon. Carbon-bearing sources are used as charged carbon (lumped within the basket), which consumes surplus oxygen during the melting stage and delivers heat or injected carbon, which interacts with oxygen to produce a foamy slag.
The operation with foamy slag enables higher productivity, a reduction in electrode consumption and arc noise reduction due to arc coverage, an increase in the average power due to improved arc stability, a reduction in the wall thermal stress, reduction in electric energy consumption due to better thermal efficiency, lower nitrogen absorption, and a reduction in harmonic electric disturbances [12,13,14,15].
To achieve the foaming process, approximately 5–10 kg of injected carbon is used in an EAF [16]. The main requirements for carbon-bearing materials are a high carbon content (>85 wt.%, dry basis), a low ash content, and a bulk density of about 1000 kg/m3.
However, conventional carbon sources (anthracite, coke, or graphite) are responsible for 60–70% of direct greenhouse gas (GHG) emissions [8]. Looking for new ways to reduce CO2 emissions [17] and achieve carbon neutrality and a circular economy [18,19], the partial or complete replacement of conventional carbon sources with materials such as biomass [20] or biochar has been investigated [16,21,22,23,24,25,26,27]. Carbon from biochar directly reacts with iron oxide (FeO) or reduces FeO indirectly through an intermediate gasification stage [28]. Notably, biochar usually contains a large amount of volatile matter (VM) including hydrogen [29]. Hydrogen contributes to the reaction of FeO to Fe and H2O [30]. The indirect reaction of the water–gas conversion supports the gasification of solid carbon, accelerating the slag and carbon reaction. Hydrogen in the gas phase also increases the carbon gasification rate because H2 and H2O react faster with carbon and slag than CO and CO2. In addition, FeO reacts faster with hydrogen compared to CO [16]. This provides the advantage of using biochar instead of anthracite [31] or coke, which is characterized by a small amount of VM and a relatively low amount of hydrogen [32,33,34]. In addition, for the scrap/EAF route, charcoal was assumed to replace the charge fully, injectant, and recarburizer carbon (85% C) in an EAF on an equivalent fixed carbon basis [35]. Partial or complete application of biomass/biochar is considered as a good option [36,37]. However, it is still a challenging issue in EAF-based steel production as the carbon source should have sufficient fixed carbon. Nevertheless, EAF-based steel production with biomass can reduce CO2 emissions by 83% [38].
Shukla [39] demonstrated the thermo-chemical conversion of biomass to renewable fuels at a temperature below 1000 °C, which was lower than the steelmaking temperature of 1550–1650 °C. It was concluded that in the scrap-EAF route, biomass could be used as a slag foaming agent and in a cogeneration plant.
Demus et al. [22] assessed that biocoal from biogenic residues had great potential for industrial-scale EAF steelmaking. However, it was noticed that there were some problems in handling highly reactive carbonaceous materials with a high specific surface. Therefore, they suggested the use of biocoal briquettes.
Bianco et al. [40] characterized biochar from grape seed and wood residues, anthracite, and petroleum coke too study the slag foaming capability. It was concluded that petroleum coke had the highest carbon value of 93% and the lowest yield of VM of 1%. Biochar from the wood residues was characterized by the lowest carbon values and VM of 60% and 13.5%, respectively.
The thermochemical properties of two biochars obtained from the grape seed and pumpkin seed chars were studied by Fidalgo et al. [41] as an injected and/or charged carbon. They found that grape seed charcoal was more volatile and had a higher ash content than the charcoal and pumpkin seed charcoal. Thermogravimetric analysis indicated that grape seed charcoal had a higher reactivity for gasification, combustion, and slow release of VM, which may contribute to the supply of heat and sustaining reactions in the slag phase for a long time.
Kalde et al. [42] studied the reactivity and combustion behavior of wood produced by hydrothermal carburization (in the form of pellets), torrefaction (in the form of pellets), and pyrolysis as well as non-processed biomass such as palm kernel shells. Based on the obtained results, palm kernel shells were selected for a series of tests in an industrial-scale EAF. A study of reactivity as a function of time eliminated most materials due to a potentially explosive reaction that is possible when introduced into an industrial furnace. Based on the obtained results, palm kernel shells were selected for a series of tests on an industrial scale EAF.
Biochar produced by two different technologies (woody biomass after slow pyrolysis technology at 900 °C, and biochar from woody biomass after fast pyrolysis technology at 400 °C), graphite, coke, and char from tire pyrolysis were studied by Huang et al. [43]. Carbonaceous materials were characterized in terms of their chemical composition and carbon structure by Raman spectroscopy and XRD analysis. It was shown that materials were in the following microstructural order: graphite > coke > tire char > biochar from woody biomass after slow pyrolysis > biochar from woody biomass after fast pyrolysis technology at 400 °C. Moreover, it was found that the smooth surface of the biochar reduced the foaming of the slag. The interaction between biochar and slag was weak compared to other carbonaceous materials.
The reduction reactions and foaming of the slag in EAF depend not only on the physical and chemical properties of the slag but on the physicochemical properties of the carbon source. Indicators of proximate analysis, reactivity, micropores, and crystallinity show the physical and chemical properties of carbon sources and determine the kinetics of reactions with their participation. The most general indicator of the quality of carbon sources is reactivity, the value of which depends on the ordering of the carbon structure as well as on the proximate analysis indicators.
In this paper, anthracite, calcined petroleum coke, and high-temperature coke were studied as conventional carbon-bearing sources. Two types of biocoke and biochar were selected as alternative carbon-bearing sources. The specific objective was to study the physicochemical and microstructural properties of conventional and non-conventional carbon-bearing sources to assess the requirements of the carbon materials for EAF application.

2. Materials and Methods

2.1. Sample Materials

Calcined petroleum coke (CPC) with a grain size of 0–3 mm, a by-product of the oil refinery “MiRO” Germany, was provided by Stahl- und Walzwerk Marienhütte GmbH, Graz, Austria. The anthracite (Anth) sample with a grain size of 0–3 mm was taken from Vietnam; conventional coke (C) lumps as well as wood biochar pellets obtained at approximately 600 °C (Bch) were provided by Voestalpine Stahl GmbH, Linz, Austria. Samples of biocoke with 3 wt.% torrefied wood (BC1) and biocoke with 3 wt.% petroleum coke + 3 wt.% charcoal (BC2) were provided by ThyssenKrupp Steel Europe AG, Duisburg, Germany. It should be noted that the samples of biocoke were obtained in 2014 (BC2) and 2015 (BC1), which could have affected the quality of the biocokes. Low VM coal, medium VM coal, and high VM coal were used to prepare the base blends. The composition of the coal blends for BC1 and BC2 differed in additives to replace coals (Table 1).
The proximate and ultimate analyses for carbon-bearing sources (Table 2) were carried out according to ASTM D3172-13 [44]. The calorific value for the anthracite, coke, and biocoke samples (Table 2) was determined according to ISO 1928:2020 and biochar according to ISO 18125:2017 [45,46].

2.2. Methods

The coke reactivity index (CRI) and coke strength after reaction with CO2 (CSR) were determined according to ISO 18894:2018 [47]. Pre-dried coke weighing 200 ± 3 g with particle sizes from 19.0 to 22.4 mm was heated in a reaction vessel to a temperature of 1100 °C in a nitrogen atmosphere. Subsequently, the atmosphere was changed to carbon dioxide and held for 2 h. After that, the coke was cooled in a nitrogen atmosphere to 50 °C. Mass loss in the course of the CRI tests was recorded by a Mettler Toledo XP64000L balance. To determine the CSR, the reacted coke was treated in a tumbler (Model TB 5000 of R.B. Automazione, Genoa, Italy) for 600 revolutions in 30 min. After that, the coke was sieved, and the sample greater than 10.0 mm was weighed. All tests were repeated.
Before the combined test method of determining the Brunauer–Emmett–Teller (BET) specific surface area (SSA) and Barrett–Joyner–Halenda (BJH) pore size and pore volume, the samples were degassed for 3 h at a temperature of 300 °C and p/po of 0.00–0.30. Degassing of anthracite and biochar was carried out for 24 h at a temperature of 120 °C and p/po of 0.0001–0.99. The measurements were carried out at 77.3 K (−195.8 °C) using a Micromeritics Tristar II 3020 (Micromeritics, Norcross, GA, USA) instrument in a nitrogen atmosphere following ISO 9277:2010 [48]. The weight of the sample was 0.5 g with a grain size of <150 µm. All tests were repeated twice.
Images of the samples were obtained via optical microscopy Polyvar Reichert-Jung MEF 2 and Clemex Vision PE Software version 7.0. Samples were also observed via a scanning electron microscope SEM FEI Quanta 200 Mk2 (FEI Technologies Inc., Oregon, OR, USA) equipped with an energy-dispersive (EDS) detector, back-scattered electron (BSE) detector, and a digital microscope Keyence VHX-E20 (Keyence, Itasca, IL, USA). After SEM/EDS analysis, the mineral matters were all normalized to 100 wt.%.
X-ray diffraction (XRD) spectra of the powdered samples were obtained using a Bruker AXS D8 (Bruker Corporation, Billerica, MA, USA) advance diffractometer with a lynxeye detector and a Cu X-ray tube with Cu Kα radiation. The crystallite height (Lc), carbon crystallite width (La), and interlayer spacing between the aromatic planes of the carbon crystallites (d002) were calculated using the Scherrer equation [49] and Bragg’s Law [50]. The crystalline stacking layer number N was calculated by an equation with the parameters d002 and Lc according to [51].
A Horiba Labram HR Evolution instrument (Horiba, Ltd., Kyoto, Japan), equipped with a 100 mW Nd: Yag (532 nm) laser, a confocal microscope (hole aperture = 100 μm), an 1800 g/mm grating, and a Peltier cooled CCD detector were used to obtain Raman spectra as they can confidently characterize the microstructural state of the carbon materials [52]. To assess the microstructural variability of the experimental samples within a sample, a lump of each sample ranging in size from 19.0 to 22.4 mm was examined by analyzing 10 random spots (diameter of ca. 1.6 μm) per lump on a section through the lump using a 10× objective and laser energy of 100 mW.
X-ray fluorescence analysis (XRF) was conducted to determine the ash chemical composition of all samples according to ASTM D4326-21 [53]. The mass fraction (%) of chemical elements was measured using an energy-dispersive analyzer EXPERT 3L. The detection limits of the elements ranged from 1 to 10 ppm. The resolution of the detector (for KαMn) at nominal load did not exceed 149 eV.

3. Results

Samples of anthracite, calcined petroleum coke, conventional coke, and two samples of biocoke were characterized by a major amount of silica and aluminum oxide (Table 3). Iron, calcium oxide, and potassium oxide were present in smaller amounts. The biochar sample was characterized by a significant amount of calcium oxide, chlorine, and a much smaller amount of silica than the other carbon-bearing sources. Phosphorus oxide was present in small amounts in the coke (0.07 wt.% db) and biochar (0.08 wt.% db) samples. The difference in the content of phosphorus oxide was not large between the biocoke samples and amounted to 0.41 wt.% db (BC1) and 0.34 wt.% db (BC2).
The BC1 CRI value was lower than the CRI of BC2 and had 29.18 and 32.50 wt.%, respectively (Table 4), being much lower compared to conventional coke.
The lowest value of BET SSA was characterized by anthracite (0.71 m2/g). A sample of calcined petroleum coke was also characterized by a small BET SSA value of 0.95 m2/g. The conventional coke sample had a BET SSA of 2.54 m2/g. The BET SSA for BC1 was higher than that for BC2 and had values of 4.85 and 4.20 m2/g, respectively. Biochar was characterized by the highest BET SSA value of 42.95 m2/g.

3.1. Optical Microscopy and SEM Analysis

The SEM images of anthracite showed lumped particles up to 3 mm in size, which were used as injected carbon in the EAF (Figure 1). During the study, the presence of mechanical inorganic contaminations on the surface of the particles was noticed.
The surface of the particles of the calcined petroleum coke sample was smooth, flaky, and cracked, as shown in Figure 2b.
Biochar particles were the most porous material (Figure 3), which was confirmed by the highest BET SSA value (see Table 4). The coke sample was a porous-fractured material consisting of pores, microcracks, and a hard carbon matrix with organic and inorganic inclusions (Figure 4b). It is evident from Figure 4b that this was a heterogeneous material composed of organic carbon, mineral substances, and many pores. The microstructures of BC1 (Figure 5a,b) and BC2 (Figure 5c,d) did not differ significantly. These were visually characterized by the presence of large pores, unlike the conventional coke presented in Figure 4a,b.
Si, Al, Mg, Ca, and Fe–oxides were found in all samples (Table 5). The predominant presence of alumina-silicates characterized the coke and anthracite samples. Potassium was also detected for all specimens, with the highest value for calcined petroleum coke. Sulfur was only detected in the anthracite sample. The biocoke samples did not differ in the presence of elements such as Al, Si, Ca, and Fe.

3.2. X-ray Diffraction Analysis

The lattice distance d002 for anthracite, calcined petroleum coke, coke, and BC1 was 0.35 nm and 0.37 nm for BC2, which was slightly higher (Table 6). Biochar was characterized by the highest value of d002 (0.45 nm). The largest value of the carbon crystallite height was characterized by anthracite (2.08 nm) followed by coke (1.86 nm), and the lowest by biochar (0.69 nm). The number of the crystal stacking layers was larger (6.94) in anthracite than in the other four coke samples.
In the anthracite sample (Figure 6a), quartz and muscovite [31] were found. In the biochar, quartz and calcite (Figure 6b) were identified. Quartz and pyrite were found for calcined petroleum coke (Figure 6c). In addition, a weak peak at approximately 43°2θ was detected in the coke, BC1, and BC2 samples and assigned to graphite (Figure 6d–f). For coke, BC1, and BC2 (Figure 6e,f), the peak around 16.0°2θ was specified as mullite (3Al2O3·2SiO2), showing that the predominant crystalline phases were quartz and mullite.
The minerals of the cokes were not significantly different, but wollastonite (CaSiO3) was also found in the coke [54]. Additionally, a weak peak was observed at approximately 43°2θ and was assigned to the (101) plane reflection of graphite.

3.3. Raman Spectroscopy

Carbon-bearing sources were characterized by the D-STA [55] parameter describing the microstructural order (the lower the parameter value, the better the level of microstructure order [52]. The lowest value of the D-STA for carbonized carbon sources corresponded to coke (Table 7). Furthermore, the most ordered carbon-bearing source was calcined petroleum coke. If two samples of biocokes were compared, then the lowest value of the D-STA corresponded to BC1. Biochar had the highest D-STA value, and consequently, the worst order of the microstructure.
Based on the results shown in Figure 7, a statistically significant structural difference in the D-STA parameter was seen between the samples of coke and calcined petroleum coke, coke and biochar, and between the samples of BC1 and BC2.

4. Discussion

The yield of VM of the carbonized carbon materials depends on the processing conditions. It is important to assess the difference in VM yield for biocokes in relation to the other indicators. The highest yield of VM was characterized as biochar (Table 2). The low ash content of calcined petroleum coke can be explained by the low mineral content of oil and heavy oil residues from oil refining that have been coked. The sulfur content was close to that of other materials. The high ash content of biocoke relative to other materials was due to the high mineral content of the blended coal components. The ash content and VM yield of the studied carbon-bearing sources determined the fixed carbon values. The elemental composition of materials subjected to carbonization depends on the temperature and the initial ratio of the main organic components of coal, oil, and biomass. Calcined petroleum coke had the lowest ash content and the highest carbon content, followed by coke and biocoke. Biochar had the lowest carbon content, with the highest hydrogen content simultaneously. The elemental composition, ash content, and moisture determined the calorific value. Obviously, calcined petroleum coke was characterized by the highest calorific value. Conventional coke and biocokes have similar values, exceeding anthracite and biochar.
A high fixed carbon value is essential for EAF steel production [35]. Therefore, coke is used as a source of injection carbon as well as calcined petroleum coke and anthracite. However, a high ash content of anthracite and coke (Table 2) excludes their recarburization, so calcined petroleum coke is therefore preferred. However, calcined petroleum coke, in turn, is a more limited and expensive carbon material than the other studied sources. Biochar has the advantage of a low ash content and practically does not contain sulfur as well as a high amount of hydrogen compared to conventional ones. However, its use is limited as it does not have sufficient fixed carbon (Table 2). Biocoke (torrefied wood/petroleum coke + charcoal is an alternative source for substituting conventional carbon sources) has enough fixed carbon for use in EAF steel production. However, biocoke is also characterized by a high ash content, and can therefore be proposed for use as a source of injection carbon.
One of the essential parameters for using carbon-bearing sources in EAF is the amount and nature of the minerals, as they potentially have an influence on this process (Cl and K) and on the steel properties (P) [26]. In the case of K and Cl, their presence can cause corrosion issues in the flue gas section of the EAF. 
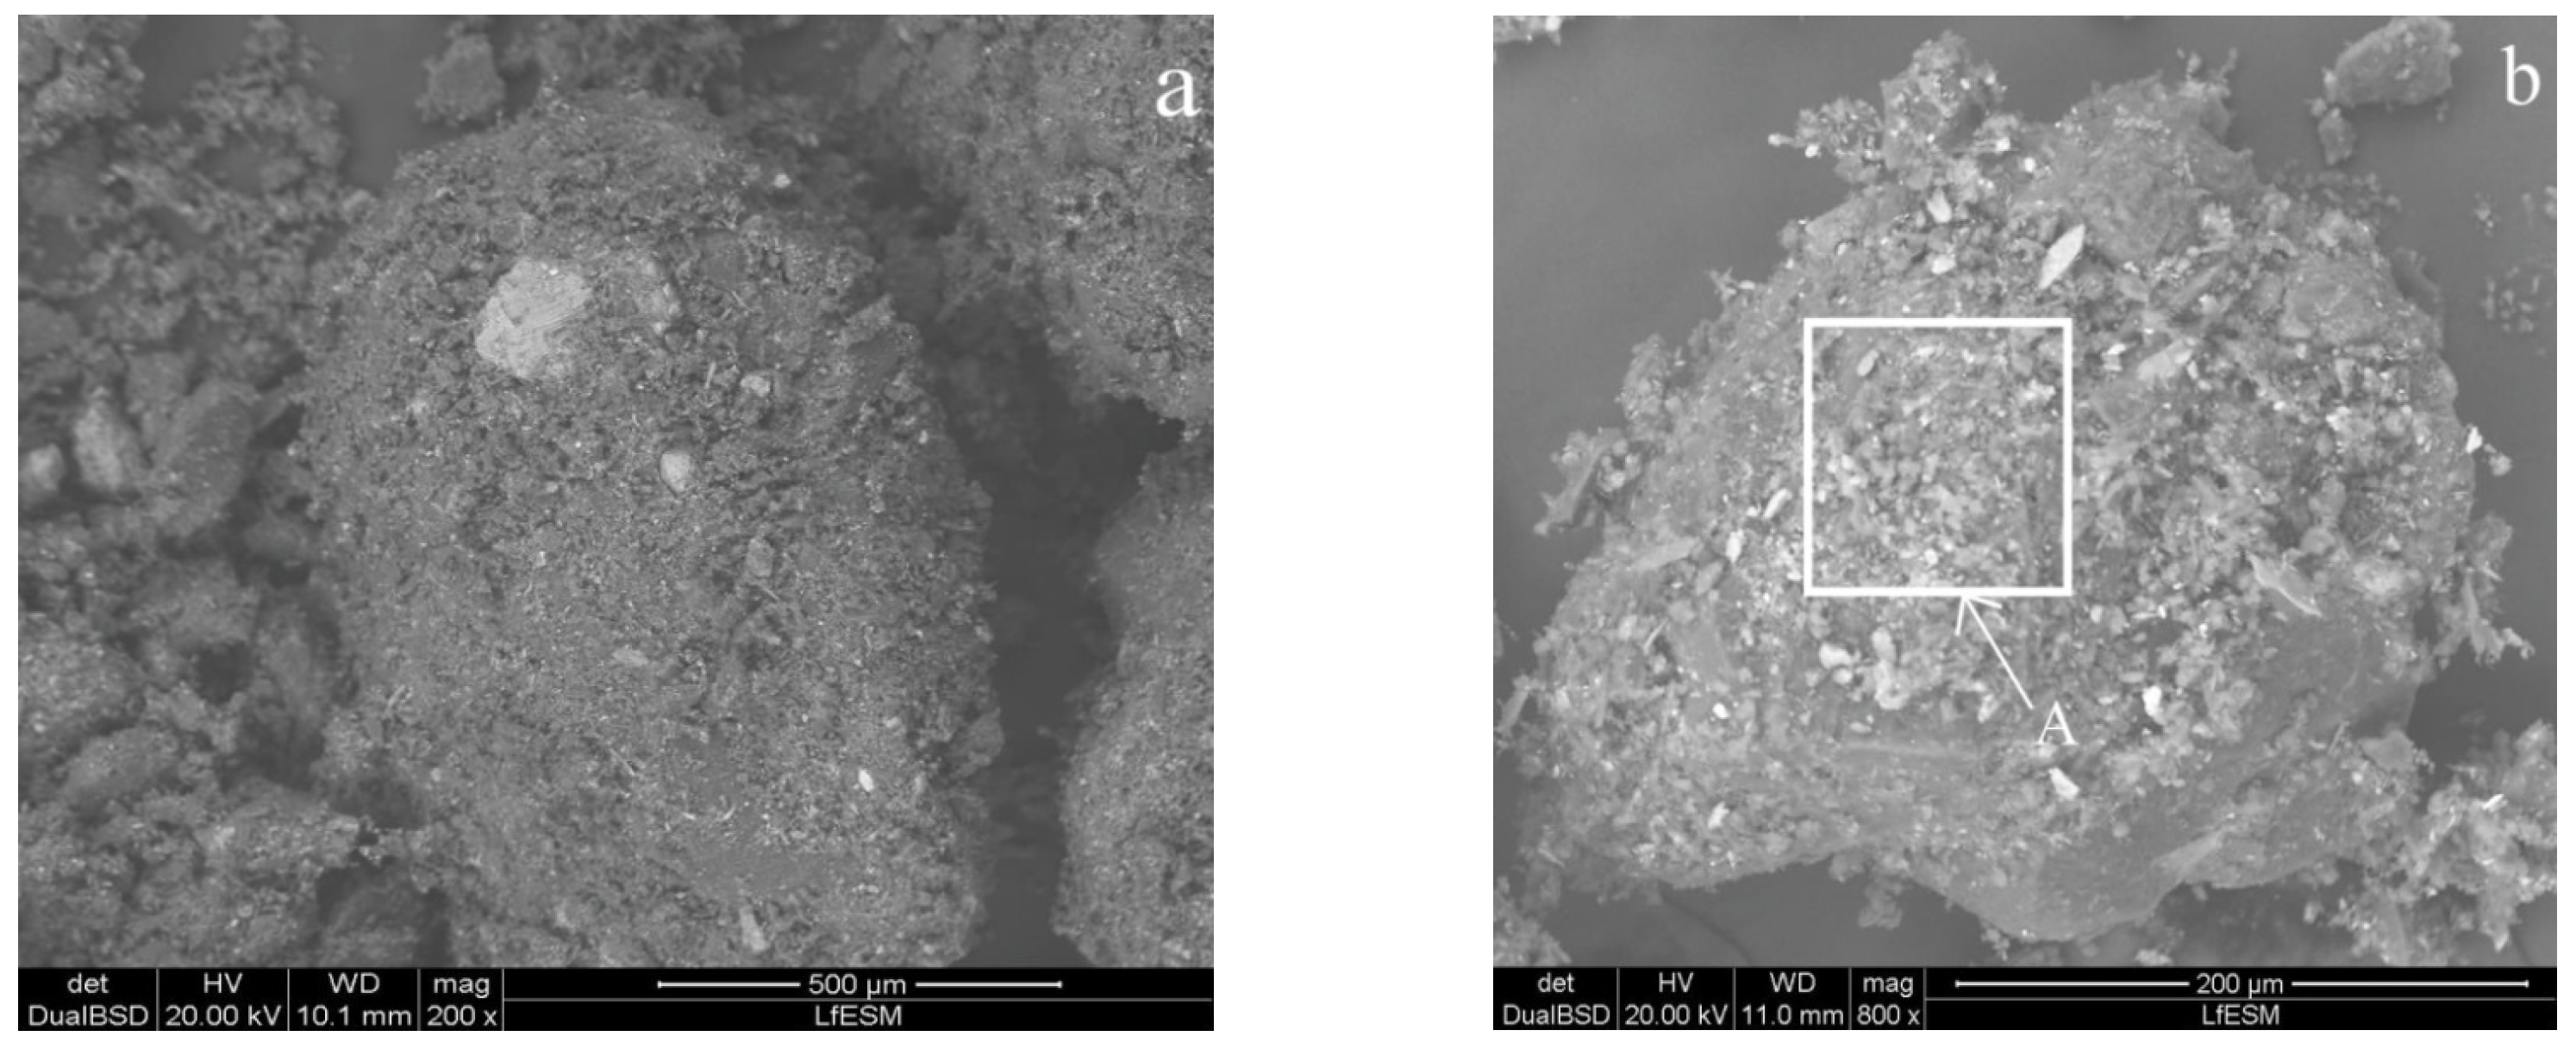
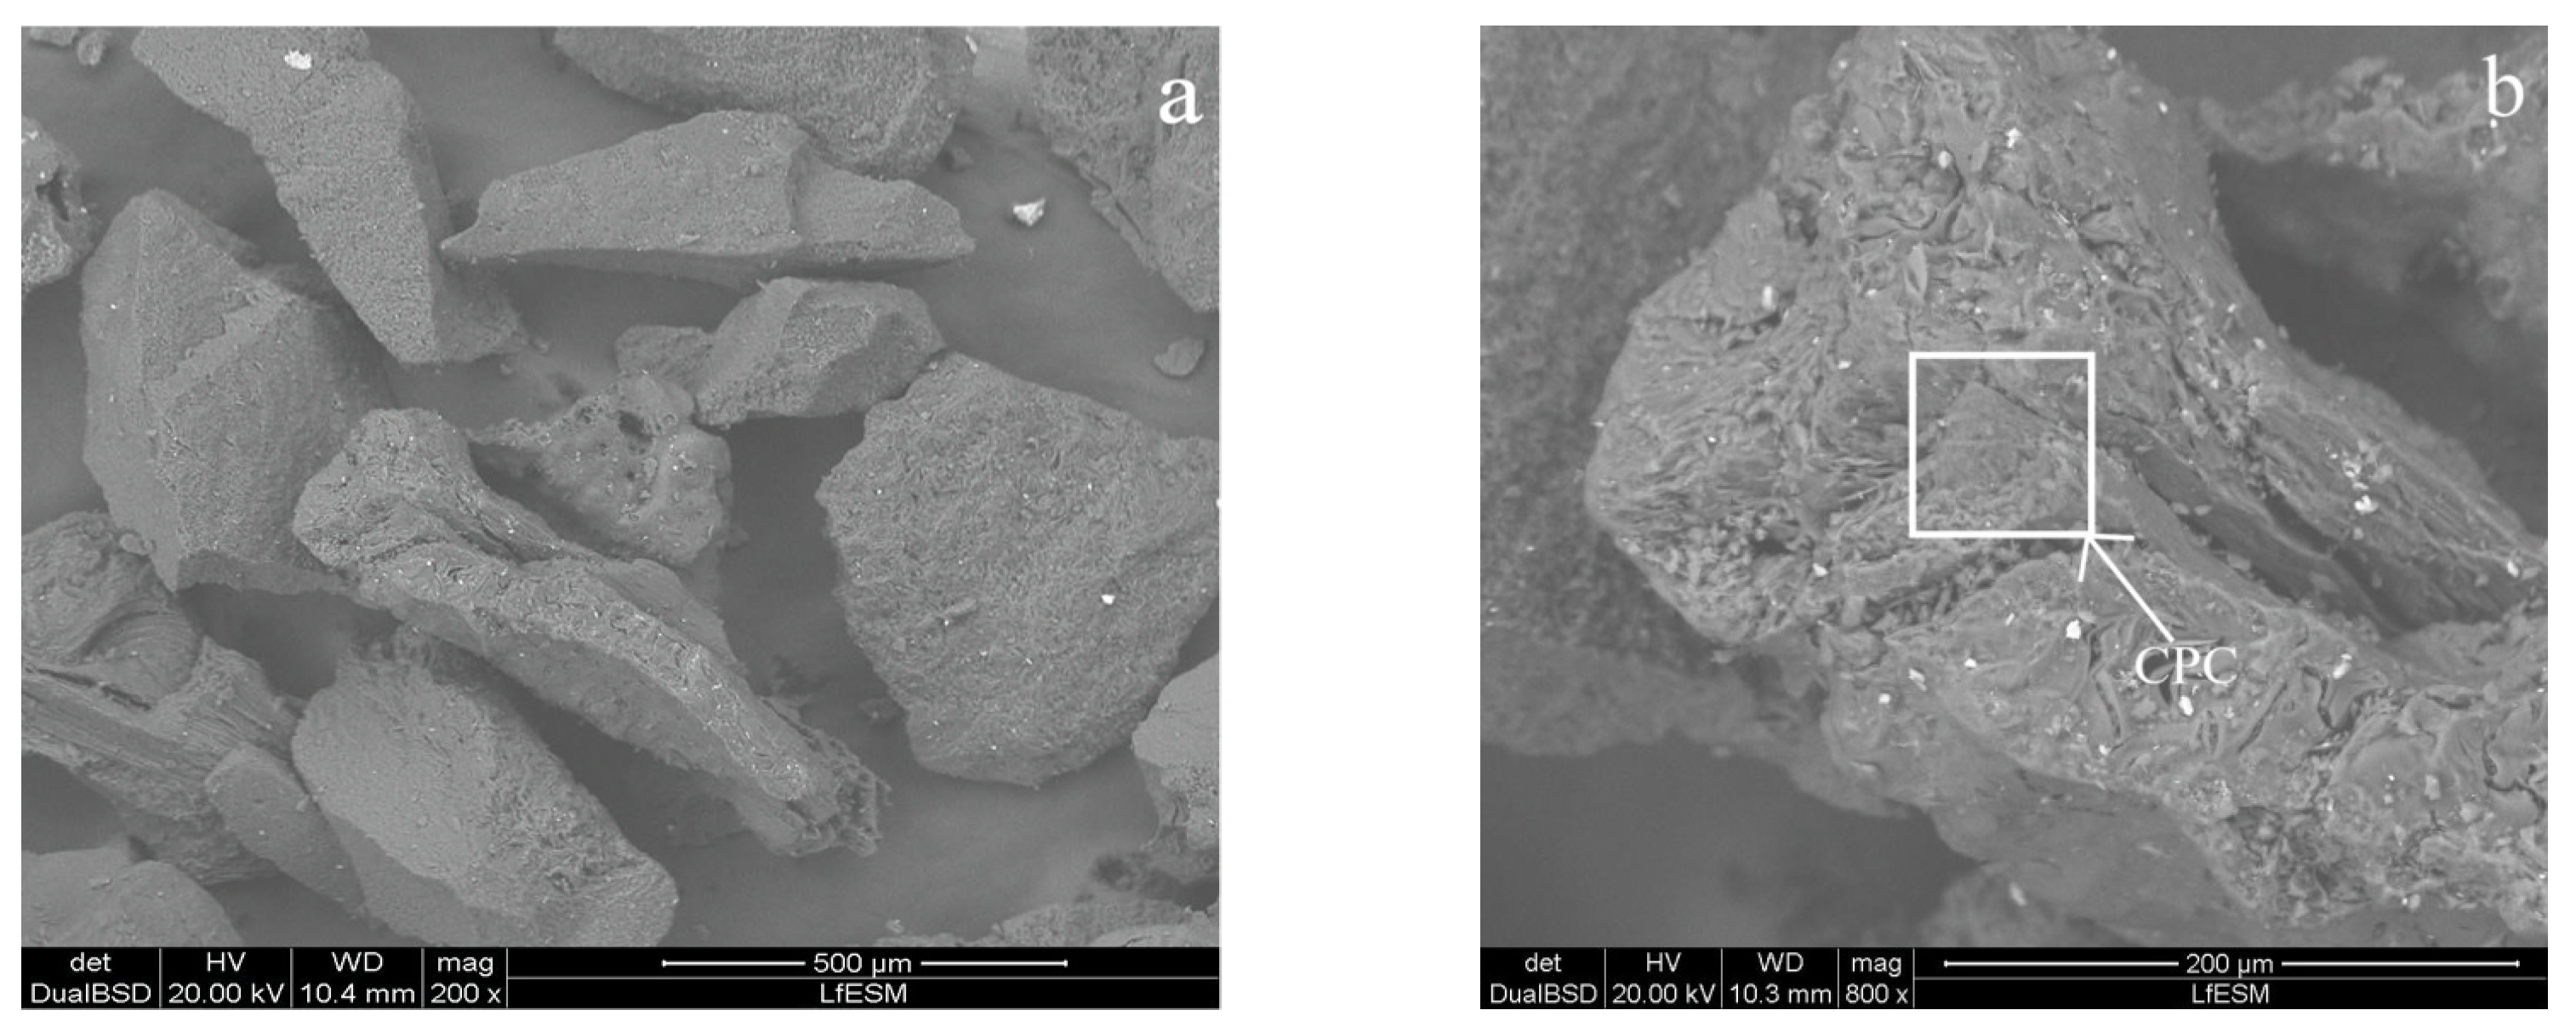
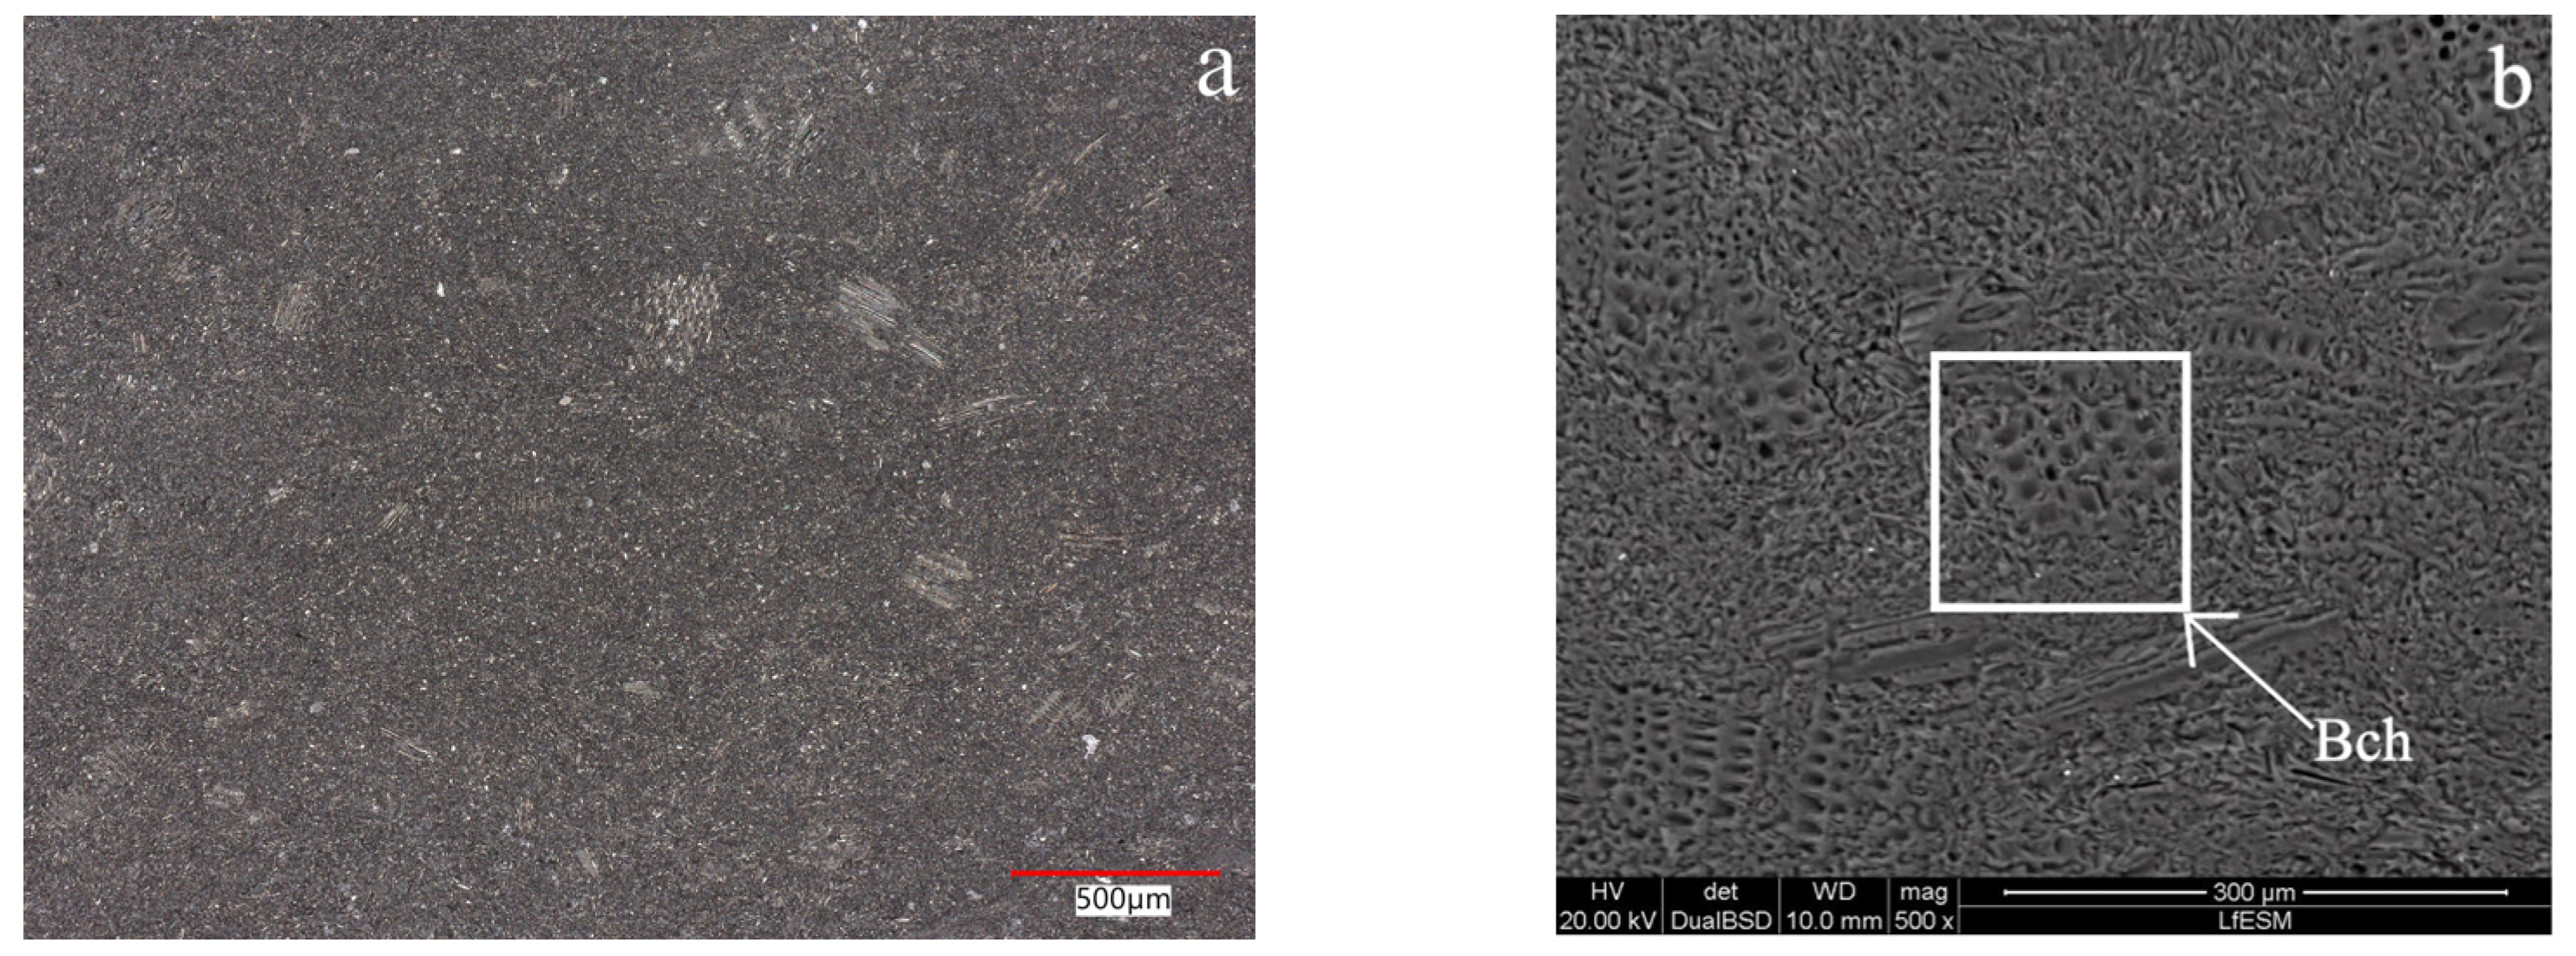
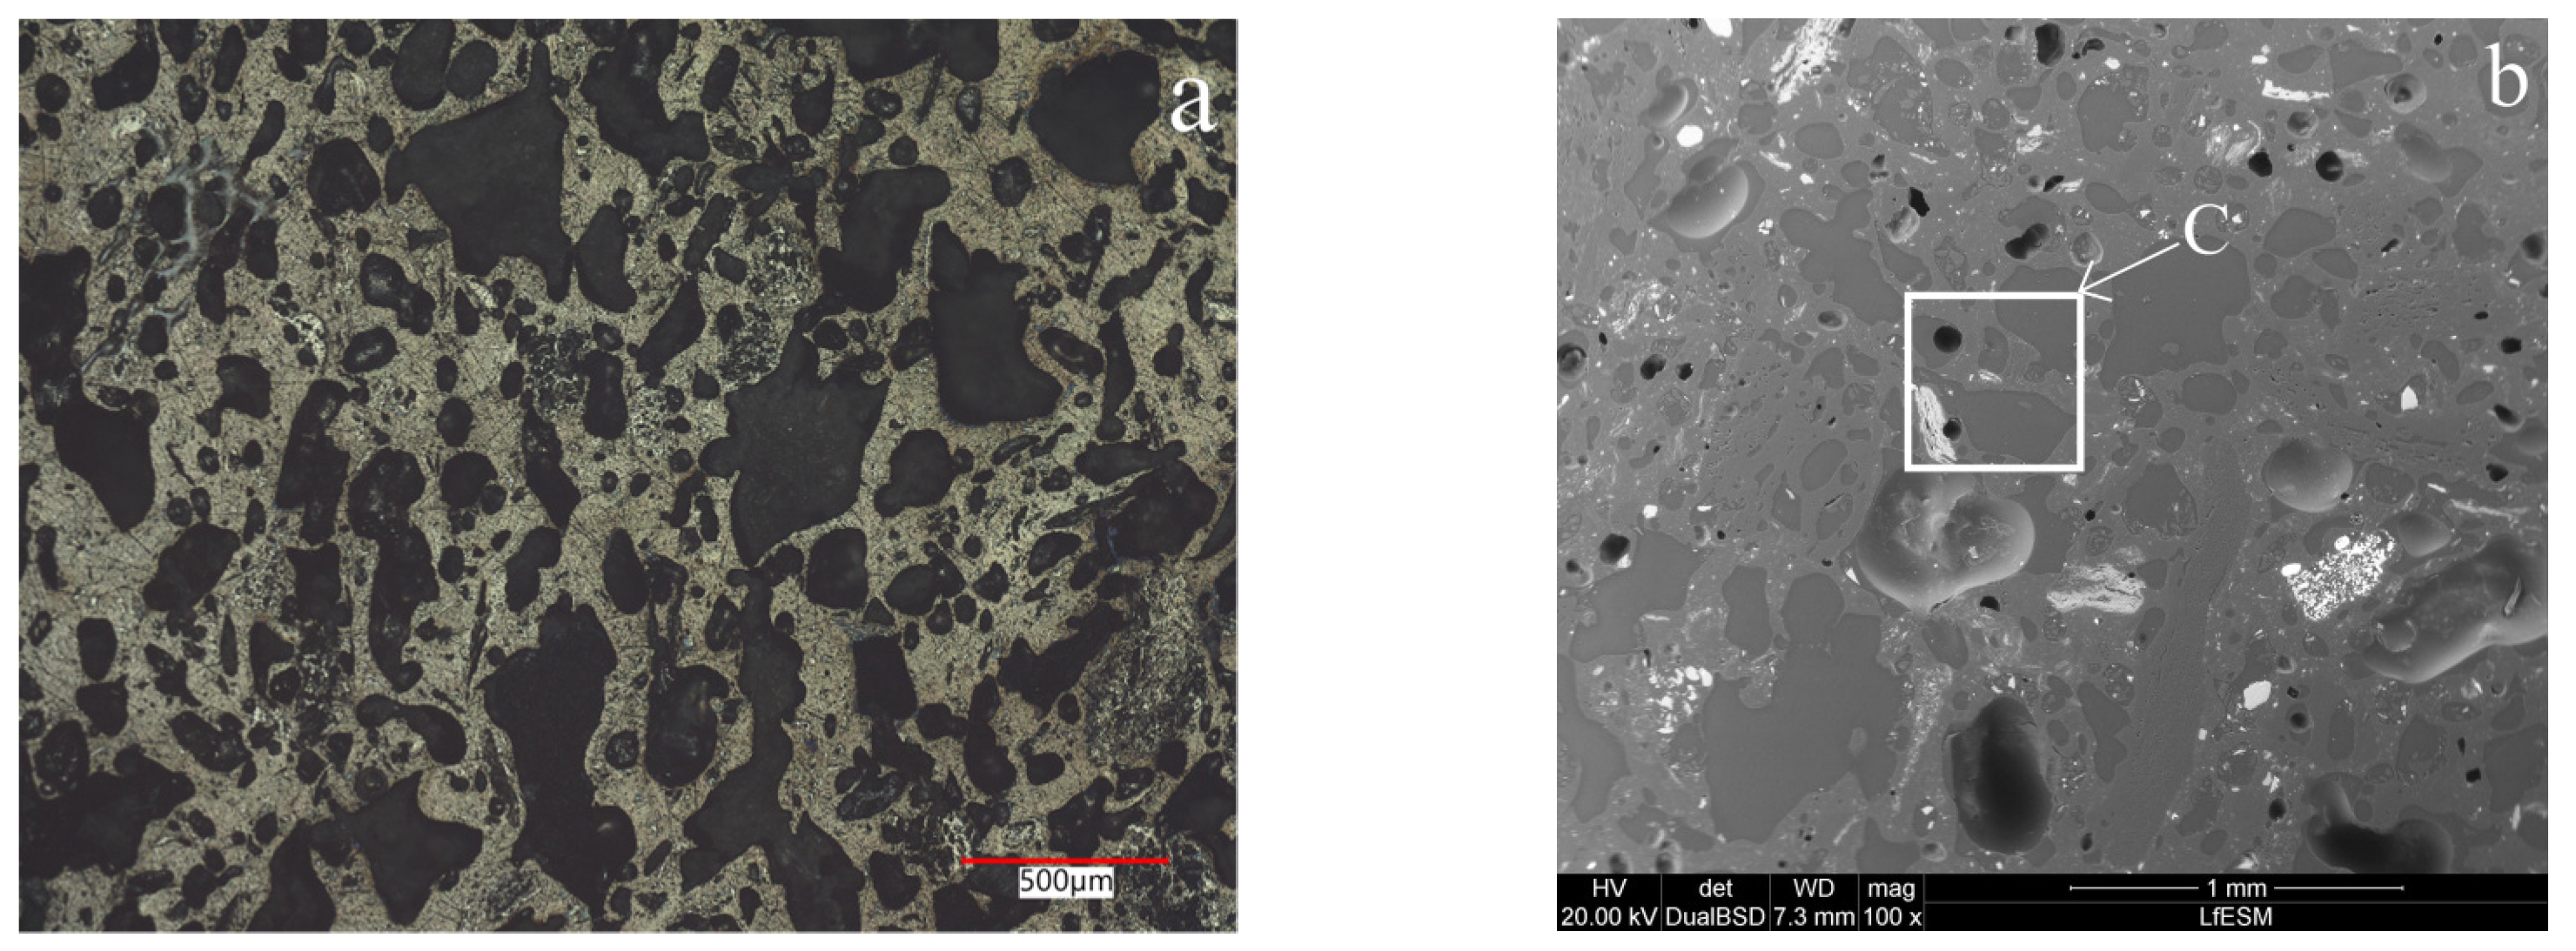
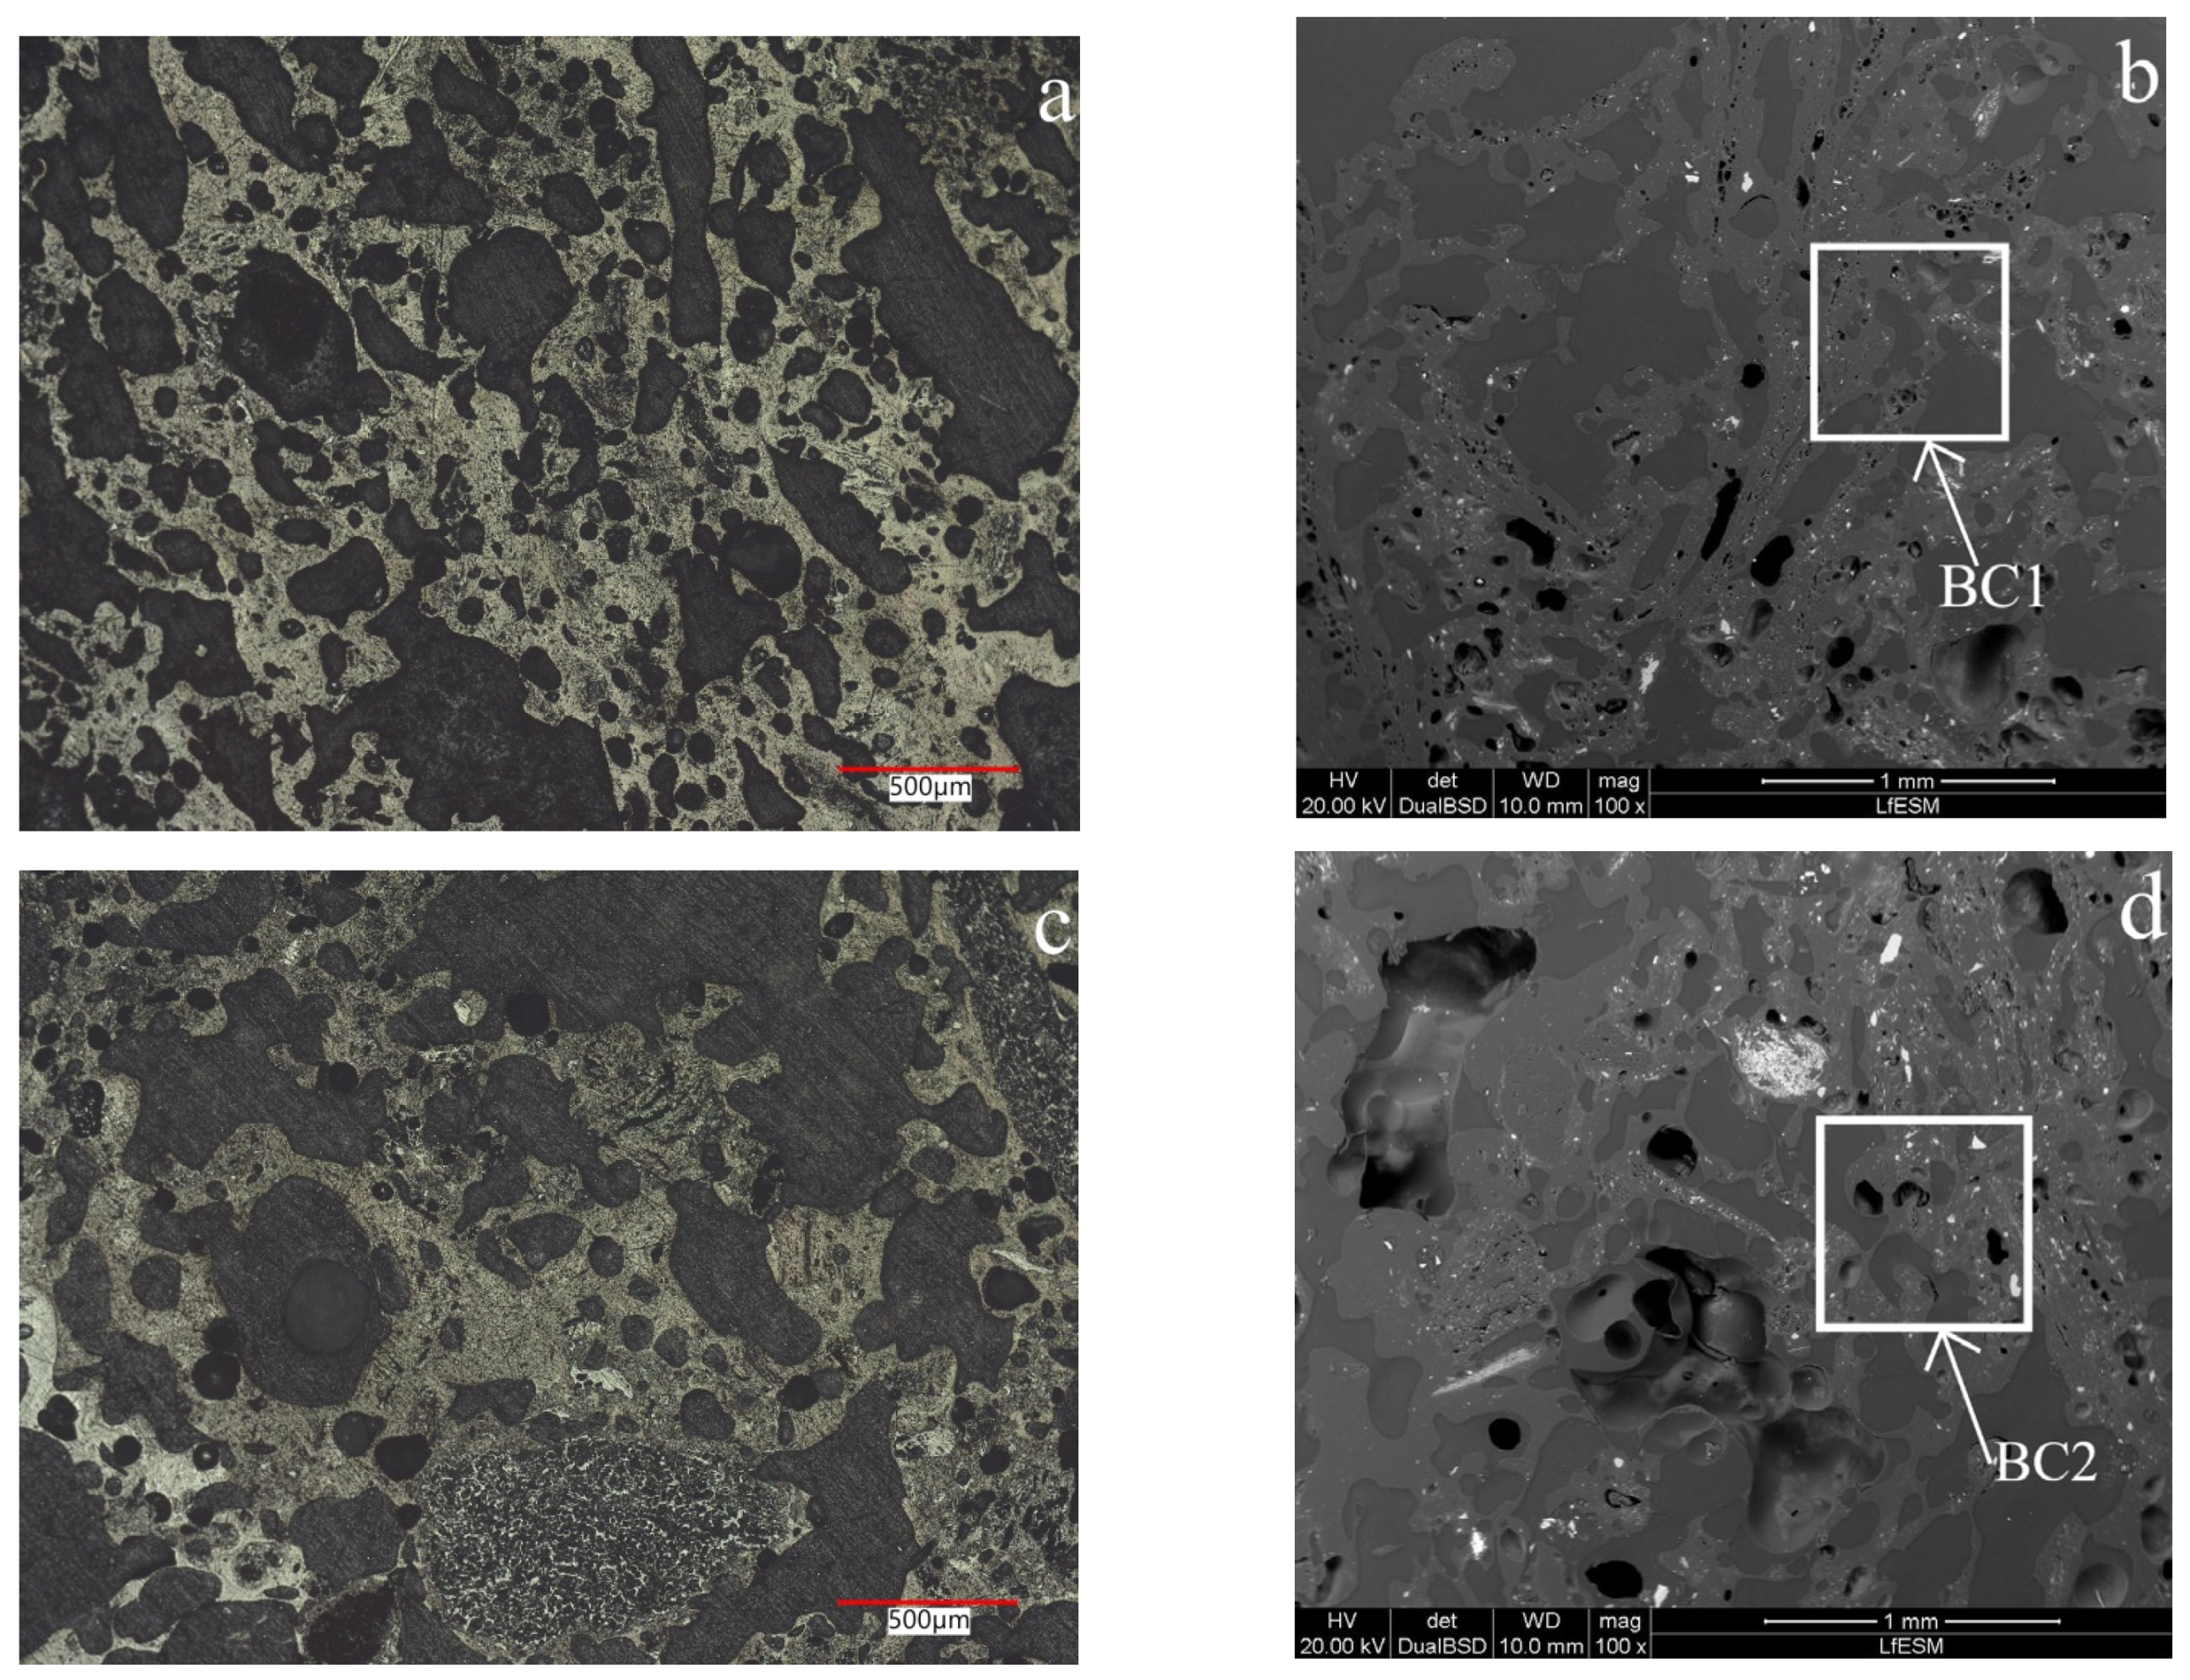
Table 3 shows no significant difference in the ash composition of biocokes. However, BC2 was characterized by a lower content of phosphorus oxide. The lower value of phosphorus oxide for BC2 can be explained by the replacement of a large amount of less phosphorus-containing additives than in the components of the coal blend. The highest ash basicity was for biochar and was determined by the presence of CaO. The low content of CaO in biocokes can be explained by the low content of CaO in the coal blend and the slight influence on the change in CaO from the addition of biomaterials. The other samples had similar small values. The SEM/EDS analysis revealed that typical ash minerals were found in all samples [43,56,57].
The effect of the additive in the biocoke samples did not significantly influence the CRI (Table 4), as also observed by [58]. However, the CSR was influenced negatively. A low microstructural ordering might explain the lower CSR values due to an inert additive (3 wt.% torrefied biomass in the case of BC2). CSR was even lower for BC2 than for BC1, reflecting the overall higher amount of additives (3 wt.% charcoal and 3 wt.% petroleum coke) due to the fact that petroleum coke can be considered an inert additive.
The BET SSA of carbon sources is important since the process of interaction first begins along the surface. In addition, high BET SSA values indicate a high porosity of materials, which leads to an increase in the reactivity [40] of carbon sources, all other things being equal (chemical and structural properties). A mesopore structure characterized all of the studied samples according to the International Union of Pure and Applied Chemistry (IUPAC) definition (Table 4). Biochar was characterized by the greatest BET SSA value. It is worth noting that the addition of 3 wt.% charcoal and 3 wt.% petroleum coke into BC2 did not significantly affect the BET SSA compared to BC1 with 3 wt.% torrefied biomass.
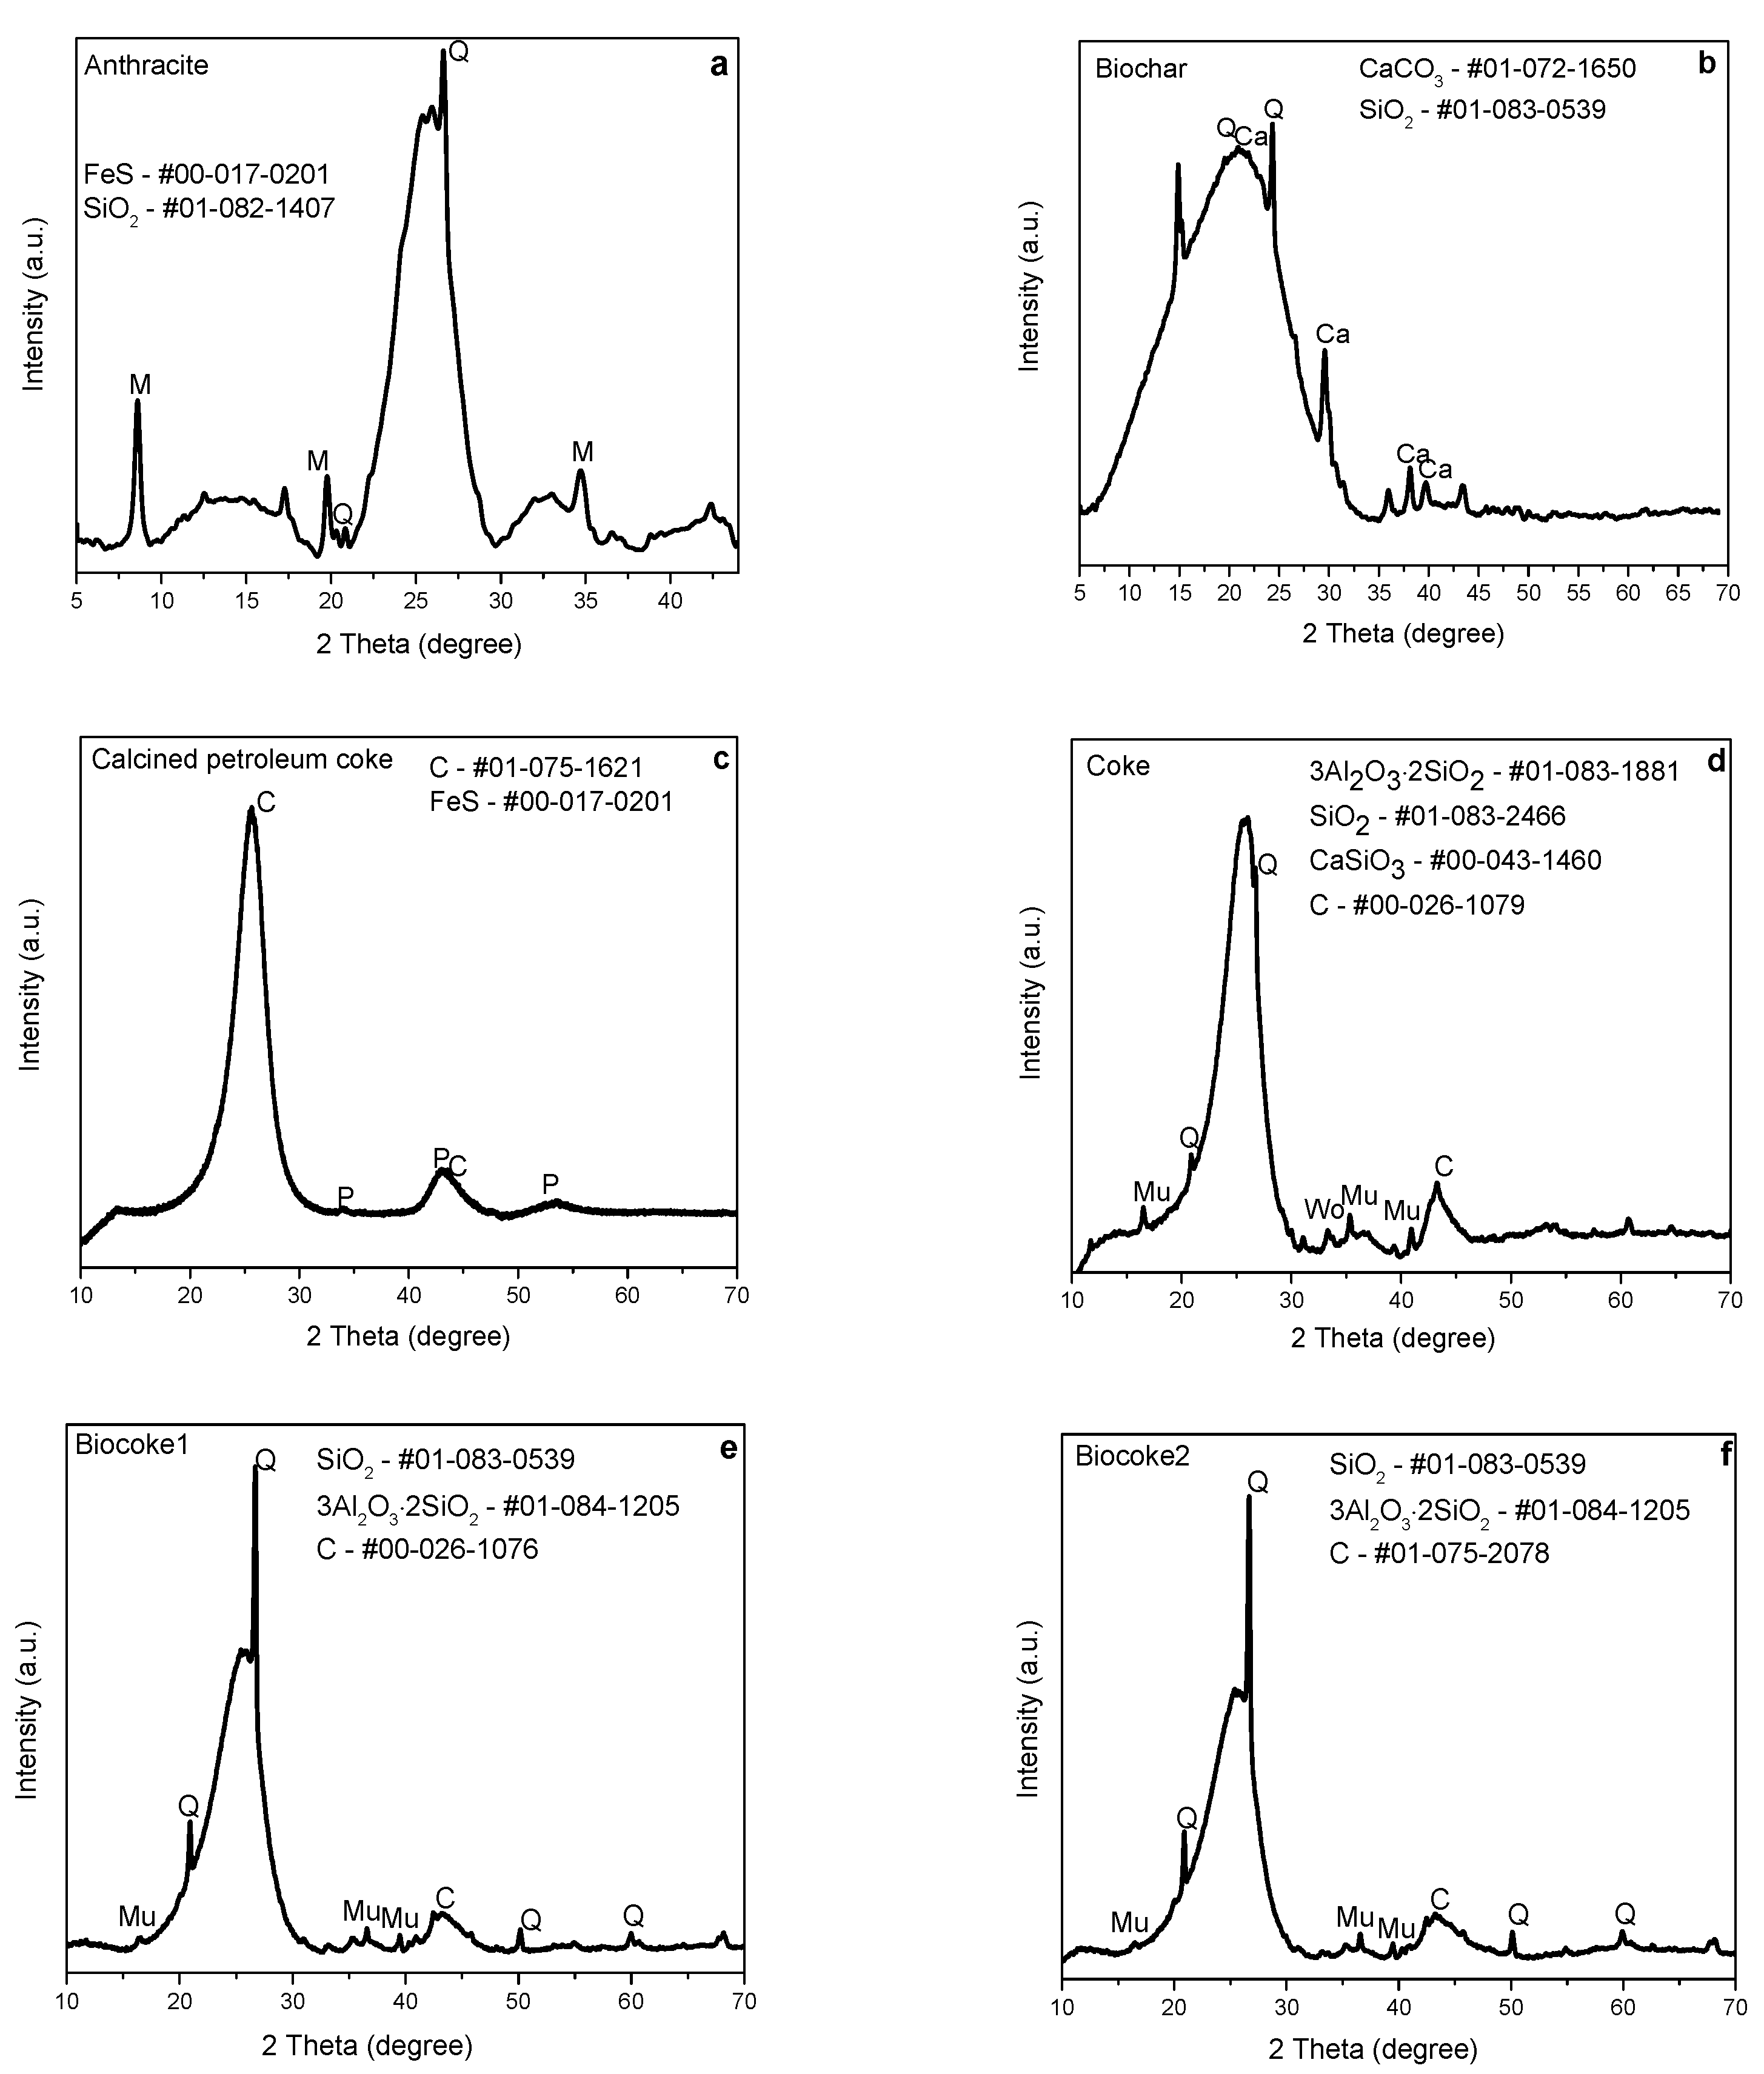
Although d002 for the four coke samples was approximately the same (Table 6), the value of Lc was higher for coke. When comparing the BC1 and BC2 samples, 6 wt.% of total additives in BC2 had more effect on the degree of graphitization compared to the sample with 3 wt.% of total additives in BC1. As the XRD analysis results showed, after coking the blend to obtain BC1, the best ordering of the structure was observed compared to BC2. Additional confirmation was the lower CRI value, which was consistent with the results in Table 4. In addition, it was noticed that anthracite had a more ordered carbon structure and larger crystallite size compared to carbon sources that had been artificially ordered by carbonization. Similar results and conclusions regarding the microstructural ordering of anthracite and coke have been shown in [59,60].
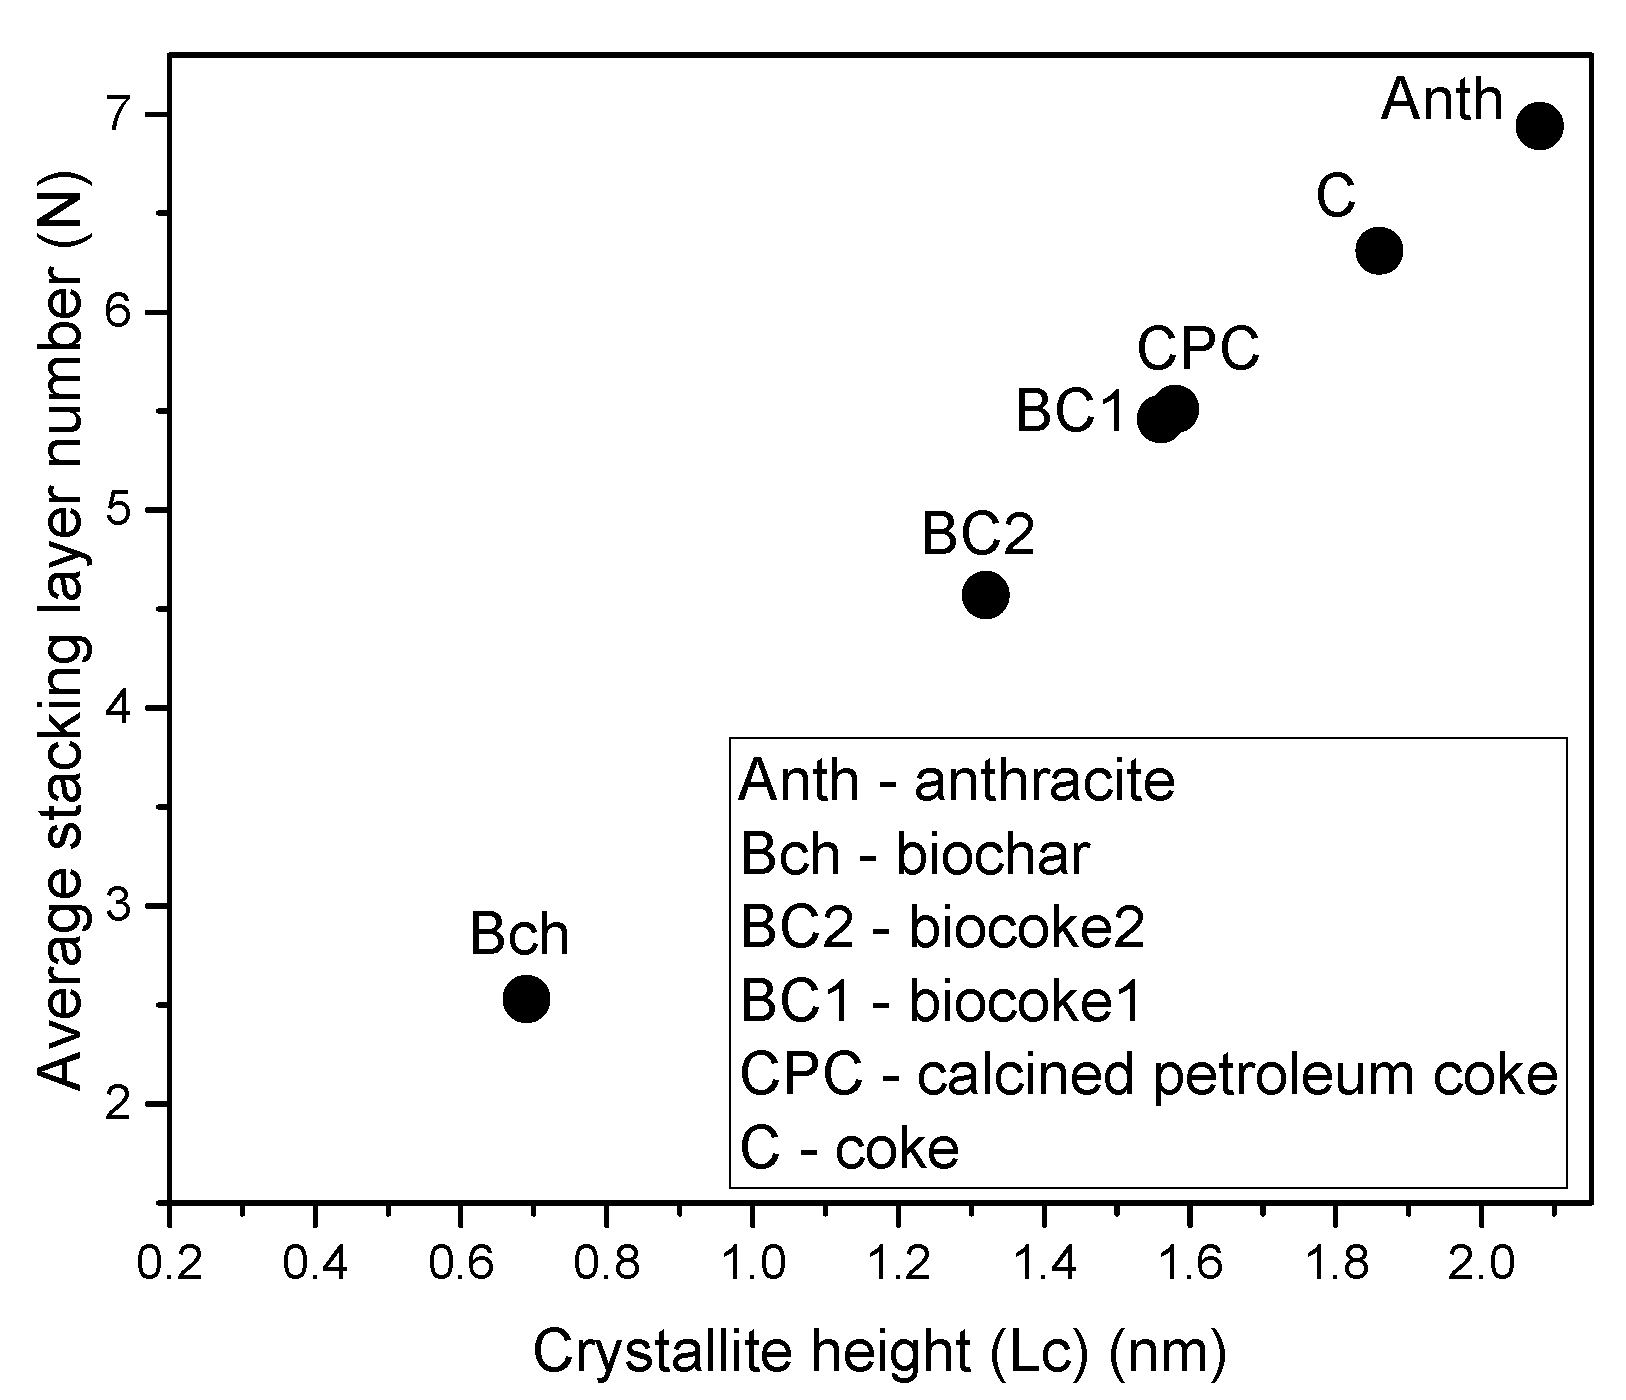
It can be summarized that the amount of disordered carbon structure increases in the following order: C < CPC ~ BC1 < BC2 < Bch (Figure 8) excluding anthracite, as it is a naturally ordered carbon material compared to the other four samples subjected to carbonization.
As can be seen from the results above, conventional high-temperature coke is a more ordered material than other studied materials ordered by carbonization (Table 7). When comparing the microstructural ordering between BC1 and BC2, in BC1, the total amount of the additive is a more ordered carbon material, which is consistent with the results of the XRD analysis.
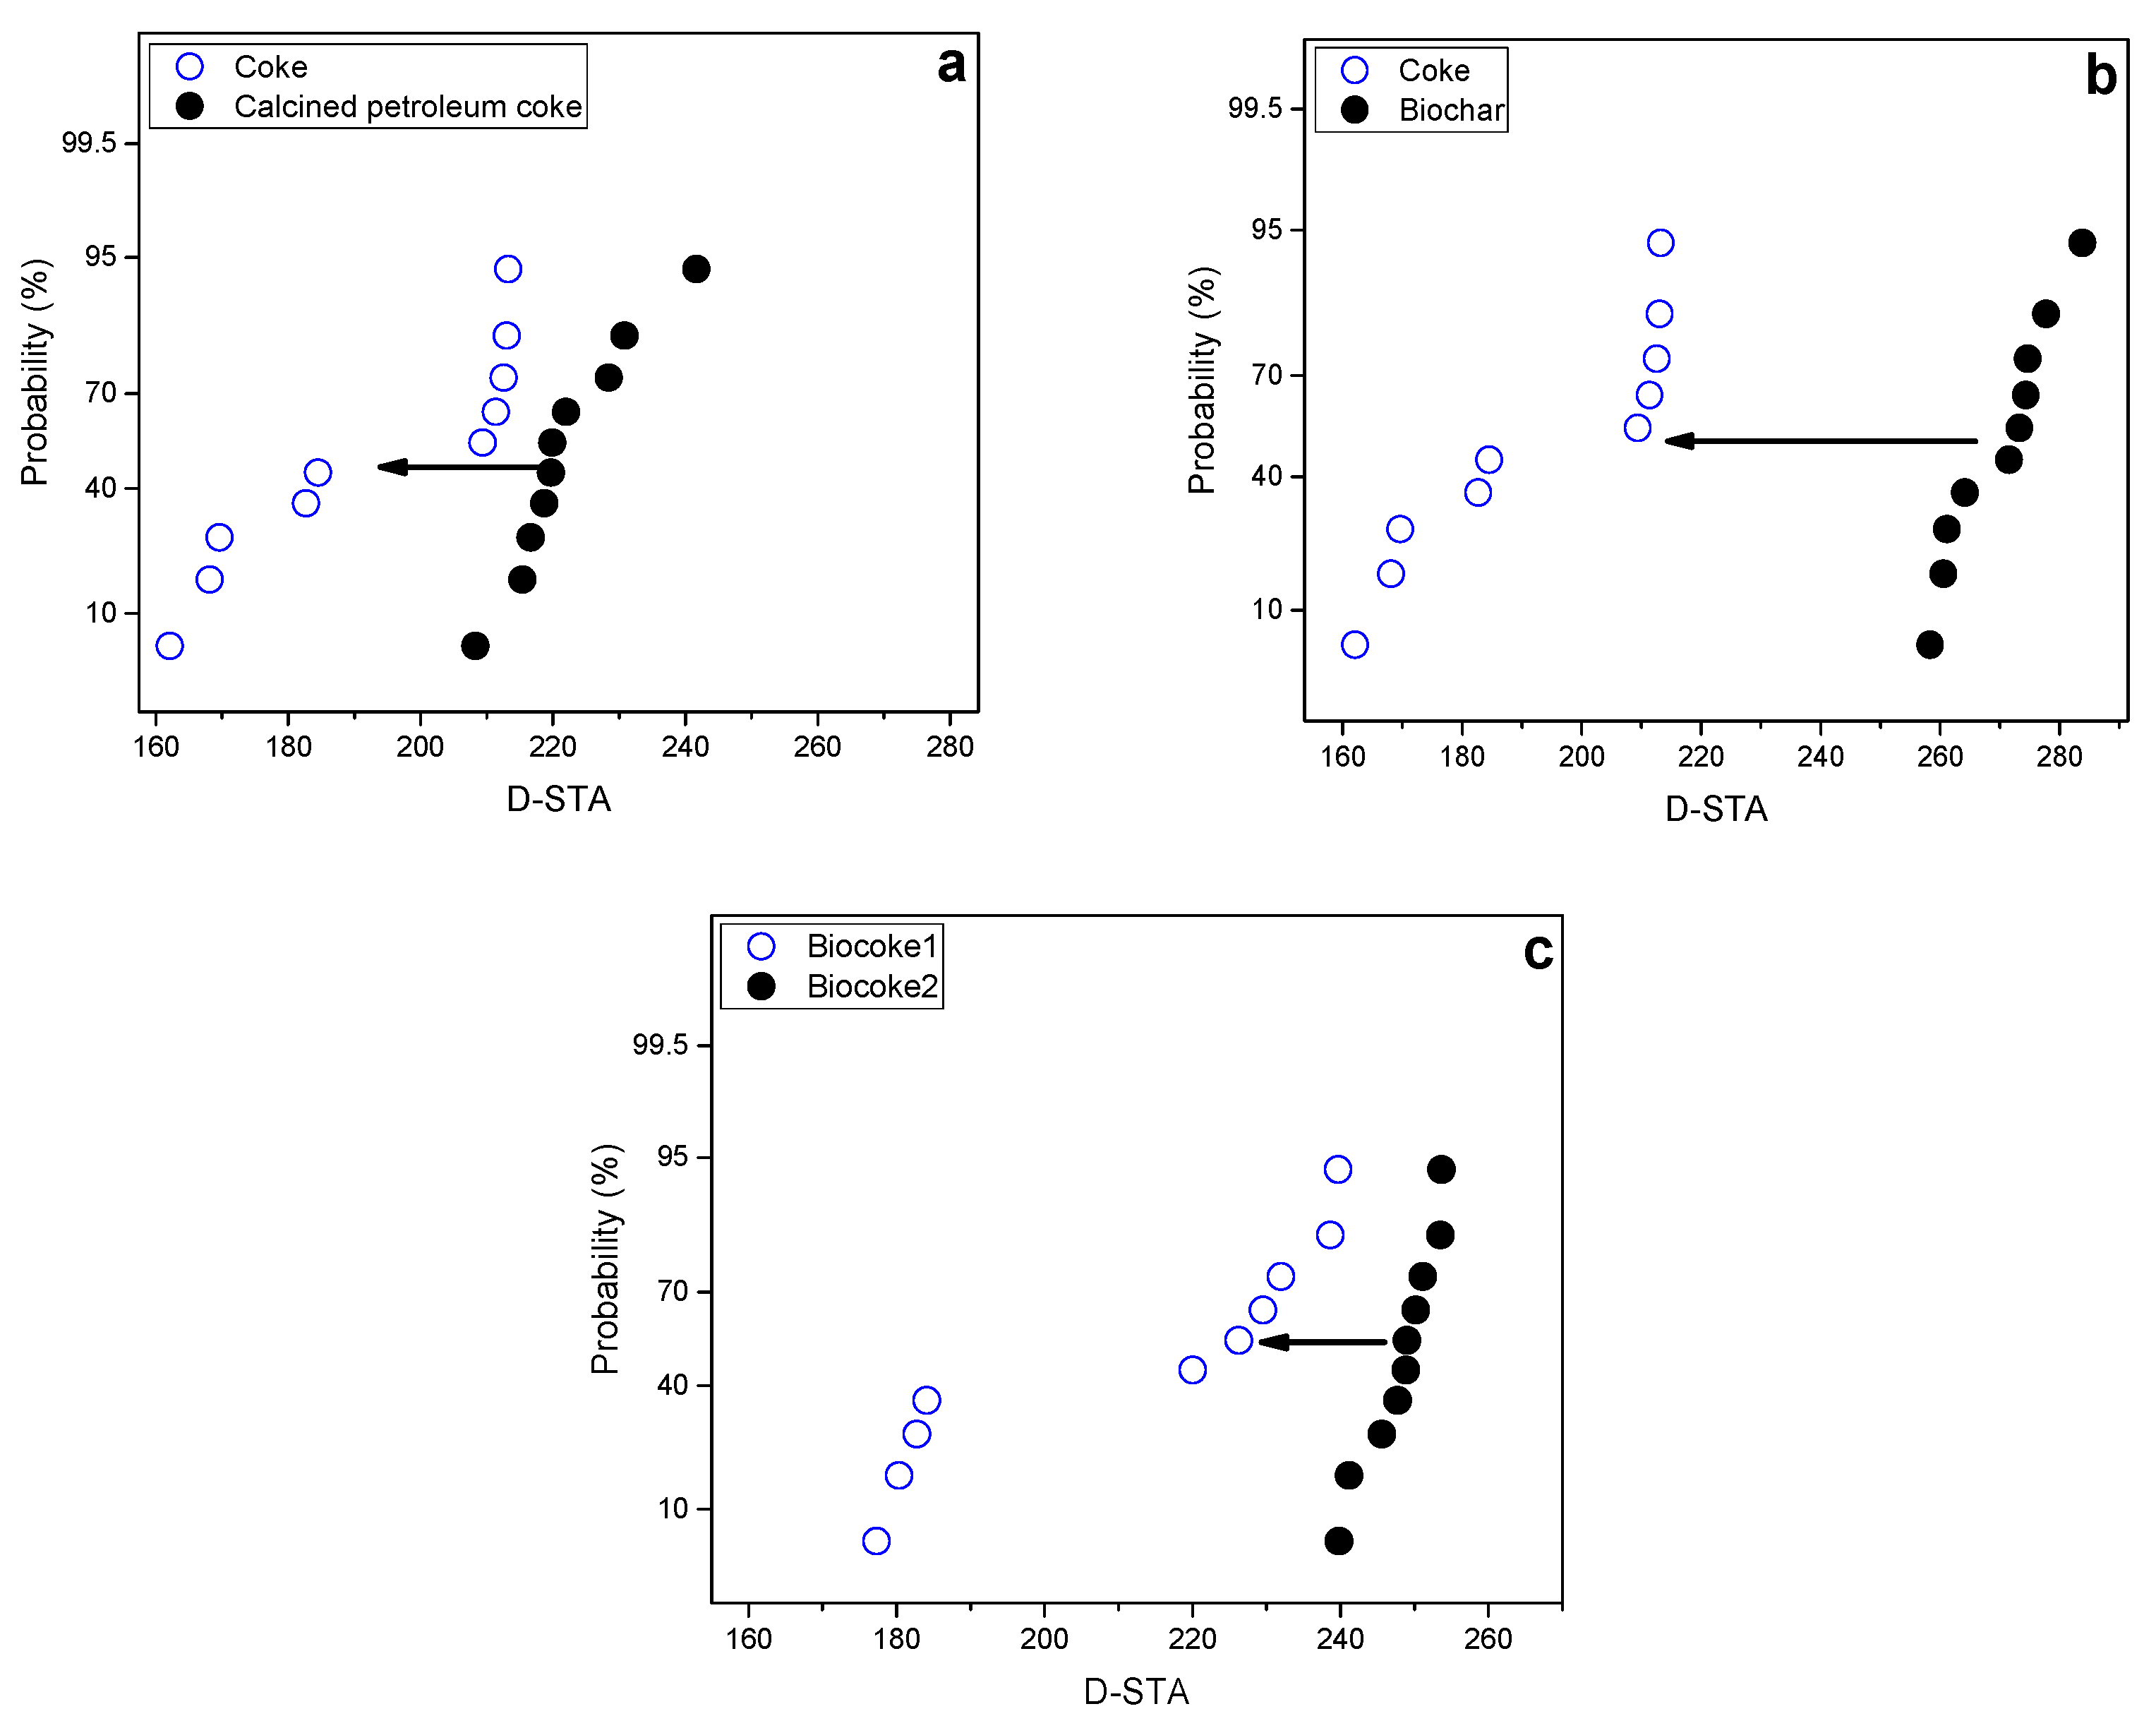
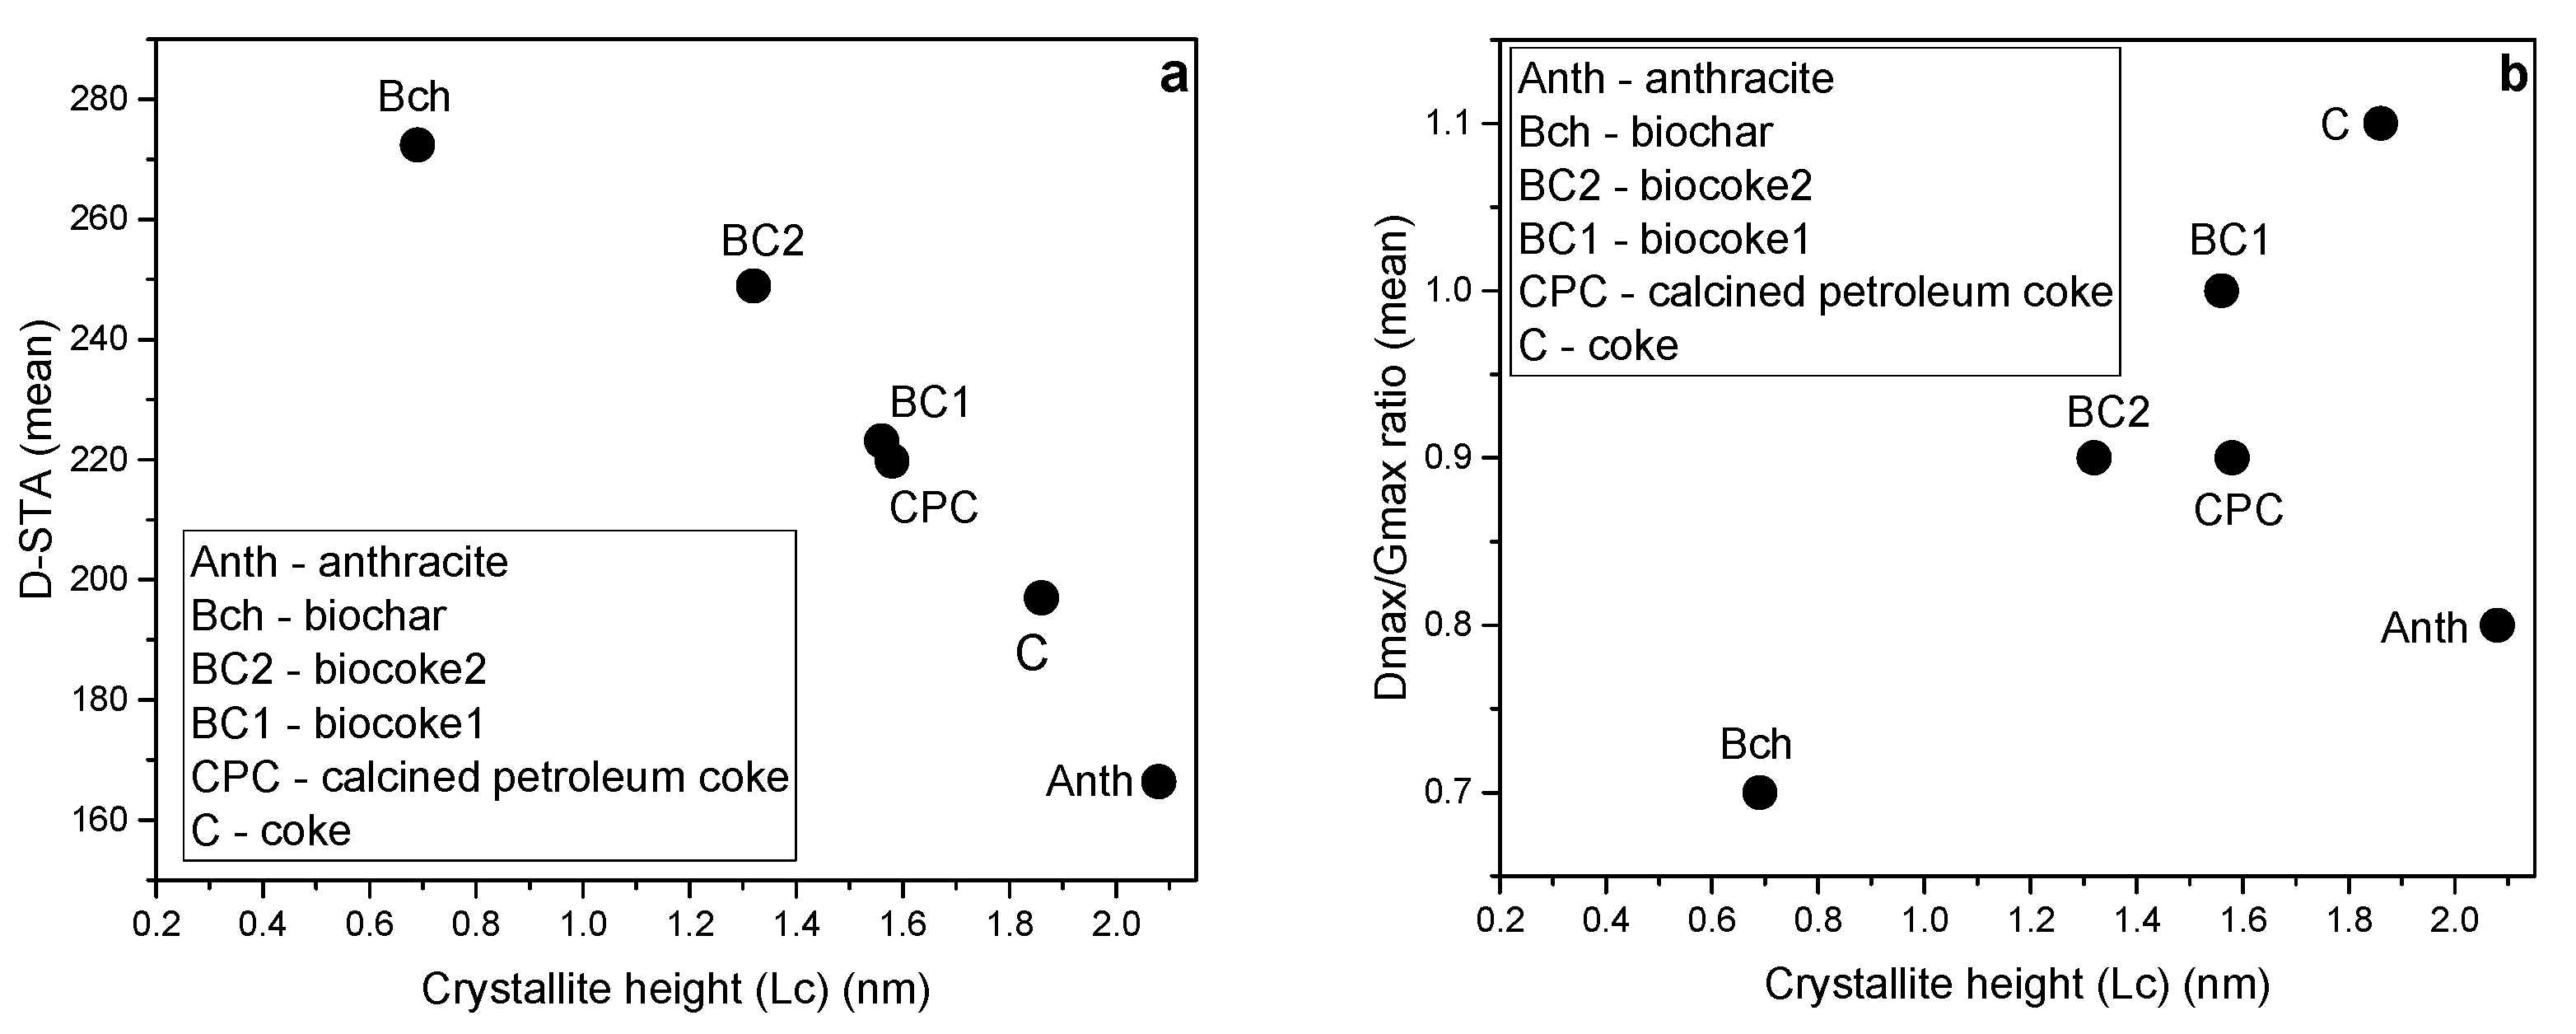
According to Figure 9a, the higher the Lc, the lower the D-STA value, which characterizes the carbon material as more ordered, and this relationship showed the order: Bch < BC2 < BC1 ~ CPC < C. Figure 9b shows the relationship between Lc and the Dmax/Gmax ratio (mean). The Dmax/Gmax ratio increased in the order of C > BC1 > CPC = BC2 > Bch, indicating increasingly growing aromatic layers that develop a local molecular orientation.
It can be summarized that the carbonization of biochar is an essential condition to improve its properties and the possibility of its further use. Regarding ordering, the biocoke samples were less ordered materials than coke and calcined petroleum coke.
Generally, coke is the most common metallurgical carbon source. However, for EAFs, coke is used, which is obtained according to the requirements of the BF process, namely with low reactivity and high strength.
During the smelting process, the carbon source should have certain reactivity, which can be on the same level as conventional carbon sources or those more reactive. Therefore, the use of biocoke for EAFs can have a number of advantages, namely, increased reactivity, reduced ash content (due to lower ash content of biomaterials), sulfur content, high strength, and reduced GHG emissions with other indicators that are not inferior to conventional coke (for instance, volatile matter, fixed carbon). In the case of using coke for EAFs, quality characteristics more suitable for BF production than for EAF have to be considered.
Thus, biocoke can be considered as a promising option to replace conventional carbon sources since biomass/charcoal additives have less effect on changing the properties of coke while reducing the ash content and sulfur content, and the volatile matter can be on a level with conventional coke since this parameter depends on the severity of carbonization. In the case of biocoke, achieving high values of fixed carbon content at the same level as coke is possible. It has been established that up to 5 wt.% bio-additives can be used to replace coal in the production of biocoke without a significant deterioration in the reactivity [61]. Compared to biochar, it is a less reactive and more mechanically strong material.

5. Conclusions

A comparative study investigated the properties (CRI and CSR, BET SSA, BJH pore size and volume, ash chemical composition, microstructure) of conventional and non-conventional carbon-bearing sources. Characteristics of the crystallinity of carbon sources obtained using Raman spectroscopy and XRD analysis can be of scientific and practical interest as the ordering of carbon sources determines their interaction with oxygen to create slag foam and further influence the smelting process in EAF. The obtained results assessed the suitability of different carbon-bearing sources for their use in EAF-based steel production. The following conclusions can be drawn for conventional carbon-bearing sources:
(1)
The use of studied anthracite has the advantage of being characterized by a relatively low sulfur value of 0.48 wt.% and a rather high fixed carbon value of 85.81 wt.%. However, it was characterized by an ash value of 10.50 wt.%. The disadvantages of anthracite for use in the EAFs are less fixed carbon compared to carbonized materials as well as a lower calorific value.
(2)
Using calcined petroleum coke as a carbon source has low ash and VM content advantages. In contrast, the sulfur content was similar to other carbon-bearing materials (except biochar). Calcined petroleum coke had the highest fixed carbon content of 98.63 wt.% and calorific value of 32.74 wt.% compared to other conventional and non-conventional carbon-bearing sources. As a result of calcination, petroleum coke was characterized by a layered and cracked structure. This material had the highest potassium content compared to the other studied materials. Calcined petroleum coke had a well-ordered microstructure, predominantly inferior to coke.
(3)
The use of coke was determined by low values of VM and sulfur as well as high values of fixed carbon and calorific value. The ash composition of coke was predominantly characterized by silica and aluminum oxide. CRI and CSR were within the requirements. In terms of microstructural ordering, coke was characterized by the least amount of disordered carbon structure and had the best ordering among artificially ordered materials after carbonization.
The following conclusions were drawn for non-conventional carbon-bearing sources:
(1)
The use of biochar is preferred over conventional carbon-bearing sources since it is characterized by a low ash content, practically no sulfur, and a high hydrogen content. However, a low fixed carbon value limits its use. Biochar was also characterized by the highest ash basicity value and had the highest BET SSA value. Biochar also had an inferior microstructural order. Consequently, carbonization at 600 °C or higher is necessary for its use to maintain the required fixed carbon value and reduce VM.
(2)
Biocoke is a good option to replace conventional carbon-bearing sources. Both biocoke samples had high fixed carbon values but slightly higher ash values. The CSR values were much lower, which could be explained by the influence of inert additives. The biocoke samples were inferior to conventional carbon sources obtained after carbonization in terms of ordering. Nevertheless, using biocoke for EAFs can have benefits such as increased reactivity, reduced ash content (due to lower ash content of biomaterials) and sulfur content, high strength, and reduced GHG emissions.

Author Contributions

Conceptualization, L.K. and J.S.; Investigation, L.K., A.H. and H.H.; Methodology, L.K., A.K. and A.H.; Supervision, J.S.; Writing—original draft, L.K.; Writing—review & editing, J.S., A.K. and G.R. All authors have read and agreed to the published version of the manuscript.

Funding

This research received no external funding.

Institutional Review Board Statement

Not applicable.

Informed Consent Statement

Not applicable.

Data Availability Statement

Not applicable.

Acknowledgments

This research was supported by the scholarship program “Scholarship of the Scholarship Foundation of the Republic of Austria, Postdocs,” [MPC-2022-02241], financed by the Federal Ministry of Education, Science and Research of Austria, which is gratefully acknowledged. Stahl-und Walzwerk Marienhütte GmbH, Graz, Austria; Voestalpine Stahl GmbH, Linz, Austria; and ThyssenKrupp Steel Europe AG, Duisburg, Germany are gratefully acknowledged for providing the sample materials for this research. The authors are also grateful to the reviewers for their insightful comments and efforts in improving the manuscript.

Conflicts of Interest

The authors declare no conflict of interest.

References

  1. European Steel Technology Platform (ESTEP): Clean Steel Partnership Roadmap; 2020. Available online: https://www.estep.eu/assets/Uploads/CSP-SRIA-Oct2021-clean.pdf (accessed on 27 January 2023).
  2. Suer, J.; Traverso, M.; Ahrenhold, F. Carbon Footprint of Scenarios towards Climate-Neutral Steel According to ISO 14067. J. Clean. Prod. 2021, 318, 128588. [Google Scholar] [CrossRef]
  3. Reimann, A.; Hay, T.; Echterhof, T.; Kirschen, M.; Pfeifer, H. Application and Evaluation of Mathematical Models for Prediction of the Electric Energy Demand Using Plant Data of Five Industrial-Size EAFs. Metals 2021, 11, 1348. [Google Scholar] [CrossRef]
  4. Schubert, C.; Büschgens, D.; Eickhoff, M.; Echterhof, T.; Pfeifer, H. Development of a Fast Modeling Approach for the Prediction of Scrap Preheating in Continuously Charged Metallurgical Recycling Processes. Metals 2021, 11, 1280. [Google Scholar] [CrossRef]
  5. Suer, J.; Ahrenhold, F.; Traverso, M. Carbon Footprint and Energy Transformation Analysis of Steel Produced via a Direct Reduction Plant with an Integrated Electric Melting Unit. J. Sustain. Metall. 2022, 8, 1532–1545. [Google Scholar] [CrossRef]
  6. Fan, Z.; Friedmann, S.J. Low-Carbon Production of Iron and Steel: Technology Options, Economic Assessment, and Policy. Joule 2021, 5, 829–862. [Google Scholar] [CrossRef]
  7. Steel Statistical Yearbook 2019. Available online: https://worldsteel.org/wp-content/uploads/Steel-Statistical-Yearbook-2019-concise-version.pdf (accessed on 27 January 2023).
  8. Cardarelli, A.; De Santis, M.; Cirilli, F.; Barbanera, M. Computational Fluid Dynamics Analysis of Biochar Combustion in a Simulated Ironmaking Electric Arc Furnace. Fuel 2022, 328, 125267. [Google Scholar] [CrossRef]
  9. Kieush, L.; Koveria, A.; Schenk, J.; Rysbekov, K.; Lozynskyi, V.; Zheng, H.; Matayev, A. Investigation into the Effect of Multi-Component Coal Blends on Properties of Metallurgical Coke via Petrographic Analysis under Industrial Conditions. Sustainability 2022, 14, 9947. [Google Scholar] [CrossRef]
  10. Mombelli, D.; Quadrio, M.; Mapelli, C.; Echterhof, T.; Fernandez Aparicio, L.; Sorger, C.; Griessacher, T.; Mudersbach, D.; Schüler, S. Influence of the Recirculation of Various By-Products Generated through Electric Arc Furnace Route on EAF Slag Quality. ISIJ Int. 2022, 62, 2610–2621. [Google Scholar] [CrossRef]
  11. International Iron and Steel Institute. EAF Technology. State of the Art & Future Trends; IISI: Brussels, Belgium, 2000. [Google Scholar]
  12. Ji, F.-Z.; Barati, M.; Coley, K.; Irons, G.A. Kinetics of coal injection into iron oxide containing slags. Can. Metall. Q. 2005, 44, 85–94. [Google Scholar] [CrossRef]
  13. Coley, K.S. Progress in the Kinetics of Slag-Metal-Gas Reactions, Past Present and Future. J. Min. Met. B Met. 2013, 49, 191–199. [Google Scholar] [CrossRef]
  14. Agnihotri, A.; Singh, P.K.; Singh, D.; Gupta, M. Foamy Slag Practice to Enhance the Energy Efficiency of Electric Arc Furnace: An Industrial Scale Validation. Mater. Today Proc. 2021, 46, 1537–1542. [Google Scholar] [CrossRef]
  15. Menad, N.-E.; Kana, N.; Seron, A.; Kanari, N. New EAF Slag Characterization Methodology for Strategic Metal Recovery. Materials 2021, 14, 1513. [Google Scholar] [CrossRef]
  16. Echterhof, T. Review on the Use of Alternative Carbon Sources in EAF Steelmaking. Metals 2021, 11, 222. [Google Scholar] [CrossRef]
  17. Schmitz, N.; Sankowski, L.; Kaiser, F.; Schwotzer, C.; Echterhof, T.; Pfeifer, H. Towards CO2-Neutral Process Heat Generation for Continuous Reheating Furnaces in Steel Hot Rolling Mills—A Case Study. Energy 2021, 224, 120155. [Google Scholar] [CrossRef]
  18. Fit for 55 2022. Available online: https://www.consilium.europa.eu/en/policies/green-deal/fit-for-55-the-eu-plan-for-a-green-transition/ (accessed on 27 January 2023).
  19. Huang, D.; Dinga, C.D.; Tao, Y.; Wen, Z.; Wang, Y. Multi-Objective Optimization of Energy Conservation and Emission Reduction in China’s Iron and Steel Industry Based on Dimensionality Reduction. J. Clean. Prod. 2022, 368, 133131. [Google Scholar] [CrossRef]
  20. Wang, R.; Zhao, Y.; Babich, A.; Senk, D.; Fan, X. Comprehensive Study on the Reduction of Biomass Embedded Self-Reducing Pellets (SRP) under H2 Involved Conditions by TG-DTA. Powder Technol. 2022, 407, 117654. [Google Scholar] [CrossRef]
  21. Oliveira, T.L.; Assis, P.S.; Leal, E.M.; Ilídio, J.R. Study of Biomass Applied to a Cogeneration System: A Steelmaking Industry Case. Appl. Therm. Eng. 2015, 80, 269–278. [Google Scholar] [CrossRef] [Green Version]
  22. Demus, T.; Echterhof, T.; Pfeifer, H.; Schulten, M.; Noel, Y.; Quicker, P. Investigations on the Use of Biogenic Residues as a Substitute for Fossil Coal in the EAF Steelmaking Process. In Proceedings of the 10th European Electric Steelmaking Conference, Graz, Austria, 25–28 September 2012; Volume 10. [Google Scholar]
  23. Rejdak, M.; Wojtaszek-Kalaitzidi, M.; Gałko, G.; Mertas, B.; Radko, T.; Baron, R.; Książek, M.; Yngve Larsen, S.; Sajdak, M.; Kalaitzidis, S. A Study on Bio-Coke Production—The Influence of Bio-Components Addition on Coke-Making Blend Properties. Energies 2022, 15, 6847. [Google Scholar] [CrossRef]
  24. Demus, T.; Reichel, T.; Schulten, M.; Echterhof, T.; Pfeifer, H. Increasing the Sustainability of Steel Production in the Electric Arc Furnace by Substituting Fossil Coal with Biochar Agglomerates. Ironmak. Steelmak. 2016, 43, 564–570. [Google Scholar] [CrossRef]
  25. Meier, T.; Hay, T.; Echterhof, T.; Pfeifer, H.; Rekersdrees, T.; Schlinge, L.; Elsabagh, S.; Schliephake, H. Process Modeling and Simulation of Biochar Usage in an Electric Arc Furnace as a Substitute for Fossil Coal. Steel Res. Int. 2017, 88, 1600458. [Google Scholar] [CrossRef]
  26. Funke, A.; Demus, T.; Willms, T.; Schenke, L.; Echterhof, T.; Niebel, A.; Pfeifer, H.; Dahmen, N. Application of Fast Pyrolysis Char in an Electric Arc Furnace. Fuel Process. Technol. 2018, 174, 61–68. [Google Scholar] [CrossRef]
  27. Firsbach, F.; Senk, D.; Babich, A. Multi-Step Recycling of BF Slag Heat via Biomass for CO2 Mitigation. Minerals 2022, 12, 136. [Google Scholar] [CrossRef]
  28. Bhoi, B.; Jouhari, A.K.; Ray, H.S.; Misra, V.N. Smelting Reduction Reactions by Solid Carbon Using Induction Furnace: Foaming Behaviour and Kinetics of FeO Reduction in CaO–SiO2–FeO Slag. Ironmak. Steelmak. 2006, 33, 245–252. [Google Scholar] [CrossRef]
  29. Ru, B.; Wang, S.; Dai, G.; Zhang, L. Effect of Torrefaction on Biomass Physicochemical Characteristics and the Resulting Pyrolysis Behavior. Energy Fuels 2015, 29, 5865–5874. [Google Scholar] [CrossRef]
  30. Sahajwalla, V.; Zaharia, M.; Kongkarat, S.; Khanna, R.; Rahman, M.; Saha-Chaudhury, N.; O’Kane, P.; Dicker, J.; Skidmore, C.; Knights, D. Recycling End-of-Life Polymers in an Electric Arc Furnace Steelmaking Process: Fundamentals of Polymer Reactions with Slag and Metal. Energy Fuels 2012, 26, 58–66. [Google Scholar] [CrossRef]
  31. Zheng, Y.; Zhai, C.; Chen, A.; Yu, X.; Xu, J.; Sun, Y.; Cong, Y.; Tang, W.; Zhu, X.; Li, Y. Microstructure Evolution of Bituminite and Anthracite Modified by Different Fracturing Fluids. Energy 2023, 263, 125732. [Google Scholar] [CrossRef]
  32. Koveria, A.; Kieush, L.; Svietkina, O.; Perkov, Y. Metallurgical Coke Production with Biomass Additives. Part 1. A Review of Existing Practices. Can. Metall. Q. 2020, 59, 417–429. [Google Scholar] [CrossRef]
  33. Kieush, L.; Schenk, J.; Pfeiffer, A.; Koveria, A.; Rantitsch, G.; Hopfinger, H. Investigation on the Influence of Wood Pellets on the Reactivity of Coke with CO2 and Its Microstructure Properties. Fuel 2022, 309, 122151. [Google Scholar] [CrossRef]
  34. Bazaluk, O.; Kieush, L.; Koveria, A.; Schenk, J.; Pfeiffer, A.; Zheng, H.; Lozynskyi, V. Metallurgical Coke Production with Biomass Additives: Study of Biocoke Properties for Blast Furnace and Submerged Arc Furnace Purposes. Materials 2022, 15, 1147. [Google Scholar] [CrossRef]
  35. Norgate, T.; Haque, N.; Somerville, M.; Jahanshahi, S. Biomass as a Source of Renewable Carbon for Iron and Steelmaking. ISIJ Int. 2012, 52, 1472–1481. [Google Scholar] [CrossRef] [Green Version]
  36. Yunos, N.F.M.; Zaharia, M.; Idris, M.A.; Nath, D.; Khanna, R.; Sahajwalla, V. Recycling Agricultural Waste from Palm Shells during Electric Arc Furnace Steelmaking. Energy Fuels 2012, 26, 278–286. [Google Scholar] [CrossRef]
  37. Nwachukwu, C.M.; Wang, C.; Wetterlund, E. Exploring the Role of Forest Biomass in Abating Fossil CO2 Emissions in the Iron and Steel Industry—The Case of Sweden. Appl. Energy 2021, 288, 116558. [Google Scholar] [CrossRef]
  38. Toktarova, A.; Karlsson, I.; Rootzén, J.; Göransson, L.; Odenberger, M.; Johnsson, F. Pathways for Low-Carbon Transition of the Steel Industry—A Swedish Case Study. Energies 2020, 13, 3840. [Google Scholar] [CrossRef]
  39. Shukla, I. Potential of Renewable Agricultural Wastes in the Smart and Sustainable Steelmaking Process. J. Clean. Prod. 2022, 370, 133422. [Google Scholar] [CrossRef]
  40. Bianco, L.; Baracchini, G.; Cirilli, F.; Moriconi, A.; Moriconi, E.; Marcos, M.; Demus, T.; Echterhof, T.; Pfeifer, H.; Beiler, C. Sustainable EAF Steel Production (GREENEAF); Publications Office of the European Union: Luxembourg, 2013.
  41. Fidalgo, B.; Berrueco, C.; Millan, M. Chars from Agricultural Wastes as Greener Fuels for Electric Arc Furnaces. J. Anal. Appl. Pyrolysis 2015, 113, 274–280. [Google Scholar] [CrossRef]
  42. Kalde, A.; Demus, T.; Echterhof, T.; Pfeifer, H. Determining the Reactivity of Biochar-Agglomerates to Replace Fossil Coal in Electric Arc Furnace Steelmaking. In Proceedings of the EUBCE 2015 Online Conference Proceedings, Vienna, Austria, 1–4 June 2015; pp. 497–507. [Google Scholar]
  43. Huang, X.-A.; Ng, K.W.; Giroux, L.; Duchesne, M. Carbonaceous Material Properties and Their Interactions with Slag during Electric Arc Furnace Steelmaking. Met. Mater. Trans. B 2019, 50, 1387–1398. [Google Scholar] [CrossRef]
  44. ASTM D3172-13; Standard Practice for Proximate Analysis of Coal and Coke. ASTM International: West Conshohocken, PA, USA, 2013.
  45. ISO 18125:2017; Solid Biofuels—Determination of Calorific Value. International Organization for Standardization: Geneva, Switzerland, 2017.
  46. ISO 1928:2020; Coal and Coke—Determination of Gross Calorific Value. International Organization for Standardization: Geneva, Switzerland, 2020.
  47. ISO 18894:2018; Coke—Determination of Coke Reactivity Index (CRI) and Coke Strength after Reaction (CSR). International Organization for Standardization: Geneva, Switzerland, 2018.
  48. ISO 9277:2010; Determination of the Specific Surface Area of Solids by Gas Adsorption—BET Method. International Organization for Standardization: Geneva, Switzerland, 2010.
  49. Warren, B.E. X-ray Diffraction in Random Layer Lattices. Phys. Rev. 1941, 59, 693–698. [Google Scholar] [CrossRef]
  50. Okolo, G.N.; Neomagus, H.W.J.P.; Everson, R.C.; Roberts, M.J.; Bunt, J.R.; Sakurovs, R.; Mathews, J.P. Chemical–Structural Properties of South African Bituminous Coals: Insights from Wide Angle XRD–Carbon Fraction Analysis, ATR–FTIR, Solid State 13C NMR, and HRTEM Techniques. Fuel 2015, 158, 779–792. [Google Scholar] [CrossRef]
  51. Li, J.; Xu, R.; Wang, G.; Zhang, J.; Song, B.; Liang, W.; Wang, C. Study on the Feasibility and Co-Combustion Mechanism of Mixed Injection of Biomass Hydrochar and Anthracite in Blast Furnace. Fuel 2021, 304, 121465. [Google Scholar] [CrossRef]
  52. Rantitsch, G.; Bhattacharyya, A.; Günbati, A.; Schulten, M.-A.; Schenk, J.; Letofsky-Papst, I.; Albering, J. Microstructural Evolution of Metallurgical Coke: Evidence from Raman Spectroscopy. Int. J. Coal Geol. 2020, 227, 103546. [Google Scholar] [CrossRef]
  53. ASTM D4326-21; Standard Test Method for Major and Minor Elements in Coal Ash By X-ray Fluorescence. ASTM International: West Conshohocken, PA, USA, 2021.
  54. Shamsudin, R.; Abdul Azam, F.A.; Abdul Hamid, M.; Ismail, H. Bioactivity and Cell Compatibility of β-Wollastonite Derived from Rice Husk Ash and Limestone. Materials 2017, 10, 1188. [Google Scholar] [CrossRef] [PubMed] [Green Version]
  55. Lünsdorf, N.K.; Dunkl, I.; Schmidt, B.C.; Rantitsch, G.; von Eynatten, H. Towards a Higher Comparability of Geothermometric Data Obtained by Raman Spectroscopy of Carbonaceous Material. Part 2: A Revised Geothermometer. Geostand. Geoanal. Res. 2017, 41, 593–612. [Google Scholar] [CrossRef]
  56. European Commission. Directorate General for Research and Innovation. Flexible Production of Coke Using Alternative Coals: Effects on Coke Properties under Blast Furnace Conditions (FLEXCOKE): Final Report; Publications Office: Luxembourg, 2019.
  57. Hilding, T.; Gupta, S.; Sahajwalla, V.; Björkman, B.; Wikström, J.-O. Degradation Behaviour of a High CSR Coke in an Experimental Blast Furnace: Effect of Carbon Structure and Alkali Reactions. ISIJ Int. 2005, 45, 1041–1050. [Google Scholar] [CrossRef] [Green Version]
  58. El-Tawil, A.A.; Björkman, B.; Lundgren, M.; Bäck, F.; Ökvist, L.S. Influence of Modified Bio-Coals on Carbonization and Bio-Coke Reactivity. Metals 2021, 12, 61. [Google Scholar] [CrossRef]
  59. Dun, W.; Guijian, L.; Ruoyu, S.; Xiang, F. Investigation of Structural Characteristics of Thermally Metamorphosed Coal by FTIR Spectroscopy and X-ray Diffraction. Energy Fuels 2013, 27, 5823–5830. [Google Scholar] [CrossRef]
  60. Wang, M.; Wei, G.; Zhu, R.; Dong, K. Effect of CO2-O2 Oxidizing Atmospheres on the Combustion Characteristics of Metallurgical Coke and Anthracite. J. CO2 Util. 2021, 52, 101665. [Google Scholar] [CrossRef]
  61. Ng, K.W.; MacPhee, J.A.; Giroux, L.; Todoschuk, T. Reactivity of Bio-Coke with CO2. Fuel Process. Technol. 2011, 92, 801–804. [Google Scholar] [CrossRef]
Figure 1. (a) SEM image of the anthracite particles, magnification 200×. (b) SEM image of anthracite particle with a spot of the EDS spectrum (A), magnification 800×.
Metals 13 00722 g001
Figure 2. (a) SEM image of the calcined petroleum coke sample, magnification 200×; (b) SEM image of the calcined petroleum coke sample with a spot of the EDS spectrum (CPC), magnification 800×.
Metals 13 00722 g002
Figure 3. Images of the biochar sample. (a) Optical image of the biochar sample, magnification 100×. (b) SEM image of the biochar sample with a spot of the EDS spectrum (Bch), magnification 500×.
Metals 13 00722 g003
Figure 4. Images of the coke sample. (a) Optical image of the coke sample, magnification 100×; (b) SEM image of the coke sample with a spot of the EDS spectrum (C), magnification 100×.
Metals 13 00722 g004
Figure 5. Microscopic images of the biocoke samples. (a) Optical image of the biocoke1 sample, magnification 100×. (b) SEM image of the biocoke1 sample with a spot of the EDS spectrum (BC1), magnification 100×. (c) Optical image of the biocoke2 sample, magnification 100×. (d) SEM image of the biocoke2 sample with a spot of the EDS spectrum (BC2), magnification 100×. The arrow indicates the spot for which the EDS was applicable.
Metals 13 00722 g005
Figure 6. The XRD spectra of mineral matter of carbon-bearing sources: (a) anthracite; (b) biochar; (c) calcined petroleum coke; (d) coke; (e) biocoke1; and (f) biocoke2. Q is quartz, M is muscovite, Ca is calcite, C is graphite, P is pyrite, Mu is mullite, and Wo is wollastonite.
Metals 13 00722 g006
Figure 7. (a) Probability distribution of the D-STA parameter of coke and calcined petroleum coke; (b) coke and biochar; and (c) biocoke samples. The arrow indicates a statistically significant difference.
Metals 13 00722 g007
Figure 8. Relationship between the crystallite height (Lc) and crystalline stacking layer number (N).
Metals 13 00722 g008
Figure 9. Relationship between the parameters of crystallite height (Lc) and selected Raman parameters. (a) Relationship between crystallite height (Lc) and D-STA (mean). (b) Relationship between crystallite height (Lc) and the Dmax/Gmax ratio (mean).
Metals 13 00722 g009
Table 1. Composition of the blend for obtaining BC1 and BC2 (wt.%).
Blend ComponentsBC1BC2
Base Blend (LV + MV + HV) + 3 wt.% Torrefied Wood, Medium Temperature of 235–275 °CBase Blend (LV + MV + HV) + 3 wt.% Petroleum Coke + 3 wt.% Charcoal
Low volatile (LV) coal4040
Medium volatile (MV) coal3029
High volatile (HV) coal2725
Petroleum coke-3
Charcoal-3
Torrefied wood (medium temperature of 235–275 °C)3-
Table 2. Proximate and ultimate analyses of the carbon-bearing sources.
Carbon-Bearing SourceProximate Analysis (wt.%)Ultimate Analysis (wt.%)Calorific Value (kJ/kg)
MVM (db)VM (daf)Ash (db)S (db)C (db)H (db)N (db)Cfix (db)
Anthracite5.913.694.1210.500.4882.582.190.9785.8127.78
Calcined petroleum coke0.170.440.450.930.6397.260.291.4998.6332.74
Coke2.271.421.5910.820.7790.560.301.0587.7629.47
Biochar2.6739.2841.044.29trace72.744.620.2456.4326.87
Biocoke10.100.700.7911.430.5686.500.221.2987.8729.28
Biocoke20.100.300.3411.540.6186.400.181.4188.1629.30
M is moisture; C is carbon; H is hydrogen; N is nitrogen; S is sulfur; db is dry basis; daf is dry ash-free basis; VM(daf) = VM(db)·100/(100 − ash yield (db,%)); Cfix, wt.% = 100 − (wt.% VM (db) − wt.% Ash (db)).
Table 3. The XRF results of ash composition of carbon-bearing sources (wt.% db).
Ash CompositionCarbon-Bearing Source
AnthraciteCalcined Petroleum CokeCokeBiocharBiocoke1Biocoke2
Fe4.592.604.686.313.113.24
SiO252.7356.6352.675.3059.1060.20
Al2O331.2613.5730.79n.d.29.9028.20
MgOn.d.n.d.n.d. 10.960.470.75
CaO2.183.152.2153.771.171.56
TiO21.581.041.620.391.601.51
K2O4.3415.544.57n.d.1.311.51
P2O50.560.310.070.080.410.34
MnO0.050.390.053.360.050.05
NiOn.d.n.d.n.d.n.d.0.020.02
Ni2O30.020.750.020.04n.d.n.d.
Ash basicity (B1)0.040.060.0410.150.020.03
n.d., not detected; minor components were excluded.
Table 4. The quality properties of carbon-bearing sources.
Carbon-Bearing SourceQuality Properties
CRI (wt.%)StdCSR (wt.%)StdBET N2-Specific Surface Area (m2/g)BJH Adsorption Cumulative Surface Area of Pores (cm3/g)BJH Adsorption Average Pore Width (4 V/A), (Å)
Anthraciten.a.n.a.n.a.n.a.0.710.00058358.205
Calcined petroleum coken.a.n.a.n.a.n.a.0.950.00143467.439
Coke31.681.3162.870.942.540.00229749.054
Biocharn.a.n.a.n.a.n.a.42.950.00459430.127
Biocoke129.181.7052.890.794.850.00095885.853
Biocoke232.501.1350.950.214.200.00240644.102
n.a., not available; std, standard deviation.
Table 5. The SEM/EDS analysis results for the carbon-bearing sources.
Chemical Composition, wt.%Carbon-Bearing Source
AnthraciteCalcined Petroleum CokeBiocharCokeBiocoke1Biocoke2
O38.5144.4925.6635.4236.7346.73
Nan.d.n.d.1.181.480.260.73
Mg0.691.420.190.270.050.16
Al21.617.180.5423.2323.5823.37
Si27.5626.471.4527.1925.5625.65
S0.92n.d.n.d.n.d.n.d.n.d.
K4.7712.901.011.580.162.35
Ca0.502.250.657.060.160.14
Tin.d.0.60n.d.0.200.030.05
Crn.d.0.901.040.120.01n.d.
Mnn.d.0.30n.d.n.d.1.30n.d.
Fe4.372.606.323.115.255.45
Nin.d.0.532.770.110.060.03
Cu1.060.020.040.12n.d.n.d.
n.d., not detected; minor components were excluded.
Table 6. The XRD parameters for the carbon-bearing sources.
Carbon-Bearing Sourced002, nmLc, nmLa, nmN
Anthracite0.352.081.646.94
Calcined petroleum coke0.351.582.765.51
Biochar0.450.691.162.53
Coke0.351.863.696.31
Biocoke10.351.562.805.46
Biocoke20.371.322.084.57
Table 7. Raman spectral parameters (see [50]) (median of 10 spot measurements) for the carbon-bearing sources.
Carbon-Bearing SourceD-STA (Mean)StdG-STA (Mean)StdG Shape Factor (Mean)StdDmax Position (Mean)StdGmax Position (Mean)StdDmax/Gmax-Ratio (Mean)Std
Anthracite166.40.2133.10.41.40.01325.60.01600.00.00.80.0
Biochar272.40.2192.20.61.40.01352.30.01591.90.00.70.0
Calcined petroleum coke219.80.1204.60.21.30.01351.40.01586.70.00.90.0
Coke197.00.2210.30.11.20.01347.90.01593.80.01.10.0
Biocoke1223.10.1215.10.11.50.01351.50.01593.70.01.00.0
Biocoke2248.90.6233.10.21.20.01361.10.01593.40.00.90.0
Std, standard deviation.
Disclaimer/Publisher’s Note: The statements, opinions and data contained in all publications are solely those of the individual author(s) and contributor(s) and not of MDPI and/or the editor(s). MDPI and/or the editor(s) disclaim responsibility for any injury to people or property resulting from any ideas, methods, instructions or products referred to in the content.

