

Surface Integrity of Cryogenically Finished Additively Manufactured and Conventional Ti-6Al-4V Alloy

1
Department of Mechanical Engineering, Indian Institutes of Technology (BHU), Varanasi 221005, Uttar Pradesh, India
2
Department of Mechanical and Industrial Engineering, Indian Institutes of Technology, Roorkee 247667, Uttarakhand, India
*
Author to whom correspondence should be addressed.
Metals 2023, 13(4), 693; https://doi.org/10.3390/met13040693
Submission received: 14 February 2023
/
Revised: 20 March 2023
/
Accepted: 29 March 2023
/
Published: 31 March 2023
(This article belongs to the Special Issue Additive Manufacturing of Metallic Materials: Characterization, Properties, and Modeling)
Abstract
:Additive manufacturing (AM) is used for the fabrication of solid components of complex geometries for customized applications. However, AM-fabricated components frequently require finishing operations such as abrasive grinding, which causes a different surface characteristic compared to the conventionally manufactured components. Thus, it is essential to study the effect of process parameters and the heat treatment on surface quality of the AM components because these may behave differently to the conventional manufactured components. In this study, surface characteristics of AM samples of Ti-6Al-4V with a cryogenically cooled finishing operation is compared with that of conventionally processed samples. The samples under investigation were fabricated by two different methods, namely, Direct Metal Laser Sintering (DMLS) and conventional processing. The effect of the two processes on surface characteristics, such as microhardness, surface roughness, X-ray diffraction (XRD), and mechanical properties has been studied. The average surface roughness from cryogenic grinding was reduced by 27.25% and 23.15% for the AM, and 30.08% and 29.13% for conventional samples, as compared to dry and moist conditions, respectively. The finished DMLS and conventional samples showed increase of microhardness by 14.07%, 14.27%, 17.54% and 17.48%, 8.06%, 38.68%, in dry, moist, and cryogenic conditions, respectively. In cryogenic conditions, as the DOC and table feed increased, a greater increase in peak broadening was observed. The peak broadening in XRD of finished DMLS components indicates that a significant level of plastic deformation occurred compared to the finished conventionally manufactured Ti-6Al-4V samples, which suggests that the DMLS samples are more sensitive to the finishing process. Compared to dry and moist grinding, cryogenic grinding was found to have the smallest grains in the layer just below the surface. The impact of cryogenic cooling on surface properties of AM Ti-6Al-4V samples is higher as compared to that on conventionally processed Ti-6Al-4V samples.
1. Introduction
Additive manufacturing (AM) processes are frequently used to fabricate near net-shape customized components of complicated structures, and are faster and easier than conventional process of manufacturing. In the AM process, components are fabricated in a layered fashion to produce three-dimensional components, using computer aided design (CAD) model files. In a broader classification, AM processes are categorized according to the energy source such as laser beam, electron beam, and arc, used for different materials (steels, titanium alloys, inconel alloys, polymers, ceramics), and the feeding system used such as powder bed or powder feed, and the feedstock type (powder or wire) [1,2]. Industries and researchers are attracted towards AM processes because they provide a unique opportunity to reduce lead time, eliminate dies, and ease complex designs and optimization, and result in lighter fabricated components [3,4].
Direct Metal Laser Sintering (DMLS) is a type of AM technology used to create Ti-6Al-4V parts with high precision and complexity. DMLS is often chosen for its ability to produce fully functional metal parts with complex geometries that would be difficult to produce using conventional manufacturing methods [5]. DMLS is commonly used in aerospace, automotive, and medical industries to produce parts with high strength and accuracy. It is also used for rapid prototyping and low-volume production. DMLS has many advantages over conventional methods, including the ability to create parts with intricate geometries, reduce waste, and produce parts with high accuracy and consistency [6,7].
Ti-6Al-4V alloy is a popular aerospace and biomedical material known for its high strength and corrosion resistance, which makes it difficult to machine, grind, or polish [8]. This alloy has a tendency to work harden and generate heat, leading to tool wear and surface damage [9]. The low thermal conductivity of this alloy causes heat to build up during machining, leading to thermal deformation and surface damage. The microstructure of the Ti-6Al-4v alloy depends on the manufacturing process, which affects the finishing process. Therefore, attempts have been made in recent times to develop advanced manufacturing methods for Ti-6Al-4V alloy.
Several researchers have discussed the effects of input parameters on the microstructure, surface roughness, tensile properties, and microhardness of the additively manufactured Ti-6Al-4V components [10,11] and that results in mechanical inhomogeneity. In recent years, many researchers discussed the different heat treatment techniques and their effect on the performance of AM and conventionally processed components. Concentrated solar energy is being utilized for heat treatment of a Ti-6Al-4V alloy fabricated by selective laser melting [12]. After heat treatment, the microhardness was decreased compared with as-fabricated samples [13]. Additional heat treatment of Ti-6Al-4V samples fabricated by electron beam melting allows for the reduction of induced stresses in the material [14].
The ductility of SLM fabricated Ti-6Al-4V samples was lower, whereas the tensile strength was significantly higher than that of EBM fabricated samples, because the porosity of SLM samples was higher in comparison to EBM samples [15]. Li et al. [16] studied the effect of heat treatment and magnetic abrasive finishing on the surface integrity of an additively manufactured Inconel 718 alloy. The magnetic abrasive finishing reduced the surface roughness and enhanced the mechanical properties.
Rotella et al. [17] mentioned that the surface integrity of machined AM Ti-6Al-4V components are distinguishable from those manufactured by conventional processes. The microstructure, defects, residual stresses, and surface morphology of AM components vary because of the changes in the thermal history as compared to conventional processes. Bordin et al. [18] observed the surface roughness in AM components with a poor surface finish and suggested finishing processes such as grinding, polishing, and coating processes. Vilaro et al. [19] discussed the microhardness and microstructural changes of the AM-fabricated Ti-6Al-4V samples. They focused on the formation of phases in the as-fabricated and heat-treated AM components due to thermal influences. The impact of post-processing techniques on AM components may differ from those obtained on conventionally fabricated components [20]. Ren et al. [3] discussed the impact of build orientation on the surface finish of AM Ti-6Al-4V components. Guo et al. [21] studied the effect of 0° and 90° orientation of components on their surface finish, tool wear, and temperature of the components. They observed different magnitudes of cutting forces for the components built with 0° and 90° orientations, and higher surface roughness in 0° oriented components because of its higher hardness.
Most of the earlier studies are focused on finishing and machining the Ti-6Al-4V components fabricated by conventional methods in dry and wet environments. Only limited studies have been carried out on cryogenic machining of additively manufactured Ti-6Al-4V samples. Moreover, the effect of cryogenic grinding on the surface integrity of additively manufactured Ti-6Al-4V samples has not been explored. Thus, it is essential to carry out a systematic investigation on the surface integrity, microhardness, and subsurface layers of the specimens finished in dry, moist, and cryogenic environments by varying the input parameters such as depth of cut and table feed for the proper inception of cryogenic grinding as a potential finishing process.
In the present study, the authors attempted to enhance the surface finish of Ti-6Al-4V samples by studying the effect of grinding variables under different grinding environments. The samples were fabricated by additive manufacturing and conventional processes. The depth of cut and table feed were varied in dry, moist, and cryogenic conditions and the microstructural characteristics, surface integrity, and quality of surface finish are analyzed. The bearing area characteristics are also analyzed. Ti-6Al-4V alloy is difficult to machine; its surface integrity, microhardness, bearing area curve, and surface roughness are of great importance for aerospace and biomedical applications. These parameters have been compared for the additively manufactured and conventionally fabricated samples.
2. Material and Methods
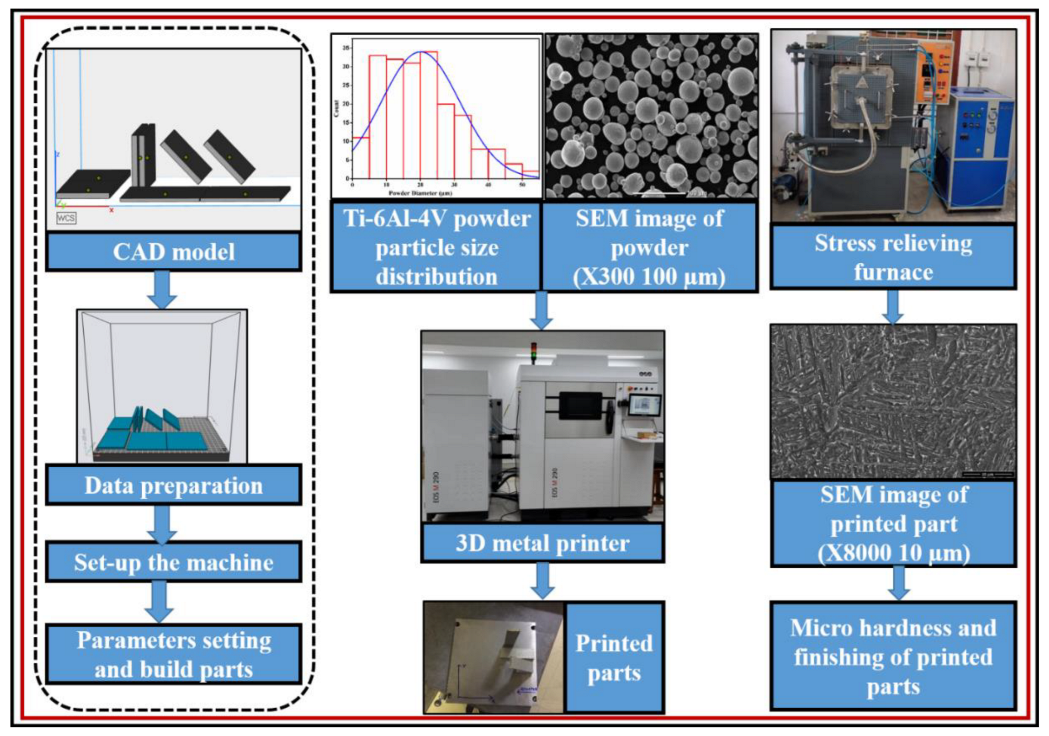
Components of the alloy Ti-6Al-4V were fabricated by the Direct Metal Laser Sintering (DMLS) and conventional (rolling) process. In the DMLS process, Ti-6Al-4V powder, with composition listed in Table 1 was used for fabricating the components on EOS INT M290 machine (EOS GmbH - Electro Optical Systems, Krailling, Germany), as shown in Figure 1 and the specifications are shown in Table 2. The AM components were fabricated under a protective Argon atmosphere, at a flow rate of 20 L/min, with beam diameter 100 µm, melt pool diameter 80 µm, layer thickness 40 µm, laser power 340 W, and scan speed 1250 mm/s. The components were built along the longitudinal axis and parallel to the build plate.
The as-fabricated DMLS specimens were heat-treated at 800 °C for 1.5 h in argon atmosphere and cooled in furnace to transform the martensitic α′ phase (Figure 2a) into α and β phases to diminish the high residual stresses, induced during additive manufacturing. After the heat treatment (HT), the martensitic α’ structure was converted into α and β phases as shown in Figure 2b. The size of grains in the as-fabricated AM samples was ~1 µm in width and approximately 10 to 140 µm in length (Figure 2a). After HT, the grain size increased and its width was about 1.5 to 3 µm.
In addition, the conventionally processed samples were subjected to the above HT. Although HT reduces the residual stresses of the AM-fabricated components, it does not enhance the surface finish of the AM components. Furthermore, the HT process lowers mechanical strength of the AM components. The microstructure of AM components is different from that of the conventionally processed one. In conventional Ti-6Al-4V, equiaxed α with intergranular β phase formed, as shown in Figure 2c. The heat-treated samples, fabricated by conventional process showed equiaxed grains (Figure 2d). The grain size in conventional samples ranged from 3.7 to 8.0 µm with an average of 5 µm; after heat treatment, the grain size increased and became 2.5 to 10.5 µm with an average of 6 µm.
The as-fabricated specimens by the AM and conventional process were mechanically polished on different grades of emery papers and finally on polishing cloth using diamond paste. To reveal and analyse the microstructure, the polished specimens were etched with Kroll’s reagent.
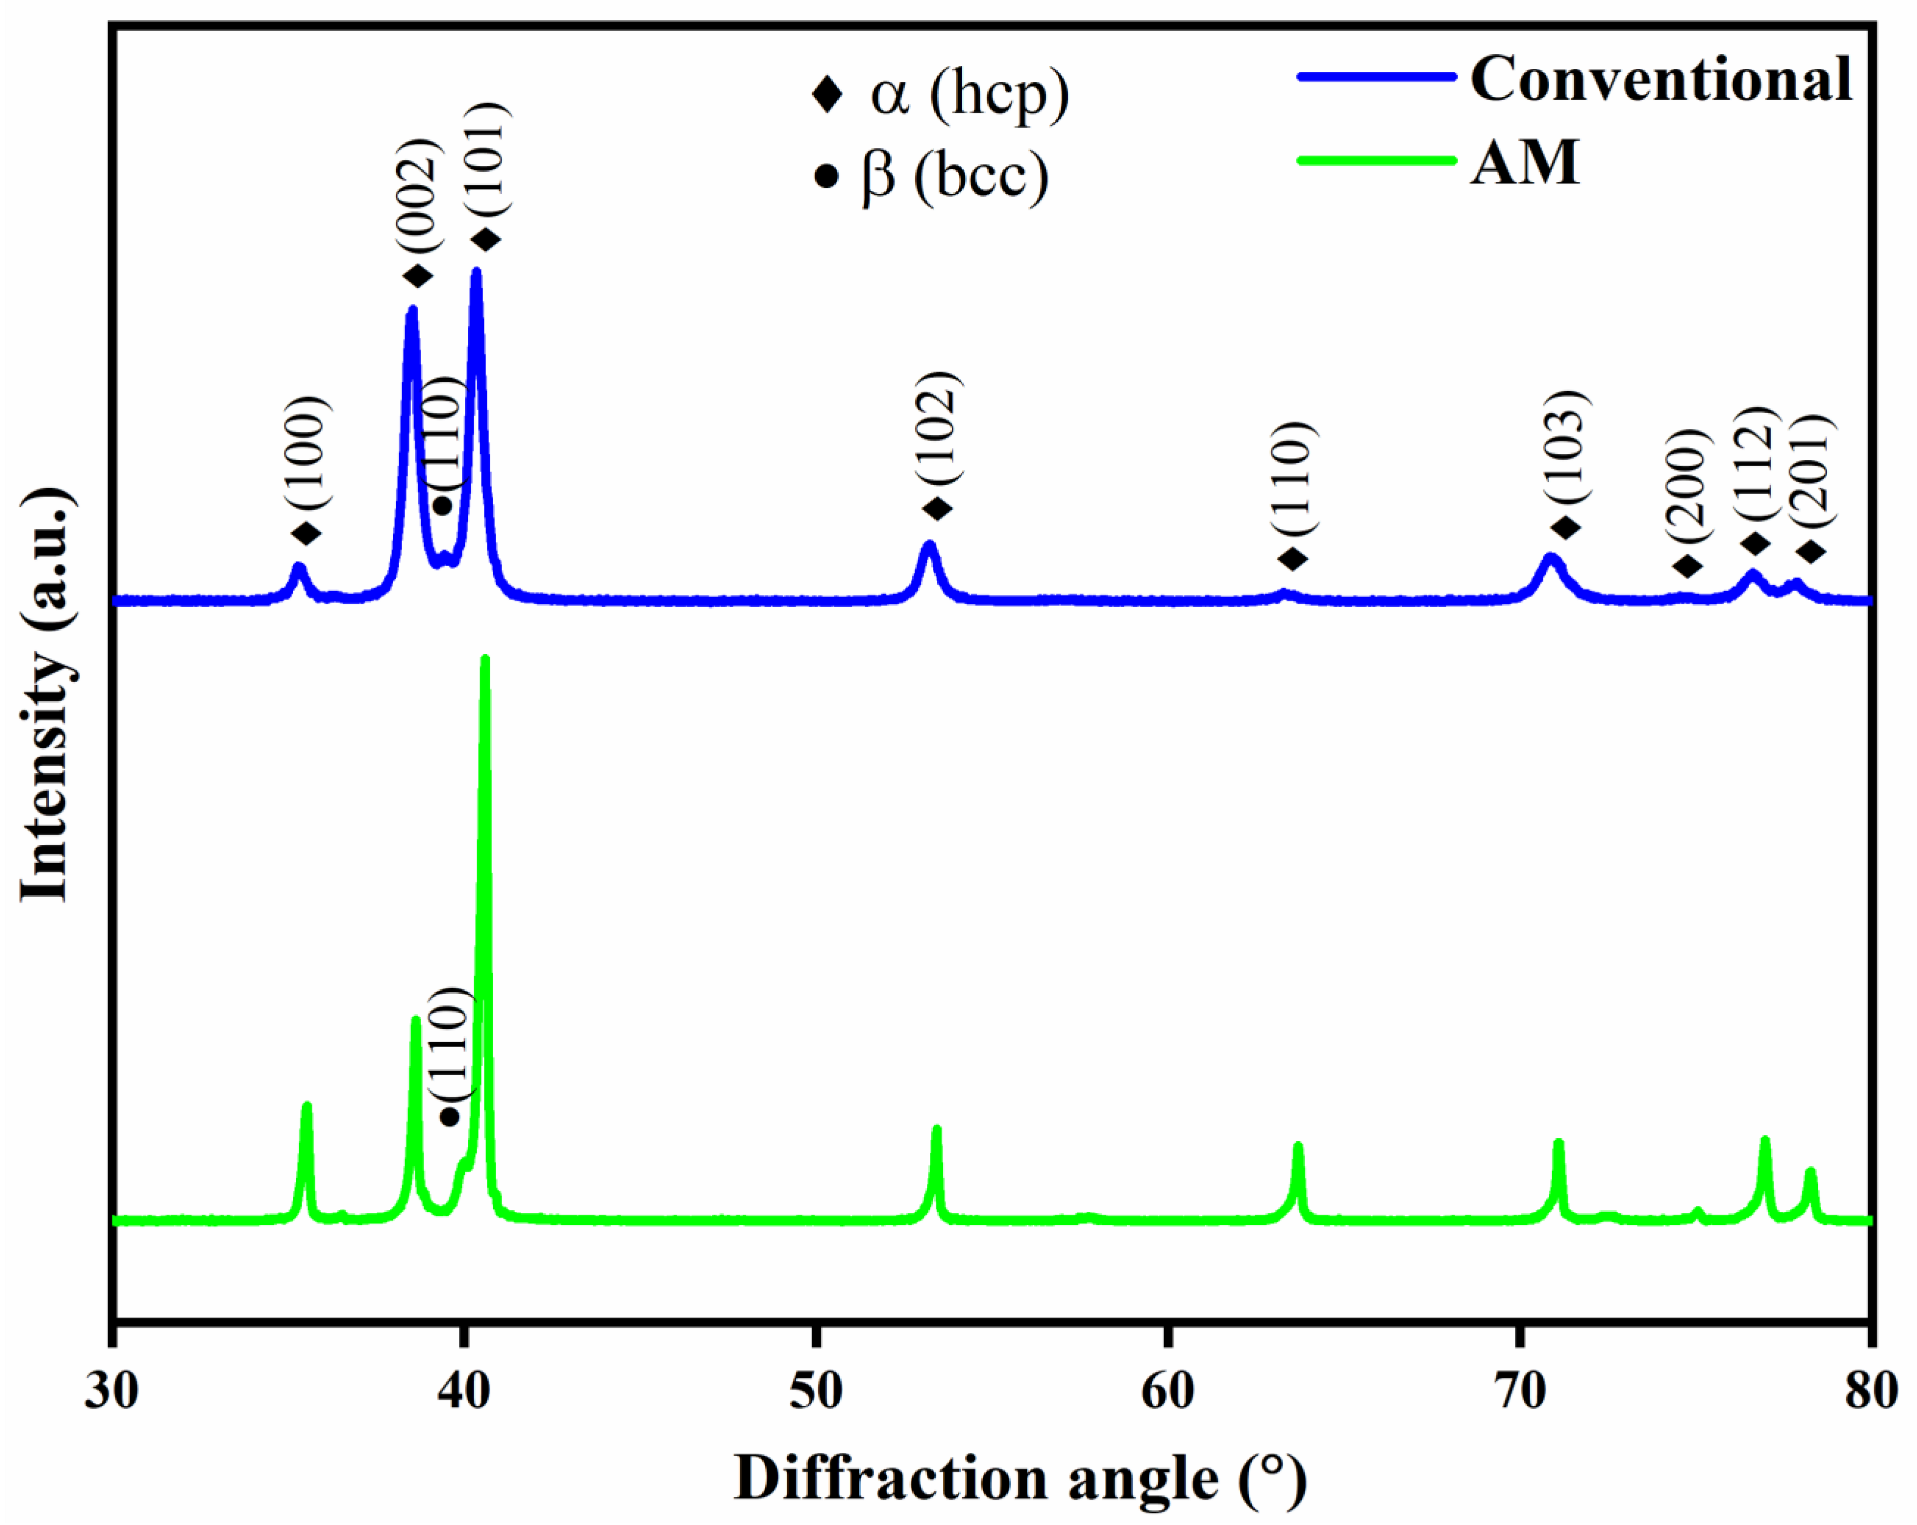
X-ray diffraction (XRD) of the specimens was carried out to evaluate the phases present in the as-fabricated AM and conventionally fabricated components (Figure 3). Using a Rigaku Miniflex 600 Desktop X-ray Diffraction System (RIGAKU Corporation, Tokyo, Japan), the components were scanned at a rate of 0.5°/min. XRD revealed the presence of hexagonally closed packed (hcp) α’ phase in the as-fabricated samples and some presence of β phase in heat-treated DMLS components.
Microhardness was measured using a semiautomatic microhardness tester with diamond pyramid indenter, at load of 200 g applied for 10 s. After heat treatment, the microhardness of DMLS and conventional Ti-6Al-4V samples were 427.81 ± 7.58 HV0.2 and 363.13 ± 4.34 HV0.2, respectively. Thus, the conventional heat-treated sample was softer in comparison with the DMLS fabricated and heat-treated sample. The higher microhardness of the DMLS component is due to the formation of martensitic α’ resulting from fast cooling [1]. It is clearly shows that the microhardness is affected by the cooling rate of the process, and it depends on the as-fabricated microstructural phases, sizes, and their textures [3,22,23].
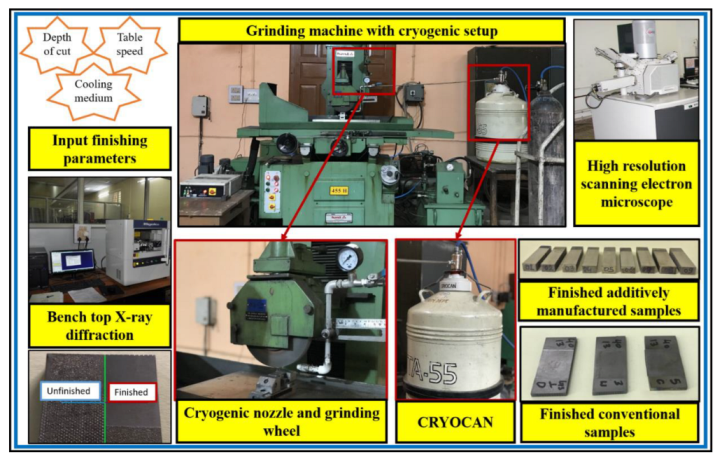
After initial characterization of the AM and conventionally fabricated specimens; dry, moist (wet), and cryogenic (cryo) grinding were done on a surface grinding machine, shown in Figure 4. The main aim of using different media for grinding was to study the surface finish of the AM-fabricated and conventionally processed specimens. The abrasive wheel is made up of aluminum oxide, mounted on a horizontal axis shaft. The lower and higher depth of cut (DOC) of 20 and 40 µm and table feeds of 07 and 13 m/min were used for the finishing operations, as shown in Table 3. These values of DOC and table feeds are recommended for titanium and other alloys [18,24,25]. The speed of abrasive wheel was fixed at 39.42 m/s, as shown in Table 3. Experiments were conducted under plunging mode for four passes. The dressing of abrasive wheel was performed using a single-point diamond dresser after every pass of the finishing operation. To check the reproducibility of the finishing operation, two tests were performed in each condition of DOC and table feed.
The temperature of the grinding region was also measured using FLIR E75 thermal camera (FLIR Systems, Inc., Wilsonville, OR, USA). The emissivity value of the material is important when using a thermal camera during the measurement of the heat generated in the grinding zone. In addition, distance is important in thermal measurements with the camera. The emissivity of the thermal camera was taken as 0.34 as per published literature for additively manufactured Ti-6Al-4V workpiece materials [26,27]. The thermal camera was fixed at a distance of 600 mm from the grinding zone using a tripod, after performing number of experiments to optimize the distance between the workpiece and the camera for proper focus on the grinding zone. A PT-100, 4-wired RTD thermocouple (Tempsens, master sensor parameters) was used to measure the temperature and at the same time, the temperature was also measured by an FLIR infrared thermal camera. The temperature measured by the FLIR infrared thermal camera was in good agreement with the one found with the thermocouple. The thermal gradient was found less than 400 °C, as a result, there was no phase transformation.
A 2D profilometer (Taylor Hobson Ltd., Leicester, UK) system was used to measure surface roughness of the finished samples. The microhardness of finished components was also evaluated.
The surface integrity and subsurface layer of finished components was evaluated by JEOL JCM-6000PLUS (JEOL Ltd., Tokyo, Japan) scanning electron microscopy operated at 15 kV.
The 3D surface qualities of the finished samples were evaluated by atomic force microscope (NT-MDT service and logistics Ltd., Castletroy, Limerick, Ireland) for further validation.
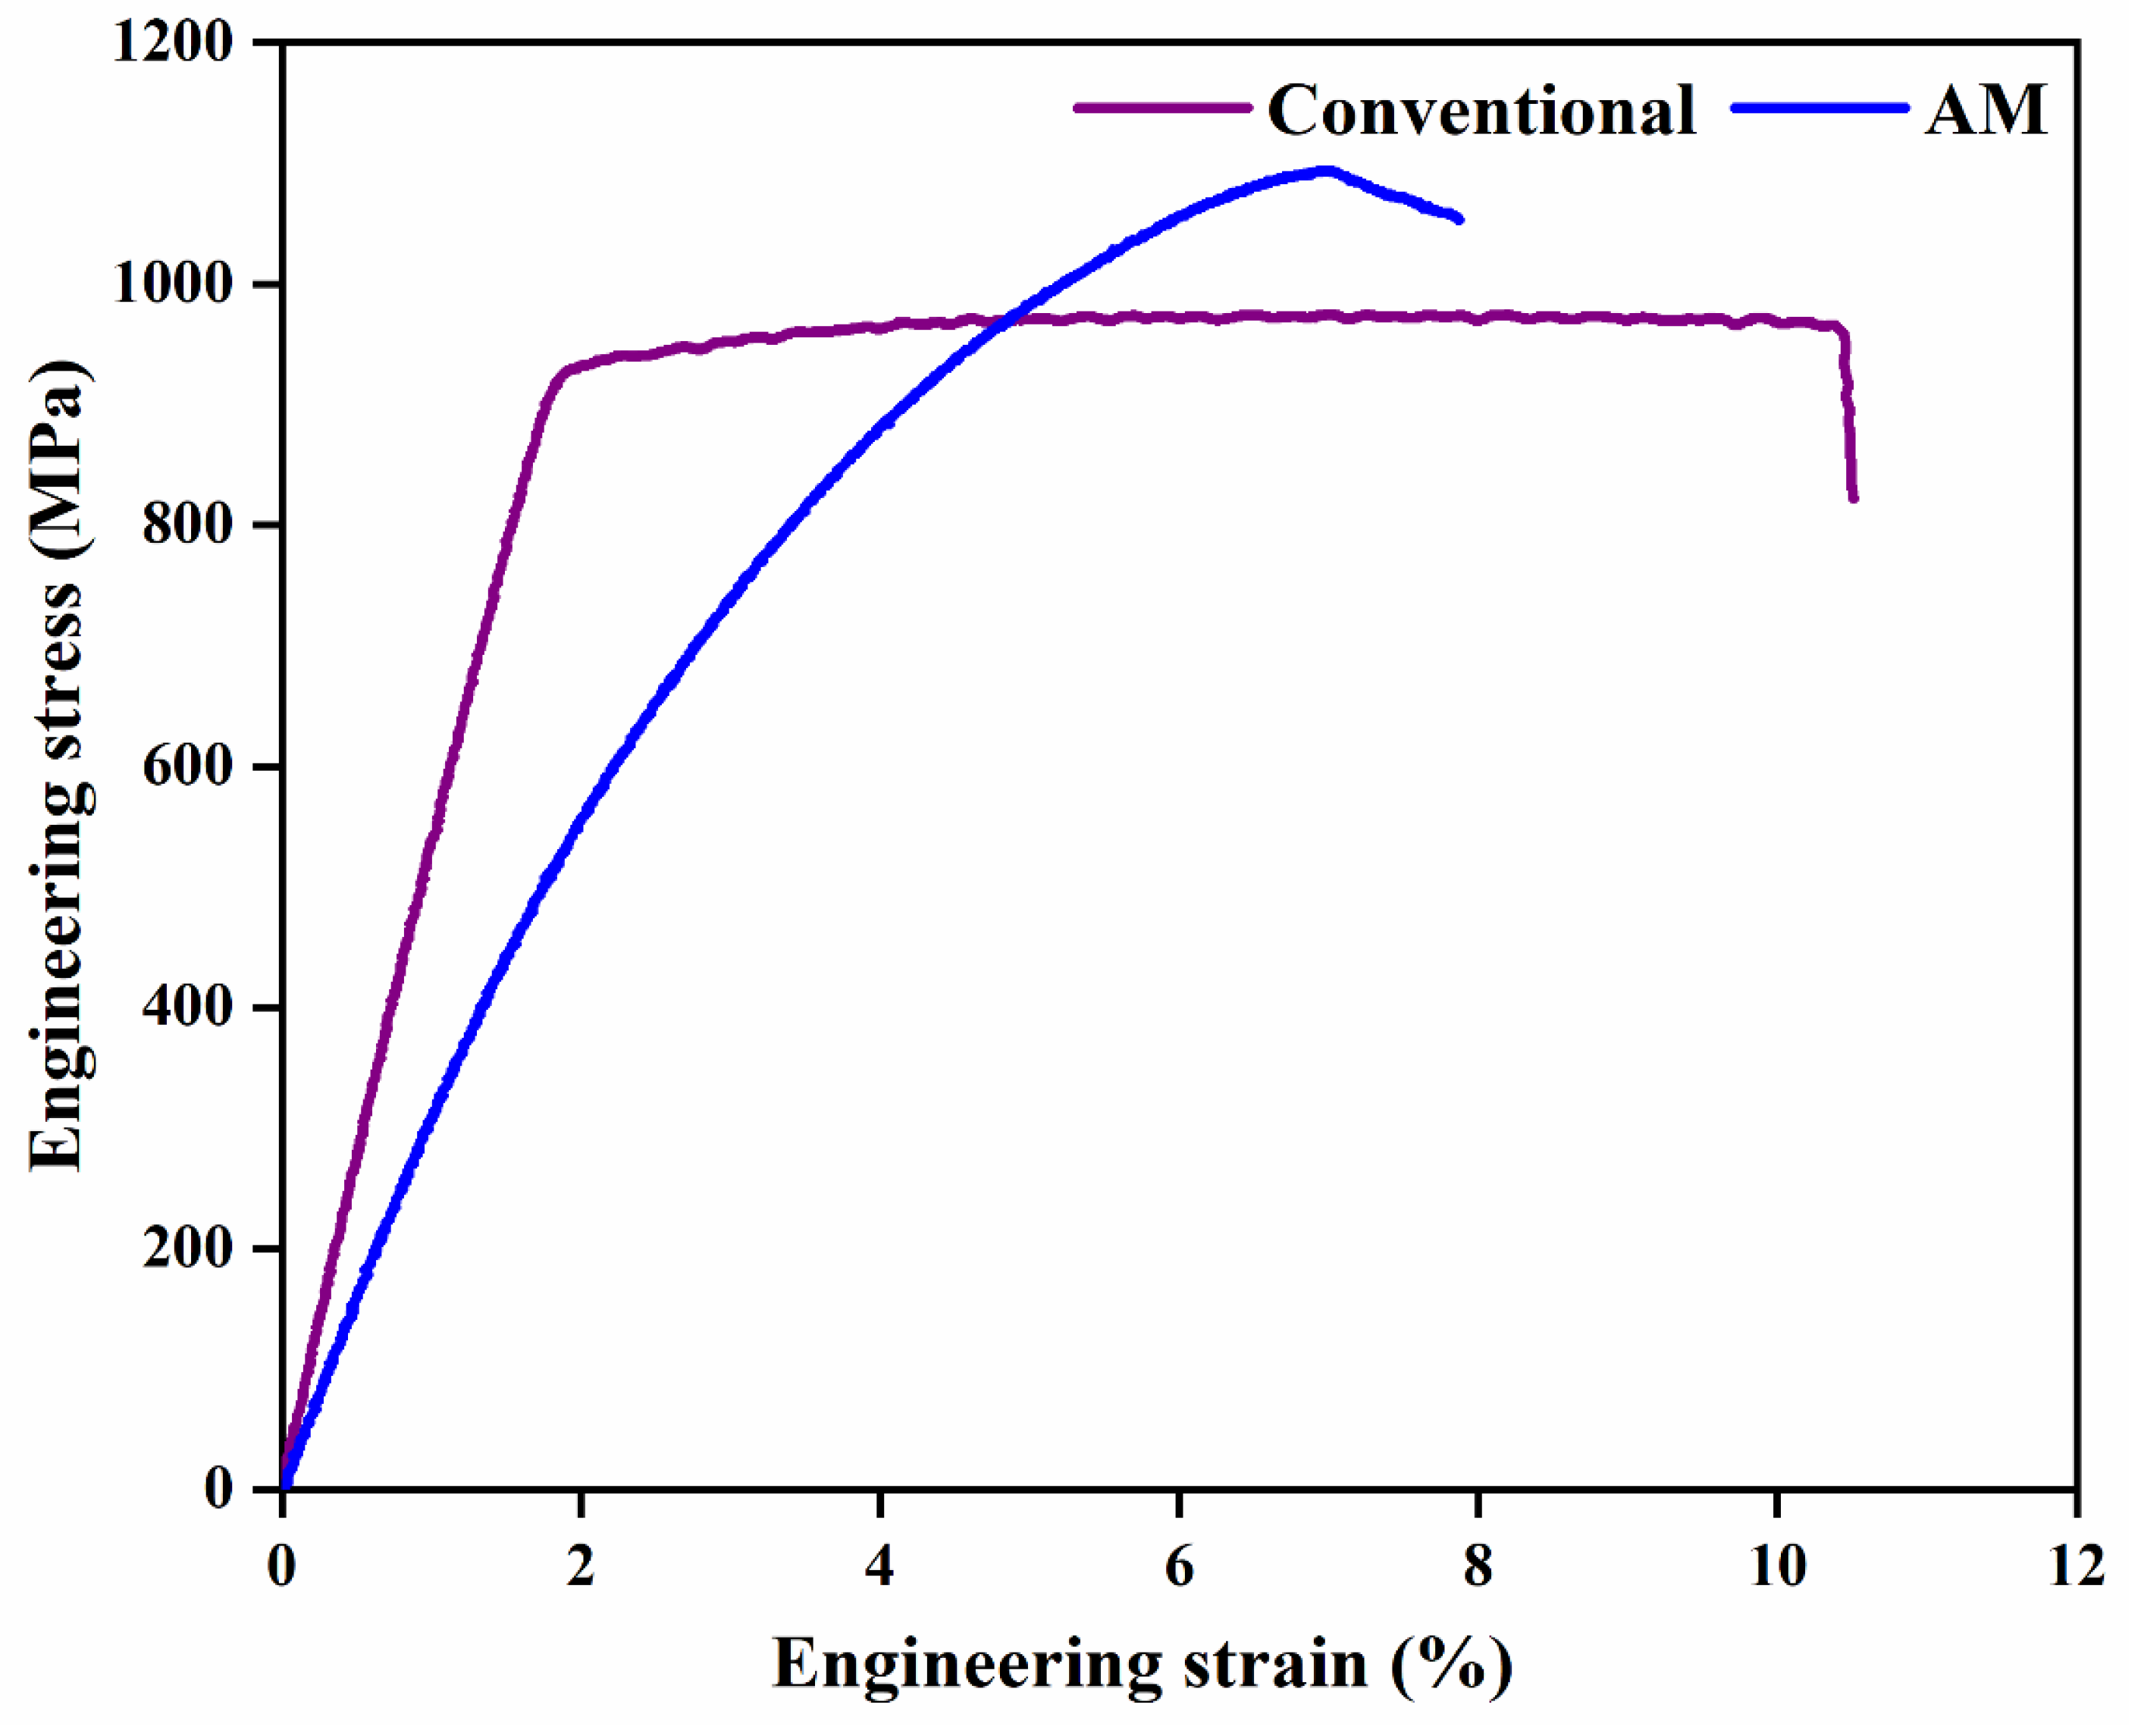
Tensile tests were performed according to ASTM E8 standard [28] on an INSTRON 8801 universal testing machine (INSTRON, Norwood, MA, USA) of 100 kN capacity for the AM and conventionally manufactured Ti-6Al-4V samples, in heat-treated condition, at a cross head displacement rate of 1 mm/min. Two specimens of each category were tested to check reproducibility.
The engineering stress-strain curves of the AM and conventionally fabricated Ti-6Al-4V samples are shown in Figure 5. The AM fabricated and heat-treated sample was found to have 12% higher tensile strength than the conventionally processed and heat-treated sample. This was due to presence of fine α martensitic structure in the AM fabricated samples [3]. The tensile strength of the conventionally processed sample was lower and ductility was higher by 30%, in comparison with that of the AM samples.
3. Results and Discussion
3.1. Surface Roughness of Finished AM and Conventional Samples, in Heat-Treated Condition, under Different Conditions
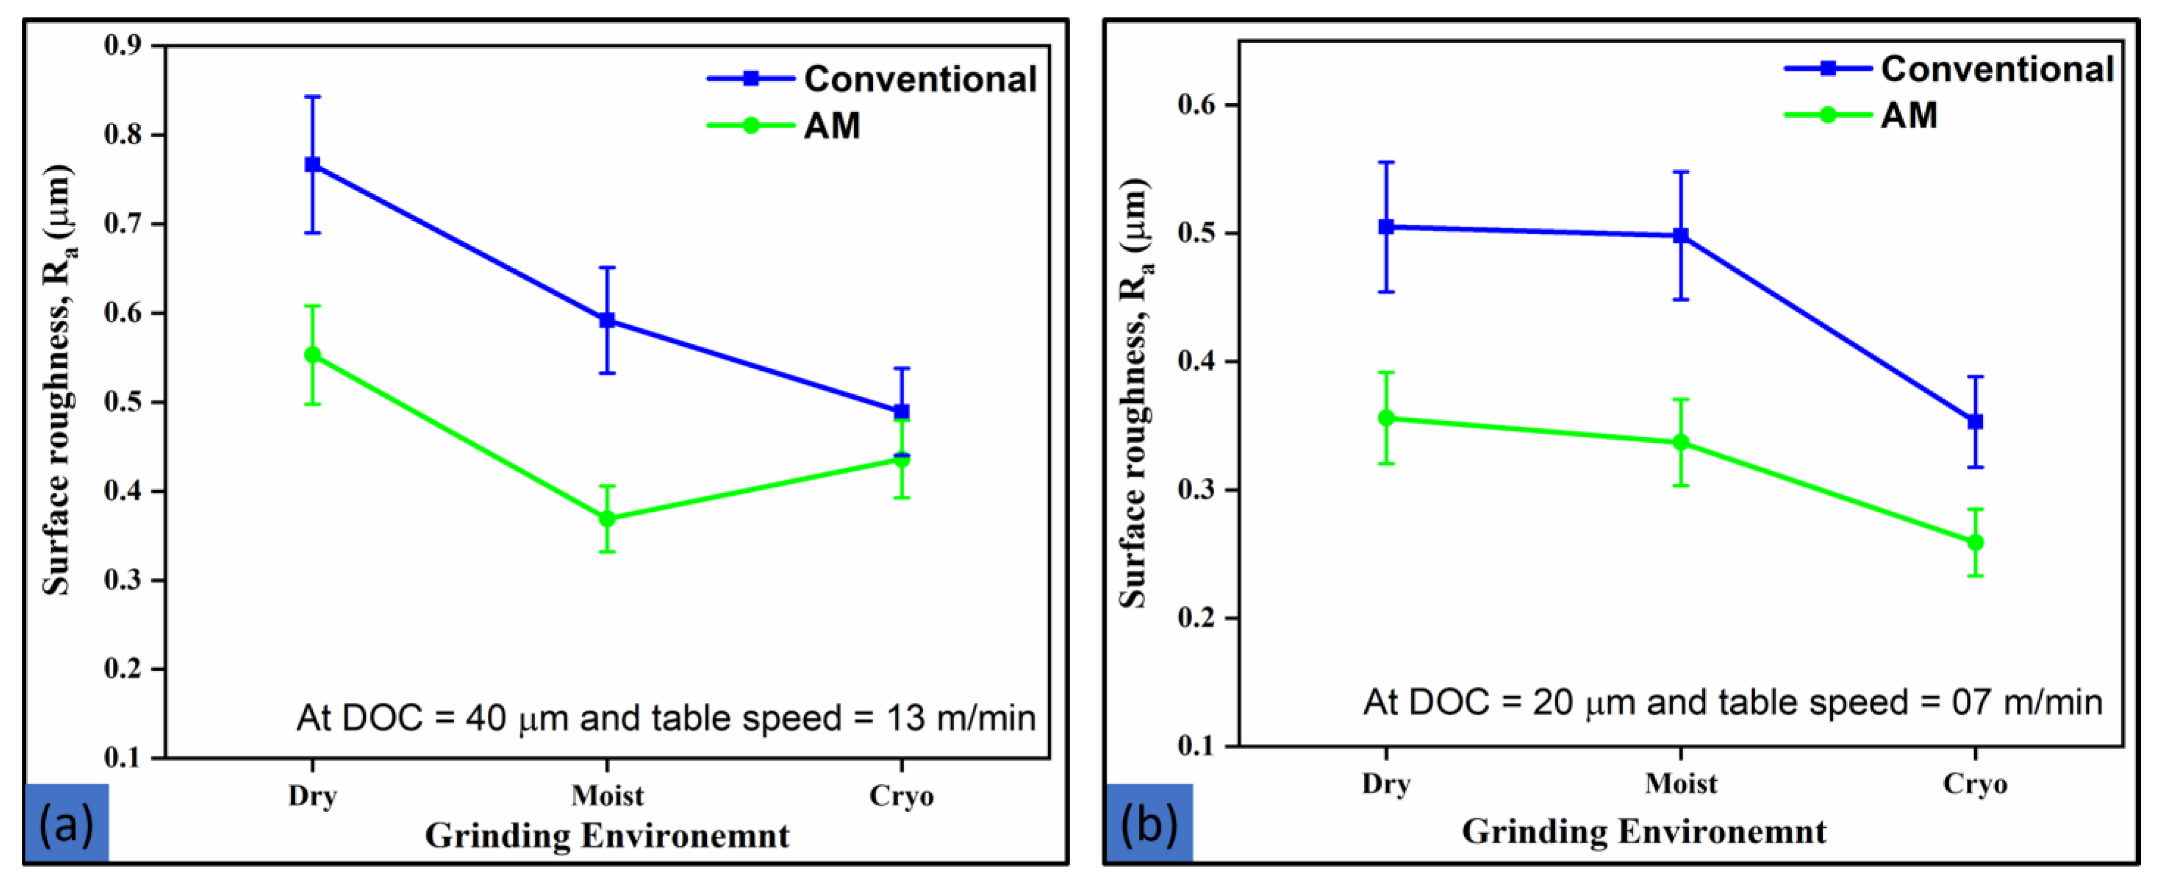
The average surface roughness () was evaluated measuring the roughness of the finished AM and conventionally processed Ti-6Al-4V samples. The initial parameter of the conventionally processed and the DMLS specimens in heat-treated condition, was found to be 3.74 ± 1.18 µm and 8.95 ± 1.58 µm, respectively. In general, after the finishing operation, the average surface roughness was improved under different conditions, especially by cryogenic grinding. As shown in Figure 6, parameter increased when the DOC and table feed increased under various grinding conditions due to the large undeformed chip thickness. Increase in DOC causes a deeper penetration of the grinding wheel into the workpiece surface, and diminishes the sharpness of the abrasive grit, increasing the surface roughness. If the table feed is increased, the grinding wheel is forced to remove more material in a shorter amount of time. This causes the wheel to become dull more quickly and generate heat between the wheel and workpiece. This heat causes the workpiece to expand, which increases surface roughness.
In general, surface roughness decreases with increase in grit sharpness, suggesting that the sharpness of abrasive grit is essential for enhancing the surface characteristics of components [29]. Lower surface roughness was observed in cryogenic grinding at DOC of 20 µm and table feed of 07 m/min, and it was 0.259 µm for the AM and 0.353 µm for conventionally processed sample. At a DOC of 20 µm and table feed of 07 m/min, it was 0.356 µm for AM and 0.505 µm for the conventionally processed sample in dry grinding and 0.337 µm for AM and 0.498 µm for the conventionally processed sample in moist grinding. The average surface roughness in cryogenic grinding was reduced by 27.25% and 23.15% for the AM and by 30.08% and 29.13% for the conventional samples, compared to dry and moist conditions, respectively. In cryogenic grinding, liquid nitrogen was injected in the grinding area which lowered the temperature in the grinding area, and as a result, the surface roughness was reduced. The drop in the temperature of the grinding zone allows the grit to maintain its sharpness throughout the grinding process. The grinding temperature is not directly correlated with the surface finish of the workpiece. According to literature, as the temperature rises, the surface finish decreases because of decrease in hardness and increase in oxidation of the grinded surface [30]. Therefore, superior surface finish is obtained at lower grinding temperatures.
The surface finish is affected by various factors such as depth of cut, table feed, and type of coolant used. In AM samples, wet grinding produced a better surface finish compared to cryogenic grinding at a higher depth of cut and table feed. Cryogenic grinding uses liquid nitrogen as a coolant to cool the sample and the grinding wheel, which results in thermal stresses and cracking of the samples, and also causes rapid wear of the grinding wheel, resulting in a less uniform grinding action and a rougher surface finish at a higher depth of cut and table feed.
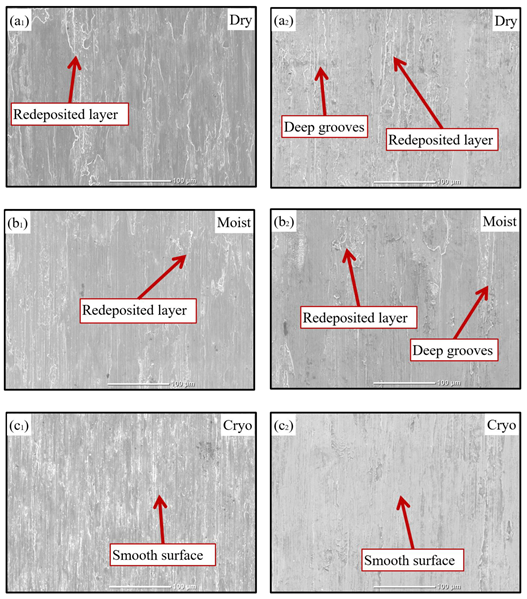
Figure 7 presents scanning electron microscopy (SEM) images of finished surfaces of the AM and conventional samples at DOC of 40 µm and table feed of 13 m/min. The surface quality of the finished components plays a crucial role in their applications. Poor surface quality has been seen from dry grinding (Figure 7(a1,a2)) due to deep grooves and redeposited layer, in the absence of coolant. A layer of dislodged material gets redeposited because of the increase in adhesion ability of the workpiece in the dry grinding condition. In moist grinding, redeposited layers and deep groves were seen at some locations because of insufficient coolant penetration around the grinding region, but the surface quality of finished samples was somewhat better than that in dry grinding (Figure 7(b1,b2)). SEM image of the finished surface under cryogenic grinding, is shown in Figure 7(c1,c2). At DOC of 40 µm and table feed of 13 m/min, cryogenic grinding generated a surface quality that was superior to dry and moist grinding. The surface characteristics of finished AM samples were better than those of finished conventional samples. Since the conventional samples are more ductile than the AM samples, their surface is rougher than that of AM samples.
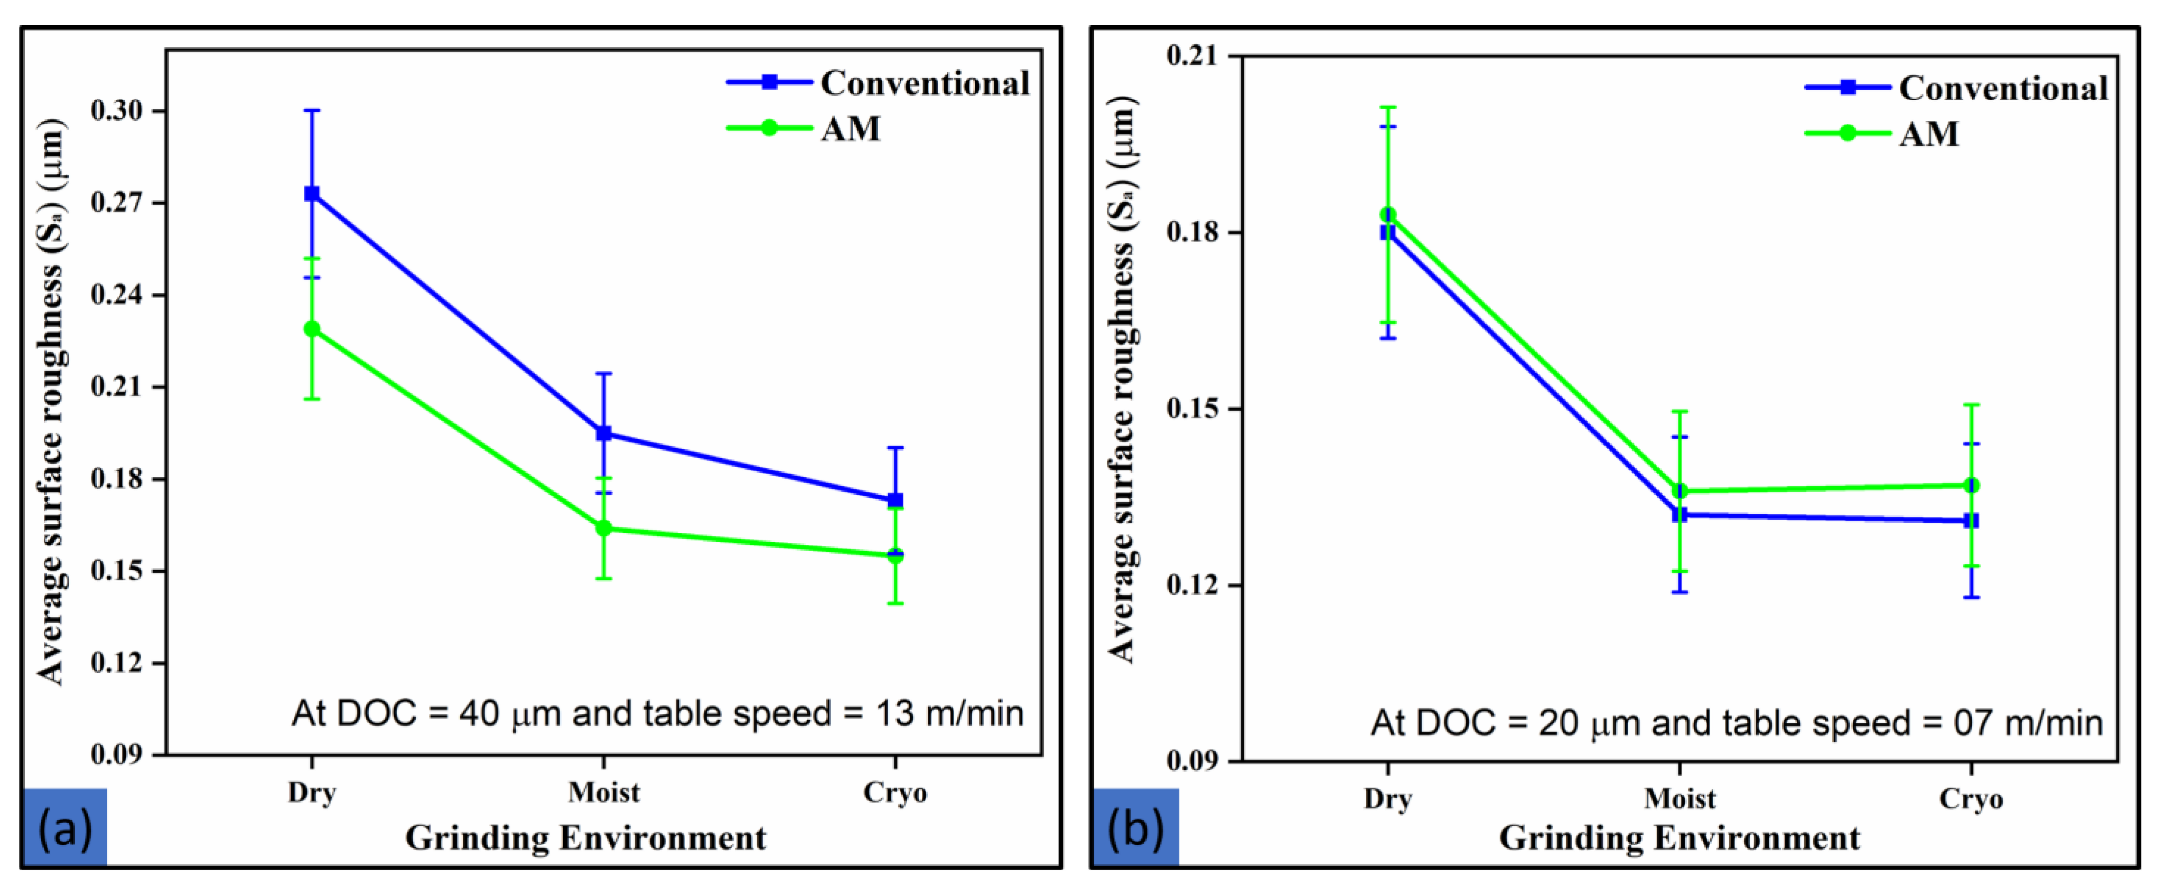
For further confirmation, Figure 8 presents the trend in the average surface roughness () of the finished AM and conventional samples, revealed by atomic force microscopy (AFM) at DOCs of 40, 20 µm and table feeds of 07, 13 m/min in various conditions, to evaluate the 3D surface morphology. At DOC of 20 µm and table feed of 07 m/min, both AM and conventionally finished samples experience almost the same surface roughness (Figure 8b); however, at DOC of 40 µm and table feed of 13 m/min, more surface roughness was found in the finished conventional samples in comparison to the finished AM samples (Figure 8a) because of more ‘ploughing’ action.
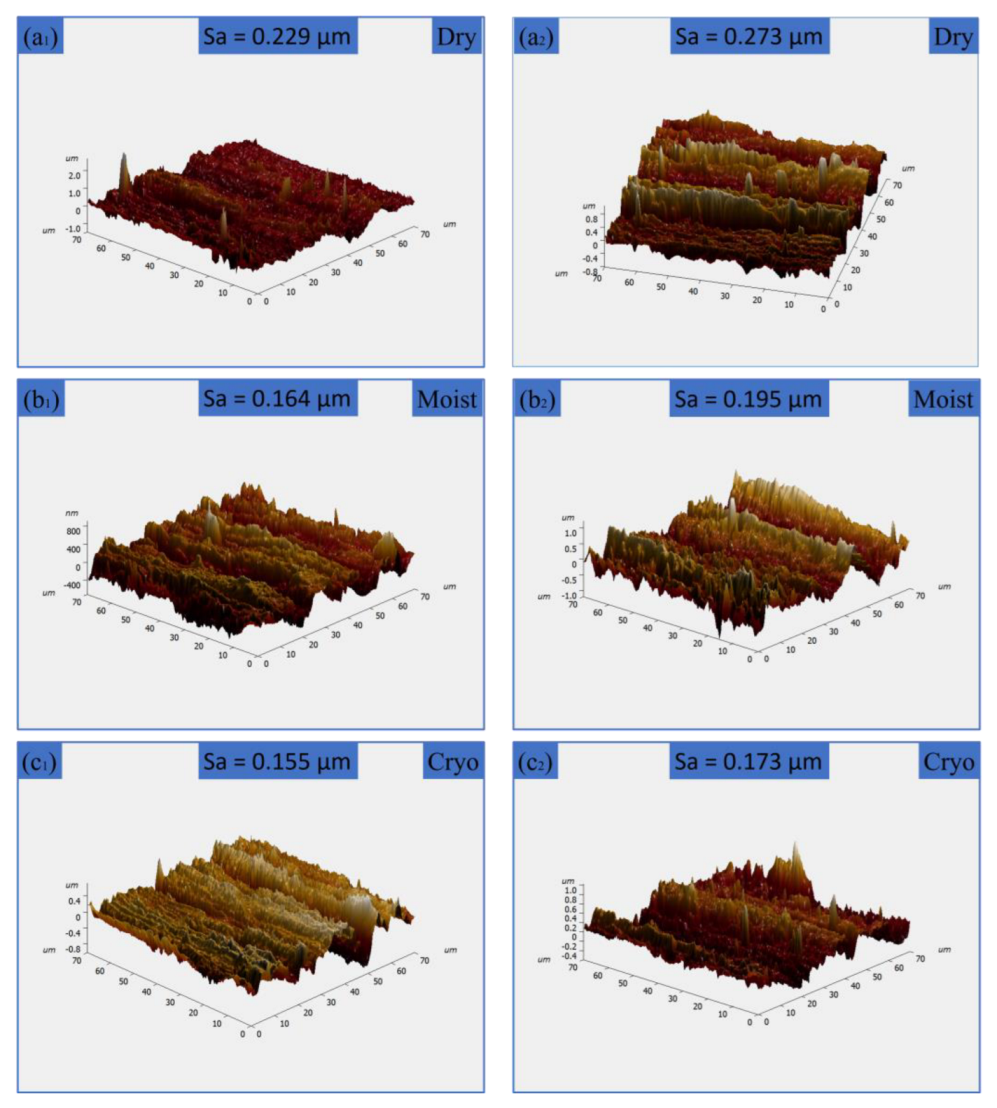
Figure 9 presents AFM images of the finished AM and conventional samples at DOC of 40 µm and table feed of 13 m/min, and an area of 70 × 70 µm2 of the finished samples was examined. From this figure, it may be observed that the finished conventional samples (Figure 9(a2,b2,c2)) are larger peaks than those of the finished AM samples (Figure 9(a1,b1,c1)). The parameter was 229 nm, 164 nm, and 155 nm for the AM and 273 nm, 195 nm, and 173 nm for the conventional samples in dry, moist, and cryogenic conditions, respectively. In dry grinding, micro-sized chips formed over the finished area during the first pass and then deposited on the abrasive wheel during another pass, because of this, deep grooves were formed on the finished surface of AM samples. This phenomenon is more noticeable in finished conventional samples because of their high ductility. To enhance the surface quality of the samples, moist grinding was performed; however, effective cooling in cryogenic grinding resulted in lower surface roughness, compared to dry and moist grinding as also observed earlier [31,32].
Suggested values of DOC and table feed for conventionally fabricated Ti-6Al-4V samples were used for the finishing of the AM samples. The positive surface roughness results show that the above set of DOC and table feed values can be used even when AM Ti-6Al-4V specimens are subjected to finishing operations, to enhance the surface quality.
3.2. Bearing Area Curve of Finished AM and Conventional Samples under Different Conditions
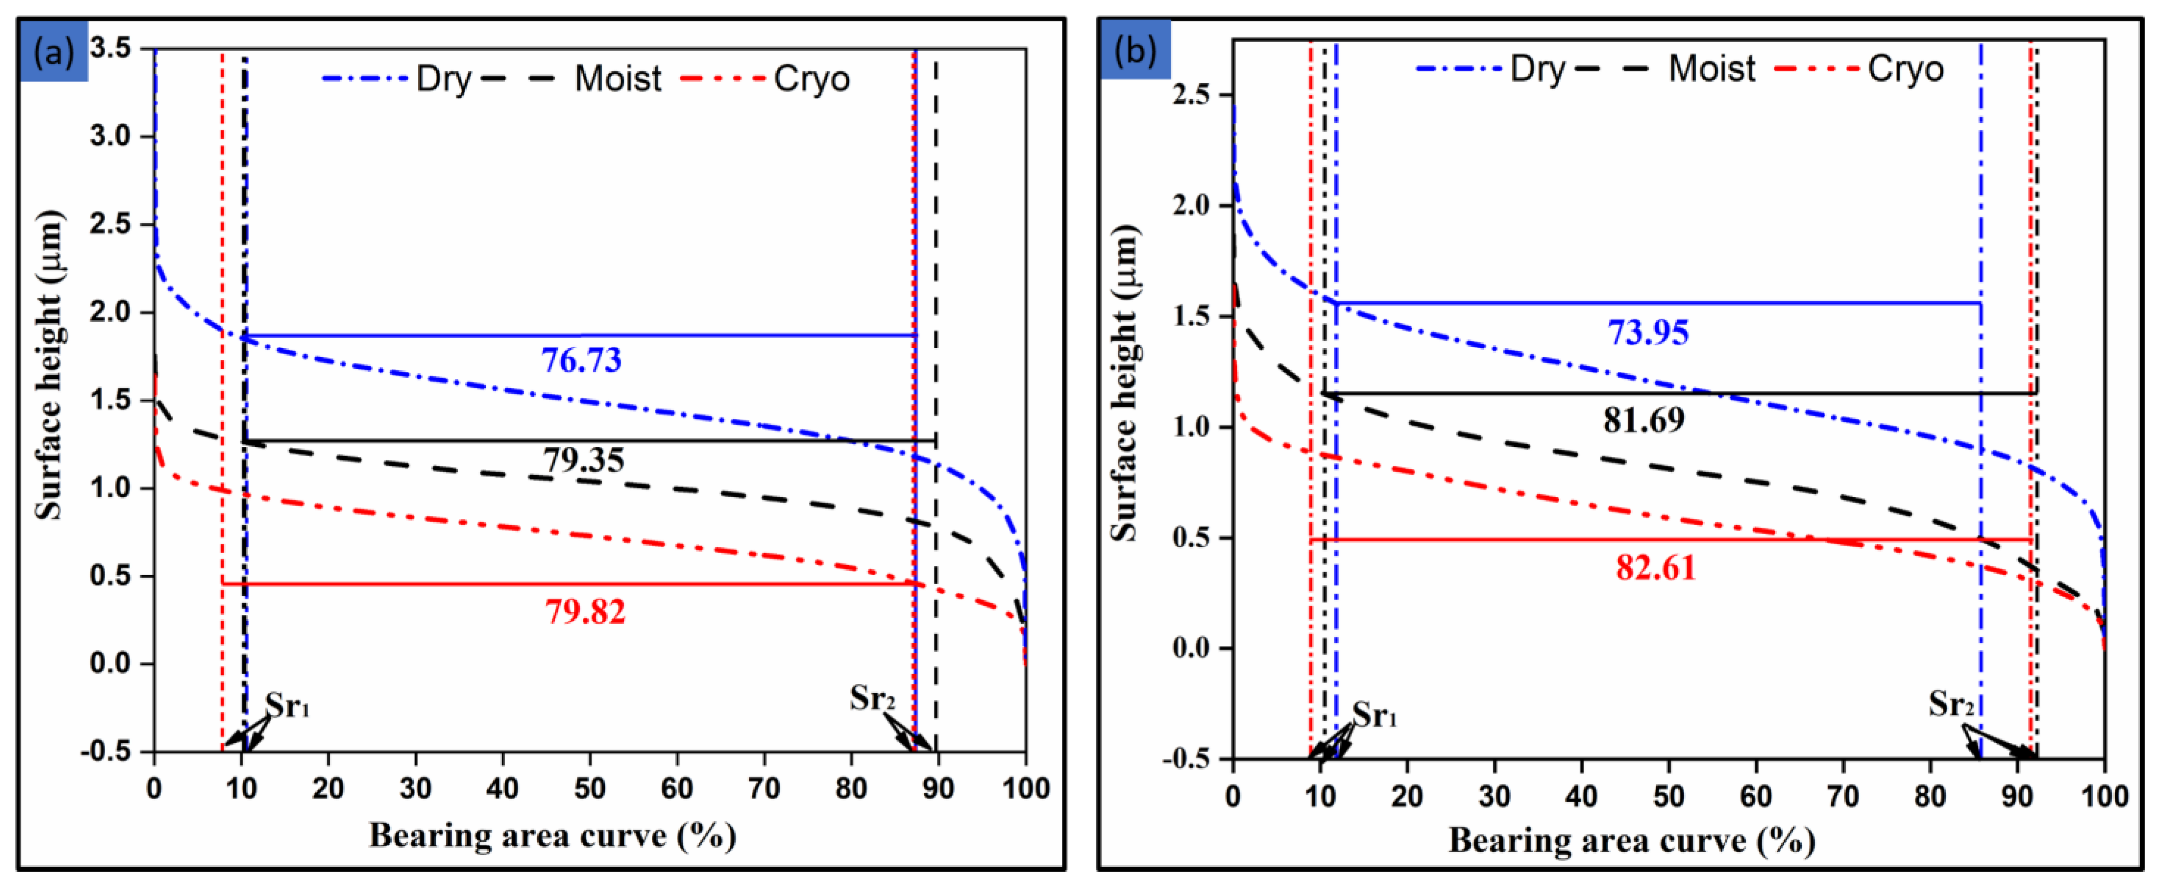
Figure 10 presents the variation of surface height of finished samples at DOC of 40 µm and table feed of 13 m/min in dry, moist, and cryogenic conditions. The difference between the upper () and lower () material ratio was measured in the bearing area curve for better understanding of the surface topography. Figure 10a,b show the trends of surface height with respect to the bearing area percentage of the finished AM and conventional samples, respectively. According to this, the differences in upper and lower ratio were 76.73%, 79.35%, and 79.82% for the finished AM and 73.95%, 81.69%, and 82.61% for finished conventional samples in dry, moist, and cryogenic conditions, respectively. In dry grinding, larger sharp points in the surface profile (Figure 9(a1,b1)) of the material being finished are a result of a lower bearing area ratio, which leads to poor bearing properties. The wide bearing area curve and high bearing ratio indicate the development of an excellent antifriction ground surface in the case of the cryogenic environment. Additionally, the surface bearing index was lower under the dry environment in comparison with moist and cryogenic conditions. The surface bearing indexes were 0.135 µm, 0.332 µm, and 0.482 µm for the finished AM and 0.300 µm, 0.411 µm, and 0.493 µm for the finished conventional sample under dry, moist, and cryogenic conditions, respectively. During cryogenic grinding, the sharpness of the abrasive grit increased which influenced the topographic features of the finished samples, and resulted in an increased surface bearing index.
3.3. Microhardness of Finished AM and Conventional Samples under Different Grinding Conditions
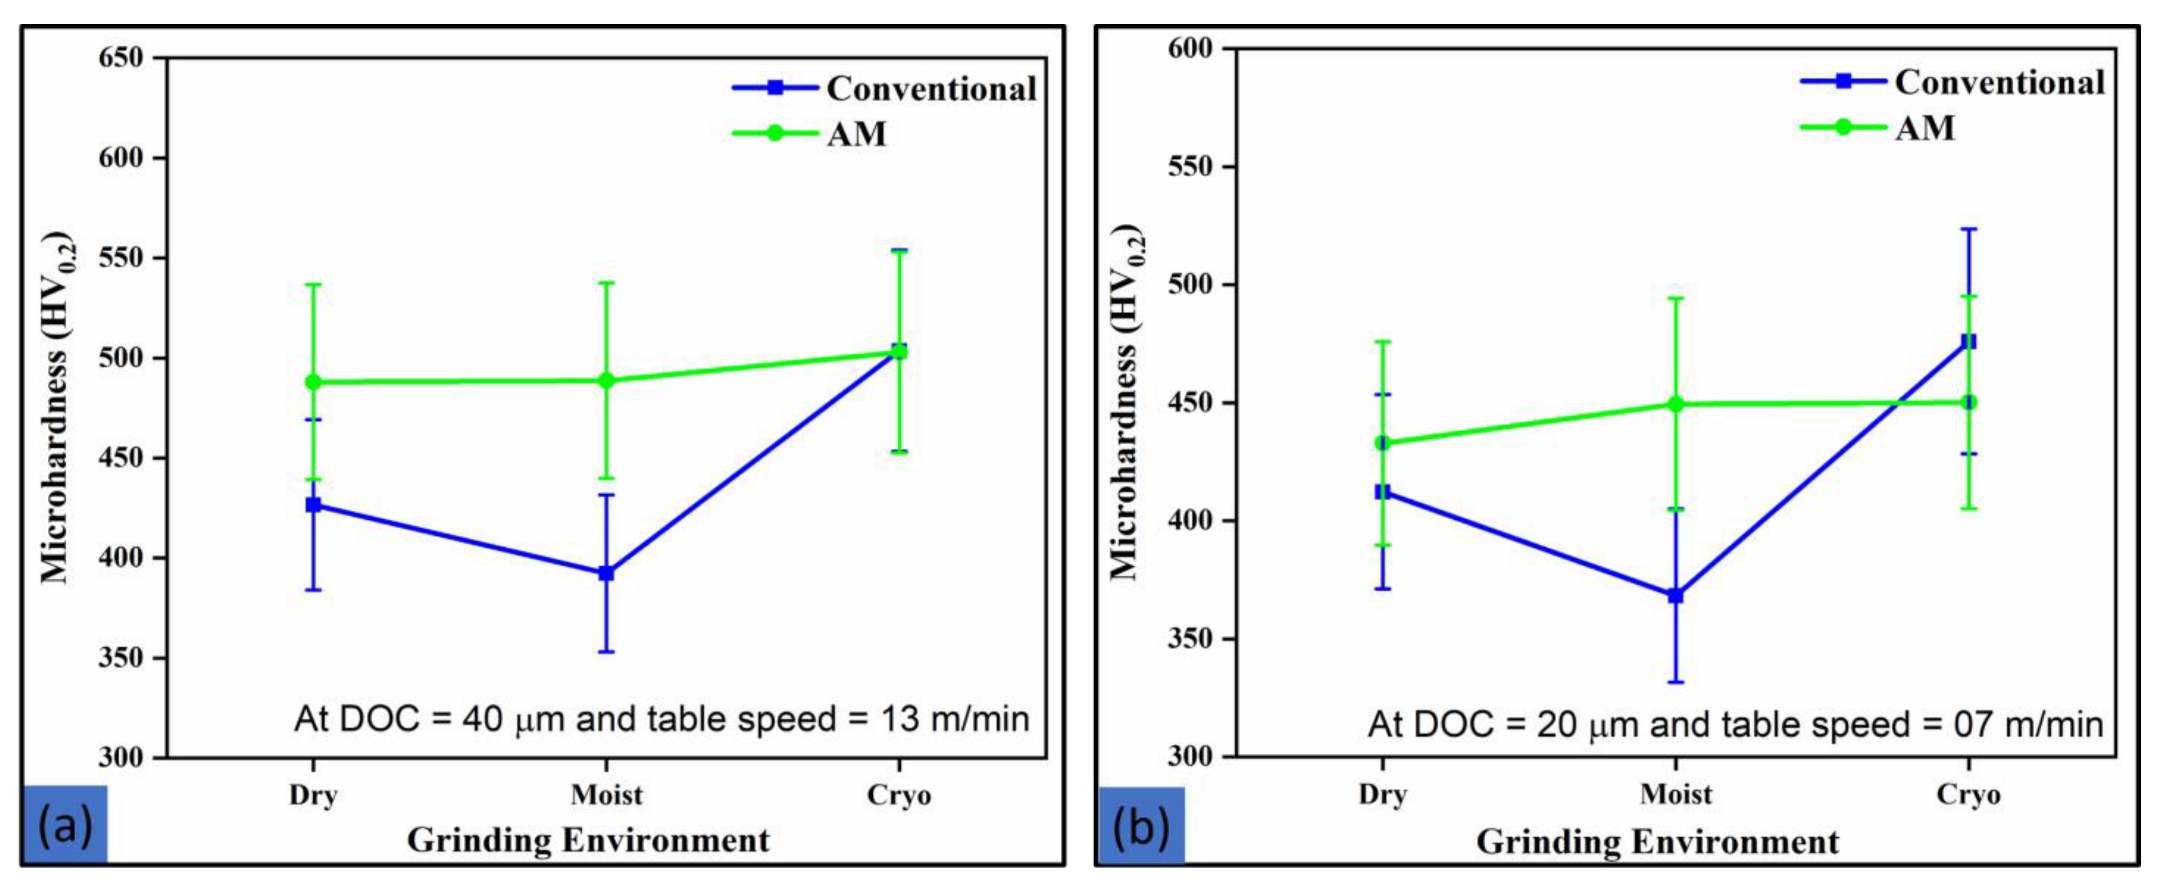
Microhardness measurements were made on each finished sample at various DOC and table feeds in various grinding conditions, and three measurements were taken at same place to check the reproducibility of the finished samples. Figure 11a,b show the maximum microhardness for the AM and conventional samples at low and high DOC and table feed, respectively. It is clear that the microstructure and microhardness of additively manufactured samples are different from those of the conventionally fabricated specimens. The hardness of AM samples was 17.81% higher than that of the conventional samples. This shows that the samples finished in the cryogenic condition have the highest microhardness for the specimens produced by both of the processes.
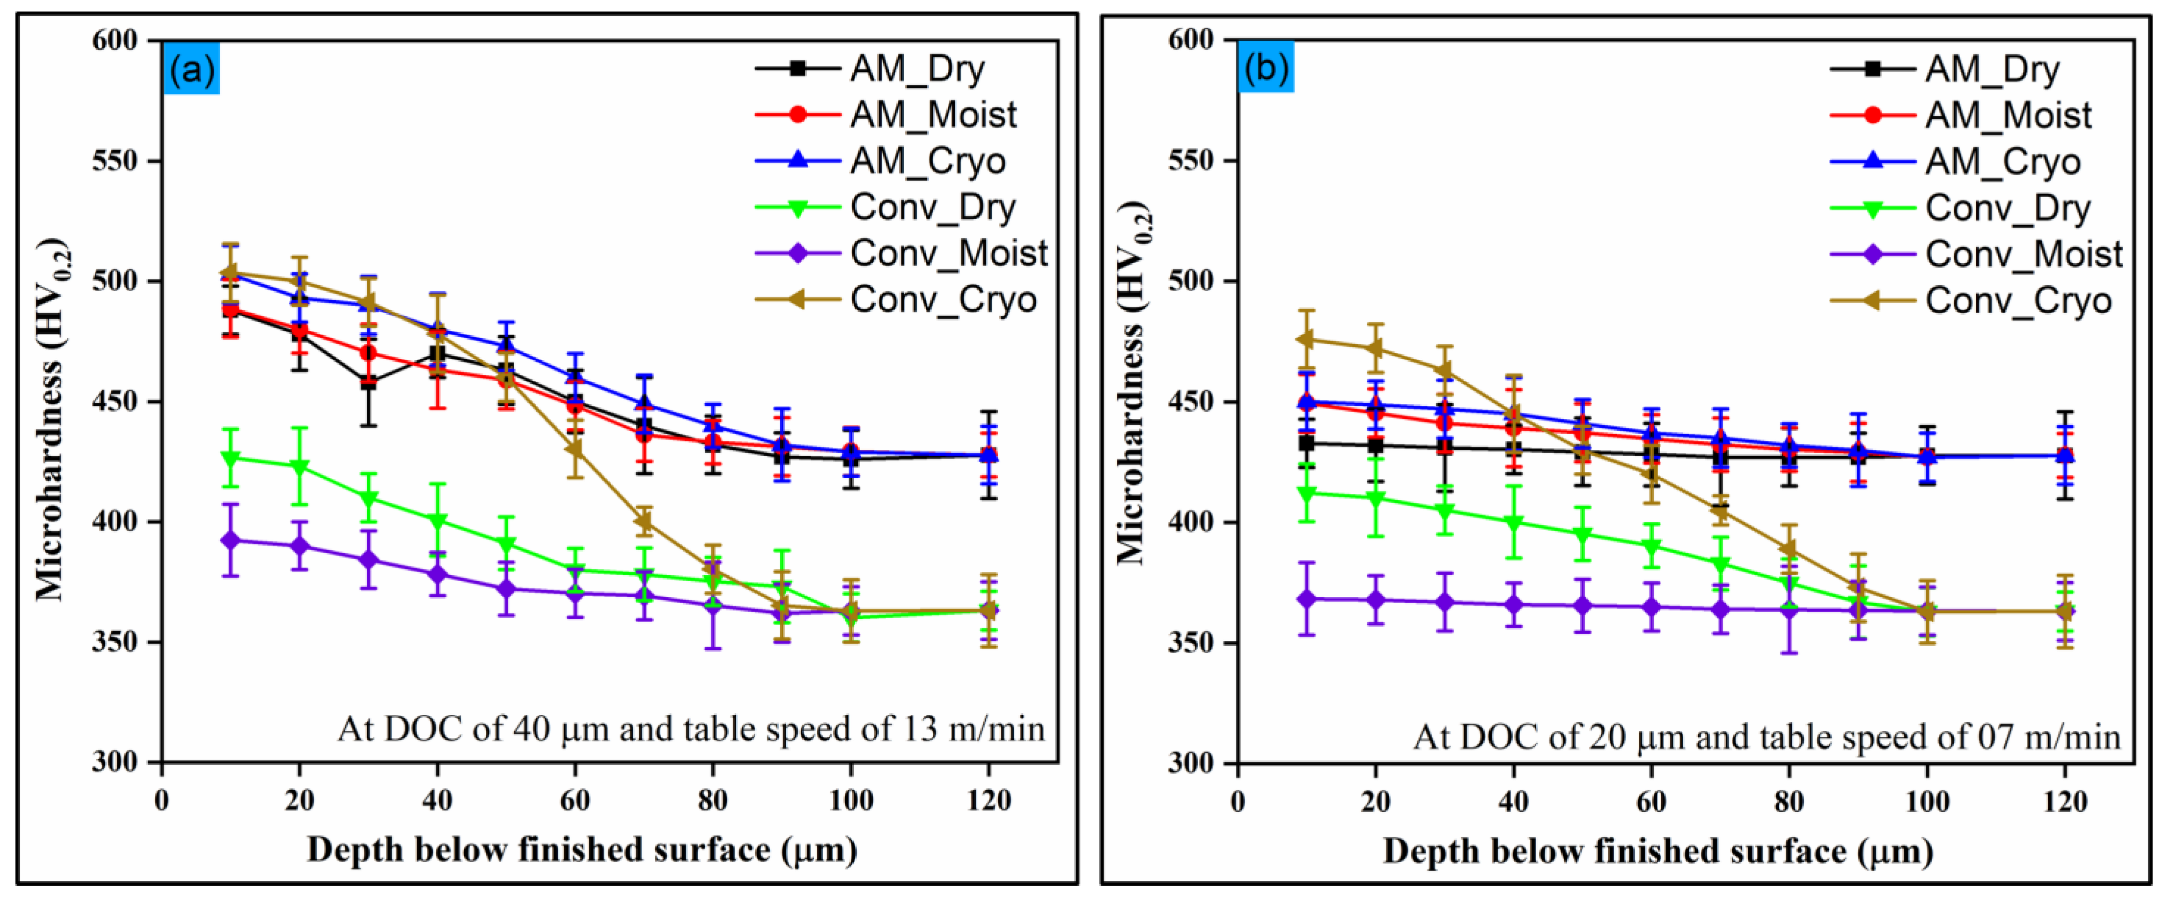
Vickers indentation was taken on the subsurface, from the edge of the ground surface of 10 µm (taken initial microhardness), and reached up to 120 µm at three distinct positions. Generally, the distance between two indentations is equal to two times the size of the previous indentation location to avoid the plastic deformation of the localized region. The highest microhardness in the finished conventional samples was up to 20 µm below the surface, grinded in dry and moist conditions, but in the cryo condition, it was up to 80 µm (Figure 12a,b). Microhardness of both the type of samples, AM as well as conventional, in different grinding environments, increased with increase in the finishing parameters like DOC and table feeds. The DMLS and conventional samples experienced a microhardness increase of 1.17%, 5.04%, and 5.22%, and 13.54%, 1.44%, and 31.08% in dry, moist, and cryogenic conditions, respectively, when finishing at DOC of 20 µm and table feed of 07 m/min. The increase in microhardness was even more when finishing at DOC of 40 µm and table feed of 13 m/min. The finished DMLS and conventional samples showed increase in microhardness by 14.07%, 14.27%, and 17.54%, and 17.48%, 8.06%, and 38.68% under dry, moist, and cryogenic conditions, respectively, as shown in Figure 11 and Figure 12. These findings show that the manufacturing techniques affect mechanical response of the finishing specimens, even when the chemical composition of the Ti-6Al-4V alloy remains the same for both of the manufacturing processes [17]. The fine acicular α phase present in the microstructure justify the maximum hardness obtained in the finished DMLS samples [1,33].
Overall, the microhardness increased because of the reduction in grain size, combined with plastic deformations, which occurred in both AM and conventionally manufactured samples during finishing operations. The increase in microhardness is greater in the cryogenic environment because liquid nitrogen has exceptional heat transfer ability from the grinding zone; thus, it suddenly reduced the grinding zone temperature and decreased the process of recovery of the deformed region [34]. Cryogenic grinding effectively cooled the workpiece, bringing the temperature down and hardening the materials. The liquid nitrogen spray that creates the cold grinding zone in the cryogenic condition enhances the material’s microhardness [18,30]. In addition, it is important to keep in mind that when finishing AM samples, the optimized input parameters for a conventional material might have a substantial impact on the surface quality.
3.4. X-ray Diffraction Analysis of Finished AM and Conventional Samples under Different Conditions
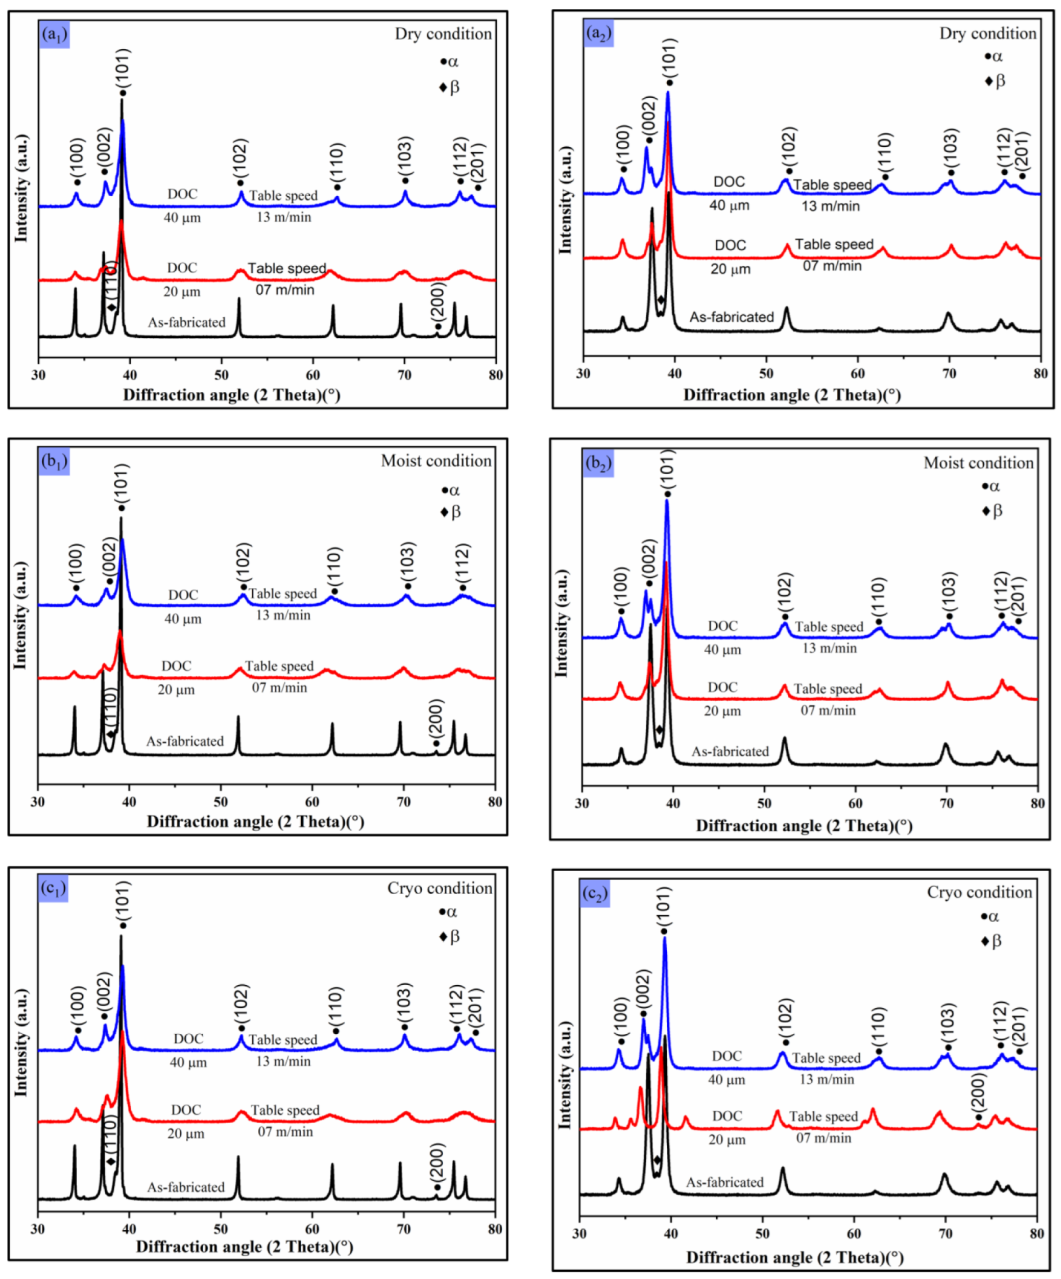
XRD analysis of finished AM and conventional samples was evaluated to visualize the effect of DOC and table feeds on the change in peaks and full width at half maximum (FWHM), as shown in Figure 13. The XRD of the finished samples indicated a flattening of the peaks, and smaller peaks of the β phase than those of the as-fabricated samples because of the finishing operations. These findings are in agreement with those of other researchers [35,36]. Table 4, Table 5, Table 6 and Table 7 present the ratio of peak intensity and FWHM of finished conventional and AM samples at maximum and minimum DOC and table feeds under dry, moist, and cryo conditions. The modification in peak broadening was caused due to plastic deformation during the finishing operations. Figure 13(a1,b1,c1,a2,b2,c2) show the effect of DOC, table feeds, and various grinding conditions on the XRD patterns of the finished additively manufactured and conventionally manufactured samples, respectively.
The temperature during finishing operations was measured and found below the β-transition temperature, thus, it is obvious that there was no phase transformation due to the finishing operations. This was verified by XRD analysis. The maximum and minimum reached temperatures were 383 °C and 88 °C, which are less than the β-transition temperature. In conventionally finished samples, DOC and table feeds slightly affected both, the ratio of intensity and the broadening of the peaks, as shown in Table 4 and Table 5. As the DOC increased, an increase in the peak broadening of the (100) plane and significant reduction in the peak intensity of the (002) plane of hexagonally closed packed α phase (Table 4 and Table 5) was observed, as shown in Figure 13(a2,b2,c2). The peak intensity of all the planes of the finished conventional samples was observed to be almost same, following grinding in all the environments.
The finishing process significantly affected the texture of finished DMLS Ti-6Al-4V samples, where almost every peak intensity was decreased (Figure 13(a1,b1,c1) and Table 6 and Table 7). In cryogenic condition, as DOC and table feeds increased, a greater increase in peak broadening was observed, as shown in Table 6 and Table 7. As shown in Figure 13(a1,b1,c1), increase in the DOC and table feeds leads to larger decrease in the peak intensity of (002) plane in all grinding conditions. The variation in peak intensity and increase in peak broadening indicates the existence of grain refinement in the finished samples. The (100), (002), (101), and (102) Ti-α peaks are broader, indicating that the DMLS samples are more sensitive to finishing processes; this was verified also by the higher microhardness measured of the finished DMLS samples (Figure 11a,b). The XRD patterns affirm the existence of a microstructure distortion on the finished samples. Additionally, the peak broadening shown in XRD of finished DMLS components indicates significant level of deformation compared to finished conventionally manufactured Ti-6Al-4V samples that indicates that the DMLS samples are more sensitive to finishing processes [17].
3.5. Effect of Grinding Media on the Subsurface Layer of Finished AM and Conventionally Manufactured Samples
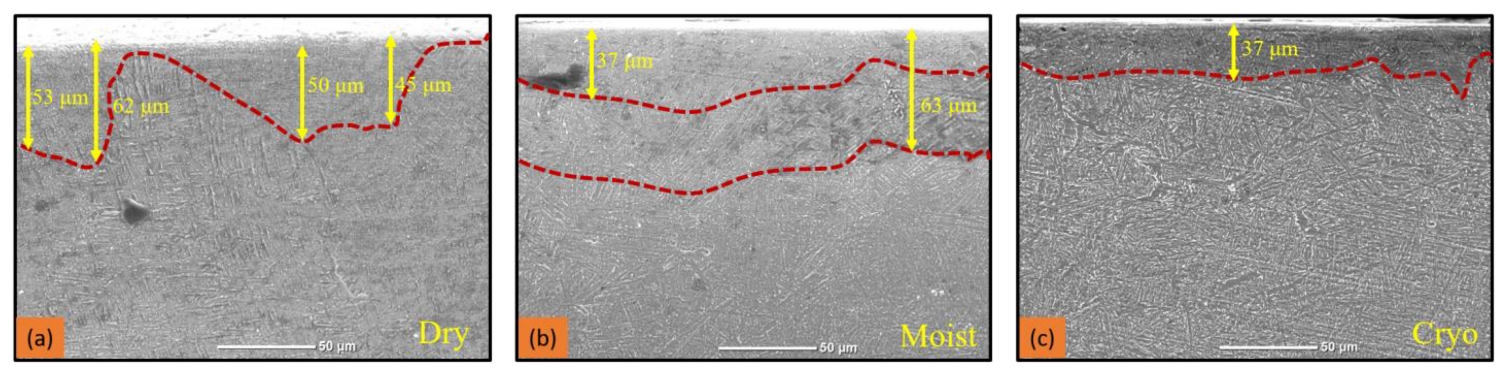
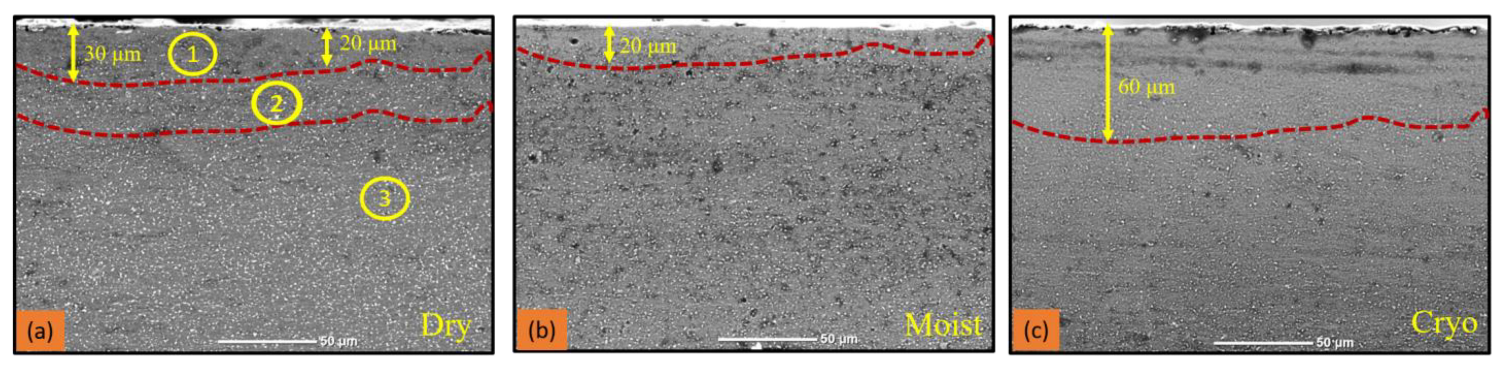
Figure 14 and Figure 15 present the effect of various grinding conditions on the subsurface layers of finished AM and conventionally manufactured samples, respectively. The finishing process introduced heat and altered the microstructure, depending on the grinding conditions. To identify the effect of finishing process on microstructural change within the affected layer of the samples, microstructure of each finished Ti-6Al-4V sample after dry, moist, and cryogenic finishing are shown in Figure 14 and Figure 15. From these figures, it is clear that grain refinement occurred on the finished surface in all the environment conditions. The subsurface layer shows a significant difference as a function of grinding environmental conditions [30]. The additively manufactured Ti-6Al-4V sample is known to have a fine martensitic microstructure due to the rapid solidification and cooling during the manufacturing process and after heat treatment, the material has α and β phases. Grinding the surface may also alter the microstructure in the subsurface layer since the material is having a mixture of α and β phases [24]. In the subsurface layers, just below the finished surface (~20 µm), smaller α grains were observed and β grains were almost diminished, as shown in Figure 14 and Figure 15. Relatively smaller grains were observed under cryogenic finishing conditions, compared to dry and moist finishing [9]. It shows how cryogenic cooling prevents grain growth at lower grinding temperatures. It also supports the potential of using cryogenic cooling to produce harder and stronger finished surface in comparison with dry and moist finishing.
4. Conclusions
The following conclusions are drawn from surface finish of the Ti -6Al-4V samples, following grinding of AM and conventional Ti-6Al-4V samples, under different conditions.
- The AM-fabricated sample was found to have 12% higher tensile strength than that of the conventionally fabricated sample due to fine α martensitic structure in the AM-fabricated samples.
- The surface roughness was improved in cryogenic grinding because of low grinding zone temperature, and was reduced by 27.25% and 23.15% for the AM and 30.08% and 29.13% for conventional samples, compared to dry and moist conditions, respectively. Also, it was observed that surface finish of the AM Ti-6Al-4V samples was better than that of the conventional samples. The finished surfaces were also analyzed by atomic force microscopy, and it was found that the surface roughness was achieved to be 229 nm, 164 nm, and 155 nm for the finished AM and 273 nm, 195 nm, and 173 nm for the finished conventional samples in dry, moist, and cryogenic conditions, respectively.
- The finished DMLS and conventional samples exhibited increase in microhardness by 14.07%, 14.27%, and 17.54% and 17.48%, 8.06%, and 38.68% in dry, moist, and cryogenic conditions, respectively. The increase in microhardness is greater in the cryogenic environment because liquid nitrogen has exceptional heat transfer ability from the grinding zone, and suddenly reduces the grinding zone temperature.
- In cryogenic conditions, as DOC and table feeds increased, peak broadening was observed significantly. The ratio of FWHM for finished AM components indicated significant increase in peak broadening as compared to finished conventional samples, because of a significant level of deformation. This suggests that the AM samples are more susceptible to the finishing operations.
- The subsurface layer shows a significant difference as a function of the grinding environment conditions. Grinding the surface alters the microstructure in the subsurface layer, since the material has a mixture of α and β phases. In the subsurface layers just below the finished surface (~20 µm), smaller α grains were observed and β grains were almost diminished. The smallest grains were observed under cryogenic finishing conditions, compared to dry and moist finishing, because of the restriction on grain growth at low grinding temperatures. Due to this, cryogenic finishing produces harder and stronger surfaces in comparison to dry and moist finishing.
- Suggested values of DOC and table feed for the conventional Ti-6Al-4V samples were used for finishing of the AM Ti-6Al-4V samples. The positive surface roughness results suggest that the above set of DOC and table feed can be used even for the AM Ti-6Al-4V components for the finishing operations, to enhance the surface quality.
Author Contributions
P.K.S.: Conceptualization, investigation, methodology, and writing; S.K. and P.K.J.: supervision, review and editing. All authors have read and agreed to the published version of the manuscript.
Funding
There is no funding involved in this research.
Institutional Review Board Statement
Not applicable.
Informed Consent Statement
Not applicable.
Data Availability Statement
The data for undertaken study is already presented in the article.
Acknowledgments
Authors express their sincere thanks to IDC lab and CIF, IIT (BHU), Varanasi, U.P., India for conducting the experiments and characterization.
Conflicts of Interest
The authors declare that they have no known competing financial interest or personal relationship that could have appeared to influence the work reported in this paper.
Nomenclature/Abbreviations
| AM | Additive manufacturing |
| DMLS | Direct Metal Laser Sintering |
| DOC | Depth of cut |
| CAD | Computer aided design |
| EOS | Electro optical system |
| HT | Heat-treated |
| XRD | X-ray diffraction |
| Cryo | Cryogenic |
| SEM | Scanning electron microscopy |
| AFM | Atomic force microscopy |
| Average surface roughness for 2D profile | |
| Average surface roughness for 3D profile | |
| Liquid nitrogen | |
| Peak intensity at initial condition | |
| Peak intensity after finishing condition | |
| Full width half maximum at initial condition | |
| Full width half maximum after finishing condition |
References
- Yan, X.; Yin, S.; Chen, C.; Huang, C.; Bolot, R.; Lupoi, R.; Kuang, M.; Ma, W.; Coddet, C.; Liao, H. Effect of heat treatment on the phase transformation and mechanical properties of Ti6Al4V fabricated by selective laser melting. J. Alloys Compd. 2018, 764, 1056–1071. [Google Scholar] [CrossRef]
- Dhinakaran, V.; Ajith, J.; Fahmidha, A.F.Y.; Jagadeesha, T.; Sathish, T.; Stalin, B. Wire Arc Additive Manufacturing (WAAM) process of nickel based superalloys–A review. Mater. Today Proc. 2020, 21, 920–925. [Google Scholar] [CrossRef]
- Ren, S.; Chen, Y.; Liu, T.; Qu, X. Effect of build orientation on mechanical properties and microstructure of Ti-6Al-4V manufactured by selective laser melting. Metall. Mater. Trans. A 2019, 50, 4388–4409. [Google Scholar] [CrossRef]
- Abdulrahman, K.O.; Mahamood, R.M.; Akinlabi, E.T. Additive Manufacturing (AM): Processing Technique for Lightweight Alloys and Composite Material. In Handbook of Research on Advancements in the Processing, Characterization, and Application of Lightweight Materials; IGI Global: Hershey, PA, USA, 2022; pp. 27–48. [Google Scholar]
- Ghani, S.; Zakaria, M.; Harun, W.; Zaulkafilai, Z. Dimensional accuracy of internal cooling channel made by selective laser melting (SLM) And direct metal laser sintering (DMLS) processes in fabrication of internally cooled cutting tools. In Proceedings of the MATEC Web of Conferences, Cyberjaya, Malaysia, 2–3 August 2016; Volume 90, p. 01058. [Google Scholar]
- Zhang, L.-C.; Wang, J.; Liu, Y.; Jia, Z.; Liang, S.-X. Additive Manufacturing of Titanium Alloys. In Encyclopedia of Materials: Metals and Alloys; Caballero, F.G., Ed.; Elsevier: Oxford, UK, 2022. [Google Scholar]
- Hamza, H.M.; Deen, K.M.; Haider, W. Microstructural examination and corrosion behavior of selective laser melted and conventionally manufactured Ti6Al4V for dental applications. Mater. Sci. Eng. C 2020, 113, 110980. [Google Scholar] [CrossRef]
- Nguyen, H.D.; Pramanik, A.; Basak, A.K.; Dong, Y.; Prakash, C.; Debnath, S.; Shankar, S.; Jawahir, I.S.; Dixit, S.; Buddhi, D. A critical review on additive manufacturing of Ti-6Al-4V alloy: Microstructure and mechanical properties. J. Mater. Res. Technol. 2022, 18, 4641–4661. [Google Scholar] [CrossRef]
- Bertolini, R.; Lizzul, L.; Pezzato, L.; Ghiotti, A.; Bruschi, S. Improving surface integrity and corrosion resistance of additive manufactured Ti6Al4V alloy by cryogenic machining. Int. J. Adv. Manuf. Technol. 2019, 104, 2839–2850. [Google Scholar] [CrossRef]
- Simonelli, M.; Tse, Y.Y.; Tuck, C. Effect of the build orientation on the mechanical properties and fracture modes of SLM Ti–6Al–4V. Mater. Sci. Eng. A 2014, 616, 1–11. [Google Scholar] [CrossRef] [Green Version]
- Xie, W.; Zheng, M.; Wang, J.; Li, X. The effect of build orientation on the microstructure and properties of selective laser melting Ti-6Al-4V for removable partial denture clasps. J. Prosthet. Dent. 2020, 123, 163–172. [Google Scholar] [CrossRef] [Green Version]
- Chicos, L.-A.; Zaharia, S.M.; Cempura, G.; Kruk, A.; Lech, S.; Kryshtal, O.; Ziętara, M.; Michta, G.; Rodríguez, J.; Cosnita, M. Effect of concentrated solar energy on microstructure evolution of selective laser melted Ti-6Al-4V alloy. Int. J. Adv. Manuf. Technol. 2021, 118, 1–25. [Google Scholar] [CrossRef]
- Wu, S.; Lu, Y.; Gan, Y.; Huang, T.; Zhao, C.; Lin, J.; Guo, S.; Lin, J. Microstructural evolution and microhardness of a selective-laser-melted Ti–6Al–4V alloy after post heat treatments. J. Alloys Compd. 2016, 672, 643–652. [Google Scholar] [CrossRef]
- Pushilina, N.; Stepanova, E.; Kudiiarov, V.; Laptev, R.; Syrtanov, M. Heat treatment of the Ti-6Al-4V alloy manufactured by electron beam melting. In Proceedings of the AIP Conference Proceedings, Tomsk, Russia, 9–11 December 2019; p. 020290. [Google Scholar]
- Zhao, X.; Li, S.; Zhang, M.; Liu, Y.; Sercombe, T.B.; Wang, S.; Hao, Y.; Yang, R.; Murr, L.E. Comparison of the microstructures and mechanical properties of Ti–6Al–4V fabricated by selective laser melting and electron beam melting. Mater. Des. 2016, 95, 21–31. [Google Scholar] [CrossRef]
- Li, K.; Ma, R.; Zhang, M.; Chen, W.; Li, X.; Zhang, D.Z.; Tang, Q.; Murr, L.E.; Li, J.; Cao, H. Hybrid post-processing effects of magnetic abrasive finishing and heat treatment on surface integrity and mechanical properties of additively manufactured Inconel 718 superalloys. J. Mater. Sci. Technol. 2022, 128, 10–21. [Google Scholar] [CrossRef]
- Rotella, G.; Imbrogno, S.; Candamano, S.; Umbrello, D. Surface integrity of machined additively manufactured Ti alloys. J. Mater. Process. Technol. 2018, 259, 180–185. [Google Scholar] [CrossRef]
- Bordin, A.; Sartori, S.; Bruschi, S.; Ghiotti, A. Experimental investigation on the feasibility of dry and cryogenic machining as sustainable strategies when turning Ti6Al4V produced by Additive Manufacturing. J. Clean. Prod. 2017, 142, 4142–4151. [Google Scholar] [CrossRef]
- Vilaro, T.; Colin, C.; Bartout, J.-D. As-fabricated and heat-treated microstructures of the Ti-6Al-4V alloy processed by selective laser melting. Metall. Mater. Trans. A 2011, 42, 3190–3199. [Google Scholar] [CrossRef]
- Jawahir, I.S.; Brinksmeier, E.; M’Saoubi, R.; Aspinwall, D.K.; Outeiro, J.C.; Meyer, D.; Umbrello, D.; Jayal, A.D. Surface integrity in material removal processes: Recent advances. CIRP Ann. 2011, 60, 603–626. [Google Scholar] [CrossRef]
- Guo, P.; Zou, B.; Huang, C.; Gao, H. Study on microstructure, mechanical properties and machinability of efficiently additive manufactured AISI 316L stainless steel by high-power direct laser deposition. J. Mater. Process. Technol. 2017, 240, 12–22. [Google Scholar] [CrossRef]
- Barba, D.; Alabort, C.; Tang, Y.; Viscasillas, M.; Reed, R.; Alabort, E. On the size and orientation effect in additive manufactured Ti-6Al-4V. Mater. Des. 2020, 186, 108235. [Google Scholar] [CrossRef]
- Liu, J.; Li, G.; Sun, Q.; Li, H.; Sun, J.; Wang, X. Understanding the effect of scanning strategies on the microstructure and crystallographic texture of Ti-6Al-4V alloy manufactured by laser powder bed fusion. J. Mater. Process. Technol. 2022, 299, 117366. [Google Scholar] [CrossRef]
- Setti, D.; Yadav, N.K.; Ghosh, S. Grindability improvement of Ti-6Al-4V using cryogenic cooling. Proc. Inst. Mech. Eng. Part B J. Eng. Manuf. 2014, 228, 1131–1137. [Google Scholar] [CrossRef]
- Paul, S.; Chattopadhyay, A. The effect of cryogenic cooling on grinding forces. Int. J. Mach. Tools Manuf. 1996, 36, 63–72. [Google Scholar] [CrossRef]
- Kayacan, M.Y.; Yılmaz, N.; Özsoy, A. Experimental determination of thermal emissivities for Ti6Al4V in SLM method. J. Addit. Manuf. Technol. 2021, 1, 494. [Google Scholar]
- De Maddis, M.; Lunetto, V.; Razza, V.; Russo Spena, P. Infrared Thermography for Investigation of Surface Quality in Dry Finish Turning of Ti6Al4V. Metals 2022, 12, 154. [Google Scholar] [CrossRef]
- ASTM International. E8/E8M-16a: Standard Test Methods for Tension Testing of Metallic Materials; ASTM International: West Conshohocken, PA, USA, 2016. [Google Scholar]
- Malkin, S.; Guo, C. Grinding Technology: Theory and Application of Machining with Abrasives; Industrial Press Inc.: New York, NY, USA, 2008. [Google Scholar]
- Balan, A.S.; Chidambaram, K.; Kumar, A.V.; Krishnaswamy, H.; Pimenov, D.Y.; Giasin, K.; Nadolny, K. Effect of cryogenic grinding on fatigue life of additively manufactured maraging steel. Materials 2021, 14, 1245. [Google Scholar] [CrossRef]
- Umbrello, D.; Pu, Z.; Caruso, S.; Outeiro, J.; Jayal, A.; Dillon, O.; Jawahir, I. The effects of cryogenic cooling on surface integrity in hard machining. Procedia Eng. 2011, 19, 371–376. [Google Scholar] [CrossRef] [Green Version]
- Kaynak, Y.; Lu, T.; Jawahir, I. Cryogenic machining-induced surface integrity: A review and comparison with dry, MQL, and flood-cooled machining. Mach. Sci. Technol. 2014, 18, 149–198. [Google Scholar] [CrossRef]
- Popovich, A.; Sufiiarov, V.; Borisov, E.; Polozov, I.A. Microstructure and mechanical properties of Ti-6Al-4V manufactured by SLM. In Key Engineering Materials; Trans Tech Publications Ltd.: Zurich, Switzerland, 2015; pp. 677–682. [Google Scholar]
- Sharma, A.; Chaudhari, A.; Awale, A.S.; Yusufzai, M.Z.K.; Vashista, M. Effect of grinding environments on magnetic response of AISI D2 tool steel. Russ. J. Nondestruct. Test. 2021, 57, 212–221. [Google Scholar] [CrossRef]
- Velásquez, J.P.; Bolle, B.; Chevrier, P.; Geandier, G.; Tidu, A. Metallurgical study on chips obtained by high speed machining of a Ti–6 wt.% Al–4 wt.% V alloy. Mater. Sci. Eng. A 2007, 452, 469–474. [Google Scholar] [CrossRef]
- Wang, Q.; Liu, Z. Plastic deformation induced nano-scale twins in Ti-6Al-4V machined surface with high speed machining. Mater. Sci. Eng. A 2016, 675, 271–279. [Google Scholar] [CrossRef]
Figure 1.
Process flow chart of additively manufactured Ti-6Al-4V parts by DMLS technique.

Figure 2.
(a) SEM micrograph of as-fabricated AM, (b) optical micrograph of HT AM, (c) optical micrograph of conventionally processed and (d) optical micrograph of heat-treated conventionally processed specimen.
Figure 2.
(a) SEM micrograph of as-fabricated AM, (b) optical micrograph of HT AM, (c) optical micrograph of conventionally processed and (d) optical micrograph of heat-treated conventionally processed specimen.

Figure 3.
XRD patterns of the HT AM and HT conventionally processed specimens.

Figure 4.
Abrasive finishing experimental setup used for finishing the AM and conventional samples.

Figure 5.
Engineering stress-strain curve of AM and conventional Ti-6Al-4V samples in heat-treated condition.
Figure 5.
Engineering stress-strain curve of AM and conventional Ti-6Al-4V samples in heat-treated condition.

Figure 6.
Surface roughness of finished AM and conventionally processed components: (a) at DOC of 40 µm and table feed of 13 m/min and (b) at DOC of 20 µm and table feed of 07 m/min.
Figure 6.
Surface roughness of finished AM and conventionally processed components: (a) at DOC of 40 µm and table feed of 13 m/min and (b) at DOC of 20 µm and table feed of 07 m/min.

Figure 7.
SEM images of finished AM and conventionally processed samples at a DOC of 40 µm and table feed of 13 m/min, in: (a1) dry for AM, (a2) dry for conventional, (b1) moist for AM, (b2) moist for conventional, (c1) cryogenic for AM, and (c2) cryogenic for conventional samples.
Figure 7.
SEM images of finished AM and conventionally processed samples at a DOC of 40 µm and table feed of 13 m/min, in: (a1) dry for AM, (a2) dry for conventional, (b1) moist for AM, (b2) moist for conventional, (c1) cryogenic for AM, and (c2) cryogenic for conventional samples.

Figure 8.
Average surface roughness obtained from atomic force microscopy: (a) at a DOC of 40 µm and table feed of 13 m/min and (b) at a DOC of 20 µm and table feed of 07 m/min.
Figure 8.
Average surface roughness obtained from atomic force microscopy: (a) at a DOC of 40 µm and table feed of 13 m/min and (b) at a DOC of 20 µm and table feed of 07 m/min.

Figure 9.
AFM images of finished AM and conventionally processed samples at DOC of 40 µm and table feed of 13 m/min: (a1) dry for AM, (a2) dry for conventional, (b1) moist for AM, (b2) moist for conventional, (c1) cryogenic for AM, and (c2) cryogenic for conventional samples.
Figure 9.
AFM images of finished AM and conventionally processed samples at DOC of 40 µm and table feed of 13 m/min: (a1) dry for AM, (a2) dry for conventional, (b1) moist for AM, (b2) moist for conventional, (c1) cryogenic for AM, and (c2) cryogenic for conventional samples.

Figure 10.
Surface height variation of finished (a) AM and (b) conventional samples at a DOC of 40 µm and table feed of 13 m/min in dry, moist, and cryogenic conditions.
Figure 10.
Surface height variation of finished (a) AM and (b) conventional samples at a DOC of 40 µm and table feed of 13 m/min in dry, moist, and cryogenic conditions.

Figure 11.
Maximum microhardness for AM and conventional components at (a) DOC of 40 µm and table feed of 13 m/min and (b) DOC of 20 µm and table feed of 07 m/min under different grinding conditions.
Figure 11.
Maximum microhardness for AM and conventional components at (a) DOC of 40 µm and table feed of 13 m/min and (b) DOC of 20 µm and table feed of 07 m/min under different grinding conditions.

Figure 12.
Variation in microhardness results for finished DMLS and conventional samples at (a) DOC of 40 µm and table feed of 13 m/min and (b) DOC of 20 µm and table feed of 07 m/min.
Figure 12.
Variation in microhardness results for finished DMLS and conventional samples at (a) DOC of 40 µm and table feed of 13 m/min and (b) DOC of 20 µm and table feed of 07 m/min.

Figure 13.
XRD patterns at DOC of 40, 20 µm and table feeds of 07, 13 m/min for various grinding conditions: (a1) dry for AM, (a2) dry for conventional, (b1) moist for AM, (b2) moist for conventional, (c1) cryogenic for AM, and (c2) cryogenic for conventional samples.
Figure 13.
XRD patterns at DOC of 40, 20 µm and table feeds of 07, 13 m/min for various grinding conditions: (a1) dry for AM, (a2) dry for conventional, (b1) moist for AM, (b2) moist for conventional, (c1) cryogenic for AM, and (c2) cryogenic for conventional samples.

Figure 14.
SEM images of subsurface layers of finished AM samples in (a) dry, (b) wet, and (c) cryo conditions.
Figure 14.
SEM images of subsurface layers of finished AM samples in (a) dry, (b) wet, and (c) cryo conditions.

Figure 15.
SEM images of subsurface layers of finished conventional samples in (a) dry, (b) wet, and (c) cryo conditions.
Figure 15.
SEM images of subsurface layers of finished conventional samples in (a) dry, (b) wet, and (c) cryo conditions.


Table 1.
Chemical composition of Ti-6Al-4V powder.
| Elements | Composition |
|---|---|
| Ti | balance |
| Al | 5.8 wt.% |
| V | 3.89 wt.% |
| O | <2000 ppm |
| N | <500 ppm |
| C | <800 ppm |
| H | <150 ppm |
| Fe | <3000 ppm |
Table 2.
Specification of EOS M290 DMLS printer.
| Description | Specification |
|---|---|
| Construction volume | 250 × 250 × 325 mm3 |
| Laser type | Yb fiber laser; 400 W |
| Scan speed | up to 7.0 m/s |
| Focus diameter | 100 μm |
| Power consumption | Max. 8.5 kW |
| Software | EOSPRINT |
Table 3.
Grinding parameters.
| Parameters | Conditions |
|---|---|
| Grinding machine | Surface grinding |
| Abrasive wheel | Aluminum oxide (250 × 20 × 76.2 mm3); specification-AA60K5V |
| Work piece material | Additively and conventionally manufactured Ti-6Al-4V, and heat-treated; dimension: 40 mm (length) × 20 mm (width) × 20 mm (thickness) |
| Grinding environments | Dry, moist, and cryo |
| Moist fluid | Water-based soluble oil |
| Cryogenic fluid | Liquid nitrogen (LN2) |
| Wheel speed | 39.42 m/s (constant) |
| Table feed | 7, 10, and 13 m/min |
| Depth of cut (DOC) | 20, 30, and 40 µm |
| Dresser | Single-point diamond |
Table 4.
The ratio of peak intensity and FWHM at DOC of 20 µm and table feed of 07 m/min for conventionally finished samples.
Table 4.
The ratio of peak intensity and FWHM at DOC of 20 µm and table feed of 07 m/min for conventionally finished samples.
| Plane | Dry Condition | Moist Condition | Cryo Condition | |||
|---|---|---|---|---|---|---|
| (hkl) | ||||||
| (100) | 1.08 | 1.27 | 1.17 | 1.46 | 1.14 | 1.31 |
| (002) | 0.38 | 1.80 | 0.34 | 2.60 | 0.36 | 1.93 |
| (101) | 0.73 | 1.34 | 0.87 | 1.33 | 0.82 | 1.28 |
| (102) | 0.61 | 1.66 | 0.56 | 1.64 | 0.62 | 1.55 |
| (110) | 2.31 | 2.71 | 2.08 | 2.84 | 2.34 | 2.71 |
| (103) | 0.71 | 1.64 | 0.66 | 1.65 | 0.66 | 1.57 |
| (112) | 1.10 | 1.62 | 1.11 | 1.80 | 1.04 | 1.59 |
| (201) | 1.09 | 1.51 | 1.14 | 1.47 | 1.17 | 1.50 |
Table 5.
The ratio of peak intensity and FWHM at DOC of 40 µm and table feed of 13 m/min for conventionally finished samples.
Table 5.
The ratio of peak intensity and FWHM at DOC of 40 µm and table feed of 13 m/min for conventionally finished samples.
| Plane | Dry Condition | Moist Condition | Cryo Condition | |||
|---|---|---|---|---|---|---|
| (hkl) | ||||||
| (100) | 1.25 | 1.34 | 1.02 | 1.50 | 0.68 | 0.75 |
| (002) | 0.29 | 2.98 | 0.26 | 2.61 | 0.30 | 0.95 |
| (101) | 0.98 | 1.13 | 0.86 | 1.24 | 0.52 | 0.94 |
| (102) | 0.58 | 1.30 | 0.53 | 1.41 | 0.68 | 1.25 |
| (110) | 2.60 | 2.54 | 2.24 | 2.92 | 4.06 | 2.35 |
| (103) | 0.71 | 1.14 | 0.81 | 1.00 | 0.77 | 1.34 |
| (112) | 1.29 | 1.35 | 1.42 | 1.38 | 0.98 | 1.14 |
| (201) | 1.54 | 1.60 | 1.30 | 1.73 | 1.12 | 1.62 |
Table 6.
The ratio of peak intensity and FWHM at DOC of 20 µm and table feed of 07 m/min for AM finished samples.
Table 6.
The ratio of peak intensity and FWHM at DOC of 20 µm and table feed of 07 m/min for AM finished samples.
| Plane | Dry Condition | Moist Condition | Cryo Condition | |||
|---|---|---|---|---|---|---|
| (hkl) | ||||||
| (100) | 0.29 | 3.26 | 0.16 | 3.24 | 0.27 | 3.04 |
| (002) | 0.30 | 6.90 | 0.17 | 5.73 | 0.28 | 10.42 |
| (101) | 0.36 | 2.91 | 0.21 | 3.36 | 0.32 | 2.39 |
| (102) | 0.40 | 3.57 | 0.28 | 5.69 | 0.35 | 3.71 |
| (110) | 0.32 | 6.34 | 0.29 | 8.08 | 0.35 | 5.98 |
| (103) | 0.49 | 3.78 | 0.33 | 6.45 | 0.45 | 4.01 |
| (112) | 0.45 | 3.57 | 0.28 | 8.26 | 0.44 | 3.42 |
| (201) | 0.55 | 3.47 | 0.36 | 8.31 | 0.54 | 3.41 |
Table 7.
The ratio of peak intensity and FWHM at DOC of 40 µm and table feed of 13 m/min for AM finished samples.
Table 7.
The ratio of peak intensity and FWHM at DOC of 40 µm and table feed of 13 m/min for AM finished samples.
| Plane | Dry Condition | Moist Condition | Cryo Condition | |||
|---|---|---|---|---|---|---|
| (hkl) | ||||||
| (100) | 0.20 | 3.69 | 0.22 | 4.20 | 0.26 | 3.93 |
| (002) | 0.17 | 5.41 | 0.21 | 4.78 | 0.29 | 5.32 |
| (101) | 0.26 | 3.31 | 0.28 | 3.47 | 0.35 | 3.33 |
| (102) | 0.29 | 5.86 | 0.30 | 5.13 | 0.26 | 5.70 |
| (110) | 0.33 | 6.98 | 0.29 | 7.21 | 0.22 | 8.33 |
| (103) | 0.28 | 7.00 | 0.33 | 5.76 | 0.27 | 6.14 |
| (112) | 0.29 | 8.83 | 0.31 | 8.51 | 0.25 | 8.87 |
| (201) | 0.48 | 8.92 | 0.51 | 8.59 | 0.41 | 8.95 |
Disclaimer/Publisher’s Note: The statements, opinions and data contained in all publications are solely those of the individual author(s) and contributor(s) and not of MDPI and/or the editor(s). MDPI and/or the editor(s) disclaim responsibility for any injury to people or property resulting from any ideas, methods, instructions or products referred to in the content. |
© 2023 by the authors. Licensee MDPI, Basel, Switzerland. This article is an open access article distributed under the terms and conditions of the Creative Commons Attribution (CC BY) license (https://creativecommons.org/licenses/by/4.0/).
Share and Cite
MDPI and ACS Style
Singh, P.K.; Kumar, S.; Jain, P.K. Surface Integrity of Cryogenically Finished Additively Manufactured and Conventional Ti-6Al-4V Alloy. Metals 2023, 13, 693. https://doi.org/10.3390/met13040693
AMA Style
Singh PK, Kumar S, Jain PK. Surface Integrity of Cryogenically Finished Additively Manufactured and Conventional Ti-6Al-4V Alloy. Metals. 2023; 13(4):693. https://doi.org/10.3390/met13040693
Chicago/Turabian StyleSingh, Pankaj Kumar, Santosh Kumar, and Pramod Kumar Jain. 2023. "Surface Integrity of Cryogenically Finished Additively Manufactured and Conventional Ti-6Al-4V Alloy" Metals 13, no. 4: 693. https://doi.org/10.3390/met13040693
Note that from the first issue of 2016, this journal uses article numbers instead of page numbers. See further details here.