
Hall–Petch Description of the Necking Point Stress

1
Magnesium Research Center, Kumamoto University, Kumamoto 860-8555, Japan
2
Department of Materials Science & Engineering, Monash University, Clayton, Melbourne, VIC 3800, Australia
3
School of Mechanical & Chemical Engineering, University of Western Australia, Crawley, Perth, WA 6009, Australia
*
Author to whom correspondence should be addressed.
Metals 2023, 13(4), 690; https://doi.org/10.3390/met13040690
Submission received: 4 March 2023
/
Revised: 24 March 2023
/
Accepted: 29 March 2023
/
Published: 31 March 2023
(This article belongs to the Special Issue Editorial Board Members’ Collection Series: Metal Crystal/Polycrystal Plastic Strain Hardening)
Abstract
:We posited that the grain size dependence of the tensile necking stress, as determined by the Considère criterion for plastic instability, is a more meaningful characteristic of the Hall–Petch (H–P) effect than that of the yield stress or the 0.2% proof stress. An inverse square-root dependence of the necking stress on the grain size was derived from a dislocation dynamics-based constitutive model. In this model, the grain size effect enters the stress indirectly via the evolution of the dislocation density. Model predictions were confirmed by the experimental data for nickel and titanium.
1. Introduction
The Hall–Petch (H–P) relation between the yield strength and the average grain size of polycrystalline materials is one of the pillars of physical metallurgy. It has been quite some time since an H–P description was established for the entire stress–strain curve, i.e., for any strain ε—initially for the polycrystalline mild steel tested in tension [1]. The H–P relation is commonly presented in form of the equation
relating the flow stress at a given strain to the average grain size (or average intercept length in micrographs) . In Equation (1), the ‘friction stress’, , represents the flow stress in a single crystal limit of ‘infinitely large’ . The friction stress absorbs the contributions to flow stress from mechanisms not related to the dislocation interaction effects, such as solute drag, the Peierls stress, etc. For pure fcc metals, can be assumed to be negligible, at least after a sufficiently large strain. The Hall–Petch coefficient measures the stress intensity required for the transmission of plastic flow across the grain boundaries [2]. It is material-specific and is determined empirically, as reviewed in [3,4].
In recent years, the research focus has been on incorporating the H–P description into constitutive models that include temperature and strain rate dependences, as encompassed, for example, in the Zerilli-Armstrong (Z-A) relations that are different for face-centered cubic (fcc) and body-centered cubic (bcc) metals [5]:
These phenomenological equations can be seen as special cases of Equation (1). The specific form of the friction stress involves an athermal stress component , which is dependent on the solute content and the dislocation density. The remainder accounts for temperature-dependent strain hardening, with the strain- and temperature-dependent terms taken as a product for the fcc case and in an additive form for the bcc case. In Equation (2), the strain hardening that is measured in terms of and a recovery strain, , is coupled with an exponential temperature-dependent factor, where introduces a dependence on the shear strain rate . Here and are material parameters. In Equation (3), is the athermal stress reflecting the resistance to dislocation glide at zero absolute temperature, T = 0. The rate dependence enters via , in the same manner as in . The parameters and in the Ludwik term [6] govern the strain hardening of the material. The hexagonal close-packed (hcp) metals α-titanium, zirconium, and hafnium behave like bcc metals, while magnesium, zinc, and cadmium follow an fcc-type behavior. Accordingly, Equations (2) and (3) can be applied for these two respective groups of hcp metals.
An excellent descriptive capability of the Z-A model has been demonstrated in many examples, cf. [7,8]. A deficiency of the Ludwik ansatz, however, is that a trend of the flow stress to saturate at large strains is not reflected by Equation (3), and that the constants and do not have any microstructurally-based meaning, even when the approximation of the stress–strain data by the Ludwik-type models is seemingly acceptable. A viable alternative is a physically based modeling approach going back to Kocks and Mecking [9], in which the dislocation density plays the role of an internal state variable evolving in the process of straining. The model was later extended by Estrin and Mecking [10] to account for the grain size effect (see also [11]). In the next section, an analysis of the H–P effect in terms of the Kocks–Mecking–Estrin (KME) model [10,11] will be presented. This will be followed by gauging the KME model against the experimental data for nickel and titanium as representative fcc and hcp materials.
2. Dislocation Density Based Constitutive Modeling of the Hall–Petch Behavior
Virtually all dislocation-based strain hardening models involving a single internal variable comprise two constitutive equations: a semi-empirical equation relating the flow stress to the total dislocation density , and an equation describing the evolution of with plastic strain . The first equation is the Taylor relation:
where b is the magnitude of the dislocation Burgers vector, is the shear modulus, and is a microstructure-sensitive factor, typically ranging between 0.1 and 0.4. Its magnitude is governed by the dislocation arrangement and includes the strain-rate and temperature dependence of the flow stress; is the texture-dependent orientation factor converting the resolved shear stress to the axial stress. The factor is introduced on the right-hand side of Equation (4) for brevity. The evolution equation for the total dislocation density may take different forms, of which the simplest one reads as [10,11,12,13]
The dislocation density evolution described by Equation (5) is a result of the competing processes of dislocation storage and annihilation (dynamic recovery). If one assumes that dislocations are stored quasi-homogenously at a rate inversely proportional to their mean free path , can be expressed as , with being a non-dimensional constant. The term represents the average rate of dynamic dislocation recovery, which is a thermally activated process governed by the cross-slip of screw dislocations or the diffusion-controlled climb of edge dislocations. This is reflected in the temperature and strain rate dependence of the dynamic recovery coefficient . If the dislocation travel is geometrically constrained by grain boundaries, i.e., for sufficiently small grain size, the mean free path can be identified with the average grain size d. In this case, the evolution equation assumes the form
where the storage term is explicitly related to .
In a more general formulation, assuming that both grain boundaries and dislocations within the grains (distributed randomly or organized in dislocation cells) contribute to dislocation storage concurrently, Equation (5) can be extended to a generalized evolution equation of the Kocks–Mecking–Estrin (KME) model [10,11]:
This equation reduces to the evolution equation of the Kocks–Mecking (KM) model in the limit of large when is significantly smaller than , and the dislocation production is controlled by dislocation reactions in the grain interior.
The constitutive model expressed by Equations (4), (5), and (7) recovers an H–P type relation between the flow stress and the grain size. Specifically, it delivers the classical H–P formula for the conventional yield stress at the 0.2% proof strain:
Here, the H–P coefficient is given by
which, as opposed to the predictions made in [14], may be microstructure-sensitive due to the influence of microstructure on the parameters and .
In the limit of (or sufficiently small initial dislocation density and/or grain size d) the yield stress dependence on the grain size reads as
and Equation (9) reduces to
We recall that as early as in 1967, Conrad et al. [15] arrived at the following semi-empirical relation between the flow stress and the grain size at the notional onset of plastic flow (i.e., at the 0.2% proof strain):
Here, is a material dependent parameter. The functional dependence on the grain size given by this equation is obviously the same as that in Equation (10).
To derive this equation, Conrad et al. assumed that grain boundaries affect the total dislocation density, which determines the flow stress through the Taylor Equation (4). The experimental data they used showed a linear dependence of the dislocation density on plastic strain, , at the onset of yielding. Note that this experimental observation resulting in the well-known ‘parabolic’ hardening, , is naturally predicted by Equation (5) when the first term on the right-hand side describing the dislocation production prevails over the annihilation term, e.g., for well-annealed polycrystals. Shortly after the publication by Conrad et al., Ashby [16] used the slip distance concept that he developed for the description of plasticity in heterogeneous materials and came up with essentially the same form of the relation. This work prompted the emergence of a family of strain hardening based models of the H–P effect as reviewed, for example, by Cordero et al. [17]. In this context one should mention the work by Hazzledine [18,19] and the companion theoretical analysis [20] on the basis of the KME kinetic Equation (7), which has led to the H–P expression resembling Equation (12). Godon et al. [21] expressed the Hall–Petch slope for a group of strain-hardening based models in a general form similar to Equation (11): , albeit without referring to the dislocation multiplication coefficient directly. Here, is a model-specific microstructure-sensitive parameter depending on the dislocation multiplication process, in general, and the number of activated slip systems [22], in particular; it may also depend on the grain boundary state through the density of ledges [23]. Furthermore, using discrete dislocation dynamics simulations of the deformation behavior of Cu polycrystals with grain sizes ranging from 0.5 to 2 μm, Lefebvre et al. [22,24] demonstrated that regardless of the details of the dislocation multiplication process, the H–P effect can be interpreted as Taylor hardening owing to a heterogenous dislocation storage process controlled by the accumulation of dislocations at the grain boundaries.
3. The Necking Stress Locus as a Basis for an H–P Analysis
Historically, the H–P relation was first established experimentally for the yield strength. The latter quantity can be represented, e.g., by the lower yield point in bcc α-iron [2,25]. However, for fcc materials, the true yield strength is difficult to determine experimentally, which is why the generally accepted convention of using the stress determined at the 0.2% irreversible strain is adopted as a measure of the yield strength, as mentioned above (see Equation (8)).
In their early work, dated 1962, Armstrong et al. [2] pointed out that the value can vary, depending on the plastic strain at which it was measured. In fact, virtually all strain hardening models predict the square-root strain dependence of the H–P factor in the form akin to Equations (10) and (12). This parabolic strain dependence of has long been a matter of controversy in experimental measurements performed on various materials, including fcc Cu [26,27,28], Al [29,30], Ni [31,32], and 30/70 brass [2]; bcc Fe [2,25,33]; and hcp Zn [2], Ti [34], Zr [35], and Hf [36]. Most studies converged on the conclusion that increases with plastic strain, yet with some exceptions, as reviewed in [17,37]. It was found that may exhibit an opposite trend, decreasing with strain due to deformation twinning or a strong crystallographic texture. The most remarkable discrepancy seen from these assessments of the strain hardening models lies in the fact that none of the experimental measurements confirm the parabolic behavior predicted by Equation (10). Cordero et al. [17] suggested that one possible reason for the observed inconsistency is that the values have historically been measured at stresses that are so large that Ashby’s assumption that the density of geometrically necessary dislocations is much larger than that of statistically stored dislocations is no longer valid. We share this viewpoint and take it a step further. In our opinion, the contribution from the dynamic recovery term in the strain hardening models including the KM, Equation (5), and the KME, Equation (7), models cannot be neglected even at the beginning of plastic flow.
Thus, the KME strain hardening models predict an H–P type dependence of the flow stress on the grain size for any given strain, despite an ambiguity with the choice of the reference strain discussed in the previous section. However, the strain is not a state variable [38], and it is therefore desirable to compare the flow stresses for different grain sizes in a condition free of any arbitrariness. We propose to use the locus of the maximum loads, corresponding to the onset of tensile necking under various deformation conditions, as representing a well-defined state that offers itself for an H–P analysis. The uniqueness of this locus defined by the necking instability condition eliminates the arbitrariness of other approaches in which the strain is considered (explicitly or tacitly) as a state variable. The necking condition is obtained in terms of extrinsic variables, the true stress and true strain, for a given plastic strain rate according to the Considère criterion [39]:
In this criterion, the strain rate sensitivity of the flow stress is neglected, which is acceptable for many fcc and hcp metals and alloys. In principle, it has been demonstrated that both the Considère condition and the more general Hart instability condition [40], which does account for the strain rate sensitivity, follow from the evolution laws for the principal internal variable—the total dislocation density [41,42]. Undoubtedly, the advantage of utilizing the necking point to characterize the H–P grain size effects is that unlike the conventional yield point (or the flow stress at a given strain), which is not a special point on the stress–strain curve, the point of onset of necking instability is actually a special point. It is controlled entirely by a combination of the parameters governing the strain hardening of a material [41], and the slope of the H–P plot is uniquely determined by these parameters, and not by any convention with regard to strain.
Combining the solution of the constitutive equations of the KME model for constant plastic strain rate with the Considère condition, Equation (9), yields the plastic strain and the flow stress at the necking point:
and
with .
Turning now to the analysis of the grain size dependence of the stress at maximum load, or the necking stress, we obtain
which yields the Hall–Petch type behavior of the necking stress. Here, the H–P factor is redefined at the Considère point as
We used the condition , which is fulfilled particularly well for fine-grained and ultrafine-grained materials [41,42,43,44,45].
The simplicity of both relations, Equations (16) and (17), makes them very attractive for practical use.
4. An H–P Dependence for of Nickel and Titanium—A Compilation of Experimental Results
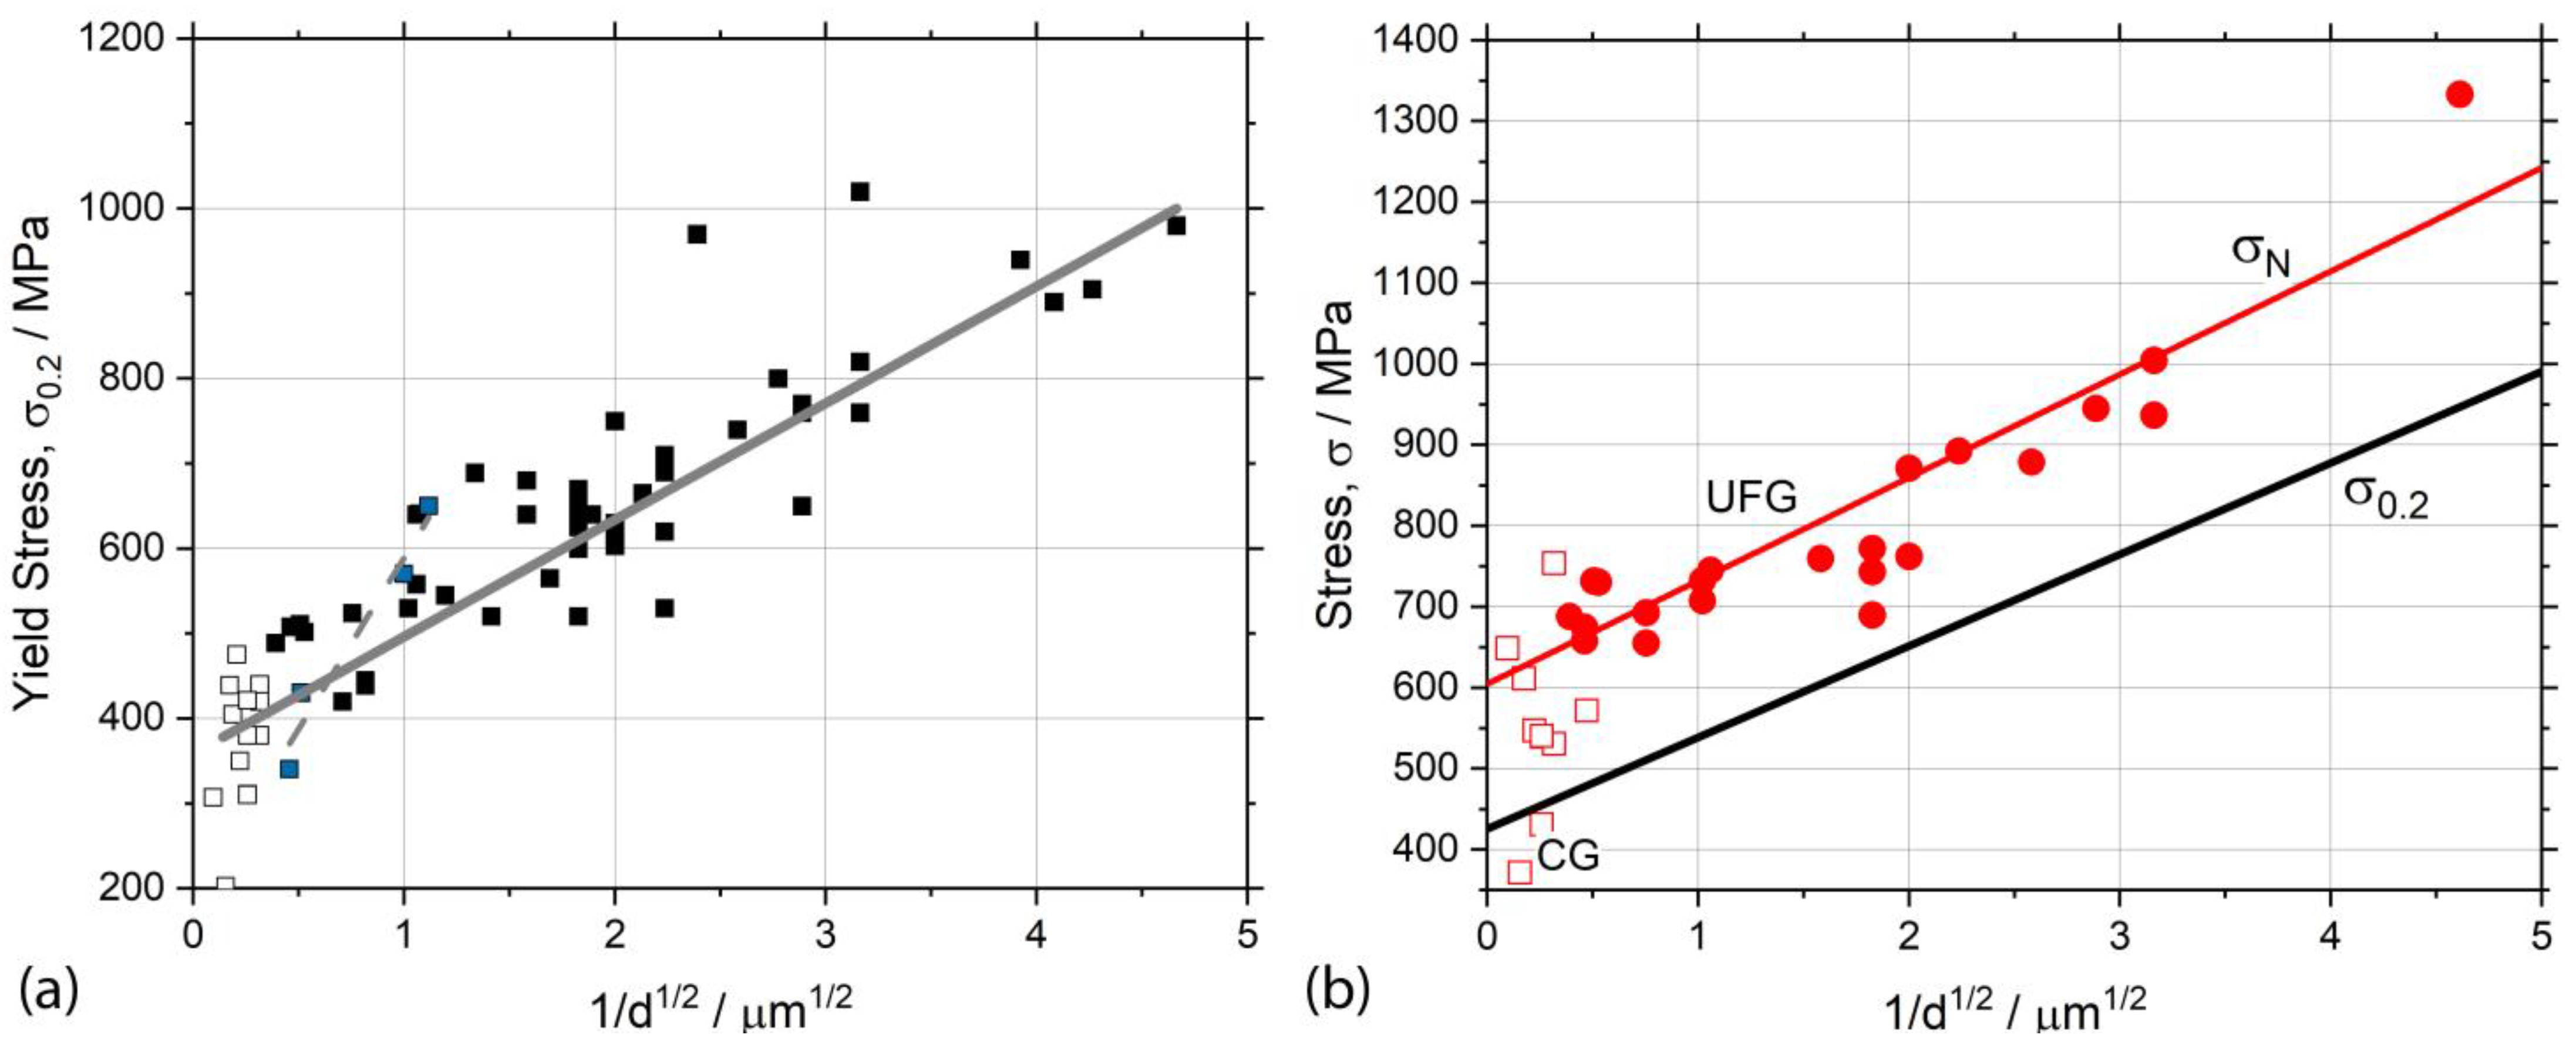
The tenet of the Z-A approach that strain hardening is contained chiefly in while is essentially unchanged, has been taken a step further in the comparison of compiled H–P measurements of and covering a large range of grain sizes for pure nickel and commercial purity (CP) titanium (Grade 2), as shown in Figure 1 and Figure 2, respectively. In these figures, the subplots (a) and (b) refer to the conventional yield stress and the necking stress , respectively. For the sake of generality, both datasets for Ni and Ti represent the results of independent investigations by different researchers. For nickel, the compilation by Di Leo et al. [14] (see the references therein) is used, with an addition of data from several other sources. The shown measurements of Yasnikov et al. [45] comprise two groupings of conventional and ultrafine-grained materials, in the latter case, having been produced by the annealing of the material that had been severely pre-strained by equal-channel angular pressing (ECAP). The ultrafine grain size measurements of Bui et al. [46,47] (see also [48] and Krasilnikov et al. [49]), adopted here, were obtained by various techniques of severe plastic deformation (SPD). The solid line corresponds to the least square regression line, with the intercept value of = 66 MPa and the slope of = 204 MPa × μm1/2, which is in fair agreement with what is typically reported for Ni [14]; the Pearson’s value for the entire dataset approximation is 0.95.
Figure 1b compares the slope represented by the regression line of Figure 1a with obtained from the data collected at the true necking stress. The latter quantity, 231 MPa × μm1/2, is only slightly higher than the value of corresponding to the 0.2% proof strain. Considering the significant scatter of experimental data, it is fair to say that both values are practically indistinguishable, and as a first order approximation, a near equality holds.
5. Discussion
The present measurements and the analysis of the data add to a previously reported compilation of results assembled for the tensile test characteristics of bcc, fcc, and hcp metals [66]. Special emphasis is put on the H–P analysis of the stress at the maximum load locus (necking stress) as an important convention-free measure of the material state. Both the phenomenological Z-A model and the KME model, with its greater microstructural underpinning, were revealed to provide an adequate description of the H–P behavior, the latter being capable, in principle, of predicting different slopes of the H–P curves for the yield stress and the necking stress. Even though no significant difference between these two slopes was seen in the present work for either Ni or Ti, this is not what is often observed. For example, Tsuji et al. [67] found that the value for fine grained CP aluminum alloy Al1100 was considerably larger than that of measured at the ultimate tensile strength. The microstructural sensitivity of the H–P effect is reflected in Figure 1 and Figure 2 in several aspects. The significant scatter seen in large experimental datasets assembled from different sources for materials of the same type (see also recent comprehensive compilations of H–P data for Ti by Takebe and Ushioda [68], Ti and Al by Figueiredo and Langdon [69], and for Ti, Al, Mg, Cu, and Fe by Dangwal et al. [70]) suggests that while the general scaling law for the flow stress does hold, the microstructural factors other than grain size (e.g., crystallographic texture, dislocation storage in the substructure, the grain boundary state, etc.) strongly influence the mechanical response. Thus, is not a universal material constant that can be used to quantitatively predict the flow stress dependence on the grain size. The slopes of the H–P plots generated by different investigators for essentially the same material can differ quite appreciably. As an example, in Figure 2, we highlighted the data by Luo et al. [64] (grey squares), showing that the H–P slope of 404 MPa × μm1/2 for a specific sub-set (plotted as a dashed linear regression line) is almost triple the slope of the linear regression line for the whole dataset (137 MPa × μm1/2). Furthermore, both these values are remarkably different from the H–P coefficient of 173 MPa × μm1/2 derived from the data presented by Figueiredo and Langdon [69] for ultrafine grained Grade 2 Ti. The results reported by Khamsuk et al. [71] for fine grain Al1100, with a different processing history, corroborate the above statement that the H–P coefficient is sensitive to the microstructure. These authors showed that within approximately the same range of grain sizes, the slope of the H–P diagrams varied by a factor of five—from 28 MPa × μm1/2 for cold-rolled and annealed samples to 58 MPa × μm1/2 for those produced by torsion, and 139 MPa × μm1/2 for the material fabricated by accumulated roll bonding.
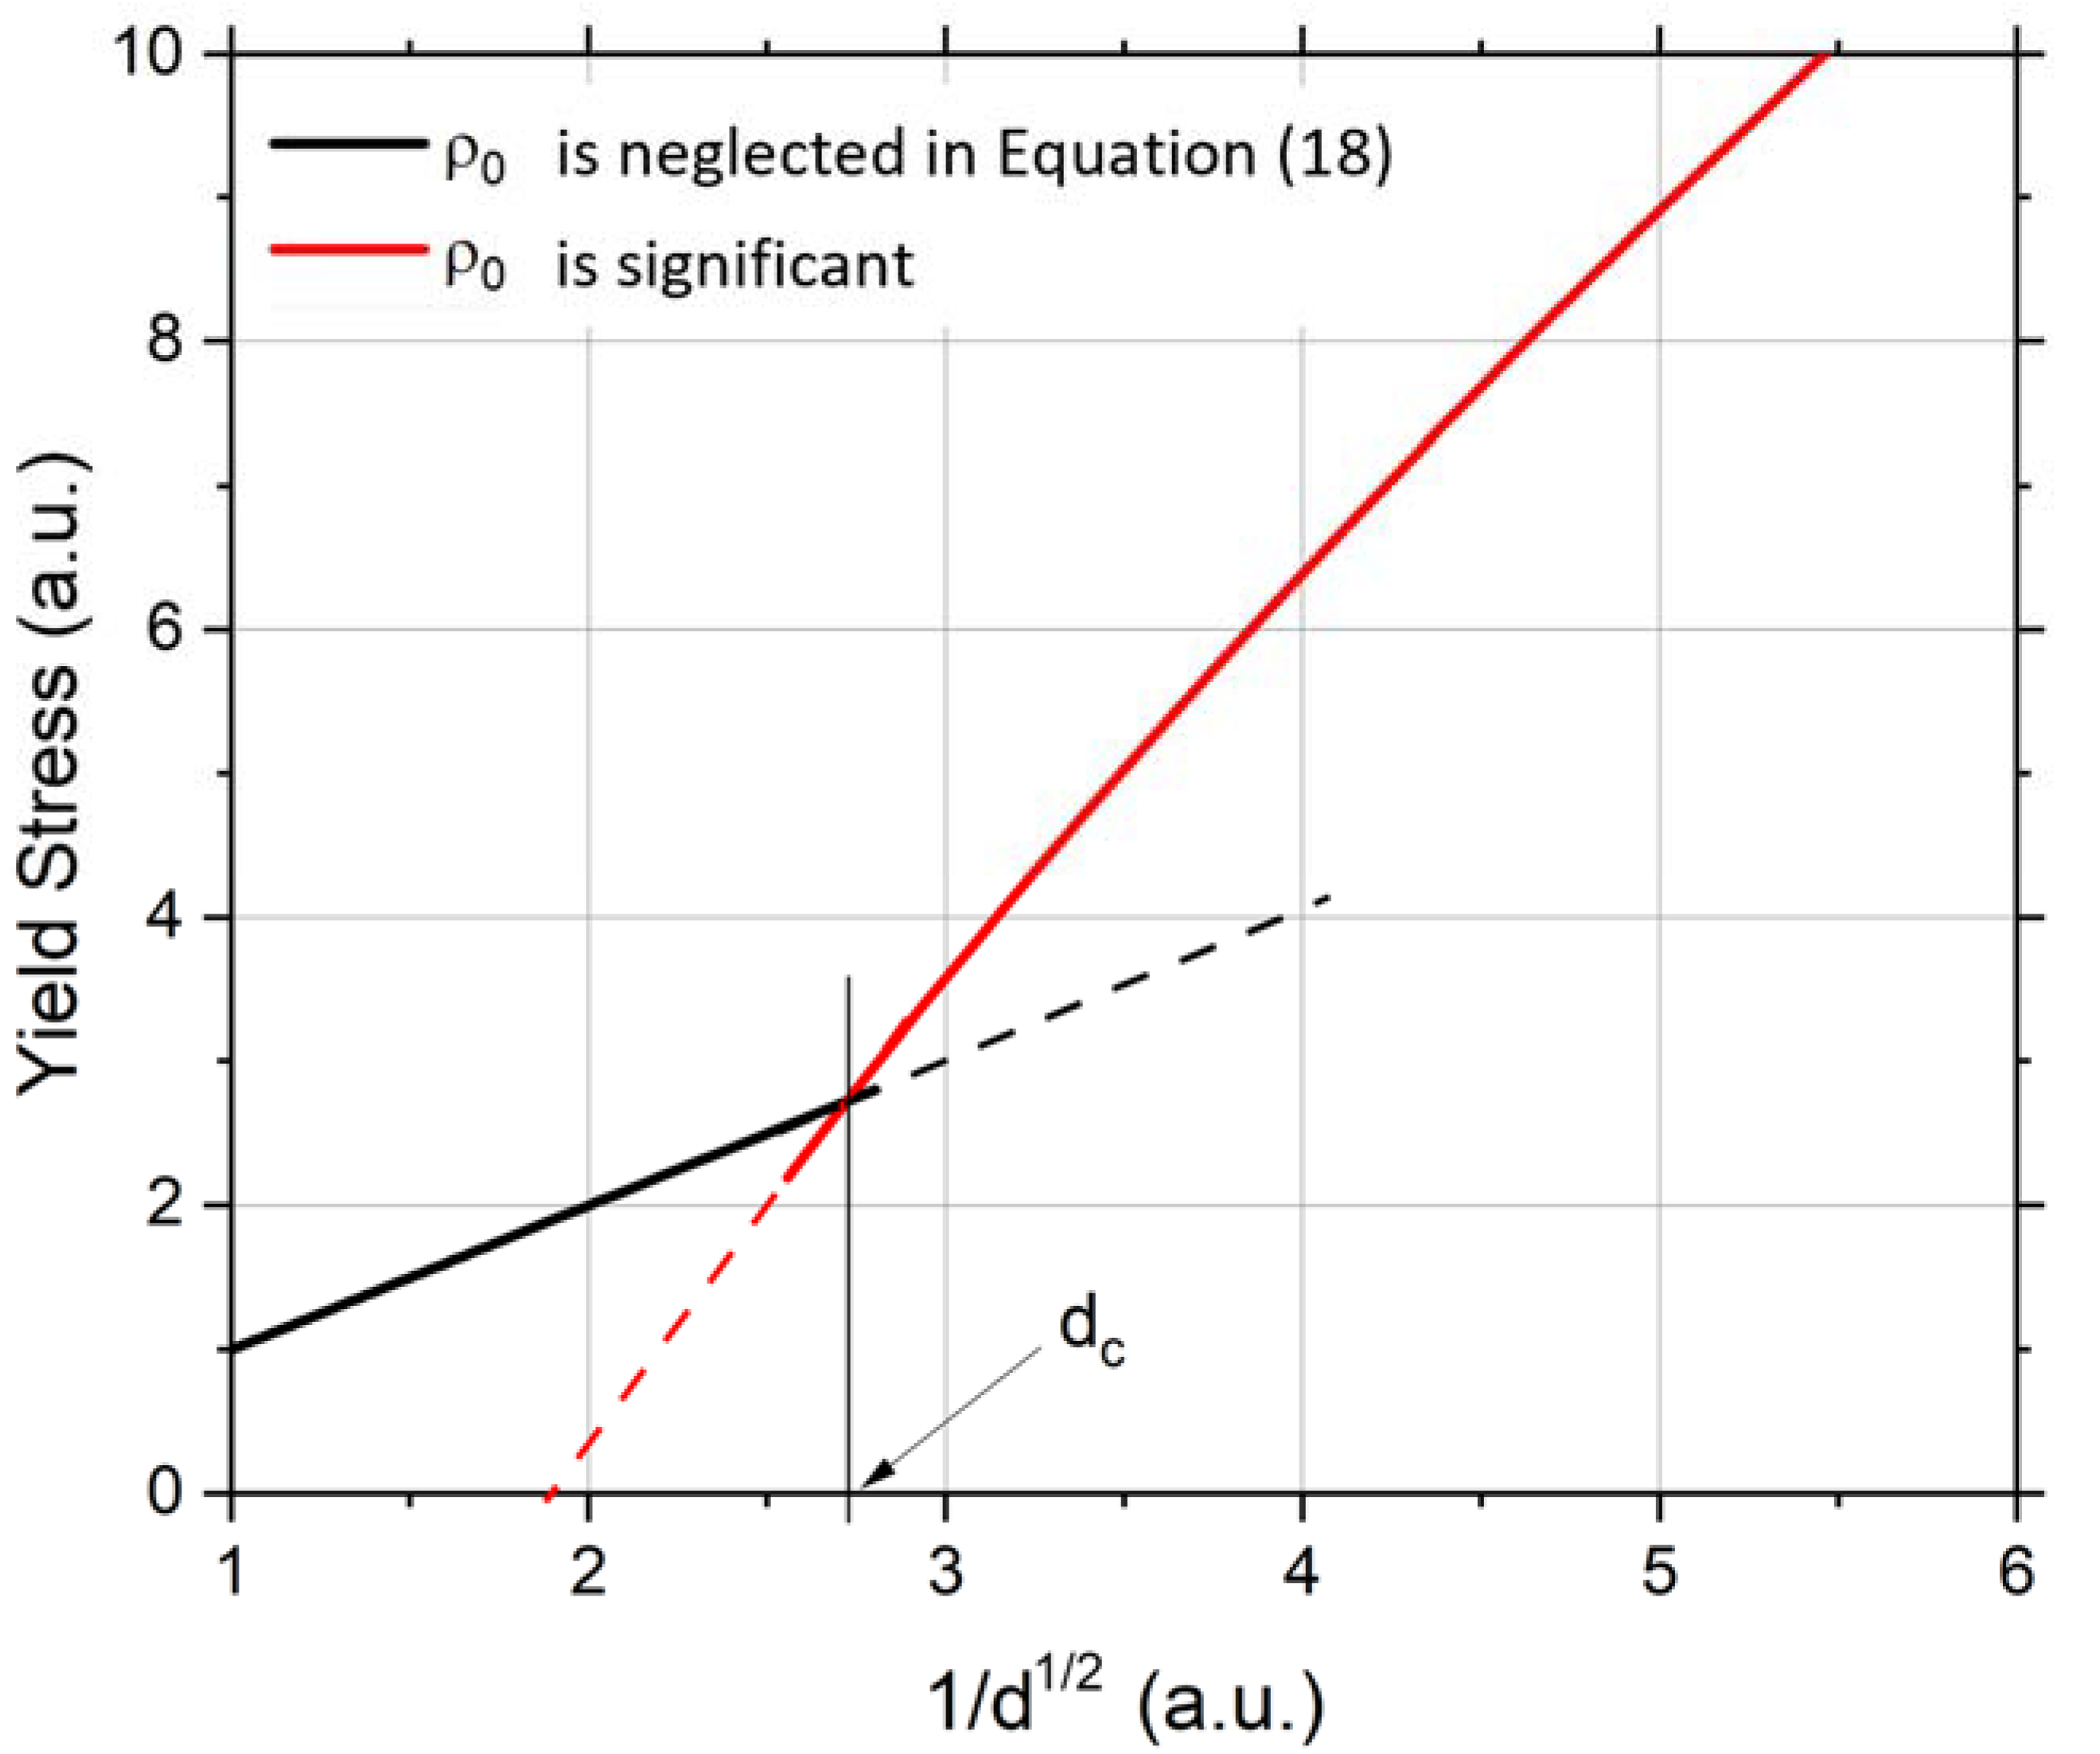
We should thus contend that the slope of the H–P line is sensitive to the microstructure of a material and may depend appreciably on its processing history. The data by Tian et al. [72], Bai et al. [73], and Dangwal et al. [70] provide further support for this posit. These authors observed a two-stage H–P regime with remarkably different slopes in coarse- and fine-grain domains in differently processed pure Cu, Al, Mg, Ti, and ultrafine grained Fe-31Mn-3Al-3Si alloy specimens, as schematically illustrated in Figure 3. Similar results indicating the existence of a critical grain size , where a sharp transition in the H–P behavior is observed with grain refinement to the sub-micron scale, were reported by Fu et al. [74] for IF steels with the grain size ranging from 0.5 to 500 μm. A similar bi-linearity in the H–P behavior for strains up to 5% has been reported earlier by Kashyap and Tanrgi [75] for 316 stainless steel (note that the single H–P relation was, however, observed at larger strains up to necking) by Thompson [76] for Ni, by Begrström and Hallen [77] for Fe, and by Lloyd [78] and Armstrong [79] for aluminum. This microstructure sensitivity can, in principle, be readily accounted for in a phenomenological way by allowing a dependence of the dislocation production coefficients and in Equation (9) on the grain microstructure, texture, and grain boundary state resulting from a specific processing route. For example, the puzzling two-stage H–P behavior reported in the publications cited above can be seamlessly explained by the KME model we use. The authors of [70] have heuristically related the observed change-over in the slope of the H–P plot, with grain reduction to the sub-micron range, by the increased number of dislocations stored during SPD processing. We concur with this view and expand on that. Recalling the general form of the H–P coefficient proceeding from the KME model, Equation (9), one can notice that the initial dislocation density enters it as an addition to the ‘classical’ H–P term under the square root sign. An upward change in the slope of the H–P diagram occurs when the term in Equation (9) comes into play and becomes comparable with or greater than . Then Equation (8) for the yield stress is transformed to the more general form
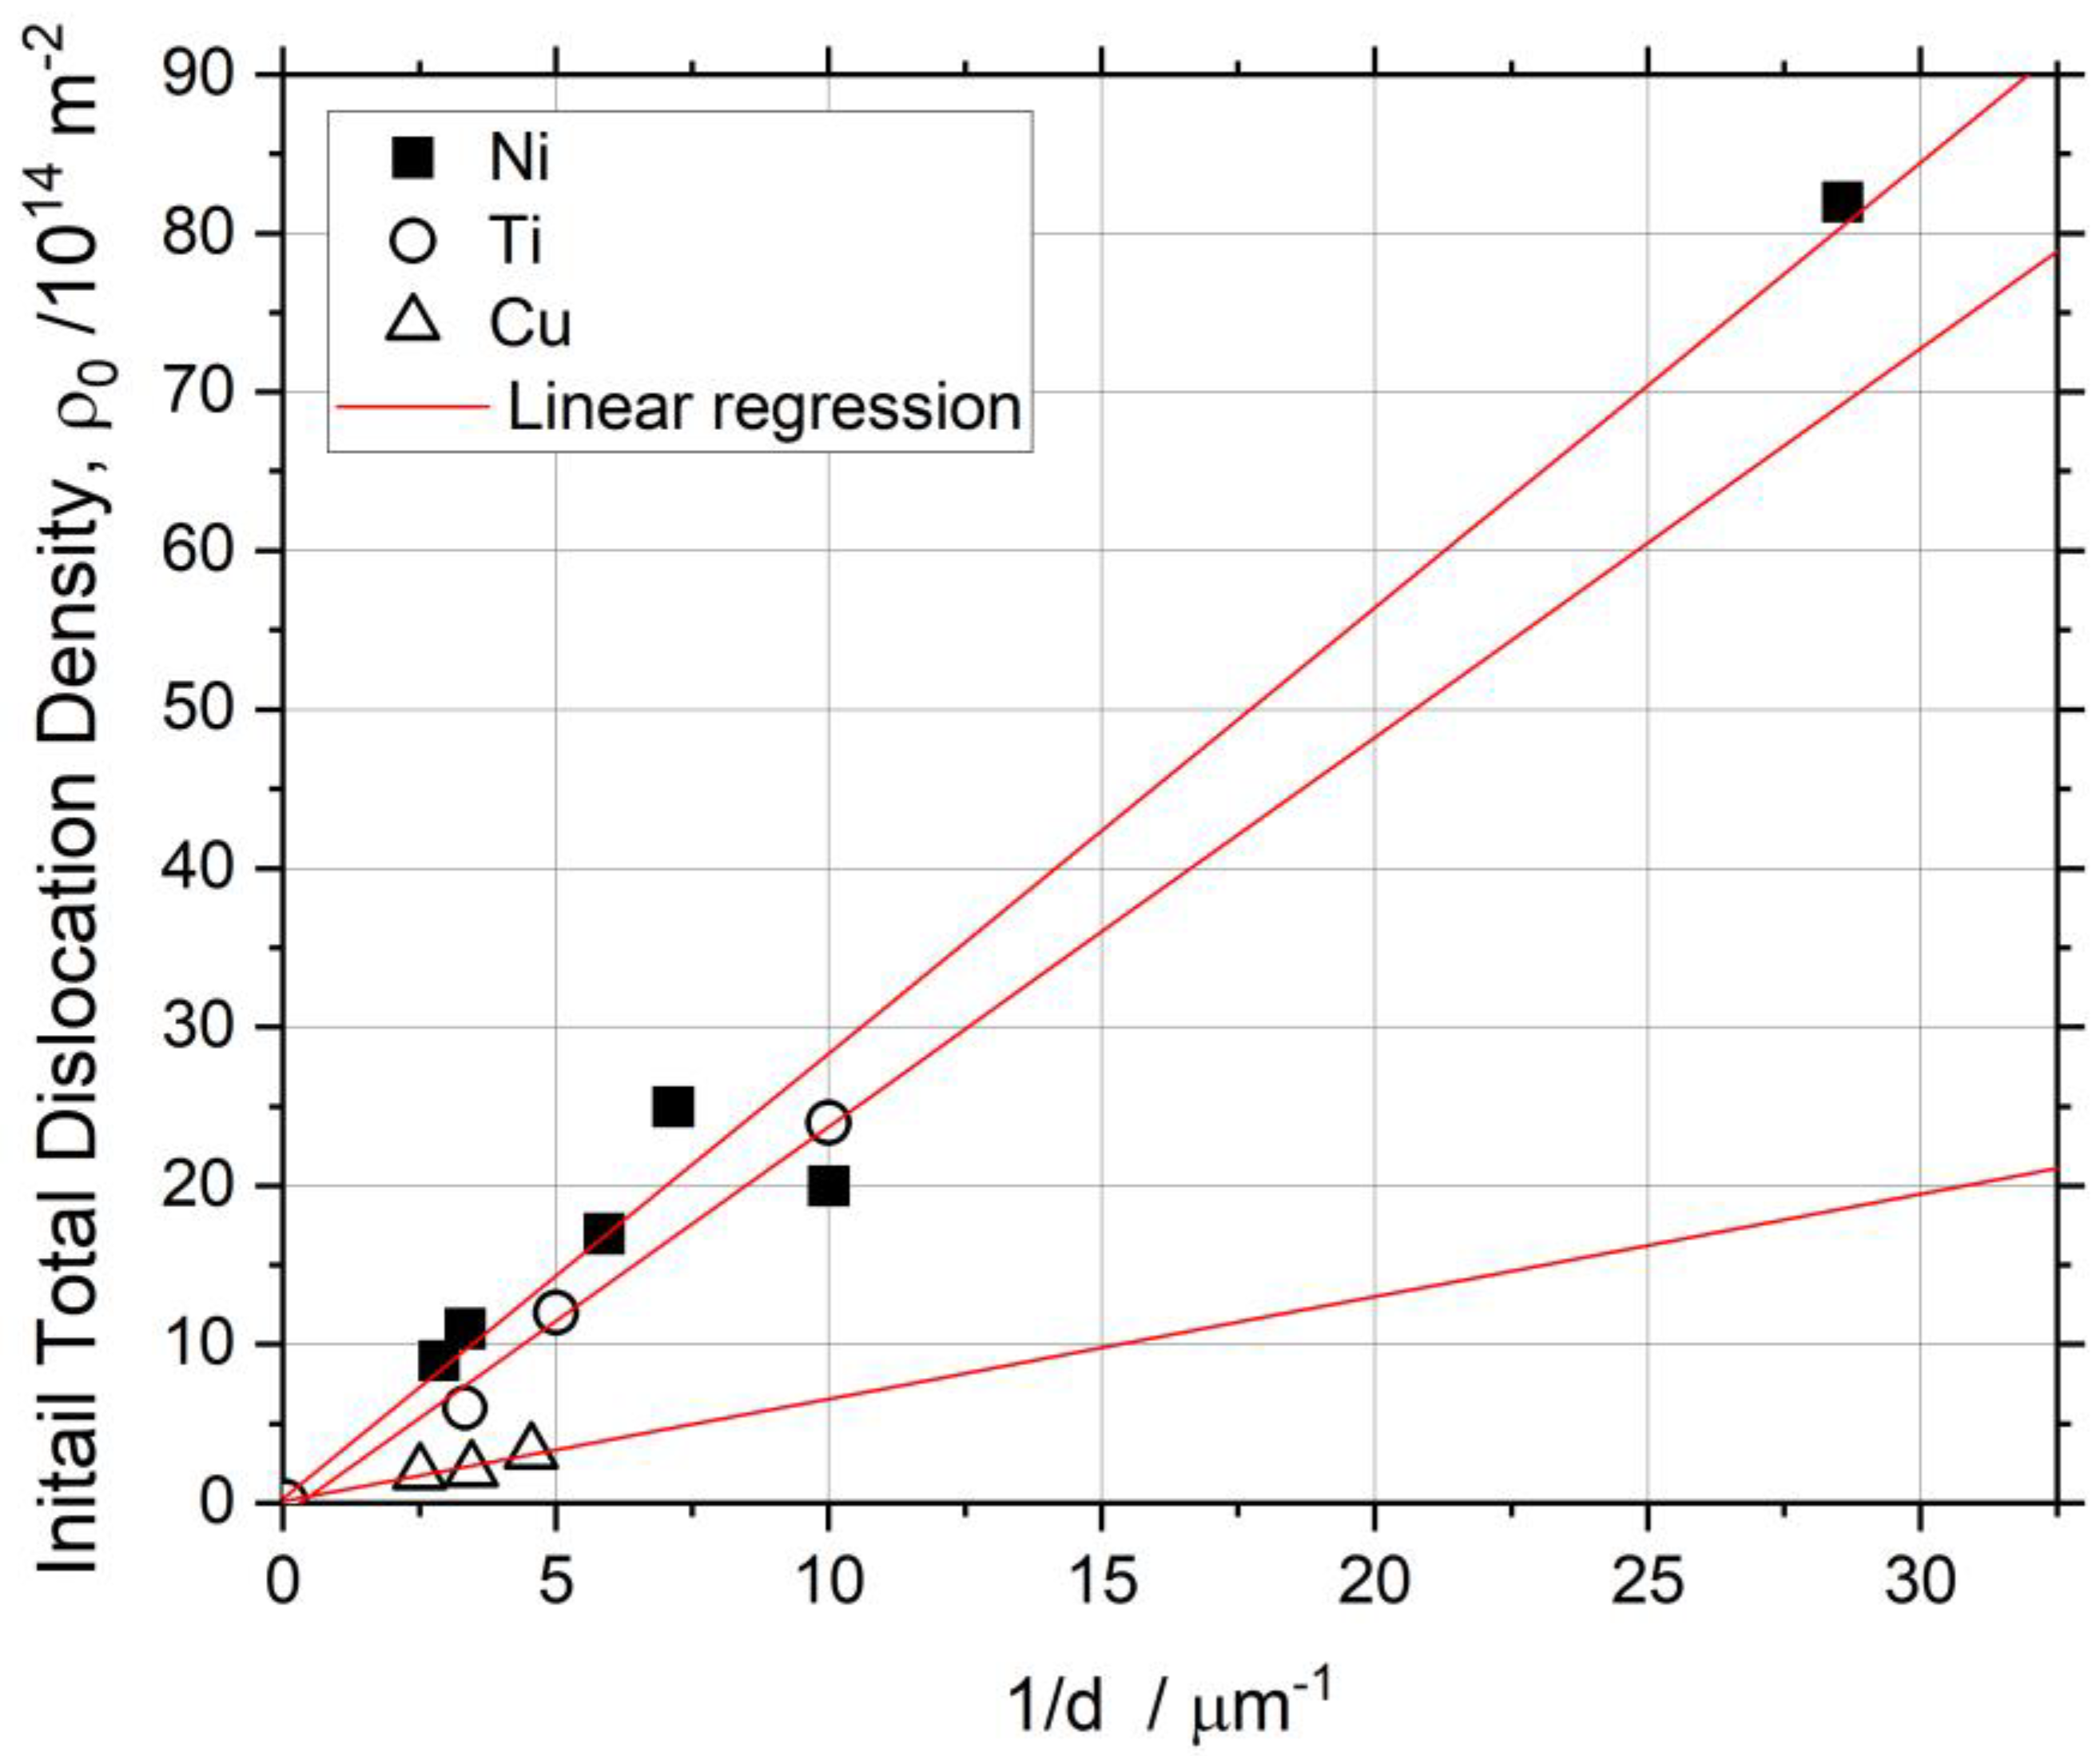
Assuming that the initial dislocation density scales with the inverse grain/cell size is [80] (cf. Figure 4 confirming this relation for ultrafine grained materials, according to the X-ray profile analysis by Zhilyaev et al. [81] for Ni, Gubicza et al. [82] for Ti, and Dalla Torre et al. [43] for Cu), the last expression reads simply as . Here is a microstructure-sensitive parameter integrating the coefficients of the KME model. To highlight the versatility of the proposed approach, we note that, generally speaking, can also be grain size-dependent through the factor tending to increase with decreasing grain size. A discussion about these minutiae of the model is beyond the scope of the present paper and will be extended elsewhere.
We would like to emphasize that we do not associate the observed change in the slope of the H–P diagram with a break of the H–P relation. In our opinion, this relation holds universally true for both coarse-grained and fine-grained materials, but with different H–P coefficients governed by the phenomenological parameters in the dislocation kinetics laws. We should reiterate that for grain sizes above the nano scale, the KME model provides a coherent view for both observed H–P regimes, without a need to invoke a new deformation mechanism. Rather, the differences observed in the H–P behavior in coarse- and fine-grained materials or differently manufactured materials are associated with an interplay between the contributions of the omnipresent grain size-dependent and grain size-independent dislocation storage processes.
We should also note that the results reported in [67,74] for the H–P effect measured at 0.2% proof strain and at the maximum tensile load compare favorably with our findings and model predictions. It is fair to say that the predictions for the H–P behavior of the ultimate tensile strength (i.e., the necking stress), which follow from Equation (18), are largely fulfilled. This refers particularly to a decrease in the slope of the H–P diagram with the grain size reduction to the nano-scale [70], which can be attributed to the experimentally established strong inverse dependence of the dynamic recovery rate coefficient on the grain size. This dependence is bound to level off as the grain size is reduced to the nano scale [41,42,43,44,45]. Indeed, at this scale, the diffusional processes at the grain boundaries prevail and control the plastic flow [84] (see also [70] and references therein). This domain, which is very interesting scientifically, is rarely reached with common materials processing techniques, however.
In conclusion, the simplicity and generality of the present analytical model, coupled with its sensitivity to the microstructure, provides it with a high predictive capability. This refers in particular to the Hall–Petch relation derived on the basis of the model, thus making it a valuable practical tool for materials design. Although we tested it only against Ni and Ti as representatives of fcc and hcp materials, the model can easily be applied to other metals and alloys from these classes. Moreover, without loss of generality, it can be adapted to bcc systems where the Peierls stress can no longer be neglected. The validation of the proposed approach to the Hall–Petch relation for bcc metals is thus a future target of research in this field.
6. Summary
Using experimental data for two archetypal metals—fcc nickel and hcp titanium—the grain size dependence of the stress at maximum load, which is determined by the Considère criterion for necking, was shown to obey a Hall–Petch type relation. Calculations based on the Kocks–Mecking–Estrin model confirmed a great predictive capability of the proposed modeling method. A distinctive difference between the Z-A and the KME approaches is that the grain size effect enters through an additive term in stress in the Z-A model and appears indirectly, through its effect on the strain hardening rate controlled by dislocation density evolution, in the KME model. We contend that the Hall–Petch behavior of the necking stress is a more meaningful measure of the grain size dependence than the classical H–P relation of the yield stress represented by the 0.2% proof stress. The greatest advantage of using the former measure is that it does not rely on any arbitrary conventions. Still, even this measure we favor is not free of problems, as the slope is sensitive to the microstructure of the material and cannot be regarded as a universal material characteristic. The concluding judgement is that while the general validity of the H–P relation is not put in question by our results, its universality over the entire grain size range can no longer be claimed.
Author Contributions
Conceptualization, Y.E. and A.V.; investigation, A.V.; writing—original draft preparation, A.V.; writing—review and editing, Y.E. and A.V.; visualization, A.V. All authors have read and agreed to the published version of the manuscript.
Funding
This research received no external funding.
Data Availability Statement
No new experimental data were created in this study. Data sharing is not applicable to this article.
Acknowledgments
We are indebted to R.W. Armstrong, who initiated a discourse on the origins of the Hall–Petch relation that led to this article. Fruitful discussions with I.S. Yasnikov are appreciated. A.V. appreciates the support from MRC, Kumamoto University, for titanium research.
Conflicts of Interest
The authors declare no conflict of interest.
References
- Armstrong, R.W. The influence of polycrystal grain size on several mechanical properties of materials. Metall. Mater. Trans. B 1970, 1, 1169–1176. [Google Scholar] [CrossRef]
- Armstrong, R.; Codd, I.; Douthwaite, R.M.; Petch, N.J. The plastic deformation of polycrystalline aggregates. Philos. Mag. A J. Theor. Exp. Appl. Phys. 1962, 7, 45–58. [Google Scholar] [CrossRef]
- Armstrong, R.W. 60 years of Hall-Petch: Past to present nano-scale connections. Mater. Trans. 2014, 55, 2–12. [Google Scholar] [CrossRef] [Green Version]
- Armstrong, R.W.; Balasubramanian, N. Unified Hall-Petch description of nano-grain nickel hardness, flow stress and strain rate sensitivity measurements. AIP Adv. 2017, 7, 085010. [Google Scholar] [CrossRef]
- Zerilli, F.J.; Armstrong, R.W. Dislocation-mechanics-based constitutive relations for material dynamics calculations. J. Appl. Phys. 1987, 61, 1816–1825. [Google Scholar] [CrossRef] [Green Version]
- Ludwik, P. Elemente der Technologischen Mechanik; Springer: Berlin/Heidelberg, Germany, 1909; p. 57S. [Google Scholar]
- Armstrong, R.W. Engineering science aspects of the Hall–Petch relation. Acta Mech. 2014, 225, 1013–1028. [Google Scholar] [CrossRef]
- Armstrong, R.W. The Dislocation Mechanics of Crystal/Polycrystal Plasticity. Crystals 2022, 12, 1199. [Google Scholar] [CrossRef]
- Kocks, U.F. Laws for work-hardening and low-temperature creep. J. Eng. Mater. Technol.-Trans. Asme 1976, 98, 76–85. [Google Scholar] [CrossRef]
- Estrin, Y.; Mecking, H. A unified phenomenological description of work hardening and creep based on one-parameter models. Acta Metall. 1984, 32, 57–70. [Google Scholar] [CrossRef]
- Estrin, Y. Unified Constitutive Laws of Plastic Deformation; Academic Press: San Diego, CA, USA; London, UK, 1996. [Google Scholar]
- Bergström, Y. A dislocation model for the stress-strain behaviour of polycrystalline α-Fe with special emphasis on the variation of the densities of mobile and immobile dislocations. Mater. Sci. Eng. 1970, 5, 193–200. [Google Scholar] [CrossRef]
- Klepaczko, J. Thermally activated flow and strain rate history effects for some polycrystalline f.c.c. metals. Mater. Sci. Eng. 1975, 18, 121–135. [Google Scholar] [CrossRef]
- Di Leo, C.V.; Rimoli, J.J. New perspectives on the grain-size dependent yield strength of polycrystalline metals. Scr. Mater. 2019, 166, 149–153. [Google Scholar] [CrossRef]
- Conrad, H.; Feuerstein, S.; Rice, L. Effects of grain size on the dislocation density and flow stress of niobium. Mater. Sci. Eng. 1967, 2, 157–168. [Google Scholar] [CrossRef]
- Ashby, M.F. The deformation of plastically non-homogeneous materials. Philos. Mag. 1970, 21, 399–424. [Google Scholar] [CrossRef]
- Cordero, Z.C.; Knight, B.E.; Schuh, C.A. Six decades of the Hall–Petch effect—A survey of grain-size strengthening studies on pure metals. Int. Mater. Rev. 2016, 61, 495–512. [Google Scholar] [CrossRef]
- Hazzledine, P.M. Direct versus indirect dispersion hardening. Scr. Metall. Mater. 1992, 26, 57–58. [Google Scholar] [CrossRef]
- Hazzledine, P.M.; Louat, N.P. Direct as against indirect dispersion work hardening. Philos. Mag. Lett. 1994, 70, 129–133. [Google Scholar] [CrossRef]
- Estrin, Y.; Mecking, H. A remark in connection with ‘direct versus indirect dispersion hardening’. Scr. Metall. Mater. 1992, 27, 647–648. [Google Scholar] [CrossRef]
- Godon, A.; Creus, J.; Cohendoz, S.; Conforto, E.; Feaugas, X.; Girault, P.; Savall, C. Effects of grain orientation on the Hall–Petch relationship in electrodeposited nickel with nanocrystalline grains. Scr. Mater. 2010, 62, 403–406. [Google Scholar] [CrossRef]
- Lefebvre, S.; Devincre, B.; Hoc, T. Yield stress strengthening in ultrafine-grained metals: A two-dimensional simulation of dislocation dynamics. J. Mech. Phys. Solids 2007, 55, 788–802. [Google Scholar] [CrossRef]
- Malygin, G.A. Plasticity and strength of micro- and nanocrystalline materials. Phys. Solid State 2007, 49, 1013–1033. [Google Scholar] [CrossRef]
- Lefebvre, S.; Devincre, B.; Hoc, T. Simulation of the Hall–Petch effect in ultra-fine grained copper. Mater. Sci. Eng. A 2005, 400–401, 150–153. [Google Scholar] [CrossRef]
- Tjerkstra, H.H. The effect of grain size on the stress-strain curve of α-iron and the connection with the plastic deformation of the grain boundaries. Acta Metall. 1961, 9, 259–263. [Google Scholar] [CrossRef]
- Ono, N.; Karashima, S. Grain size dependence of flow stress in copper polycrystals. Scr. Metall. 1982, 16, 381–384. [Google Scholar] [CrossRef]
- Thompson, A.W.; Baskes, M.I. The influence of grain size on the work hardening of face-center cubic polycrystals. Philos. Mag. A J. Theor. Exp. Appl. Phys. 1973, 28, 301–308. [Google Scholar] [CrossRef]
- Thompson, A.W.; Baskes, M.I.; Flanagan, W.F. The dependence of polycrystal work hardening on grain size. Acta Metall. 1973, 21, 1017–1028. [Google Scholar] [CrossRef]
- Hansen, N. The effect of grain size and strain on the tensile flow stress of aluminium at room temperature. Acta Metall. 1977, 25, 863–869. [Google Scholar] [CrossRef]
- Al-haidary, J.T.; Petch, N.J.; de los Rios, E.R. The plastic deformation of polycrystals I. Aluminium between room temperature and 400 °C. Philos. Mag. A 1983, 47, 869–890. [Google Scholar] [CrossRef]
- Sonon, D.; Smith, G. Effect of grain size and temperature on the strengthening of nickel and a nickel-cobalt alloy by carbon. Trans. Metall. Soc. AIME 1968, 242, 1527–1533. [Google Scholar]
- Feaugas, X.; Haddou, H. Grain-size effects on tensile behavior of nickel and AISI 316L stainless steel. Met. Mater. Trans. A 2003, 34, 2329–2340. [Google Scholar] [CrossRef]
- Jago, R.A.; Hansen, N. Grain size effects in the deformation of polycrystalline iron. Acta Metall. 1986, 34, 1711–1720. [Google Scholar] [CrossRef]
- Lederich, R.J.; Sastry, S.M.L.; O’Neal, J.E.; Rath, B.B. The effect of grain size on yield stress and work hardening of polycrystalline titanium at 295 K and 575 K. Mater. Sci. Eng. 1978, 33, 183–188. [Google Scholar] [CrossRef]
- Ramani, S.V.; Rodriguez, P. Grain size dependence of the deformation behaviour of alpha zirconium. Can. Met. Q 1972, 11, 61–67. [Google Scholar] [CrossRef]
- Cerreta, E.; Yablinsky, C.A.; Gray, G.T.; Vogel, S.C.; Brown, D.W. The influence of grain size and texture on the mechanical response of high purity hafnium. Mater. Sci. Eng. A 2007, 456, 243–251. [Google Scholar] [CrossRef]
- Lasalmonie, A.; Strudel, J.L. Influence of grain size on the mechanical behaviour of some high strength materials. J. Mater. Sci. 1986, 21, 1837–1852. [Google Scholar] [CrossRef]
- Kocks, U.F.; Mecking, H. Physics and phenomenology of strain hardening: The FCC case. Prog. Mater. Sci. 2003, 48, 171–273. [Google Scholar] [CrossRef]
- Considère, A. Mémoire sur l’emploi du fer et de l’acier dans les Constructions; Ch. Dunod, Editeur: Paris, France, 1885; Volume 9, pp. 574–775. [Google Scholar]
- Hart, E.W. Theory of the tensile test. Acta Metall. 1967, 15, 351–355. [Google Scholar] [CrossRef]
- Yasnikov, I.S.; Vinogradov, A.; Estrin, Y. Revisiting the Considère criterion from the viewpoint of dislocation theory fundamentals. Scr. Mater. 2014, 76, 37–40. [Google Scholar] [CrossRef]
- Yasnikov, I.S.; Estrin, Y.; Vinogradov, A. What governs ductility of ultrafine-grained metals? A microstructure based approach to necking instability. Acta Mater. 2017, 141, 18–28. [Google Scholar] [CrossRef]
- Dalla Torre, F.; Lapovok, R.; Sandlin, J.; Thomson, P.F.; Davies, C.H.J.; Pereloma, E.V. Microstructures and properties of copper processed by equal channel angular extrusion for 1–16 passes. Acta Mater. 2004, 52, 4819–4832. [Google Scholar] [CrossRef]
- Vinogradov, A.; Yasnikov, I.S.; Matsuyama, H.; Uchida, M.; Kaneko, Y.; Estrin, Y. Controlling strength and ductility: Dislocation-based model of necking instability and its verification for ultrafine grain 316L steel. Acta Mater. 2016, 106, 295–303. [Google Scholar] [CrossRef]
- Yasnikov, I.S.; Kaneko, Y.; Uchida, M.; Vinogradov, A. The grain size effect on strain hardening and necking instability revisited from the dislocation density evolution approach. Mater. Sci. Eng. A 2022, 831, 142330. [Google Scholar] [CrossRef]
- Bui, Q.H.; Dirras, G.; Ramtani, S.; Gubicza, J. On the strengthening behavior of ultrafine-grained nickel processed from nanopowders. Mater. Sci. Eng. A 2010, 527, 3227–3235. [Google Scholar] [CrossRef]
- Bui, Q.H.; Pham, X.T. Modeling of microstructure effects on the mechanical behavior of ultrafine-grained nickels processed by hot isostatic pressing. Int. J. Mech. Sci. 2011, 53, 812–826. [Google Scholar] [CrossRef]
- Nguyen, T.-D.; Phan, V.-T.; Bui, Q.-H. Modeling of Microstructure Effects on the Mechanical Behavior of Ultrafine-Grained Nickels Processed by Severe Plastic Deformation by Crystal Plasticity Finite Element Model. J. Eng. Mater. Technol. 2015, 137, 021010. [Google Scholar] [CrossRef]
- Krasilnikov, N.; Lojkowski, W.; Pakiela, Z.; Valiev, R. Tensile strength and ductility of ultra-fine-grained nickel processed by severe plastic deformation. Mater. Sci. Eng. A 2005, 397, 330–337. [Google Scholar] [CrossRef]
- Beygelzimer, Y.; Orlov, D. Metal plasticity during the twist extrusion. Defect Diffus. Forum 2002, 208–209, 311–314. [Google Scholar] [CrossRef]
- Pachla, W.; Kulczyk, M.; Sus-Ryszkowska, M.; Mazur, A.; Kurzydlowski, K.J. Nanocrystalline titanium produced by hydrostatic extrusion. J. Mater. Process. Technol. 2008, 205, 173–182. [Google Scholar] [CrossRef]
- Kim, W.-J.; Hyun, C.-Y.; Kim, H.-K. Fatigue strength of ultrafine-grained pure Ti after severe plastic deformation. Scr. Mater. 2006, 54, 1745–1750. [Google Scholar] [CrossRef]
- Stolyarov, V.V.; Zhu, Y.T.; Lowe, T.C.; Islamgaliev, R.K.; Valiev, R.Z. A two step SPD processing of ultrafine-grained titanium. Nanostruct. Mater. 1999, 11, 947–954. [Google Scholar] [CrossRef]
- Stolyarov, V.V.; Beigel’zimer, Y.E.; Orlov, D.V.; Valiev, R.Z. Refinement of microstructure and mechanical properties of titanium processed by twist extrusion and subsequent rolling. Phys. Met. Met. 2005, 99, 204–211. [Google Scholar]
- Yapici, G.G.; Karaman, I.; Maier, H.J. Mechanical flow anisotropy in severely deformed pure titanium. Mater. Sci. Eng. A 2006, 434, 294–302. [Google Scholar] [CrossRef]
- Anibal, M.; Andrea, M.K.; Maurizio, F.; Vitor, L.S. How severe plastic deformation at cryogenic temperature affects strength, fatigue, and impact behaviour of grade 2 titanium. IOP Conf. Ser. Mater. Sci. Eng. 2014, 63, 012161. [Google Scholar]
- Rao, M.S.; Chakkingal, U.; Raghu, T. Mechanical behavior of commercial purity titanium processed by equal channel angular pressing followed by cold rolling. Trans. Indian Inst. Met. 2013, 66, 357–362. [Google Scholar] [CrossRef]
- Salishchev, G.A.; Galeev, R.M.; Malysheva, S.P.; Zherebtsov, S.V.; Mironov, S.Y.; Valiakhmetov, O.R.; Ivanisenko, É.I. Formation of submicrocrystalline structure in titanium and titanium alloys and their mechanical properties. Met. Sci. Heat Treat. 2006, 48, 63–69. [Google Scholar] [CrossRef]
- Miura, H.; Kobayashi, M.; Aoba, T.; Aoyama, H.; Benjanarasuth, T. An approach for room-temperature multi-directional forging of pure titanium for strengthening. Mater. Sci. Eng. A 2018, 731, 603–608. [Google Scholar] [CrossRef]
- Kang, D.-H.; Kim, T.-W. Mechanical behavior and microstructural evolution of commercially pure titanium in enhanced multi-pass equal channel angular pressing and cold extrusion. Mater. Des. 2010, 31, S54–S60. [Google Scholar] [CrossRef]
- Terada, D.; Inoue, S.; Tsuji, N. Microstructure and mechanical properties of commercial purity titanium severely deformed by ARB process. J. Mater. Sci. 2007, 42, 1673–1681. [Google Scholar] [CrossRef]
- Milner, J.L.; Abu-Farha, F.; Bunget, C.; Kurfess, T.; Hammond, V.H. Grain refinement and mechanical properties of CP-Ti processed by warm accumulative roll bonding. Mater. Sci. Eng. A 2013, 561, 109–117. [Google Scholar] [CrossRef]
- Lin, Z.; Wang, L. The ultrafine-grained titanium and biomedical titanium alloys processed by severe plastic deformation (SPD). SOJ Mater. Sci. Eng. 2013, 1, 1–5. [Google Scholar] [CrossRef] [Green Version]
- Luo, P.; McDonald, D.T.; Palanisamy, S.; Dargusch, M.S.; Xia, K. Ultrafine-grained pure Ti recycled by equal channel angular pressing with high strength and good ductility. J. Mater. Process. Technol. 2013, 213, 469–476. [Google Scholar] [CrossRef]
- Medvedev, A.; Ng, H.P.; Lapovok, R.; Estrin, Y.; Lowe, T.C.; Anumalasetty, V.N. Comparison of laboratory-scale and industrial-scale equal channel angular pressing of commercial purity titanium. Mater. Lett. 2015, 145, 308–311. [Google Scholar] [CrossRef]
- Petch, N.J.; Armstrong, R.W. The tensile test. Acta Metall. Mater. 1990, 38, 2695–2700. [Google Scholar] [CrossRef]
- Tsuji, N.; Ito, Y.; Saito, Y.; Minamino, Y. Strength and ductility of ultrafine grained aluminum and iron produced by ARB and annealing. Scr. Mater. 2002, 47, 893–899. [Google Scholar] [CrossRef]
- Takebe, H.; Ushioda, K. Effects of Grain Size, Thickness and Tensile Direction on Yield Behavior of Pure Titanium Sheet. J. Jpn. Inst. Met. Mater. 2022, 86, 53–61. [Google Scholar] [CrossRef]
- Figueiredo, R.B.; Langdon, T.G. Deformation mechanisms in ultrafine-grained metals with an emphasis on the Hall–Petch relationship and strain rate sensitivity. J. Mater. Res. Technol. 2021, 14, 137–159. [Google Scholar] [CrossRef]
- Dangwal, S.; Edalati, K.; Valiev, R.Z.; Langdon, T.G. Breaks in the Hall–Petch relationship after severe plastic deformation of magnesium, aluminum, copper, and iron. Crystals 2023, 13, 413. [Google Scholar] [CrossRef]
- Khamsuk, S.; Park, N.; Gao, S.; Terada, D.; Adachi, H.; Tsuji, N. Mechanical properties of bulk ultrafine grained aluminum fabricated by torsion deformation at various temperatures and strain rates. Mater. Trans. 2014, 55, 106–113. [Google Scholar] [CrossRef] [Green Version]
- Tian, Y.Z.; Ren, Y.P.; Gao, S.; Zheng, R.X.; Wang, J.H.; Pan, H.C.; Zhang, Z.F.; Tsuji, N.; Qin, G.W. Two-stage Hall-Petch relationship in Cu with recrystallized structure. J. Mater. Sci. Technol. 2020, 48, 31–35. [Google Scholar] [CrossRef]
- Bai, Y.; Kitamura, H.; Gao, S.; Tian, Y.; Park, N.; Park, M.-h.; Adachi, H.; Shibata, A.; Sato, M.; Murayama, M.; et al. Unique transition of yielding mechanism and unexpected activation of deformation twinning in ultrafine grained Fe-31Mn-3Al-3Si alloy. Sci. Rep. 2021, 11, 15870. [Google Scholar] [CrossRef]
- Fu, B.; Pei, C.; Pan, H.; Guo, Y.; Fu, L.; Shan, A. Hall-Petch relationship of interstitial-free steel with a wide grain size range processed by asymmetric rolling and subsequent annealing. Mater. Res. Express 2020, 7, 116516. [Google Scholar] [CrossRef]
- Kashyap, B.P.; Tangri, K. On the Hall-Petch relationship and substructural evolution in type 316L stainless steel. Acta Metall. Et Mater. 1995, 43, 3971–3981. [Google Scholar] [CrossRef]
- Thompson, A.W. Effect of grain size on work hardening in nickel. Acta Metall. 1977, 25, 83–86. [Google Scholar] [CrossRef]
- Bergström, Y.; Hallén, H. Hall–Petch relationships of iron and steel. Met. Sci. 1983, 17, 341–347. [Google Scholar] [CrossRef]
- Lloyd, D.J. Deformation of fine-grained aluminium alloys. Met. Sci. 1980, 14, 193–198. [Google Scholar] [CrossRef]
- Armstrong, R.W. The Yield and Flow Stress Dependence Polycrystal Grain Size. In Yield, Flow and Fracture of Polycrystals; Baker, T.N., Ed.; Applied Science Publishers, Ltd.: London, UK; New York, NY, USA, 1983. [Google Scholar]
- Holt, D.L. Dislocation Cell Formation in Metals. J. Appl. Phys. 1970, 41, 3197–3201. [Google Scholar] [CrossRef]
- Zhilyaev, A.P.; Gubicza, J.; Nurislamova, G.; Revesz, A.; Surinach, S.; Baro, M.D.; Ungar, T. Microstructural characterization of ultrafine-grained nickel. Phys. Status Solidi A 2003, 198, 263–271. [Google Scholar] [CrossRef]
- Gubicza, J.; Fogarassy, Z.; Krállics, G.; Lábár, J.; Törköly, T. Microstructure and mechanical behavior of ultrafine-grained titanium. Mater. Sci. Forum 2008, 589, 99–104. [Google Scholar] [CrossRef]
- Fattah-alhosseini, A.; Keshavarz, M.K.; Mazaheri, Y.; Reza Ansari, A.; Karimi, M. Strengthening mechanisms of nano-grained commercial pure titanium processed by accumulative roll bonding. Mater. Sci. Eng. A 2017, 693, 164–169. [Google Scholar] [CrossRef]
- Meyers, M.A.; Mishra, A.; Benson, D.J. Mechanical properties of nanocrystalline materials. Prog. Mater. Sci. 2006, 51, 427–556. [Google Scholar] [CrossRef]
Figure 1.
Hall–Petch plots showing the grain size dependence of (a) the yield stress and (b) the true stress at maximum load for nickel polycrystals. The linear regression line for presented in (a) is reintroduced in (b) for easier comparison. The references for the datapoints collected from different studies by Di Leo et al. (2019) are given in [14]; other points are adapted from [45,46,47,48,49].

Figure 2.
Hall–Petch plots showing the grain size dependence of (a) the yield stress and (b) the true stress at maximum load for CP titanium (Grade 2); the data were collected from [50,51,52,53,54,55,56,57,58,59,60,61,62,63,64].

Figure 3.
Schematic illustration of the two-stage Hall–Petch behavior that has been frequently reported for pure metals and alloys [70,72,73,74].


Disclaimer/Publisher’s Note: The statements, opinions and data contained in all publications are solely those of the individual author(s) and contributor(s) and not of MDPI and/or the editor(s). MDPI and/or the editor(s) disclaim responsibility for any injury to people or property resulting from any ideas, methods, instructions or products referred to in the content. |
© 2023 by the authors. Licensee MDPI, Basel, Switzerland. This article is an open access article distributed under the terms and conditions of the Creative Commons Attribution (CC BY) license (https://creativecommons.org/licenses/by/4.0/).
Share and Cite
MDPI and ACS Style
Vinogradov, A.; Estrin, Y. Hall–Petch Description of the Necking Point Stress. Metals 2023, 13, 690. https://doi.org/10.3390/met13040690
AMA Style
Vinogradov A, Estrin Y. Hall–Petch Description of the Necking Point Stress. Metals. 2023; 13(4):690. https://doi.org/10.3390/met13040690
Chicago/Turabian StyleVinogradov, Alexey, and Yuri Estrin. 2023. "Hall–Petch Description of the Necking Point Stress" Metals 13, no. 4: 690. https://doi.org/10.3390/met13040690
Note that from the first issue of 2016, this journal uses article numbers instead of page numbers. See further details here.