
Active and Passive Thermal Management in Wire Arc Additive Manufacturing

1
Indian Institute of Technology Hyderabad, Sangareddy 502284, India
2
Faculty of Engineering Technology, KU Leuven, Campus De Nayer, 2860 Sint-Katelijne-Waver, 3001 Leuven, Belgium
*
Author to whom correspondence should be addressed.
Metals 2023, 13(4), 682; https://doi.org/10.3390/met13040682
Submission received: 13 January 2023
/
Revised: 27 February 2023
/
Accepted: 27 March 2023
/
Published: 30 March 2023
(This article belongs to the Special Issue Wire Arc Additive Manufacturing of Metal and Alloys)
Abstract
:This article presents innovative approaches for managing residual stresses and distortion in additive manufacturing (AM) of metal components (baseplate material: EN8; filler wire material: ER70S-6). The experiments are conducted with two approaches for thermal management—passive and active. The passive approach of experiments is performed by varying the selected process parameters to study their effect on residual stresses and distortion. The chosen parameters are current, torch speed, geometry, continuous or a delay in the deposition, and cooling arrangement. Based on the understanding gained from the passive approach, the active approach of thermal management was implemented by insulating the substrate with and without adaptive current and heating the substrate. The experimental results were corroborated with the simulation to understand the process better. A comparative study for hardness was made based on the T8/5 extracted from the simulation. These experiments and simulations endorse passive and active thermal management as effective tools that can alter the distortion and residual stress pattern and the mechanical properties of an AM component. The investigation concludes that the process parameters that lead to higher heat input vis-à-vis an increase in current or a decrease in speed increase the distortion. On the other hand, the parameters that affect the rate of heat distribution vis-à-vis torch speed and geometry affect the residual stresses. When current, traverse speed and a/b ratio were kept the same, active thermal management with a heated base reduced distortion from 1.226 mm to 0.431 mm, a 65% reduction compared to passive thermal management. Additionally, the maximum residual stress was reduced from 492.31 MPa to 250.68 MPa, with residual stresses decreasing from 418.57 MPa to 372 MPa. Overall, active thermal management resulted in a 63% reduction in distortion, lowering it from 1.35 mm to 0.50 mm using external heating. The components that are difficult to complete because of the in-process distortion are expected to be manufactured with thermal management, e.g., heating the substrate is an effective measure to manage the in-process distortion. Thermal management techniques depend on geometry; for instance, a concave surface, because of self-heating, reduces the cooling rate and has relatively less variation in hardness.
Keywords:
additive manufacturing; WAAM; thermal management; distortion; residual stress; hardness; simulation1. Introduction
Over the past decade, AM has been gaining attention and is playing a prominent role in the manufacturing industry due to its ability to produce components at a lesser cost, with lower manufacturing lead-time, minimal wastage of material, design flexibility for the production of complex geometries and customization tailored to specific needs. AM provides a new processing route to produce complex parts with varying material composition and functional properties in a spatially controlled manner, unlike conventional manufacturing methods with limited complexity and requiring additional postprocessing [1].
One such additive manufacturing method is the use of a gas metal arc welding (GMAW) process, known as Wire-Direct Energy Deposition (W-DED) or Wire Arc Additive Manufacturing (WAAM). Low capital and operating costs, high deposition rates and material efficiency are some of the benefits of WAAM, making it ideal for manufacturing large structural components widely used in marine, aerospace, defence and transportation [2,3]. WAAM has successfully fabricated super alloys, which are functionally graded materials that have tailored properties for various industrial applications [4]. The Metal AM process consists of depositing and solidifying molten metal on a substrate plate or the preceding layer. As a result, the heating and cooling of the substrate plate and the underlying layers are not uniform. This variation in thermal cycles results in residual stresses and possible distortion, which impairs the quality and accuracy of AM. Residual stresses also play a pivotal role in the mechanical behaviour of the built part; for example, tensile residual stresses decrease the fatigue life of a component as they support crack initiation and propagation.
Several researchers have investigated different approaches to reduce residual stress. One method is altering the area-filling patterns. Somashekara et al. found that among the raster, spiral-in, and spiral-out deposition patterns, raster and spiral-in patterns showed maximum and minimum residual stresses, respectively [5]. Another method is to monitor the pace of the depositing process through the layers, vis-à-vis interlayer pause or continuous deposition. Zhua et al. observed that the interpass idle time significantly affects residual stress and distortion. Every rear layer has a stress release effect on the fore layer and vice versa, except for the last deposited layer [6]. Longer dwell time results in greater distortion due to the generation of thermal gradients [7]. Residual stresses are mainly concentrated near the base wall interface, and the substrate temperature significantly affects residual stresses [8,9]. Preheating may minimize residual stress and distortion [10,11]. Martina et al. suggested mechanical intervention methods, such as rolling between passes, to reduce residual stresses and distortion [12]. Using profiled and split rollers on the deposited metal can considerably reduce residual stress and deformation [13]. In the case of larger components, distortion management is possible by balancing the deposition process, i.e., depositing an equal quantity of material on either side of the substrate plate to balance the bending moment around the neutral axis [14]. For symmetrical components, the plane of symmetry is identified, and the deposition is alternated on either side; hence stresses produced on one side of the deposit are balanced by the other side. Optimizing the part orientation with the shortest path deposition can reduce residual stresses.
In recent years, the residual stress and distortion in WAAM have been investigated from different perspectives. The residual stress and distortion in WAAM parts strongly depend on heat distribution. When the heat spreads uniformly throughout the piece, so as the residual stress, as observed in the WAAM built wall and pipe components [15]. More distortion occurs depending on the cooling rate in the place where the heat accumulates. Interestingly, the distortion is much more significant when the number of layers is small [16]. The geometry of the built component also affects the residual stress; for instance, the corner of the rectangle shows extremely high residual stress [17]. The adaptive heat flow to the substrate or the workpiece is one of the latest approaches to controlling residual stress and distortion; for instance, Doumenc et al. [18] used a cooling system to keep the substrate at 20 °C such that after every layer deposition, 20 °C is reached in 40 s. Differently, Fan et al. [19] suggested trailing cooling of argon gas to −15 °C, followed by depositing a subsequent layer, which reduced residual stress. However, residual stress increased even more for the first few layers. Similarly, Reddy et al. [20] demonstrated that the substrate must first be heated and cooled at an optimal rate. Likewise, Montevecchi et al. [21] recommended using an air jet for cooling after the 4th layer. The substrate thickness is another aspect that can impact the residual stress; that is, a thicker substrate helps to reduce residual stress [22].
The preceding investigations report different methods of impacting residual stress. There is a need for a comprehensive investigation wherein the effect of process parameters, control measures and heat distribution are collectively investigated. The objective of this work is to manage residual stresses and distortion in components produced by the WAAM process through passive and active thermal management approaches. In a larger sense, thermal management is a method of modifying the heating and cooling rates to influence residual stress and distortion. Passive cooling refers to natural conduction, convection, and radiation to cool a component. In contrast, active cooling requires the use of energy specifically dedicated to influencing the cooling rate, e.g., by preheating the base plate. The passive approach mainly examines the effect of process parameters, geometry, the pace of the build process and external intervention on distortion and residual stresses such that the operating conditions are disjointed from the process evolution. The active approach involves changing the starting condition (by preheating the base plate) and the interlayer conditions (by adapting the current). The distortion and residual stress are investigated through the design of experiment (DOE) in the framework of thermal management, including the method of cooling (natural cooling/forced cooling), continuous or delayed deposition with waiting in between the passes, process parameters (welding current and traverse speed) and geometry (aspect ratio of an elliptic cylinder). A predictive relation for distortion and residual stress prediction is presented for the candidate geometry in one of the first of its kind. Hardness and simulation studies are carried out to support the findings.
The paper’s main contribution is a comprehensive evaluation of the thermal management approaches in wire arc additive manufacturing. The approaches are thoroughly investigated in a wide range of process conditions, and conclusions useful for practical implementations are derived. The experimental methodology is presented in the following section, followed by a description of active and passive thermal management approaches. Subsequently, the results of the investigation are presented and discussed.
2. Materials and Methods
This section covers the experimental methodology adopted for the fabrication and measurements. The procedure for sample fabrication and selecting appropriate parameters is described in the first subsection. The measurement method used to determine the deformation and residual stresses follows in the second subsection.
2.1. Component Fabrication
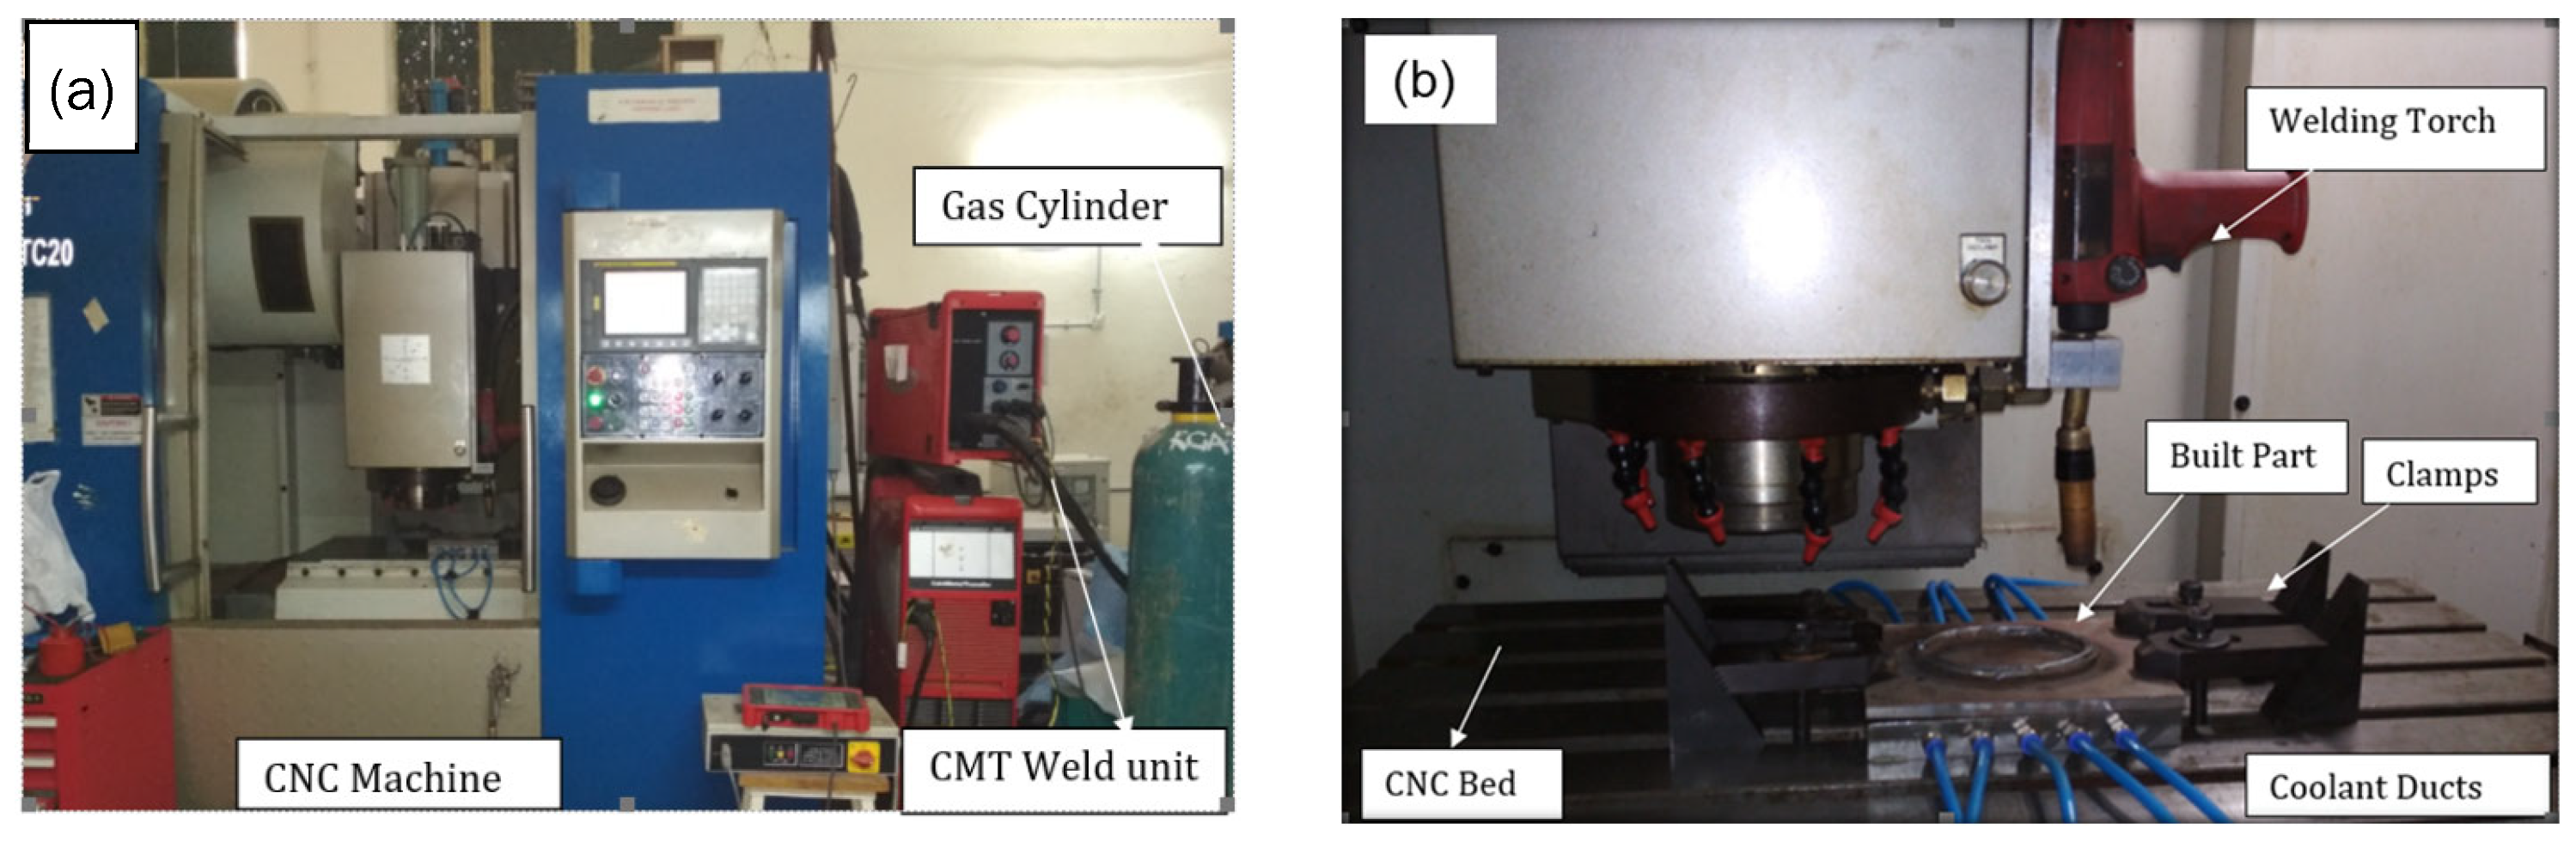
The experimental setup for component fabrication through WAAM consisted of 2 essential components: a GMA welding system (model: Cold Metal Transfer (CMT), Fronius) for metal deposition and a vertical CNC milling machine for the movement of the torch. The welding torch was retrofitted on the CNC machine, and together they acted as a deposition head that could build the desired geometry on a substrate, as shown in Figure 1a,b. The substrate plate was mounted on a cooling fixture fixed on the machine bed. To ensure constant clamping force, the cooling fixture and substrate plate were fastened to the machine bed using lateral clamps. A constant clamping force of 1.6 kN was applied using a 40 Nm torque wrench. In addition, identical clamps and bolts were utilized to further ensure consistency in the clamping force.
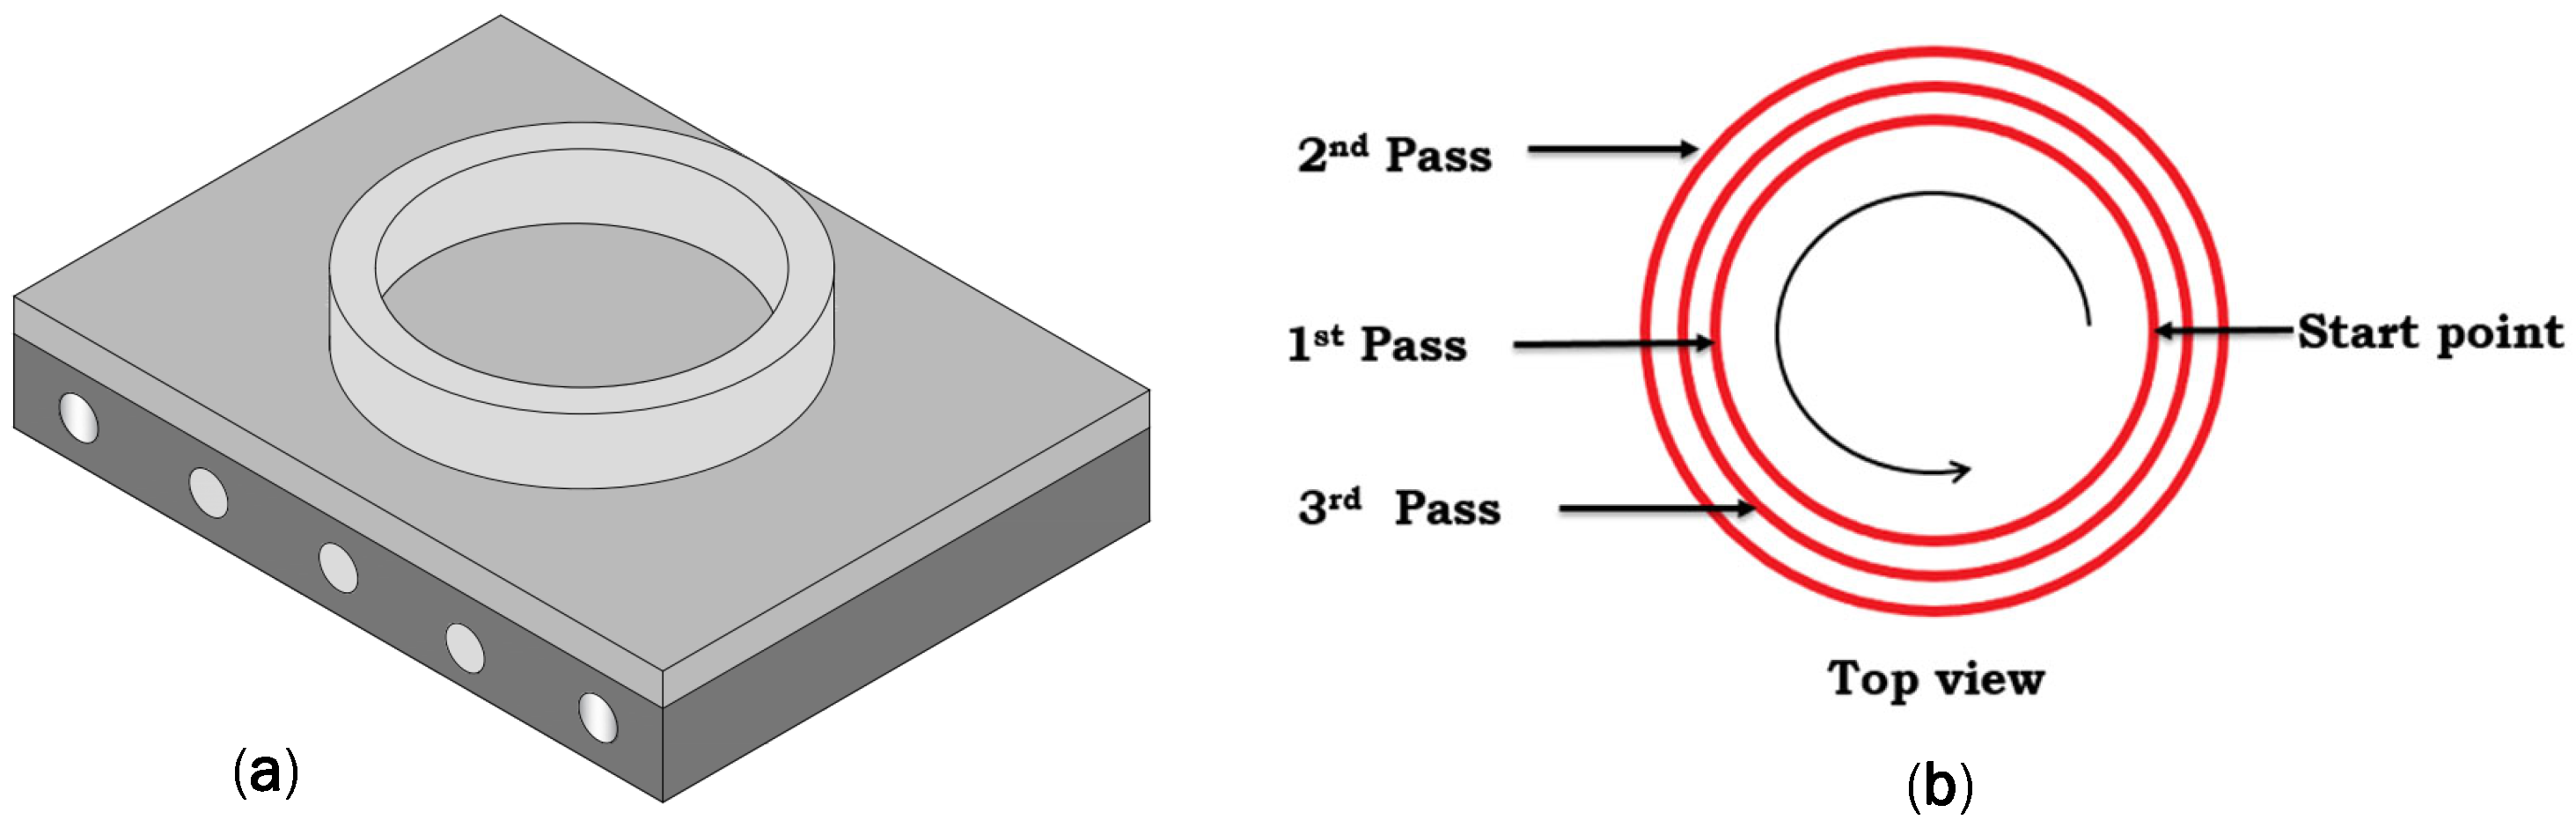
The cooling fixture (shown in Figure 2a) had parallel ducts for the continuous water flow. The plan of experiments, elaborated in the subsequent sections, required both forced and natural cooling of the substrate. When coolant circulated in the conduits, it provided forced cooling of the substrate on which the component was deposited. In contrast, no coolant flow would imply natural cooling without external intervention in the thermal evolution of the deposited component. The value of the current during the deposition was maintained through the welding system. Torch speed, geometry and build pace (i.e., interlayer pause or continuous deposition) are achieved through the tool path file of the CNC part programming.
Various patterns (as detailed later) used for the experiments were deposited on a rectangular substrate (EN8 alloy BS970: 1955) 11 mm thick and with dimensions of 200 mm × 150 mm. The fabrication of each test case involved the deposition of a circular/oval shape comprising three concentric passes for each layer, as shown in Figure 3. In line with the typical AM methodology of having the contours deposited first, followed by internal filling, the other passes were deposited first, and the central pass was deposited at the end. The deposition started at position 1 and proceeded in a circular/oval manner, as shown in Figure 2b. All experiments were conducted to fabricate a geometry of 10 mm in thickness and 20 mm in height to ensure that the total amount of material added was the same. This was achieved by selecting appropriate values of welding current, torch speed and distance between the passes. The materials used for experimentation, fixture details and base plate properties are given in Table 1 and Table 2.
2.2. Measurement Methodology
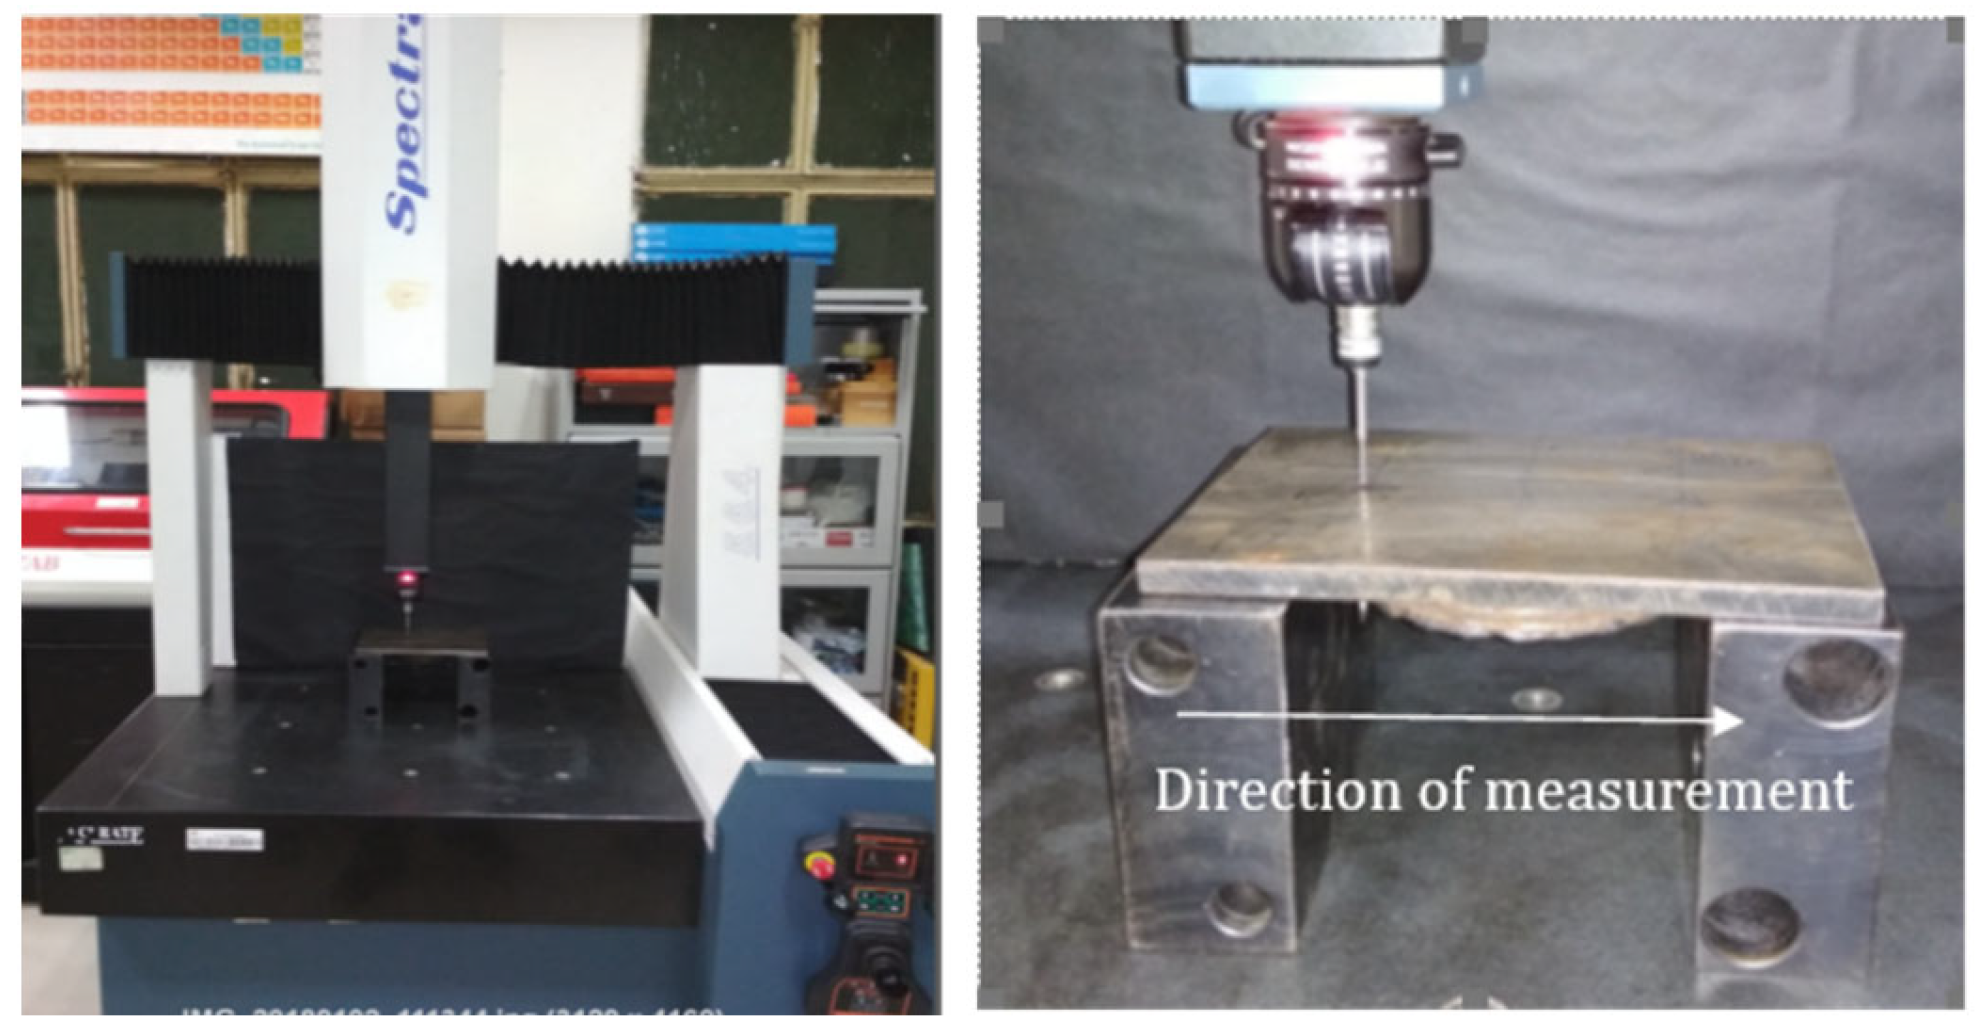
Once the deposition was complete, the components were allowed to cool down to room temperature and then unclamped. The significant and localized nature of the heat input during the deposition process resulted in the development of thermal stresses. When the substrate was released, some of the stresses resulted in the deformation of the substrate, while residual stresses remained. Hence, distortion and residual stresses were of interest as a measure of thermal stresses developed in the process. The distortion was measured by using a coordinate measuring machine (CMM). The baseplate was placed upside down over the parallel blocks, as shown in Figure 3. The reference plane and centre coordinates were chosen at the centre of the plate. These obtained coordinates were used for profiling the deformed substrate.
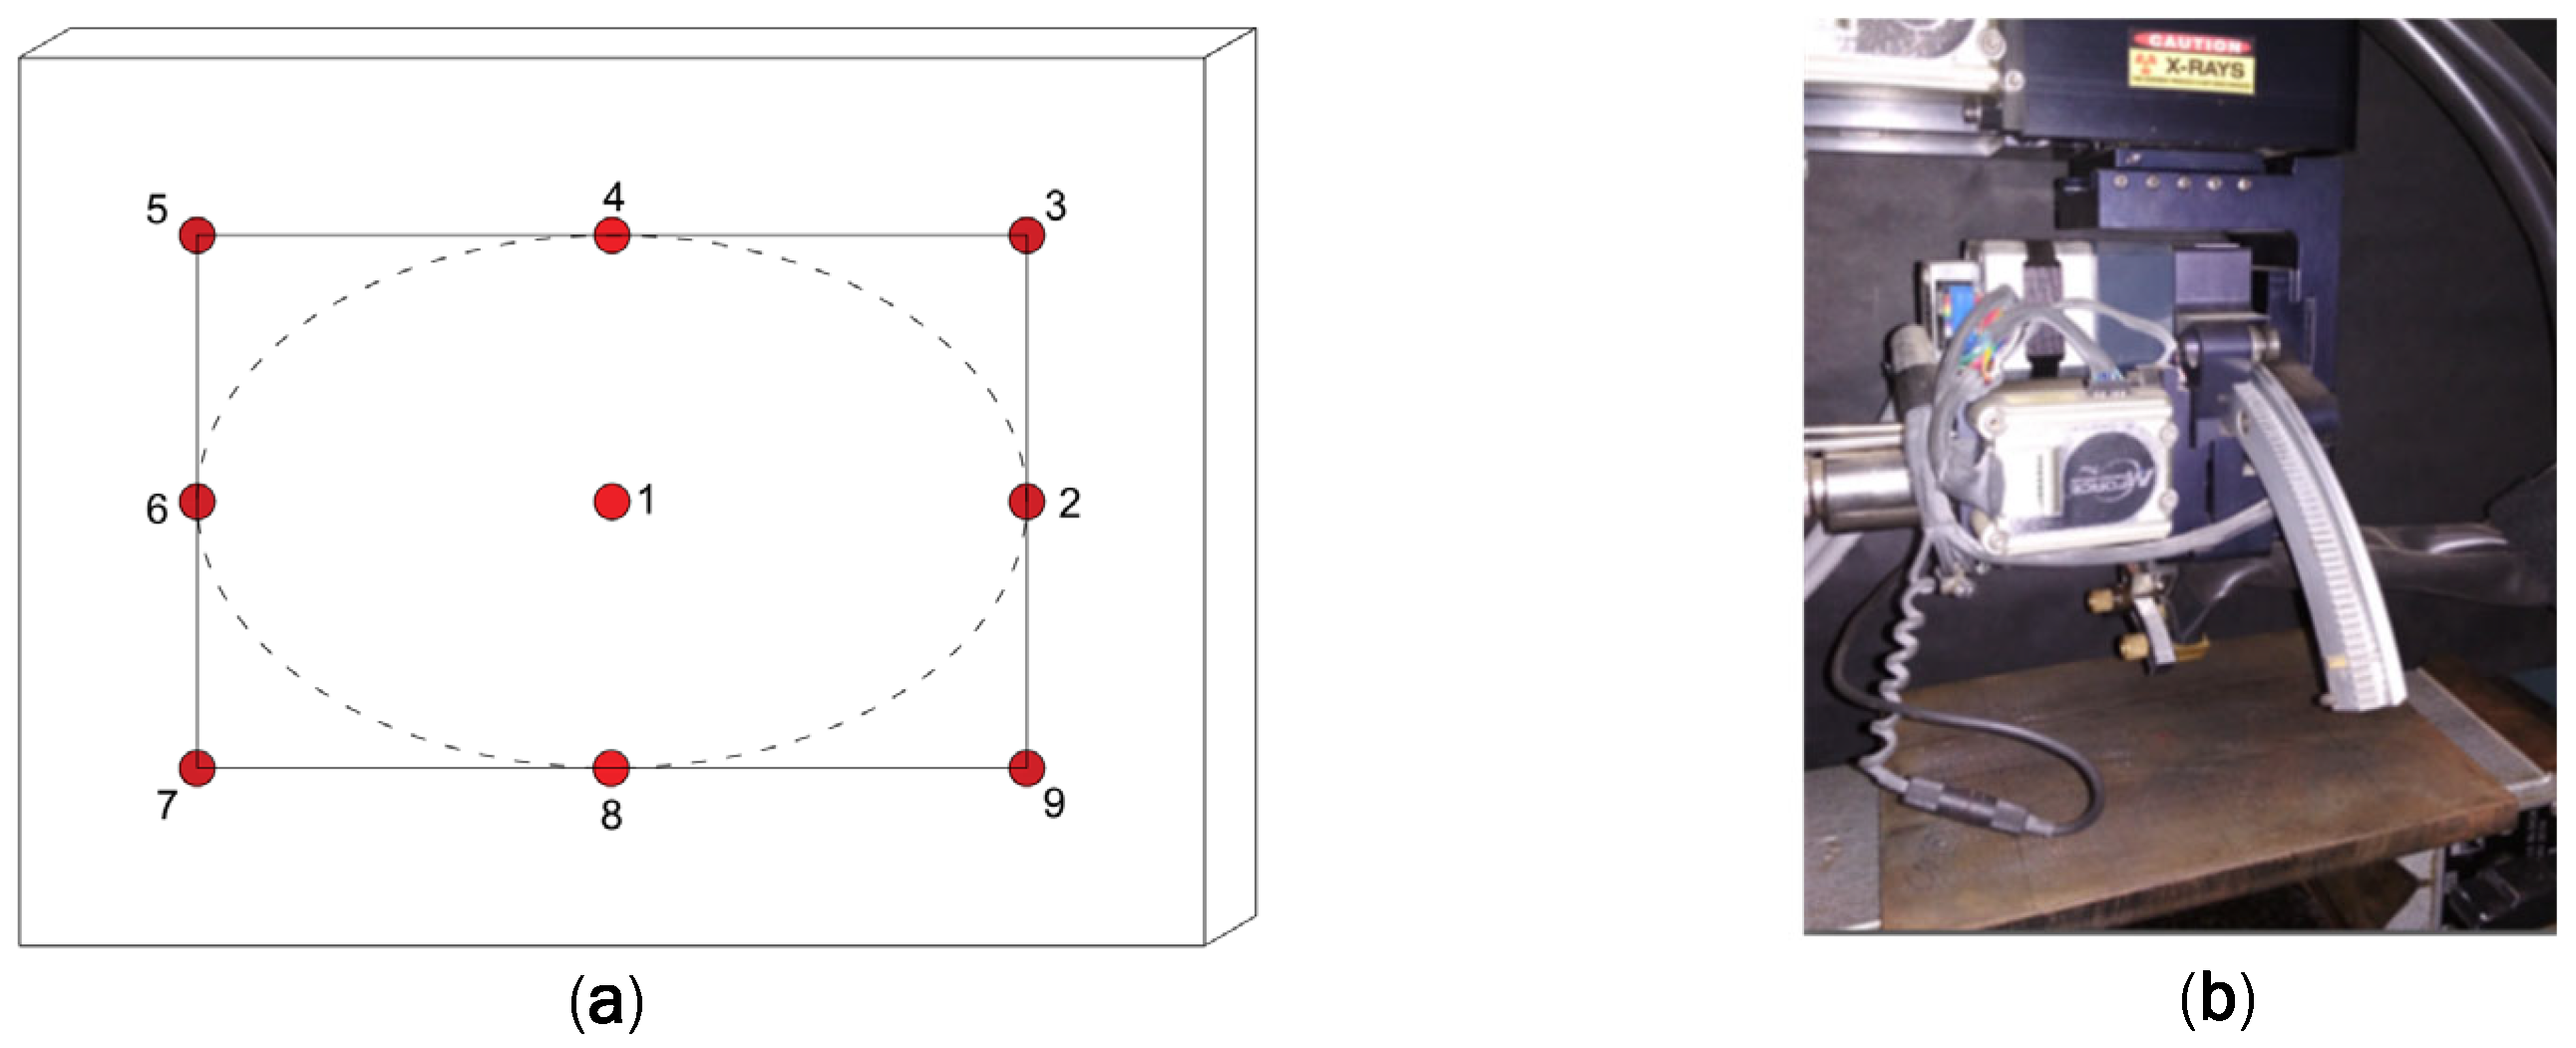
The residual stresses were measured on an XRD machine (brand: proto) following the Braggs law. Residual stresses were measured on the undersurface of the support plate at 9 different points. These 9 points corresponded to the corners and midpoints of the rectangle, circumscribing the centreline of the deposited piece, as shown in Figure 4. To eliminate any interference with the prior history of the substrate, the residual stresses at these locations were measured before and after the deposition, and the difference between these values was used for analysis. After measuring the deformations and residual stresses in the base plate, the components were cut diagonally to obtain the lateral profile of the deposited component.
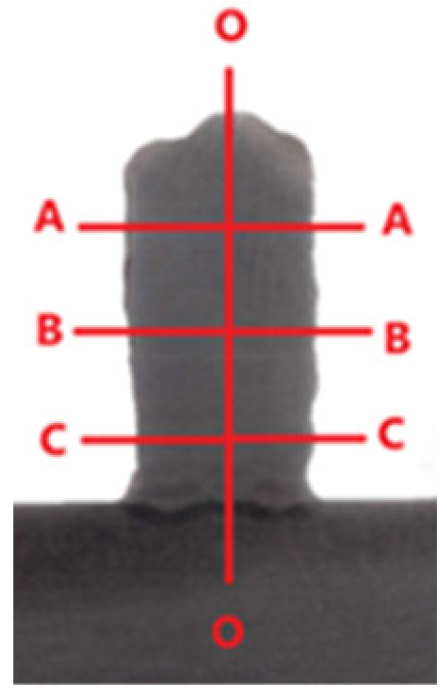
The deposited samples were cut using electric discharge machining, and the cut surfaces were polished and prepared for the hardness measurement. The hardness was measured using the Vickers microhardness tester (make: UHL), with an indentation force of 100 gF and a step size of 0.2 mm. Hardness measurements were taken along the centre line (O–O) and at 3 different locations (randomly at A–A, B–B and C–C) across the width of the sample, as depicted in Figure 5.
3. Passive and Active Approaches to Thermal Management
3.1. Passive Approach
The passive approach mainly examines the effect of process parameters, geometry, the pace of the build process and the external intervention on distortion and residual stresses. During the deposition process, several factors are involved in the evolution of the thermal history of the component. Prominent among them were the following:
- Process parameters of deposition (welding current and traverse speed)
- Shape/geometry of the component being deposited
- Pace of the build process (with or without interlayer pause or delay)
- External intervention on the build system, if any
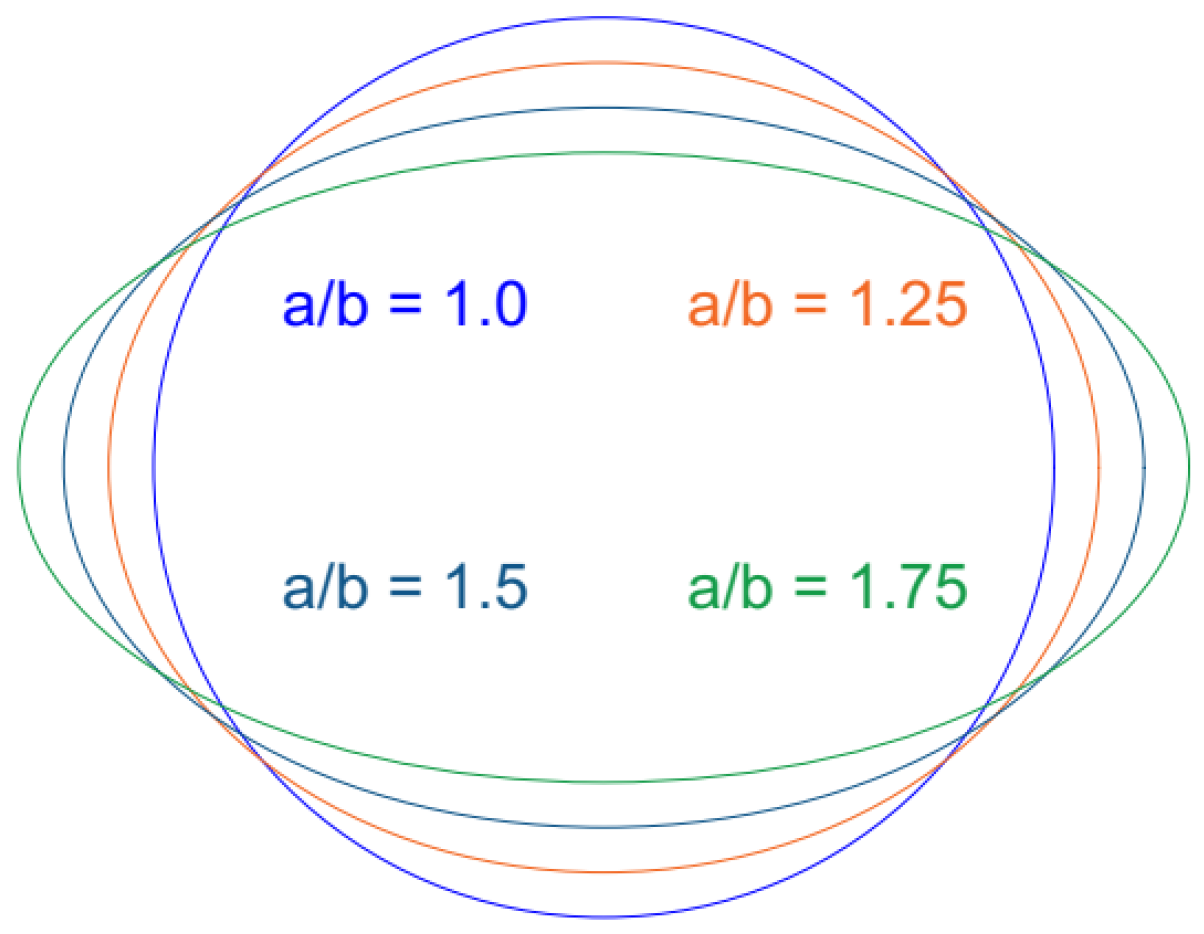
The role of the shape/geometry of the deposited component was captured in the form of symmetricity (or lack of it) by taking an elliptical shape and changing the major to minor radii (a/b) of the ellipse, as shown in Figure 6. This a/b ratio was altered in such a manner that the total perimeter of the ellipse remained constant. It may be noted that the size of the substrate plate might also affect the distortion. However, as the AM substrate is usually sacrificial, it was not considered in the current analysis.
In layer-by-layer component fabrication, the pace of building these layers can also influence the thermal evolution of the process. Continuous deposition and deposition with an interlayer delay are the two configurations used to cover this effect. In the deposition with an interlayer delay (henceforth called delay deposition), each layer is allowed to cool down to a set temperature before the deposition for the next layer begins. Based on the literature, the set temperature selected was 93 °C [23]. In the continuous deposition case, the deposition of a new layer commenced immediately after the completion of the previous, and no delay was given.
The deposition is carried out with and without coolant being circulated through the coolant fixture. This form of external intervention to the system signifies forced cooling (achieved by a continuous flow of coolant taking away the heat) and natural cooling (with no coolant flow and cooling only in the form of losses to the surrounding environment). The set of prominent factors and their corresponding parameters are summarized in Table 3.
A design of experiments array was constructed to understand the effect of the above-discussed parameters on residual stresses and distortion while minimizing the number of experiments. The design is a mixed level L16, Taguchi’s near orthogonal array design as shown in Table 4, with three factors (current, geometry and torch speed) at four levels and two more factors (continuous vs. delay; normal vs. forced cooling) at two levels each. In addition to the distortion and residual stresses, the hardness variation across the geometry for some selected cases was also carried out to understand the effect of the weld-deposition sequence.
3.2. Active Approach
In the previous section on the passive approach, the operating conditions were disjointed from the process evolution. This section examines the feasibility and benefits of active thermal management. Active management was achieved by altering the starting conditions (through baseplate preheating) and the interlayer conditions (through an adaptive change in welding current). As the objective here was to speculate on the role of active management and parameter optimization per se, parameters were chosen so that the thermal gradients were manifested in a magnified manner. Hence, maximum current, maximum torch speed and continuous deposition were determined. The a/b ratio was kept at 1.0. To eliminate any possible interference from the operating environment and to focus solely on the thermal evolution inside the deposited system, the base was held on an asbestos sheet, insulated from the remaining system and allowed to cool down naturally. Three experiments were performed to demonstrate the active approach, namely A1—natural cooling with an insulated base, A2—natural cooling with an insulated and heated plate, and A3—natural cooling with an insulated base and adaptive change of current. The current was adapted between 90 to 120 A. The current was reduced in steps of 3 A per layer. The speed was also changed in the same proportion by keeping the current/speed ratio constant. The constant ratio ensured a constant heat input per unit length.
4. Results and Discussions
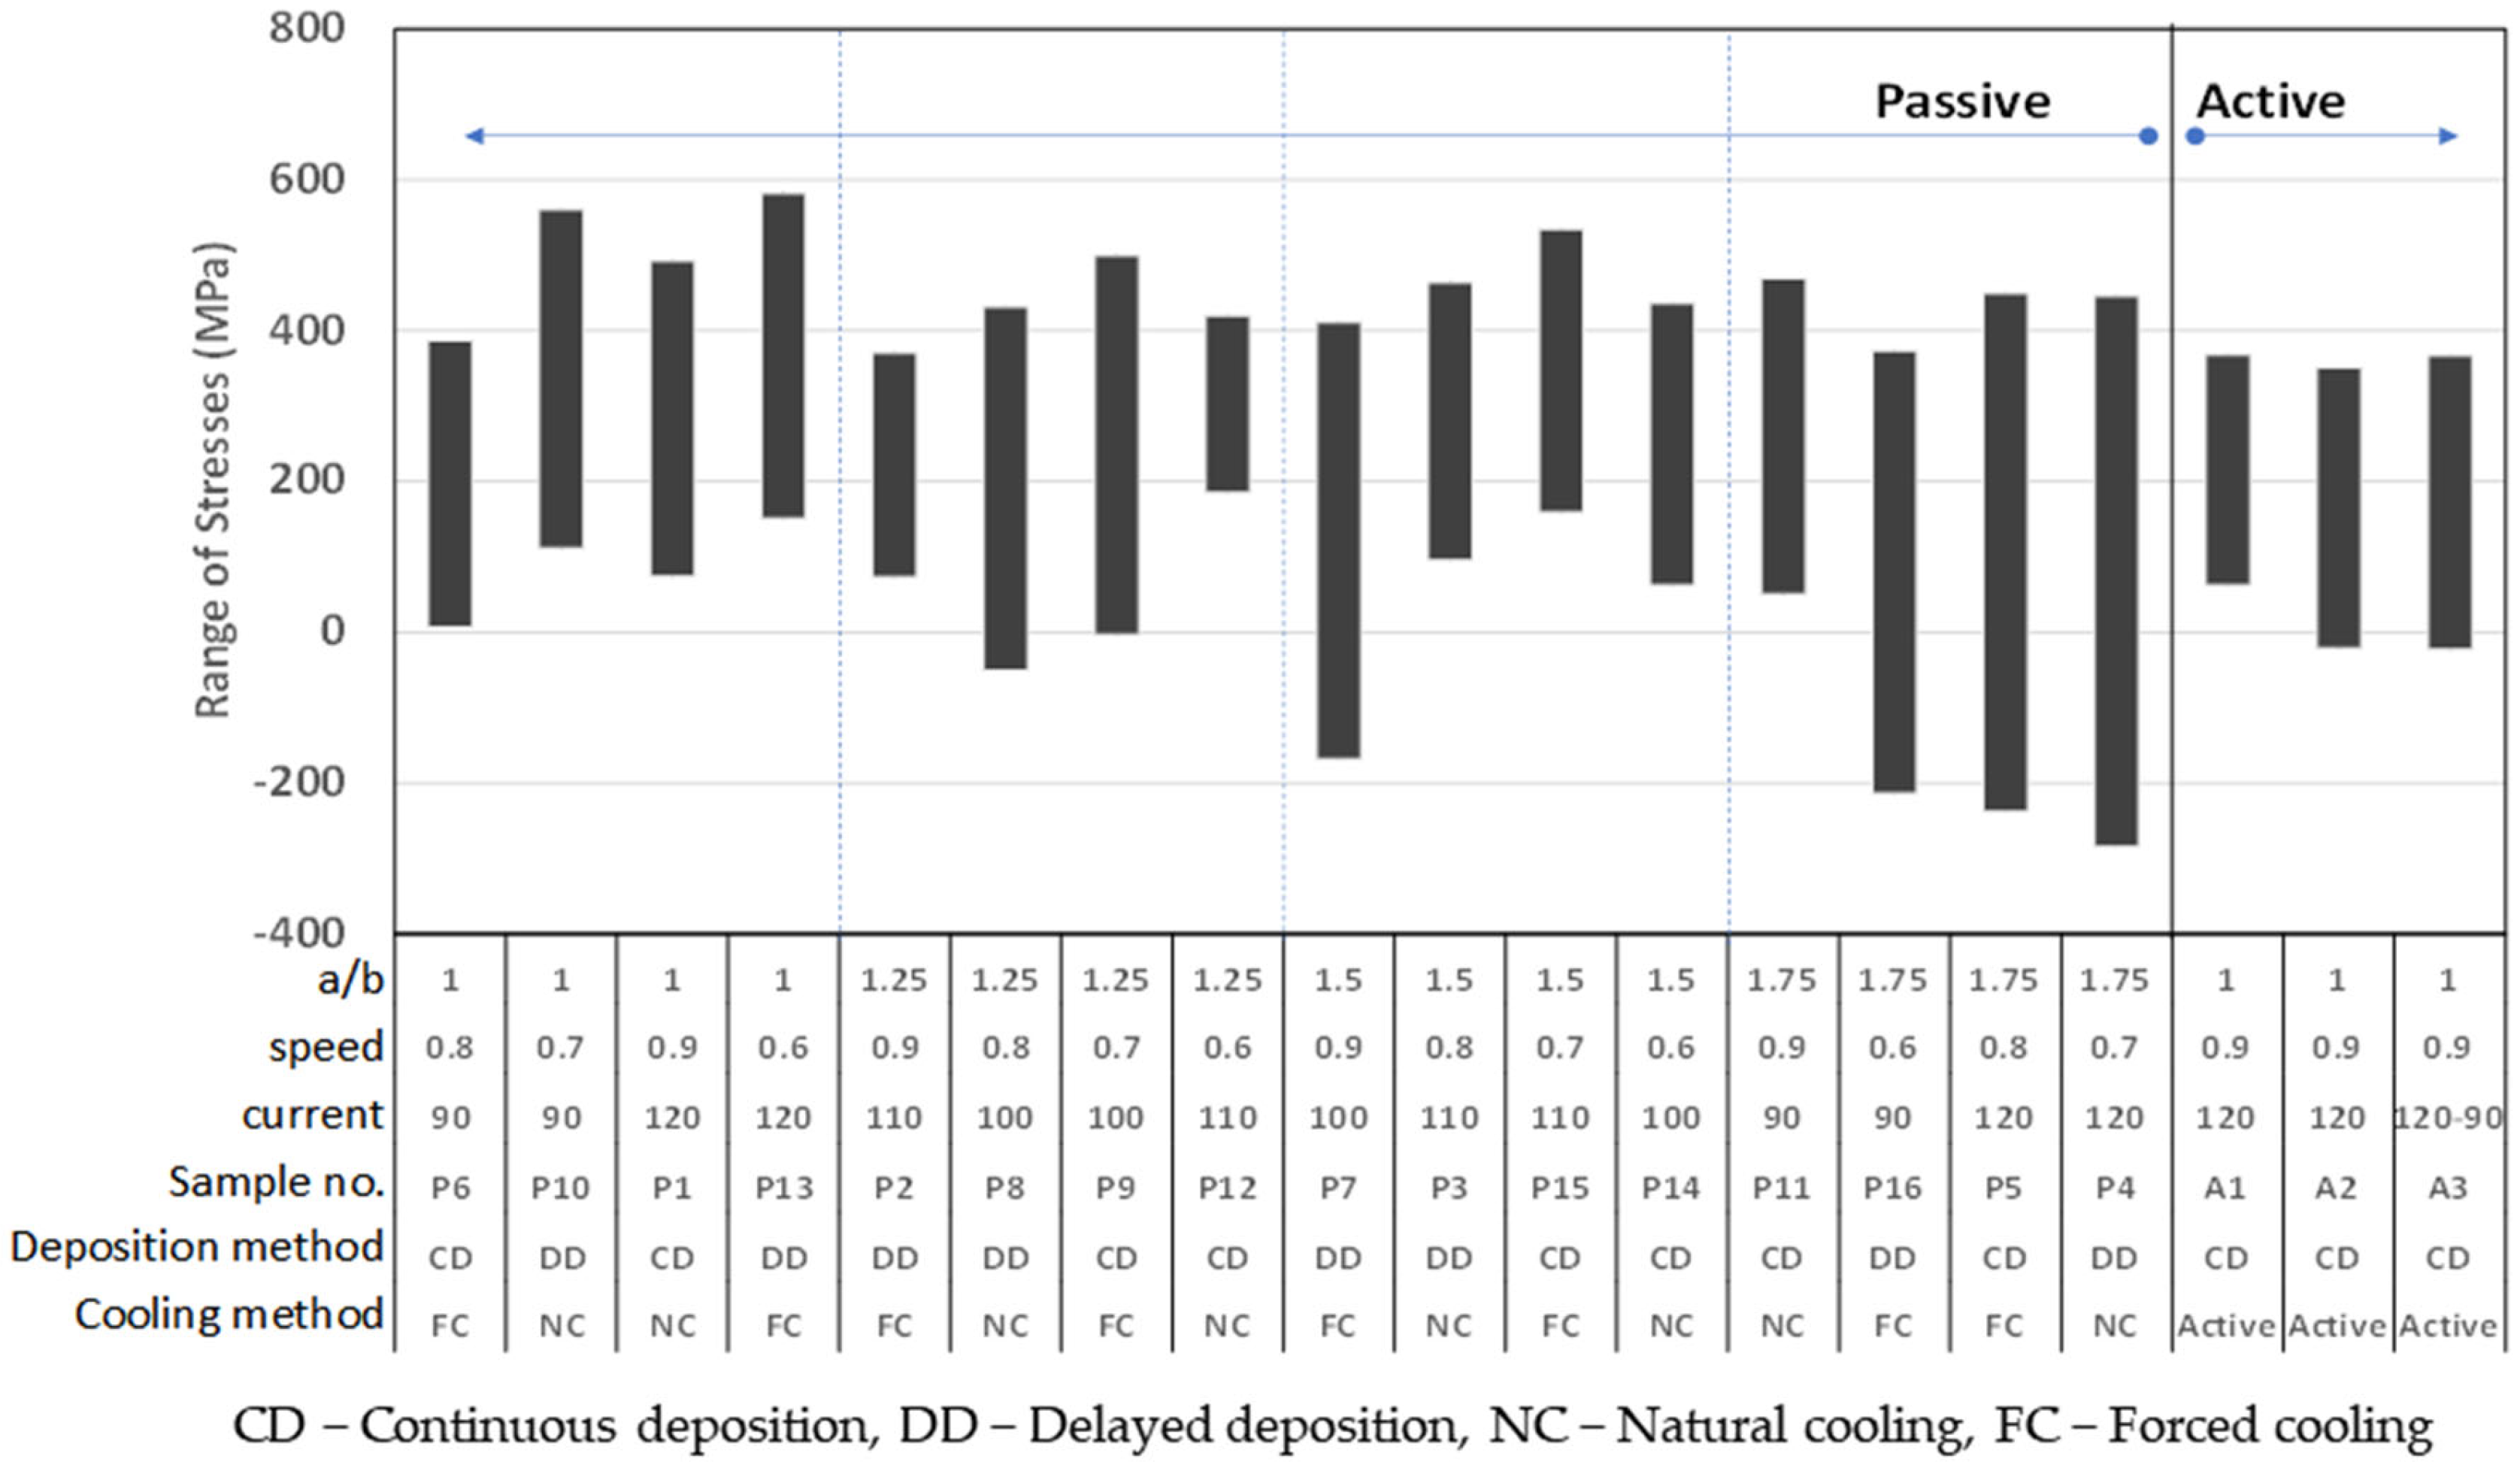
The results related to the active and passive approaches of experiments are categorized into three parts: distortion, residual stresses and hardness variation. The first two reveal the combined/bulk effect of all the deposited layers on the base plate. At the same time, the latter can give insight into the thermal evolution across the component geometry. The maximum distortion value and the range of the residual stresses for each of these samples are listed in Table 5.
4.1. Distortion with Passive and Active Thermal Management
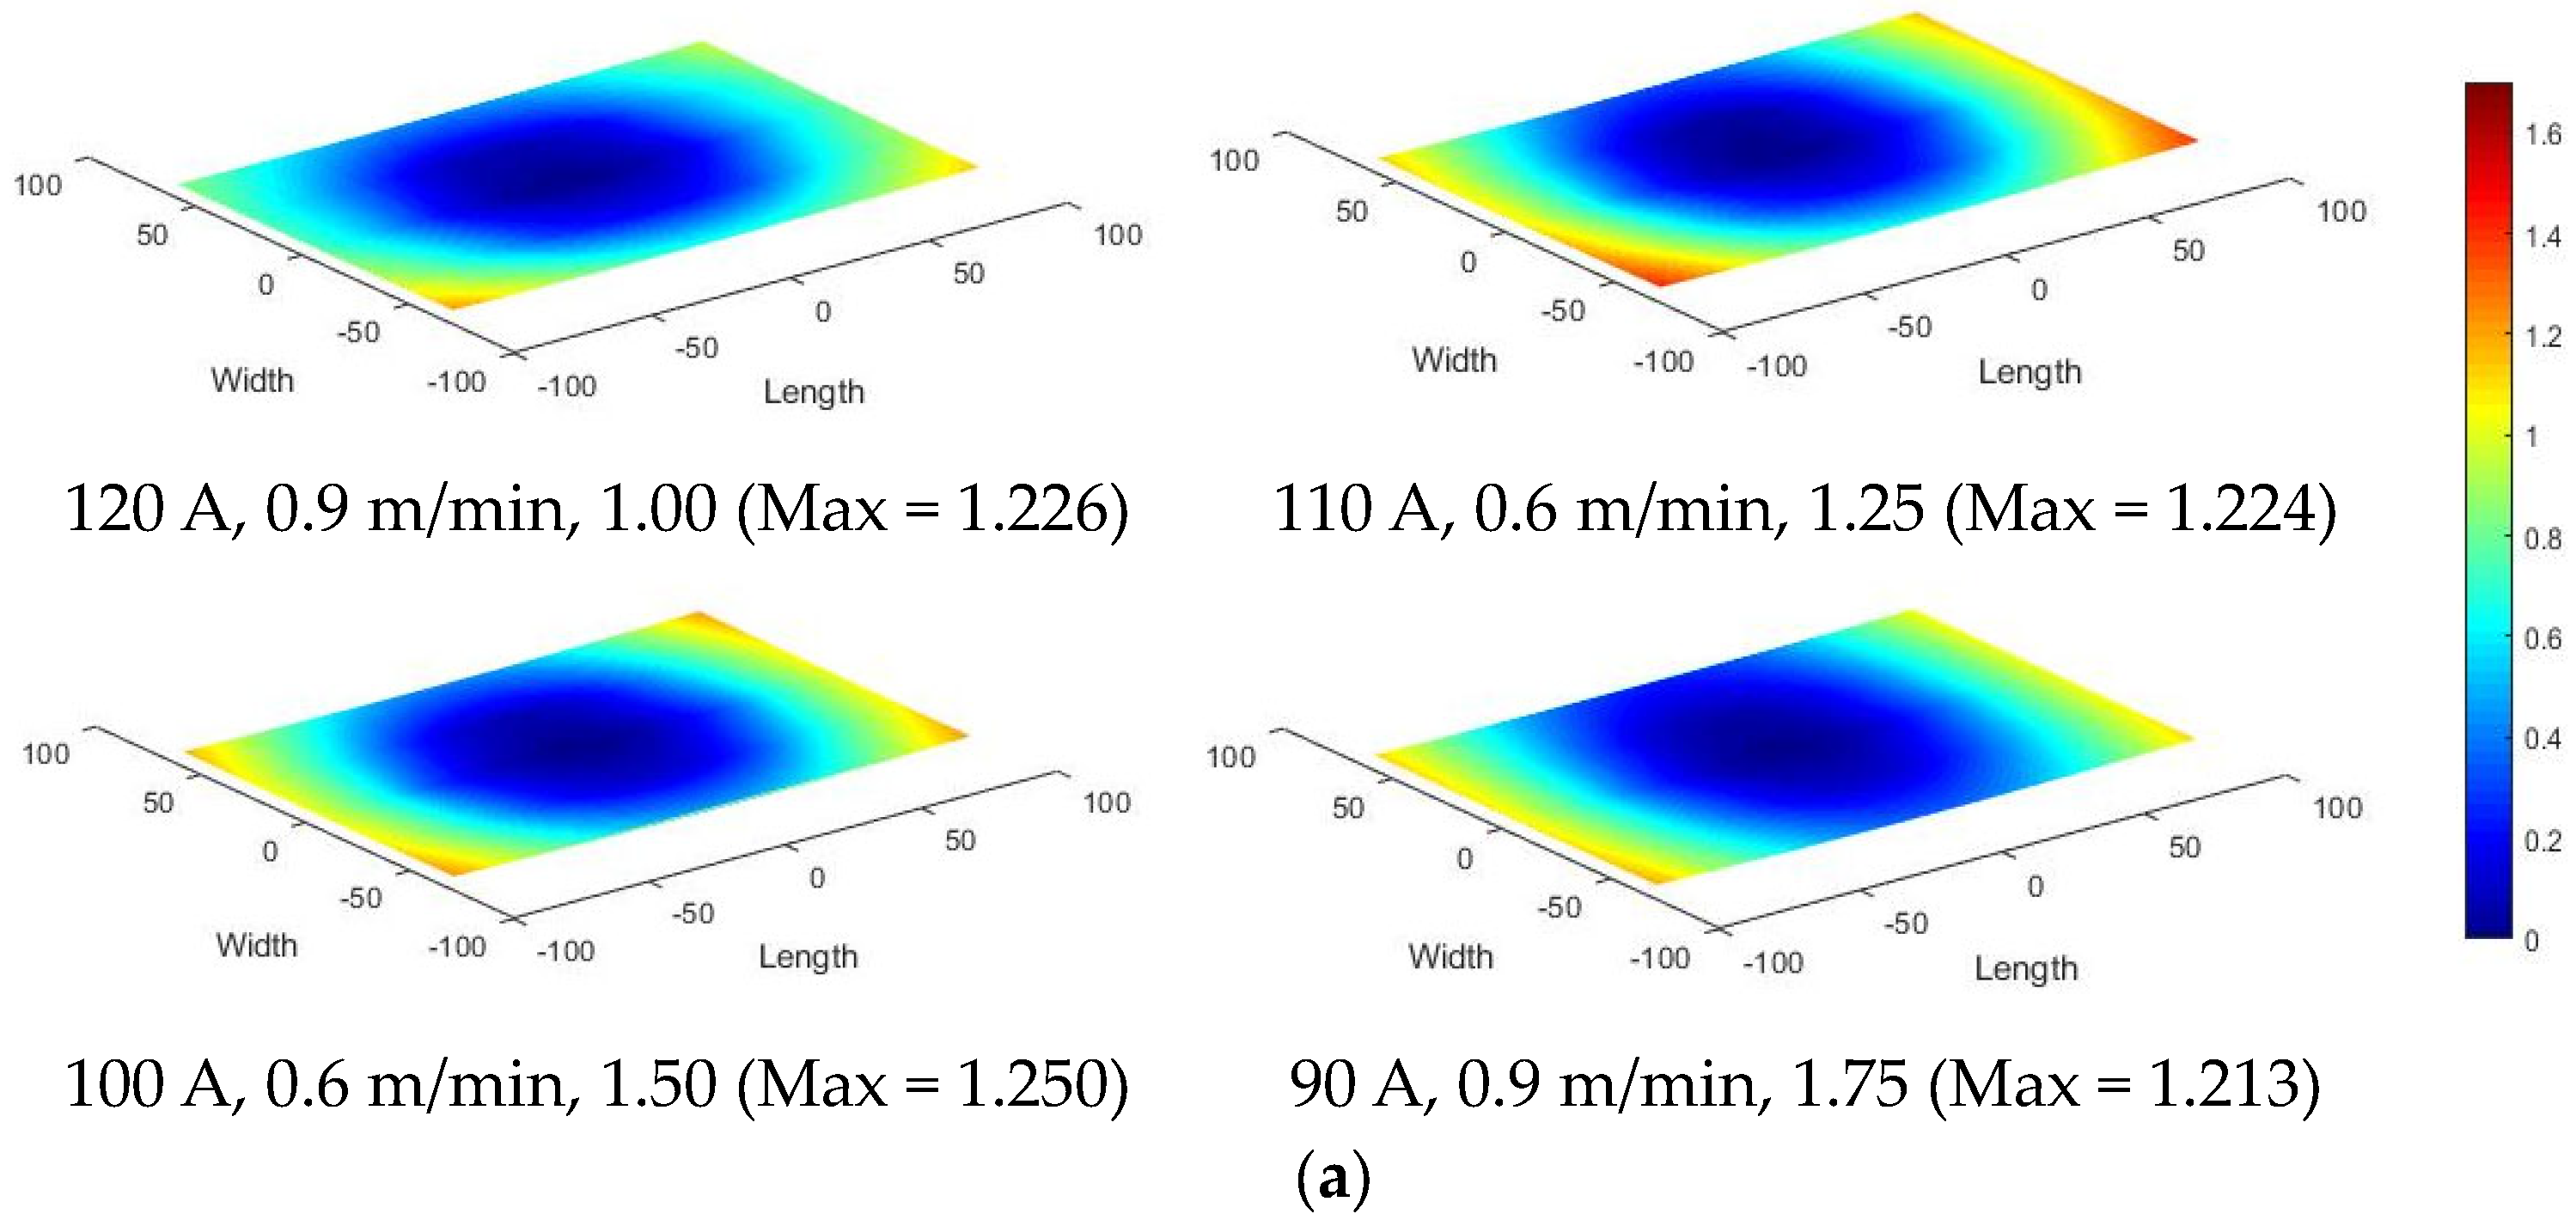
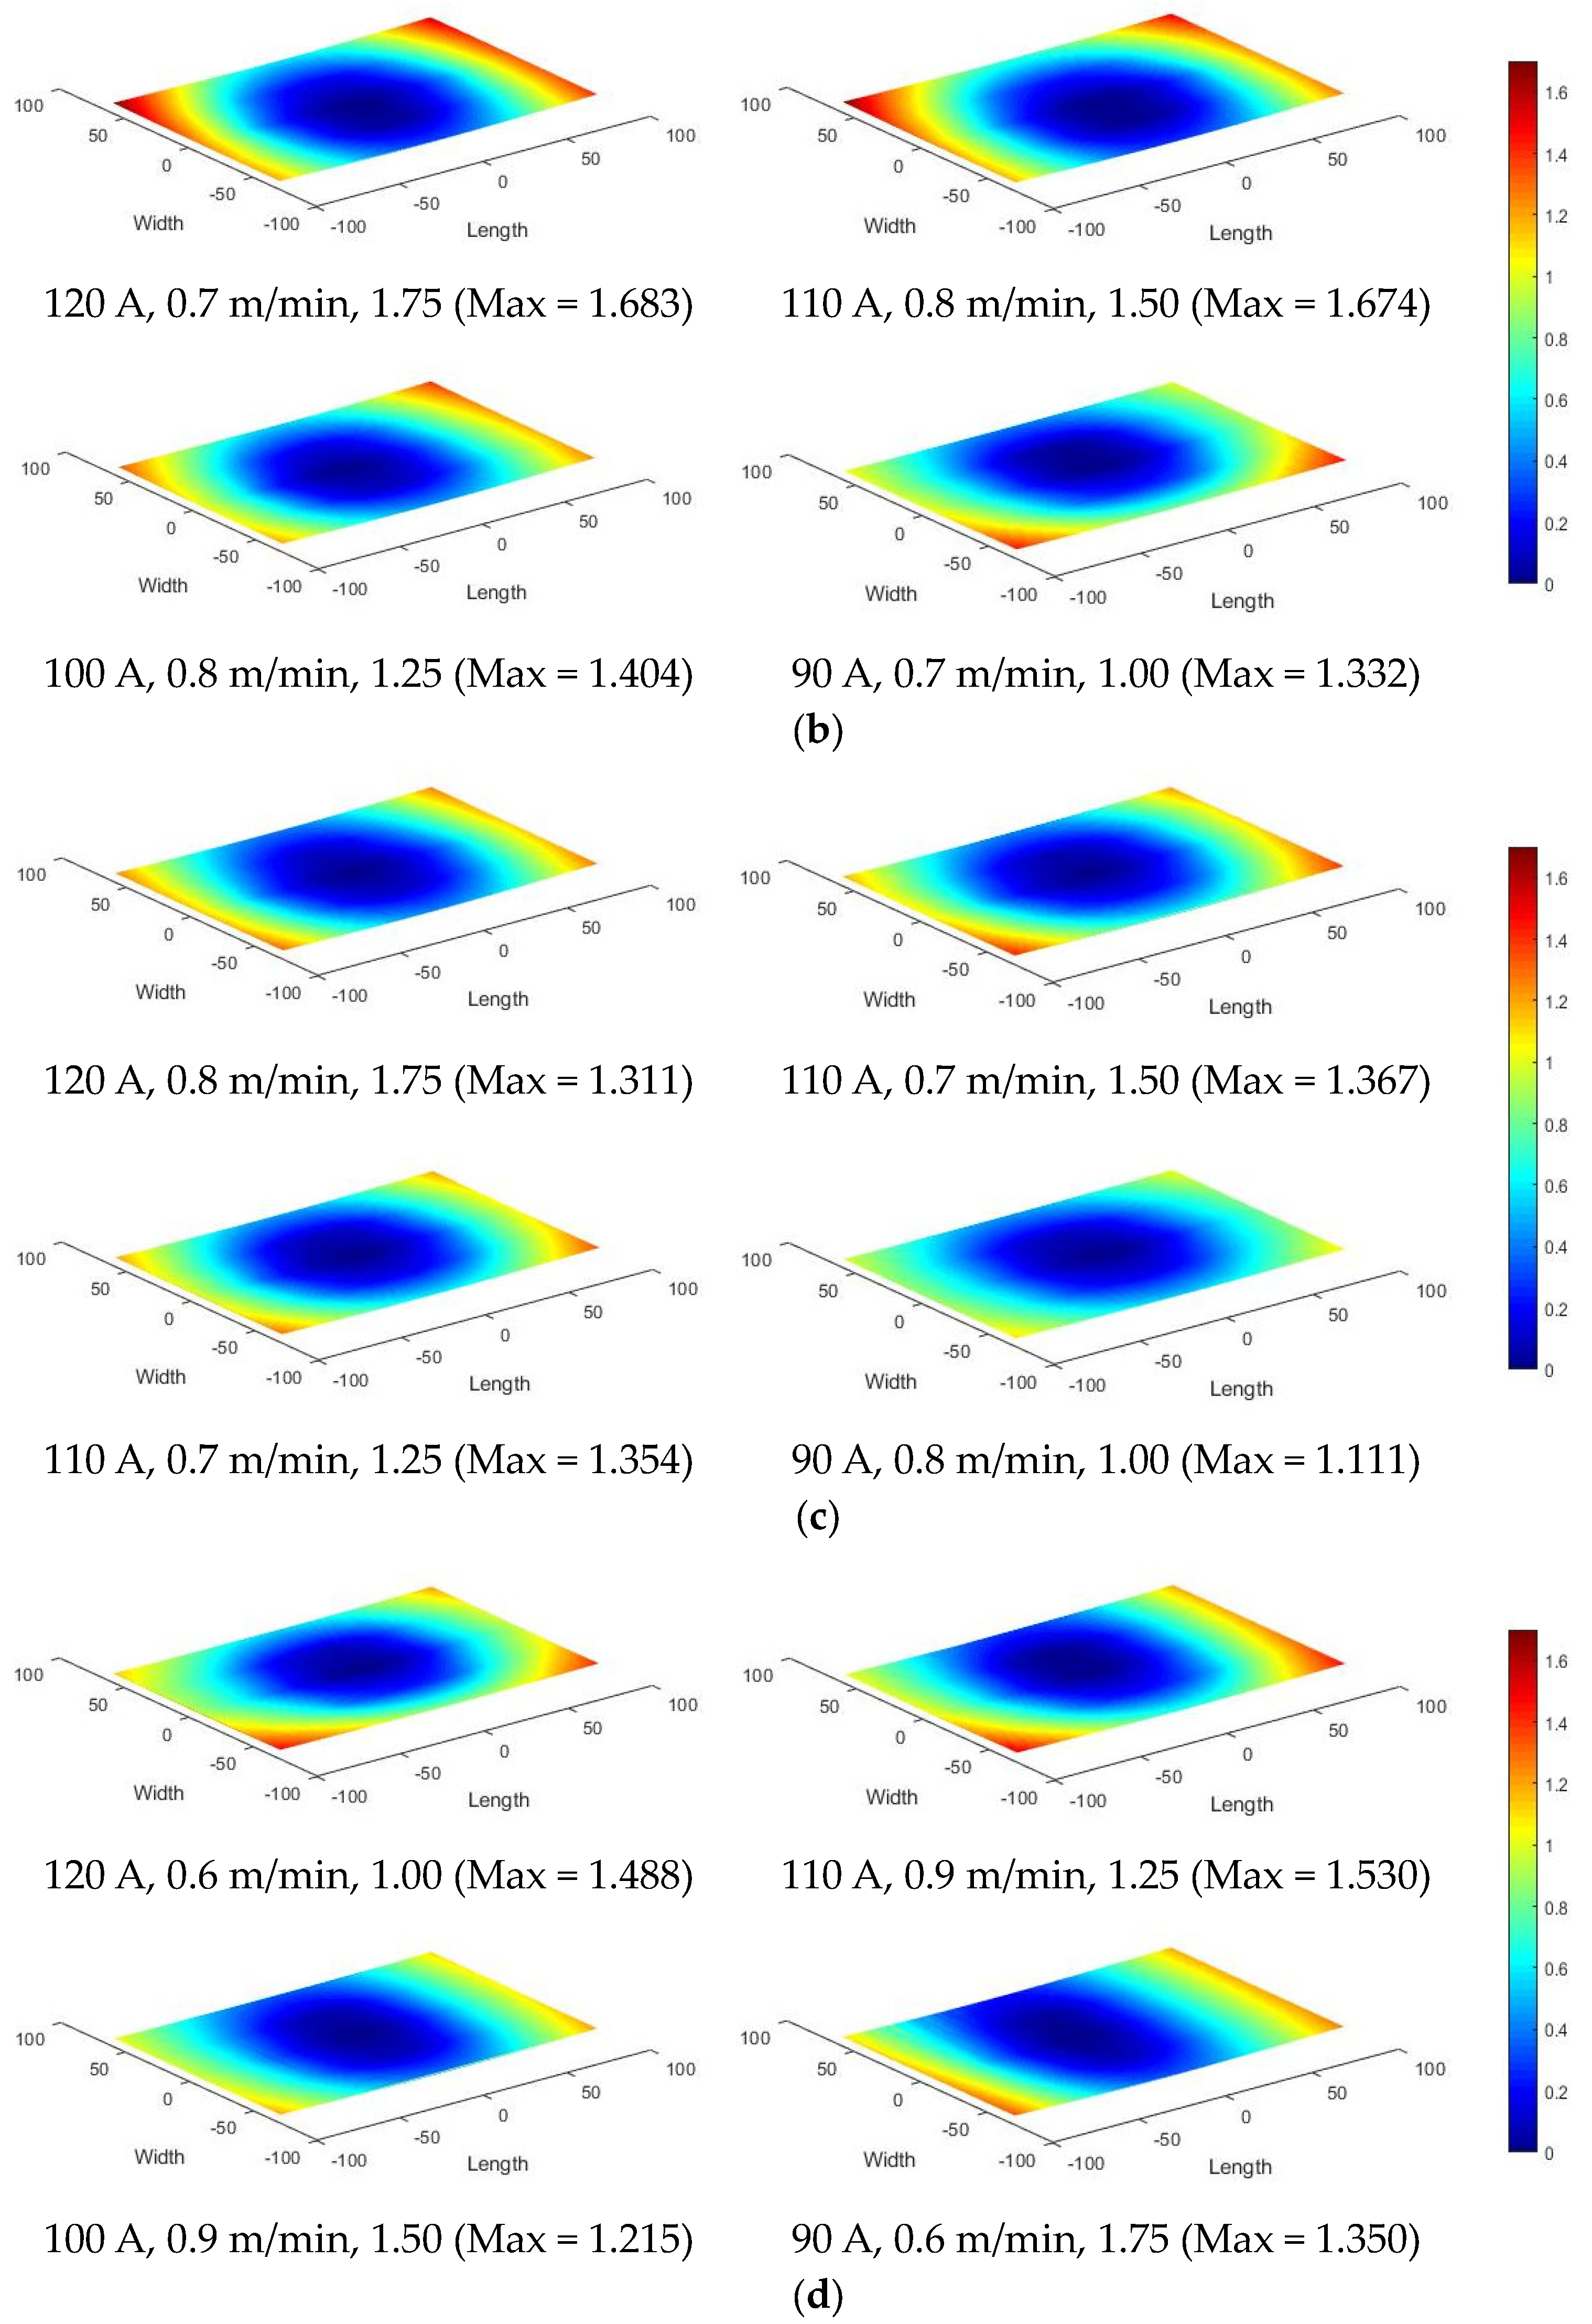
The point data from the coordinate measuring machine were used to plot the surface plots in MATLAB software (R2022a, MathWorks, Natick, MA, USA) for distortion, as shown in Figure 7. Similarly, the range of residual stresses measured across the nine points has been plotted as a bar chart. The a/b ratio was categorically a significant factor responsible for residual stresses.
The qualitative effects of process conditions on the distortion with passive thermal management are depicted by the analysis of variance (ANOVA) in Table 6. The method of cooling and deposition are categorical (non-numeric) parameters. For the ANOVA, they are represented by 0 and 1; 0 for natural cooling and continuous and 1 for forced cooling and a delay in the deposition. The ANOVA reveals that the cooling method under the current scheme of experiments does not significantly influence the distortion. The process parameters, viz., current and torch speed, are the primary factors responsible for distortion. However, continuous or delayed deposition interacts with the current and the geometry (i.e., a/b ratio). The welding parameters primarily accountable for the amount of heat and material deposition were predominant over the geometry part and method of distribution. The current and speed independently influenced the distortion while remaining influential during interaction.
The strong relation between process conditions and distortion was potential enough to be expressed as a predictive model. The process conditions and distortion relation appeared to be highly nonlinear. The box–cox transformation revealed that the −1/2 power of distortion (d) could be linearly expressed as a function of parameters under study, as shown in Equations (1) and (2). The significant main factors and interactions were identified with stepwise regression.
Continuous deposition
Delayed deposition
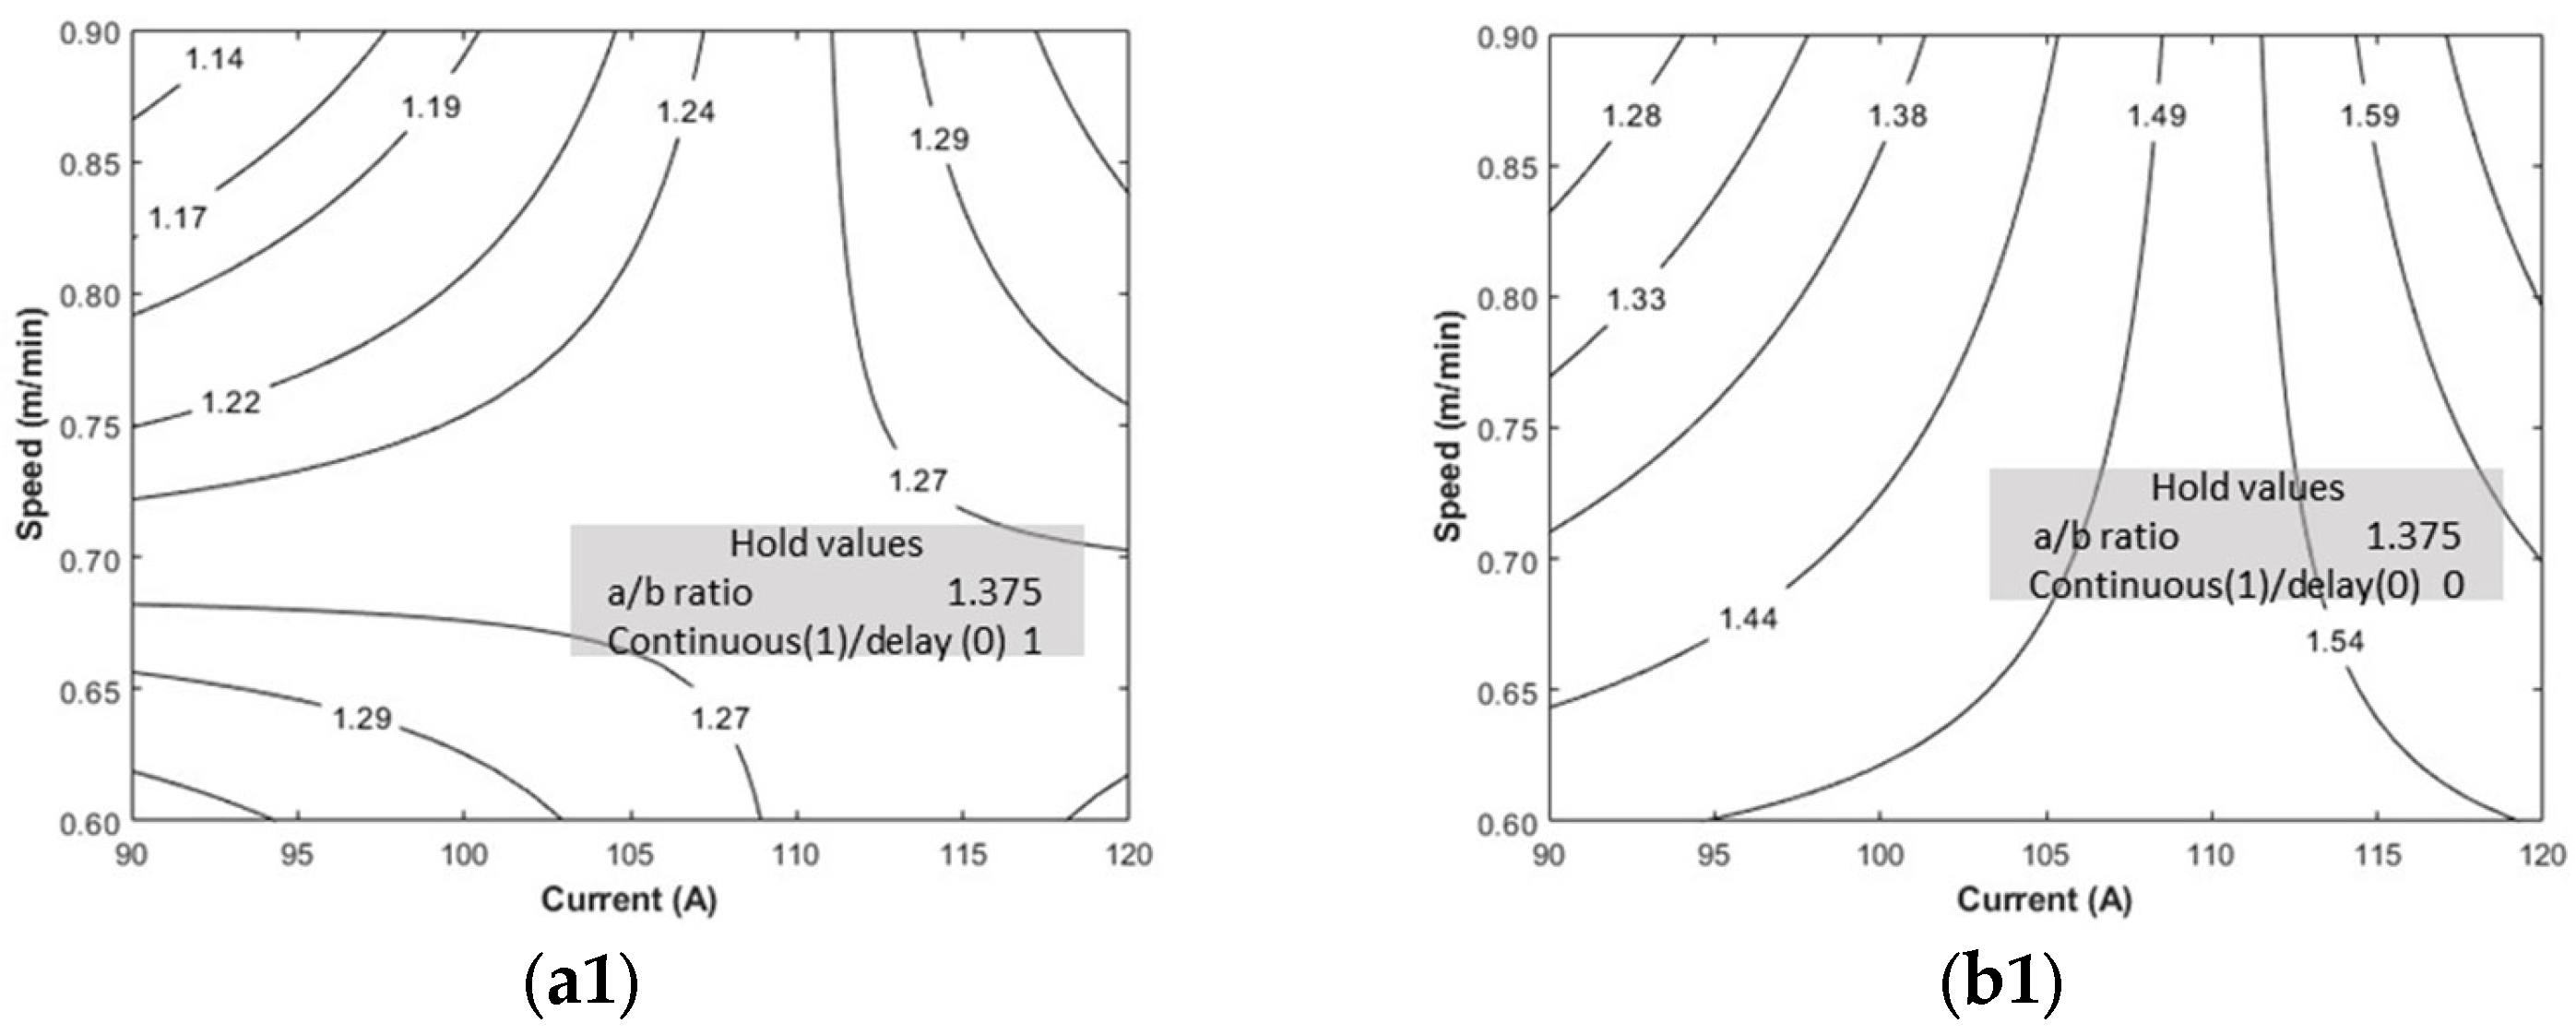
These regression equations were used to plot the interactive plots for continuous and delayed deposition, as shown in Figure 8. The plots were obtained by keeping one parameter constant in the equation as a hold value, which is the average of the high- and low-level values of the corresponding parameter. The following are some key observations that can be made:
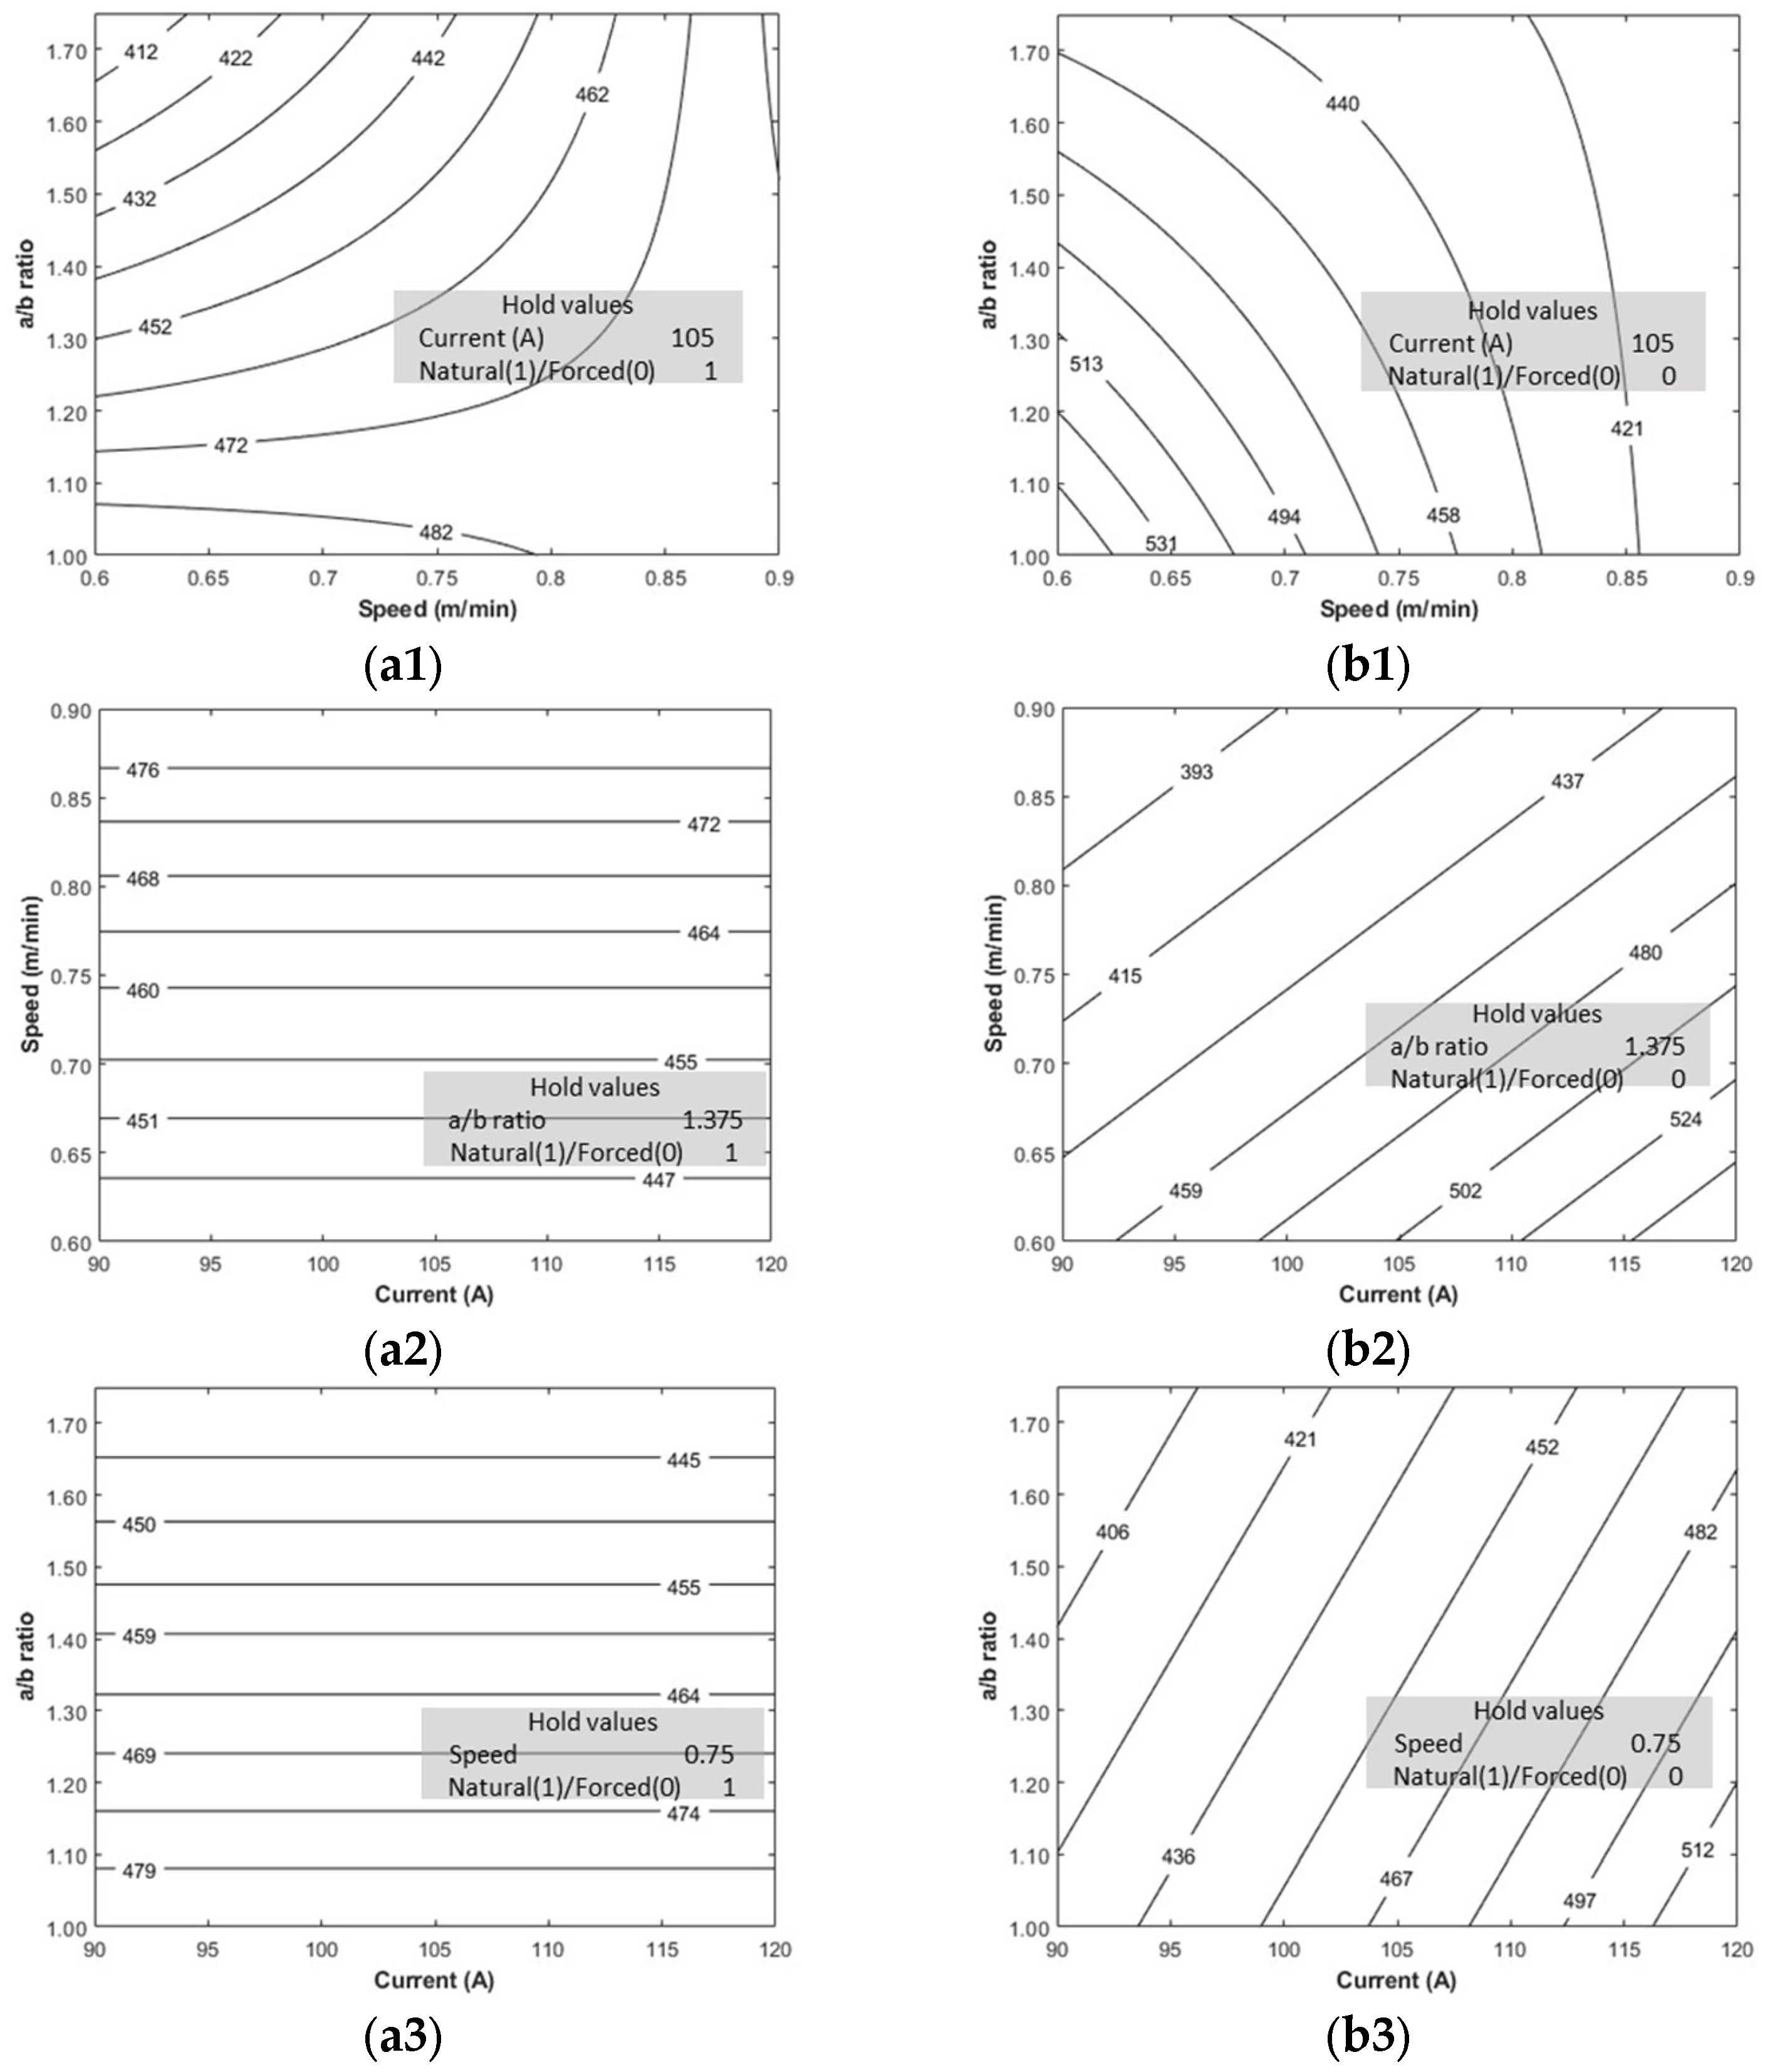
Torch speed vs. current plot, fixed geometry (Figure 8(a1,b1)): From this plot, it can be inferred that for a given geometry with either mode of deposition (continuous or delayed), the best way to minimize the distortion is to decrease the current, increase the torch speed or both. In other words, it manages the heat input rate; if the heat input is low and spreads faster, the result is lower thermal gradients and distortion.
Aspect ratio vs. current, fixed torch speed (Figure 8(a2,b2)): The distortion for a given speed increases with the current increase due to higher heat input causing more significant thermal gradients, which increase the distortion. Distortion also increases with the a/b ratio when the deposition is continuous. The higher a/b ratio leads to skewing of the shape, which may result in a nonhomogeneous concentration of heat across the geometry. However, this was not the case with delayed deposition, as the adequate cooling time between layers provides ample scope for the homogeneous spread of heat.
Aspect ratio vs. torch speed, fixed current: (Figure 8(a3,b3)): The behaviour, in this case, is very similar to that of the earlier in terms of the a/b ratio. As the torch speed increases, the heat distributes faster, decreasing the thermal gradients and the distortions. Hence, it can be observed that as the torch speed moves faster, the maximum distortion decreases.
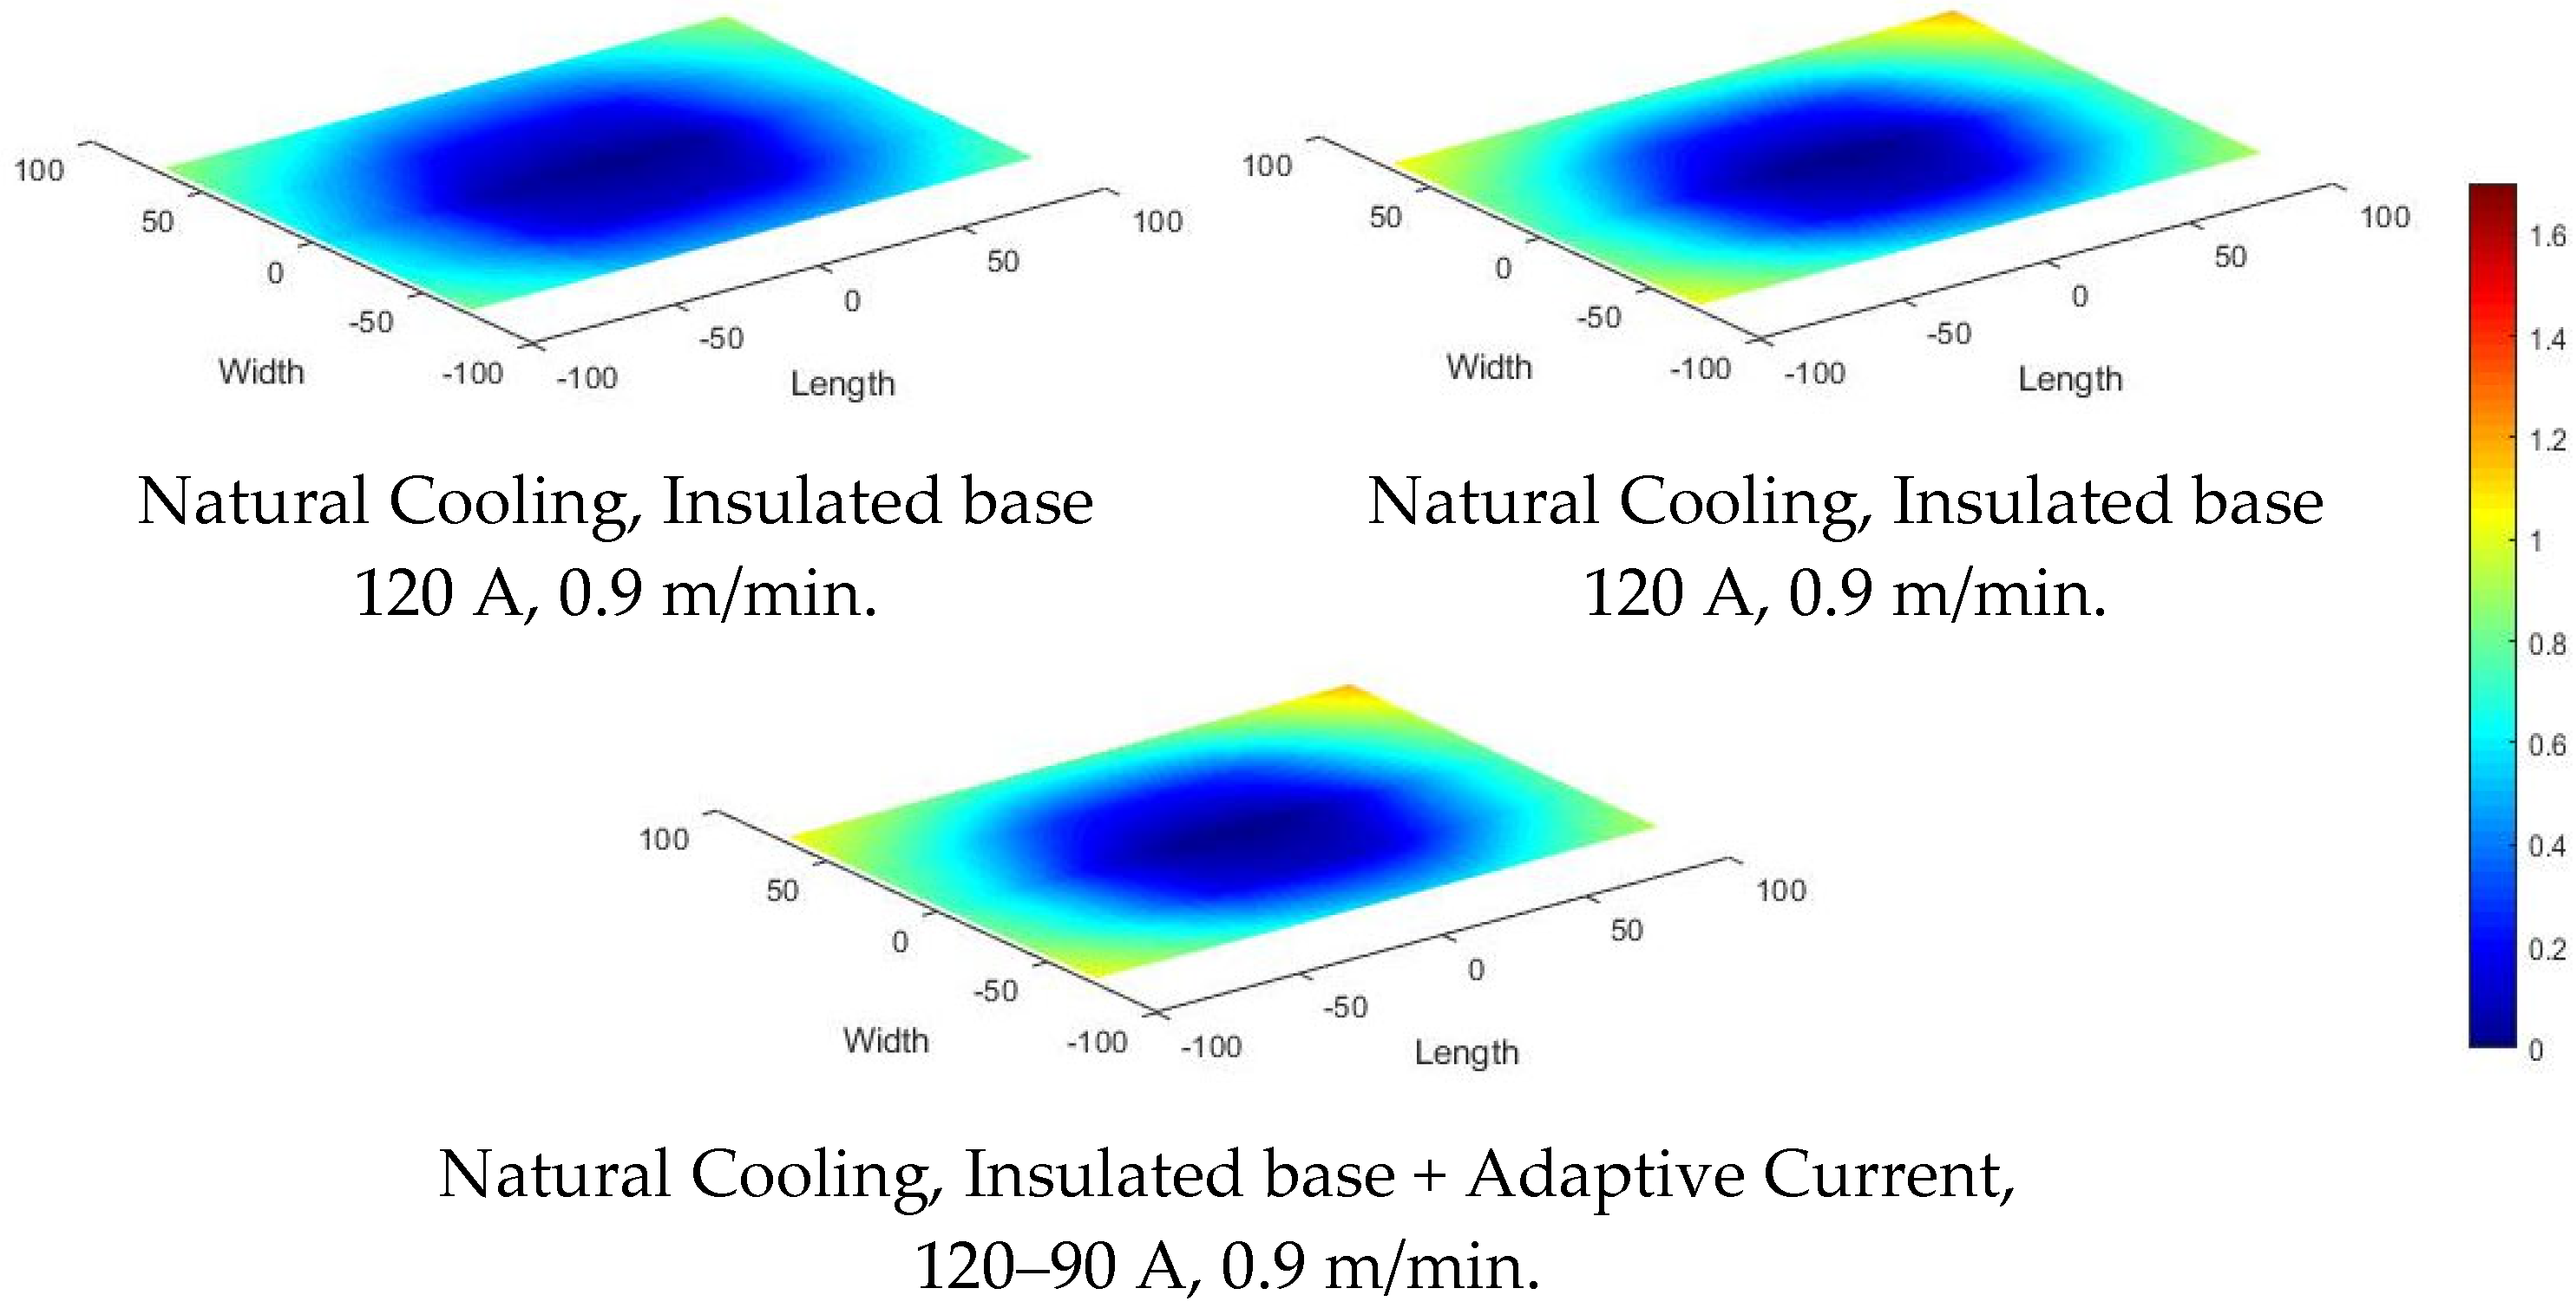
Figure 9 shows the distortion plots for an active management set of experiments. The overall impact of active management is a significant reduction in distortion. The distortion with active management decreases to 0.5 mm from 1.35 mm with passive management. Among the active methods, the distortion is minimum for the insulated and heated substrate (case A1) compared to the others. In the case of A3, the current was adaptively varied across the layers while maintaining the current/speed ratio as a constant. It was done with the expectation of negating the cumulative heat accumulation through a corresponding decrease in the current (and heat input). However, as seen from the results, this case had the maximum distortion. The possible reasons for this failure of adaptive change in the current are further discussed in the next section, along with simulation results. From the above experiments and analysis, it can be inferred that:
- Distortion is lower for continuous deposition than with an interlayer delay. This is possibly due to the progressive nature of the thermal evolution (in continuous deposition) against the intermittent kind (in delayed deposit).
- Low current and/or high torch speed help decrease the thermal peaks and distortions.
- With the continual accumulation of heat, the aspect ratio was found to have no significant effect in the case of continuous deposition. However, it was observed to be influencing the distortions in the case of delayed deposit.
4.2. Residual Stresses with Passive and Active Thermal Management
The residual stresses vary over the plate surface. The range of variation differs for different experimental conditions (Figure 10). The welding process parameters, geometry, and cooling method influence the residual stress. The a/b ratio is categorically a significant factor responsible for residual stresses.
With an increase in aspect ratio, the stress bands widen but shift from tensile to compressive sides, which is a good indication. Compressive residual stress helps in delaying crack propagation. However, the maximum value of residual stress decides the overall structural integrity. The precise and collective effect of the experimental conditions on the maximum residual stress is assessed through the ANOVA in Table 7.
Unlike distortion, the welding current does not affect the maximum residual stress. The speed and aspect ratio plays a significant role, which can be established from the lower p-value in the ANOVA. Unlike the distortion, the cooling method, instead of the deposition method, is substantial in the ANOVA of maximum residual stress. Table 7 shows the ANOVA model adequacy of 99.44%, which makes a strong case for predictive Equations (3) and (4) of maximum residual stress (rmax) as follows:
Natural cooling
Forced cooling
Based on the regression Equations (3) and (4), a contour plot for stress disparity is plotted and shown in Figure 11. It can be observed from Figure 11 that residual stress strongly depends on the a/b ratio and speed for forced and natural cooling (Figure 11(a1,b1), respectively). As the torch speed increases, the heat is distributed faster, decreasing the thermal gradients and the stresses. When the geometry is closer to a circular form, the thermal energy accumulates at the centre, leading to higher residual stresses. The stresses for a given set of speed and a/b ratio are more with forced cooling than natural cooling. The forced cooling traps the stresses, which is not the case with natural cooling.
The welding current influences the residual stress when forced cooling is applied (Figure 11(a2,a3)). The residual stresses increase with the increase in current because of increased heat input. The current’s effect, within the range of experiments, does not appear with the natural cooling (Figure 11(b2,b3)) because the heat dissipates slowly.
The residual stress is impacted by active thermal management. Compared to passive management, the range of residual stress over the plate shrinks (Figure 10). The stresses are uniformly distributed. The average maximum residual stress comes down by 100 because of passive management. The residual stress is minimum for the insulated–heated substrate (case A1) compared to others. The preheating may result in stress relieving of the original plate; additionally, as the deposition is performed in the heated condition, the thermal gradients are remarkably reduced.
4.3. Hardness Variation with Passive and Active Thermal Management
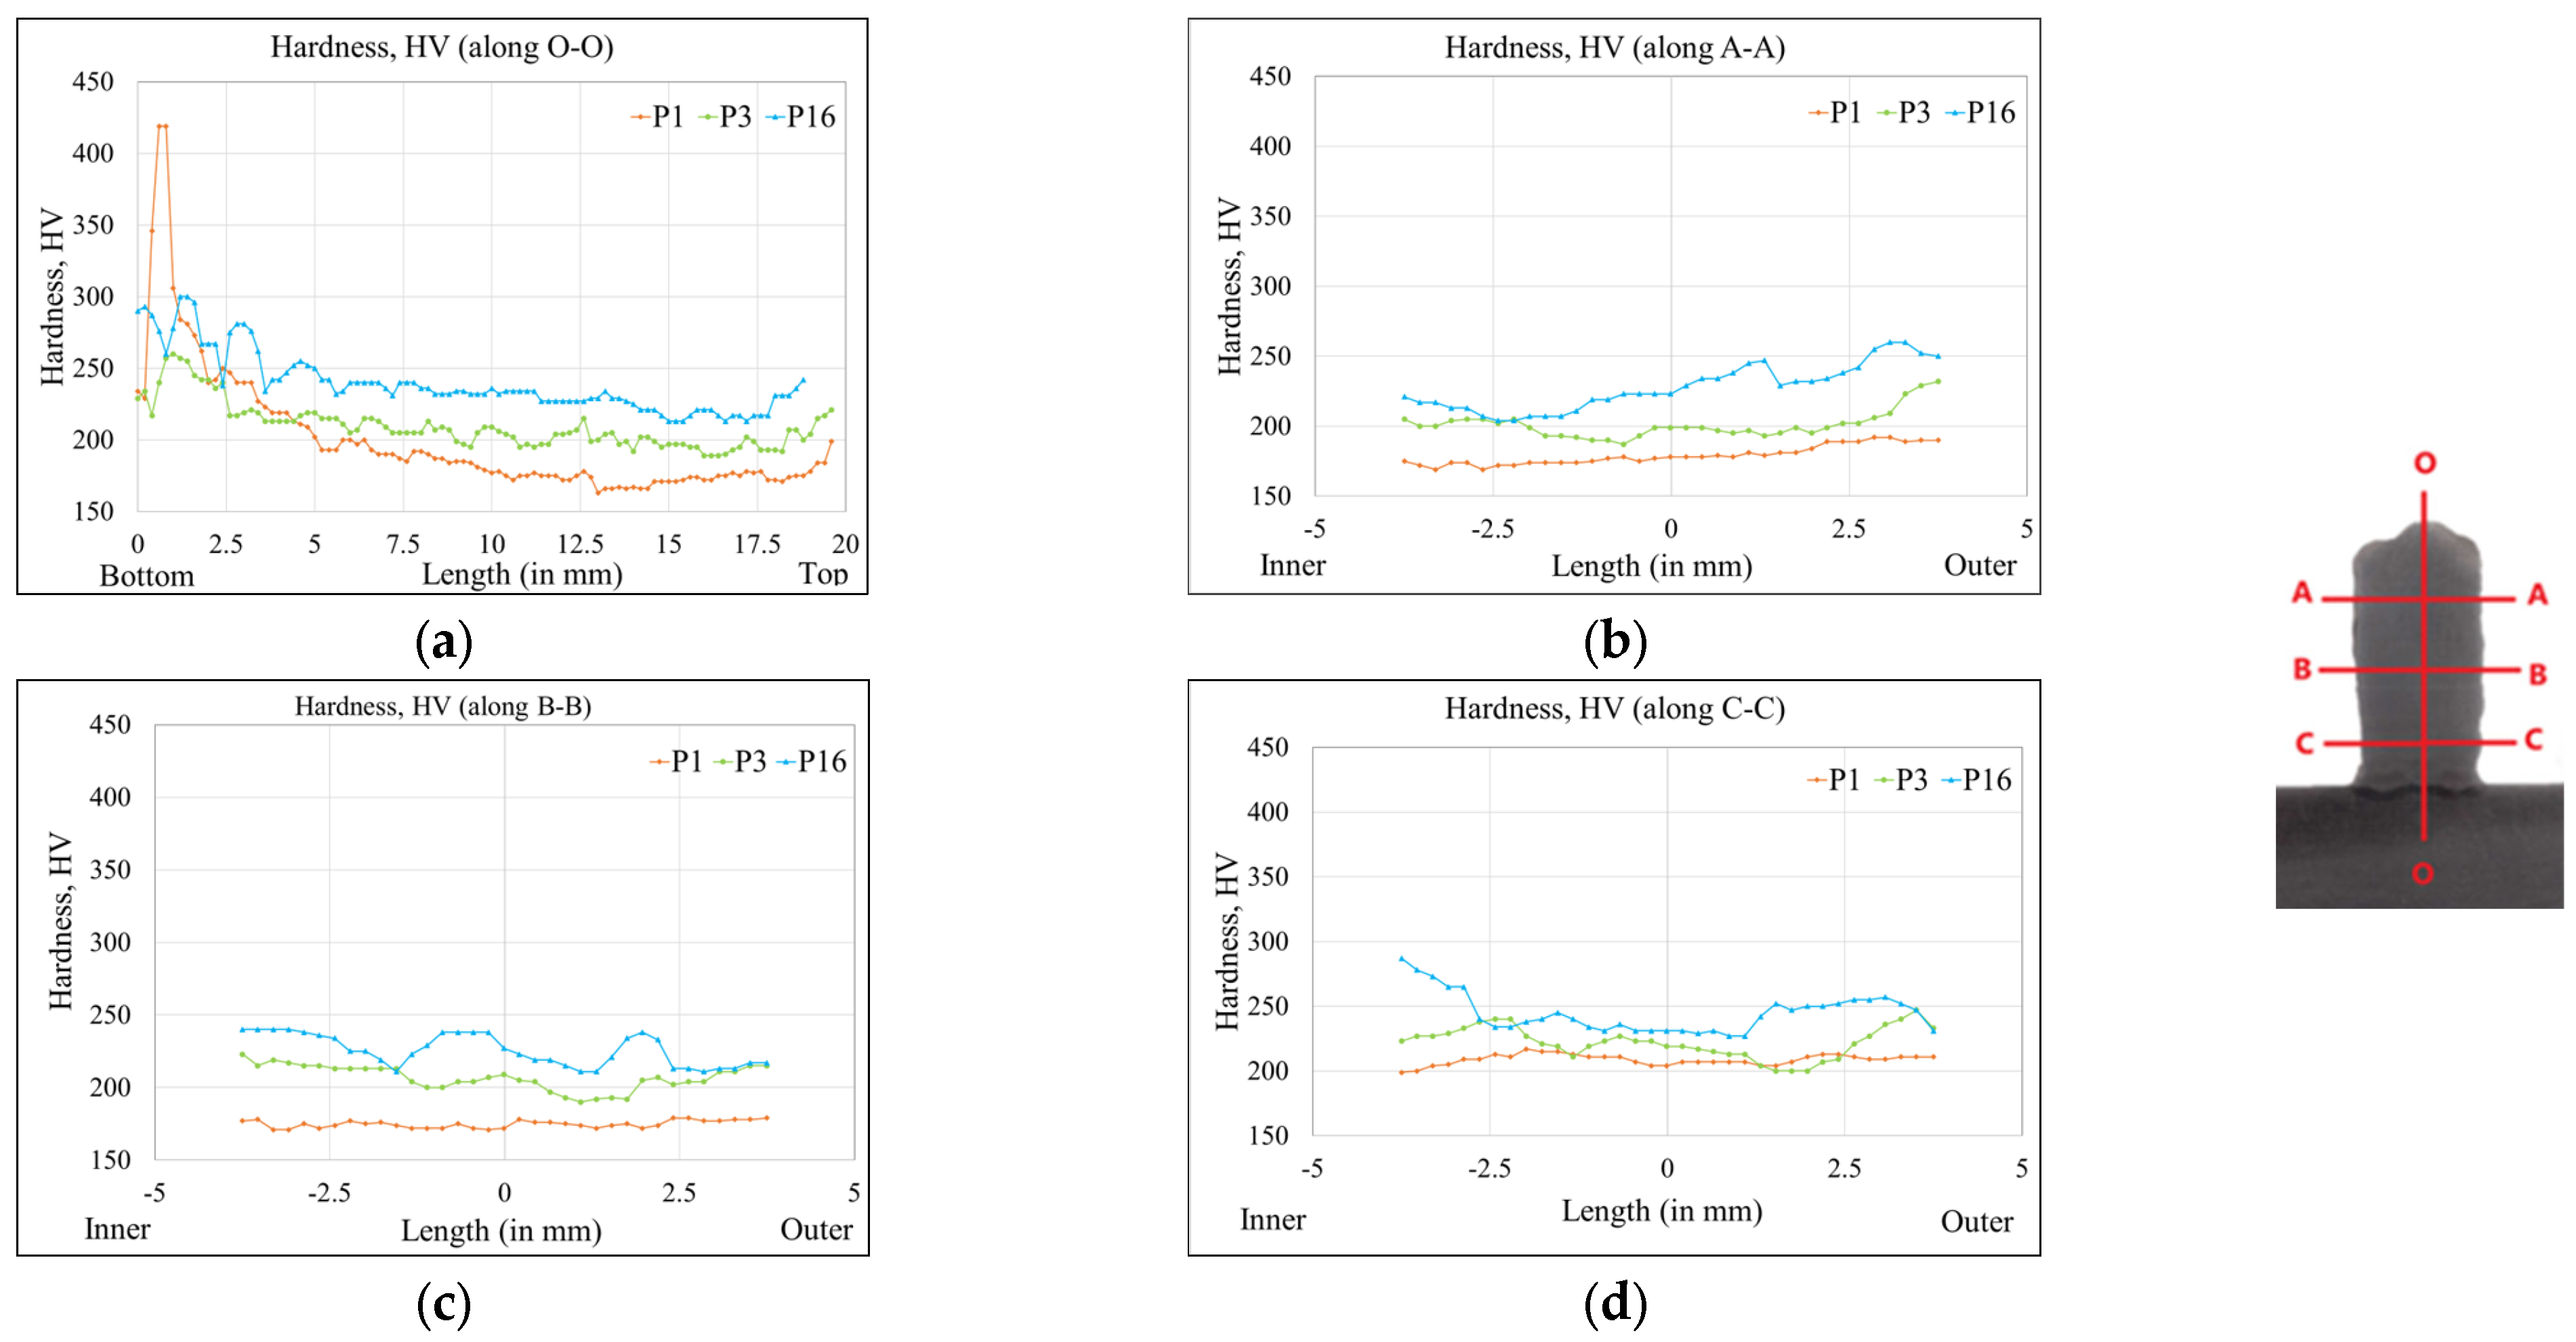
As additive manufacturing is a process in which the component is gradually fabricated, the deposition sequence is also a parameter to be factored in. To understand how the sequence of steps affects the properties of the fabricated component, the hardness variation across the cross-section for three samples (P1, P3, P16) from the above set, indicative of a different rate of cooling, was carried out. Hardness was measured across the height along the centerline (O−O) and three places (randomly at A−A, B−B, and C−C) across the width of the sample, as shown in Figure 12.
It is observed that forced cooling always shows a higher hardness than others. This is possible due to the rapid rate of cooling. Normal cooling with a delay shows the intermediate values as the delay keeps the remaining part of the component at a lower temperature, facilitating faster cooling. Normal cooling with continuous deposition is subjected to continuous heat built up in the component leading to slower cooling rates.
Along O–O, for all three cases, the hardness is highest in the initial layers and gradually decreases for the subsequent layers. It is found to be slightly increasing again in the final layer. This might be due to the faster cooling rates at the bottom (close to the base plate) and top (higher radiation losses). The hardness variation is insignificant along the horizontal lines, i.e., A–A, B–B and C–C. However, the centre portion generally tended to be of lower hardness than the outer regions. This might be due to the centre portion being the last to be deposited and, hence, subjected to higher thermal gradients.
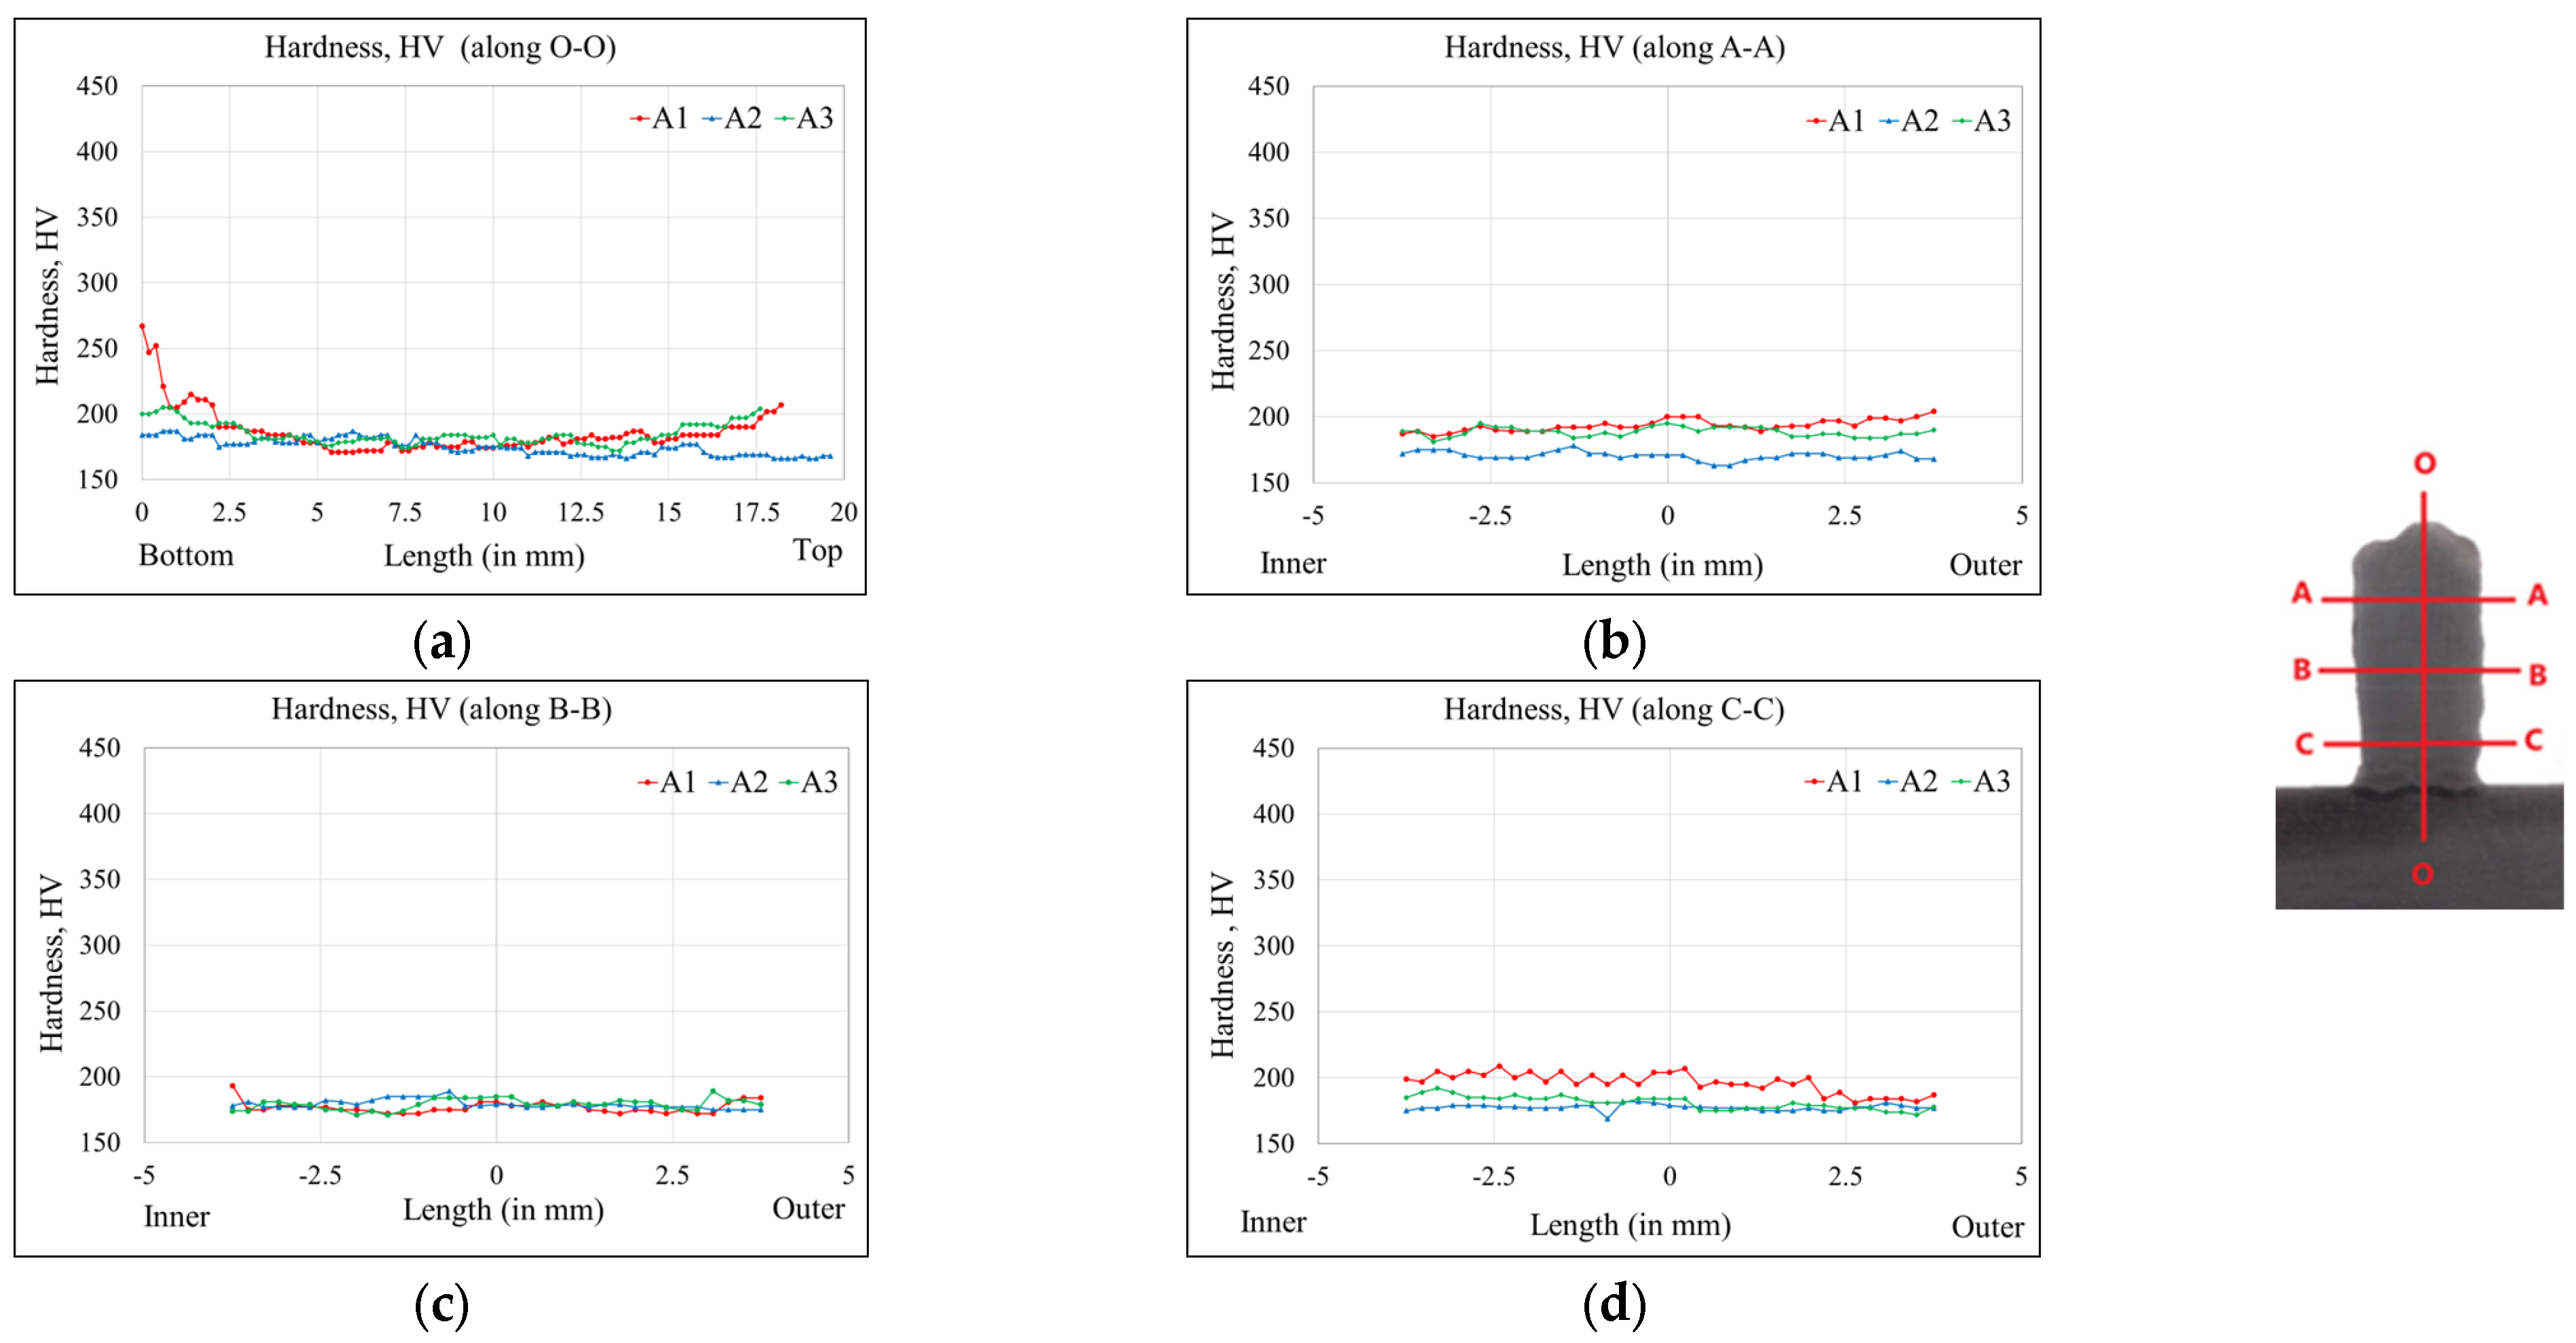
Figure 13 summarizes the hardness across the cross-section for active management cases. The hardness values are not significantly different for the three cases, although they have different predeposition thermal conditions. This implies that the cooling rate is more influential in determining the component’s properties than the heat quantity. Similar observations are made in the previous study on managing the properties by influencing the cooling rate [16]. The active cooling homogenizes the internal structure of the workpiece. Compared to the passive cooling (Figure 12), the hardness variation in the build (Figure 13a) and thickness (Figure 13b–d) direction is remarkably reduced. A particular observation is vital about the through-thickness variation in hardness. Until a few more layers are deposited over it, a layer is rapidly cooled by radiative and convective cooling. The radiative and convective cooling coefficients remain higher at higher temperatures. After that, the layers are reheated slower in the range of annealing temperatures that soften the structure. The radiative and convective cooling differs from the inner surface to the outer surface of the cylindrical deposition as in the present case. The inner surface sees itself while the outer surface sees the surroundings and, thus, cools fast. The faster cooling reflects on the higher hardness of the top outer surface compared to the inner surface along the A–A line in Figure 12b. A similar hardness variation with active cooling is not observed because of the active thermal management (Figure 13b).
4.4. Intralayer and Interlayer Thermal Evolution
To further corroborate and understand the results of the experimental studies described in the earlier section, modelling of the deposition process was carried out using Simufact Welding Software (Simufact Welding v7.1, Simufact Engineering GmbH, Hamburg, Germany). The simulation was performed for all the cases of active management, as follows:
- Insulated substrate (Natural cooling, continuous, 120 A, 0.9 m/min, 1.0)
- Insulated + heated substrate (Natural cooling, heated substrate (400 °C), continuous, 120 A, 0.9 m/min, 1.0)
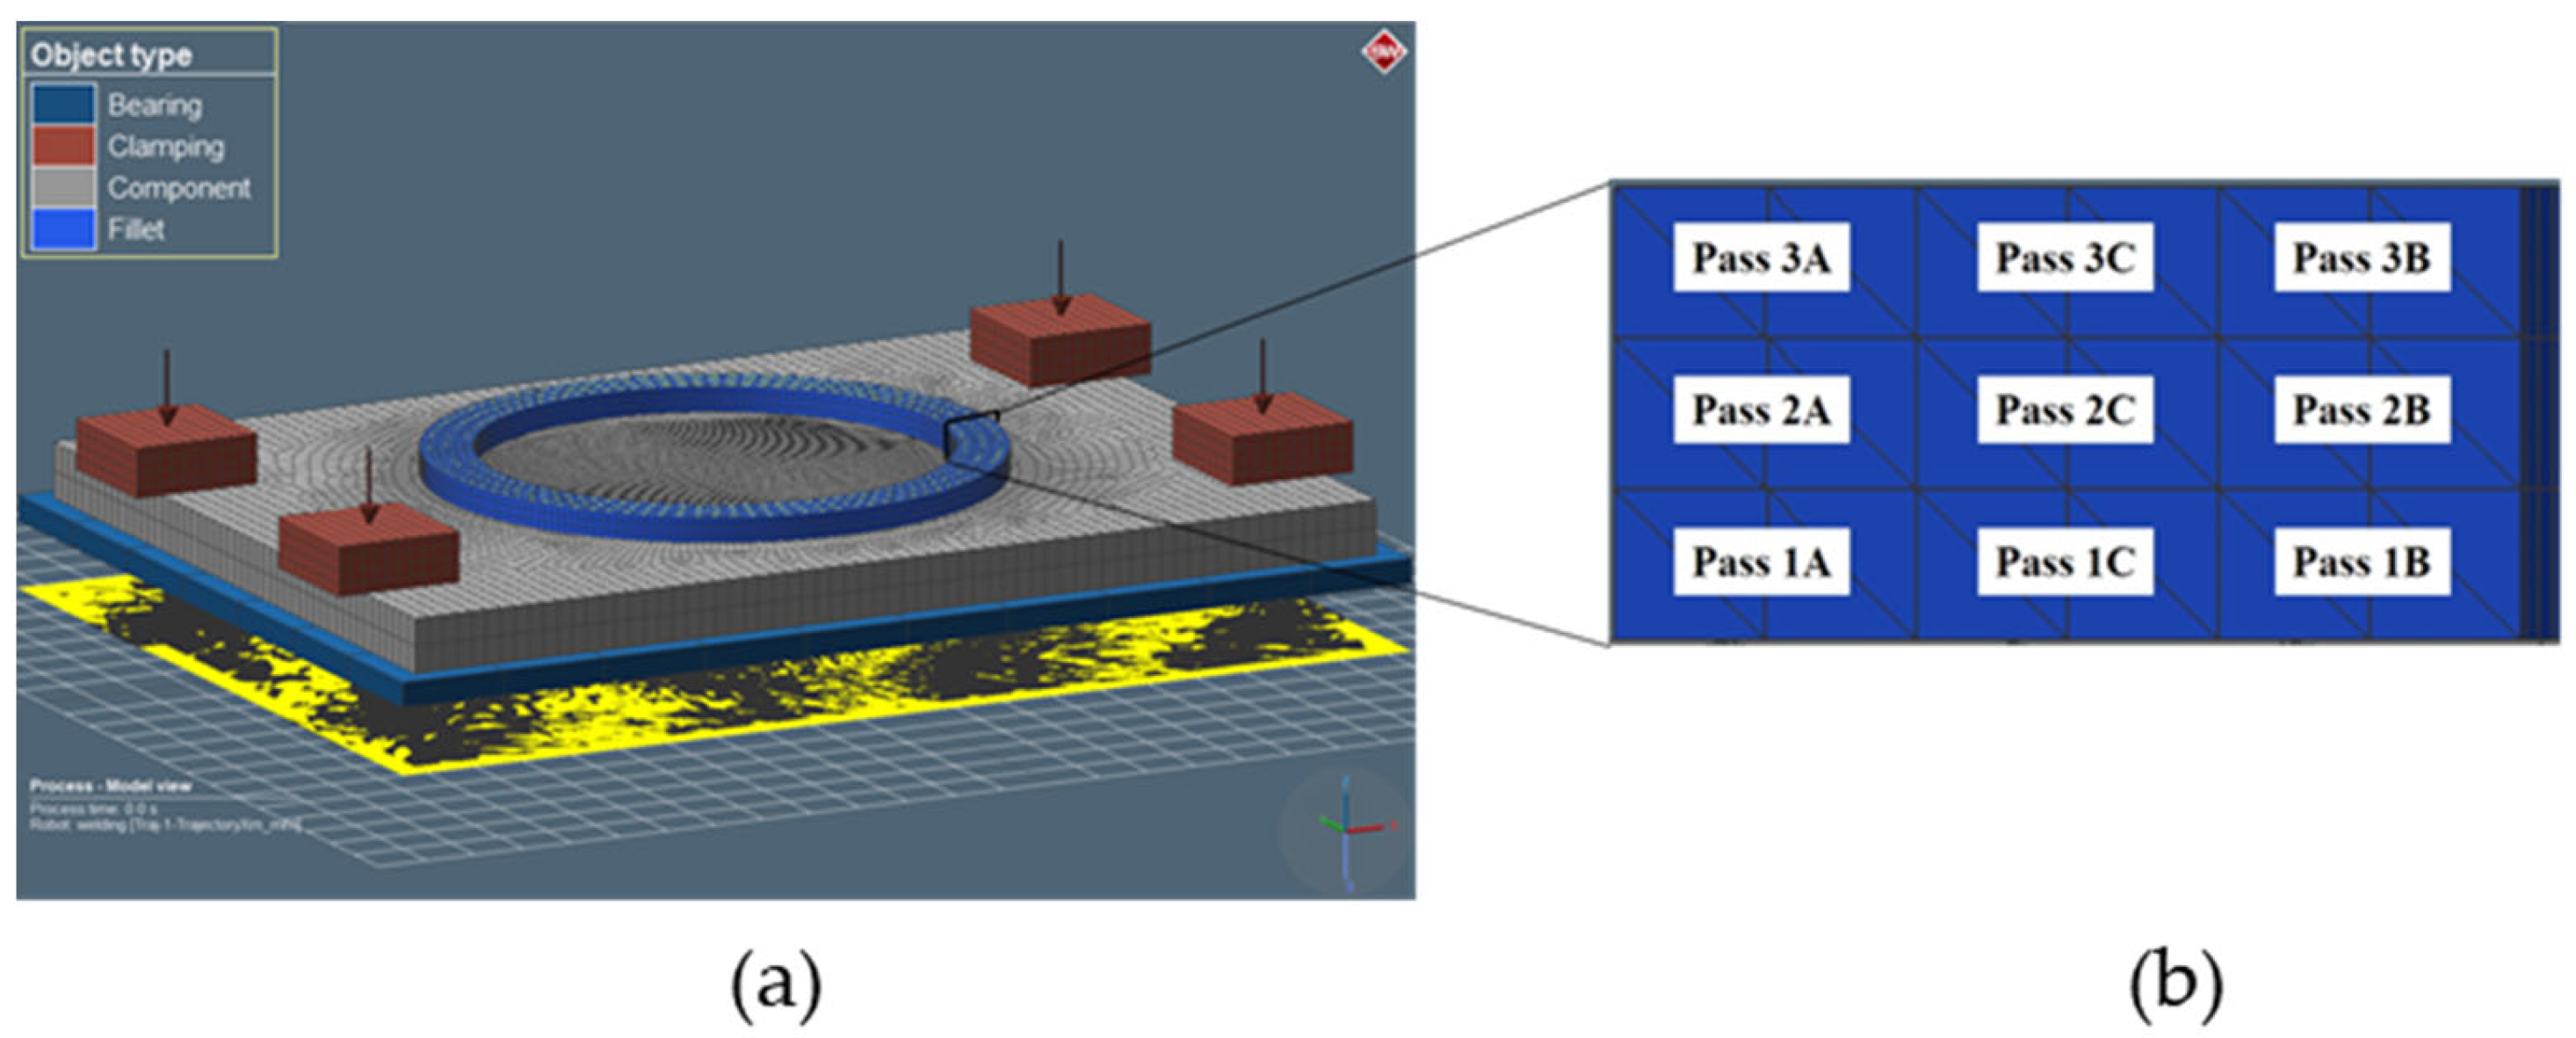
Insulated substrate + adaptive Current 120–87 A (Natural cooling, normal substrate, continuous, 1.0). The experimental setup was modelled and meshed in MSC Apex. The respective parts were then imported to Simufact welding software for thermomechanical analysis. Goldak double ellipsoidal heat source model was chosen with the following values of the constants—front bead constant 1.002 mm; rear bead constant 3.34 mm; depth and width of the heat source model 1.67 mm. The substrate and insulated sheet’s dimensions mirrored the experimental setup. The focus here was to understand the thermal evolution across layers. The simulation was carried out only for three layers with three passes in each layer. Each pass was a rectangular bead of 3.33 mm in width and 1.67 mm in height. The total buildup resulting from the 3 × 3 passes, as shown in Figure 14, was 10 mm in width and 5 mm in height. The deposition sequence was kept similar to that of the experimental condition, viz., inner–outer–middle. Hence, this inner (A)–outer (B)–middle (C) sequence along layer-1, layer-2 and layer-3 will become 1A, 1B, 1C, 2A, 2B, 2C, 3A, 3B and 3C as per the notation shown in Figure 14b.
Initially, the weld substrate was kept in a clamped condition. The weld layers were simulated for continuous deposition conditions. The temperature variation during the whole process is measured for each experiment. To get the temperature data, one point each (particle in the simulation parlance) was selected for each of the nine weld-deposition passes. These points were located at the centre of each weld-deposition pass and midway through the deposition process.
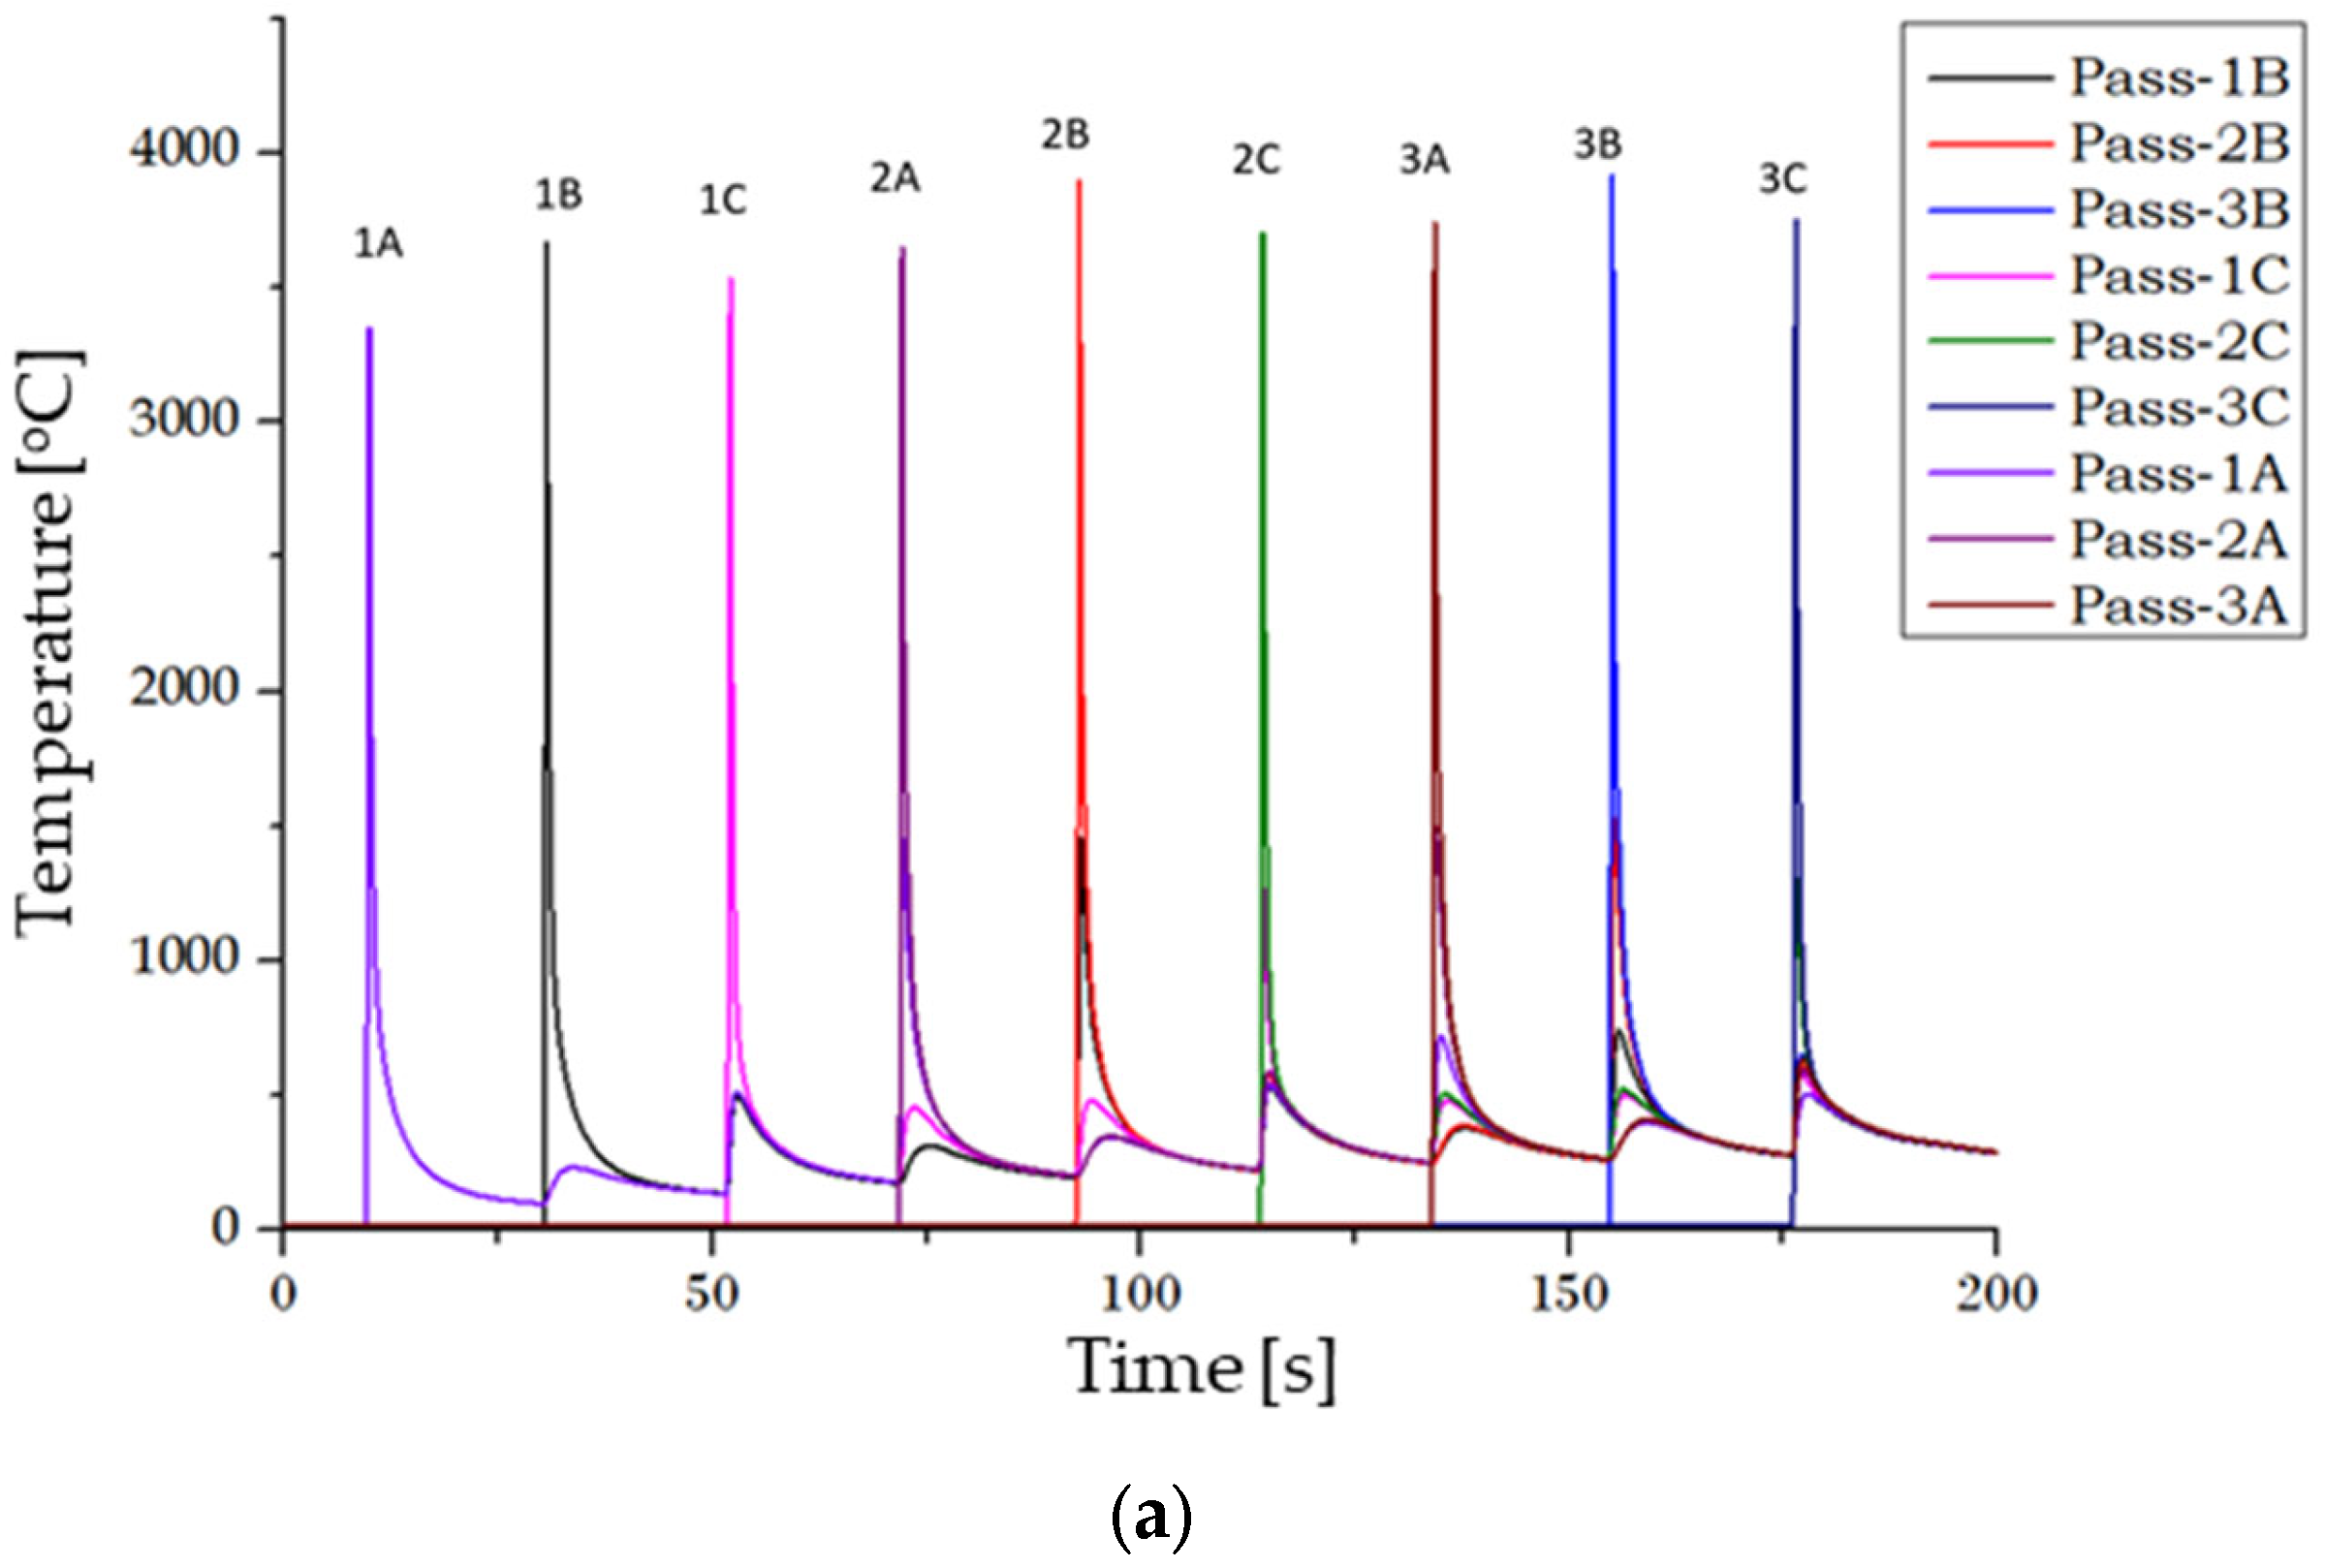
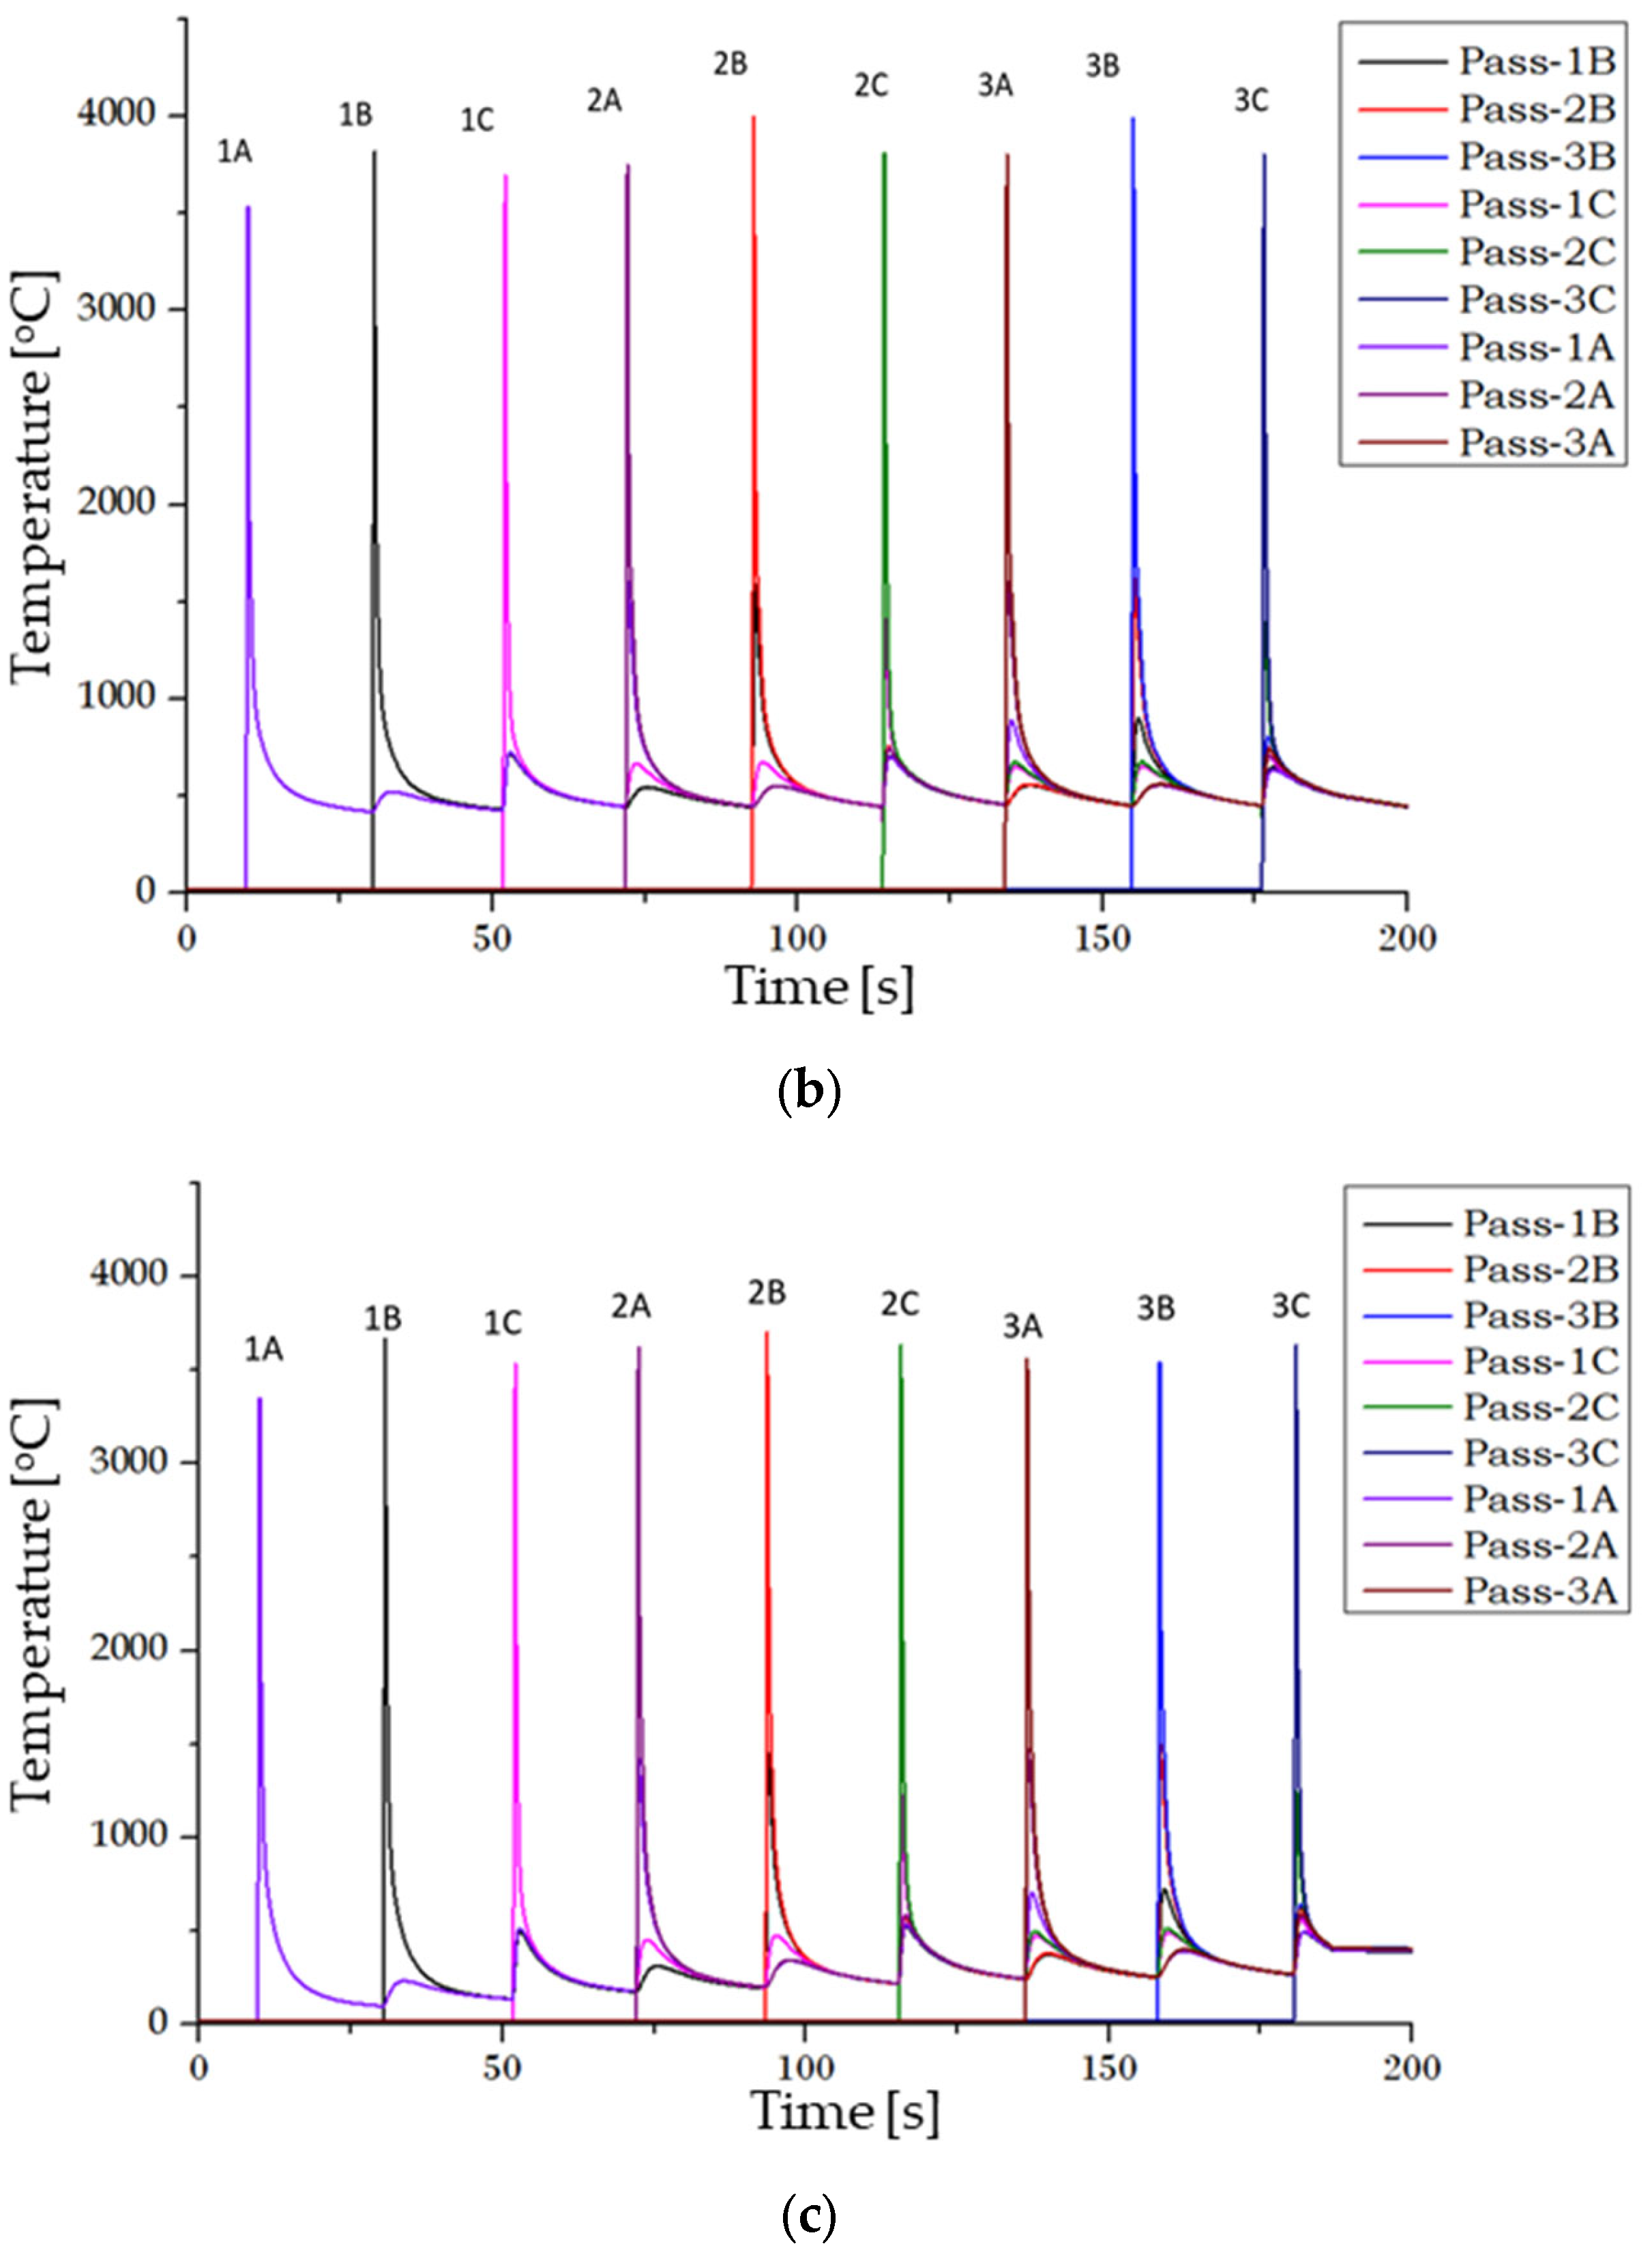
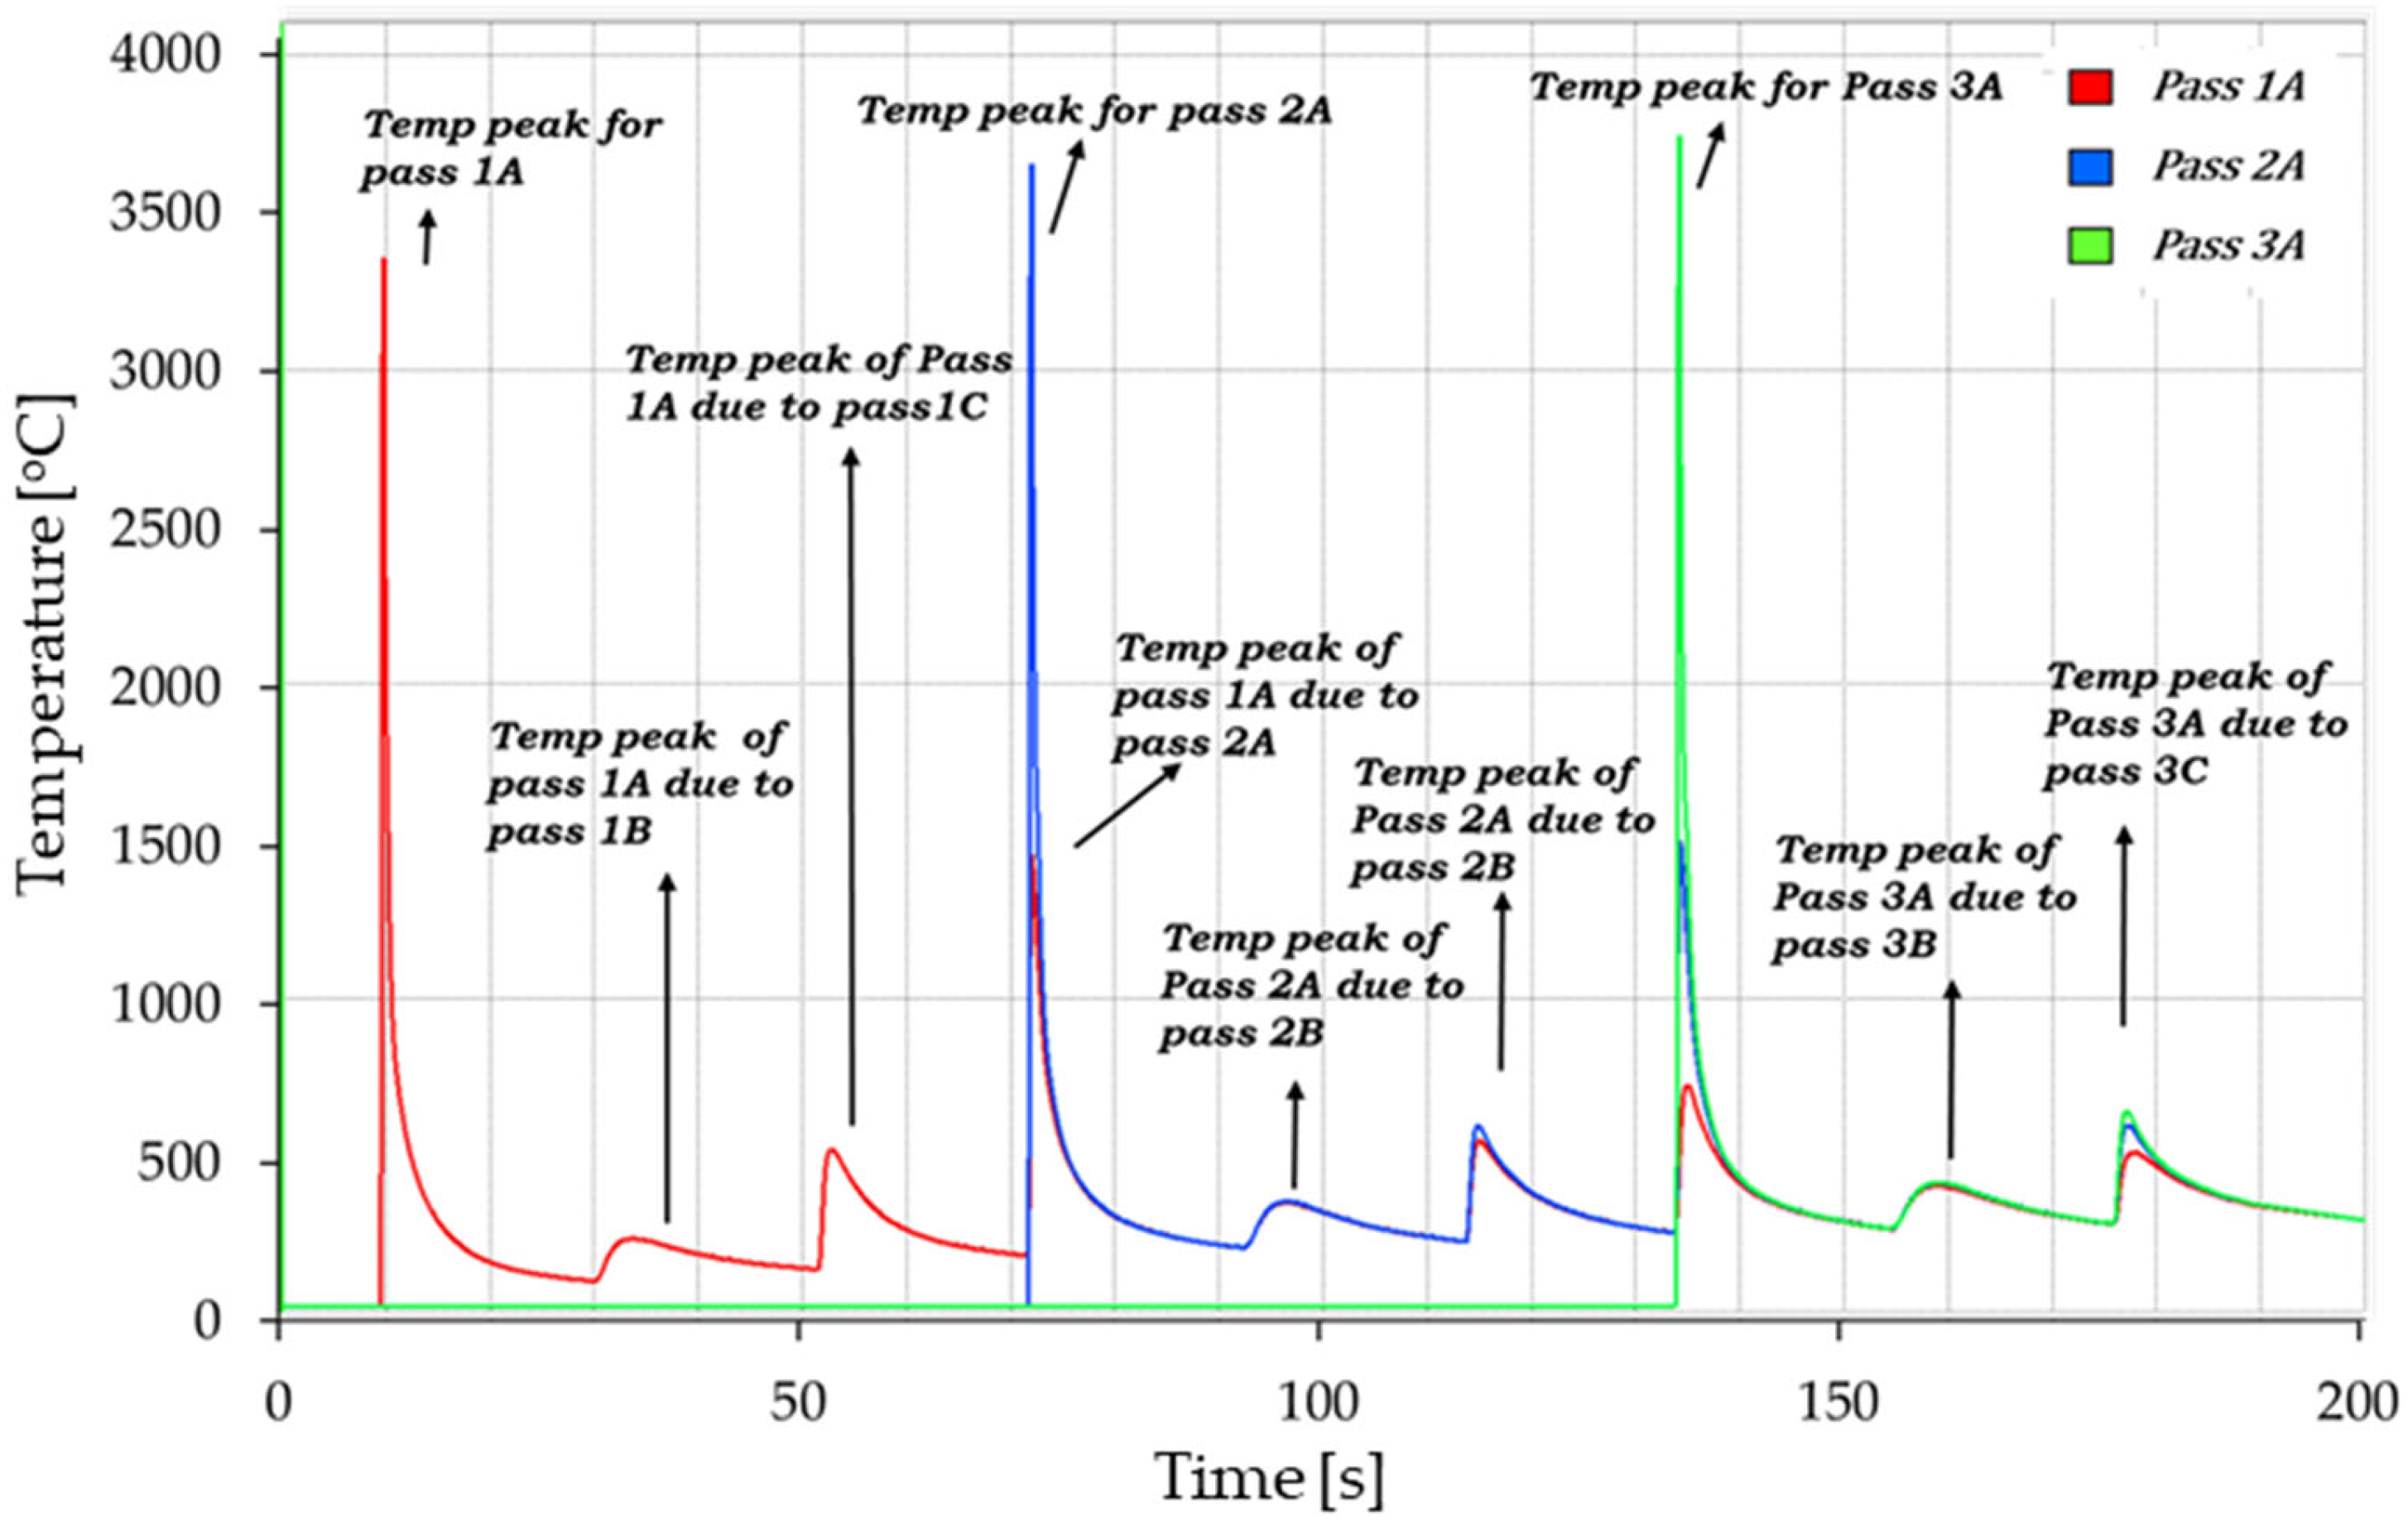
The analysis of the thermal cycles that a deposited component undergoes was based on the simulation results for three different cases, viz., (A1) Insulated substrate, (A2) Insulated + Heated substrate and (A3) Insulated substrate + Adaptive Current. Figure 15 shows the time–temperature plots of the nine passes for these three cases. One of these plots (Case A1) is expanded and annotated in Figure 16 to explain the typical temperature peaks associated with the deposition of different weld passes. The graphs show the simulated temperature values of the point based on the heat source. It may be noted that in the weld-deposition process, the arc temperature is much higher than the melting point of the material. Also, as the heat source is Gaussian, the centre region at which the points are taken has maximum power density; thus, only as a means of correlating the temperature trends may these values be acceptable.
The temperature plot for a point on pass 1A reaches the peak when the deposition torch for that pass is at that point. As the torch moves further, the temperature keeps falling until the subsequent deposition. This reaches the peak when the next pass is closest to the previous location. This cycle continues for each of the three passes of a given layer. It can be observed that the closer the subsequent pass, the higher the temperature rise. A similar rise in temperature is also seen when the deposition happens at the next layer. While the temperature rise during the deposition of intralayer neighbouring elements is of the order of 100 to 350 °C, it rises to 1200 °C when deposition happens at a layer on top due to the penetration effect.
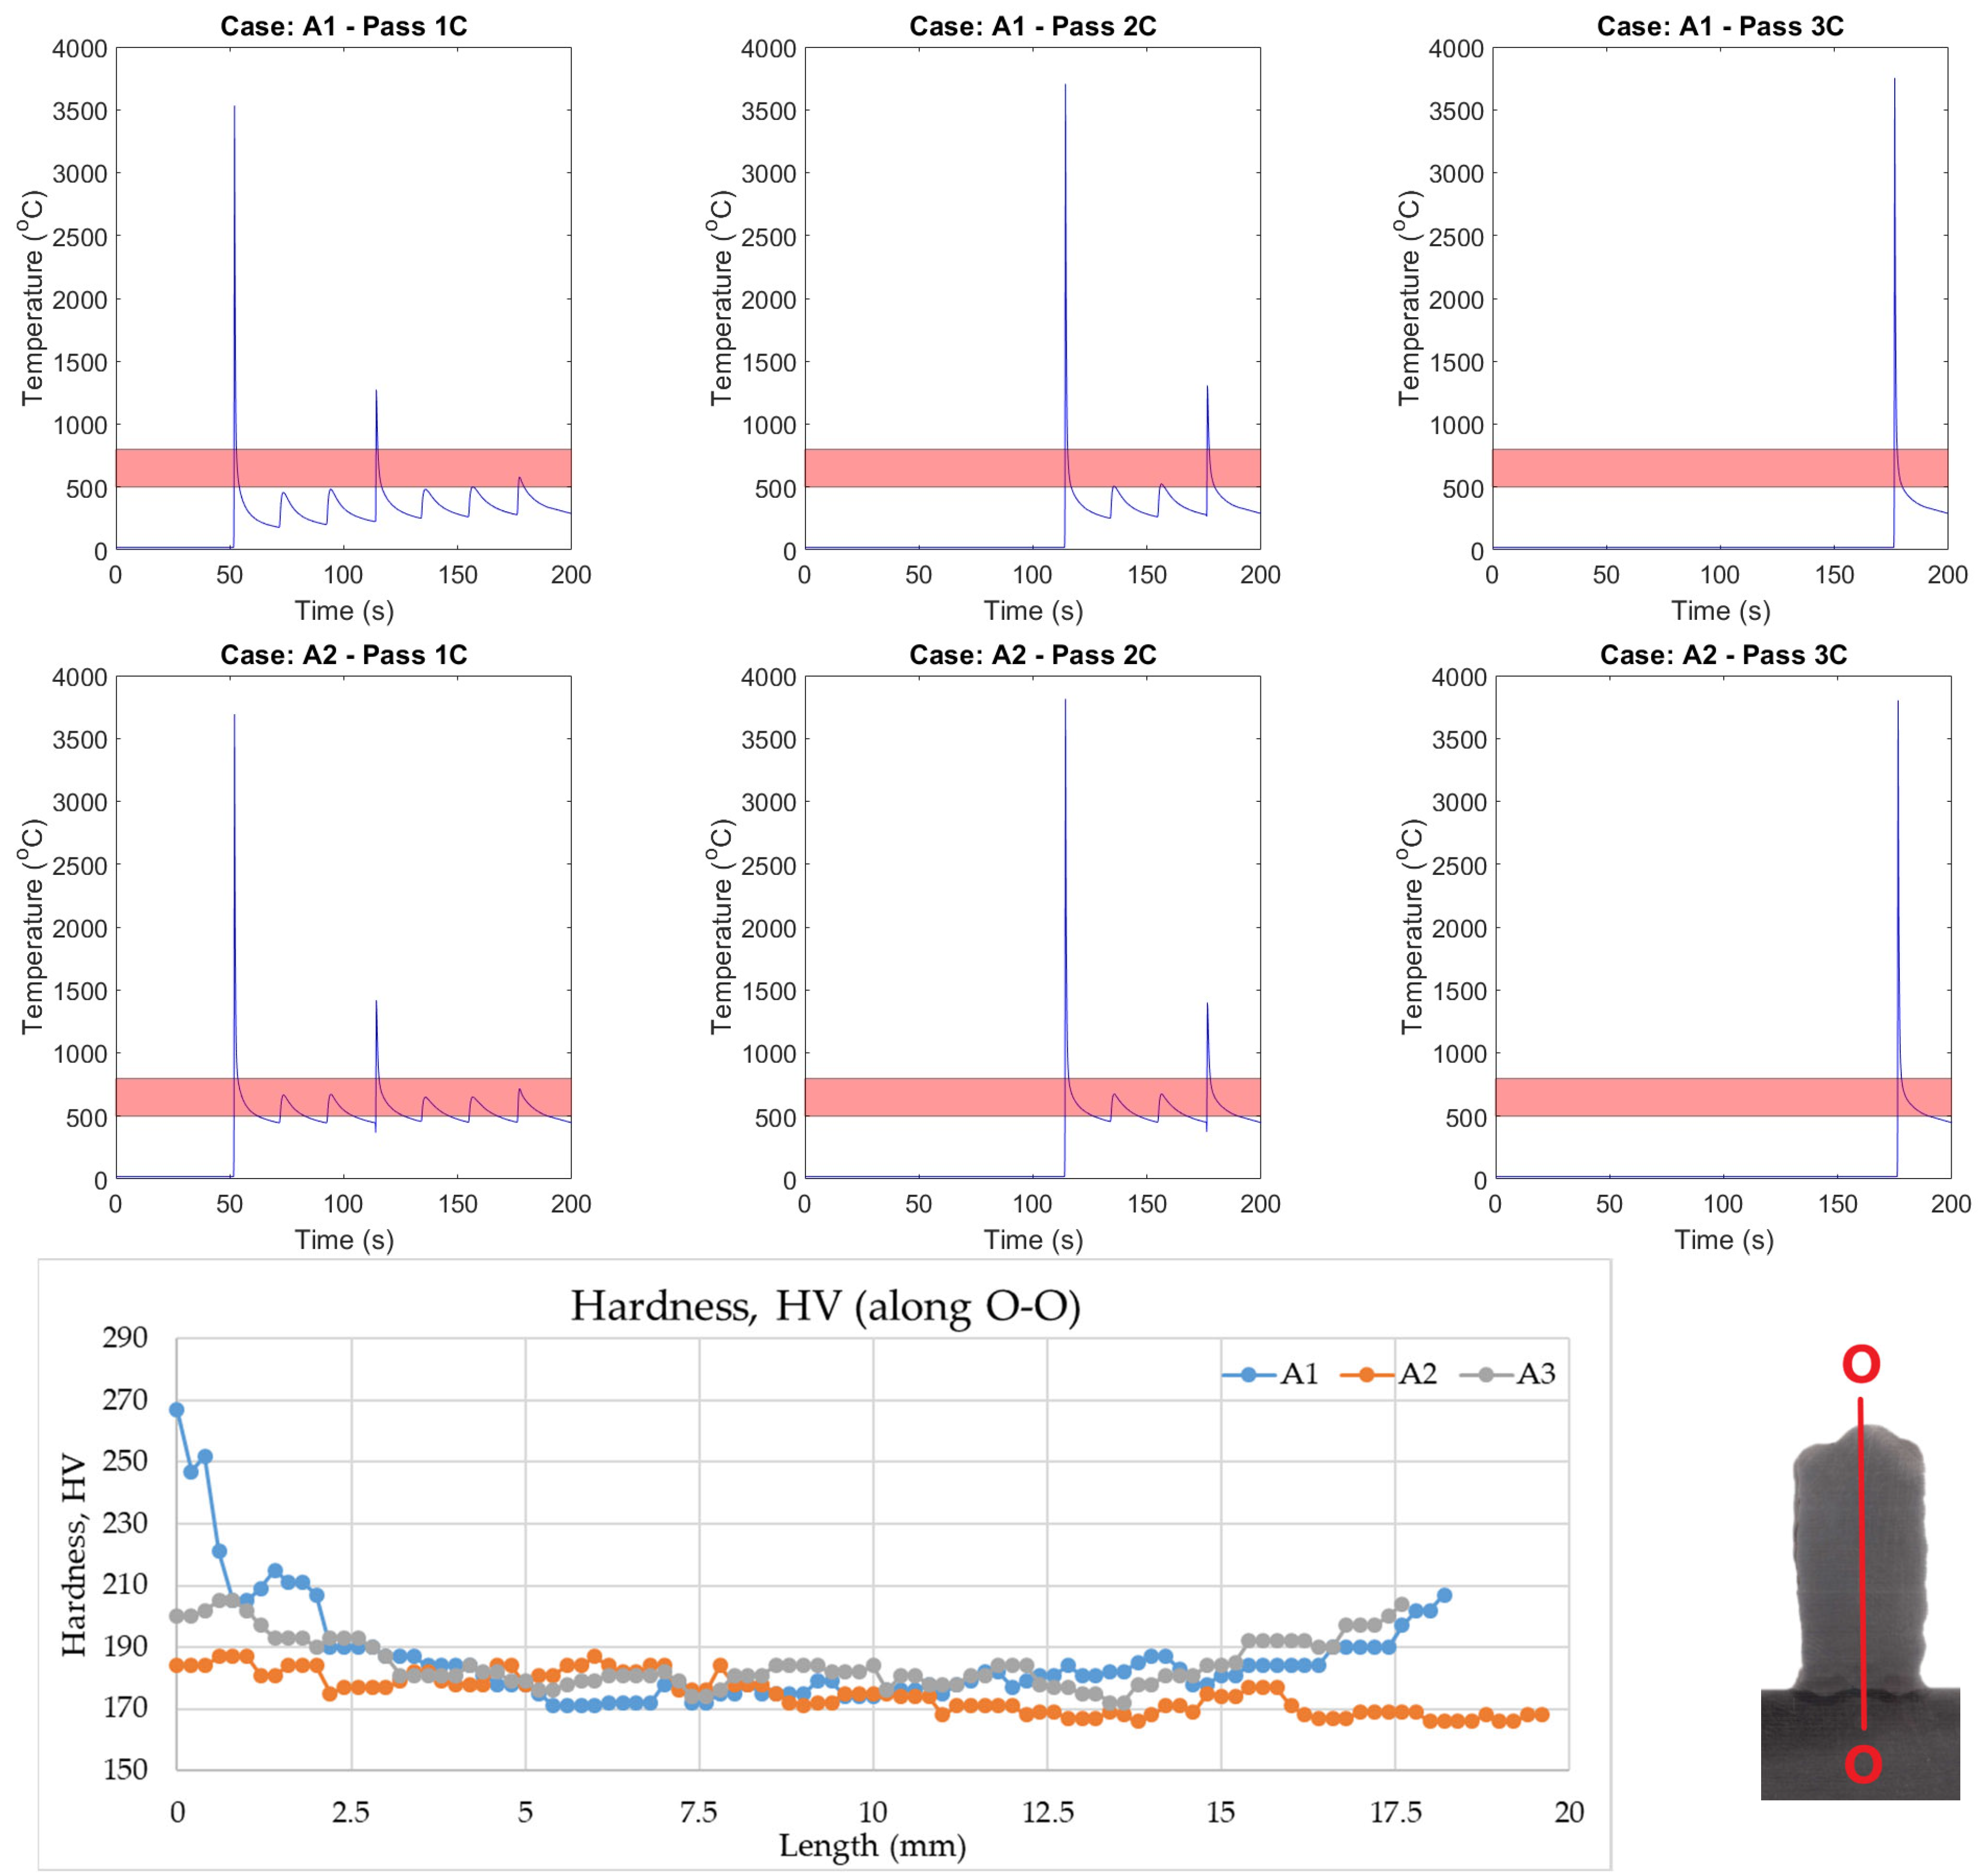
4.5. Comparison of Hardness Based on T8/5
T8/5 refers to the cooling time taken to cool from 800 °C to 500 °C. The cooling rate in this temperature zone determines the types, fractions, and grain size of low-temperature microstructural constituents. Hence, the cooling rate the material experiences in this zone directly impacts the components’ mechanical properties and microstructure. A comparison is made between case A1 and case A2 in terms of T8/5 in Figure 17. As inferred from Figure 17, case A2 remains in the T8/5 zone longer. This indicates the case of annealing heat treatment and comparatively lower hardness—a forecast validated through the hardness plot in Figure 17. It may also be observed that in the case of A1, the temperature plot enters the transition zone at a later stage (after the deposition of 1A–1C layers), resulting in a thermal cycle analogous to a normalizing process. Therefore, a uniform hardness along the height can be observed in this case of a heated substrate (case A2). These observations on the role of the T8/5 zone in the microstructure evolution reinforce that management of operating conditions like substrate temperature will directly impact the mechanical properties of the fabricated component.
5. Conclusions
The article presents thermal management approaches to manage residual stress and distortion in wire arc additive manufacturing. Two approaches for thermal management were investigated. The passive approach influences the cooling rate because of the change in process conditions. The active approach directly affects the cooling rate through external heating and adaptive change of the process parameters. The investigation, followed by the analysis of the results, yielded the following conclusions:
- Thermal management is an effective tool that can alter the distortion and residual stress pattern and the mechanical properties in an AM component. Measures to regulate the cooling and heating rate in the AM component can be designed to have predictive capabilities.
- The qualitative effects of process conditions on the distortion and residual stresses are evaluated using analysis of variance (ANOVA) for the passive thermal management approach.
- Current and torch speed are the parameters that affect distortion. Increasing current or decreasing speed increases the heat input rate, leading to higher distortion. In the case of continuous deposition for a given torch speed, a higher current can cause increased distortion due to greater heat input. Additionally, an increased aspect ratio can lead to uneven heat concentration, resulting in greater distortion. However, delayed deposition minimizes the impact of the aspect ratio on distortion, as it allows more time for heat to spread.
- Torch speed and geometry affect the residual stresses; the rate of heat distribution and geometry change causes the stress to accumulate, which increases the residual stresses. The welding current influences the residual stresses in the case of forced cooling, whereas the effect is insignificant in the natural cooling for the range of experiments considered.
- Heating the substrate shows a lower distortion comparatively and a uniform hardness across the cross-section.
- Heating the substrate is an effective measure to manage the in-process distortion. The components that are difficult to complete because of in-process distortion are expected to manufacture with thermal management.
- Thermal management techniques do depend on geometry. The efficacy of the technique needs to be evaluated through simulation and limited experiments before implementation. The maximum distortion and maximum stress can be expressed as a function of process parameters for a given thermal management technique for a given geometry.
- The AM component may have through-wall thickness variation in the properties (in addition to the across-layer variation). A concave surface may benefit self-heating, thereby reducing the cooling rate.
- Dynamic management of process parameters with layers has been found to have a limited effect in the current investigation, perhaps because of the fewer number of deposited layers. However, this approach must be checked with a component with many layers.
- The thermal management results of this investigation can be deployed to other AM processes. The coupling of active and passive management merits investigation to further the benefits of thermal management.
Author Contributions
Conceptualization, S.S. and A.S.; methodology, V.N., V.K.K., A.S. and S.S.; software, V.N. and V.K.K.; validation V.N. and V.K.K.; formal analysis, V.N., V.K.K., A.S. and S.S.; investigation, V.N., V.K.K., A.S. and S.S.; resources, A.S. and S.S.; data curation, V.N. and V.K.K.; writing—original draft preparation, V.N. and V.K.K.; writing—review and editing, A.S. and S.S.; visualization, A.S. and S.S.; supervision, S.S. and A.S.; project administration, S.S.; funding acquisition, S.S. and A.S. All authors have read and agreed to the published version of the manuscript.
Funding
This research was partially funded by The Boeing Company (BoeingMAE/F056/2017-18/S25). The Indian Institute of Technology Hyderabad supported the facilities and infrastructure to conduct experiments.
Data Availability Statement
Not applicable.
Acknowledgments
The Masters’s and PhD students engaged in this work are supported by a stipend from the Indian Institute of Technology Hyderabad. The authors acknowledge the technical inputs given by Om Prakash and Araveti Gupta of The Boeing Company.
Conflicts of Interest
The authors declare no conflict of interest.
References
- Farzaneh, A.; Khorasani, M.; Farabi, E.; Gibson, I.; Leary, M.; Ghasemi, A.; Rolfe, B. Sandwich structure printing of Ti-Ni-Ti by directed energy deposition. Virtual Phys. Prototyp. 2022, 17, 1006–1030. [Google Scholar] [CrossRef]
- Chen, X.; Fu, Y.; Kong, F.; Li, R.; Xiao, Y.; Hu, J.; Zhang, H. An in-process multi-feature data fusion nondestructive testing approach for wire arc additive manufacturing. Rapid Prototyp. J. 2022, 28, 573–584. [Google Scholar] [CrossRef]
- Chi, Y.; Murali, N.; Liu, J.; Liese, M.; Li, X. Wire arc additive manufacturing (WAAM) of nanotreated aluminum alloy 6061. Rapid Prototyp. J. 2022. ahead of print. [Google Scholar] [CrossRef]
- Mishra, A.; Paul, A.R.; Mukherjee, M.; Singh, R.K.; Sharma, A.K. Evaluation of Cu-Ti dissimilar interface characteristics for wire arc additive manufacturing process. Rapid Prototyp. J. 2023, 29, 366–377. [Google Scholar] [CrossRef]
- Somashekara, M.A.; Naveenkumar, M.; Kumar, A.; Viswanath, C.; Simhambhatla, S. Investigations into effect of weld-deposition pattern on residual stress evolution for metallic additive manufacturing. Int. J. Adv. Manuf. Technol. 2017, 90, 2009–2025. [Google Scholar] [CrossRef]
- Zhao, H.; Zhang, G.; Yin, Z.; Wu, L. Effects of Interpass Idle Time on Thermal Stresses in Multipass Multilayer Weld-Based Rapid Prototyping. J. Manuf. Sci. Eng. 2013, 135, 011016. [Google Scholar] [CrossRef]
- Denlinger, E.R.; Heigel, J.C.; Michaleris, P.; Palmer, T.A. Effect of inter-layer dwell time on distortion and residual stress in additive manufacturing of titanium and nickel alloys. J. Mater. Process. Technol. 2015, 215, 123–131. [Google Scholar] [CrossRef]
- Zhao, X.; Iyer, A.; Promoppatum, P.; Yao, S.C. Numerical modeling of the thermal behavior and residual stress in the direct metal laser sintering process of titanium alloy products. Addit. Manuf. 2017, 14, 126–136. [Google Scholar] [CrossRef]
- Hoye, N.; Li, H.J.; Cuiuri, D.; Paradowska, A.M. Measurement of Residual Stresses in Titanium Aerospace Components Formed via Additive Manufacturing. Mater. Sci. Forum 2014, 777, 124–129. [Google Scholar] [CrossRef]
- Klingbeil, N.W.; Beuth, J.L.; Chin, R.K.; Amon, C.H. Residual stress-induced warping in direct metal solid freeform fabrication. Int. J. Mech. Sci. 2002, 44, 57–77. [Google Scholar] [CrossRef]
- Klingbeil, N.W.; Zinn, J.W.; Beuth, J.L. Measurement of Residual Stresses in Parts Created by Shape Deposition Manufacturing. In Proceedings of the International Solid Freeform Fabrication Symposium, Austin, TX, USA, 11–13 August 1997; p. 8. [Google Scholar]
- Colegrove, P.A.; Coules, H.E.; Fairman, J.; Martina, F.; Kashoob, T.; Mamash, H.; Cozzolino, L.D. Microstructure and residual stress improvement in wire and arc additively manufactured parts through high-pressure rolling. J. Mater. Process. Technol. 2013, 213, 1782–1791. [Google Scholar] [CrossRef]
- Vastola, G.; Zhang, G.; Pei, Q.X.; Zhang, Y.W. Controlling of residual stress in additive manufacturing of Ti6Al4V by finite element modeling. Addit. Manuf. 2016, 12, 231–239. [Google Scholar] [CrossRef]
- Lockett, H.; Ding, J.; Williams, S.; Martina, F. Design for Wire + Arc Additive Manufacture: Design rules and build orientation selection. J. Eng. Des. 2017, 28, 568–598. [Google Scholar] [CrossRef] [Green Version]
- Huang, W.; Wang, Q.; Ma, N.; Kitano, H. Distribution characteristics of residual stresses in typical wall and pipe components built by wire arc additive manufacturing. J. Manuf. Process. 2022, 82, 434–447. [Google Scholar] [CrossRef]
- Cambon, C.; Bendaoud, I.; Rouquette, S.; Soulié, F. A WAAM benchmark: From process parameters to thermal effects on weld pool shape, microstructure and residual stresses. Mater. Today Commun. 2022, 33, 104235. [Google Scholar] [CrossRef]
- Scharf-Wildenhain, R.; Haelsig, A.; Hensel, J.; Wandtke, K.; Schroepfer, D.; Kromm, A.; Kannengiesser, T. Influence of Heat Control on Properties and Residual Stresses of Additive-Welded High-Strength Steel Components. Metals 2022, 12, 951. [Google Scholar] [CrossRef]
- Doumenc, G.; Couturier, L.; Courant, B.; Paillard, P.; Benoit, A.; Gautron, E.; Girault, B.; Pirling, T.; Cabeza, S.; Gloaguen, D. Investigation of microstructure, hardness and residual stresses of wire and arc additive manufactured 6061 aluminium alloy. Materialia 2022, 25, 101520. [Google Scholar] [CrossRef]
- Fan, D.; Gao, M.; Li, C.; Huang, J.; Yu, X. Residual stress and microstructure properties by trailing cooling of argon gas of wire and arc additive manufacturing. J. Manuf. Process. 2022, 77, 32–39. [Google Scholar] [CrossRef]
- Reddy, S.; Kumar, M.; Panchagnula, J.S.; Parchuri, P.K.; Kumar, S.S.; Ito, K.; Sharma, A. A new approach for attaining uniform properties in build direction in additive manufactured components through coupled thermal-hardness model. J. Manuf. Process. 2019, 40, 46–58. [Google Scholar] [CrossRef]
- Montevecchi, F.; Venturini, G.; Grossi, N.; Scippa, A.; Campatelli, G. Heat accumulation prevention in Wire-Arc-Additive-Manufacturing using air jet impingement. Manuf. Lett. 2018, 17, 14–18. [Google Scholar] [CrossRef]
- Lu, X.; Chiumenti, M.; Cervera, M.; Zhang, G.; Lin, X. Mitigation of residual stresses and microstructure homogenization in directed energy deposition processes. Eng. Comput. 2022, 38, 4771–4790. [Google Scholar] [CrossRef]
- Sharma, S.D.; Saluja, R.; Moeed, K.M. A review on effect of preheating and/or post weld heat treatment (PWHT) on hardened steel. Int. J. Tech. Res. App. 2013, 1, 5–7. [Google Scholar]
Figure 1.
(a) Experimental setup showing the CNC machine and the weld-deposition unit; (b) Weld-deposition unit mounted on the CNC’s milling head.
Figure 1.
(a) Experimental setup showing the CNC machine and the weld-deposition unit; (b) Weld-deposition unit mounted on the CNC’s milling head.

Figure 2.
(a) Representative 3D view; (b) Pattern of deposition.

Figure 3.
Distortion measurement.

Figure 4.
(a) Bottom view of baseplate and locations for measurement of residual stresses; (b) Setup for the residual stress measurement.
Figure 4.
(a) Bottom view of baseplate and locations for measurement of residual stresses; (b) Setup for the residual stress measurement.

Figure 5.
Reference lines of measurement of hardness.

Figure 6.
Elliptical shapes with different a/b ratios.

Figure 7.
Distortion plots for various experiments with passive thermal management. (a) Natural cooling and continuous deposition. (b) Natural cooling and delay deposition. (c) Forced cooling and continuous deposition. (d) Forced cooling and delay deposition.
Figure 7.
Distortion plots for various experiments with passive thermal management. (a) Natural cooling and continuous deposition. (b) Natural cooling and delay deposition. (c) Forced cooling and continuous deposition. (d) Forced cooling and delay deposition.


Figure 8.
Contour plots for distortion (a1–a3) Continuous and (b1–b3) delayed deposition.


Figure 9.
Distortion plots for an active set of experiments.

Figure 10.
Range of residual stresses measured.

Figure 11.
Contour plots for residual stress, (a1–a3) forced cooling, (b1–b3) natural cooling.

Figure 12.
Hardness variation with passive management along (a) O−O, (b) A−A, (c) B−B and (d) C−C.

Figure 13.
Hardness variation with active management along (a) O−O, (b) A−A, (c) B−B and (d) C−C.

Figure 14.
Weld-deposition modelling in Simufact: (a) Overall setup, (b) sectional view of the deposition passes.
Figure 14.
Weld-deposition modelling in Simufact: (a) Overall setup, (b) sectional view of the deposition passes.

Figure 15.
Temperature vs. time plot of weld passes A–C for (a) A, Insulated plate, (b) B, Insulated + heated substrate (400 °C); (c) C, Insulate base + adaptive current.
Figure 15.
Temperature vs. time plot of weld passes A–C for (a) A, Insulated plate, (b) B, Insulated + heated substrate (400 °C); (c) C, Insulate base + adaptive current.


Figure 16.
Thermal cycle variation for insulated substrate (A1) with the subsequent weld passes.

Figure 17.
T8/5 comparison of cases A1 and A2 for middle passes and hardness along the centerline.


Table 1.
Materials used in the experimentation.
| Attribute | Specifications |
|---|---|
| Feed wire material | AWS ER 70 S-6 (steel alloy AWS A5.18) |
| Diameter of the feed wire | 0.8 mm |
| Shielding gas | 80% Ar and 20% CO2 |
| Gas flow rate | 10−12 L/min |
| Weld plate dimensions | 200 mm × 150 mm × 11 mm |
| Coolant plate dimensions | 200 mm × 150 mm × 25 mm |
| Coolant duct diameter | 10 mm (five holes) |
Table 2.
EN8 alloy weld plate, coolant plate and filler wire properties.
| Attribute | Baseplate and Coolant Plate Properties | Filler Wire Properties |
|---|---|---|
| Ultimate tensile strength | 650–850 MPa | 480 MPa |
| Yield strength | 350–550 MPa | 400 MPa |
| Melting temperature | 1450–1510 °C | - |
Table 3.
Parameters considered for experimentation.
| Variable | Generic Terms | Equivalent in WAAM | Selected Parameters |
|---|---|---|---|
| Process Parameters | Heat Intensity | Current | 90, 100, 110, 120 A |
| Material Deposition Rate | Torch Speed | 0.6, 0.7, 0.8, 0.9 m/min | |
| Control Measures | Temperature Control (External Cooling/Heating) | Natural Cooling/ Forced Cooling | Coolant through substrate: (yes/no) |
| Pace Control (Continuous/ Intermittent) | Continuous vs. Pause after every layer | Continuous vs. Pause after every layer | |
| Mass/heat Distribution | Geometry | Proximity/Distribution | Ellipse with a/b ratio: 1.00, 1.25, 1.5, 1.75 |
Table 4.
DOE array for the experimentation on passive thermal management.
| Exp. No. | Natural Cooling/ Forced Cooling | Continuous/ Delay | Current (in A) | Speed (m/min) | a/b Ratio |
|---|---|---|---|---|---|
| P1 | Natural cooling | Continuous | 120 | 0.90 | 1.00 |
| P2 | Forced cooling | Delay | 110 | 0.90 | 1.25 |
| P3 | Natural cooling | Delay | 110 | 0.80 | 1.50 |
| P4 | Natural cooling | Delay | 120 | 0.70 | 1.75 |
| P5 | Forced cooling | Continuous | 120 | 0.80 | 1.75 |
| P6 | Forced cooling | Continuous | 90 | 0.80 | 1.00 |
| P7 | Forced cooling | Delay | 100 | 0.90 | 1.50 |
| P8 | Natural cooling | Delay | 100 | 0.80 | 1.25 |
| P9 | Forced cooling | Continuous | 100 | 0.70 | 1.25 |
| P10 | Natural cooling | Delay | 90 | 0.70 | 1.00 |
| P11 | Natural cooling | Continuous | 90 | 0.90 | 1.75 |
| P12 | Natural cooling | Continuous | 110 | 0.60 | 1.25 |
| P13 | Forced cooling | Delay | 120 | 0.60 | 1.00 |
| P14 | Natural cooling | Continuous | 100 | 0.60 | 1.50 |
| P15 | Forced cooling | Continuous | 110 | 0.70 | 1.50 |
| P16 | Forced cooling | Delay | 90 | 0.60 | 1.75 |
Table 5.
Experimental results after the experiments.
| Method of Cooling | Method of Deposition | Exp. No | Current (A) | Speed (m/min) | a/b Ratio | Max Stress (in MPa) | Min Stress (in MPa) | Distortion (in mm) |
|---|---|---|---|---|---|---|---|---|
| Passive approach | ||||||||
| N | C | P1 | 120 | 0.90 | 1.00 | 492.31 | 73.74 | 1.226 |
| N | C | P12 | 110 | 0.60 | 1.25 | 420.57 | 185.16 | 1.224 |
| N | C | P14 | 100 | 0.60 | 1.50 | 435.52 | 63.03 | 1.250 |
| N | C | P11 | 90 | 0.90 | 1.75 | 469.01 | 50.53 | 1.213 |
| N | D | P4 | 120 | 0.70 | 1.75 | 445.88 | −284.08 | 1.683 |
| N | D | P3 | 110 | 0.80 | 1.50 | 464.38 | 95.58 | 1.674 |
| N | D | P8 | 100 | 0.80 | 1.25 | 431.49 | −50.78 | 1.404 |
| N | D | P10 | 90 | 0.70 | 1.00 | 560.29 | 111.32 | 1.332 |
| F | C | P5 | 120 | 0.80 | 1.75 | 449.13 | −237.08 | 1.311 |
| F | C | P15 | 110 | 0.70 | 1.50 | 534.66 | 159.72 | 1.367 |
| F | C | P9 | 100 | 0.70 | 1.25 | 499.59 | −2.77 | 1.354 |
| F | C | P6 | 90 | 0.80 | 1.00 | 387.21 | 6.66 | 1.111 |
| F | D | P13 | 120 | 0.60 | 1.00 | 582.34 | 151.35 | 1.488 |
| F | D | P2 | 110 | 0.90 | 1.25 | 370.88 | 73.30 | 1.530 |
| F | D | P7 | 100 | 0.90 | 1.50 | 410.98 | −167.44 | 1.215 |
| F | D | P16 | 90 | 0.60 | 1.75 | 373.59 | −213.46 | 1.350 |
| Active approach | ||||||||
| N, IB | C | A1 | 120 | 0.90 | 1.00 | 367.74 | 63.04 | 0.529 |
| N, IHP | C | A2 | 120 | 0.90 | 1.00 | 350.68 | −21.43 | 0.431 |
| N, IB + A | C | A3 | 120–90 | 0.90 | 1.00 | 366.79 | −22.59 | 0.699 |
N—Natural cooling, F—Forced cooling, C—Continuous, Deposition, D—Delayed deposition, IHP—Insulated heated plate, IB—Insulated base, A—Adaptive.
Table 6.
ANOVA for distortion.
| Source | DF | Adj SS | Adj MS | F-Value | p-Value | |
|---|---|---|---|---|---|---|
| Regression | 5 | 11.8498 | 2.36996 | 2391.02 | 0.000 | |
| Current (A) | 1 | 0.2045 | 0.20450 | 206.32 | 0.000 | |
| Speed (m/min) | 1 | 0.1841 | 0.18409 | 185.72 | 0.000 | |
| Current (A) × Speed (m/min) | 1 | 0.1156 | 0.11563 | 116.66 | 0.000 | |
| Current (A) × Continuous(1)/delay(0) | 1 | 0.0107 | 0.01070 | 10.79 | 0.007 | |
| a/b ratio × Continuous(1)/delay(0) | 1 | 0.0043 | 0.00431 | 4.35 | 0.061 | |
| Error | 11 | 0.0109 | 0.00099 | |||
| Total | 16 | 11.8607 | ||||
| S | R-sq | R-sq (adj) | R-sq (pred) | |||
| 0.0314833 | 99.91% | 99.87% | 99.83% | |||
Table 7.
ANOVA: Residual Stress (stepwise regression).
| Source | DF | Adj SS | Adj MS | F-Value | p-Value |
|---|---|---|---|---|---|
| Regression | 6 | 0.000080 | 0.000013 | 293.46 | 0.000 |
| Current (A) | 1 | 0.000000 | 0.000000 | 8.01 | 0.018 |
| Speed (m/min) | 1 | 0.000002 | 0.000002 | 33.96 | 0.000 |
| a/b ratio | 1 | 0.000001 | 0.000001 | 19.76 | 0.001 |
| Current (A) × Natural(1)/Forced(0) | 1 | 0.000000 | 0.000000 | 6.64 | 0.028 |
| Speed (m/min) × Natural(1)/Forced(0) | 1 | 0.000000 | 0.000000 | 7.69 | 0.020 |
| Speed (m/min) × a/b ratio | 1 | 0.000001 | 0.000001 | 12.39 | 0.006 |
| Error | 10 | 0.000000 | 0.000000 | - | - |
| Total | 16 | 0.000080 | - | - | - |
| Regression | 6 | 0.000080 | 0.000013 | 293.46 | 0.000 |
| S | R-sq | R-sq (adj) | R-sq (pred) | ||
| 0.0002129 | 99.44% | 99.10% | 98.54% | ||
Disclaimer/Publisher’s Note: The statements, opinions and data contained in all publications are solely those of the individual author(s) and contributor(s) and not of MDPI and/or the editor(s). MDPI and/or the editor(s) disclaim responsibility for any injury to people or property resulting from any ideas, methods, instructions or products referred to in the content. |
© 2023 by the authors. Licensee MDPI, Basel, Switzerland. This article is an open access article distributed under the terms and conditions of the Creative Commons Attribution (CC BY) license (https://creativecommons.org/licenses/by/4.0/).
Share and Cite
MDPI and ACS Style
Nagallapati, V.; Khare, V.K.; Sharma, A.; Simhambhatla, S. Active and Passive Thermal Management in Wire Arc Additive Manufacturing. Metals 2023, 13, 682. https://doi.org/10.3390/met13040682
AMA Style
Nagallapati V, Khare VK, Sharma A, Simhambhatla S. Active and Passive Thermal Management in Wire Arc Additive Manufacturing. Metals. 2023; 13(4):682. https://doi.org/10.3390/met13040682
Chicago/Turabian StyleNagallapati, Vishwanath, Vivek Kumar Khare, Abhay Sharma, and Suryakumar Simhambhatla. 2023. "Active and Passive Thermal Management in Wire Arc Additive Manufacturing" Metals 13, no. 4: 682. https://doi.org/10.3390/met13040682
Note that from the first issue of 2016, this journal uses article numbers instead of page numbers. See further details here.