Article

Experimental Study on the Dynamic Behavior of a Cr-Ni-Mo-V Steel under Different Shock Stresses

School of Mechanical Engineering, Zhejiang Sci-Tech University, Hangzhou 310018, China
*
Author to whom correspondence should be addressed.
Metals 2023, 13(4), 663; https://doi.org/10.3390/met13040663
Submission received: 18 February 2023 / Revised: 22 March 2023 / Accepted: 23 March 2023 / Published: 27 March 2023

Abstract

:
The present study aimed to provide new insights into the behavior of high-strength low-alloy steel under dynamic compression and to promote its use in high-stress applications. The dynamic compression response of a Cr-Ni-Mo-V steel under shock stresses ranging from 3.54 GPa to 19.76 GPa was investigated using loading technology. The free surface velocity of the specimen was measured using a displacement interferometer system with the range of 166–945 m/s. The Hugoniot elastic limit (HEL), spalling fracture, and microstructure evolution of specimens under different shock stresses were determined. The results showed that an α→ε phase transition occurred in the material at an impact stress of 15.63 GPa, leading to a change in particle velocity. The relationship between the shock wave velocity and particle velocity was found to be linear. The HEL of the steel was found to be consistent at 2.28 GPa, while the spall strength showed a more complex relationship with the increasing shock stress. Initially, the spall strength increased and then decreased with increasing shock stress before increasing again after the phase transformation. The fracture mode of the steel shifted from brittle fracture to ductile fracture with the increasing impact stresses, which is related to the previous plastic deformation under different impact loads.

1. Introduction

High-strength low-alloy (HSLA) steel, which is characterized by its qualified impact toughness, ultrahigh strength, and excellent weldability, has been widely applied in various industries, such as the automotive, aerospace, energy sector, and military defense sectors. These applications include large construction machinery, aircraft missile casings, armored tank vehicle structures, and protective materials [1,2,3,4]. A common type of HSLA steel, Cr-Ni-Mo-V, is used in engineering components such as aircraft landing gear and oil pipelines due to its high strength, plastic toughness, and high temperature performance [5,6,7,8]. Despite its widespread use, there is a continued need to improve the mechanical properties of Cr-Ni-Mo-V HSLA steel in order to enable it to better withstand larger impact loads [9].
The addition of metal elements such as Ni, Cr, Si, Mn, Mo, V, and W can enhance the properties of HSLA steels [10]. For instance, a Ni mass fraction of 2% to 3% is beneficial to the formation of martensite after quenching and can change the dislocation slip characteristics to improve the toughness of the steel. Additionally, Cr, Mo, and W alloy elements can improve the hardenability of steel by hindering the transformation of austenite into pearlite after heating and austenitization. Furthermore, these elements form stable alloy carbides during the tempering process, which enhances the tempering stability of the steel. Moreover, microalloying elements, such as V, are beneficial to the formation of fine carbides with high stability, and the interaction between these precipitates and dislocations can further improve strength.
Numerous plate impact experiments have been conducted in order to understand the impact response behavior of steels with varying densities and formulations. These experiments include the contributions of the Los Alamos National Laboratory in the 1940s [11]. Thomas et al. [12] investigated the shock Hugoniots of α-phase iron and three steel alloys (CRS 1018, A36, and HY100) using velocimetry and symmetric impact experiments, finding that HY100′s shock velocities are, on average, higher than those of the other metals. Other studies have compared the shock responses of additively manufactured and conventionally wrought 304 L stainless steel, as presented in [13], revealing that a combination of factors such as composition, porosity, microstructure (e.g., grain size and morphology), and residual stress significantly affect the shock responses of these materials.
The ductile dynamic tensile failure, or spalling, of metals and alloys is governed by the processes of void nucleation, void growth, and eventual fracture through void coalescence [14]. The nucleation of cavitation is closely related to the presence of second-phase particles in metals and alloys with two or more phases, and hard precipitates or inclusions may desorb from the ductile metal matrix [15,16]. Void growth has been extensively studied in recent decades, and various micromechanical models have been proposed to understand dynamic voiding under extreme loading conditions [17,18]. The grain structure has a significant impact on the spall strength of polycrystalline metals, with some cases exhibiting a Hall–Petch-type relationship where smaller grains lead to higher spall strengths [19], and other cases showing that spall strength increases with grain size [20].
Generally speaking, the ductile brittle transition phenomenon of steel materials has an important impact on the safety of equipment and structures. For high-strength low-alloy steels, the fracture mode is closely related to impact load. Under low strain rate loading, the main fracture mode is ductile fracture, which gradually transitions to brittleness with the increase in impact stress. However, in the ductile brittle transition zone, materials often exhibit a mixed ductile brittle fracture mode. Regarding the mechanism of ductile brittle transition, scholars have conducted a large amount of research. Satoh et al. [21] believes that after the formation of ductile cracks in the notch, the stress triaxiality and normal stress in the region ahead of the crack tip increase with the crack growth, leading to cleavage fracture. Wallin [22] believes that it is mainly caused by the uneven microstructure of the material. As the ductile crack propagates, the high stress zone at the crack front edge expands, increasing the probability of cleavage fracture occurring. Through analysis and calculation of the cross-sectional morphology of the weld and base metal of C-Mn steel, Chen et al. [23] found that the stress triaxiality and normal stress at the crack tip increase as the ductile crack propagates. When the critical value is reached, the cleavage micro crack is caused, and eventually the transition from ductile crack to cleavage crack occurs.
In this study, a series of plate impact experiments were conducted to investigate the shock wave structure, the Hugoniot elastic limit, and the spall strength of a compositionally complex HSLA steel. The transition from elastic to plastic behavior under impact flyer loading was analyzed, and the phase transition and spallation of the HSLA were determined based on the measured free surface particle velocities and metallographic microscopy of recovered specimens.

2. Experiments

2.1. Materials

The experimental HSLA plate was made at the Construction Machine Tool Factory (Chongqing, China). It had a composition of 0.25% C, 0.6% Cr, 0.4% Mo, 2.8% Ni, 0.06% V, and balance Fe, and was prepared through a blast furnace converter process that included a blast furnace, molten iron pretreatment, converter, secondary refining, continuous casting, and rolling. The initial temperature was 890 ± 10 °C. After water quenching, the specimens were heated to 600 °C for tempering and holding. The density of the material was measured as 7.79 ± 0.03 g/cm3 using a standard Archimedes method. Sound speed measurements for longitudinal and shear waves were made using an Olympus 5073PR pulser–receiver (Yingdian Testing Equipment Inc., Shanghai, China). The longitudinal, shear, and bulk sound speeds (cL, cS, and cB, respectively), were 6052, 3723, and 4771 m/s.

2.2. Test Design

The schematic illustration of the plate impact experiments for a Cr-Ni-Mo-V steel is shown in Figure 1. During the test, the front of the sabot was equipped with an OFHC flyer (35 mm in diameter), which was accelerated towards a target consisting of a specimen (15 mm diameter × 3 mm) embedded in epoxy resin. The impact velocity (vimp) was measured using a series of charged metal pins. The velocity distribution of the free surface at the back of the target sample was directly measured utilizing an optical fiber probe, and the shock wave velocity of the sample was determined from both the point probe and optical window. At the moment when the flyer was 0.5 mm away from the target, both pins were triggered simultaneously, with time zero (t0) being recorded. The displacement interferometer system (DISAR) of a reflector monitored the shock wave transmitted through the target on its free surface. The experimental details of the test are listed in Table 1.

3. Results and Discussion

3.1. Gauge Trace Analyses

The velocity of the free surface of test sample No. 002, as monitored by the displacement interferometer system (DISAR), is illustrated in Figure 2. The test sample was initially subjected to impact from an OFHC flyer at time t0, resulting in the generation of both elastic precursors (represented by the dashed lines) and shock waves (represented by the solid lines) in both the sample and the flyer. It is assumed that the elastic precursor travels at the speed of sound (cL), which is faster than the speed of the shock wave. As a result, the precursor wave reaches the rear free surface of the sample at time t1, leading to a sharp rise in particle velocity within a very short time frame (less than 13 ns). The free surface velocity curve clearly indicates that the particle velocity is proportional to the HEL. Following the HEL, there is a distortion in both the elastic–plastic yield and free surface velocity data, which is attributed to the reflection of the elastic precursor back to the frontal shock wave and the interaction between multiple stress pulses. Subsequently, the shock wave, which propagates at speed Us, reaches the free surface at the rear of the sample at time t2. This results in a rapid increase in the free surface velocity to its peak value.
Upon reaching the free surface of the flyer, the propagation of the shock wave and the sample results in its reflection form a rarefied wave, commonly referred to as the release wave. It is hypothesized that the head of the release wave travels at the speed of longitudinal sound, while its tail moves at the overall speed of sound. Upon the collision of sparse waves from free surfaces of the specimen and the flyer at time t3, a substantial tensile stress is generated. If the tensile stress surpasses the spall strength of the material, a new free surface forms at the spallation plane, and a pulse propagating at the longitudinal speed of sound emerges in the spallation layer. The arrival of this pulse at the rear free surface of the sample at time t4 leads to a decrease in velocity. Another pulse arrives at time t5, causing a characteristic velocity retreat, further evidencing spallation. The difference in free surface velocity between its peak value and the first minimum value is referred to as the withdrawal velocity and is used to determine the material’s spall strength. As illustrated in Figure 2, the smaller peak value after the maximum velocity is attributed to the back and forth propagation of the spallation pulse in the layer post-fracture.
The free surface velocity curves of all test samples, as measured, are presented in Figure 3. Each curve demonstrates the transition from elastic deformation to plastic deformation. It can be observed that the free surface velocity at the HEL varies little, with values ranging from 94.8 to 98.4 m/s. In contrast, the trend of withdrawal speed is more complex. It is worth noting that the slope of the curve increases significantly after the velocity callback, which is believed to be associated with a change in the material’s failure mode from brittleness to toughness [24].
An important feature displayed in Figure 3 is the alteration in particle velocity distribution at higher impact velocities (780 m/s and 938 m/s), manifested as a step change in particle velocity at the peak platform. As the peak stress (σpeak) approaches the transformation stress threshold, the α→ε phase change occurs [25], generating a phase change pulse and leading to a shift in the particle velocity distribution from a two-wave structure to a three-wave structure comprising elastic, plastic, and phase-change waves. The peak stress can be determined using the peak free surface velocity (upfs), impact velocity (Us for the elastic wave and Up for the plastic wave), density, and Rankine–Hugoniot relationship, as described by Boteler and Dandekar [26]. The stress threshold for the α→ε phase transition was calculated to be 15.63 GPa.
Figure 4 displays the macro and micro failure modes of all of the recovered test specimens under various impact velocities processed using wire cutting. It can be seen that no significant damage or spalling layer was observed under lower shock stress. Micro-voids resulting from the impact load were present in the specimen impacted at a velocity of 598 m/s, which may significantly impact the steel’s shock response, including the shock wave propagation and spalling behavior. When the impact velocity was increased to 938 m/s, the specimen exhibited obvious plastic deformation and experienced significant tensile failure within the material.

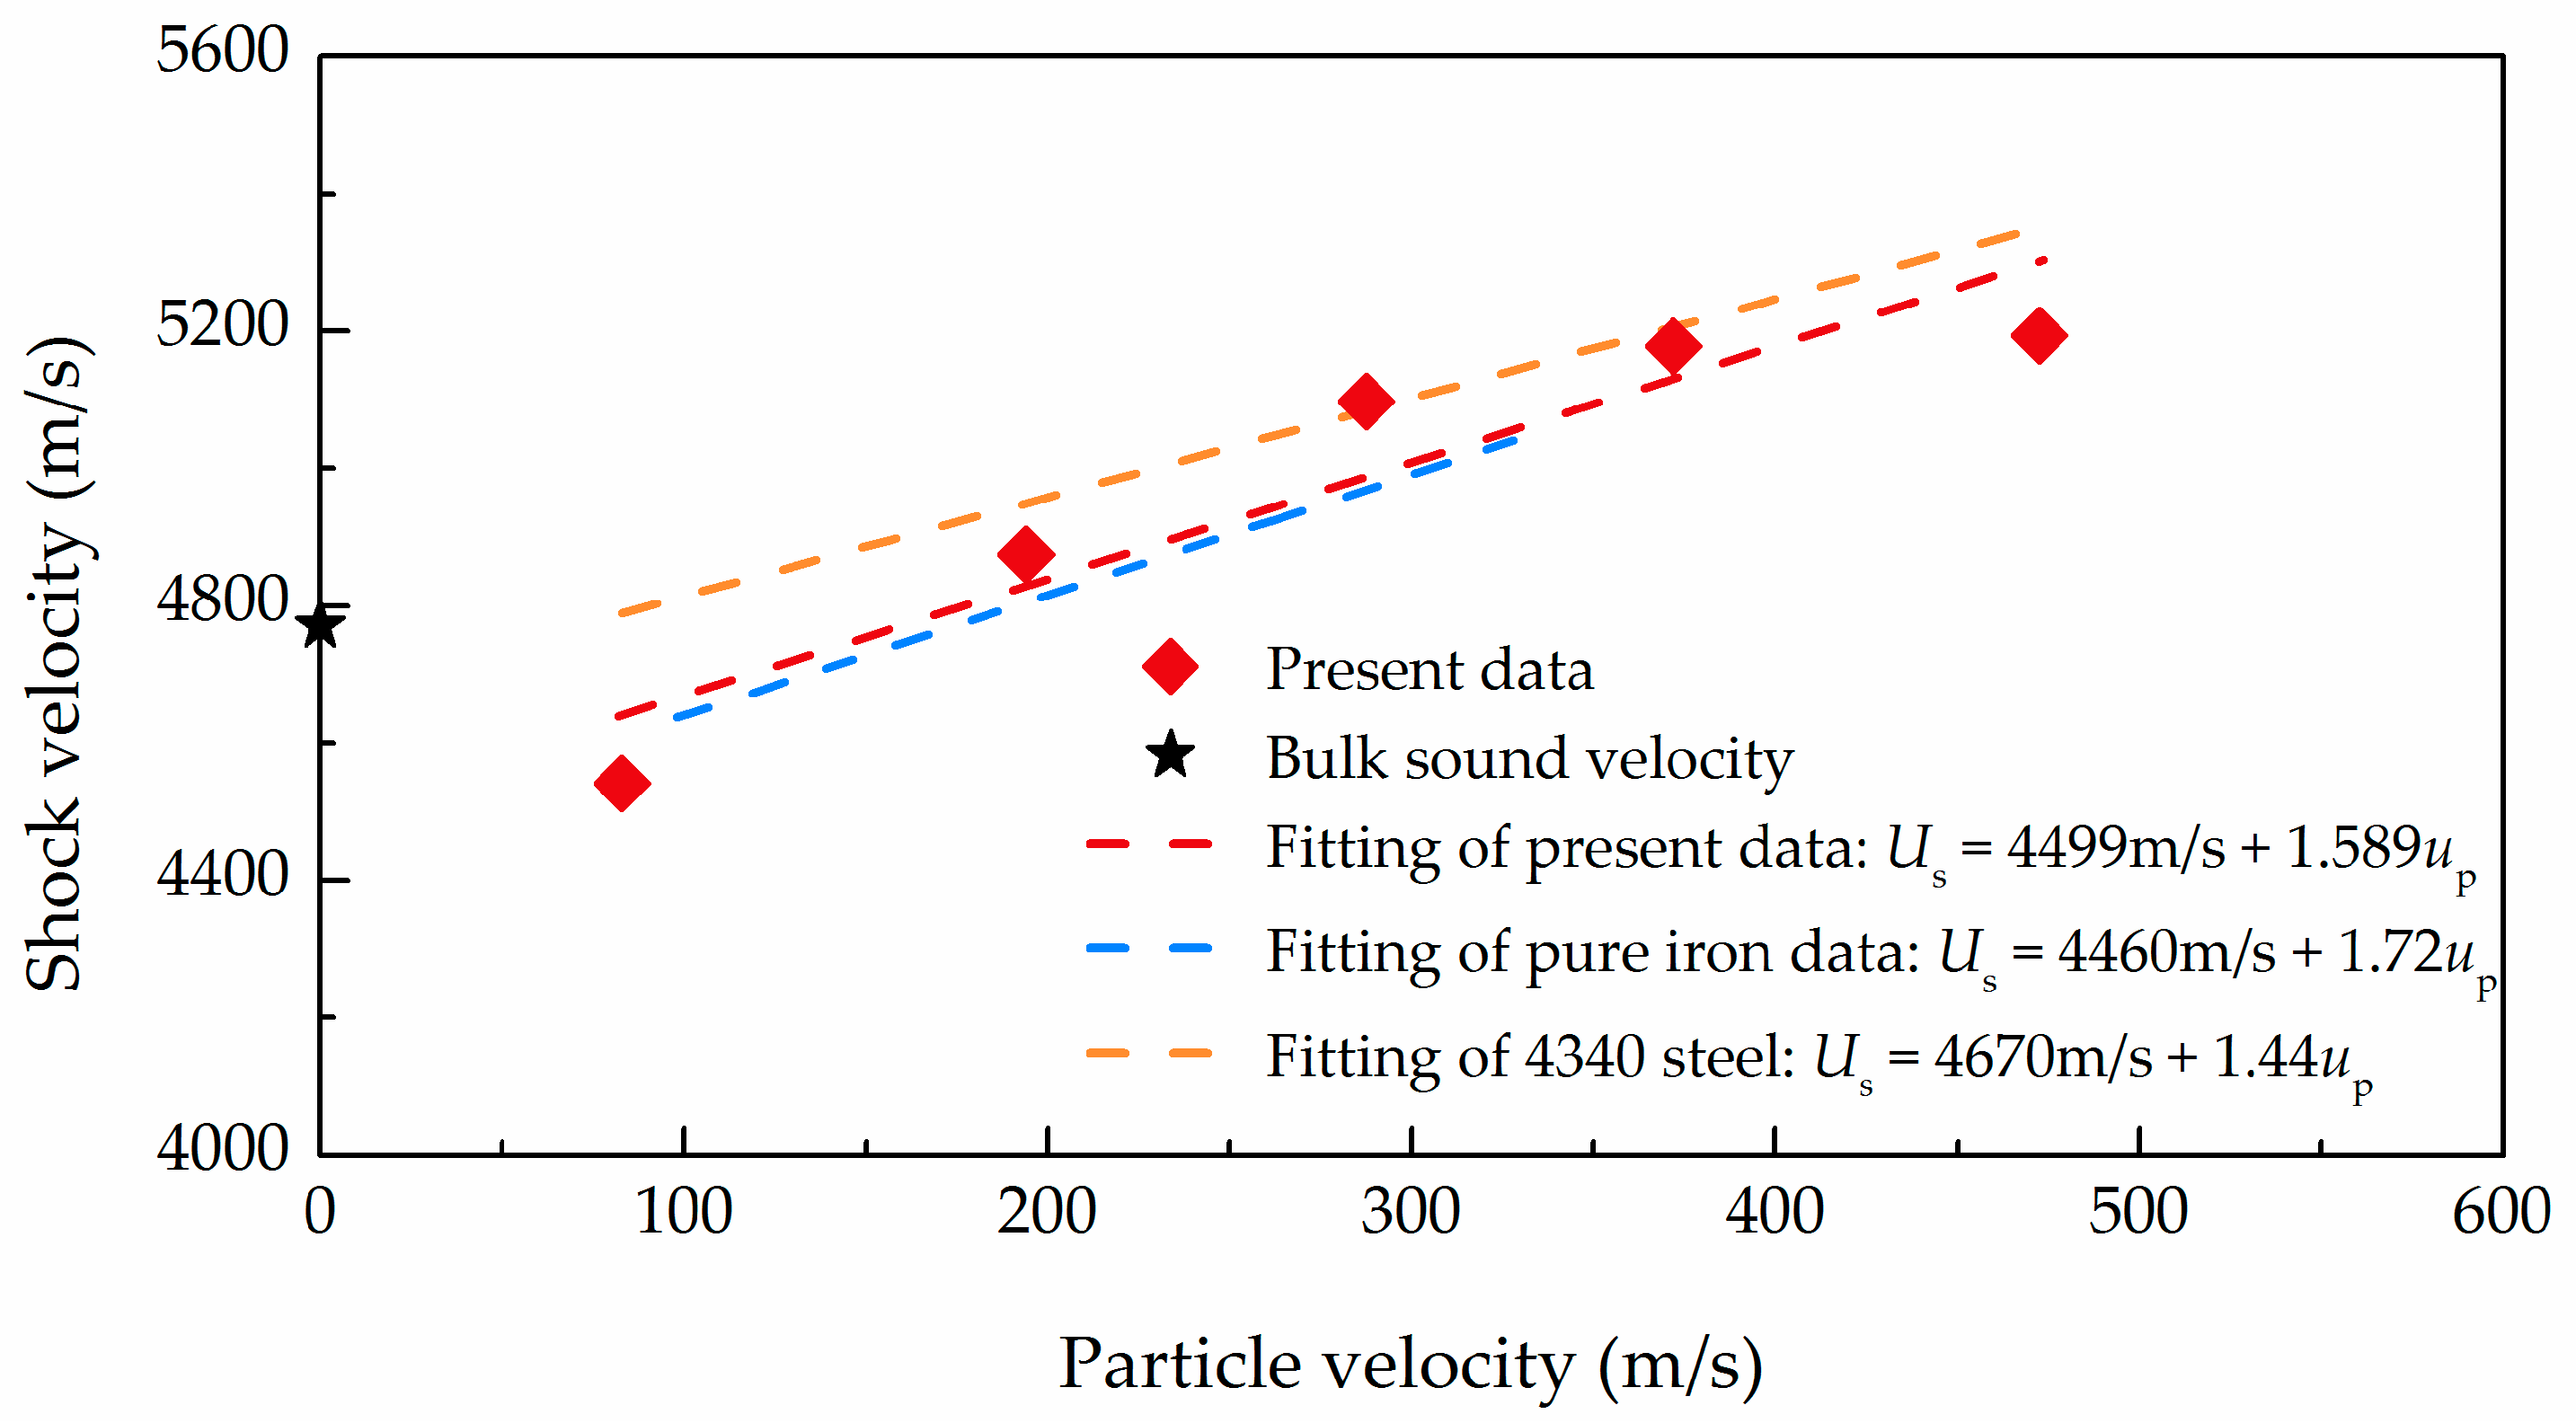
3.2. Hugoniot Relationships

The longitudinal elastic wave velocity (cL) can be determined by examining the measured particle velocity curve and using it to calculate the impact velocity. This is achieved by using the time taken for the plastic portion of the impact leading edge to reach the elastic limit as a reference value in conjunction with the specimen thickness (d):
U s = d d c L + Δ t
According to the free surface reflection law [27], the particle velocity within the material is equal to half of the rear free surface velocity. The shock velocity (US)–particle velocity (up) relationship for the Hugoniot data is presented in Figure 5 and was found to fit a linear equation given by:
U s = c 0 + S u p
where c0 is the zero-pressure bulk sound velocity and S is the slope, which is dependent on the first derivative of the bulk modulus with pressure [28].
The shock parameters c0 = 4499 m/s and S = 1.589 of the HSLA were obtained as shown in Figure 5. Data for pure iron [12] and 4340 steel [29], which are similar in composition to the steel studied here (with higher Ni content), are also presented. Our results indicate that the value of S is smaller in the HSLA compared to pure iron, while the Hugoniot intercept c0 is similar, with a deviation of only 0.87%, indicating greater resistance to compressive deformation [28]. This is likely due to the addition of other metal elements, which improves the stiffness of the steel. It should be noted that both the c0 and S values are higher in the HSLA compared to 4340 steel, potentially as a result of the increased Ni content in the HSLA, which can form a solid solution and improve the deformation resistance. Additionally, the differences in c0 values highlight the differing natures of the composites and microstructures in the various constituents.

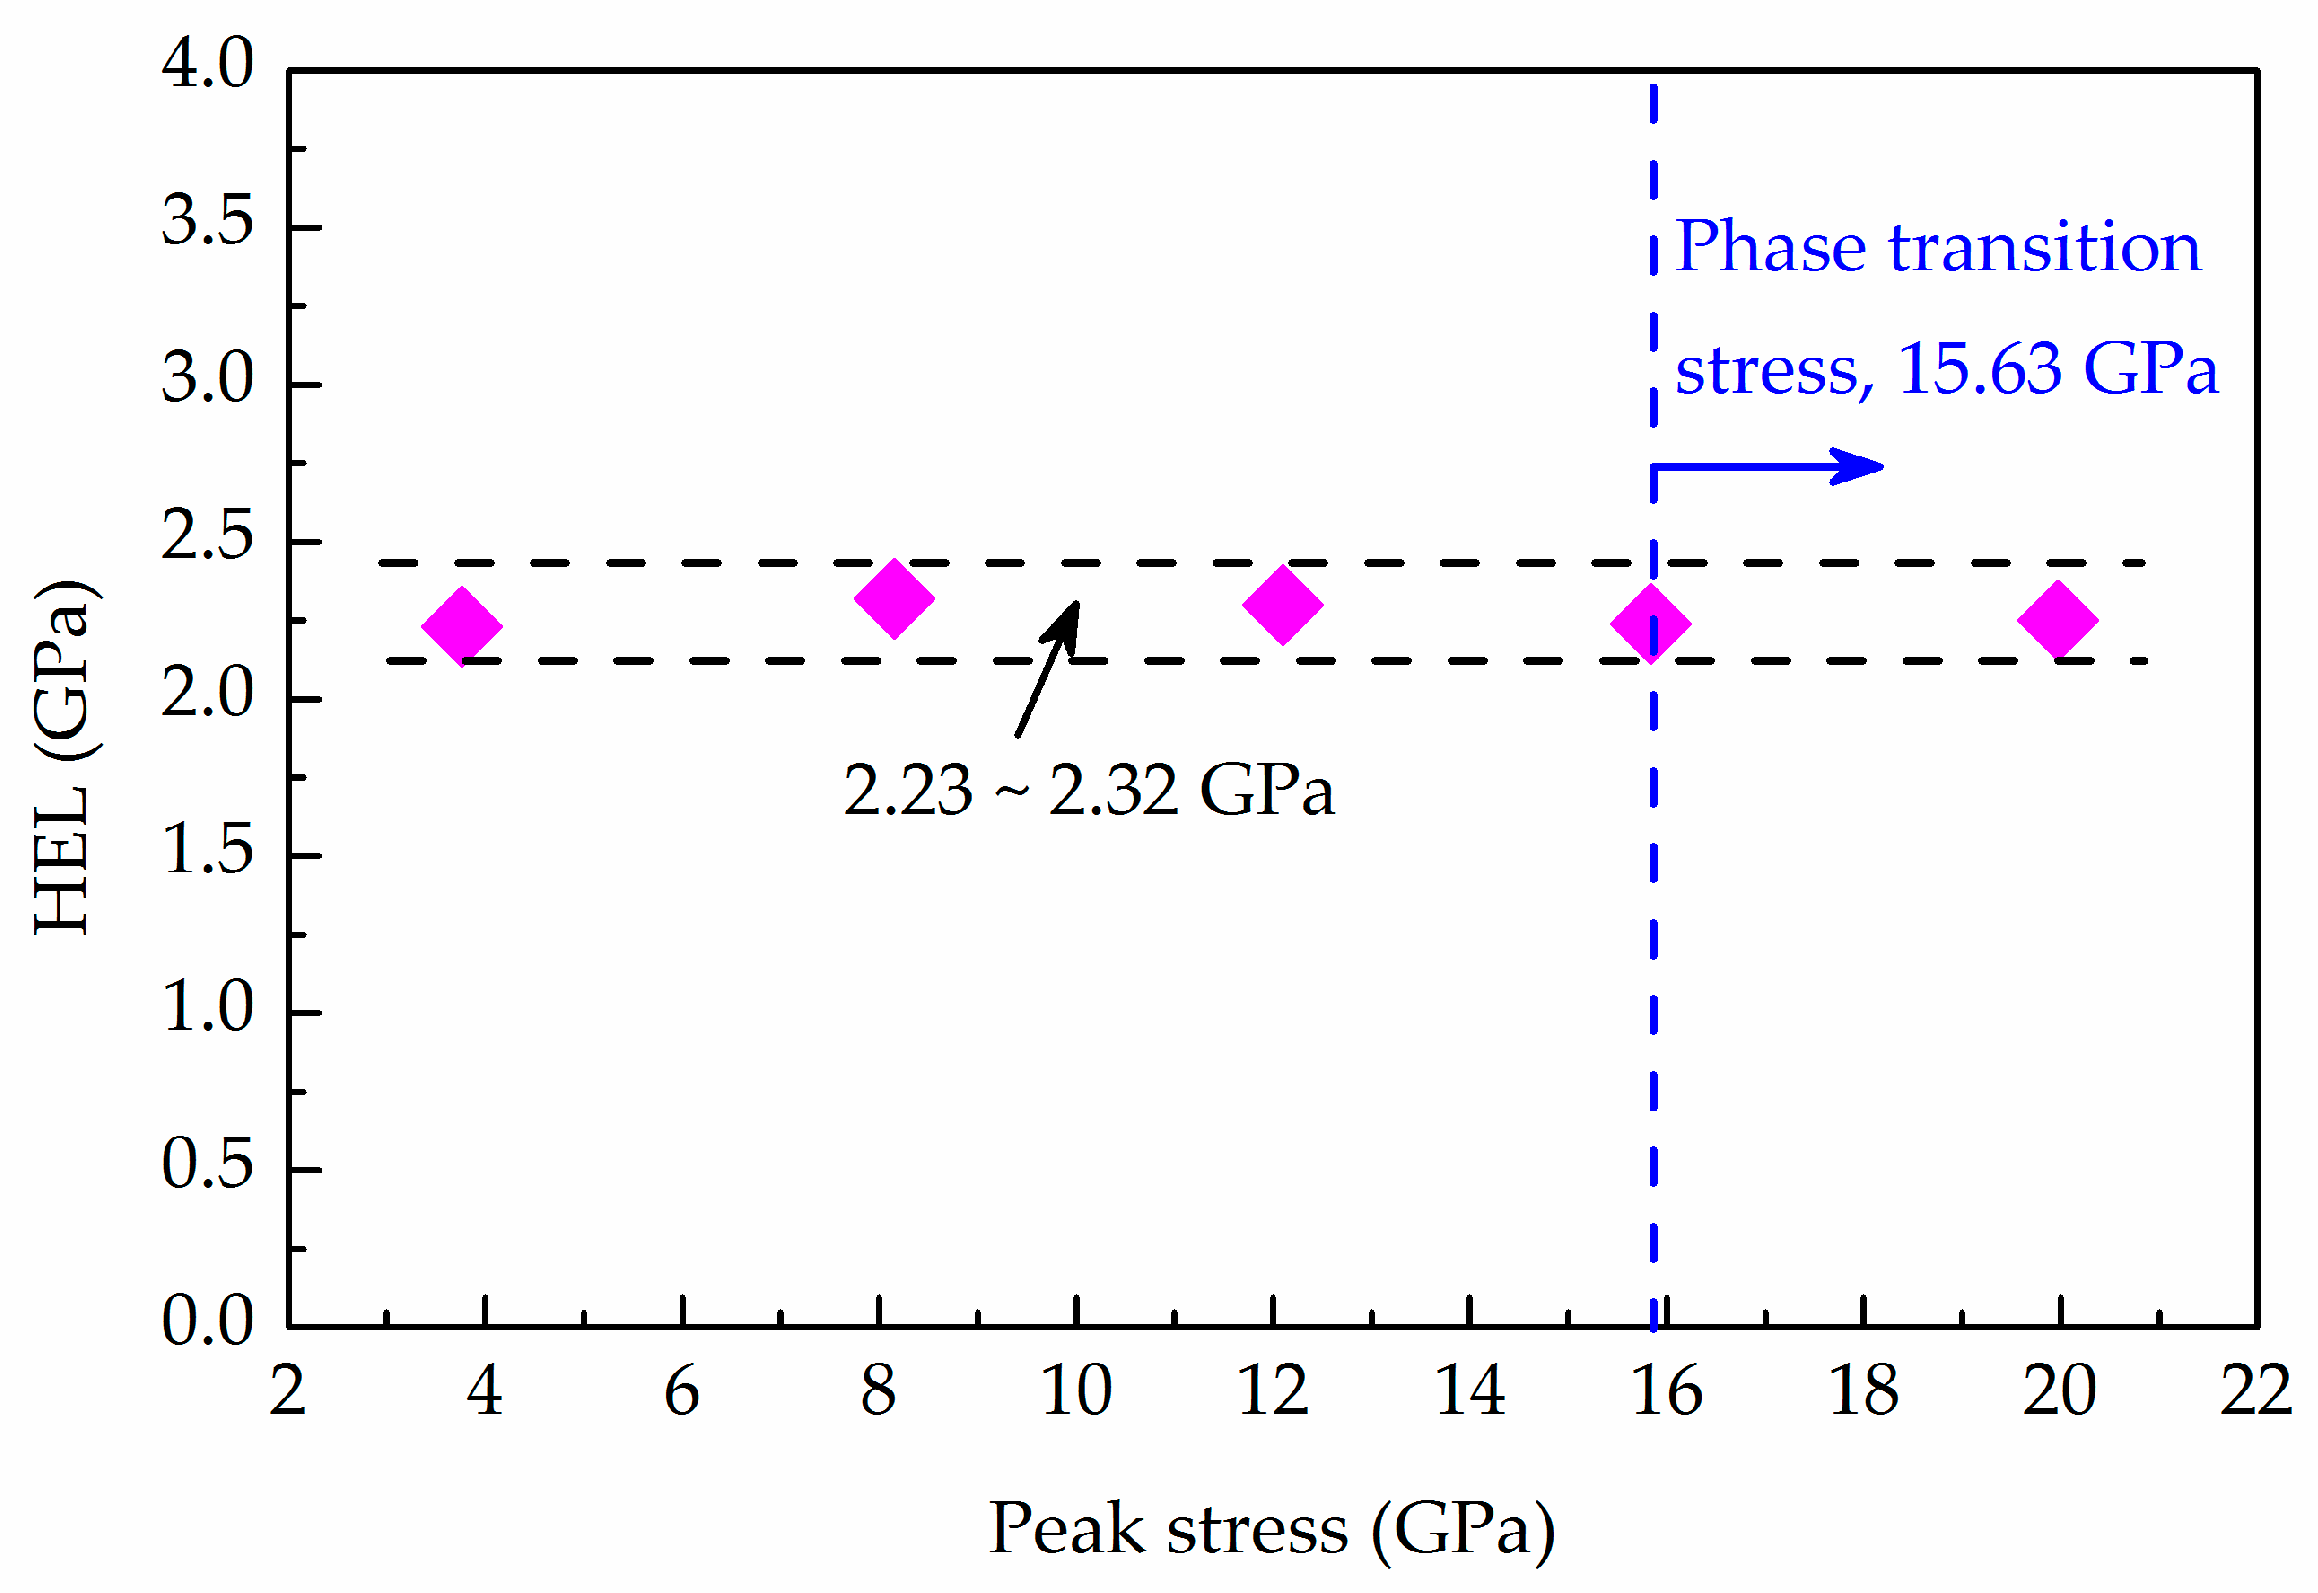
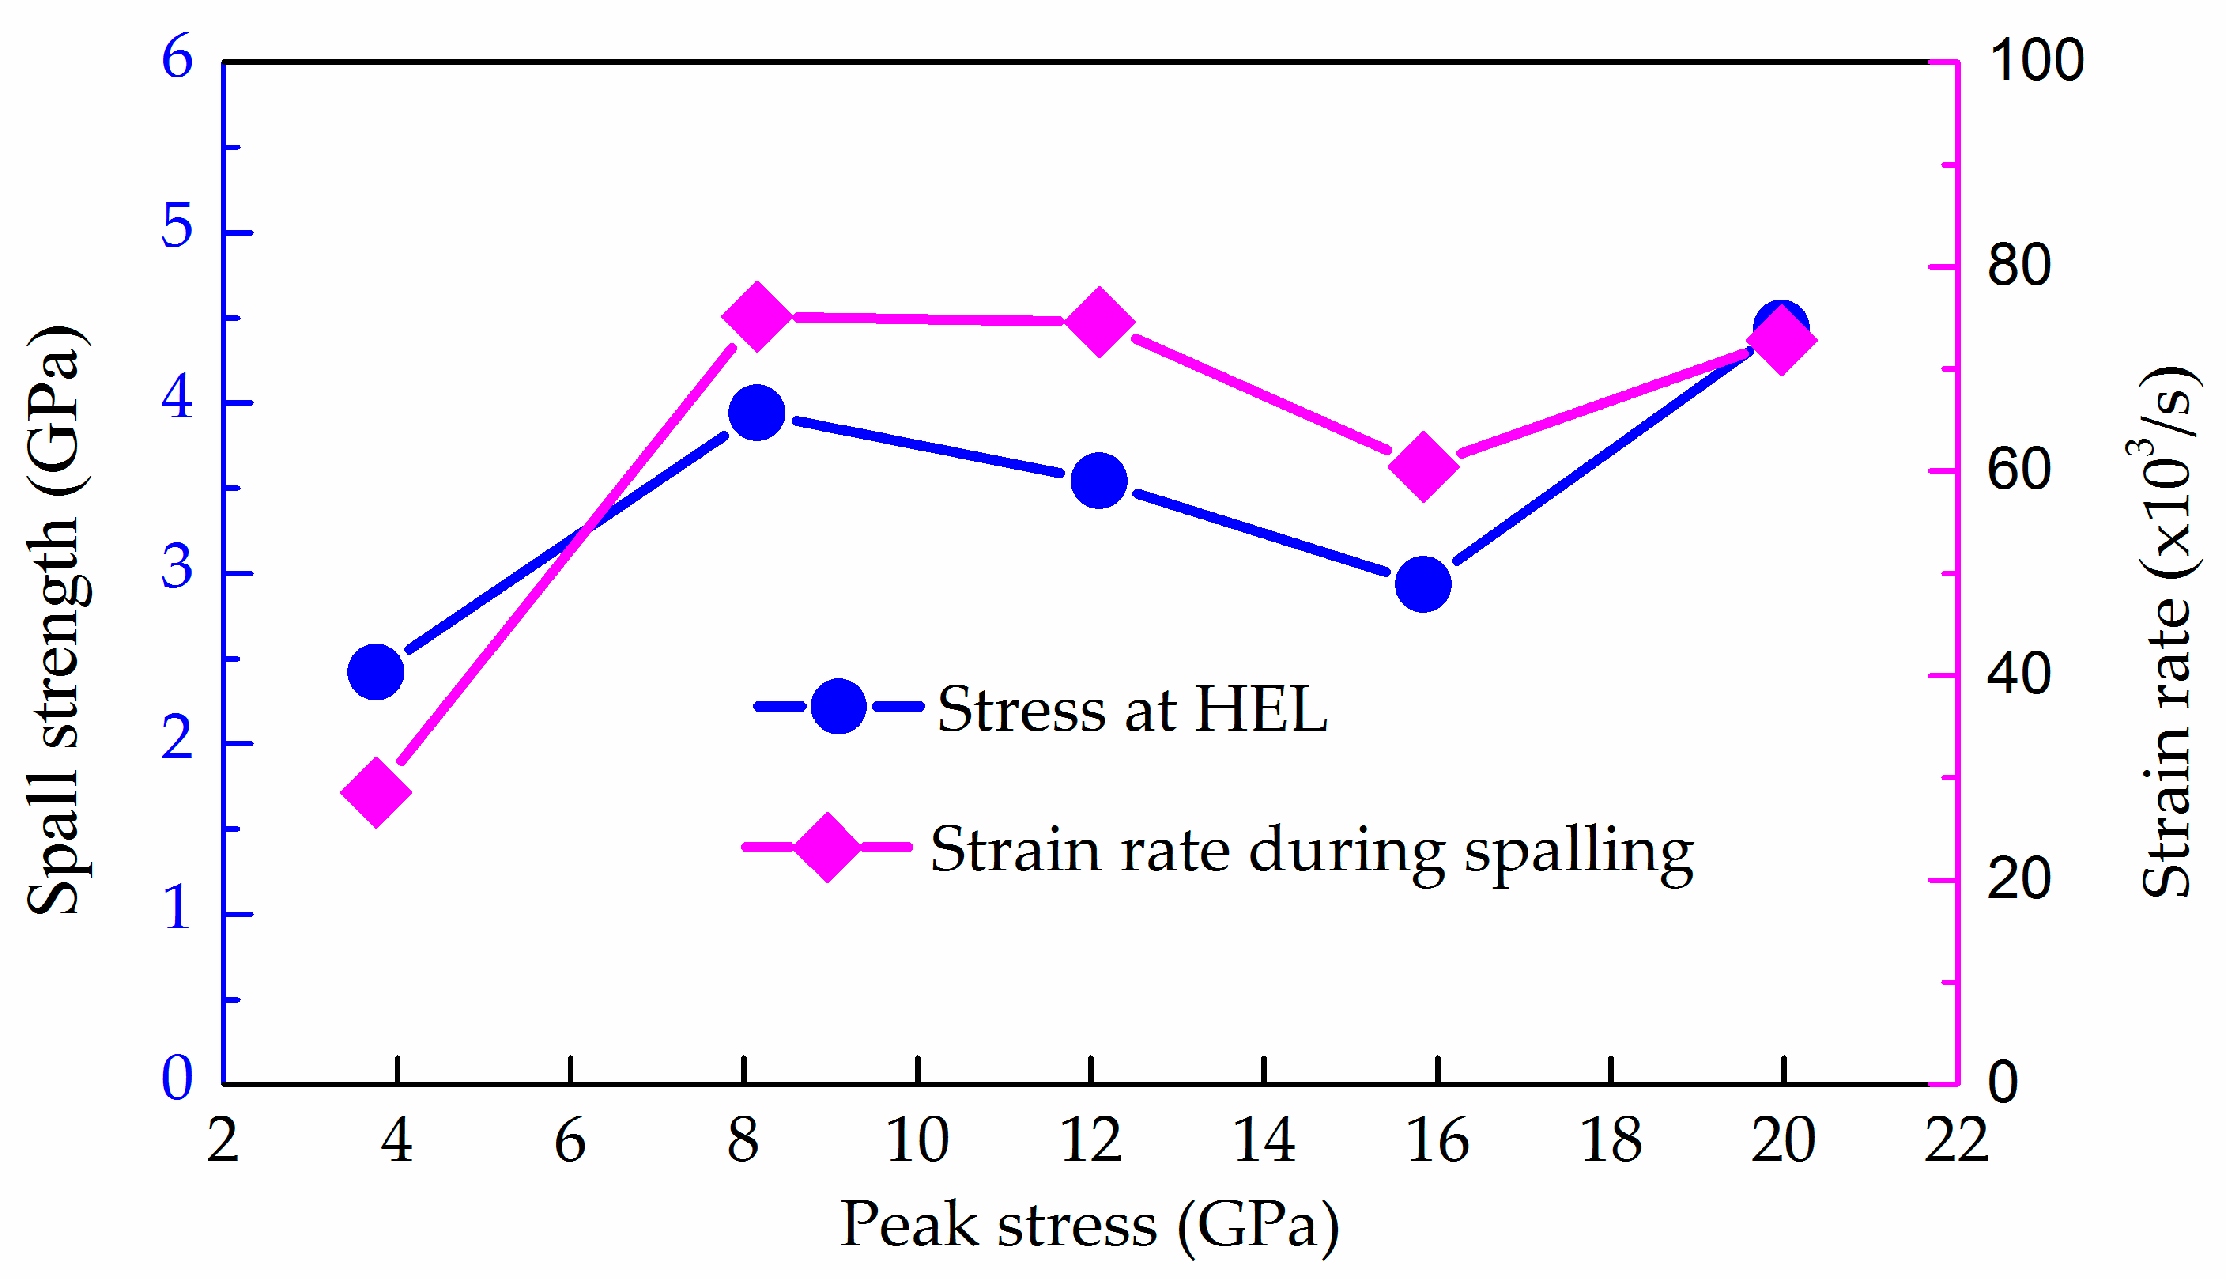
3.3. Hugoniot Elastic Limit and Spall Strength

In these experiments, the Hugoniot elastic limit and spall strength can be expressed in terms of the known density (ρ0), speeds of sound (cL and c0), and determined values of ue and Δufs based on the HEL and pullback velocity of the measured profiles as:
σ HEL = 1 2 ρ 0 c L u e
σ spall = 1 2 ρ 0 c 0 Δ u f s
where σHEL and σspall are the Hugoniot elastic limit and spall strength, ue is the particle velocity at HEL, and Δufs is the particle velocity difference between umax and umin in Figure 1.
The calculated HEL and spall strengths are summarized in Table 2. As depicted in Figure 6, the stress at the HEL of the steel is estimated to be in the range of 2.23–2.32 GPa, demonstrating a high average HEL in comparison to other conventional crystalline alloys [30,31], such as HY80 naval armor steel (1.70 Gpa), austenitic stainless steel (1.40 Gpa), and mild steel with a grain size of 48 μm (1.75 Gpa).
The results indicate that HSLA undergoes pull-out from the free surface and forms a withdrawal section under the effect of the sparse wave. The withdrawal speed and amplitude are two key characteristics of this stage, with the former being related to the tensile strain rate and the latter directly determining the spall strength of the material. The tensile strain rate can be calculated using the velocity and amplitude data:
ε ˙ = 1 2 Δ u f s c 0 Δ t
where ε ˙ is the tensile strain rate during spallation and Δt is the time difference between umax and umin.
Table 2 summarizes the calculated tensile strain rates at impact velocities from 194 m/s to 938 m/s, which range from 2.85 × 10⁴ to 7.51 × 10⁴ s−1, as shown in Figure 7. The results indicate that HSLA has high spall strength (2.42–4.44 Gpa) compared to other steels [30,32], such as Armco iron (1.07 Gpa) and 09G2S steel (0.7–1.4 Gpa). The spall strength is observed to first increase and then decrease with increasing impact stress, which is attributed to the accumulation of damage in the material during the propagation of the compression wave caused by the initial impact. This means that greater impact stress leads to a higher degree of damage. In general, the spall strength is dependent on the material’s microstructure, the history of impact loading, and the impact damage. The difference in the time sensitivity of damage initiation and propagation can explain changes in spall strength, as high strain rates may not provide enough time for dynamic loading to cause internal defects in the material, leading to a reduction in spall strength. This trend is similar to what has been observed in BMG mild steel [33].
Finally, when the impact stress increases to the α→ε phase transformation stress, the spall strength is observed to increase again. Generally, the phase transformation of the alloy occurs prior to spalling behavior and directly affects the subsequent tensile fracture behavior of the material. Therefore, this increase may be due to the large number of dislocation movements in the material’s internal lattice after the phase transformation, which leads to the hardening of the material.

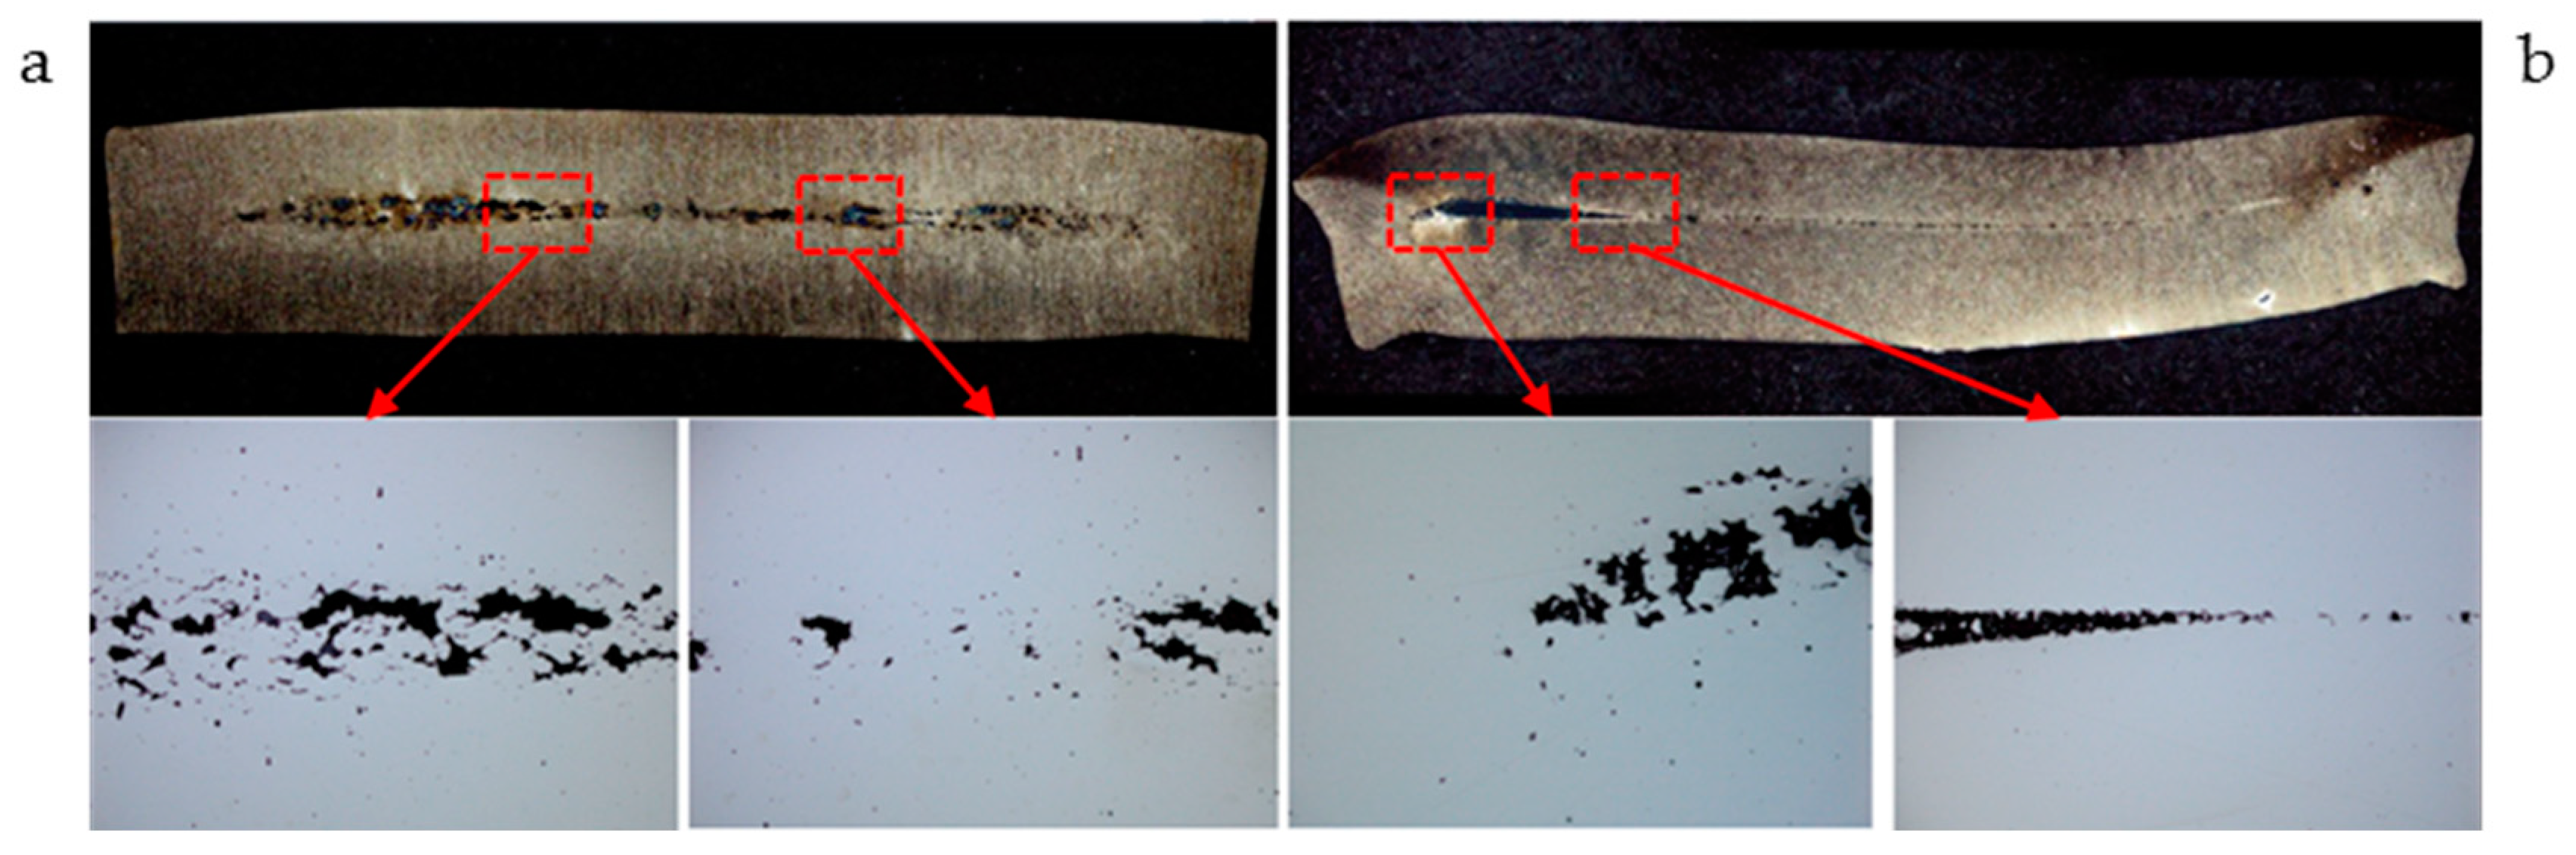
3.4. Microscopic Analysis

The fracture surface of the samples, tested under compression and tensile loads resulting from impact, was analyzed using a metallographic microscope. The observations, presented in Figure 8, revealed the internal structure of the recovered samples impacted at velocities of 598 m/s and 938 m/s.
The results show the presence of significant lamellar cracks in both samples. It can be seen that the direction of spallation is perpendicular to the impact direction and extends to both ends. In fact, the spallation inside the material occurs as a result of the interaction of tensile waves reflected from the free surface of the specimen and sparse waves from the impact surface. The sample impacted at 598 m/s displayed a higher crack density with multiple spalling layers and a higher number of micro-voids near the surface of the spalling layer. This is consistent with the widely accepted understanding of ductile dynamic tensile failure in metals or alloys, which is characterized by three stages of microscopic processes: pore nucleation, pore growth, and final fracture through pore consolidation. The interface between different grain types may serve as a point of void nucleation and crack tip, resulting in an increase in the spall strength of the material impacted at a velocity of 598 m/s. In contrast, the sample impacted at 938 m/s showed a clearer failure mode along the impact direction, with a larger crack length and crack opening and a lower crack density. This difference in failure modes is believed to be due to the hindrance of previous plastic deformation during impact loading.

4. Conclusions

The dynamic compression response of a Cr-Ni-Mo-V steel was studied in the shock stress range of 3.54–19.76 GPa. The results showed that an α→ε phase transition occurred within the material when the impact stress exceeded 15.63 GPa, leading to a step change in the particle velocity. The shock wave velocity Us was found to have a linear relationship with the particle velocity up, with a formula of Us = 4499 m·s−1 + 1.589 up. The HEL of the steel was determined to be 2.28 GPa, which remained constant despite changes in impact stress. On the other hand, the spall strength of the material first increased and then decreased with the increasing shock stresses. After the phase transformation, the spall strength increased again. The research also found that previous plastic deformation under different impact loads may affect the failure mode of the material. These findings provide new insights into the behavior of a Cr-Ni-Mo-V steel under dynamic compression and could have implications for its use in high-stress applications.

Author Contributions

Conceptualization, X.Z. and H.L.; methodology, X.Z.; validation, X.Z. and H.L.; formal analysis, X.Z.; investigation, X.Z.; writing—original draft preparation, X.Z.; writing—review and editing, H.L.; funding acquisition, X.Z. All authors have read and agreed to the published version of the manuscript.

Funding

This work was supported by the Scientific Research Foundation of Zhejiang Sci-Tech University. Grant No. 20022306-Y.

Data Availability Statement

All data included in this study are available from the corresponding author upon request.

Conflicts of Interest

The authors declare no conflict of interest.

References

  1. Yang, Y.; Fan, L.; Xu, C.; Dong, X. Experimental Study of Mechanical Properties of 30SiMn2MoVA Steel Gun Barrel Processed by Cold Radial Forging. J. Press. Vessel. Technol. 2020, 143, 22–29. [Google Scholar] [CrossRef]
  2. Kuvin, B.F. Advanced High-Strength Steels Application Guidelines Ver. 7.0. Met. Form. 2021, 22, 55. [Google Scholar]
  3. Matlock, D.K.; Speer, J.G. Third Generation of AHSS: Microstructure Design Concepts. In Microstructure and Texture in Steels; Springer: London, UK, 2009; pp. 185–205. [Google Scholar]
  4. Perka, A.K.; John, M.; Kuruveri, U.B.; Menezes, P.L. Advanced High-Strength Steels for Automotive Applications: Arc and Laser Welding Process, Properties, and Challenges. Metals 2022, 12, 1051. [Google Scholar] [CrossRef]
  5. Naylor, D.J. “Microalloyed Forging Steels.” Materials Science Forum; Trans Tech Publications, Ltd.: Zurich, Switzerland, 1998; Volume 284–286, pp. 83–94. [Google Scholar]
  6. Schino, A.D.; Gaggiotti, M.; Testani, C. Heat treatment effect on microstructure evolution in a 7% Cr steel for forging. Metals 2020, 10, 808. [Google Scholar] [CrossRef]
  7. Wu, W.; Zhu, M.L.; Liu, X.; Xuan, F.Z. Effect of temperature on high-cycle fatigue and very high cycle fatigue behaviours of a low-strength Cr–Ni–Mo–V steel welded joint. Fatigue Fract. Eng. Mater. Struct. 2017, 40, 45–54. [Google Scholar] [CrossRef]
  8. Yao, X.; Huang, J.; Qiao, Y.; Sun, M.; Wang, B.; Xu, B. Precipitation Behavior of Carbides and Its Effect on the Microstructure and Mechanical Properties of 15CrNi3MoV Steel. Metals 2022, 12, 1758. [Google Scholar] [CrossRef]
  9. Du, Y.F.; Lu, H.H.; Shen, X.Q. Coupled effects of banded structure and carbide precipitation on mechanical performance of Cr–Ni–Mo–V steel. Mater. Sci. Eng. A 2022, 832, 142478. [Google Scholar] [CrossRef]
  10. Pickering, F.B. Physical Metallurgy and the Design of Steels; Applied Science Publishers: Basel, Switzerland, 1978. [Google Scholar]
  11. Marsh, S.P. LASL Shock Hugoniot Data; University of California Press: Berkeley, CA, USA, 1980. [Google Scholar]
  12. Thomas, S.A.; Hawkins, M.C.; Matthes, M.K.; Gray, G.T.; Hixson, R.S. Dynamic strength properties and alpha-phase shock Hugoniot of iron and steel. J. Appl. Phys. 2018, 123, 175902. [Google Scholar] [CrossRef] [Green Version]
  13. Wise, J.L.; Adams, D.P.; Nishida, E.E.; Song, B.; Palmer, T.A. Comparative shock response of additively manufactured versus conventionally wrought 304L stainless steel. APS Shock Compress. Condens. Matter Meet. Abstr. 2015, 1793, 100015. [Google Scholar]
  14. Czarnota, C.; Jacques, N.; Mercier, S.; Molinari, A. Modelling of dynamic ductile fracture and application to the simulation of plate impact tests on tantalum. J. Mech. Phys. Solids 2008, 56, 1624–1650. [Google Scholar] [CrossRef]
  15. Hill, R. The Mathematical Theory of Plasticity; Oxford University Press: Oxford, UK, 1998. [Google Scholar]
  16. Wu, X.Y. The Dynamic Growth of Voids in Viscoplastic Materials; The Johns Hopkins University: Baltimore, MD, USA, 2003. [Google Scholar]
  17. Cooper, I.Z.; Rubin, M.B. Modeling damage in silicon carbide due to an impact stress below the HEL. Int. J. Impact Eng. 2014, 65, 174–184. [Google Scholar] [CrossRef]
  18. Wilkerson, J.W.; Ramesh, K.T. A dynamic void growth model governed by dislocation kinetics. J. Mech. Phys. Solids 2014, 70, 262–280. [Google Scholar] [CrossRef]
  19. Murr, L.E.; Staudhammer, K.P.; Meyers, M.A. Metallurgical Applications of Shock-Wave and High-Strain-Rate Phenomena; Marcel Dekker: New York, NY, USA, 1986. [Google Scholar]
  20. Chen, X.; Asay, J.R.; Dwivedi, S.K.; Field, D.P. Spall behavior of aluminum with varying microstructures. J. Appl. Phys. 2006, 99, 023528. [Google Scholar] [CrossRef]
  21. Jianhong, C.; Rui, C. Microscopic mechanism of cleavage fracture of weld metal. J. Met. 2017, 53, 18. [Google Scholar]
  22. Satoh, K.; Toyoda, M.; Tsukamoto, M. Mechanism of Fibrous Crack Growth under Constant Loading. Trans. Jpn. Weld. Soc. 1987, 18, 54–60. [Google Scholar]
  23. Wallin, K. The effect of ductile tearing on cleavage fracture probability in fracture toughness testing. Eng. Fract. Mech. 1989, 32, 523–531. [Google Scholar] [CrossRef]
  24. Whelchel, R.L.; Kennedy, G.B.; Dwivedi, S.K.; Sanders, T.H. Spall behavior of rolled aluminum 5083-H116 plate. J. Appl. Phys. 2013, 113, 33–482. [Google Scholar] [CrossRef]
  25. Glam, B.; Moreno, D.; Eliezer, S.; Simca, F.; Bakshi, L. The influence of hydrogen on the dynamic strength and α-ε phase transition of SAE 1020 steel. AIP Conf. Proc. 2020, 2272, 5. [Google Scholar]
  26. Brar, N.S.; Rosenberg, Z. Shock Hugoniot of 1215 Steel; American Institute of Physics: College Park, ML, USA, 1996. [Google Scholar]
  27. Dannemann, K.A.; Chalivendra, V.B.; Song, B. Dynamic Behavior of Materials. Exp. Mech. 2012, 52, 117–118. [Google Scholar] [CrossRef] [Green Version]
  28. Davison, L.; Graham, R.A. Shock compression of solids. Phys. Rep.-Rev. Sect. Phys. Lett. 1979, 55, 255–379. [Google Scholar] [CrossRef]
  29. Franz, R.E.; Robitaille, J.L. The Hugoniot of 4340 Steel RC 54-55; Army Ballistic Research Lab Aberdeen Proving Ground MD: Clemson, SC, USA, 1979. [Google Scholar]
  30. Wang, G.Y. Influence of Shock Pre-Compression Stress and Tensile Strain Rate on the Spall Behaviour of Mild Steel. Strain 2011, 47, 398–404. [Google Scholar] [CrossRef]
  31. Brown, J.M.; Fritz, J.N.; Hixson, R.S. Hugoniot data for iron. J. Appl. Phys. 2000, 88, 5496–5498. [Google Scholar] [CrossRef]
  32. Ogorodnikov, V.A.; Borovkova, E.Y.; Erunov, S.V. Strength of Some Grades of Steel and Armco Iron under Shock Compression and Rarefaction at Pressures of 2–200 GPa. Combust. Explos. Shock Waves 2004, 40, 597–604. [Google Scholar] [CrossRef]
  33. Yuan, F.; Prakash, V.; Lewandowski, J.J. Spall strength and Hugoniot elastic limit of a zirconium-based bulk metallic glass under planar shock compression. J. Mater. Res. 2007, 22, 402–411. [Google Scholar] [CrossRef]
Figure 1. Schematic illustration of the plate impact experiments for a Cr-Ni-Mo-V steel.
Metals 13 00663 g001
Figure 2. Typical free surface velocity of Cr-Ni-Mo-V steel under impact loading.
Metals 13 00663 g002
Figure 3. Rear free surface velocity vs. time of Cr-Ni-Mo-V steel at flyer impact velocities from 194 to 938 m/s.
Metals 13 00663 g003
Figure 4. Macro and micro failure modes of the recovered Cr-Ni-Mo-V steel under different impact velocities.
Metals 13 00663 g004
Figure 5. Shock velocity–particle velocity relationship for Cr-Ni-Mo-V steel along with data for pure iron from Thomas et al. [12] and 4340 steel from Franz et al. [29].
Metals 13 00663 g005
Figure 6. Calculated HEL values for Cr-Ni-Mo-V steel.
Metals 13 00663 g006
Figure 7. Calculated values of spall strength and tensile strain rate at different impact velocities for Cr-Ni-Mo-V steel.
Metals 13 00663 g007
Figure 8. Metallographic microscope observation of internal structures of recovered Cr-Ni-Mo-V steel subjected to different impact velocities: (a) vimp= 598 m/s; (b) vimp = 938 m/s.
Metals 13 00663 g008
Table 1. Experimental details of the plate impact test.
Test NumberImpact Velocity
vimp (m/s)
Thickness (mm)Diameter (mm)
SpecimenOFHCSpecimenOFHC
0011943.0581.49715.0034.97
0024103.1221.47815.0134.94
0035983.0741.47915.0135.02
0047803.0831.48714.9935.01
0059383.0751.48815.0134.95
Table 2. Experimental results for Cr-Ni-Mo-V steel obtained through plate impact test.
Test Numberupfs
(m/s)
Us
(m/s)
ue
(m/s)
σHEL
(Gpa)
σpeak
(Gpa)
Δufs
(m/s)
σspall
(Gpa)
ε ˙
(104 s−1)
001166454294.82.233.54130.22.422.85
002388487498.42.327.92212.03.947.51
003575509897.62.3011.88190.53.547.46
004744517895.22.2415.63158.02.946.04
005945519395.42.2519.76238.84.447.28
Note: None of the data presented have measurement errors or standard deviation values.
Disclaimer/Publisher’s Note: The statements, opinions and data contained in all publications are solely those of the individual author(s) and contributor(s) and not of MDPI and/or the editor(s). MDPI and/or the editor(s) disclaim responsibility for any injury to people or property resulting from any ideas, methods, instructions or products referred to in the content.

