

Physical Simulation Study on Flow Field Characteristics of Molten Steel in 70t Ladle Bottom Argon Blowing Process

1
Ningbo Iron & Steel Co., Ltd., No. 168 Lingang Second Road, Beilun District, Ningbo 315807, China
2
State Key Lab of Advanced Metallurgy, University of Science & Technology Beijing, No. 30 Xueyuan Road, Haidian District, Beijing 100083, China
*
Authors to whom correspondence should be addressed.
Metals 2023, 13(4), 639; https://doi.org/10.3390/met13040639
Submission received: 22 February 2023
/
Revised: 13 March 2023
/
Accepted: 21 March 2023
/
Published: 23 March 2023
(This article belongs to the Special Issue Advanced Tundish Metallurgy and Clean Steel Technology)
Abstract
:In the LF refining process, argon blowing at the bottom of ladle can play an important role in unifying the composition and temperature of molten steel and removing inclusions. However, unreasonable bottom argon blowing process can also cause many problems. Slag entrapment and slag surface exposure may occur, affecting the steel quality. Since the working conditions of different enterprises are very different, corresponding optimization is required for specific parameters. There were some problems in 70t ladle of a steel plant, such as unclear control of bottom argon blowing system in different refining periods, unobvious floating removal effect of inclusions in ladle, high total oxygen content and large fluctuation, etc. In this study, a 1:3 physical model was established according to the similarity principle. Then, on this basis, the experimental schemes with different blowing hole positions and argon flow rates were designed for simulation experiments. By means of mixing time measurement, flow field display and oil film measurement, the optimal argon blowing position was double holes 6, 12 (2/3R), and the included angle between them was 135°. The optimal argon flow rate for wire feeding and soft blowing should be 7.6 L/min (corresponding to the actual production of 180 L/min) and 0.6 L/min (corresponding to the actual production of 15 L/min), respectively. According to this scheme, the industrial experiments showed that the contents of total oxygen and nitrogen in the whole process were reduced, the surface density of inclusions in billet was reduced by 11.81% on average, and calcium sulfide and various inclusions containing aluminum were reduced to varying degrees.
1. Introduction
The quality of steel is closely related to the cleanliness of molten steel, and high-quality clean steel is the unremitting pursuit of the development of iron and steel industry [1,2,3,4,5]. Secondary refining plays a very important role in improving the cleanliness of molten steel, and among all refining technologies, LF refining has been widely used for its complete functions and low cost [6,7,8,9,10]. In the tens of minutes of LF refining, argon blowing at the bottom of ladle is required to promote the material transfer and energy transfer between molten steel and slag, so as to achieve the metallurgical effect of uniform the composition and temperature of molten steel and removal of inclusions [9,10,11,12]. Ladle water modelling studies were used to investigate the behavior of molten steel in the ladle during steelmaking processes [13]. Several studies had been conducted in the literature to understand the effects of different parameters on the flow patterns, mixing efficiency, and heat transfer characteristics of the ladle [14]. One of the key findings in these studies was that the flow patterns in the ladle were influenced by the ladle geometry, nozzle position, and flow rate of steel [15]. Additionally, studies had shown that the addition of gas injection could further enhance mixing and heat transfer in the ladle [16]. The gas bubbles acted as a stirring agent, promoting turbulence and increasing the contact area between the molten steel and the slag [17]. Other studies had focused on the effect of ladle preheating on the mixing and heat transfer characteristics of the molten steel. Preheating the ladle could reduce the thermal shock experienced by the molten steel during the steelmaking process and improve the efficiency of ladle mixing [18]. Overall, ladle water modelling studies had provided valuable insights into the behavior of molten steel in the ladle and had helped to optimize ladle practices in steelmaking processes. Lou used CFD-PBM coupling model to study and found that both the double-hole bottom blowing method and increasing the gas flow rate can significantly shorten the mixing time and increase the inclusion removal rate [19]. Liu and Chen simulated based on the VOF-DPM coupling model and found that the bubble size had little effect on the change of liquid steel flow, on the contrary, the gas flow had an important effect on liquid steel flow [20,21]. Zhang analyzed the technology of injecting gas to remove inclusions in molten steel by establishing mathematical model and water model experiment, and found that the gas flow rate had a great impact on improving the inclusion removal rate [22]. Lou studied the influence of gas injection on the plume and inclusion removal of stirred liquid steel, and finally found that the gas flow rate within a certain range can promote inclusion removal [23]. Geng established a ladle model with porous structure, described the impact of inclusion removal, extracted the data of turbulent kinetic energy, turbulent energy dissipation rate, inclusion number density and so on in the ladle. Through data analysis, it was concluded that porous structure was more conducive to the removal of inclusions in ladle than single-hole structure. Finally, it was concluded that top-slag adsorption was the main way to remove inclusions [24].
In the actual production process, different production conditions lead to different process parameters for optimal argon blowing effect in ladle soft blowing process, so it is necessary to conduct corresponding research based on specific parameters and conditions [25,26]. There were some problems in 70t ladle of a steel plant, such as unclear control of bottom argon blowing system in different refining periods, unobvious floating removal effect of inclusions in ladle, high total oxygen content and large fluctuation, etc. To solve this problem, a 1:3 water physical model was established in the laboratory, which was used to optimize the prototype ladle bottom argon blowing system and determine the reasonable ladle bottom argon blowing position and flow rate [27]. The final industrial experiment was carried out to verify the optimization effect and provide theoretical and practical guidance for the production of high value-added clean steel such as bearing steel in this mill.
2. Experimental Method
2.1. Experimental Equipment
The experimental equipment in this study was shown in Figure 1. Argon gas was used in both physical simulation and actual production. The argon gas stored in the cylinder was blown into the scaled-down water model through the gas flow meter and valve. Two conductance electrodes for measuring conductivity were placed below the liquid level and above the bottom of the ladle and at the same two positions from the ladle walls on both sides of the ladle. The two electrodes were on the same diameter. In each experiment, 200 mL of saturated KCl solution was added as a tracer. Then, the conductivity value of KCl was collected by the DJ800 detection system for a period of time after adding KCl, and the change law was analyzed by computer. The camera was mainly used to visually record the dynamic flow field after adding dye and the change law of slag eye after adding oil film under different working conditions.
2.2. Experimental Principle
2.2.1. Geometric Similarity
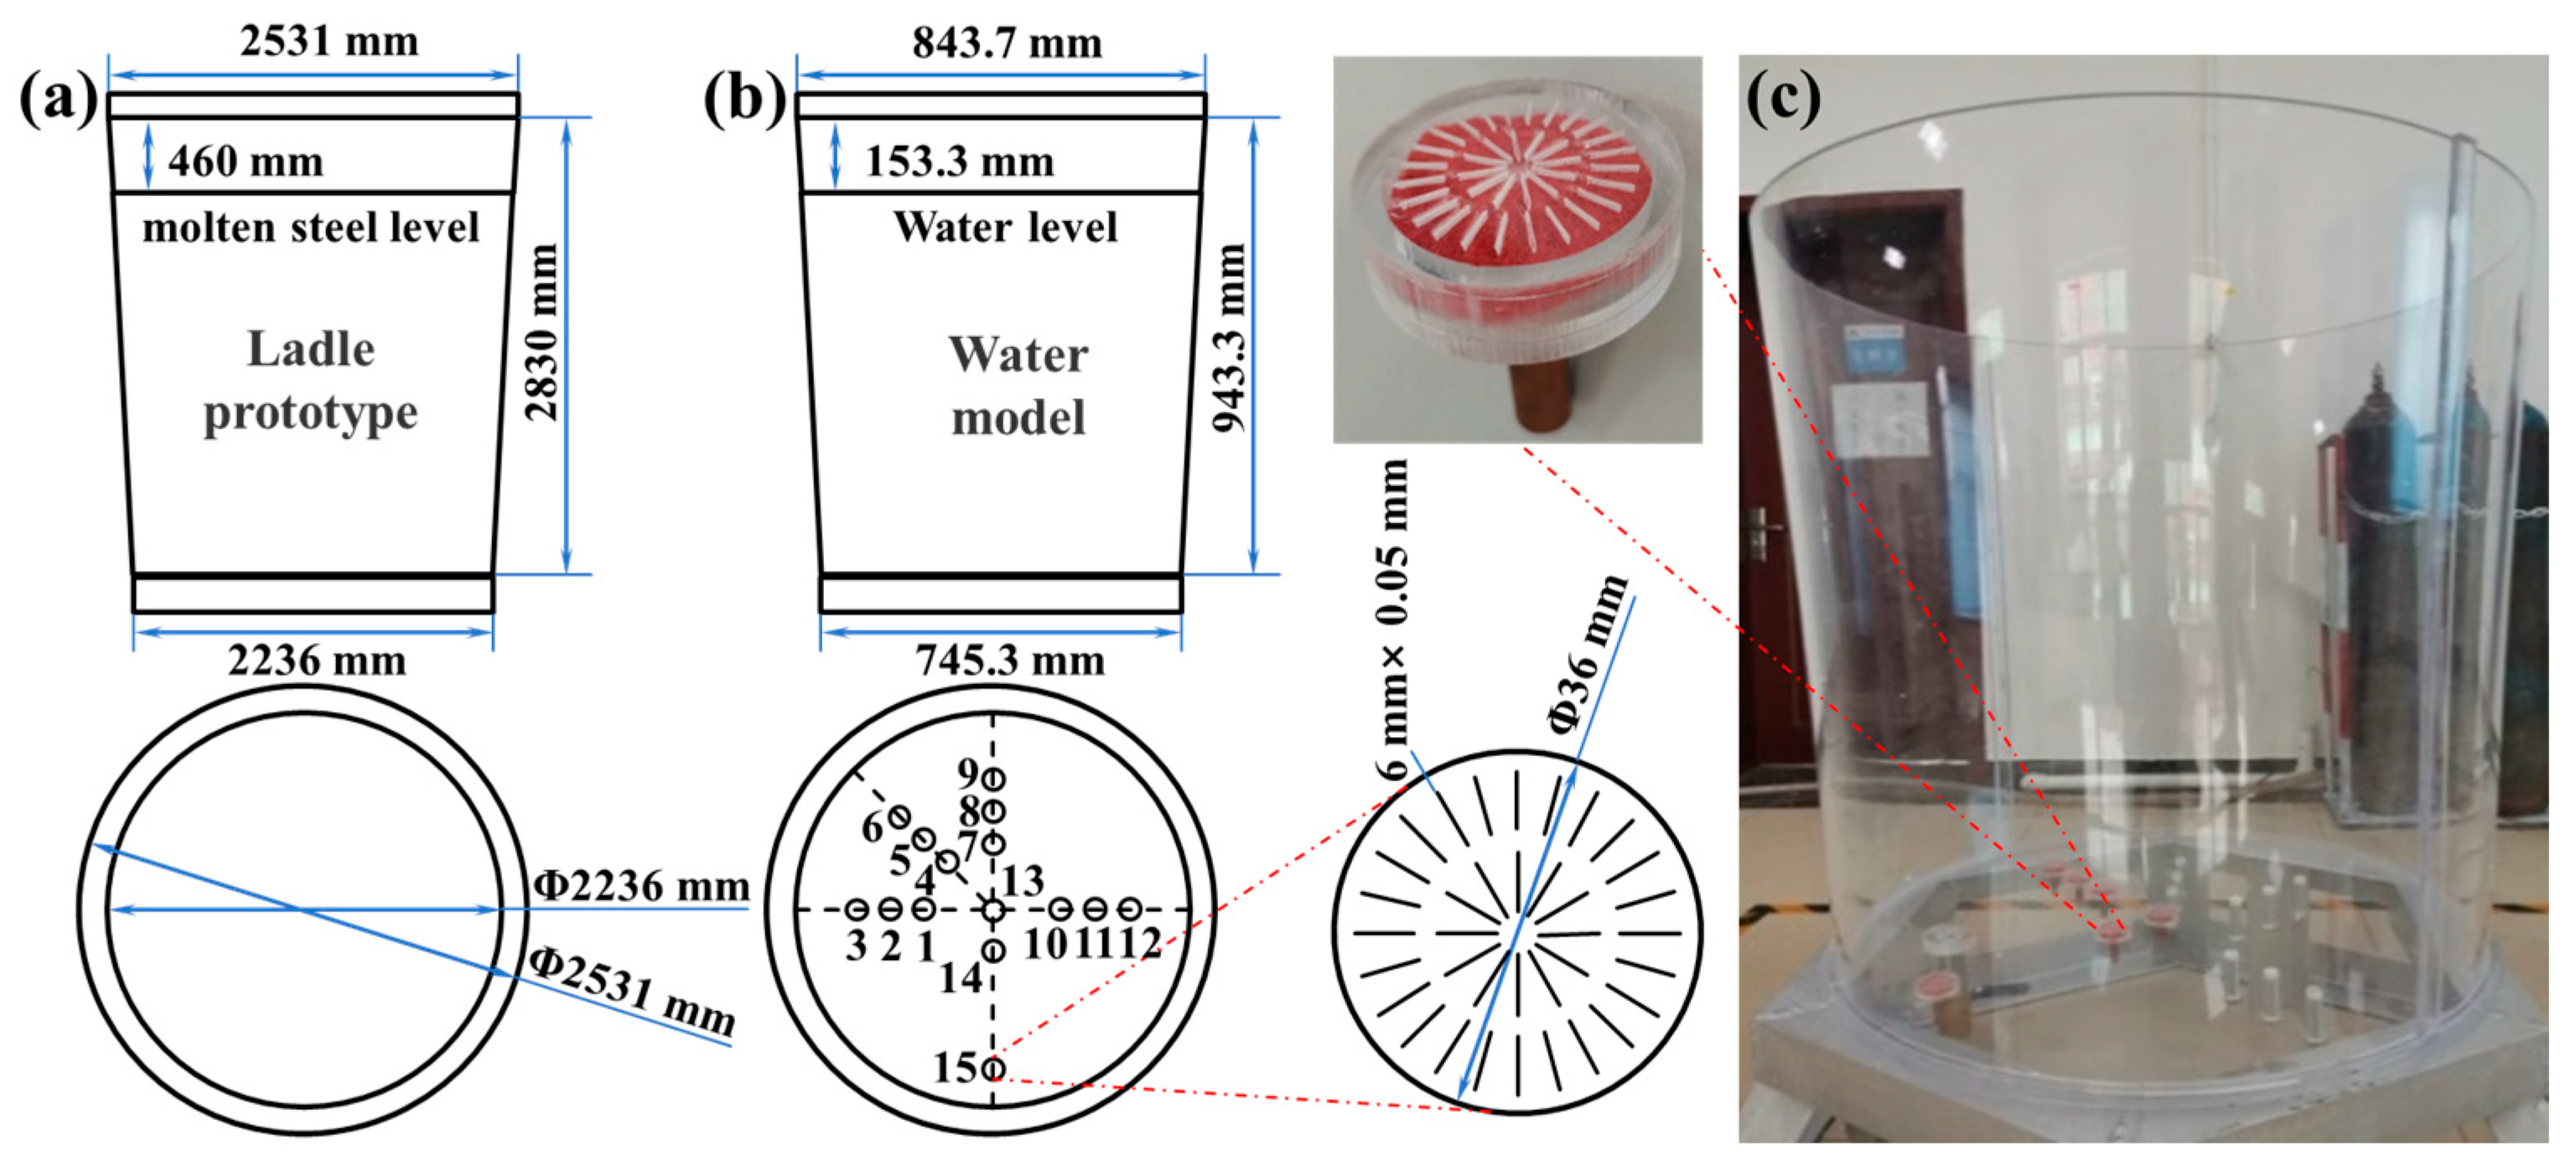
According to the size of 70t ladle and permeable brick in this steel plant, the similarity ratio adopted in designing ladle physical model was 1:3, and the dimensions of prototype and water model was shown in Table 1 and Figure 2. The ladle used on site had a bottom blow hole at positions 2 and 11 in
Figure 2b, respectively. Therefore, the blowing holes were added at the positions of 1/5R, 1/3R, 1/2R, 2/3R, and 4/5R in the radial direction, avoiding the nozzle, as shown in Figure 2b. The number and position details of each hole were shown in Table 2. There was the following relationship between each position: holes 1, 2, 3, 10, 11 and 12 were on the same diameter, holes 7, 8, 9, 14 and 15 were on the same diameter, and the above two diameters were perpendicular to each other. The holes 4, 5, and 6 were on the same radius, and the radius was at an angle of 45° with the above two diameters.
2.2.2. Dynamic Similarity
Dynamic similarity was the key to similarity conditions. In the process of blowing argon at the bottom of ladle, the most important movement was the movement of argon bubbles [28]. The motion was mainly carried out under the action of buoyancy and had little relation with viscous force. Therefore, when considering the dynamic similarity of this physical simulation, it was only necessary to make the Froude numbers equal [29]. In order to obtain the corresponding blowing volume of the model, further theoretical deduction was needed. The modified Froude number can be defined as Equation (1), where the characteristic velocity was calculated as Equation (2). According to the equality of Froude number in the water model and the actual ladle, Equation (3) can be obtained by bringing in the actual value. The blowing volume of the model can be obtained by using Equation (3), and the specific values were shown in Table 3.
where was the gas density, was the liquid density, was the viscosity, g was the gravitational acceleration, was the liquid level, was the volume flow rate, was the nozzle diameter, was the actual blowing flow rate of the ladle, and was the indicated value of the water model gas flowmeter.
2.2.3. Slag Steel Interface Similarity
For the simulation of steel slag, the most important thing to be determined was the density. Different from the dynamic similarity, because the slag-steel interface was mainly affected by surface tension, it was necessary to ensure that the We criteria were equal besides Froude criteria, and Equation (4) can be obtained [30,31]. When the actual value was brought in, it can be known that kg/m3. According to the literature research, the density of 100# vacuum pump oil was 879 kg/m3, which was close to the calculated density. Therefore, 100# vacuum pump oil was used for the simulation of steel slag.
where was the surface tension of water-oil, was the surface tension of steel-slag, was the density of oil, was the density of molten slag.
2.3. Experimental Characterization
2.3.1. Mixing Time
The shorter the time required for the molten pool to reach the mixed state, the better the smelting effect. Ladle refining was to drive the movement of molten steel by blowing argon bubbles at the bottom. On the one hand, it accelerated the transfer of substances in the molten steel, on the other hand, it was beneficial to the heat transfer of the molten steel and improved the temperature uniformity. Therefore, mixing time can be used as an important evaluation index for the optimization of ladle bottom blowing. In this study, the stimulus-response method was used to determine the mixing time [32]. In the experiment of the water model, it was usually considered to be in the mixed state when the response signal of a specific location was basically unchanged, and then the time from adding the tracer to reaching the mixed state can be obtained. In this experiment of argon blowing at the bottom of ladle, the tracer was saturated KCl solution, and the monitored response signal was conductivity. The DJ800 monitoring system was used to measure the conductivity of the two points and obtain the mixing time. It should be noted that before adding the tracer, argon gas was introduced into the water model for a few minutes, and the measurement was performed after the liquid flow in the container stabilized.
2.3.2. Flow Field Display
Due to the black box property of the ladle, it was impossible to directly obtain the characteristics of its internal flow field. In order to evaluate and compare flow fields, researchers had developed a variety of flow field display methods. According to different principles, it can be divided into particle tracer method and optical display method, which mainly included direct tracer injection method, wall tracer method, silk thread method, chemical tracer method, electronic control method and optical tracer method [33]. In this study, the color liquid method in optical tracer was used to study the water model of argon blowing at the bottom of ladle. After the argon was blown into the liquid and flows stably, KMnO4 solution was added to the ladle water model. At the same time, the camera was used to shoot, and the flow field under different working conditions was recorded for comparative analysis.
2.3.3. Oil Film Measurement
When ladle bottom blowing was used for refining, the steel slag would inevitably be blown away, thus forming a slag eye [34]. This might cause secondary oxidation of molten steel, and then slag entrapment, which would have a great impact on the quality of steel. Therefore, it was also necessary to pay attention to the size of slag eye and the degree of slag entrapment in the model study, so as to determine the reasonable argon blowing flow rate. Prior to this experiment, water was first added to the specified height in the plexiglass model, and then oil was added to the surface of the water to the calculated layer thickness. When the whole oil layer was calm, the gas was blown under different argon flow rate and blowing position. The camera was used to record the change of slag eye and the specific situation of slag entrapment. Finally, ImageJ was used to statistically analyze the size of slag eyes.
2.3.4. Field Sampling Analysis
The metallographic samples were prepared by hot setting using a metallographic inlay machine. Then, the metallographic samples were ground and polished by a fully automatic grinding and polishing machine. The treated specimen was observed under a light microscope to ensure that the surface was clean enough to avoid the presence of foreign objects affecting the observation results of subsequent inclusions. After the above operation, LECO oxygen and nitrogen analyzer and ASPEX automatic inclusion scanning system were used to detect and analyze the oxygen and nitrogen content and the number of inclusions.
3. Results and Discussion
3.1. Single Hole Bottom Blowing Experiment
3.1.1. Mixing Time
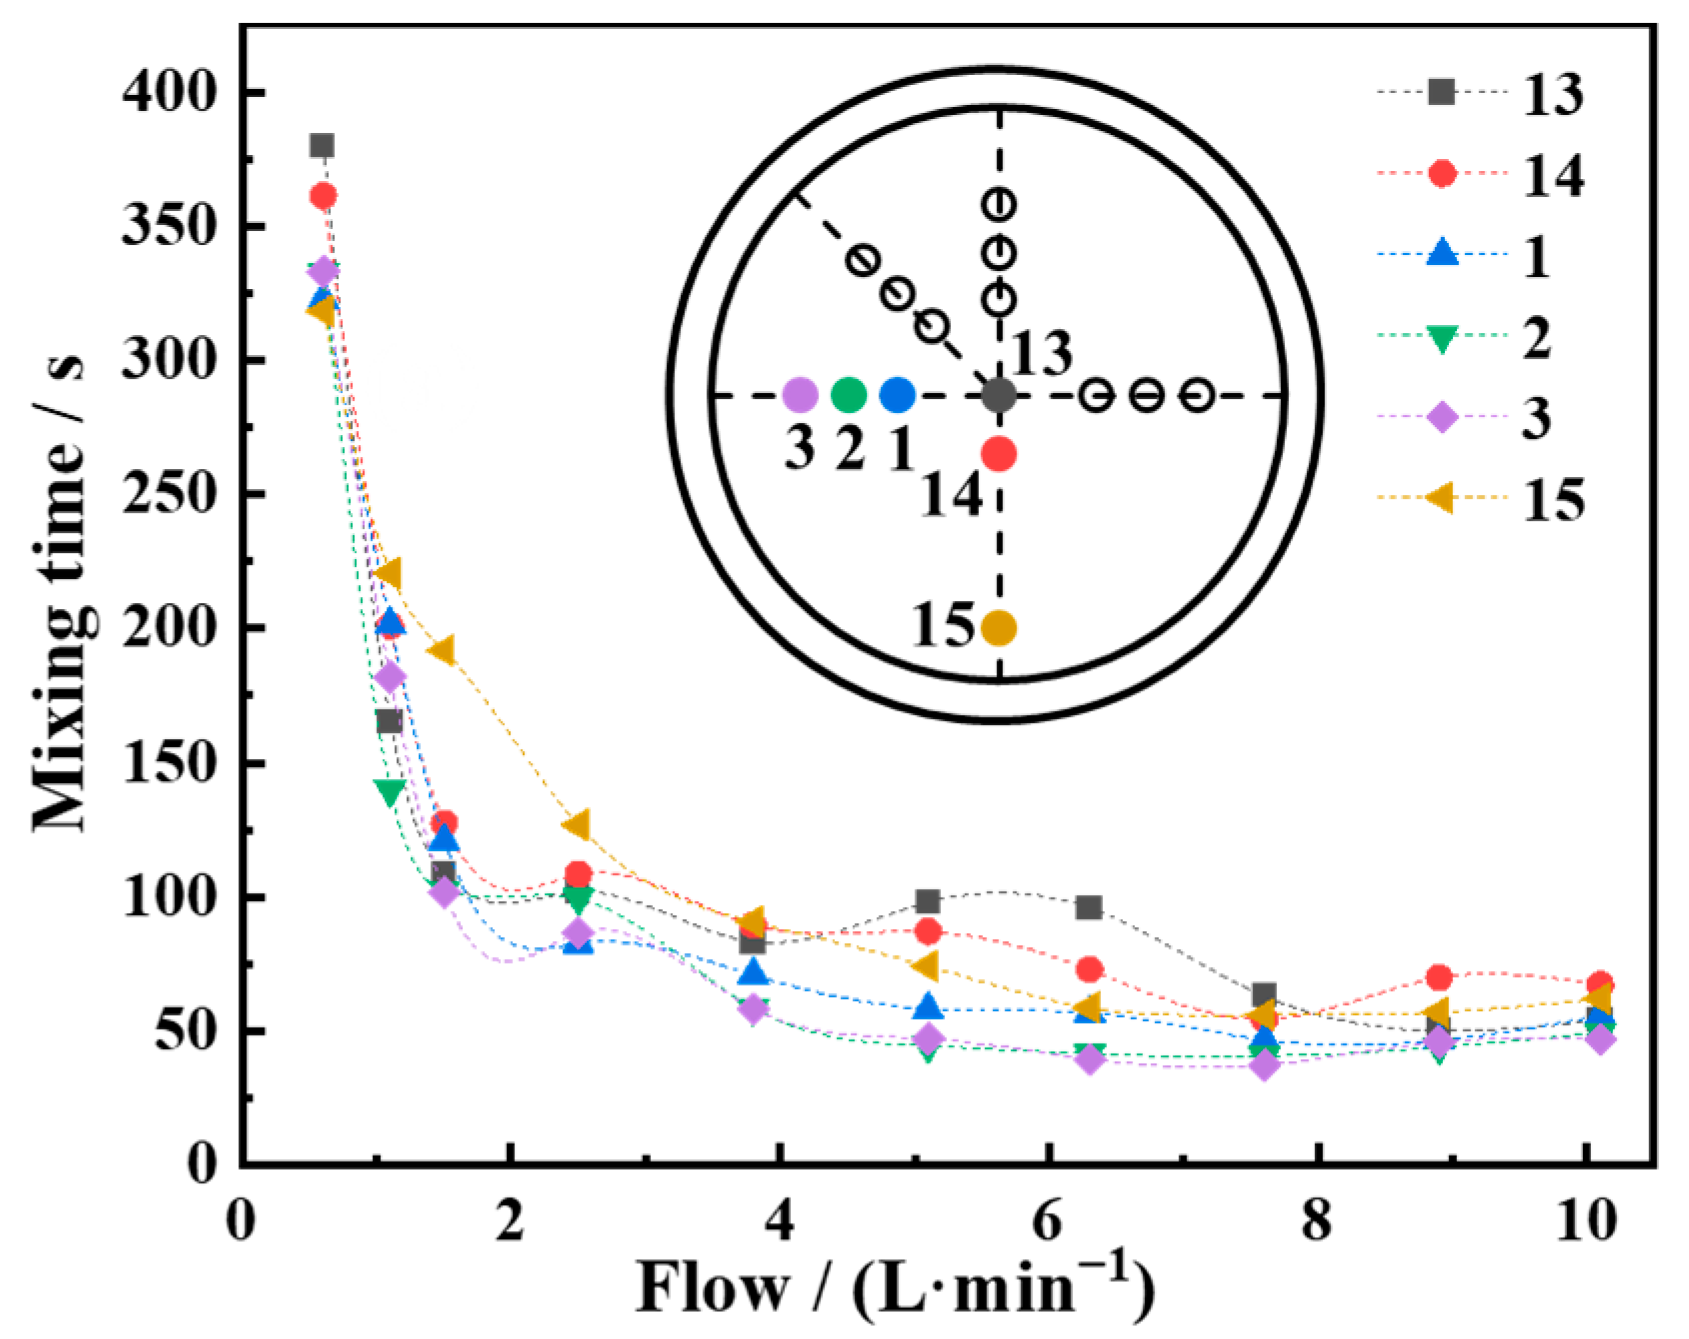
In the single-hole bottom blowing experiment, the mixing time at 6 positions of holes 13, 14, 1, 2, 3 and 15 under different blowing flow rates was carried out, as shown in Figure 3. It can be seen from the figure that the overall trend of the curve was downward, that is, the flow rate increased and the mixing time decreased. After careful analysis of the curve coordinate points, it can be found that within a certain range of blowing flow, the mixing time decreased rapidly, and after reaching a critical value, the decreasing trend would slow down or even increase. This showed that the air blowing rate at the inflection point of the model was 7.6 L/min. After that, the increased air blowing rate was almost used to cause the fluctuation of slag surface, rather than the mixing of molten steel, which not only affected the mixing effect, but also caused slag entrapment. It can also be found that with the distribution of the blowhole position from the center to the wall, the mixing time first increased, then decreased, and then increased. The mixing time of the single-hole blowing position within the distance of 1/2R-2/3R was smaller than that of the center position. Therefore, in the single-hole blowing experiment, if only mixing time was considered, hole 2 and hole 3 were the better choices.
3.1.2. Flow Field Display
In the flow field display experiment, the color display reagent potassium permanganate solution was added to display the flow field and qualitatively judge the flow state in the ladle. The time of each group of photos taken by the camera was 0–30 s, and the time interval was 5 s. In order to further determine the optimal scheme, the flow field of hole 2 and hole 3 at the blowing flow rate of 7.6 L/min was photographed, as shown in Figure 4. After analyzing the results of the flow field display experiment, it was found that at the 25th second, the color of the whole flow field of the two was basically uniform. However, at this time, the color of the flow field in the hole 3 scheme was slightly lighter and uniform as a whole, and there was no darker color position. On the contrary, the color in the middle of the flow field in the hole 2 scheme was darker, and the color on both sides was lighter. This showed that the mixing degree of the former was better than that of the latter.
3.1.3. Exposed Molten Steel
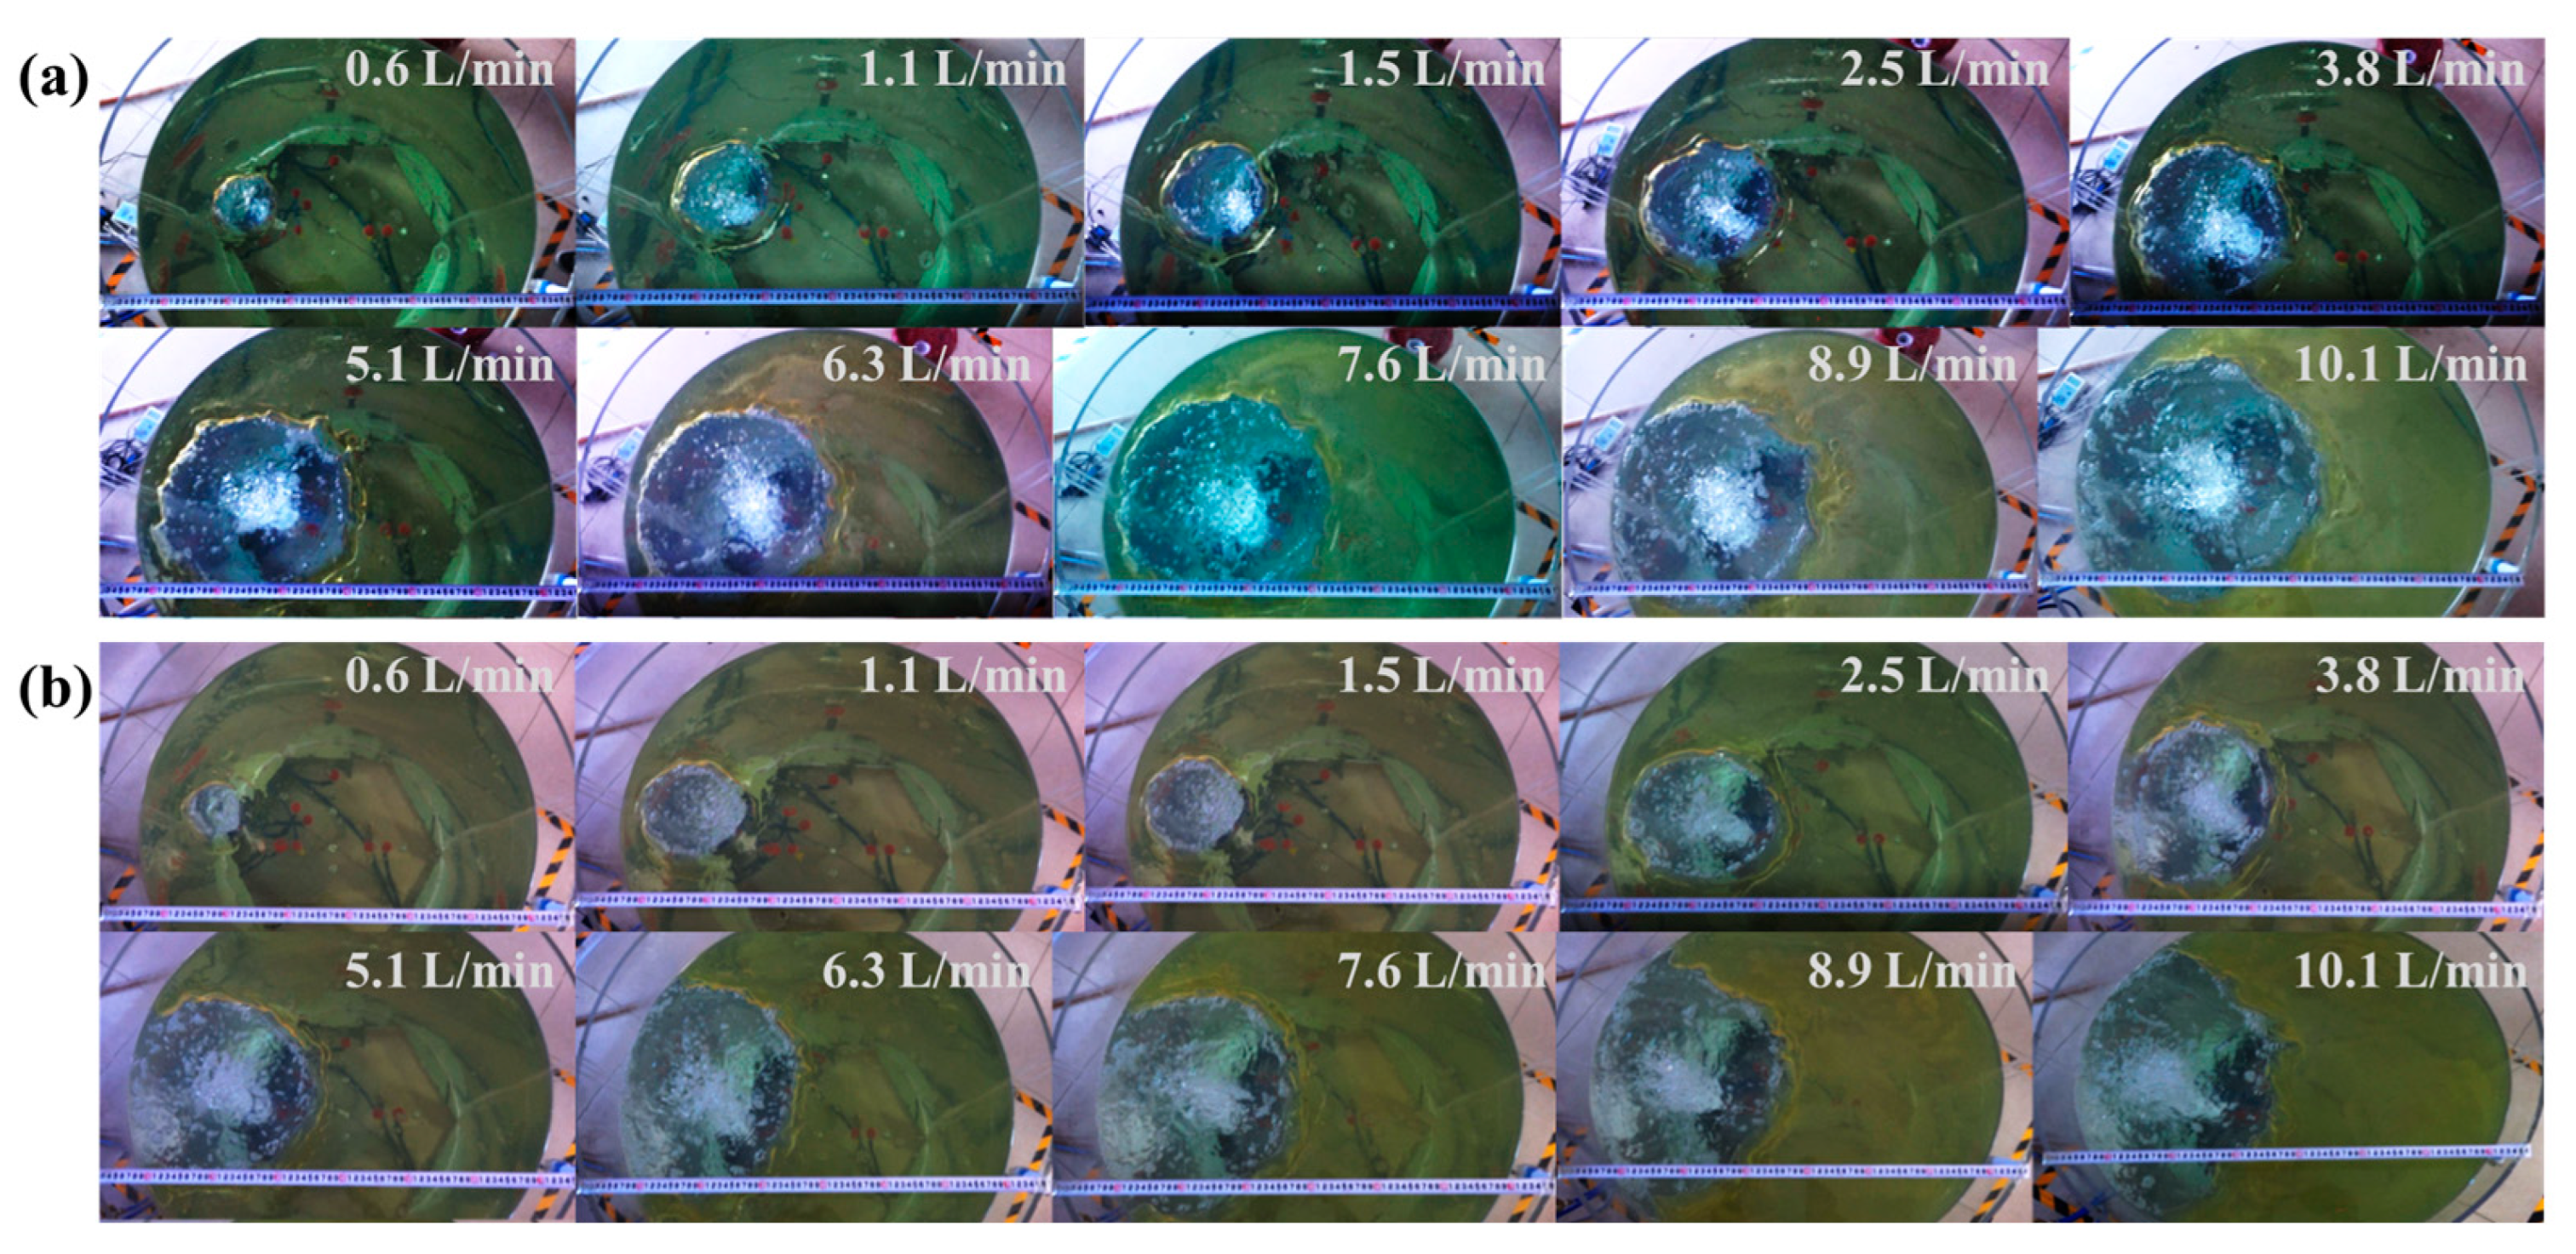
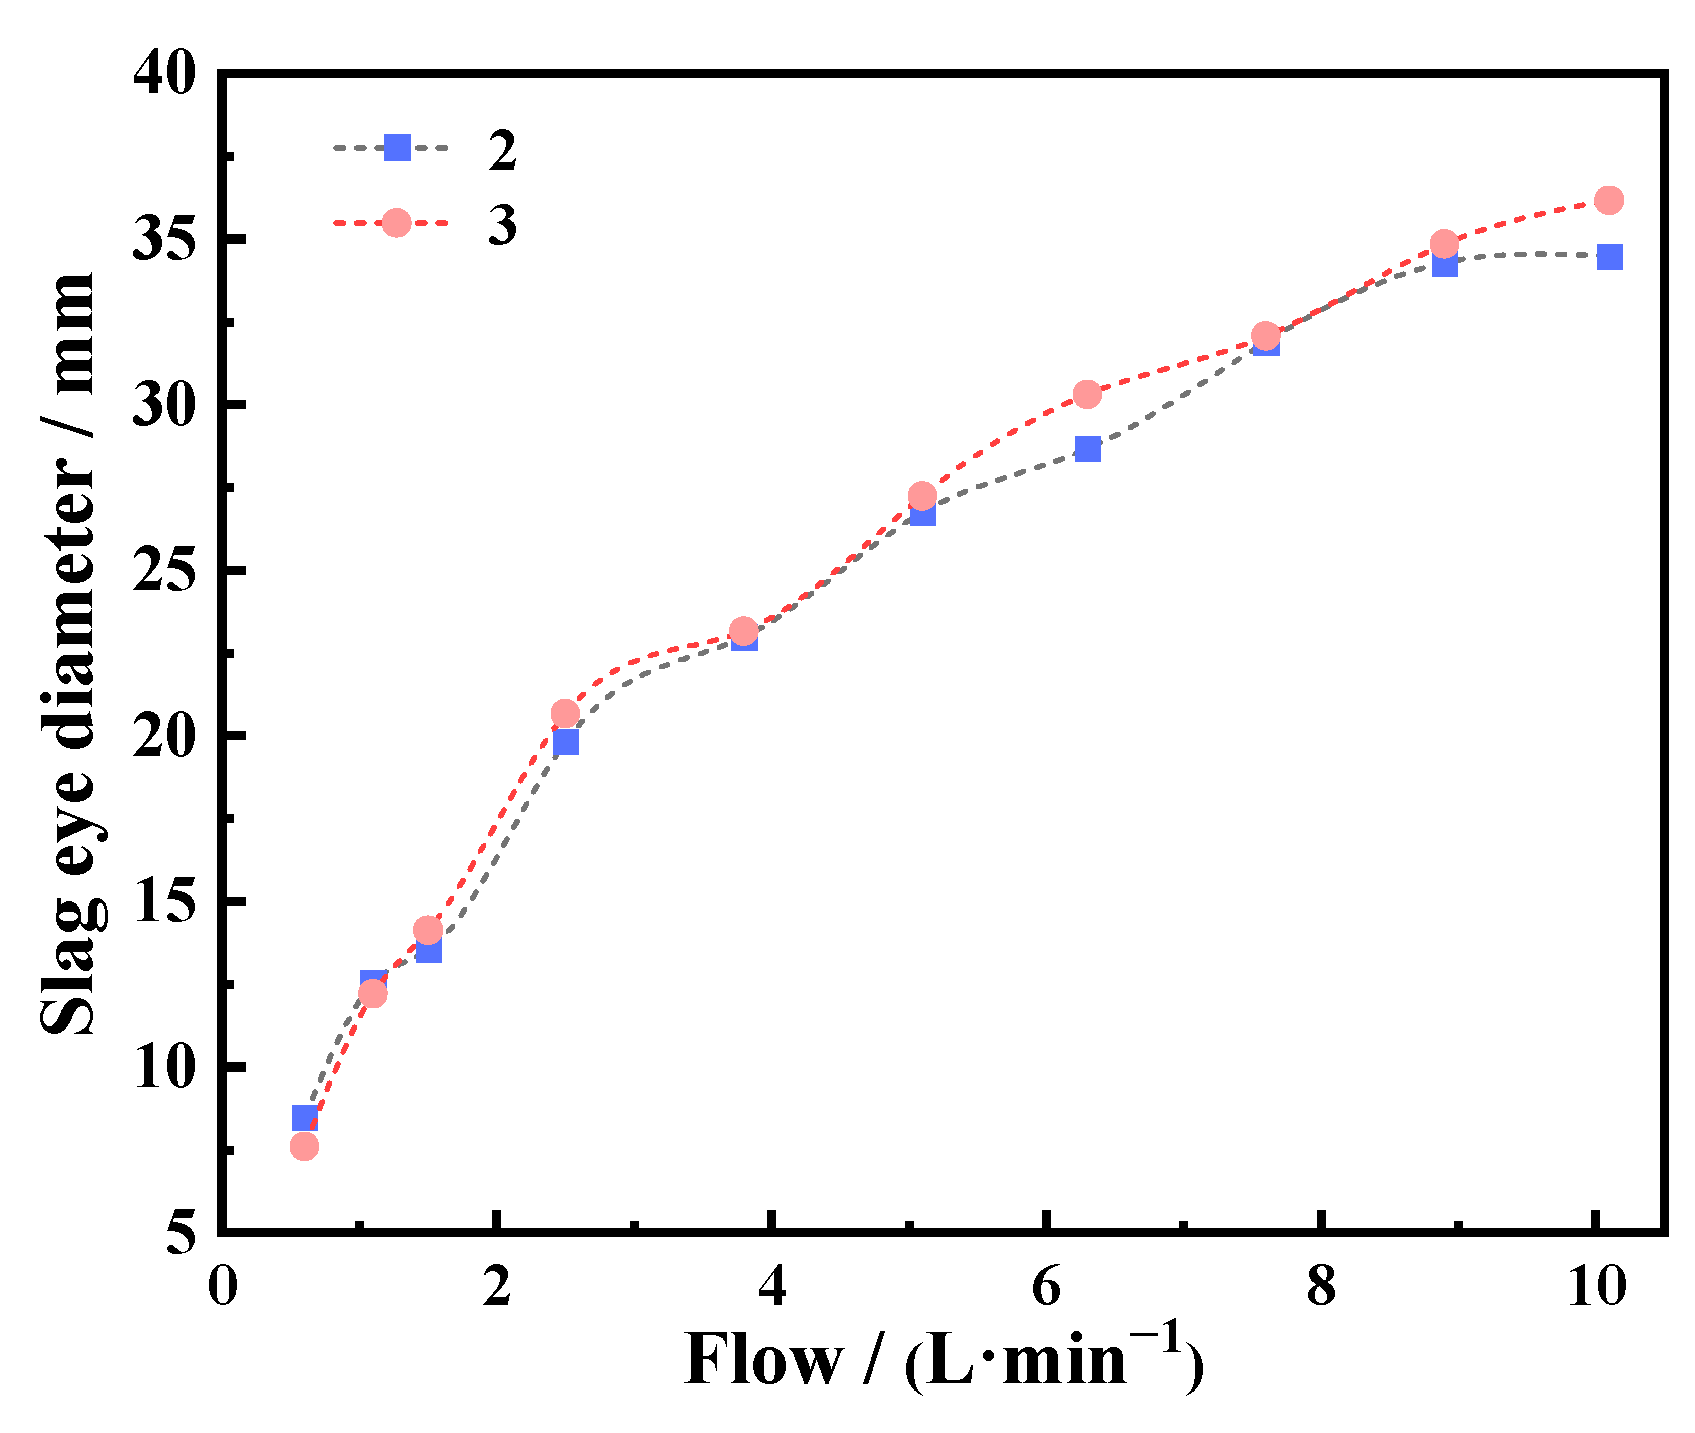
After the oil film was added to the water surface, the size of slag eye can be compared. Similarly, the schemes of hole 2 and hole 3 were selected to measure and make statistics on the exposed areas of slag surface under different gas flows, as shown in Figure 5. ImageJ (V1.8.0) software was used for image analysis to outline the exposed area of slag surface with different contrast, and then measure its area and calculate the equivalent diameter as the size of the exposed area of slag surface, which was drawn in Figure 6.
As can be seen from the slag surface exposed diagram of the schemes of hole 2 and hole 3 (Figure 6), the size of the slag surface exposed area increased obviously with the increase of the blowing flow rate. In hole 2 scheme, the shape of slag hole was round when the blowing volume was less than 7.6 L/min. When the blowing air volume was greater than 7.6 L/min, argon bubbles gradually began to scour the ladle wall surface, and the exposed shape became oval under the influence of the wall surface. Under this flow rate, the ladle wall had an impact on the flow. Hole 3 was closer to the ladle wall than hole 2. For hole 3, the slag hole was circular when the blowing air volume was less than 3.8 L/min. When the blowing air volume at the bottom of ladle was greater than 3.8 L/min, the exposed shape of liquid steel began to be affected by the ladle wall surface, and the rising argon gas stream began to further scour the ladle refractory. When the blowing flow rate was greater than 8.9 L/min, the change of slag hole was no longer obvious. The exposed area of the slag surface blown by hole 2 was slightly smaller than that of hole 3 under each blowing flow rate.
3.1.4. Bottom Blowing Slag Entrapment
During the experiment, the slag entrapment under different blowing rates was recorded by taking photos, and the two adjacent blowing rates were analyzed. The results of slag entrapment in the two blowing volumes of hole 2 and hole 3 schemes were shown in Figure 7. Under the condition of 2.5 L/min bottom blowing flow, the steel slag level was relatively calm when the hole 2 and hole 3 were blowing, and there was no obvious fluctuation on the slag surface. Under the condition of 3.8 L/min bottom blowing flow, the steel slag level of both sides fluctuated, the slag layer was blown away by argon gas flow and turned over, which was easy to be involved in the fluid. But the slag drop could rise again and return to the steel slag interface, at this time, it was only the fluctuation of the slag surface rather than the occurrence of slag entrapment. The slag entrapment trend of hole 2 and hole 3 was similar.
In the above research, firstly, the optimal blowing positions of hole 2 and hole 3 were screened out by mixing time, and the two schemes were further compared by flow field display experiment, slag surface exposure experiment and slag entrapment experiment. It was found that there was little difference in mixing time between hole 2 and hole 3, and the flow field effect was not much different, but the slag hole area of the former was smaller than that of the latter, and the scouring operation on the cladding wall was less. To sum up, it was reasonable to choose hole 2 (1/2R) for blowing in single air hole and 7.6 L/min for bottom blowing flow rate.
3.2. Double Hole Bottom Blowing Experiment
3.2.1. Mixing Time
Through the water model experiment, the mixing time of the three radii of 1/3R, 1/2R and 2/3R and the combined positions of 180°, 135° and 90° were obtained, as shown in Figure 8. In the 180° double hole scheme, the mixing time decreased with the increase of the bottom blowing volume. When the bottom blowing volume was less than 7.6 L/min, the mixing time changed significantly. When the bottom blowing volume was greater than 7.6 L/min, the change of mixing time tended to be gentle. By comprehensive comparison of the change process of the total bottom blowing volume, the mixing time of the combination of holes 1, 11 and 2, 12 was small. In the 135° double hole scheme, the mixing time also decreased with the increase of the bottom blowing volume. After the blowing volume was greater than 7.6 L/min, the mixing time changed slowly. In the 135° double hole blowing combination, the mixing effect of holes 6 and 12 was the best, and the mixing time was shorter than that of prototype holes 2 and 11. In the 90° double hole scheme, the mixing effect of holes 2, 8 and 3, 9 was better, but it was not different from the prototype when the gas volume was small. To sum up, the mixing time of 1, 11 in 180° and 6, 12 in 135° in the double hole layout was shorter than that of the prototype, which was the better scheme.
3.2.2. Flow Field Display
The flow field display experiment of double hole was the same as that of single hole bottom blowing. The duration of each set of photos taken by the camera was 0–30 s, and the interval was 5 s. In order to further determine the optimal scheme, the prototype, 1, 11 in 180° and 6, 12 in 135°, were respectively photographed in the blowing flow field of 7.6 L/min, as shown in Figure 9. By comparing the flow field display photos of the three groups of hole positions, it can be found that the colors of hole 2, 11 and 1, 11 were not completely uniform in the 25 s, and they were mixed in the 30 s. However, the color of flow field in hole 6 and hole 12 was completely uniform at the 25 s.
3.2.3. Exposed Molten Steel
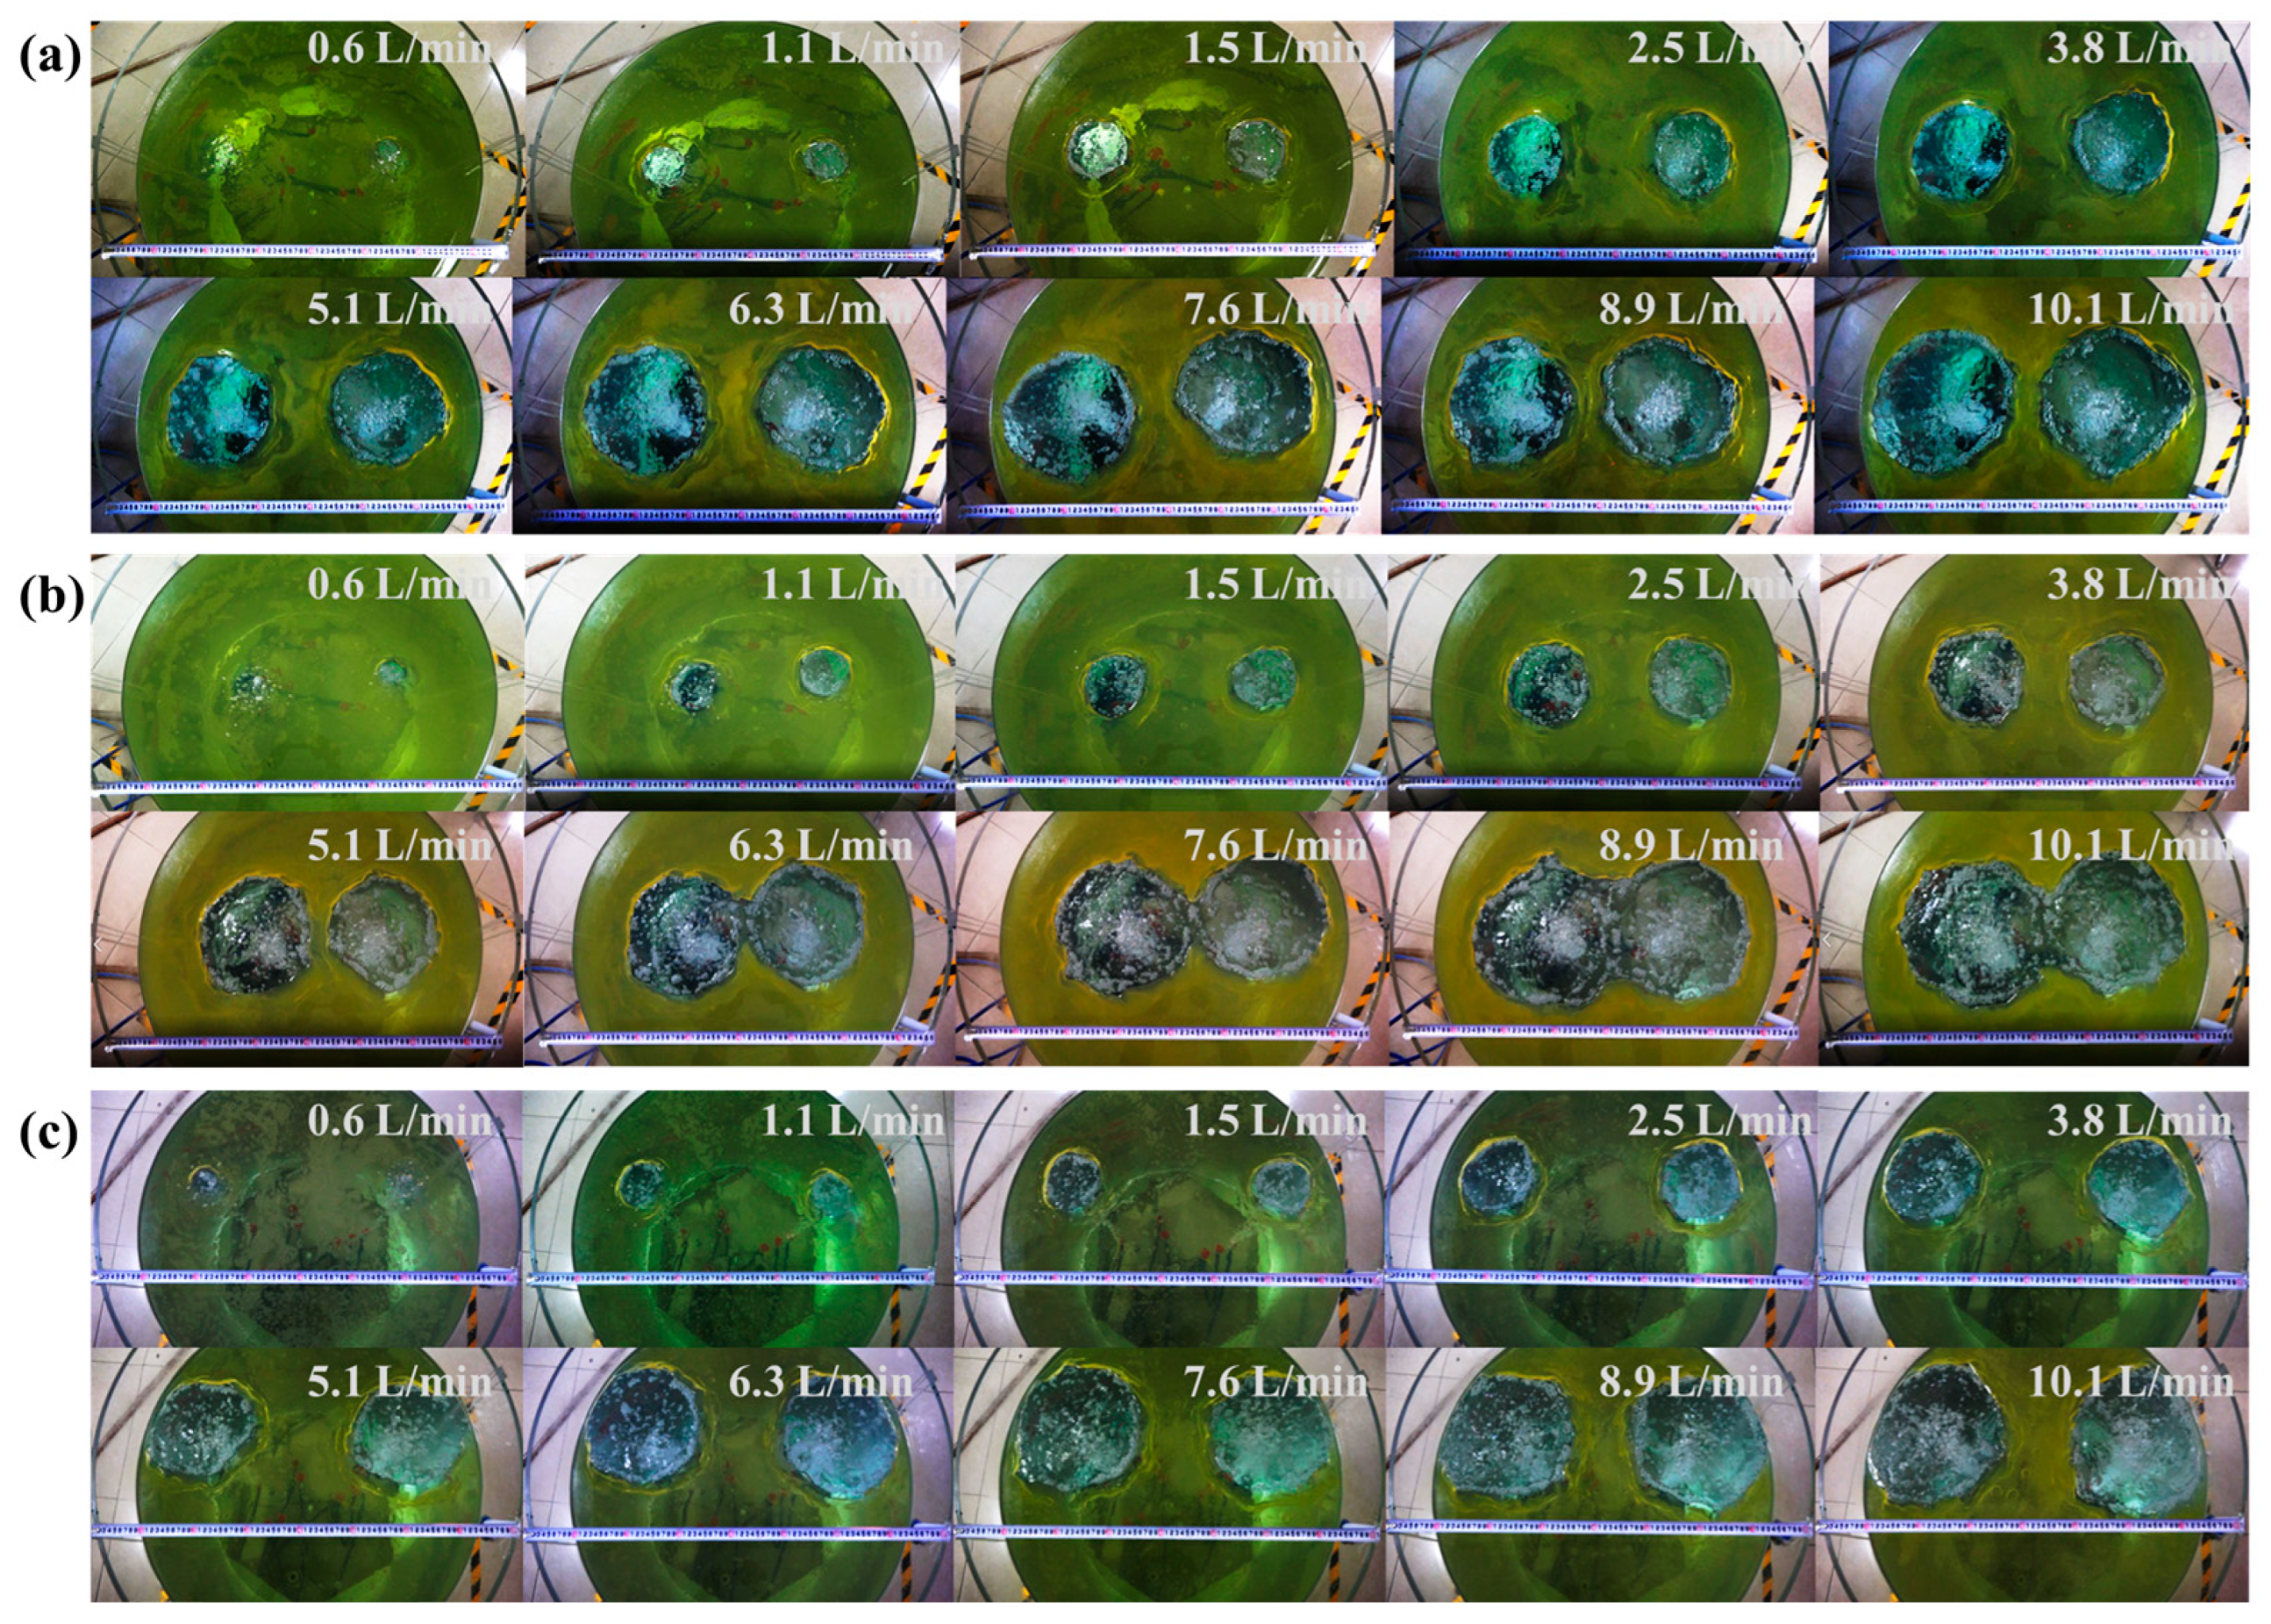
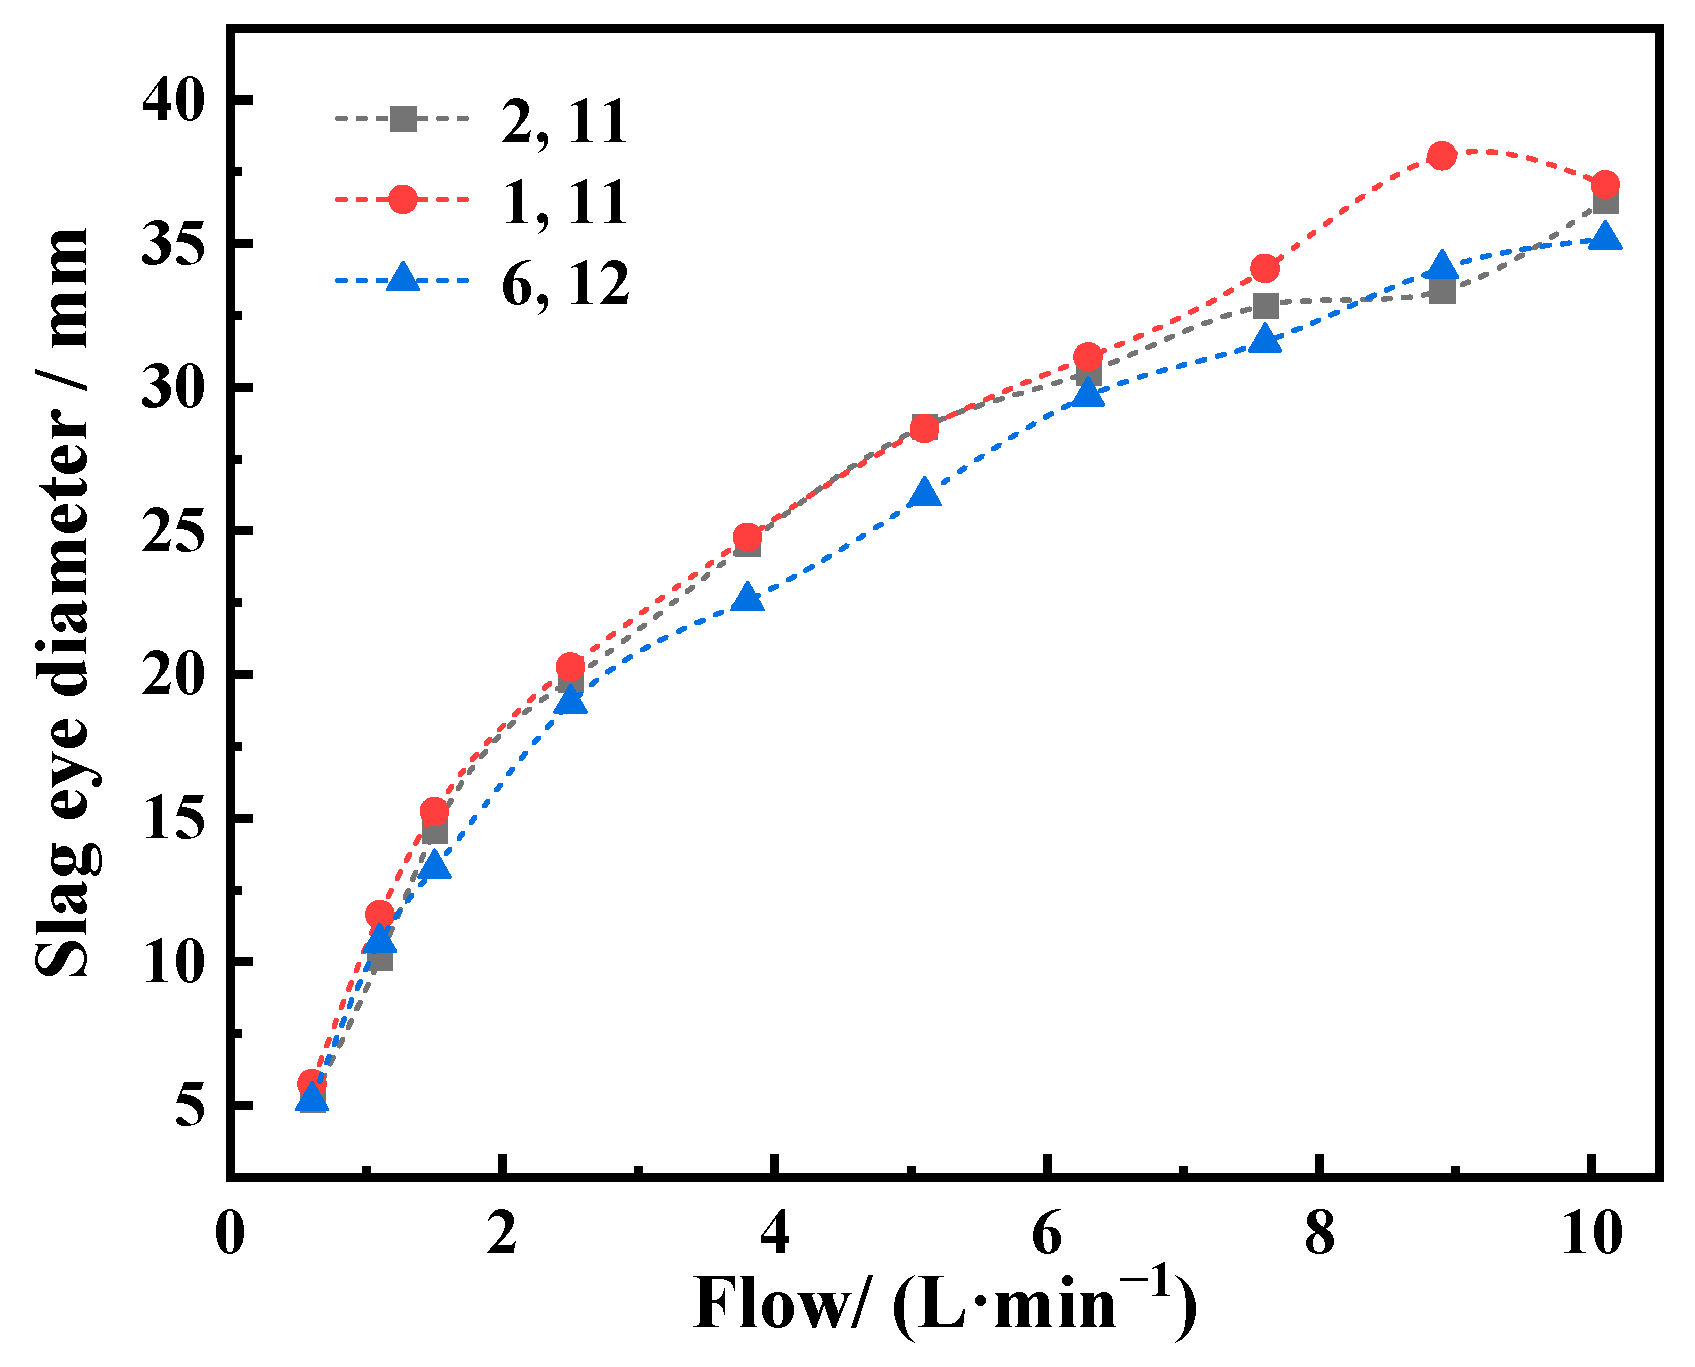
Experiments were carried out on the slag surface exposure of prototypes 2, 11, 1, 11 and 6, 12 at different flow rates. The specific results were shown in Figure 10. ImageJ (V1.8.0) software was used to measure the slag surface exposure size of each scheme, and the statistical results were plotted in Figure 11.
By comparing the above three different schemes, it can be obtained that when the blowing positions were holes 1 and 11, the positions of the two bottom blowing holes were relatively close. With the increase of the blowing volume, when the blowing flow rate of the double holes was 6.3 L/min, the two holes began to connect. With the increase of the argon blowing flow rate of the ladle, the diameter of the slag hole continued to rise. When the blowing volume of the double hole bottom was greater than 8.9 L/min, the change trend of the exposed diameter of the slag surface slowed down, and the energy generated by increasing the air volume was no longer mainly consumed in the stirring of the molten steel. In the scheme of holes 6 and 12, the phenomenon of slag hole contact had not occurred, and its diameter was the smallest. During the study, it was found that when soft blowing was performed, the slag surface was kept in a slightly blown-open state to prevent the occurrence of secondary oxidation of the steel and improve the refining effect. Based on previous slag eye studies, it was determined that the argon flow rate in this state was 0.6 L/min, which corresponded to an actual flow rate of 15 L/min.
3.2.4. Bottom Blowing Slag Entrapment
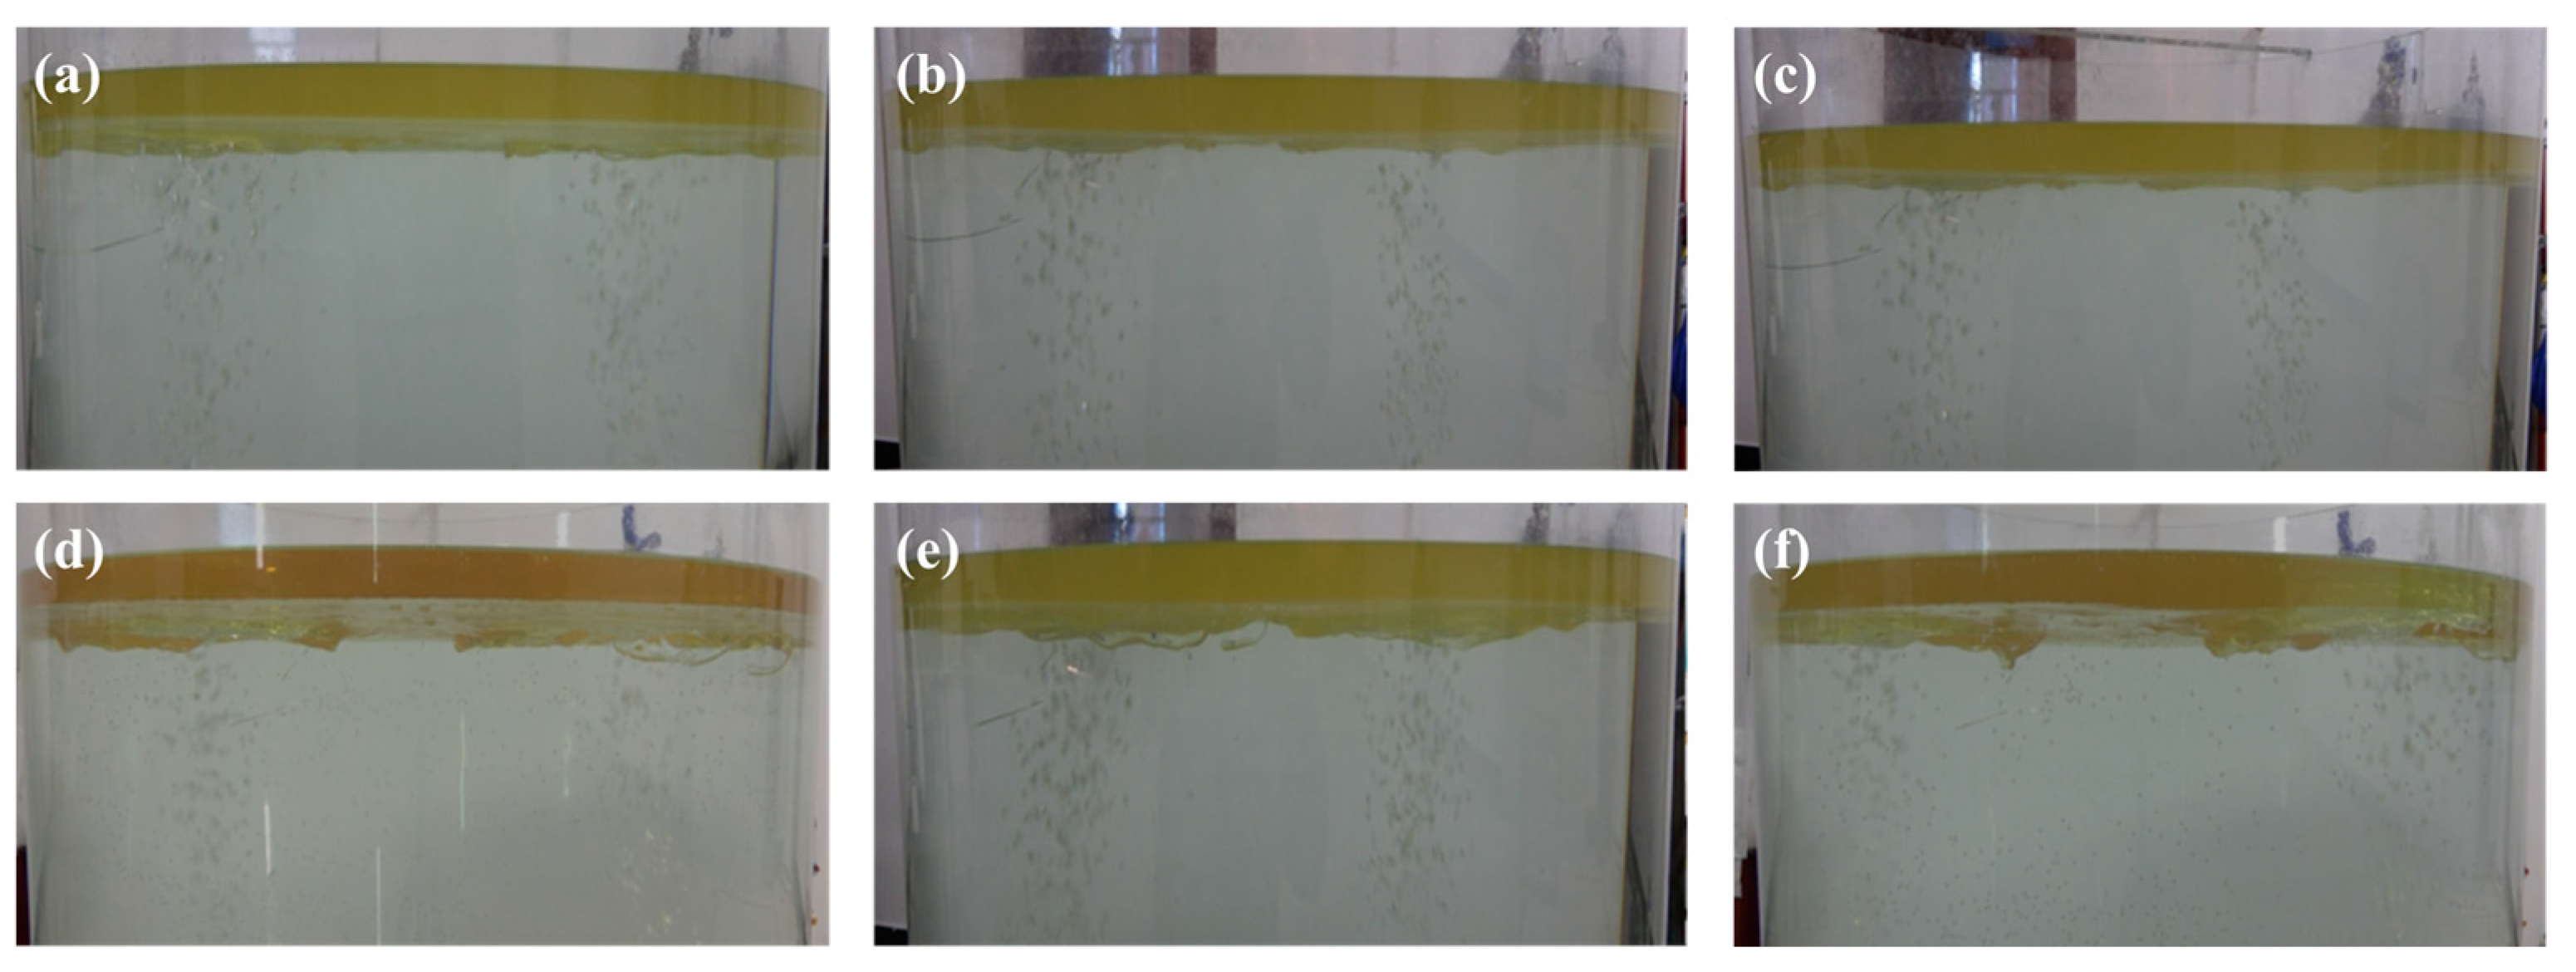
The experiment of double-hole bottom blowing slag entrapment also carried out related experiments on the slag entrapment of prototypes 2, 11, 1, 11 and 6, 12 under different flow rates. During the experiment, the slag entrapment under different blowing rates was photographed step by step, as shown in Figure 12. At the bottom blowing flow rate of 2.5 L/min, there was no obvious fluctuation of steel slag interface in holes 2, 11, 1, 11 and 6, 12. However, at 3.8 L/min, the slag surface fluctuated slightly in all three schemes, but the slag fluctuating in molten steel would still float on its own. The fluctuation trend of holes 1 and 11 was more obvious than that of holes 2, 11, 6 and 12, and the latter two had almost the same fluctuation state.
In the above research, firstly, 1, 11 in 180° and 6, 12 in 135° were selected as the optimal blowing positions according to the mixing time, and the two schemes were further compared by flow field display experiment, slag surface exposure and slag entrapment experiment. It was found that the hole 6, 12 scheme was obviously better in all experiments. Therefore, it was reasonable to choose holes 6 and 12 (2/3R, 135°) and 7.6 L/min for double-hole blowing.
4. Industrial Experiment
According to the optimization results of the water model, industrial experiment was carried out after the ladle structure transformation at the production site, and the selected steel grade was 27SiMn. Sampling was carried out at the same time before and after ladle optimization. The specific sampling scheme was shown in Table 4, which was the barrel sample and the finished billet sample at different stages of LF refining.
In industrial experiment, the optimization effect was mainly evaluated by the following indicators. (1) Total oxygen content: the main form of oxygen in molten steel was inclusion, and the total oxygen content can reflect the level of inclusion in molten steel. (2) Nitrogen content: the change of nitrogen content can reflect the secondary oxidation of molten steel. (3) Number of inclusions: the number of inclusions directly represented the cleaning level of molten steel. From the perspective of the oxygen content, the refining and deoxidation process was stable and could accurately control the oxygen content. Prototype 1 and 2 were both sampling results with bottom blowing at holes 2 and 11, while optimization 1 and 2 were sampling results with bottom blowing at holes 6 and 12. From Figure 13b, it can be seen that the nitrogen content of the prototype ladle increased by 21 ppm and 24 ppm during the soft blowing process in LF refining, indicating that the molten steel had a large contact area with air during argon blowing. After optimization, the nitrogen content during the soft blowing process decreased by 2 ppm and 3 ppm, respectively, effectively reducing the secondary oxidation of the prototype. During the whole LF process, the nitrogen content slightly increased and the control became more stable. Figure 13c showed the results of automatic scanning detection of inclusions sampled in the whole process. It can be found that the inclusion surface density of ladle sampling after optimization was low whether from the whole refining process or the soft blowing process in which inclusions were mainly removed by floating up. In particular, the inclusion surface density of the billet was reduced by 11.81% on average. In conclusion, the inclusion removal effect after ladle optimization was better than that of the prototype. As seen from Figure 13d, it was observed that the problematic calcium sulfide and various aluminum-containing inclusions present in the field had almost all decreased to varying degrees. Among them, the reduction of CaS was the most significant, which indirectly reflected the effect of soft-blow optimization. The finished pipe after rolling was sampled, and the inclusion level was determined according to the standard (GB/T 10561-2005) [35]. A total of 9 heats (11 samples) were tested in the test ladle, and the inclusion detection results were all qualified.
5. Conclusions
The optimal argon blowing position and argon blowing flow rate were obtained through comparative study of various indicators of single-hole and double-hole argon blowing, and the final optimization results were verified by industrial experiment, and the following conclusions were drawn:
- (1)
- Under the equipment conditions of this study, the optimal argon blowing position was double holes 6, 12 (2/3R), and the included angle between them was 135°.
- (2)
- In order to obtain the best mixing effect and reduce secondary oxidation during heating and wire feeding, the argon flow rate should be 7.6 L/min (corresponding to the actual production of 180 L/min), and the argon flow rate in the soft blowing process should be 0.6 L/min (corresponding to the actual production of 15 L/min).
- (3)
- After optimization, the content of total oxygen and nitrogen in the whole process decreased, especially in the soft blowing process, indicating that the scheme reduced the secondary oxidation of liquid steel.
- (4)
- The surface density of inclusions in the refining process was lower than that of the prototype, especially the surface density of inclusions in the casting billet was reduced by 11.81% on average, and calcium sulfide and various aluminum-containing inclusions were reduced to varying degrees.
Author Contributions
Conceptualization, Z.L. and W.O.; methodology, Z.W.; software, R.Z.; validation, R.Z., Y.B. and C.G.; funding acquisition, Y.B. All authors have read and agreed to the published version of the manuscript.
Funding
This research was funded by the National Natural Science Foundation of China, grant number 52174297.
Data Availability Statement
Not applicable.
Conflicts of Interest
The authors declare no conflict of interest.
References
- Yuan, B.; Liu, J.; Zeng, J.; Zhang, M.; Huang, J.; Yang, X. Evolution of inclusions and cleanliness in Ti-bearing IF steel produced via the BOF–LF–RH–CC process. Metals 2022, 12, 434. [Google Scholar] [CrossRef]
- Chen, C.; Jiang, Z.; Li, Y.; Sun, M.; Wang, Q.; Chen, K.; Li, H. State of the art in the control of inclusions in spring steel for automobile—A review. ISIJ Int. 2020, 60, 617–627. [Google Scholar] [CrossRef] [Green Version]
- Xiao, W.; Bao, Y.; Gu, C.; Wang, M.; Liu, Y.; Huang, Y.; Sun, G. Ultrahigh cycle fatigue fracture mechanism of high-quality bearing steel obtained through different deoxidation methods. Int. J. Miner. Metall. Mater. 2021, 28, 804–815. [Google Scholar] [CrossRef]
- Yang, W.; Wang, X.; Zhang, L.; Shan, Q.; Liu, X. Cleanliness of low carbon aluminum-killed steels during secondary refining processes. Steel Res. Int. 2013, 84, 473–489. [Google Scholar] [CrossRef]
- Wei, G.; Zhu, R.; Wu, X.; Dong, K.; Yang, L.; Liu, R. Technological innovations of carbon dioxide injection in EAF-LF steelmaking. JOM 2018, 70, 969–976. [Google Scholar] [CrossRef]
- Zhao, S.; He, S.; Guo, Y.; Chen, G.; Lv, J. Effect on cleanliness of molten steel with different refining slag systems for low alloy ship plate. Ironmak. Steelmak. 2016, 43, 790–798. [Google Scholar] [CrossRef]
- Mantripragada, V.T.; Sarkar, S. Slag eye formation in single and dual bottom purged industrial steelmaking ladles. Can. Metall. Q. 2020, 59, 159–168. [Google Scholar] [CrossRef]
- Yuan, F.; Xu, A.; Gu, M. Development of an improved CBR model for predicting steel temperature in ladle furnace refining. Int. J. Miner. Metall. Mater. 2021, 28, 1321–1331. [Google Scholar] [CrossRef]
- Zhang, Y.X.; Chen, C.; Lin, W.M.; Yu, Y.C.; E, D.Y.; Wang, S.B. Numerical Simulation of Tracers Transport Process in Water Model of a Vacuum Refining Unit: Single Snorkel Refining Furnace. Steel Res. Int. 2020, 91, 2000022. [Google Scholar] [CrossRef]
- Ouyang, X.; Lin, W.; Luo, Y.; Zhang, Y.; Fan, J.; Chen, C.; Cheng, G. Effect of Salt Tracer Dosages on the Mixing Process in the Water Model of a Single Snorkel Refining Furnace. Metals 2022, 12, 1948. [Google Scholar] [CrossRef]
- Cui, X.; Xue, Y.; Zhao, D.; Wang, S.; Guo, F. Physical modeling of bubble behaviors in molten steel under high pressure. High Temp. Mater. Process. 2021, 40, 471–484. [Google Scholar] [CrossRef]
- Zhao, S.; He, S.; Chen, G.; Peng, M.; Wang, Q. Castability of molten steel and cleanliness of slab for high strength low alloy steel without calcium treatment. Ironmak. Steelmak. 2014, 41, 153–160. [Google Scholar] [CrossRef]
- Patil, S.P.; Satish, D.; Peranandhanathan, M.; Mazumdar, D. Mixing models for slag covered, argon stirred ladles. ISIJ Int. 2010, 50, 1117–1124. [Google Scholar] [CrossRef] [Green Version]
- Terrazas, M.S.C.; Conejo, A.N. Effect of nozzle diameter on mixing time during bottom-gas injection in metallurgical ladles. Metall. Mater. Trans. B 2014, 46, 711–718. [Google Scholar] [CrossRef]
- Neifer, M.; Rödl, S.; Sucker, D. Investigations on the fluiddynamic and thermal process control in ladles. Steel Res. Int. 1993, 64, 54–62. [Google Scholar] [CrossRef]
- Ek, M.; Wu, L.; Valentin, P.; Sichen, D. Effect of inert gas flow rate on homogenization and inclusion removal in a gas stirred ladle. Steel Res. Int. 2010, 81, 1056–1063. [Google Scholar] [CrossRef]
- Conejo, A.N.; Kitamura, S.; Maruoka, N.; Kim, S.J. Effects of top layer, nozzle arrangement, and gas flow rate on mixing time in agitated ladles by bottom gas injection. Metall. Mater. Trans. B 2013, 44, 914–923. [Google Scholar] [CrossRef]
- Pan, S.M.; Chiang, J.D.; Hwang, W.S. Effects of gas injection condition on mixing efficiency in the ladle refining process. J. Mater. Eng. Perform. 1997, 6, 113–117. [Google Scholar] [CrossRef]
- Lou, W.; Zhu, M. Numerical simulations of inclusion behavior and mixing phenomena in gas-stirred ladles with different arrangement of tuyeres. ISIJ Int. 2014, 54, 9–18. [Google Scholar] [CrossRef] [Green Version]
- Liu, W.; Lee, J.; Guo, X.; Silaen, A.K.; Zhou, C.Q. Argon bubble coalescence and breakup in a steel ladle with bottom plugs. Steel Res. Int. 2019, 90, 1800396. [Google Scholar] [CrossRef]
- Chen, G.; He, S.; Li, Y. Investigation of the air-argon-steel-slag flow in an industrial RH reactor with VOF-DPM coupled model. Metall. Mater. Trans. B 2017, 48, 2176–2186. [Google Scholar] [CrossRef]
- Zhang, Q.; Wang, L.; Xu, Z. A new method of removing inclusions in molten steel by injecting gas from the shroud. ISIJ Int. 2006, 46, 1177–1182. [Google Scholar] [CrossRef] [Green Version]
- Lou, W.; Zhu, M. Numerical simulations of inclusion behavior in gas-stirred ladles. Metall. Mater. Trans. B 2013, 44, 762–782. [Google Scholar] [CrossRef]
- Geng, D.; Lei, H.; He, J. Numerical simulation for collision and growth of inclusions in ladles stirred with different porous plug configurations. ISIJ Int. 2010, 50, 1597–1605. [Google Scholar] [CrossRef] [Green Version]
- He, F.; He, D.; Xu, A.; Wang, H.; Tian, N. Hybrid model of molten steel temperature prediction based on ladle heat status and artificial neural network. J. Iron Steel Res. Int. 2014, 21, 181–190. [Google Scholar] [CrossRef]
- Qu, T.; Jiang, M.; Liu, C.; Komizo, Y. Transient flow and inclusion removal in gas stirred ladle during teeming process. Steel Res. Int. 2010, 81, 434–445. [Google Scholar] [CrossRef]
- Liu, Y.; Bai, H.; Liu, H.; Ersson, M.; Jönsson, P.G.; Gan, Y. Physical and numerical modelling on the mixing condition in a 50t ladle. Metals 2019, 9, 1136. [Google Scholar] [CrossRef] [Green Version]
- Liu, W.; Tang, H.; Yang, S.; Wang, M.; Li, J.; Liu, Q.; Liu, J. Numerical simulation of slag eye formation and slag entrapment in a bottom-blown argon-stirred ladle. Metall. Mater. Trans. B 2018, 49, 2681–2691. [Google Scholar] [CrossRef]
- Obiso, D.; Kriebitzsch, S.; Reuter, M.; Meyer, B. The importance of viscous and interfacial forces in the hydrodynamics of the top-submerged-lance furnace. Metall. Mater. Trans. B 2019, 50, 2403–2420. [Google Scholar] [CrossRef] [Green Version]
- Ni, P.; Tanaka, T.; Suzuki, M.; Nakamoto, M.; Jönsson, P.G. A kinetic model of mass transfer and chemical reactions at a steel/slag interface under effect of interfacial tensions. ISIJ Int. 2019, 59, 737–748. [Google Scholar] [CrossRef] [Green Version]
- Merder, T.; Pieprzyca, J.; Saternus, M.; Tkadlecková, M. The interaction of the argon curtain at the interface: Metal-slag in a tundish. Metalurgija 2022, 61, 585–588. [Google Scholar]
- Chen, C.; Rui, Q.; Cheng, G. Effect of salt tracer amount on the mixing time measurement in a hydrodynamic model of gas-stirred ladle system. Steel Res. Int. 2013, 84, 900–907. [Google Scholar] [CrossRef]
- Freymuth, P. Flow visualization in fluid mechanics. Rev. Sci. Instrum. 1993, 64, 1–18. [Google Scholar] [CrossRef]
- Wang, Q.; Liu, C.; Pan, L.; He, Z.; Li, G.; Wang, Q. Numerical understanding on refractory flow-induced erosion and reaction-induced corrosion patterns in ladle refining process. Metall. Mater. Trans. B 2022, 53, 1617–1630. [Google Scholar] [CrossRef]
- GB/T 10561-2005; Steel-Determination of Content of Nonmetallic Inclusions-Micrographic Method Using Standards Diagrams. China Iron and Steel Association: Beijing, China, 2005.
Figure 1.
Schematic diagram of water model experimental equipment.

Figure 2.
(a) prototype dimensions, (b) model dimensions and (c) model physical objects.

Figure 3.
Blending time of different blowing rates in single hole scheme.

Figure 4.
Flow field display diagram of single hole 2 (a) and 3 (b) at 7.6 L/min blowing rate.

Figure 5.
Slag surface exposure of single hole 2 (a) and hole 3 (b) at different blowing rates.

Figure 6.
Slag eye diameter of single hole 2 and hole 3 at different blowing rates.

Figure 7.
Slag entrapment behavior of single hole 2 and hole 3 under (a,b) 2.5 L/min, (c,d) 3.8 L/min bottom blowing flow.
Figure 7.
Slag entrapment behavior of single hole 2 and hole 3 under (a,b) 2.5 L/min, (c,d) 3.8 L/min bottom blowing flow.

Figure 8.
Mixing time of different blowing volumes in the double hole (a) 180°, (b) 135°, (c) 90° distribution schemes.
Figure 8.
Mixing time of different blowing volumes in the double hole (a) 180°, (b) 135°, (c) 90° distribution schemes.

Figure 9.
Flow field display diagram of double holes 2, 11 (a), 1, 11 (b) and 6, 12 (c) at 7.6 L/min blowing rate.
Figure 9.
Flow field display diagram of double holes 2, 11 (a), 1, 11 (b) and 6, 12 (c) at 7.6 L/min blowing rate.

Figure 10.
Slag surface exposure of double holes 2, 11 (a), 1, 11 (b) and 6, 12 (c) at different blowing rates.
Figure 10.
Slag surface exposure of double holes 2, 11 (a), 1, 11 (b) and 6, 12 (c) at different blowing rates.

Figure 11.
Slag eye diameter of double holes at different blowing rates.

Figure 12.
Slag entrapment behavior of double-hole 2, 11, 1, 11 and 6, 12 at 2.5 L/min (a–c), 3.8 L/min (d–f) bottom blowing flow.
Figure 12.
Slag entrapment behavior of double-hole 2, 11, 1, 11 and 6, 12 at 2.5 L/min (a–c), 3.8 L/min (d–f) bottom blowing flow.

Figure 13.
Changes in total oxygen content (a), nitrogen content (b), inclusion density (c) and inclusion type (d) of molten steel before and after optimization.
Figure 13.
Changes in total oxygen content (a), nitrogen content (b), inclusion density (c) and inclusion type (d) of molten steel before and after optimization.


Table 1.
Size parameters of ladle prototype and model.
| Parameter | Actual Dimensions (mm) | Model Dimensions (mm) |
|---|---|---|
| Ladle depth | 2830 | 943.3 |
| Upper diameter of ladle | 2531 | 843.7 |
| Lower diameter of ladle | 2236 | 745.3 |
| Diameter of top surface of vent plug | 108 | 36 |
| Height of molten pool | 2370 | 790 |
| Thickness of slag | 63.9 | 21.3 |
Table 2.
Position and number of blow holes at the bottom of water model.
| Position | Number |
|---|---|
| 1/3R | 1, 4, 7, 10 |
| 1/2R | 2, 5, 8, 11 |
| 2/3R | 3, 6, 9, 12 |
| Center of circle | 13 |
| 1/5R | 14 |
| 4/5R | 15 |
Table 3.
Blowing volume of prototype and model.
| Prototype (L/min) | 15 | 25 | 35 | 60 | 90 | 120 | 150 | 180 | 210 | 240 |
| Model (L/min) | 0.6 | 1.1 | 1.5 | 2.5 | 3.8 | 5.1 | 6.3 | 7.6 | 8.9 | 10.1 |
Table 4.
Sampling position and sample type.
| No. | Position | Sample Type |
|---|---|---|
| 1 | LF arrival | Barrel sample |
| 2 | Refining for 10 min | Barrel sample |
| 3 | Refining for 20 min | Barrel sample |
| 4 | Refining for 30 min | Barrel sample |
| 5 | Before wire feeding | Barrel sample |
| 6 | After wire feeding | Barrel sample |
| 7 | Soft blowing for 10 min | Barrel sample |
| 8 | Soft blowing for 20 min | Barrel sample |
| 9 | Continuous casting | Billet sample |
Disclaimer/Publisher’s Note: The statements, opinions and data contained in all publications are solely those of the individual author(s) and contributor(s) and not of MDPI and/or the editor(s). MDPI and/or the editor(s) disclaim responsibility for any injury to people or property resulting from any ideas, methods, instructions or products referred to in the content. |
© 2023 by the authors. Licensee MDPI, Basel, Switzerland. This article is an open access article distributed under the terms and conditions of the Creative Commons Attribution (CC BY) license (https://creativecommons.org/licenses/by/4.0/).
Share and Cite
MDPI and ACS Style
Li, Z.; Ouyang, W.; Wang, Z.; Zheng, R.; Bao, Y.; Gu, C. Physical Simulation Study on Flow Field Characteristics of Molten Steel in 70t Ladle Bottom Argon Blowing Process. Metals 2023, 13, 639. https://doi.org/10.3390/met13040639
AMA Style
Li Z, Ouyang W, Wang Z, Zheng R, Bao Y, Gu C. Physical Simulation Study on Flow Field Characteristics of Molten Steel in 70t Ladle Bottom Argon Blowing Process. Metals. 2023; 13(4):639. https://doi.org/10.3390/met13040639
Chicago/Turabian StyleLi, Zhiwei, Wei Ouyang, Zhongliang Wang, Ruixuan Zheng, Yanping Bao, and Chao Gu. 2023. "Physical Simulation Study on Flow Field Characteristics of Molten Steel in 70t Ladle Bottom Argon Blowing Process" Metals 13, no. 4: 639. https://doi.org/10.3390/met13040639
Note that from the first issue of 2016, this journal uses article numbers instead of page numbers. See further details here.