Article

Effect of Scanning Strategies on the Microstructure and Mechanical Properties of Ti-22Al-25Nb Alloy Fabricated through Selective Laser Melting

1
State Key Laboratory of Advanced Design and Manufacturing for Vehicle Body, Hunan University, Changsha 410082, China
2
China Productivity Center for Machinery Co., Ltd., Beijing 100044, China
3
College of Mechanical and Electrical Engineering, Nanjing University of Aeronautics and Astronautics, Nanjing 210016, China
4
School of Energy and Power Engineering, Changsha University of Science & Technology, Changsha 410114, China
*
Author to whom correspondence should be addressed.
Metals 2023, 13(3), 634; https://doi.org/10.3390/met13030634
Submission received: 8 February 2023 / Revised: 17 March 2023 / Accepted: 20 March 2023 / Published: 22 March 2023

Abstract

:
In this study, Ti-22Al-25Nb intermetallic compound alloys are fabricated through selective laser melting (SLM) at four scanning speeds (600, 700, 800, and 900 mm/s). The microstructure and mechanical properties of the selective laser melting fabricated alloys are systematically evaluated. The results indicate that scanning speed significantly affects microstructure characteristics (e.g., relative density, grain size, texture density, and the precipitation of secondary phases). The variation laws of the relative density, grain size, and texture density are likewise affected by scanning speed. The relative density, grain size, and texture density increase and then decrease with the increase in scanning speed. The alloy fabricated with the lowest scanning speed (600 mm/s) exhibits the maximum relative density, grain size, and texture density. By contrast, the alloy with the highest scanning speed (900 mm/s) exhibits the minimum relative density, grain size, and texture density. Furthermore, the precipitations of the O phase and Ti3Al phase are primarily distributed in regions with a high strain concentration near the pool boundary. The alloy fabricated with a 600 mm/s scanning speed simultaneously achieves the highest strength and elongation, which is closely correlated with the uniform distribution of secondary phases.

1. Introduction

Titanium alloys are vital structural materials that have been used extensively in low-pressure turbine blades [1,2,3] for their relatively low density, excellent mechanical properties, and oxidation resistance at the service temperature of 750 °C [4,5]. However, Ti alloys usually exhibit poor formability at room temperature (RT), thus becoming difficult to process into parts with complex structures. Initially studied by Banerjee et al. [6], the O phase can lay a material basis for high ductility and formability at RT. Various conventional methods have been applied to Ti2AlNb alloys (e.g., a forging process that can provide a homogeneous microstructure) [7]. However, high costs and high processing temperatures limit their wide application [8,9,10].
In the last four decades, additive manufacturing (AM) has emerged as an advanced fabrication technology known for its high-quality and complex geometry components formed directly from three-dimensional computer-aided design (CAD) data. Selective laser melting (SLM) has been confirmed as a vital process in the field of metal 3D printing AM technology, which can realize the fabrication of complex shape parts based on the powder bed melting principle [11,12,13]. SLM-fabricated metallic materials have gained wide attention for their high precision and high utilization ratio of raw materials [14]. SLM has the potential to process Ti2AlNb-based intermetallic alloys (IMCs) with superior mechanical properties with regard to high energy density and fast solidification rates. Zhou et al. [15] fabricated a favorable combination of strength and ductility for a Ti2AlNb-based alloy with a tensile strength of 1090 MPa and a ductility of 22.7% using an SLM as-printed sample. The results revealed that a high-density dislocation network and a favorable phase constitution could enhance the mechanical properties of Ti-22Al-25Nb alloy. The advantage of the SLM technique is its ability to combine different energy beam parameters, which comprise scanning speed, scanning strategy, laser energy density, and depositional parameters (e.g., width and lap rate between deposition channels, the thickness of single deposition layers, and the total number of layers) [16,17].
Scanning speed is an independent process parameter that significantly evaluates microstructure [18,19,20]. Li et al. [21] studied the mechanical properties of Ti-45Al-2Cr-5Nb alloy processed through SLM and also discussed the effect of laser scanning speed on the fraction of the α2 (hexagonal close-packed structure based on the DO19 structure of Ti3Al) and β/B2 phases. Ahmed et al. [22] suggested that fabricating Ti-5Al-5Mo-5V-3Cr via SLM significantly reduces top surface quality, opens surface pores, and causes microcracks and interlayer cracks with the increase in scanning speed. As revealed by the correlation of microstructure and RT ductility of Ti-22Al-25Nb IMC alloys [23] upon heat treatment, the dominating B2 phase (ordered body-centered cubic) and the precipitation of the large-size lath O (orthorhombic structure) and α2 phase lead to maximum elongation. The successful deposition of scanning speed has posed a significant challenge with scanning speeds causing low relative density and poor metallurgical bonding, thus significantly reducing tensile properties. Zhou et al. [15] further studied the effects of laser power on the phase evolution mechanism and strengthening mechanism for the tensile properties of as-fabricated Ti–22Al–25Nb IMC using pre-alloyed powder. However, little research has been conducted on the inherent relationship between the grain orientation, crystallographic texture, and phase composition of Ti-22Al-25Nb IMC alloys processed through SLM and laser scanning speed.
In this study, the effects of scanning speed on the phase change, microstructure, and mechanical properties of Ti-22Al-25Nb IMC alloys fabricated through SLM at different scanning speeds are systematically investigated. The specimens are characterized via X-ray, EBSD, and TEM to analyze the microstructure characteristics (crystal orientation, grain size, grain boundary density, and grain boundary characteristics) of the alloys. A uniaxial tensile test assesses ultimate tensile strength, yield tensile strength, and elongation to failure. Thus, this study aims to demonstrate a relationship between laser scanning speeds, microstructure characteristics, phase evolution, and the mechanical performance of Ti-22Al-25Nb IMC alloys processed via SLM.

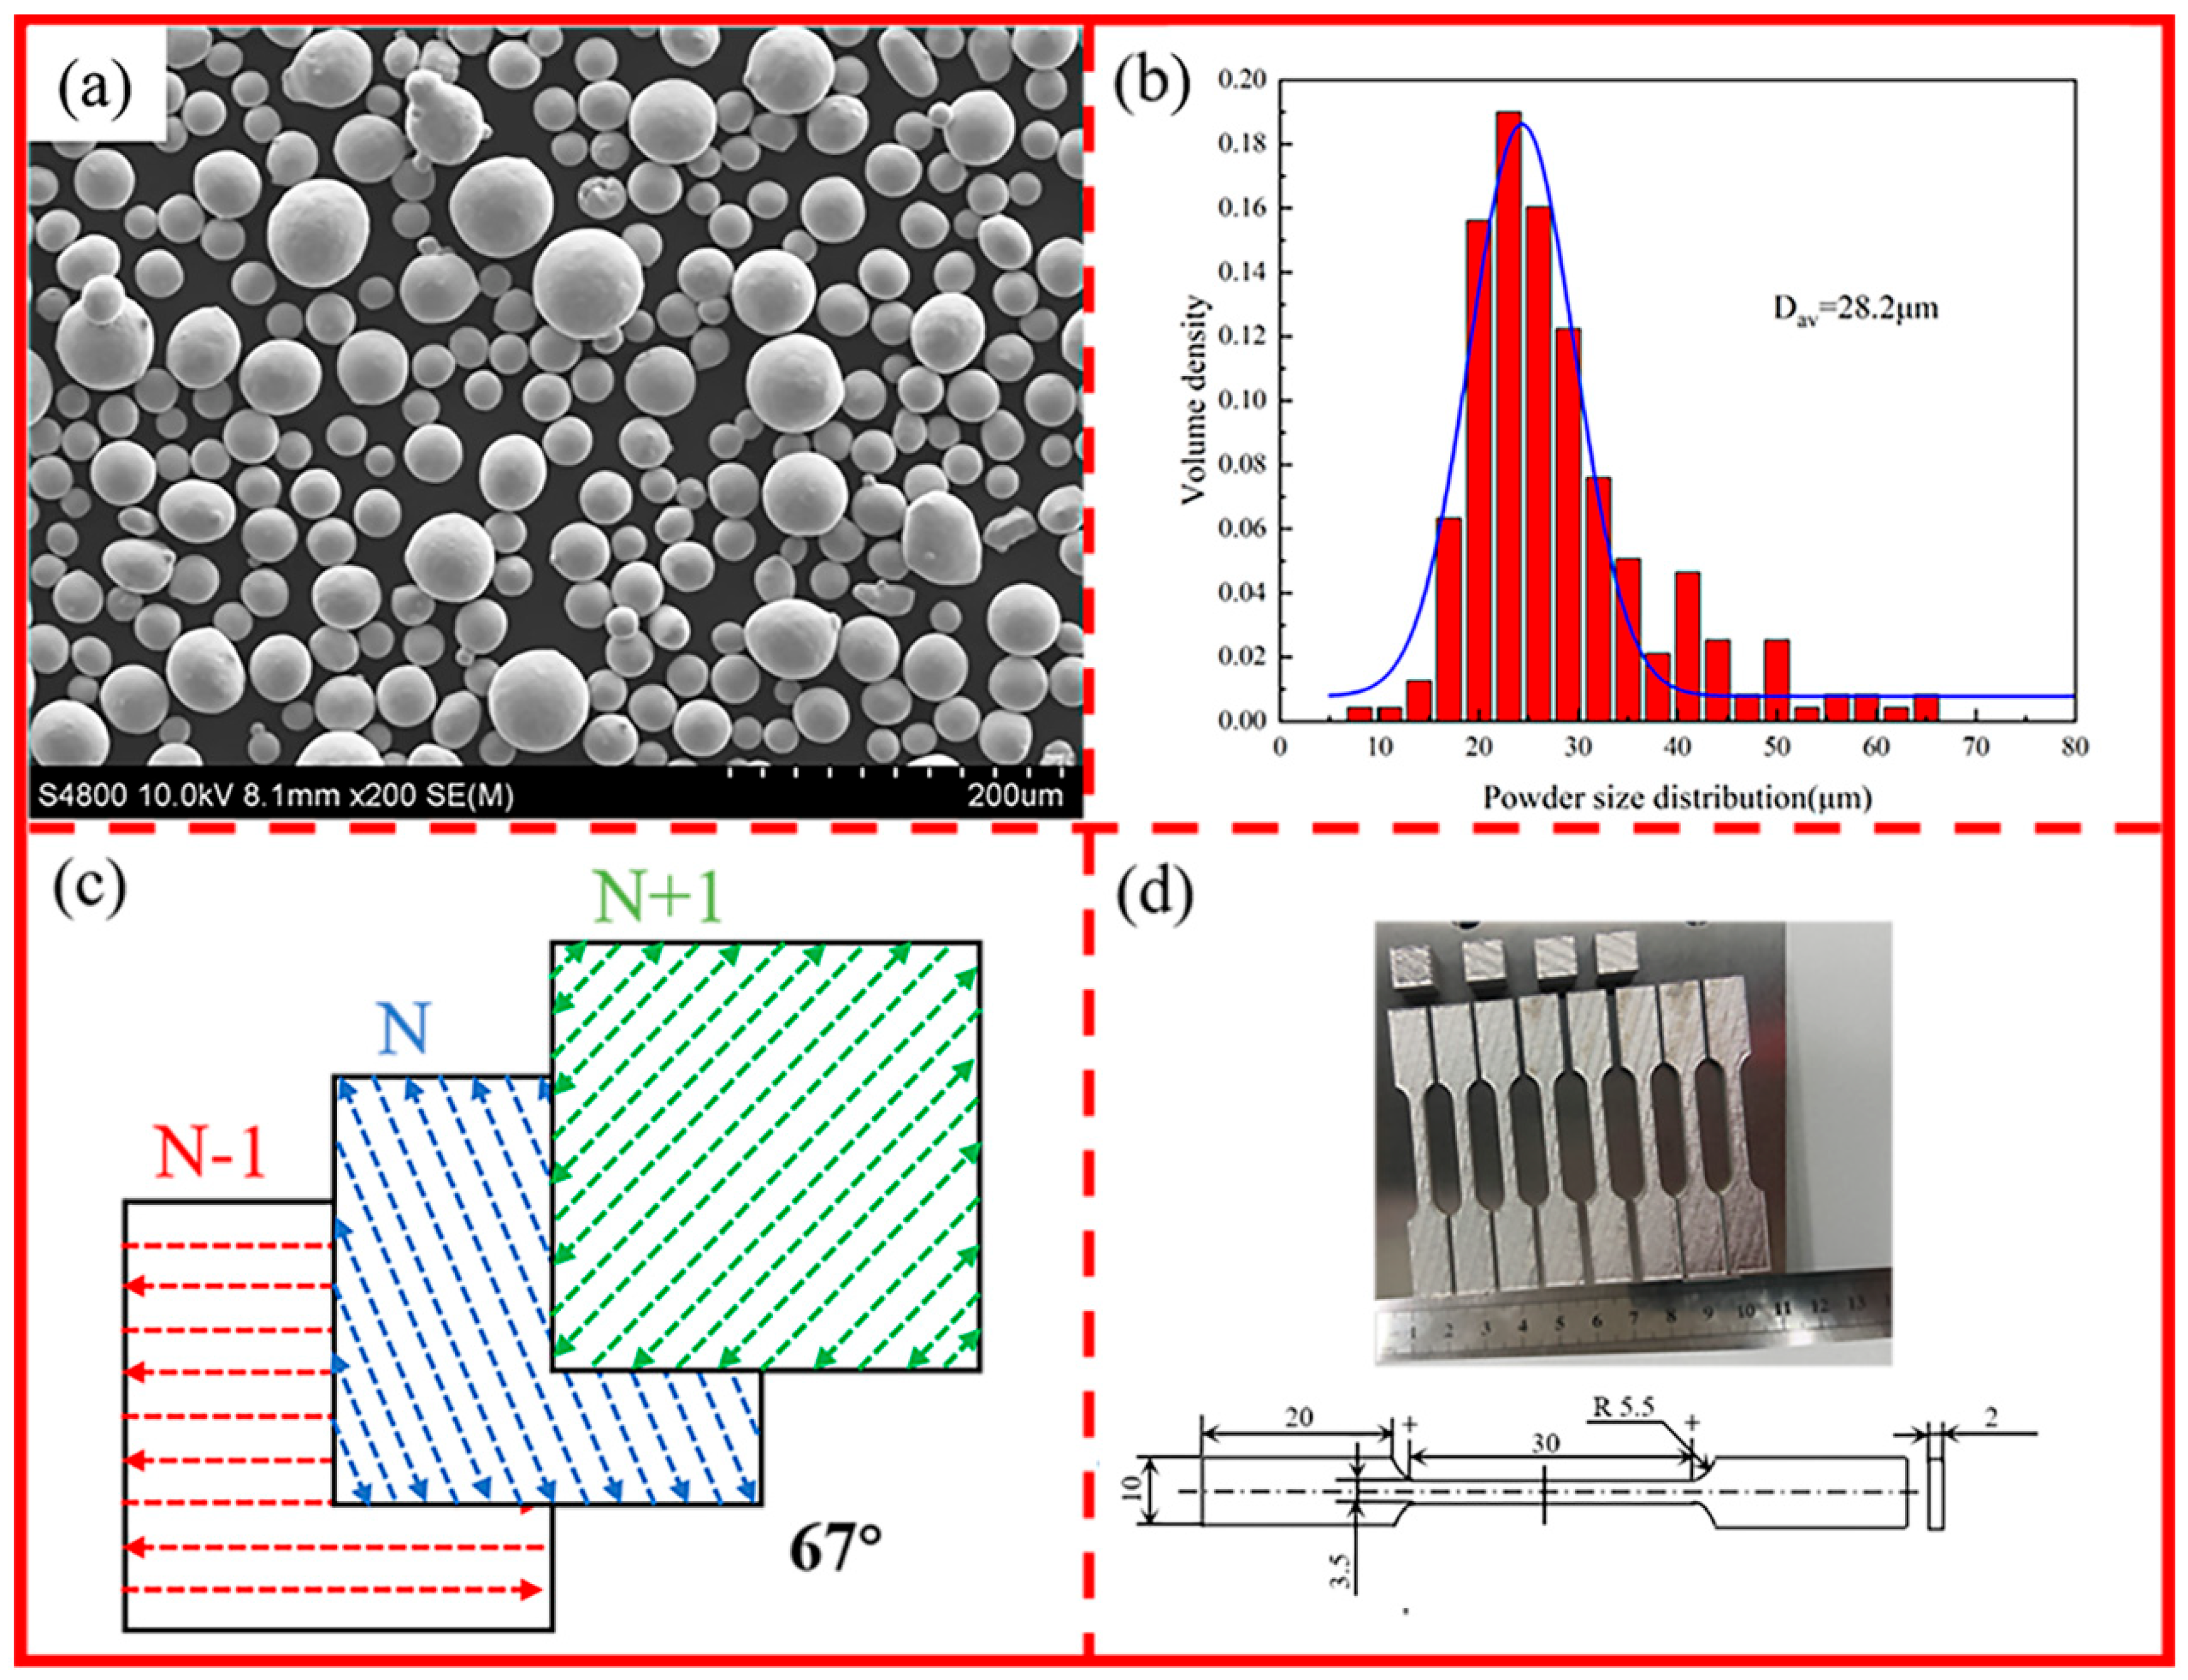
2. Materials and Methods

Ti-22Al-25Nb (at. %) powder applied in this study was produced by Sailong Additive Manufacturing Co., Ltd. (Guangzhou, China). Figure 1 presents the particle size of the powder ranging from 14 to 52 μm with mean particle size d50 = 28.2 μm. SLM experiments were performed using a BLT S210 machine (BLT, Xi’an, China) equipped with a 500 W fiber (laser beam diameter, 20 μm; wavelength, 1060 nm). The minimum oxygen content was lower than 100 ppm under an inert argon gas protection system. Figure 1d illustrates the dog-bone-shaped sample employed for tensile tests and microstructural characterization. The tensile samples were deformed in the direction perpendicular to the building direction, and these samples were examined three times to obtain the average results.
The platform was heated to 100 °C to reduce the temperature gradient. Figure 1c,d presents the major SLM process parameters. The energy density (E, energy applied per unit volume of the sample) representing the set parameters (energy input) is expressed as [24]:
E = P v · h · t
In this study, the laser power (P), hatch distance (h), and layer thickness (t) remained unchanged. The scanning speed (v) ranged from 600 to 900 mm/s. The scanning speed (v) was changed to examine its effects on microstructure and mechanical properties. For convenience, the samples were consecutively denoted as S1, S2, S3, and S4. A stripe scanning strategy was adopted (Figure 1c). The green-colored arrows represent the movement of the laser beam of the N + 1 layer with the 67° rotation angle of the N layer (denoted as the blue-colored arrows). Table 1 lists the process parameters applied. VED represents the value of energy density.
Metallographic samples were prepared via the standard procedures and finely etched with Kroll’s reagent consisting of HF:HNO3:H2O = 3:6:100 for 30 s. The microstructures of the samples were observed under Germany Leica optical microscope DMi8 (OM) (Wetzlar and Mannheim, Wetzlar, Germany) and FEI Quanta FEG 250 scanning electron microscope (SEM) (Beijing, China) equipped with energy dispersive spectrometry (EDS). The phase identification was characterized through X-ray diffraction (XRD, Rigaku D/max-2500pc, Tokyo, Japan) with a step size of 10°/min and a 2θ range from 20° to 80°. Texture analysis was conducted through electron backscatter diffraction (EBSD, Quanta JEOL JMS 7900F, Tokyo, Japan) with a step size of 2 μm. Analysis based on transmission electron microscopy (TEM) was conducted using a JEOL 2100F TEM (Tokyo, Japan) operated at 200 kV. Furthermore, the TEM and EBSD observation samples were prepared through electrolytic polishing at 243 K and 23 V using a mixture of HClO4:C4H10O:CH3OH = 3:17:30.

3. Results and Discussion

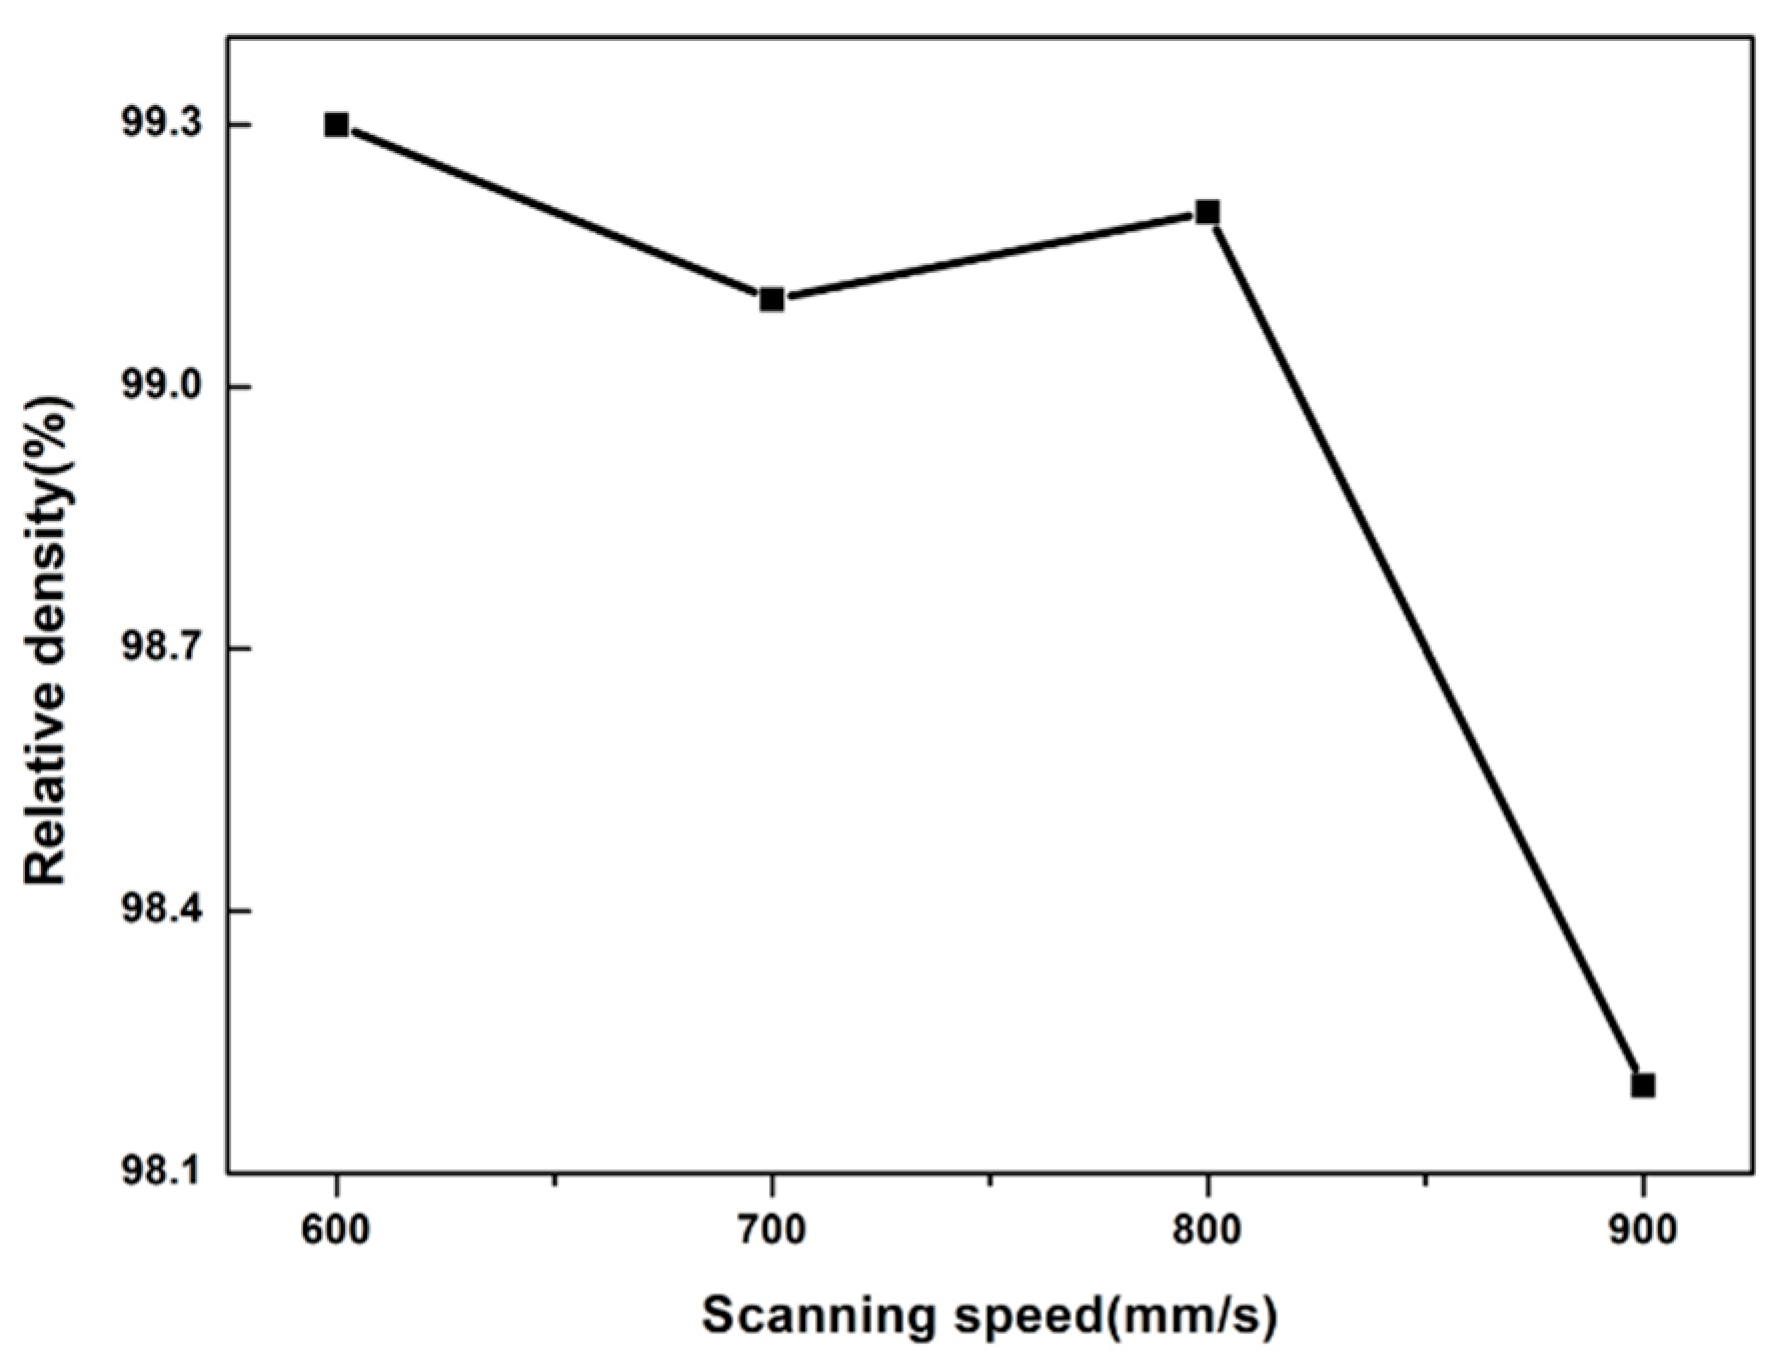
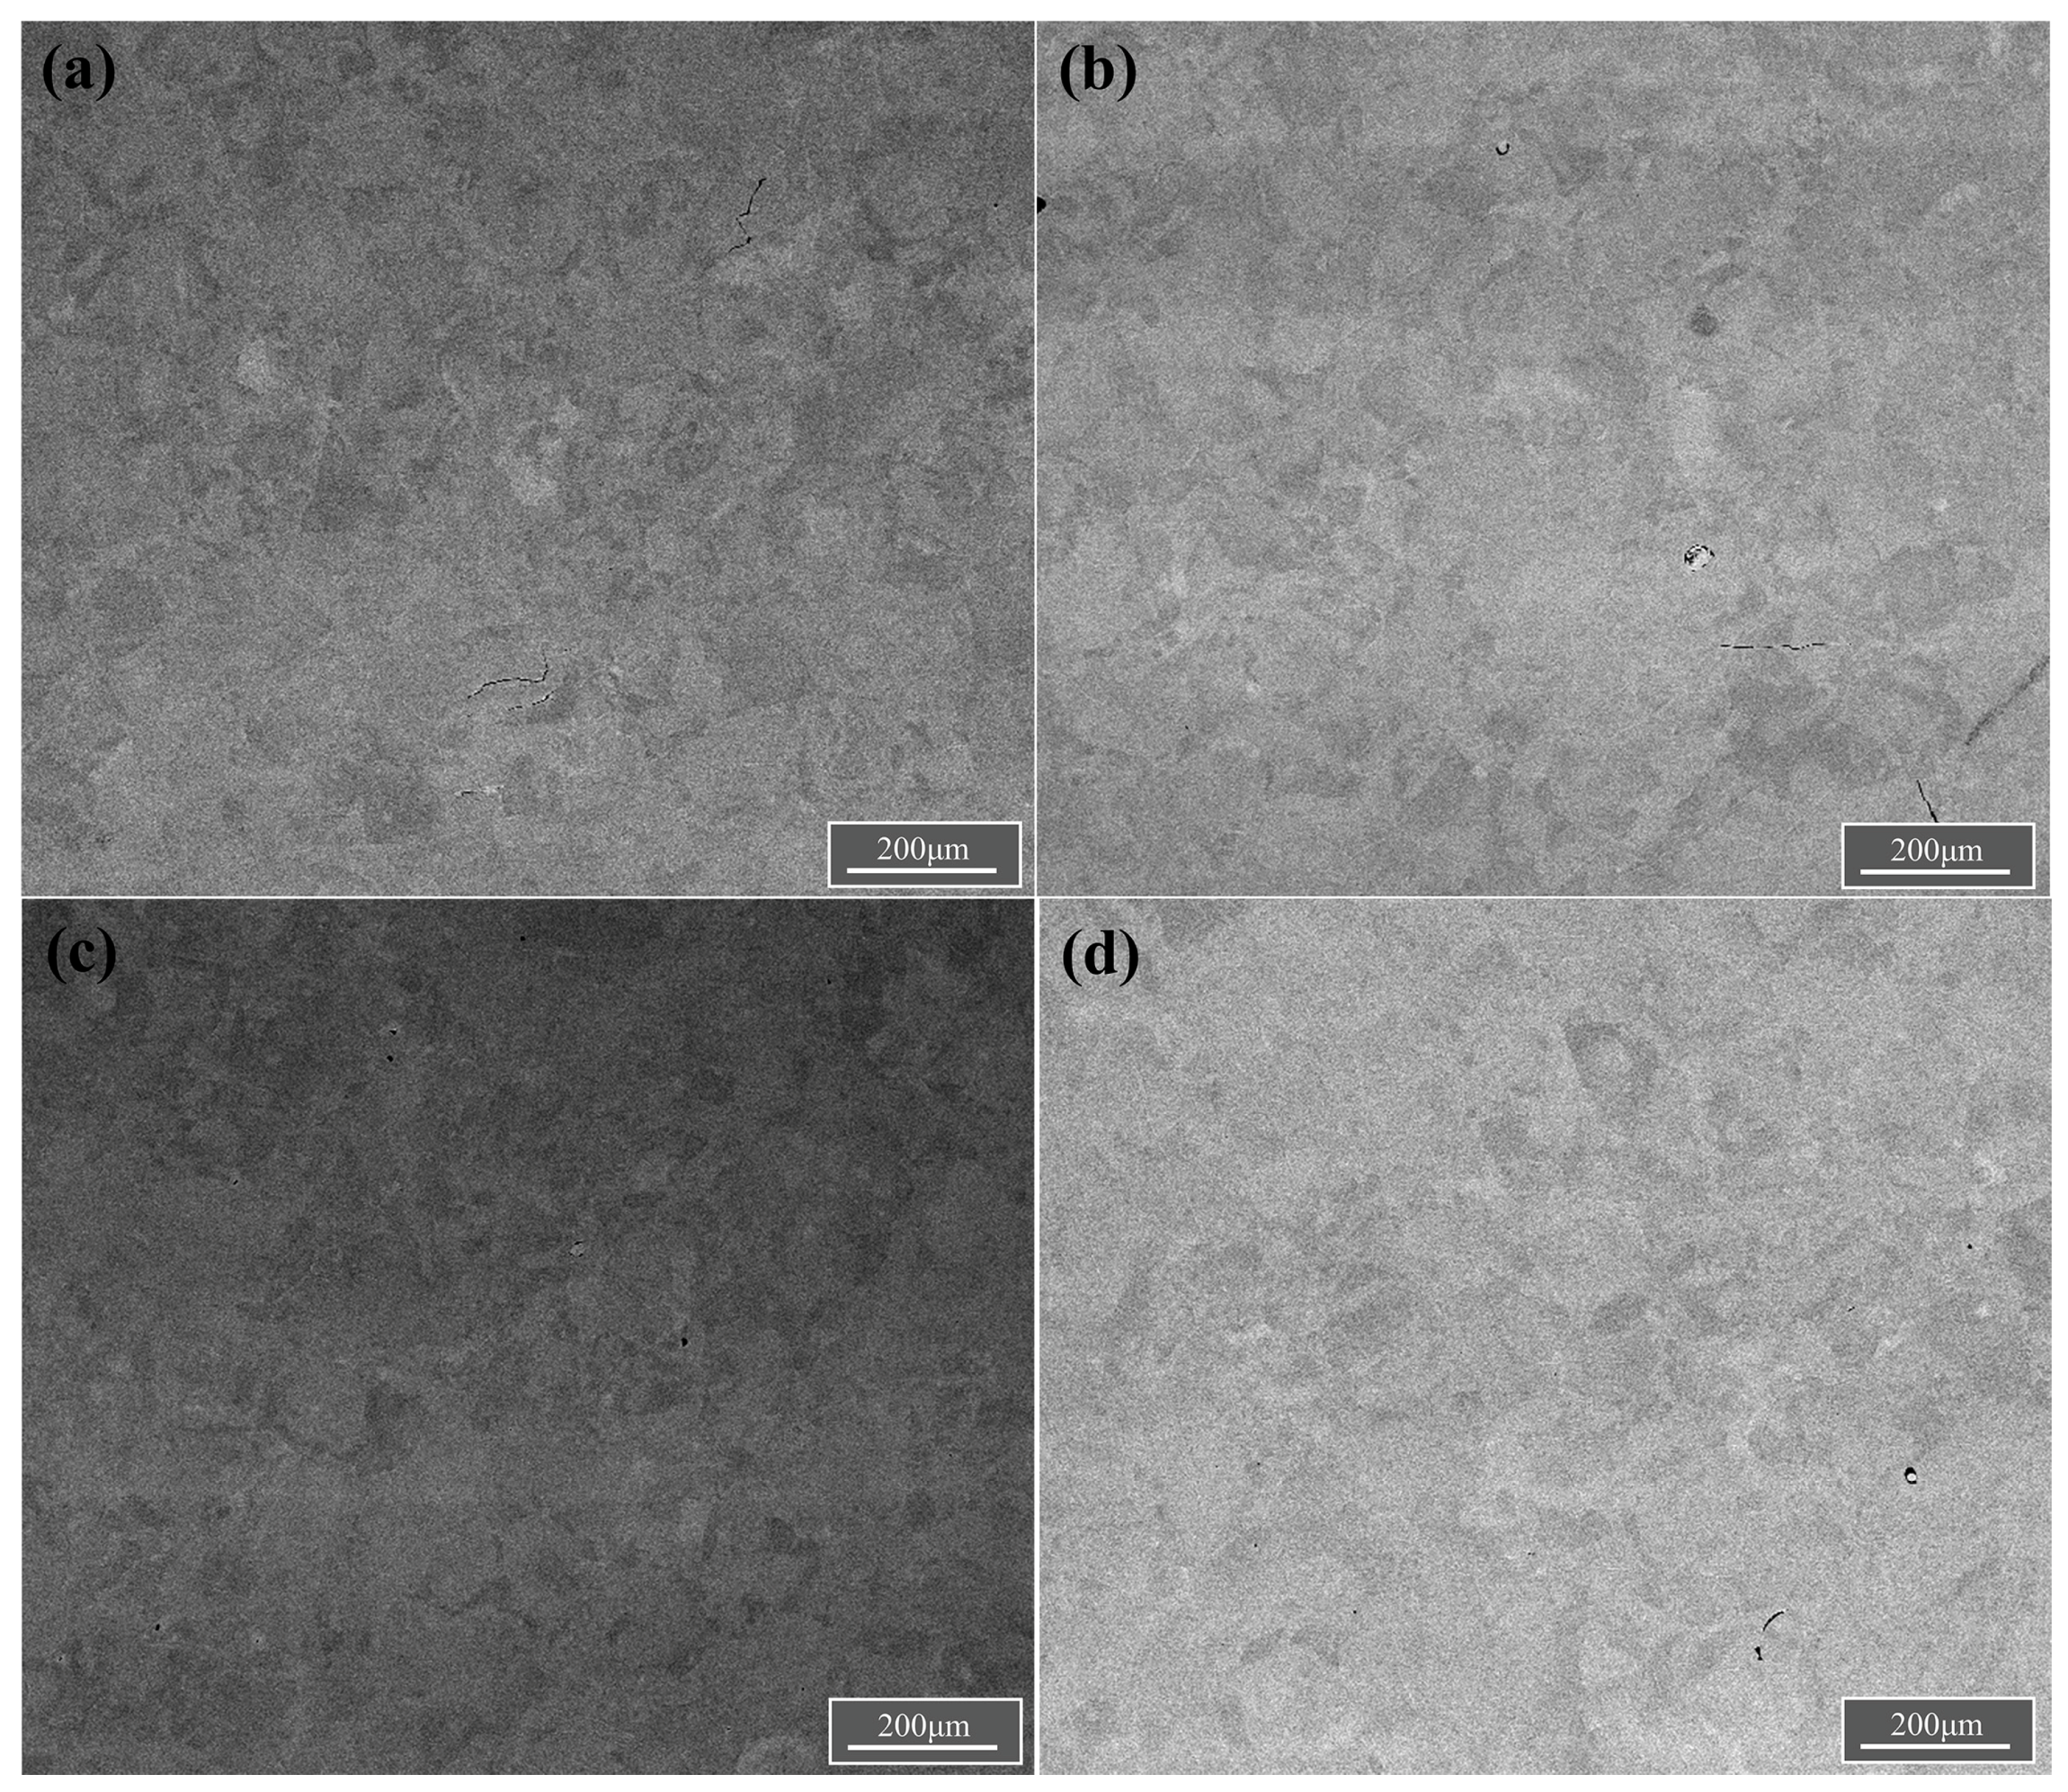
3.1. Relative Density and Surface Morphology

Figure 2a–d presents a detailed top-view OM image of the as-fabricated samples. The samples were referred to as S1, S2, S3, and S4 to represent the samples fabricated by P = 200 W and v = 600 mm/s, 700 mm/s, 800 mm/s, 900 mm/s, respectively (Figure 2a–d). The microstructure indicated no unmelted areas, and no layer connection defects were identified. The molten pools between the adjacent layers were distributed at 67°, and the pool boundaries were mutually parallel on the same layers. Furthermore, small pores and defects can be identified in the four samples. The metallurgically bonded layers had comparatively fewer defects as identified in S1.
Energy density decreased with the increase in laser scanning speed. As a result, the surface tension was gradually reduced, and the powders partially melted, reducing the surface quality. At the scanning speed of 900 mm/s, irregular microporosity appeared at the boundary of the molten pool (Figure 2d). In addition, the depth of the molten pool increased with the decrease in scanning speed. Bhardwaj et al. [15,20] suggested that the subsequent layer caused by remelting may affect the accuracy of OM statistical results to a certain extent; this trend continues under the obviously different depths and widths of the molten pool. A low scanning speed can lead to a high energy density (Figure 3), and the sample with a scanning speed of 600 mm/s only exhibits a few spherical pores caused by shrinkage [23,25] during the SLM process. The gas caused by evaporation had no time to overflow, and it was retained in the molten pool due to rapid solidification [26]. However, under the effect of low energy density, irregular micropores formed at the molten pool boundaries where the area was not completely melted due to Marangoni convection and liquid capillary instability.
The relative densities of S1, S2, S3, and S4 were determined to be 99.3%, 99.1%, 99.2%, and 98.2%, respectively, in accordance with the principle of Archimedes. Figure 3 presents the correlation between scanning speed and relative density. As shown in Figure 3, the relative density of the samples tended to increase and then decrease with the increase in scanning speed. The highest relative density was 99.3% at a scanning speed of 600 mm/s. The relative densities significantly reduced with low energy input. The relative density of S4 decreased to 98.07% with the increase in scanning speed since the powder failed to melt sufficiently at this energy density [27]. As revealed by the above results, a suitable scanning speed can ensure an appropriate energy input, thus leading to high relative density and a smooth melt track surface.

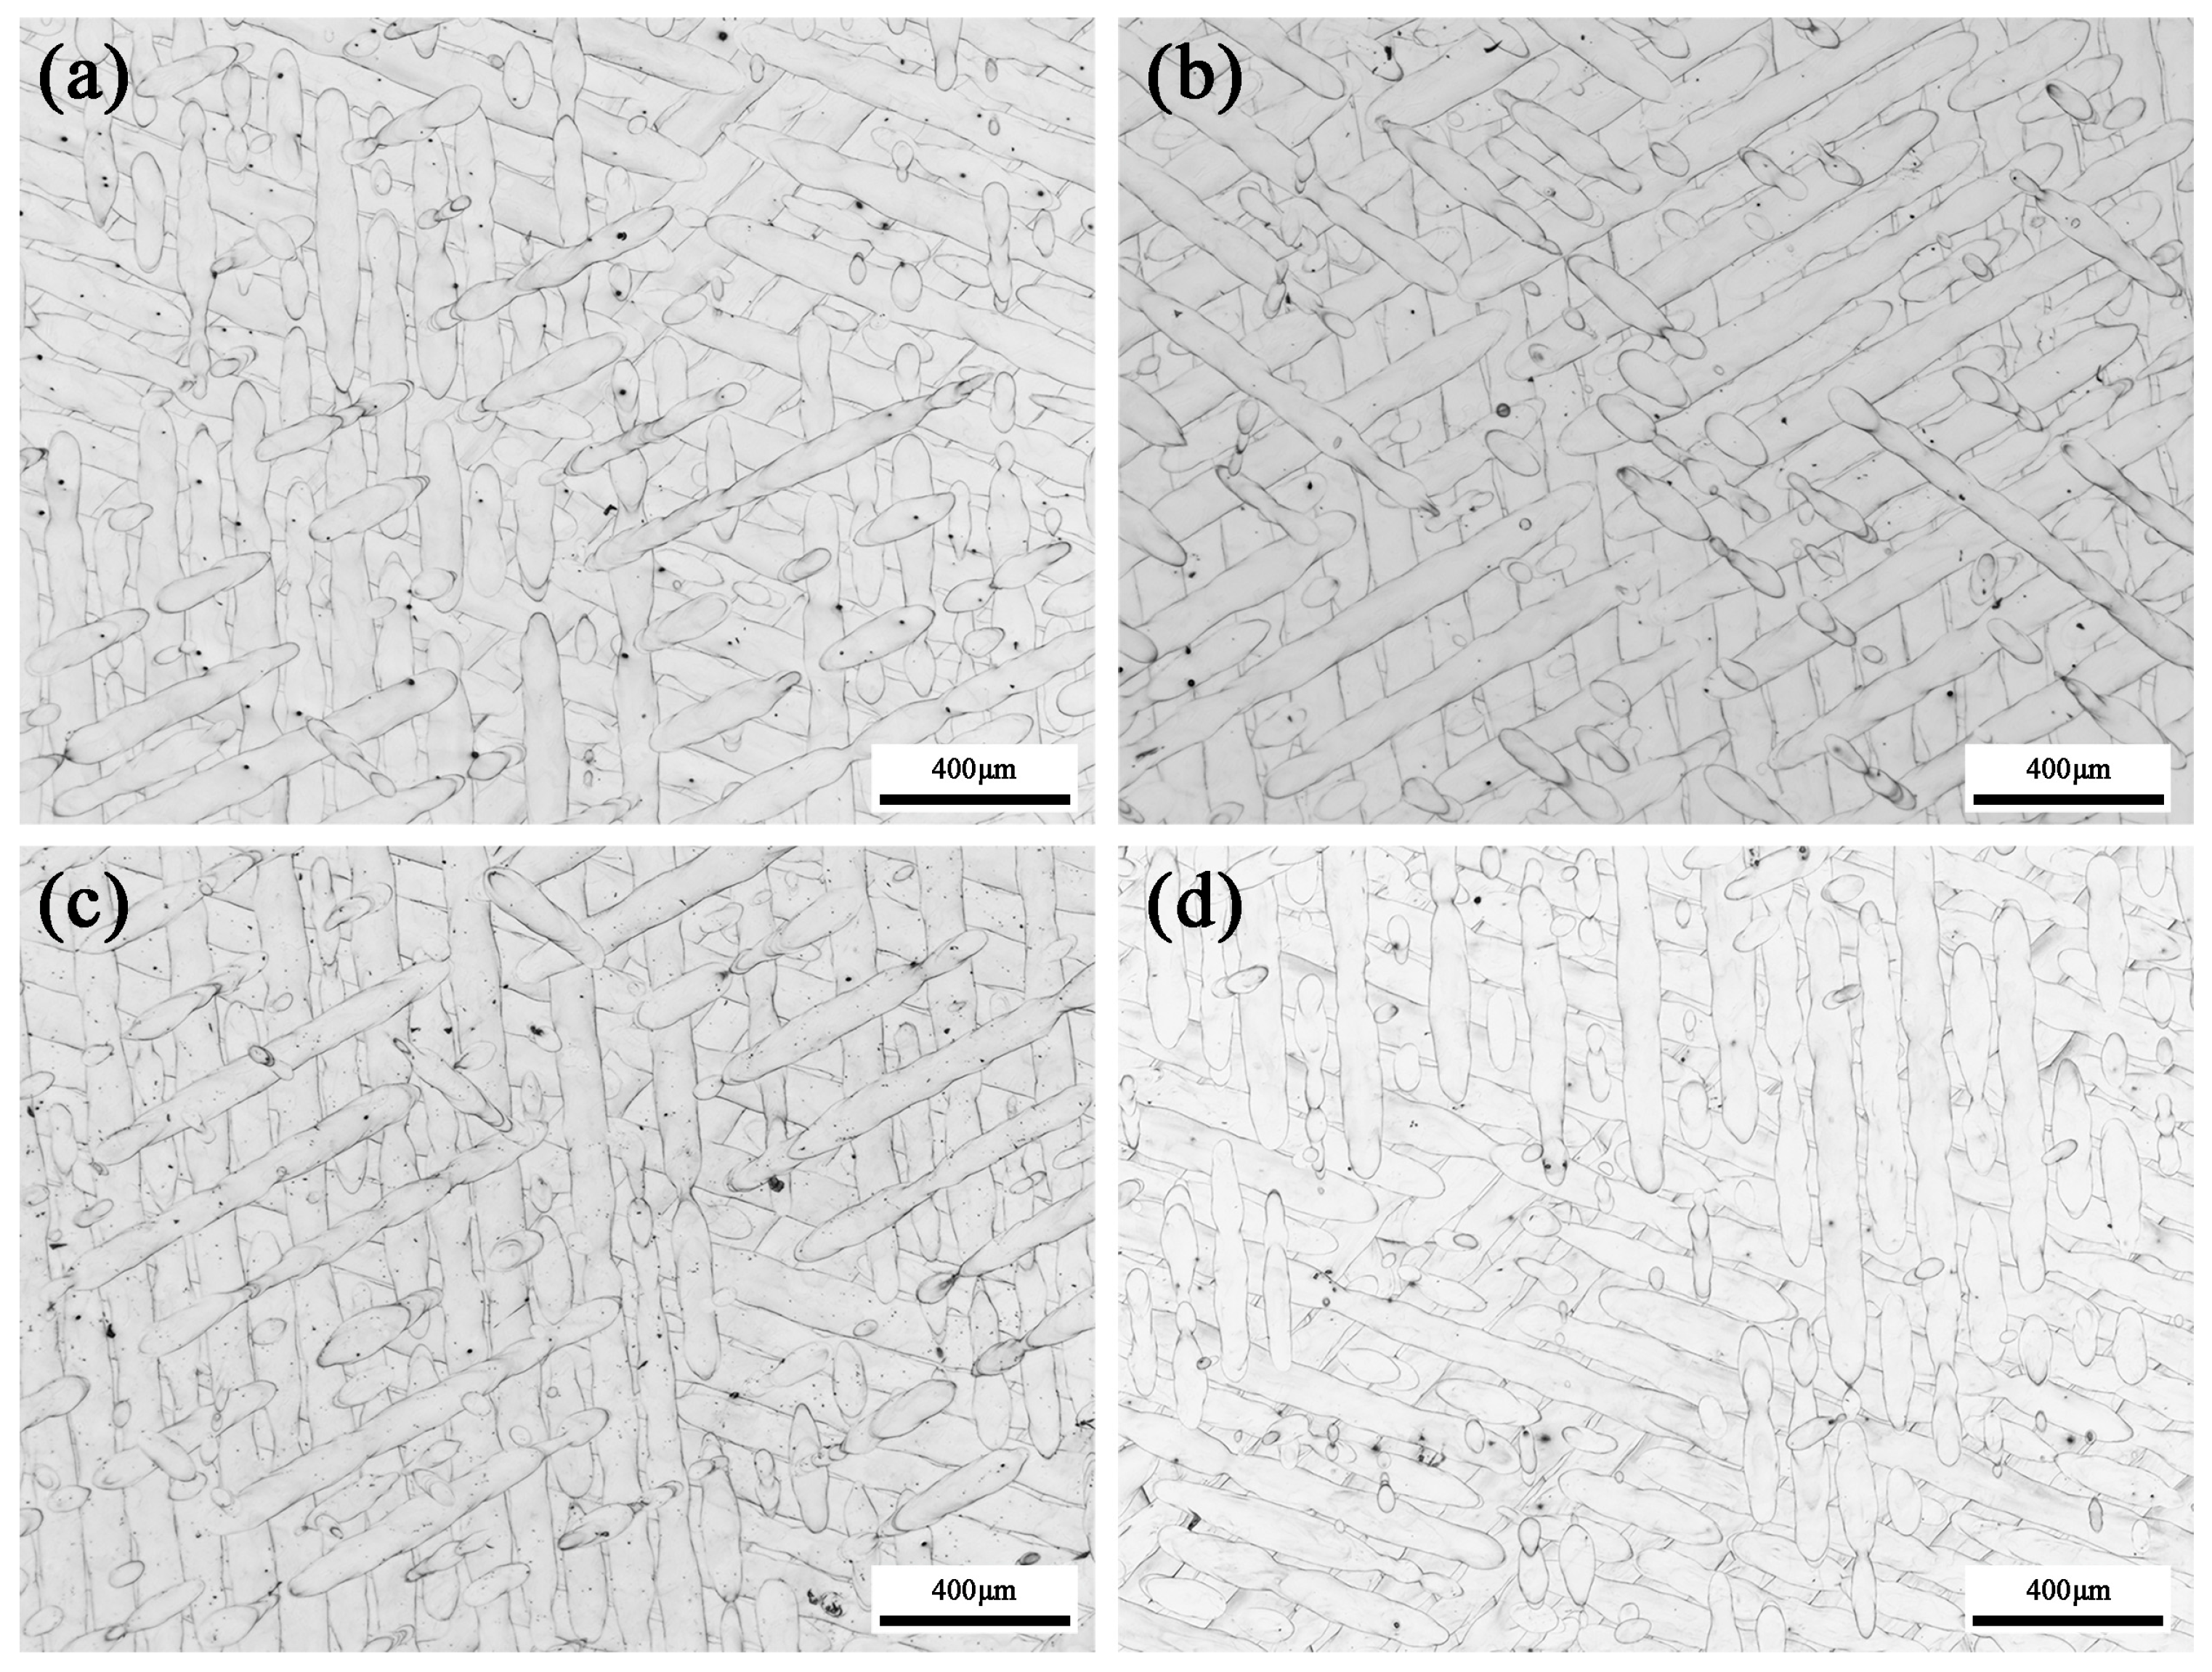
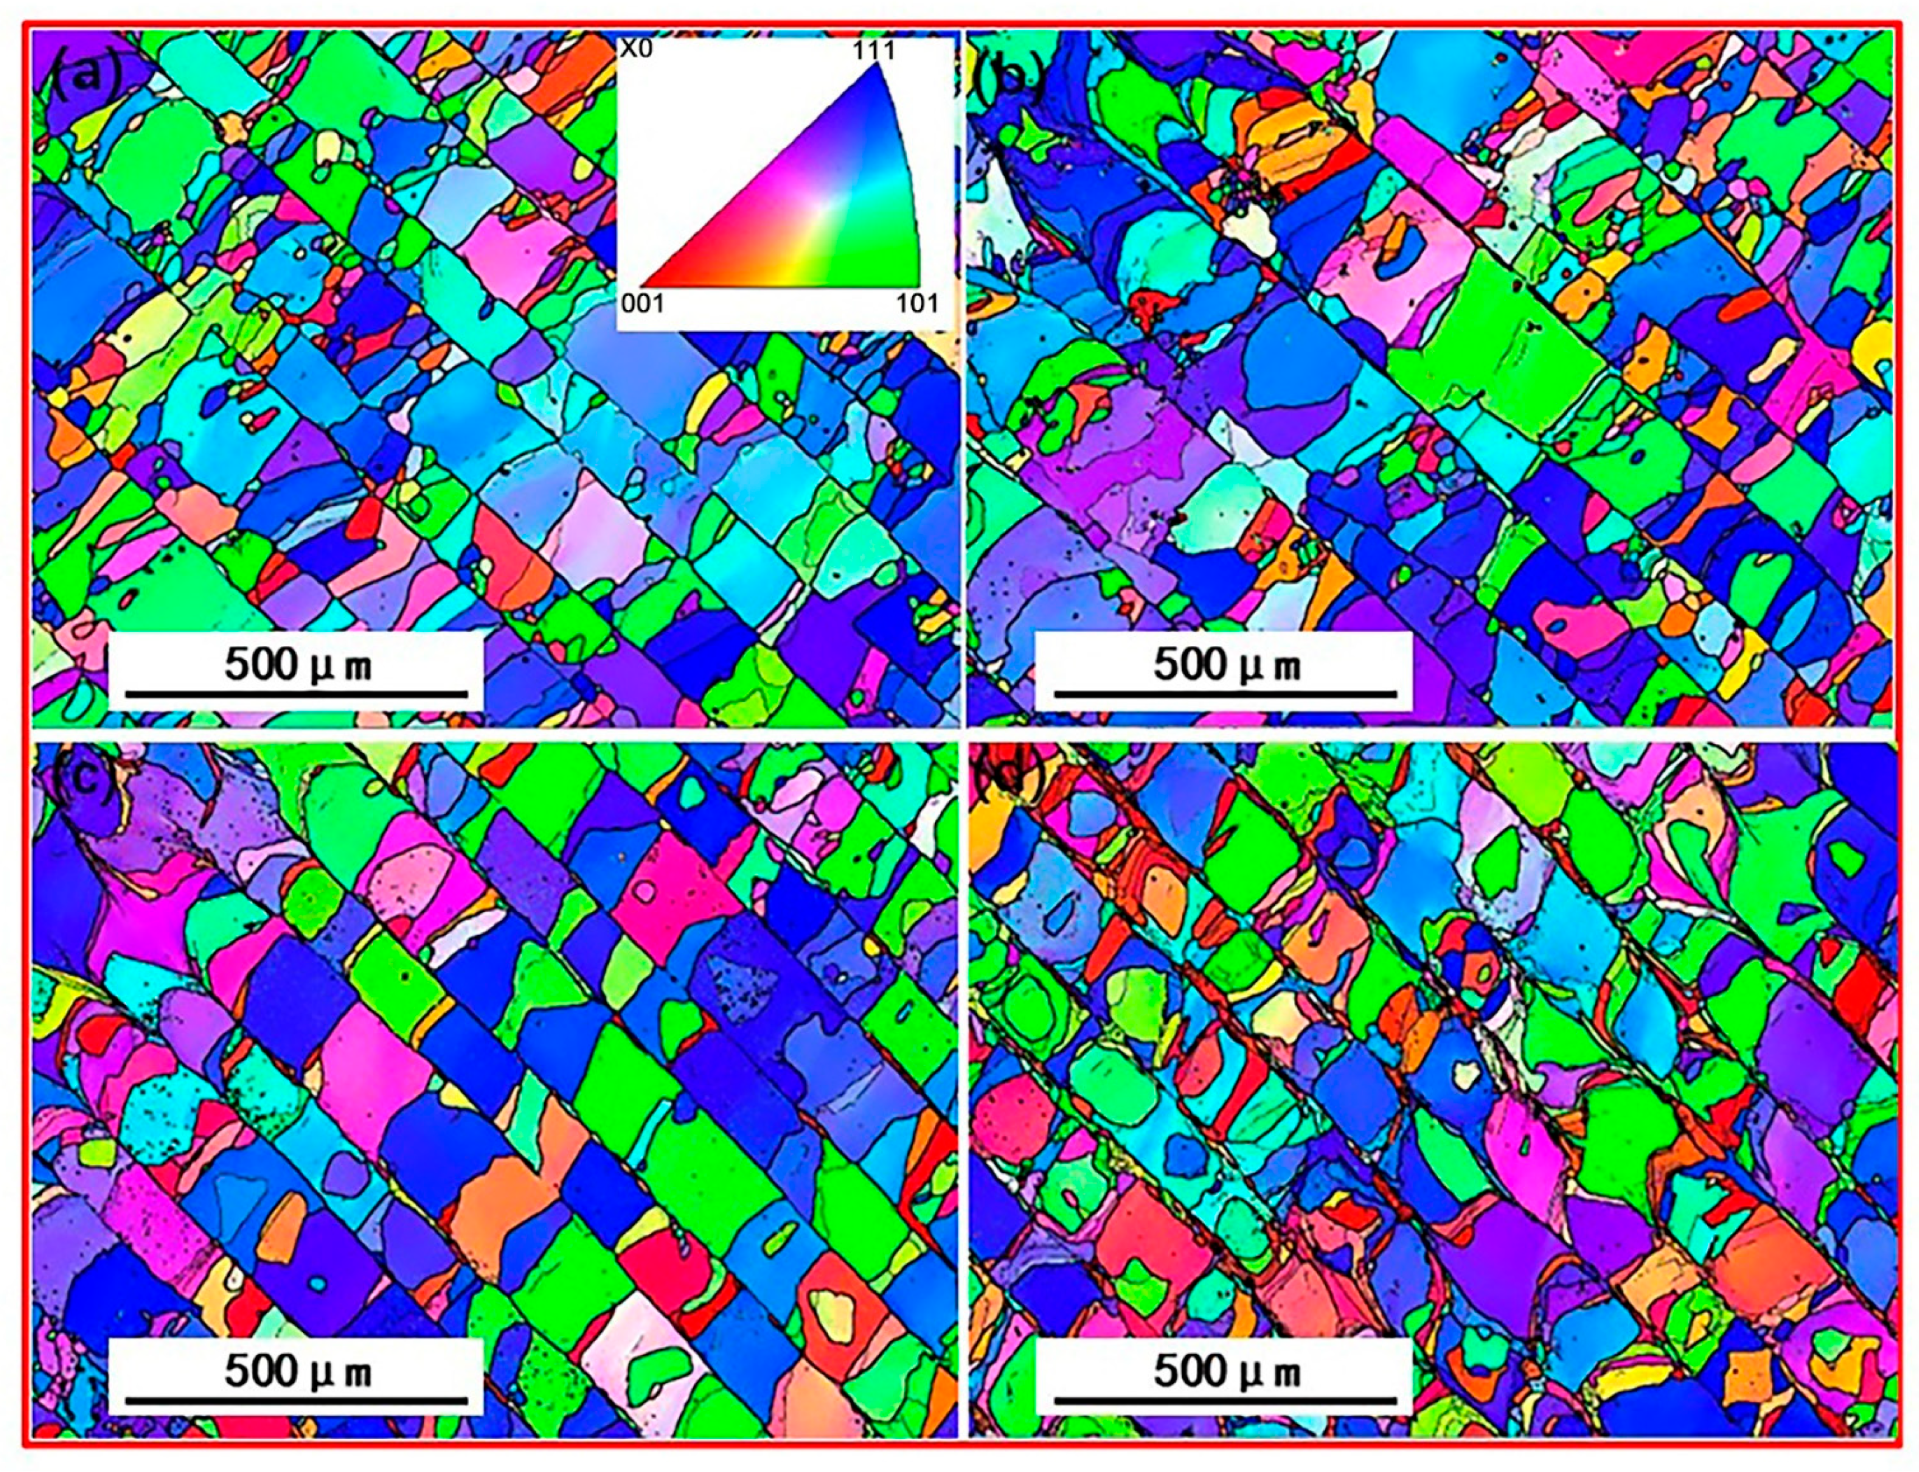
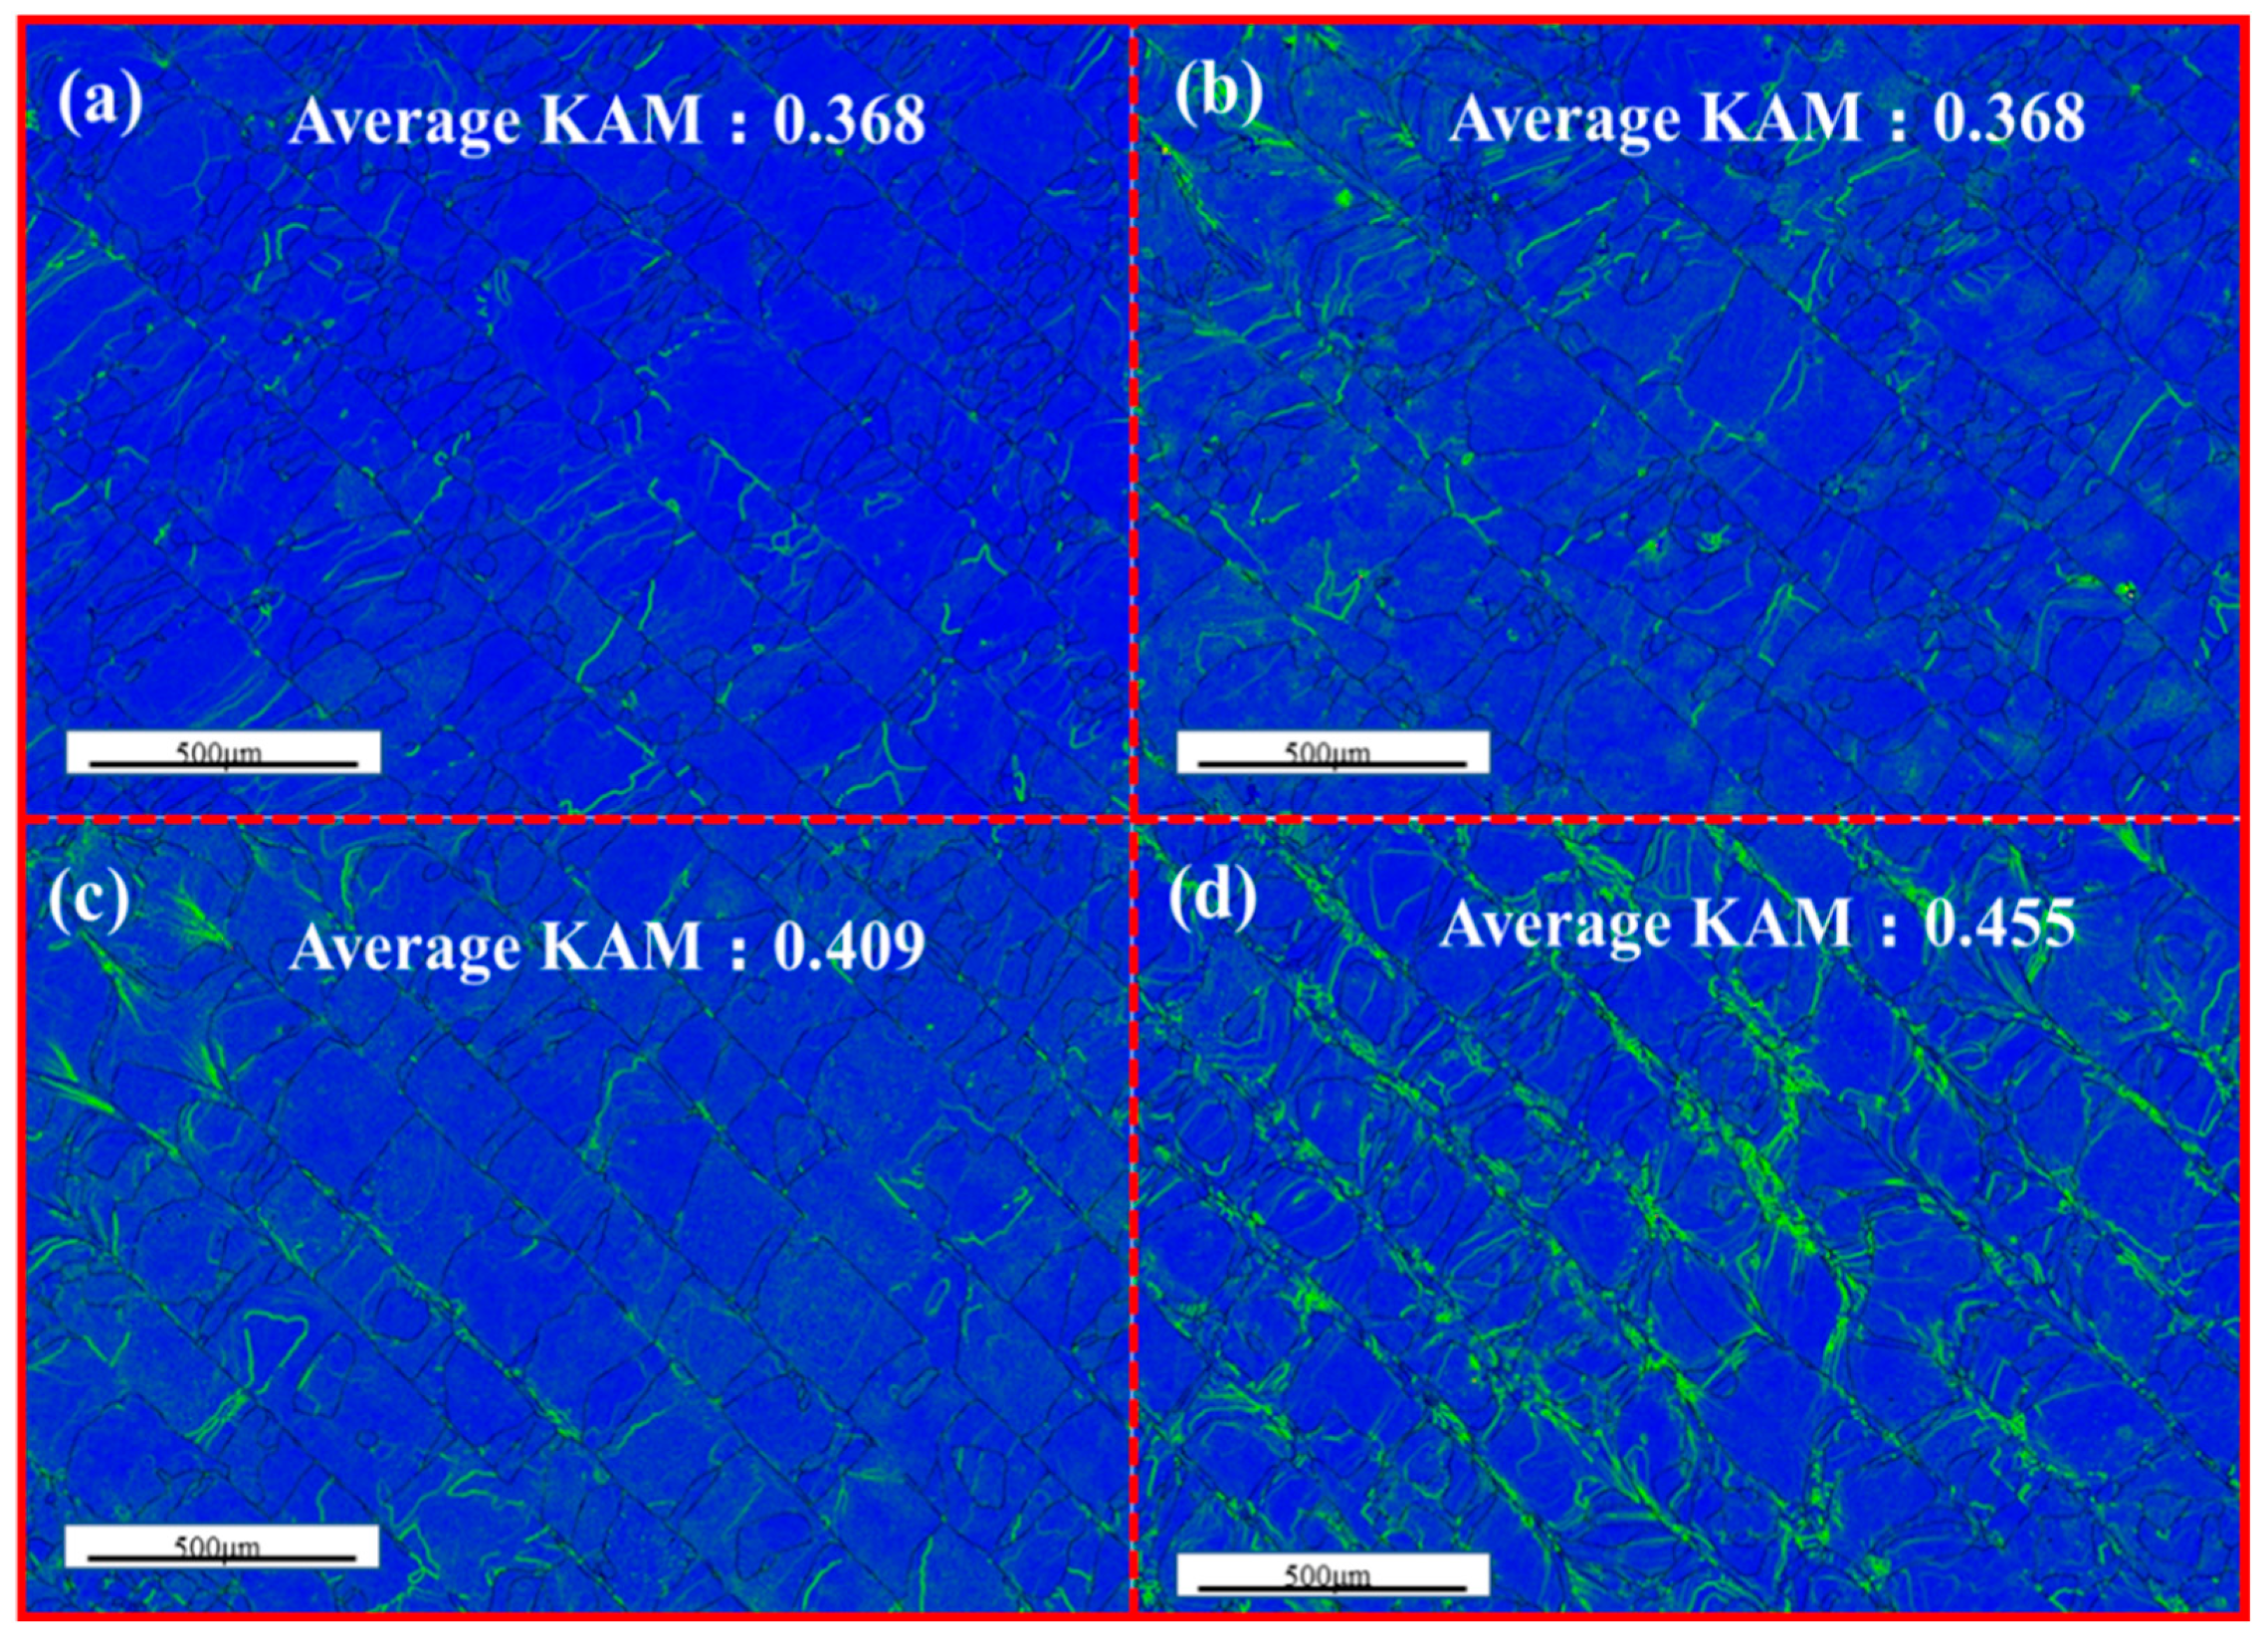
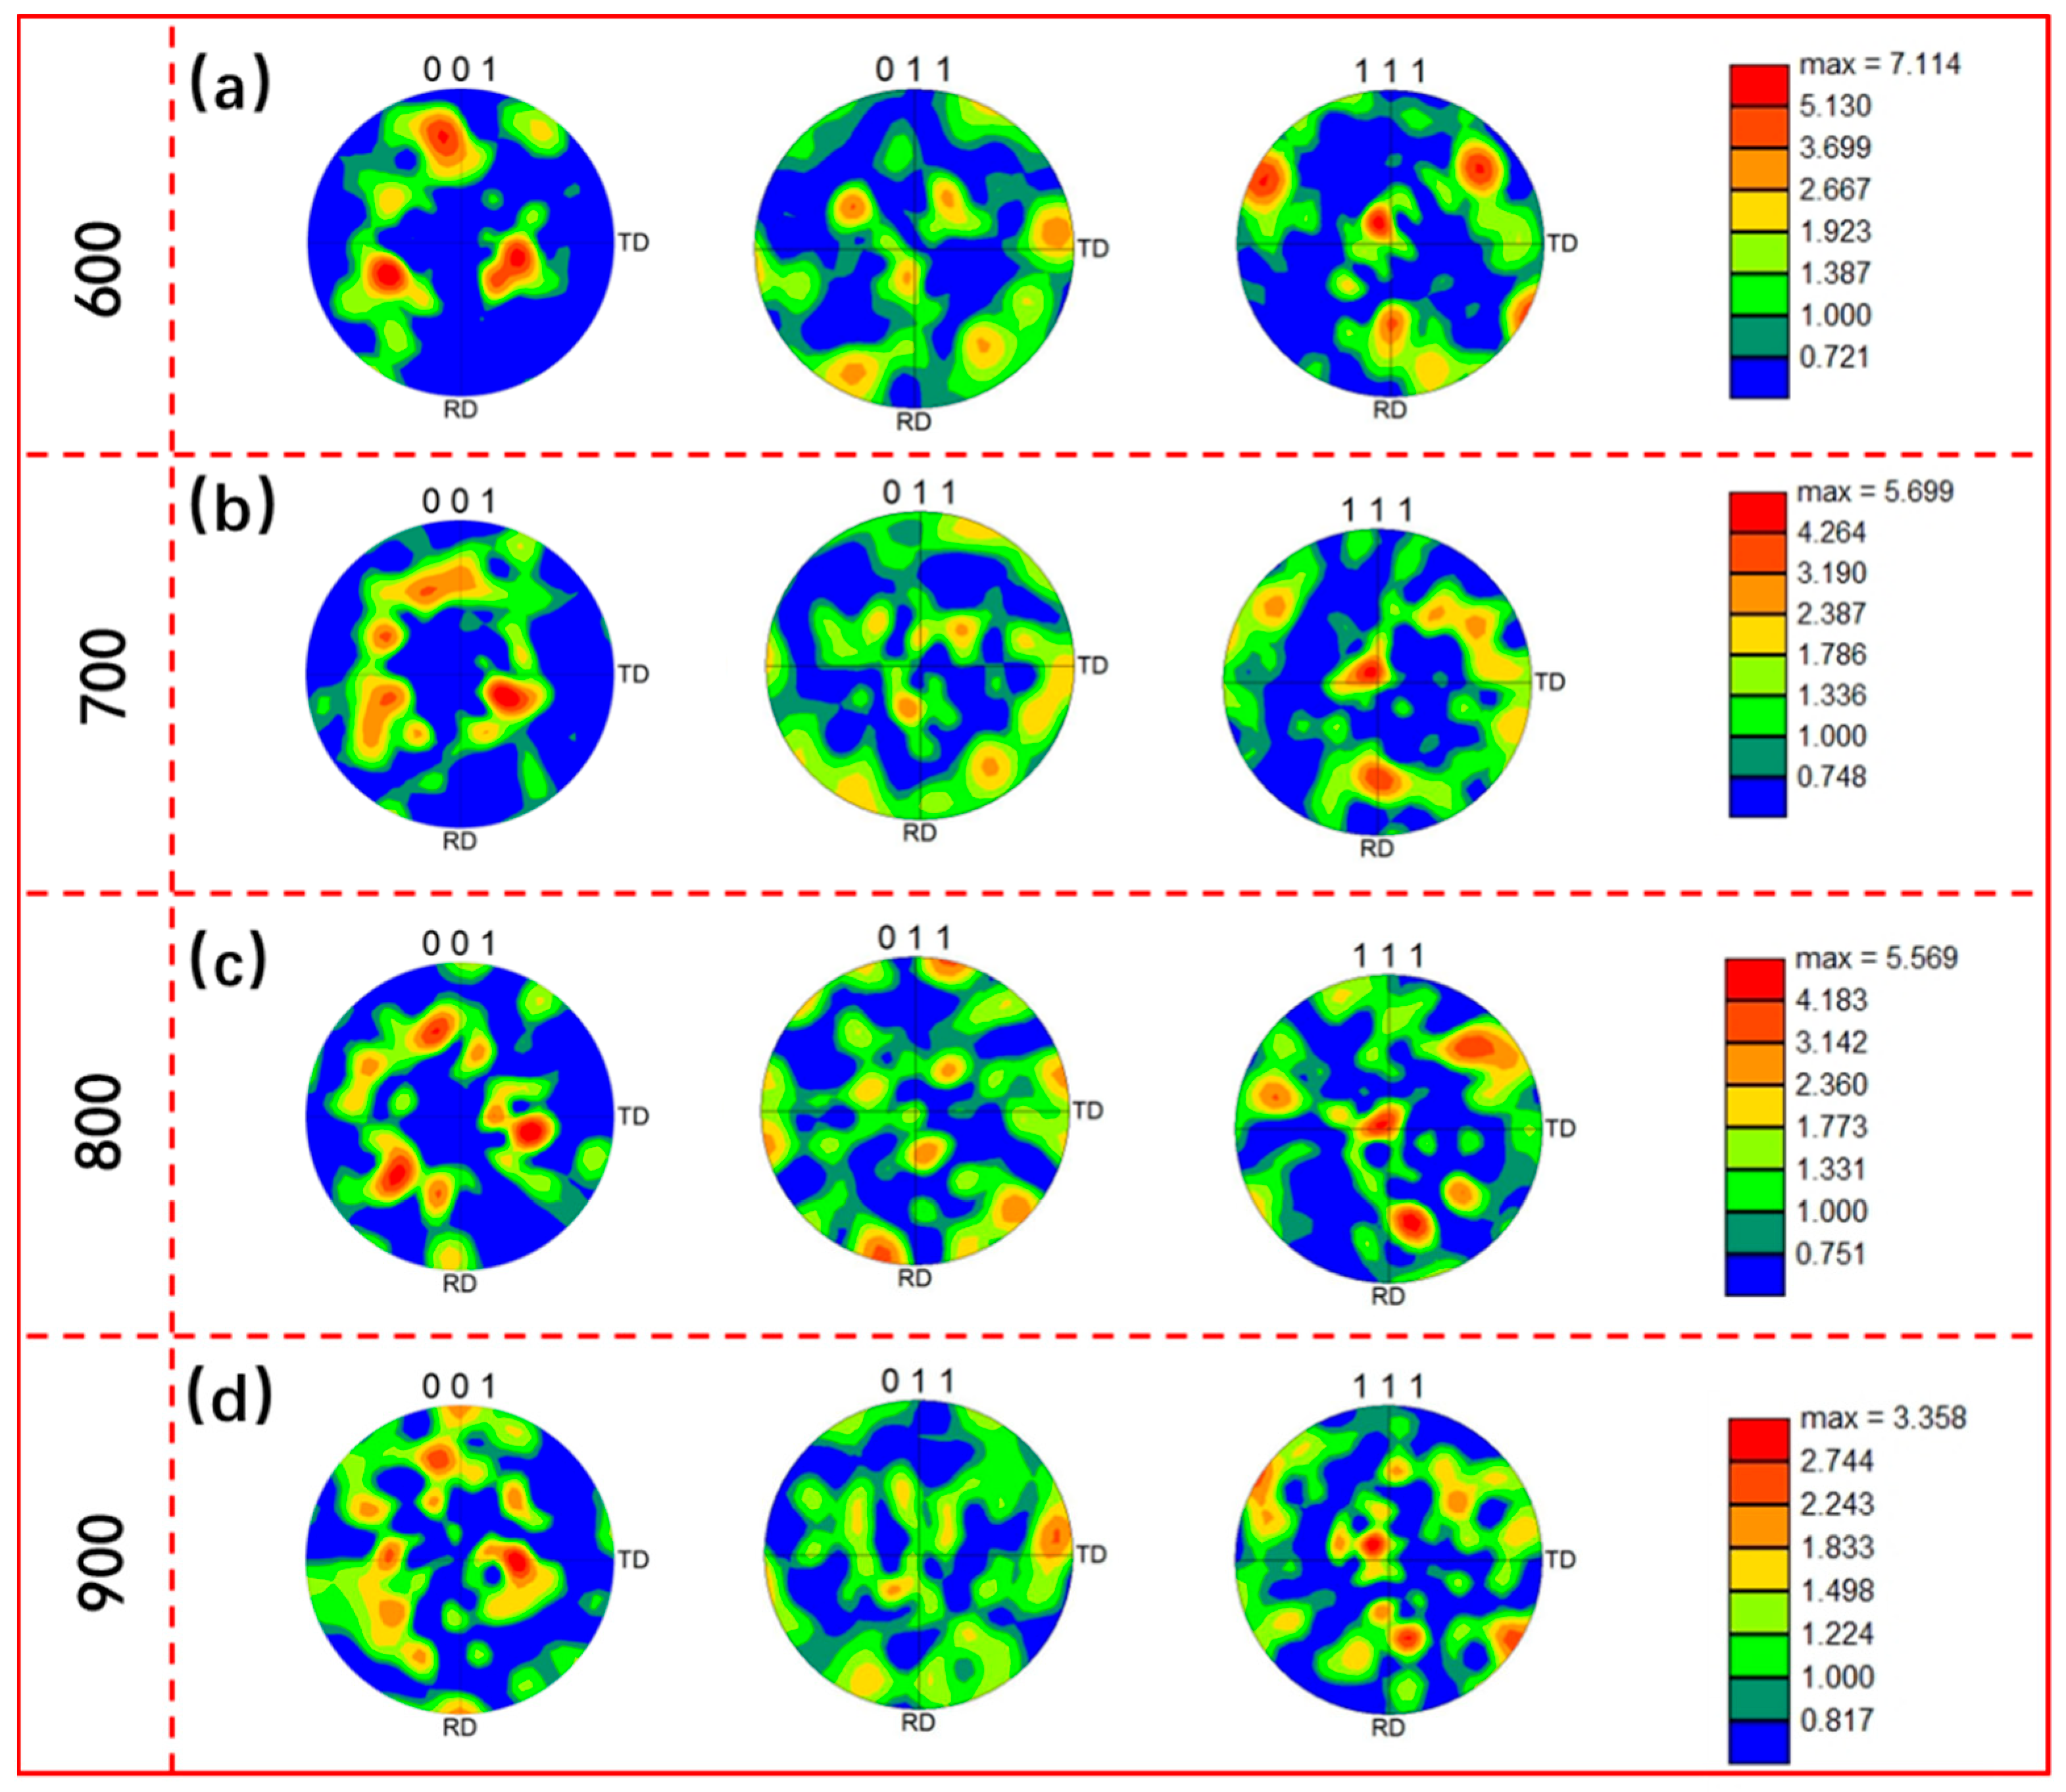
3.2. Microstructure Characteristics and Grain Orientation

Figure 4 illustrates the morphology characteristics of SLM-fabricated Ti-22Al-25Nb alloys. As depicted in the BSE SEM images (Figure 4a–d), the samples with scanning speeds of 600, 700, and 800 mm/s were completely dense with no apparent pores. The sample at the scanning speed of 900 mm/s had significant holes consistent with the results presented in Figure 2. Significant holes can be precursors to crack initiation and propagation. Chen et al. [28] confirmed that holes and voids result in macro/micro crack initiation, thus leading to premature fracturing and poor mechanical properties. To investigate the effect of scanning speed on the samples and the possible segregation in the samples, SEM and corresponding EDX mappings were performed on the Ti-22Al-25Nb IMC alloys (Figure 5a–d). The EDX mappings indicated that the samples were uniformly composited by Ti, Al, and Nb throughout the field of view. It is noted that there was no significant Nb-rich area change in the elemental content of the samples processed at different scanning speeds. These results are consistent with previous reports that suggest the effect of scanning speed on the essential content of SLM-fabricated Ti-22Al-25Nb IMC alloy can be negligible [29].
Figure 6 shows the inverse pole figure (IPF) maps of the SLM samples at different scanning speeds. Crystallographic orientations represented by corresponding colors on the IPF maps can be distinguished from the IPF triangle, with red representing a grain orientation of <001>, blue representing a grain orientation of <111>, and green representing a grain orientation of <101> (upper-right corner of Figure 6a). As depicted in Figure 6, the boundaries of the scanning tracks are noticeable in the IPF maps, which are ornamented with finer grains, and the track boundaries are parallel to each other. Li [21] and Chen [28] et al. confirmed that SLM-fabricated samples exhibited a mixed grain structure comprising large and small grains. The large grains were identified in the center of the molten pool, while the small grains were formed at the boundary of the molten pool due to the temperature gradient. Moreover, scanning speed affected the grain size and molten pool width of the as-fabricated samples. With a scanning speed of 900 mm/s, microstructure was significantly different from that of other samples, which may have been related to the relative density of the sample, since the relative density of the sample with a scanning speed of 900 mm/s was significantly lower than that of the other samples (Figure 3).
In all the samples, at a scanning speed range of 800 to 900 mm/s, the alloy primarily comprised a B2-solid solution with a cellular structure. A columnar structure was identified in the molten pool boundaries around the melted tracks. A similar phenomenon has also been identified in Ti-15Nb alloy [30]. The columnar structure on the edges of the scanning channel, which was characterized by an increased number of nucleation sites compared with the upper surface of a molten pool, induced a cellular solidification front. High scanning speeds exhibited large thermal gradients and cooling rates at the molten pool, thus facilitating cellular structure formation [31]. With the increase in scanning speed from 600 to 900 mm/s, the grain structure varied from columnar to exhibiting the coexistence of cellular grains and columnar grains around the melted tracks.
To elucidate the relative strain concentration induced by different scanning speeds, kernel average misorientation (KAM) maps of the β phase were generated and adopted so as to examine the dislocation density. Figure 7 presents the KAM maps of the samples corresponding to Figure 6, where the blue and light-green parts represent the regions with the lowest and highest density of dislocations, respectively. As depicted in Figure 7, the average dislocation density increased with the increase in scanning speed, suggesting that higher speeds led to more significant strain concentration. Additionally, the largest density of dislocation was exhibited at the pool boundaries. During the fabricating process, dislocation density and strain concentration were closely correlated with the cooling rate; that is, a higher scanning speed led to a higher cooling rate. Moreover, existing research has confirmed that the cooling rate along the directions perpendicular to the scanning direction is highest. As a result, the highest KAM value was identified in S4 (highest scanning speed) and near the pool boundary.
Figure 8 presents pole figure (PF) maps showing the orientation of the β grains in the samples. Figure 8a–c,d are the orientation maps recorded with reference to the IPF maps (Figure 7a–d), which are the stereographic projections (001) β, (101) β, (111) β, and (112) β, respectively. As depicted by the figures, the grains in all the samples showed a <111> crystallographic direction. The β grains had random orientations, and the multiples of a random density/distribution (mrd) decreased with the increase in scanning speed, with the maximum intensities ranging from 7.114 to 3.358 mrd.

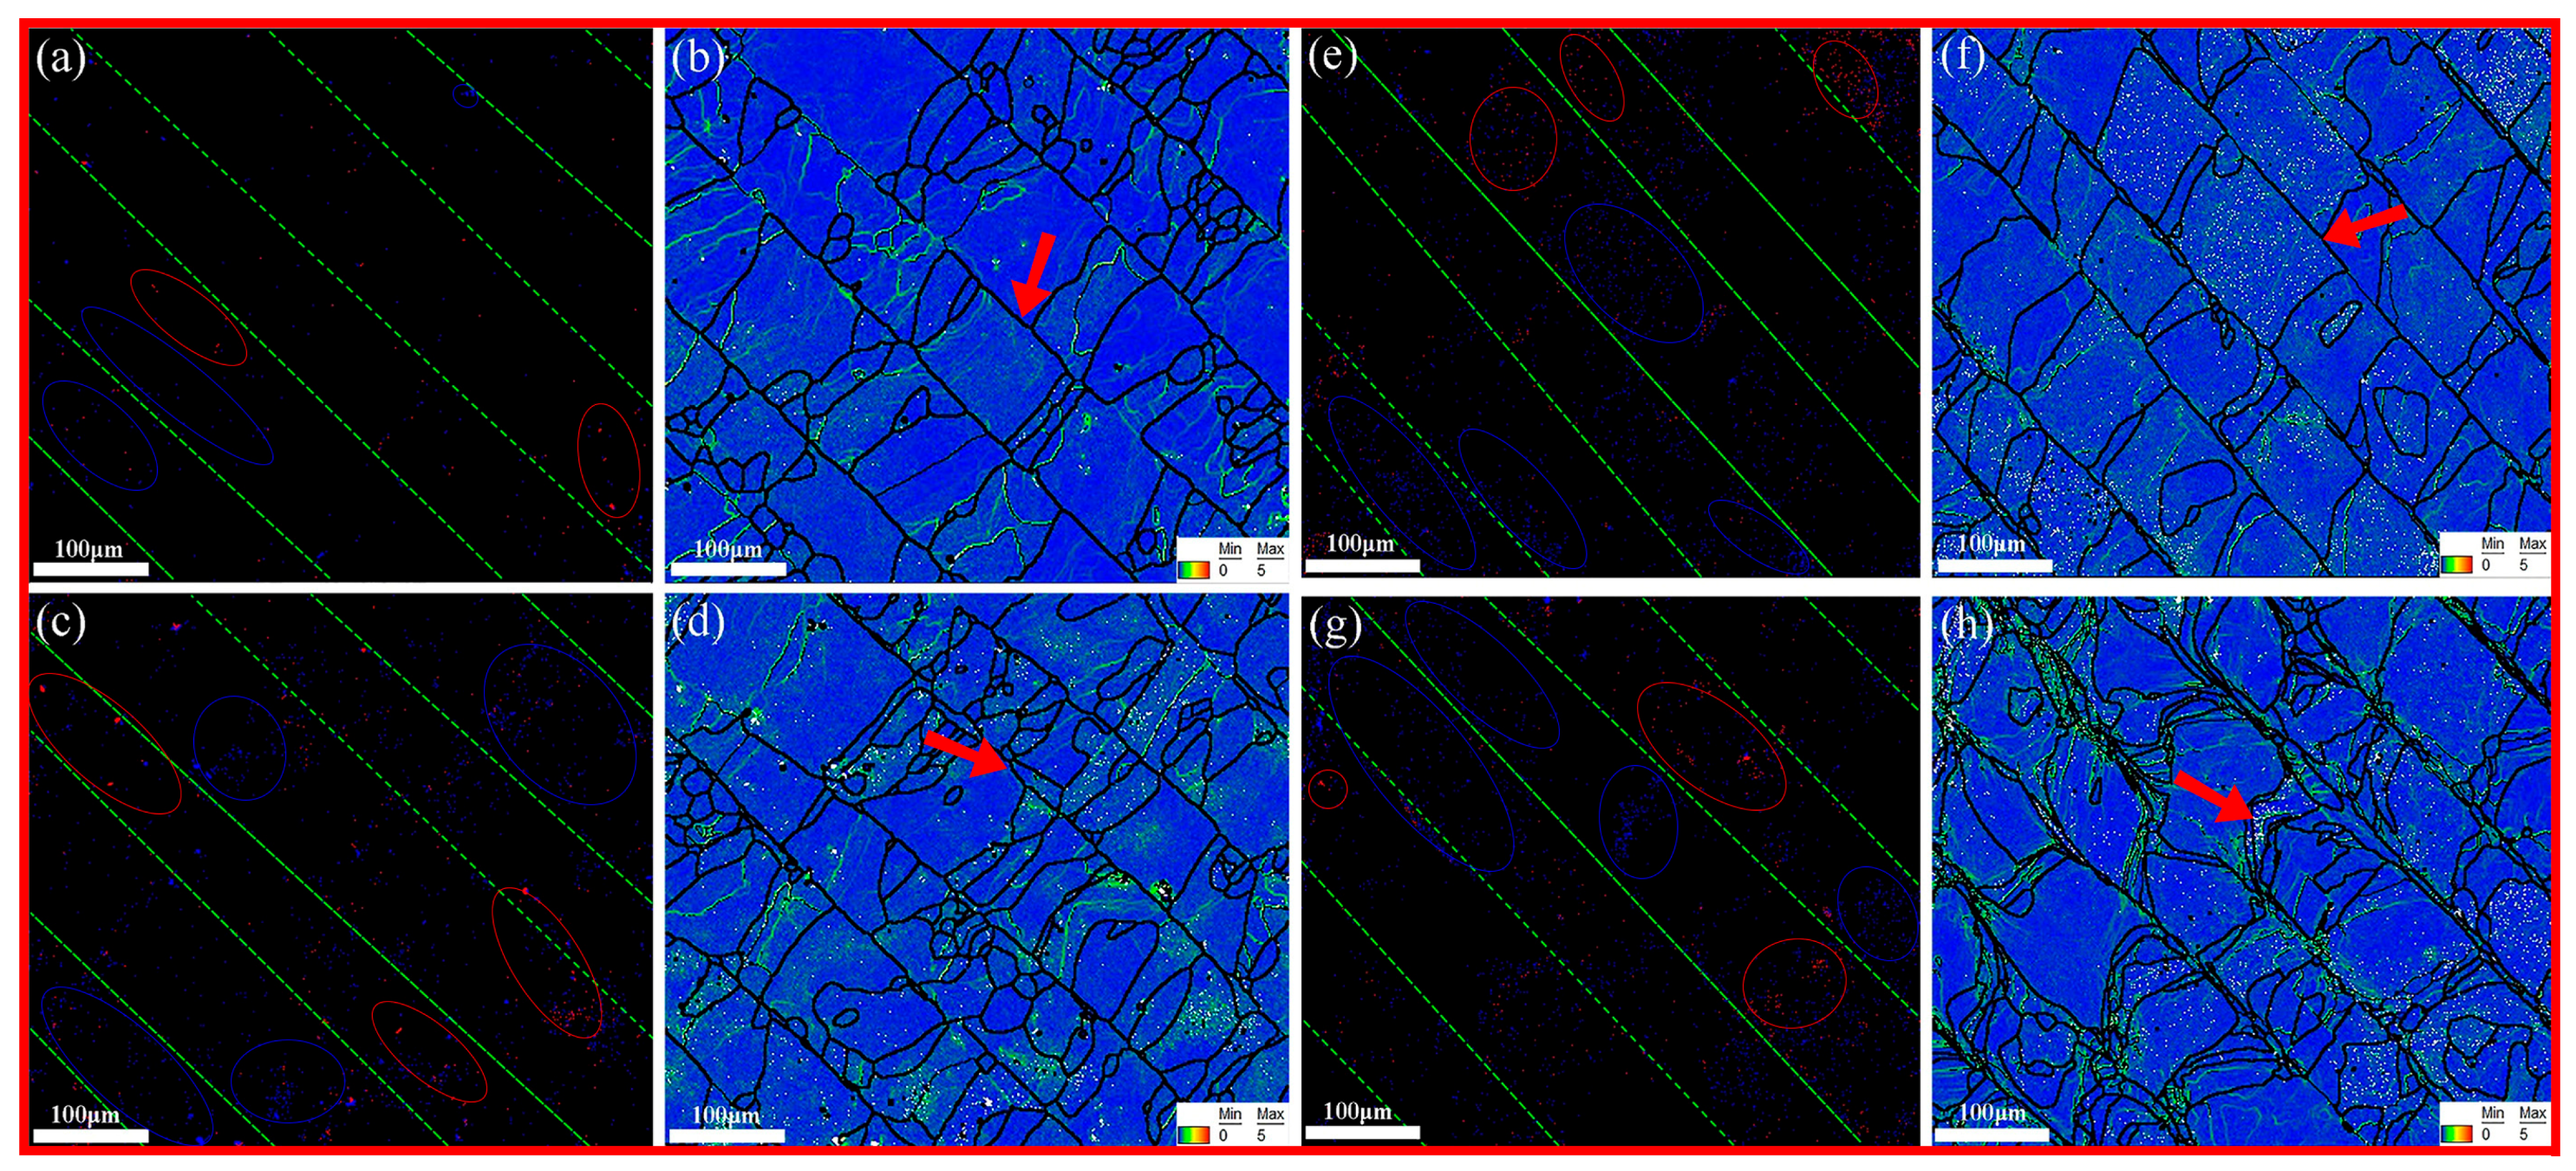
3.3. Phase Distribution

The XRD patterns of the Ti-22Al-25Nb samples are illustrated in Figure 9, which confirm the presence of the B2/β phase as well as the low-level presence of the O phase among all the samples. Small peaks of TiAl3 phases appeared only in the samples at scanning speeds of 600, 700, and 800 mm/s. Moreover, the peak intensity of the Al3Ti phase increased with the increase in scanning speed. Zhang et al. [32] examined the effects of annealing temperature and time on the growth kinetics of the TiAl3 phase in Ti/Al laminated composites. Their results suggested that the precipitation of the TiAl3 phase is largely correlated with temperature. Given the reheating effect exerted by the substrate, scanning speed will affect the energy input and cooling rate, thus affecting the precipitation of secondary phases [31]. Furthermore, the amount of TiAl3 phases was relatively low due to the transient reheating process.
The XRD patterns in Figure 9 verify the presence of some secondary phases (e.g., O phase and Ti-Al intermediate phases). To further verify the distribution of the above phases, the O (red in color) phase and Ti-Al phases (blue in color) were deducted from the EBSD orientation maps (Figure 10a,c,e,g). We used ellipses of corresponding color to mark the enriched area of the phases. As depicted in Figure 10b,f,d,h, the secondary phases were distributed more uniformly in the single grains at a lower scanning speed, labeled by the red arrow. By contrast, the secondary phases were primarily distributed in the region with a high strain concentration near the pool boundaries. Notably, in S4, the secondary phases were concentrated in the pool boundaries (Figure 10h).

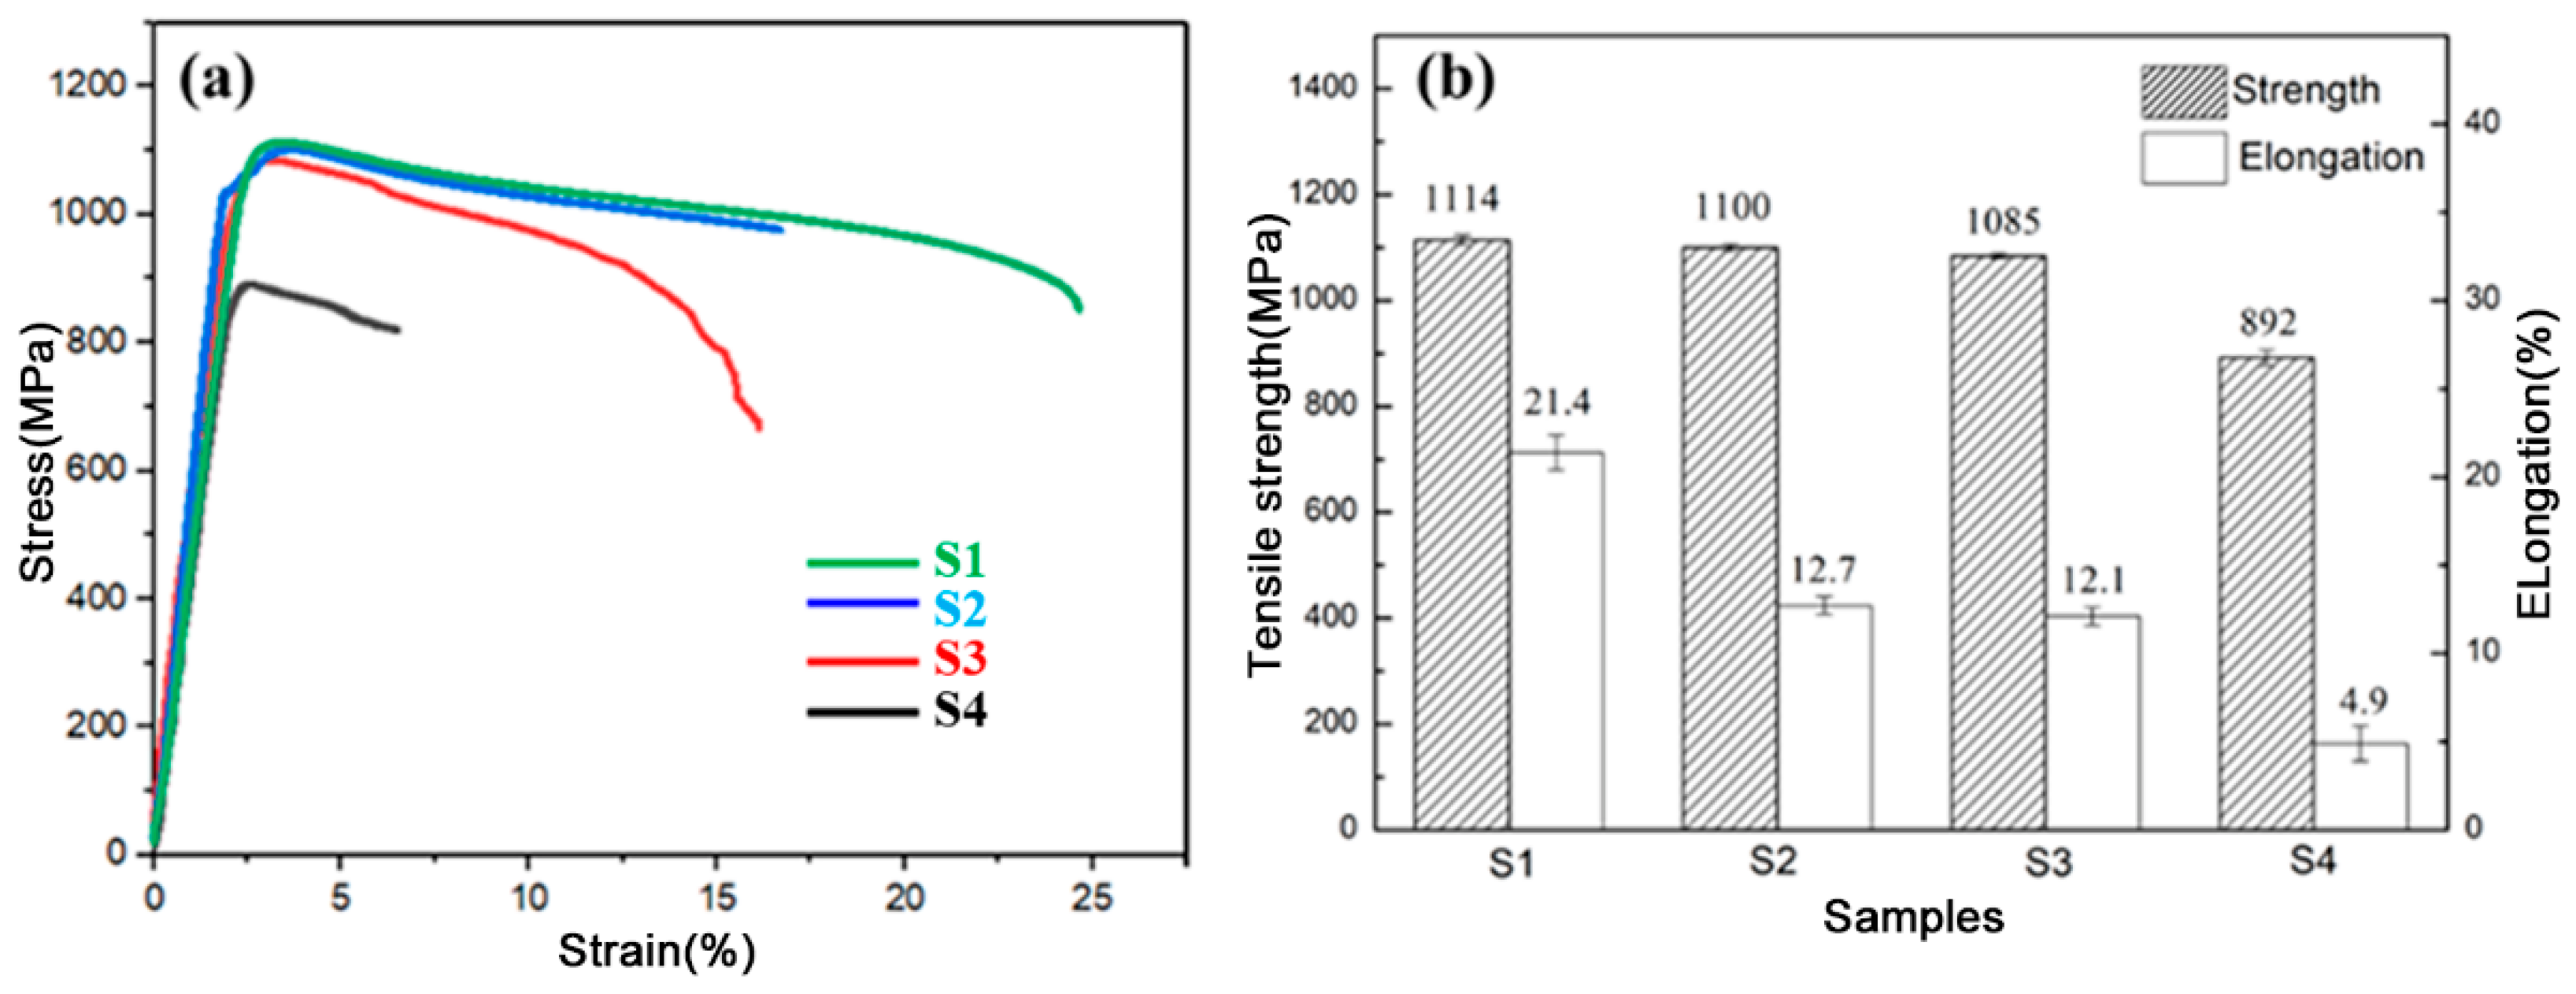
3.4. Tensile Properties

Figure 11 illustrates the stress–strain curves of the SLM-fabricated Ti-22Al-25Nb samples at different scanning speeds. As depicted in Figure 11b, the tensile strength and elongation decreased with the increase in scanning speed. The sample fabricated with 600 mm/s exhibited the highest strength of 1114 MPa and the optimal ductility of 21.4%, whereas the sample fabricated with 900 mm/s exhibited the lowest strength of 892 MPa and the worst ductility of 4.9%.
To explore the origin of the highest strength and elongation exhibited by S1, the grains and phases of the above samples were characterized in detail. Figure 12 presents the grain size and phase distributions of the different samples. Detailed grain size distribution as shown in Figure 12a indicated that the sample with the lowest scanning speed exhibited the largest grain size (36.383 μm) and the sample with highest scanning speed exhibited the smallest grain size (21.707 μm). Figure 12b presents the distribution of β (cubic), O (orthorhombic structure), and Ti3Al (hexagonal structure) phases. The content of the β phase reached up to 98%, which was a significantly higher figure than those of the other two phases. The content of the Ti3Al phase first increased (600–800 mm/s) and then decreased (800–900 mm/s) with increasing scanning speed, whereas the content of the O phase first increased (600–800 mm/s) and then remained unchanged (800–900 mm/s) with increasing scanning speed.
Among the above phases, the presence of the O phase (orthorhombic structure) had a critical effect in improving creep resistance and strength for the Ti-Al-Nb alloys [33]. The β phase is known to improve ductility and toughness [27], and the existence of Ti3Al can effectively hinder the growth of the β matrix, which can explain the refined grain size of the SLM-fabricated Ti-22Al-25Nb in this study (Figure 12a). Moreover, as depicted in Figure 10, with the increase in scanning speed, the location of the secondary phases varied from the inner β grain to the pool boundary. Previous research [2,23,34] suggested that the precipitation of the O and Ti3Al phases deteriorates tensile strength and ductility. As shown in Figure 12b, the volume fraction of the O phase in S4 with the lowest symmetry among the above phases was at least 20 times that of S1. Thus, S4 exhibited the lowest ductility.

3.5. TEM Characterization

The XRD and EBSD results indicated two secondary phases in all the SLM-fabricated samples, especially the O phase, in which the volume fraction was at least five times that of the Ti3Al phase. Moreover, mechanical properties were affected primarily by the formation of the O phase [35,36]. Accordingly, S1 and S4 were selected for TEM analysis to analyze the microstructure of the O phase in detail. Figure 13 illustrates typical TEM images of S1. Figure 13a depicts a significant dislocation structure where dense dislocation lines can be clearly seen in the slipping bands. In general, the dislocation microstructure was identified in the deformed samples, whereas no external stress was applied in the SLM-fabricated samples. It is known that levels of thermal stress induce the formation of a dislocation structure during the fabricating process [33,34,37]. Accordingly, the above dislocation morphology was usually identified in SLM-fabricated workpieces. As depicted by the selected-area diffraction pattern (SAED), only the diffraction spots for the β/B2 phase matrix could be detected. The dislocation structure of S1 was identified using the double-beam diffraction TEM technique. In Figure 13c, the dislocation lines (marked by yellow lines) are visible with g = 01 1 ¯ marked by the red arrow. Figure 13d–f presents the corresponding element distribution mapping performed by high-angle annular dark field transmission electron microscopy (HAADF-STEM). As depicted in Figure 13d–f, there was no significant element segregation in the β matrix. Combined with the SAED and XRD results, the secondary phase content may be significantly low, making it difficult to identify under TEM observation.
Figure 14 presents the TEM images of S4. Compared with S1, the dislocation structure was not significant in S4; rather, a considerable number of needle-like structures were discovered, as presented by the bright-field TEM images (Figure 14a). In accordance with the appearance of additional reflections (in the yellow circle) in the corresponding SAED pattern recorded from the 111 β / B 2 zone axis (Figure 14a), these needle-like structures were indexed as O phases, indicating the typical orientation relationship (OR) between the O phase and β phase 001 O / / 01 1 ¯ β / B 2 . In the dark-field image generated using reflections in Figure 14c indicated by the yellow circle, needle-shaped O precipitates seem to align along the 01 1 ¯ β and 10 1 ¯ β directions. Notably, the 01 1 ¯ β direction was also the direction of the dislocation line mentioned in Figure 14a. 01 1 ¯ β is one of the easy dislocation slip directions and is parallel to the precipitating or growth direction of O phases [38], which may explain the preferentially precipitating orientation of O phases. Figure 14d–f presents the corresponding elemental maps of Ti, Al, and Nb, indicating the strong solute segregation of Ti and Al atoms and the slight segregation of Nb atoms.
In general, Nb segregation was usually unavoidable in high Nb-addition TiAl and TiAlNb alloys due to the high amount of Nb added and low diffusion rate [39,40]. However, the segregation of alloying elements presented in Figure 14 was closely correlated with O precipitation. As depicted in Figure 14e–g, the β matrix was depleted of solutes while it was very rich in Ti; Al and slight Nb segregation were identified in part of the O needles. In comparing the dark-field image (Figure 14c) with the mapping images (Figure 14d–f), it is noted that not all of the O phase was rich in the above elements. The diversity of the solution elements (e.g., Ti and Al elements) in the O phase was attributed to the distortion effect in the orthorhombic structure. Gabrisch et al. [41] reported the element diversity phenomenon in Ti-42Al-8.5Nb alloy wherein a distorted O phase was enriched in Nb while undistorted phases were rich in Ti. However, this study’s segregation of the Nb element was not clear due to the low diffusion rate and high addition of Nb in Ti-22Al-25Nb.
Figure 15 presents the high-resolution TEM (HR-TEM) images of the typical partial microstructure near the O/B2 interface under the 11 1 ¯ B 2 / β zone axis of S4. In Figure 15a, the O/B2 interface is clearly distinguished and is marked by the yellow line. The interface boundary is straight, and a four-layer atomic layer thickness step is easily identified in the boundary. Figure 15b illustrates the magnified HRTEM micrograph of the interface. A slight mismatch (less than one layer of atomic layer thickness) between the 101 B 2 and 111 O interface was revealed, and the angle between the interface boundary and 101 B 2   111 O reached 60°. Figure 15c,d presents the inverse fast Fourier transform (IFFT) transformation images corresponding to the O phase lattice marked by the red rectangle area in Figure 15b. There was a significant lattice distortion in the 001 O plane compared with the IFFT images corresponding to the 111 O plane. This lattice distortion was primarily ascribed to the occupation of the solid solution atoms, which can be explained by the mapping result as presented in Figure 14e–g.

4. Conclusions

In this study, the microstructure and mechanical properties of Ti-22Al-25Nb IMC alloys fabricated via SLM at four different scanning speeds were analyzed. The following conclusions were drawn through the systematic investigation of the morphology, phase transformation, microstructure evolution, and mechanical properties of the SLM-fabricated samples:
(1)
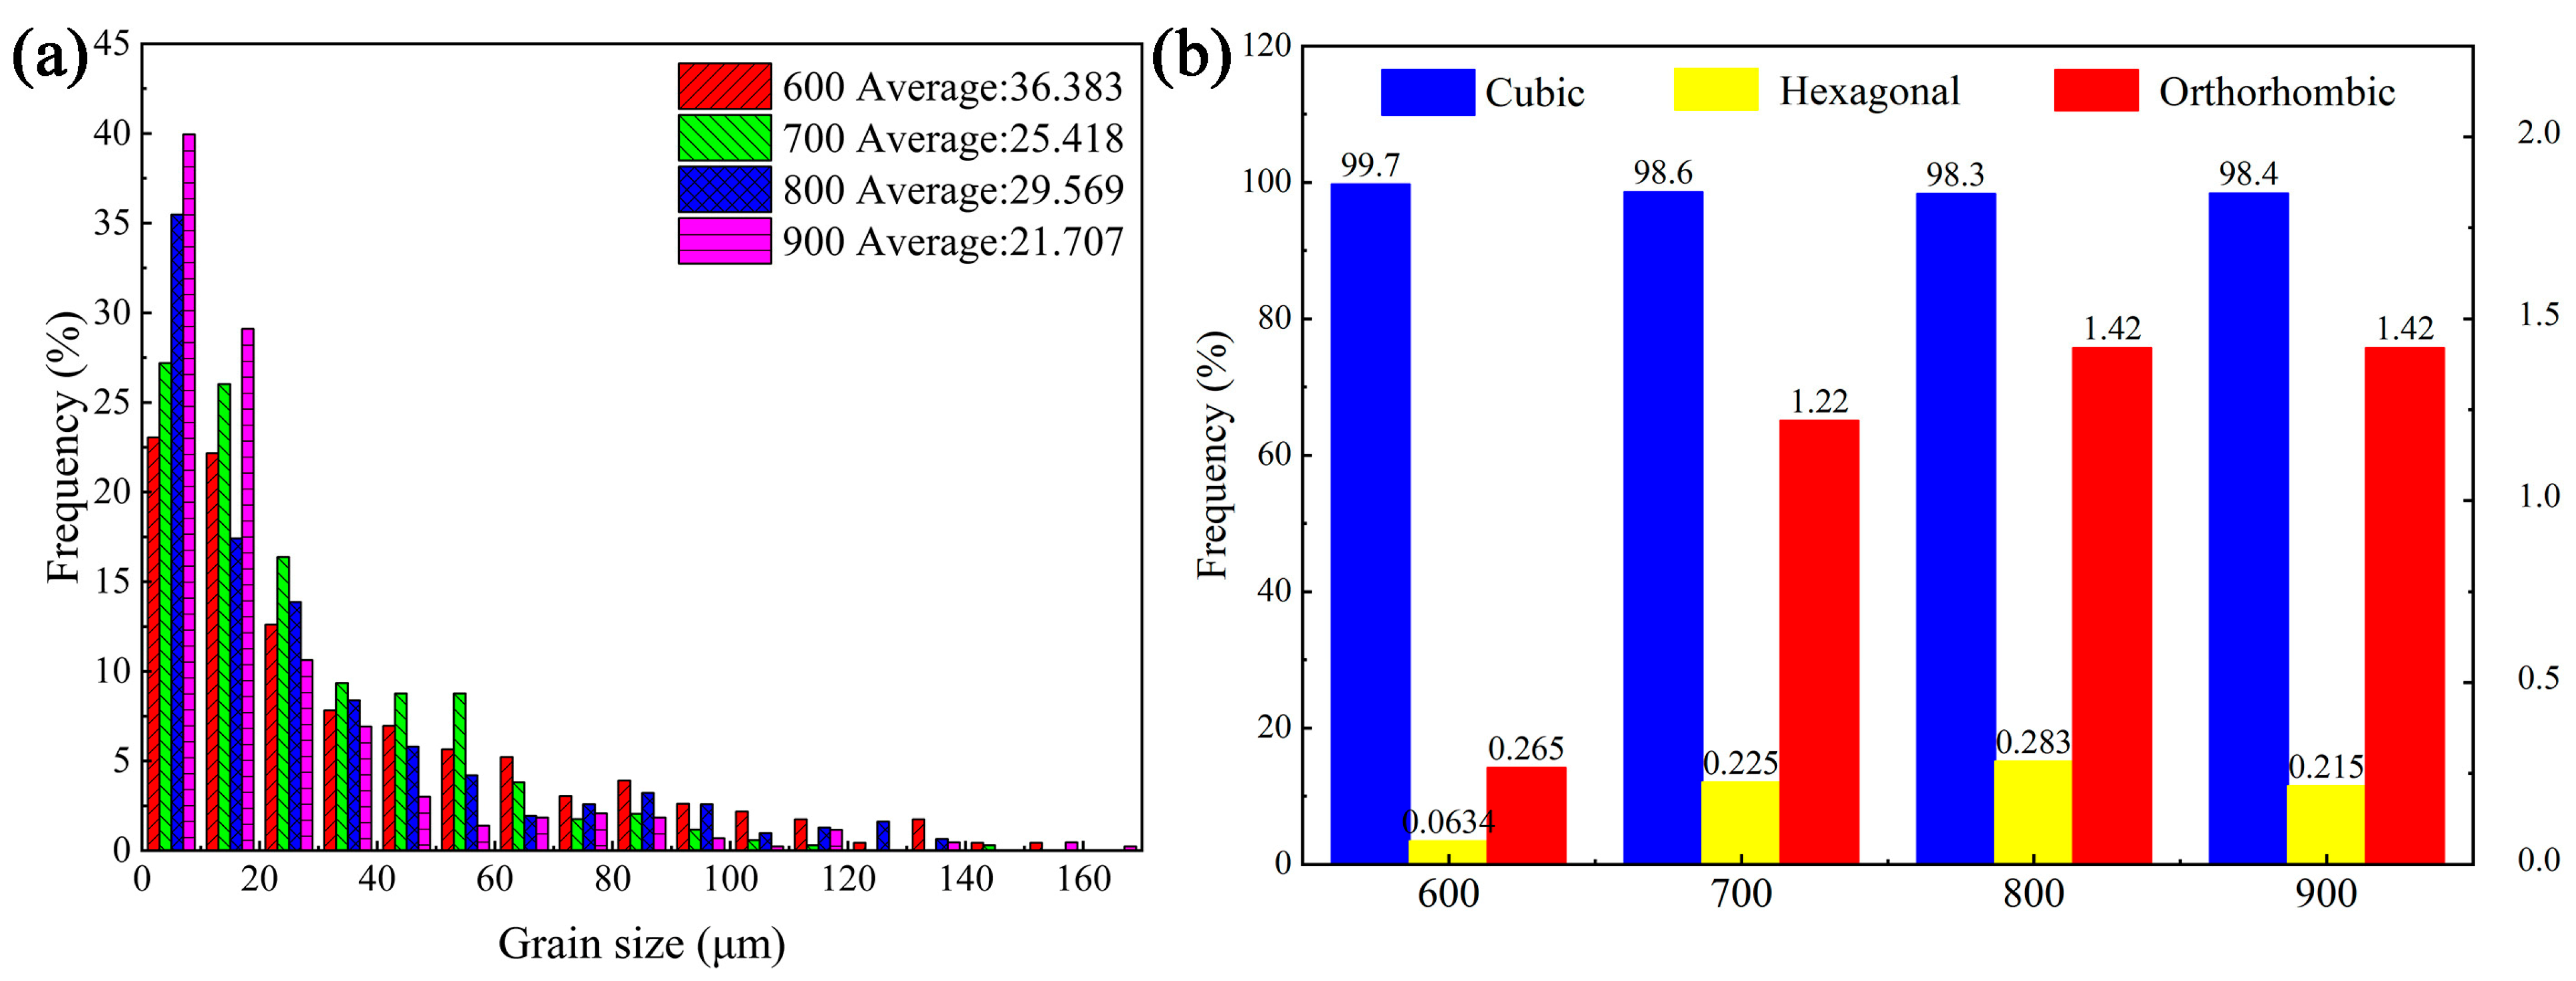
The relative density, grain size, texture density, and volume of secondary phases depended on the scanning speed. The sample with the slowest scanning speed of 600 mm/s exhibited the maximum relative density, grain size, and texture density, while the sample fabricated with the highest speed of 900 mm/s exhibited the minimum relative density, grain size, and texture density.
(2)
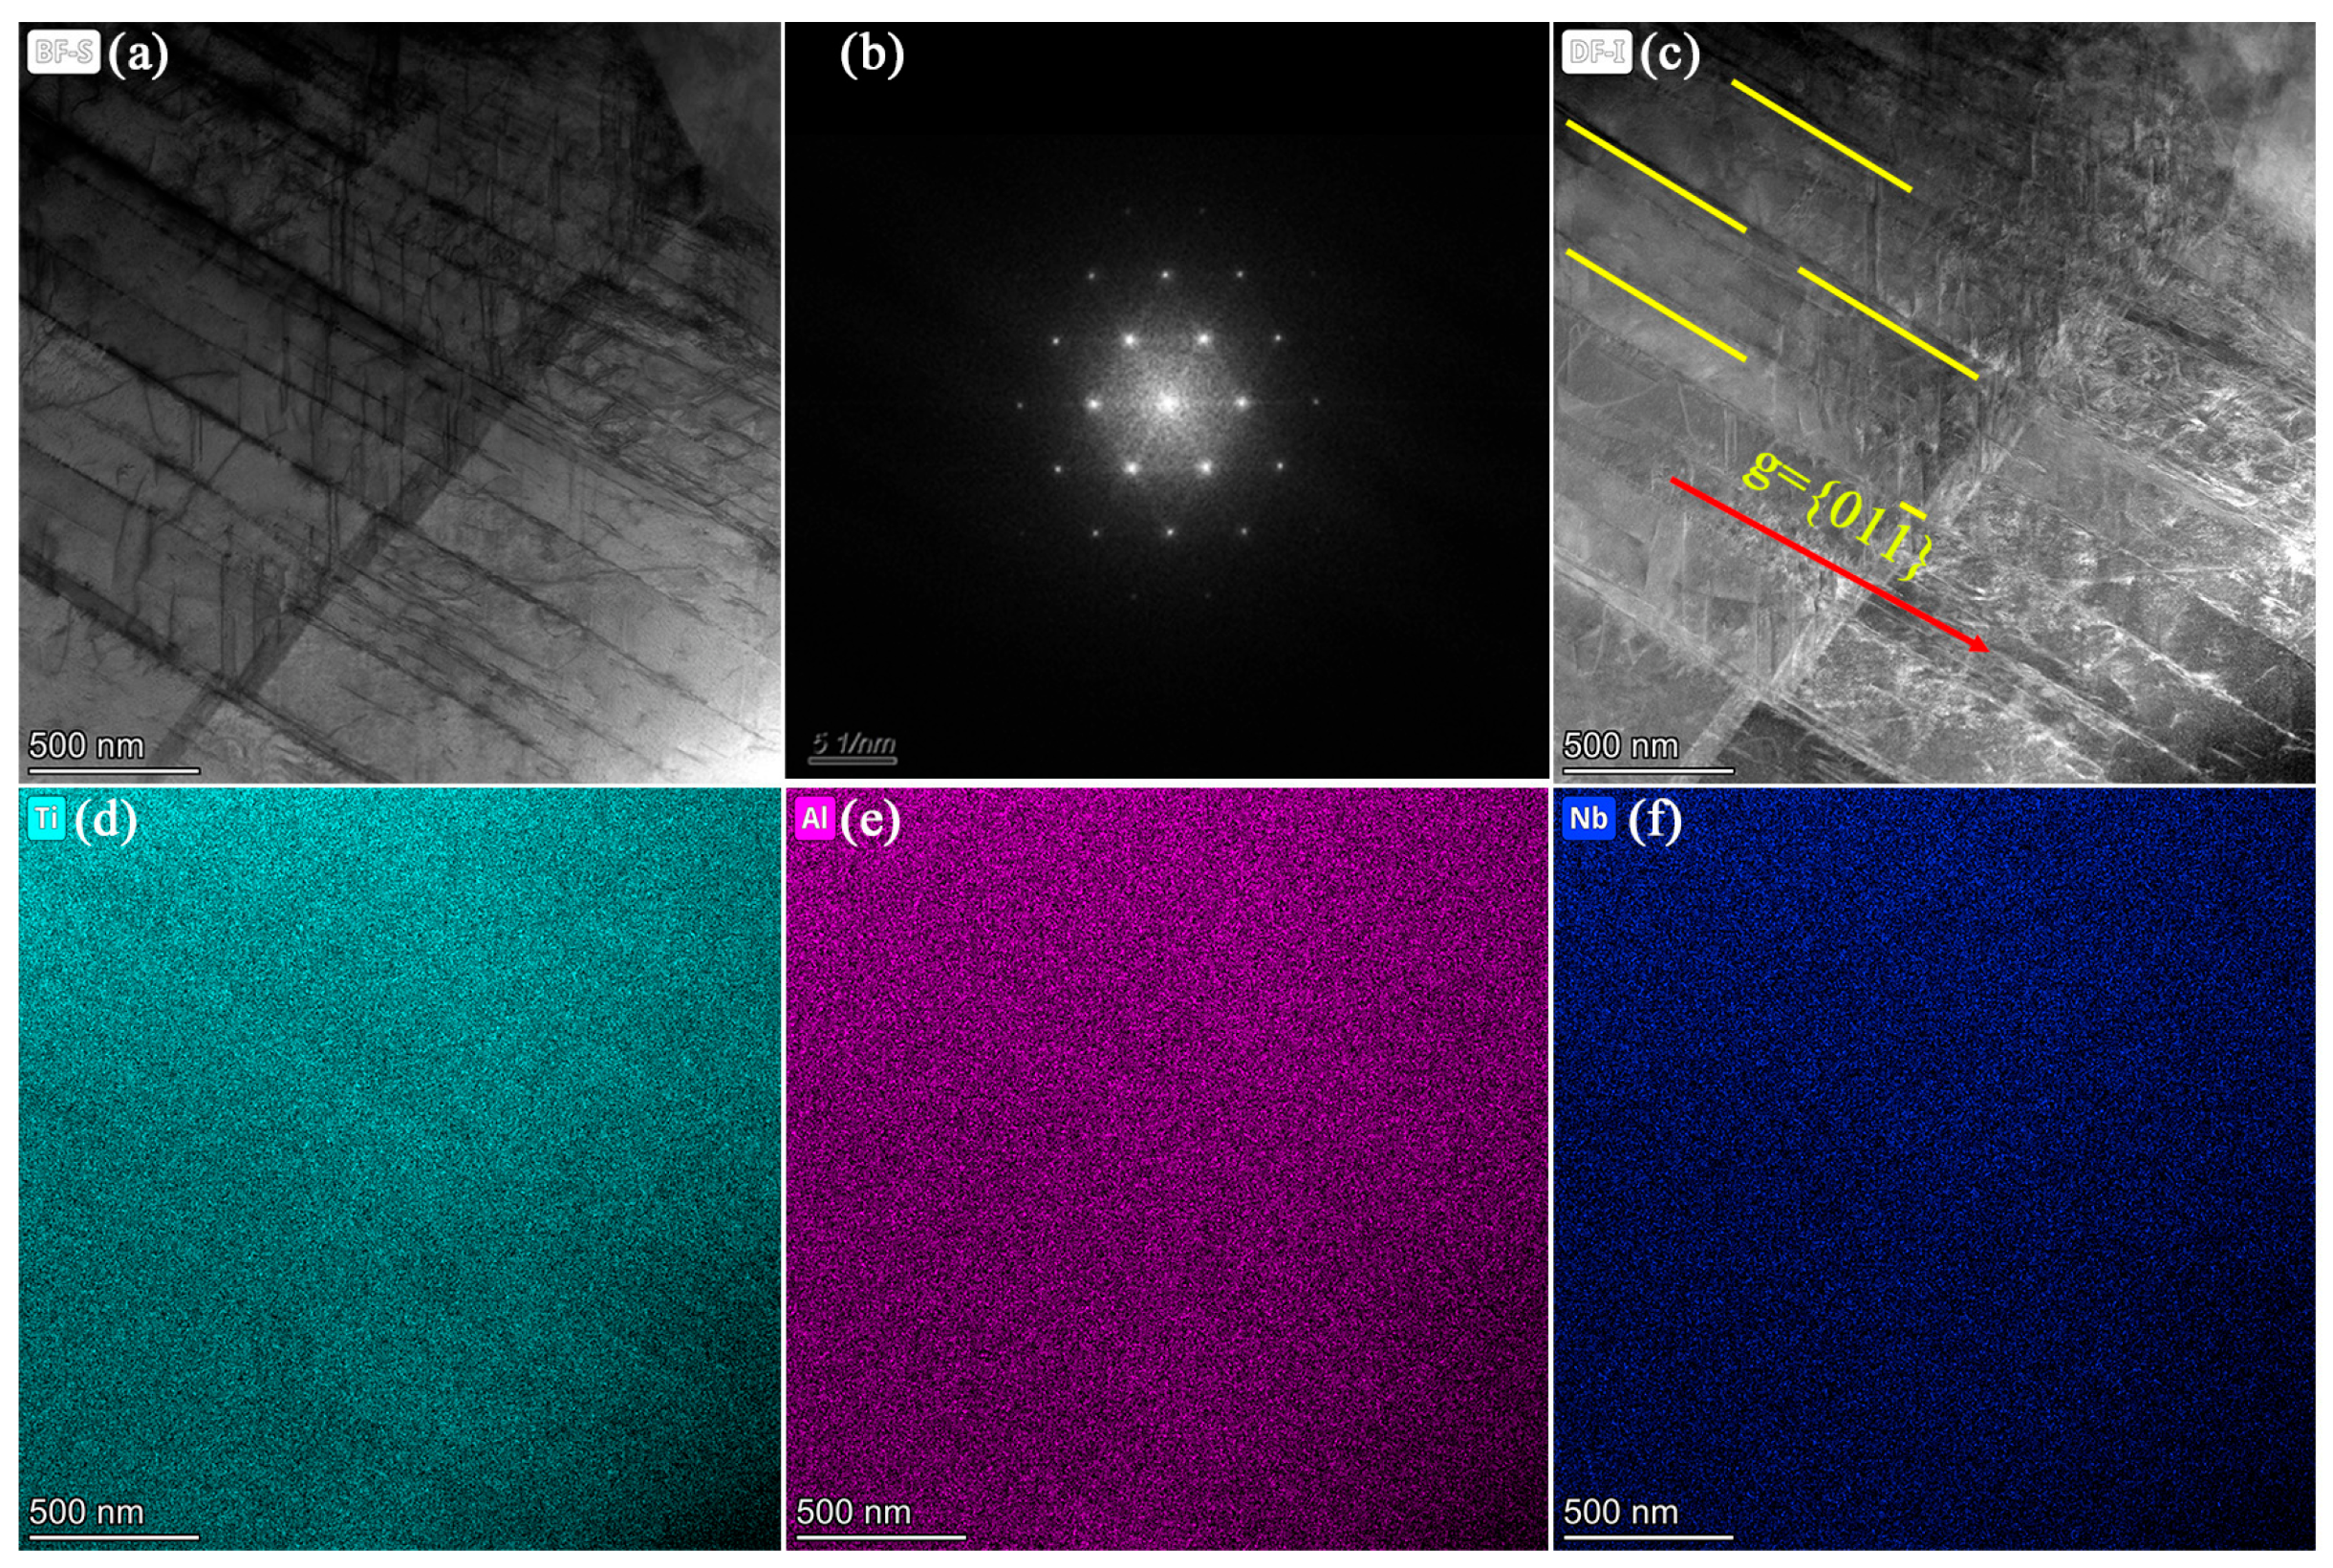
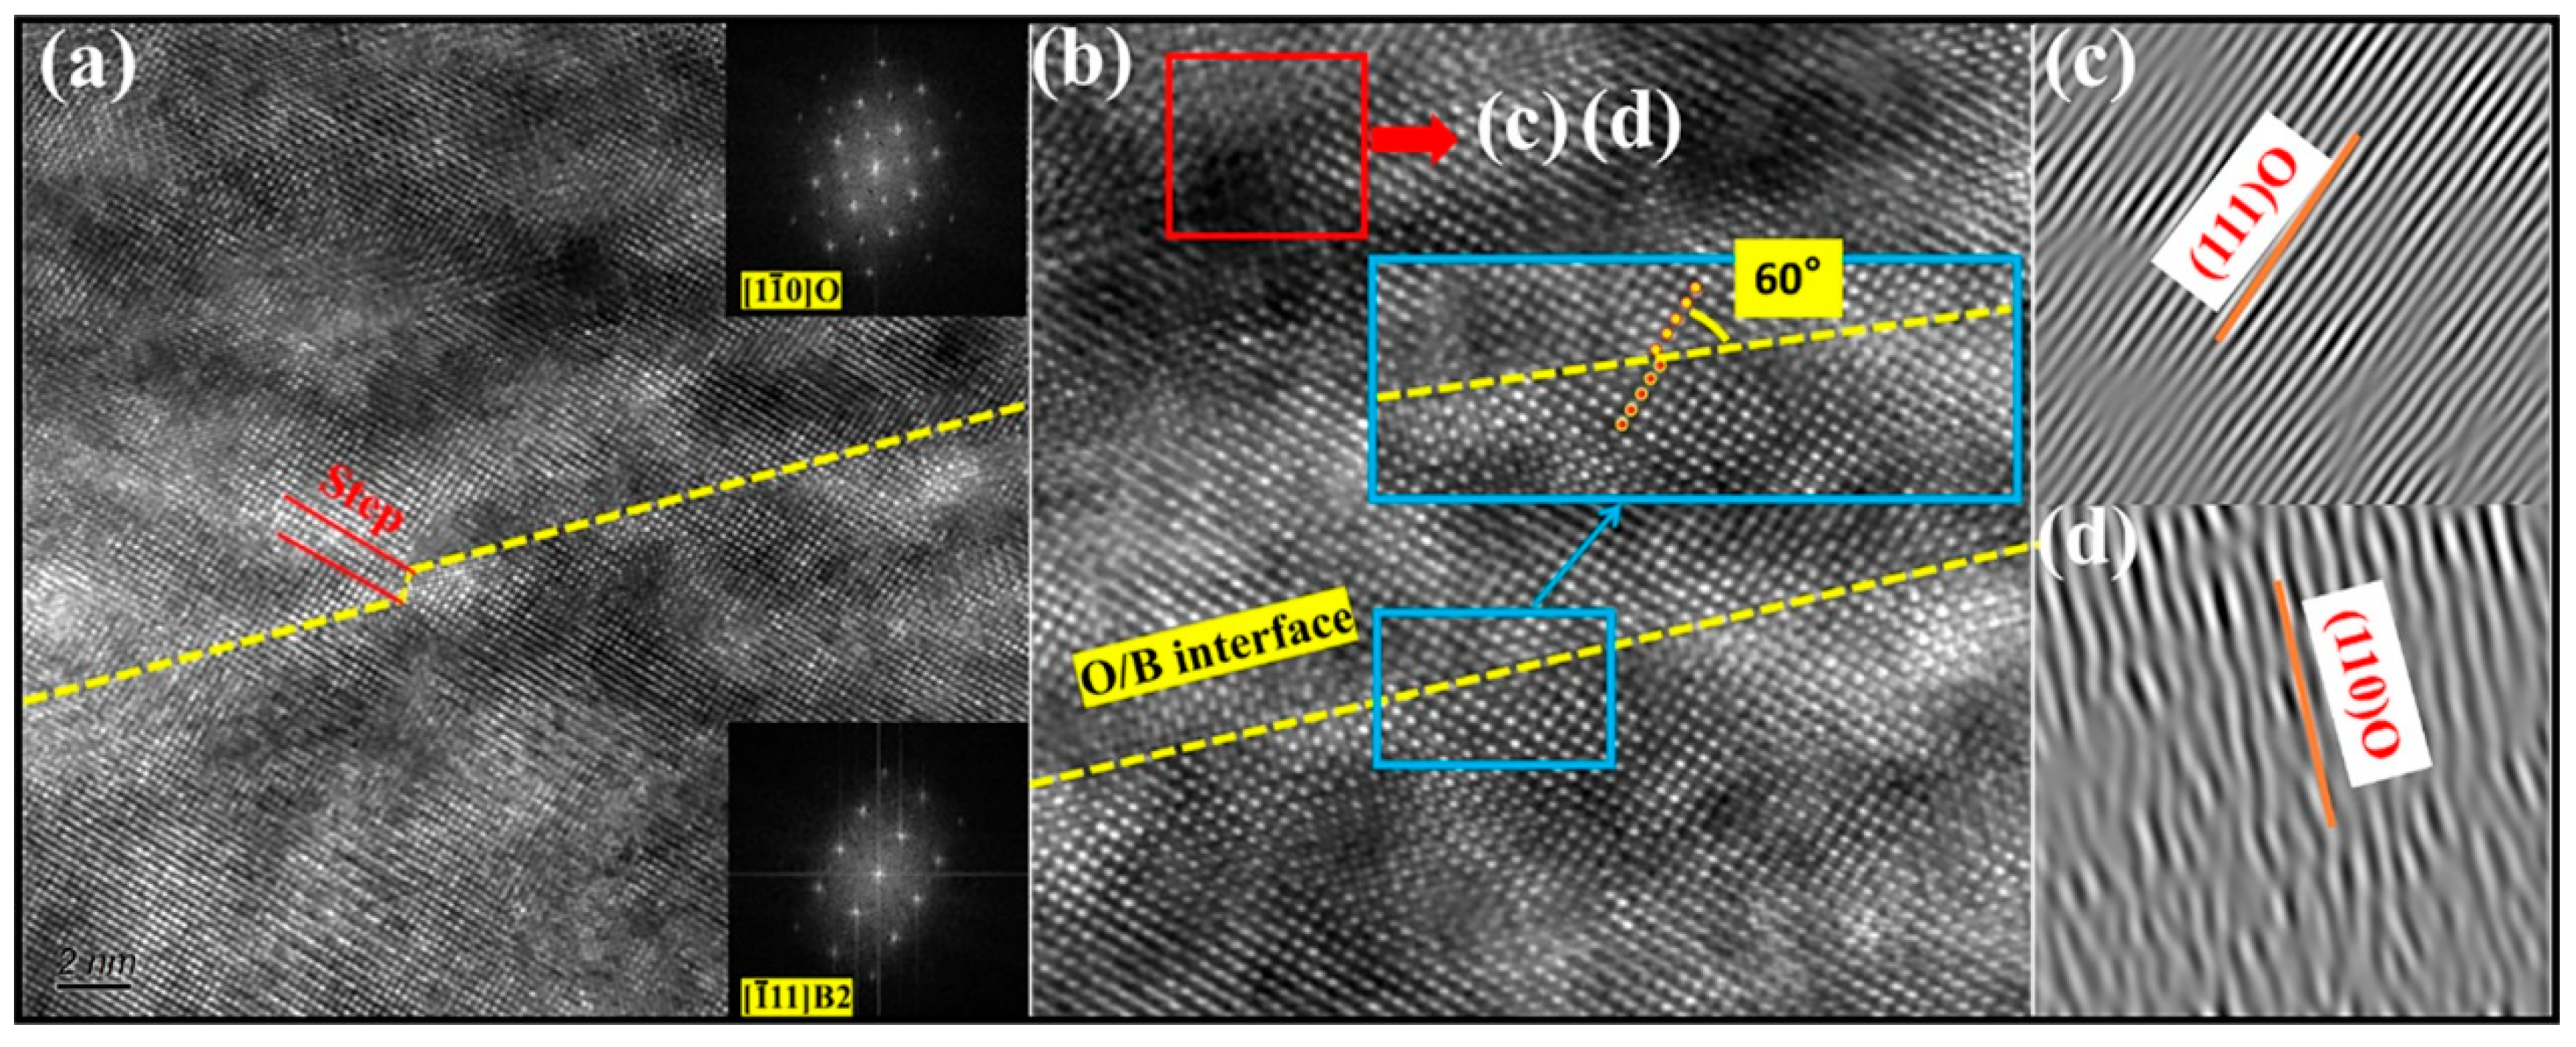
The volume fractions of the Ti3Al and O phases first increased and then decreased with the increase in scanning speed. The above two phases tended to precipitate near the pool boundary, which was the area with the highest dislocation density. Solution element equilibrium and Ti and Al enrichment were identified in lamellar O precipitates.
(3)
The SLM-fabricated sample with a scanning speed of 600 mm/s exhibited the highest strength and elongation, the reason for which was the synergistic effect of the uniformly distributed secondary phases in the matrix.

Author Contributions

Y.L.: writing—original draft, data analysis, data collection, chart production; Z.S.: supervision, research and design, revision, writing—review & editing; X.Y.: supervision, research and design; H.J.: methodology, chart and table; W.H.: supervision revision, data analysis. All authors have read and agreed to the published version of the manuscript.

Funding

The authors received financial support from the National key research and development program (grant numbers 2020YFB1711601 and 2022YFB3404904).

Data Availability Statement

No data was used for the research described in the article.

Conflicts of Interest

The authors declare no conflict of interest.

References

  1. Boyer, R.R. An overview on the use of titanium in the aerospace industry. Mater. Sci. Eng. A 1996, 213, 103–114. [Google Scholar] [CrossRef]
  2. Pang, G.D.; Lin, Y.C.; Jiang, Y.Q.; Zhang, X.Y.; Liu, X.G.; Xiao, Y.W.; Zhou, K.C. Precipitation behaviors and orientation evolution mechanisms of a phases in Ti-55511 titanium alloy during heat treatment and subsequent hot deformation. Mater. Charact. 2020, 167, 110471. [Google Scholar] [CrossRef]
  3. Lutjering, G.G.; William, J.C. Engineering Materials and Processes: Titanium; Springer: New York, NY, USA, 2007; pp. 203–250. [Google Scholar]
  4. Banerjee, D.; Williams, J.C. Perspectives on titanium science and technology. Acta Mater. 2013, 61, 844–879. [Google Scholar] [CrossRef]
  5. Chen, W.; Li, Q.F.; Zhou, L.B.; Qiu, W.; Ren, Y.J.; Li, C.; Chen, J.; Lin, Y.C.; Zhou, K.C. Oxidation mechanism of a near b-Ti alloy. Mater. Des. 2022, 223, 111144. [Google Scholar] [CrossRef]
  6. Banerjee, D.; Gogia, A.K.; Nandy, T.K. A new ordered orthorhombic phase in a Ti3Al-Nb alloy. Acta Metall. 1988, 36, 871–882. [Google Scholar] [CrossRef]
  7. Wang, W.; Zeng, W.; Xue, C.; Liang, X.; Zhang, J. Microstructure control and mechanical properties from isothermal forging and heat treatment of Ti-22Al-25Nb (at. %) orthorhombic alloy. Intermetallics 2015, 56, 79–86. [Google Scholar] [CrossRef]
  8. Chen, W.; Li, Q.F.; Zhou, L.B.; Li, C.; Qiu, W.; Chen, J.; Lin, Y.C.; Zhou, K.C. Limit of cold deformation in a near β-Ti alloy: Role of a′ phases on the failure of β phase during cold rolling. J. Mater. Res. Technol. 2022, 20, 2385–2393. [Google Scholar] [CrossRef]
  9. Devaraj, A.; Joshi, V.V.; Srivastava, A.; Manandhar, S.; Moxson, V.; Duz, V.A. A low-cost hierarchical nanostructured beta-titanium alloy with high strength. Nat. Commun. 2016, 7, 11176. [Google Scholar] [CrossRef] [Green Version]
  10. Zhang, J.L.; Guo, H.Z.; Liang, H.Q. Hot deformation behavior and process parameter optimization of Ti22Al25Nb using processing map. Rare Met. 2016, 35, 118–126. [Google Scholar] [CrossRef]
  11. Sefene, E.M. State-of-the-art of selective laser melting process: A comprehensive review. J. Manuf. Syst. 2022, 63, 250–274. [Google Scholar] [CrossRef]
  12. Zhou, L.; Yuan, T.; Li, R.; Tang, J.; Wang, G.; Guo, K. Selective laser melting of pure tantalum: Densification, microstructure and mechanical behaviors. Mater. Sci. Eng. A 2017, 707, 443–451. [Google Scholar] [CrossRef]
  13. Zhou, L.; Sun, J.; Chen, J.; Chen, W.; Ren, Y.; Niu, Y.; Li, C.; Qiu, W. Performance of Ti-15Mo alloy processed by selective laser melting. J. Alloys Compd. 2022, 928, 167130. [Google Scholar] [CrossRef]
  14. Zhang, T.L.; Huang, Z.H.; Yang, T.; Kong, H.J.; Luan, J.H.; Wang, A.D.; Wang, D.; Kuo, W.; Wang, Y.Z.; Liu, C.T. In situ design of advanced titanium alloy with concentration modulations by additive manufacturing. Science 2021, 374, 478–482. [Google Scholar] [CrossRef]
  15. Zhou, Y.H.; Li, W.P.; Wang, D.W.; Zhang, L.; Ohara, K.; Shen, J.; Ebel, T.; Yan, M. Selective laser melting enabled additive manufacturing of Ti-22Al-25Nb intermetallic: Excellent combination of strength and ductility, and unique microstructural features associated. Acta Mater. 2019, 173, 117–129. [Google Scholar] [CrossRef]
  16. Zhou, L.; Sun, J.; Bi, X.; Chen, J.; Chen, W.; Ren, Y.; Niu, Y.; Li, C.; Qiu, W.; Yuan, T. Effect of scanning strategies on the microstructure and mechanical properties of Ti–15Mo alloy fabricated by selective laser melting. Vacuum 2022, 205, 111454. [Google Scholar] [CrossRef]
  17. Tang, X.; Zhang, S.; Zhang, C.H.; Chen, J.; Zhang, J.B. Optimization of laser energy density and scanning strategy on the forming quality of 24CrNiMo low alloy steel manufactured by SLM. Mater. Charact. 2020, 170, 110718. [Google Scholar] [CrossRef]
  18. Song, C.H.; Deng, Z.T.; Zhou, Z.; Liu, L.S.; Xu, K.X.; Yang, Y.Q. Pure tantalum manufactured by laser powder bed fusion: Influence of scanning speed on the evolution of microstructure and mechanical properties. Int. J. Refract. Met. Hard Mater. 2022, 107, 105882. [Google Scholar] [CrossRef]
  19. Song, C.H.; Deng, Z.T.; Zhou, Z.; Liu, L.S.; Xu, K.X.; Yang, Y.Q. Influence of SLM scan-speed on microstructure, precipitation of Al3Sc particles and mechanical properties in Sc- and Zr-modified Al-Mg alloys. Mater. Des. 2018, 140, 134–143. [Google Scholar]
  20. Bhardwaj, T.; Shukla; Paul, C.P.; Bindra, K.S. Direct Energy Deposition—Laser Additive Manufacturing of Titanium-Molybdenum alloy: Parametric studies, microstructure and mechanical properties. J. Alloys Compd. 2019, 787, 1238–1248. [Google Scholar] [CrossRef]
  21. Li, W.; Zhou, Y.; Li, S.; Wen, S.F.; Wei, Q.S.; Yan, C.Z.; Shi, Y.S. Effect of laser scanning speed on a Ti-45Al-2Cr-5Nb alloy processed by selective laser melting: Microstructure, phase and mechanical properties. J. Alloys Compd. 2016, 688, 626–636. [Google Scholar] [CrossRef]
  22. Ahmed, M.; Obeidi, M.A.; Yin, S.; Lupoi, R. Influence of processing parameters on density, surface morphologies and hardness of as-built Ti-5Al-5Mo-5V-3Cr alloy manufactured by selective laser melting. J. Alloys Compd. 2022, 910, 164760. [Google Scholar] [CrossRef]
  23. Yang, X.; Zhang; Bai, Q.; Xie, G. Correlation of microstructure and mechanical properties of Ti2AlNb manufactured by SLM and heat treatment. Intermetallics 2021, 139, 107367. [Google Scholar] [CrossRef]
  24. Arab, J.; Mishra, D.K.; Dixit, P. Measurement and analysis of the geometric characteristics of microholes and tool wear for varying tool-workpiece gaps in electrochemical discharge drilling. Measurement 2020, 168, 108463. [Google Scholar] [CrossRef]
  25. Couret, A.; Reyes, D.; Thomas, M.; Ramond, N.R.; Desshayes, C.; Monchoux, J.P. Effect of ageing on the properties of the W-containing IRIS-TiAl alloy. Acta Mater. 2020, 199, 169–180. [Google Scholar] [CrossRef]
  26. Guo, W.Q.; Feng, B.; Yang, Y.; Ren, Y.; Liu, Y.N.; Yang, H.; Yang, Q.; Cui, L.S.; Tong, X.; Hao, S.J. Effect of laser scanning speed on the microstructure, phase transformation and mechanical property of NiTi alloys fabricated by LPBF. Mater. Des. 2022, 215, 110460. [Google Scholar] [CrossRef]
  27. Xu, S.; Cai, Q.; Li, G.; Lu, X.; Zhu, X. Effect of scanning speed on microstructure and properties of TiC/Ni60 composite coatings on Ti6Al4V alloy by laser cladding. Opt. Laser Technol. 2022, 154, 108309. [Google Scholar] [CrossRef]
  28. Chen, W.; Chen, C.; Zi, X.H.; Cheng, X.F.; Zhang, X.Y.; Lin, Y.C.; Zhou, K.C. Controlling the microstructure and mechanical properties of a metastable β titanium alloy by selective laser melting. Mater. Sci. Eng. A 2018, 726, 240–250. [Google Scholar] [CrossRef]
  29. Huang, W.; Li, Y.; Yanjie, R.E.N.; Sun, J.; Xia, Z.; Zhou, L.; Li, C.; Chen, J. Effect of scanning speed on the high-temperature oxidation resistance and mechanical properties of Inconel 625 alloys fabricated by selective laser melting. Vacuum 2022, 206, 111447. [Google Scholar] [CrossRef]
  30. Wang, Q.; Han, C.J.; Choma, T.; Wei, Q.S.; Yan, C.Z.; Song, B.; Shi, Y.S. Effect of Nb content on microstructure, property and in vitro apatite-forming capability of Ti-Nb alloys fabricated via selective laser melting. Mater. Des. 2017, 126, 268–277. [Google Scholar] [CrossRef]
  31. Sui, X.C.; Liu, Q.; Luo, S.Y.; Liu, Y.K.; Li, Z.L.; Kang, Q.X.; Wang, G.F. Achieving high ductility of Ti2AlNb sheet without sacrificing the tensile strength without post heat treatment. Mater. Sci. Eng. A 2022, 840, 142897. [Google Scholar] [CrossRef]
  32. Zhang, H.Y.; Yan, N.; Liang, H.Y.; Liu, Y.C. Phase transformation and microstructure control of Ti2AlNb-based alloys: A review. J. Mater. Sci. Technol. 2021, 80, 203–216. [Google Scholar] [CrossRef]
  33. Thijs, L.; Verhaeghe, F.; Craeghs, T.; Van Humbeeck, J.; Kruth, J.P. A study of the microstructural evolution during selective laser melting of Ti-6Al-4V. Acta Mater. 2010, 58, 3303–3312. [Google Scholar] [CrossRef]
  34. Zavodov, A.V.; Medvedev, P.N.; Nochovnaya, N.A. Effects of Dislocation Density and Concentration of Vacancies on Growth of O-Phase in Ti2AlNb-Based Alloy. Met. Sci. Heat Treat. 2021, 62, 612. [Google Scholar] [CrossRef]
  35. Facchini, L.; Magalini, E.; Robotti, P.; Molinari, A.; Hoges, S.H.; Wissenbach, K. Ductility of a Ti-6Al-4V alloy produced by selective laser melting of prealloyed powders. Rapid Prototyp. J. 2010, 16, 450–459. [Google Scholar] [CrossRef]
  36. Fu, Y.; Cui, Z. Effects of Plastic Deformation and Aging Treatment on Phase Precipitation in Ti2AlNb Alloy. J. Mater. Eng. Perform. 2022, 31, 2633–2643. [Google Scholar] [CrossRef]
  37. Xu, W.; Brandt, M.; Sun, S.; Elambasseril, J.; Liu, Q.; Latham, K.; Xia, K.; Qian, M. Additive manufacturing of strong and ductile Ti-6Al-4V by selective laser melting via in situ martensite decomposition. Acta Mater. 2015, 85, 74–84. [Google Scholar] [CrossRef]
  38. Hirth, J.P.; Wang, J.; Tomé, C.N. Disconnections and other defects associated with twin interfaces. Prog. Mater. Sci. 2016, 83, 417–471. [Google Scholar] [CrossRef] [Green Version]
  39. Chai, L.; Chen, Y.; Liu, Z. Effects of Y and Nb on the Microstructure and Mechanical Properties of Rapidly Solidified TiAl Alloys. Rare Met. Mater. Eng. 2011, 40, 1976–1981. [Google Scholar]
  40. Fang, H.; Chen, R.; Chen, X.; Yang, Y.; Su, Y.; Ding, H.; Guo, J. Effect of Ta element on microstructure formation and mechanical properties of high-Nb TiAl alloys. Intermetallics 2019, 104, 43–51. [Google Scholar] [CrossRef]
  41. Gabrisch, H.; Janovská, M.; Rackel, M.W.; Pyczak, F.; Stark, A. Impact of microstructure on elastic properties in the alloy Ti-42Al-8.5Nb. J. Alloys Compd. 2019, 932, 167578. [Google Scholar] [CrossRef]
Figure 1. (a) Powder morphology of Ti-22Al-25Nb alloy, (b) particle size distribution of Ti-22Al-25Nb alloy, (c) schematic diagram of scanning strategies, (d) schematic of cubic and tensile specimens.
Metals 13 00634 g001
Figure 2. Light optical microstructure of SLM-fabricated Ti-22Al-25Nb: (a) S1, (b) S2, (c) S3, and (d) S4.
Metals 13 00634 g002
Figure 3. Variation in relative density with scanning speed.
Metals 13 00634 g003
Figure 4. Microstructural characteristics of Ti-22Al-25Nb identified by SEM: (a) S1, (b) S2, (c) S3, and (d) S4.
Metals 13 00634 g004
Figure 5. SEM images and their corresponding EDX composition maps of the Ti-22Al-25Nb samples: (a) sample 1, (b) sample 2, (c) sample 3, and (d) sample 4.
Metals 13 00634 g005
Figure 6. IPF maps of the XY plane for the Ti-22Al-25Nb alloy formed through SLM at four scanning speeds: (a) sample 1, (b) sample 2, (c) sample 3, and (d) sample 4.
Metals 13 00634 g006
Figure 7. Kernel average misorientation (KAM) maps of the Ti-22Al-25Nb samples: (a) sample 1, (b) sample 2, (c) sample 3, and (d) sample 4.
Metals 13 00634 g007
Figure 8. PF maps measured from top view of samples fabricated at four scanning rates: (a) 600, (b) 700, (c) 800, and (d) 900 mm/s.
Metals 13 00634 g008
Figure 9. XRD patterns of the Ti-22Al-25Nb alloy with different scanning strategies via SLM process.
Metals 13 00634 g009
Figure 10. Phase maps of the SLM-fabricated Ti-22Al-25Nb samples: (a,b) sample 1, (c,d) sample 2, (e,f) sample 3, and (g,h) sample 4.
Metals 13 00634 g010
Figure 11. (a) Stress–strain curves of SLM-processed Ti-22Al-25Nb samples at different scanning speeds, (b) variations in average tensile strength and elongation with scanning speed.
Metals 13 00634 g011
Figure 12. (a) Distribution of grain size and (b) volume fraction of the phases in the Ti-22Al-25Nb alloy formed via SLM at four scanning speeds.
Metals 13 00634 g012
Figure 13. (a) TEM image of S1 (scanning speed: 600 mm/s). (b) SAED pattern corresponding to (a). (c) Bright-field image under double-beam condition. (df) HAADF mapping images of Ti, Al, and Nb.
Metals 13 00634 g013
Figure 14. (a) TEM image of S4 (scanning speed: 900 mm/s). (b) SAED pattern corresponding to (a). (c) Dark-field image recorded using the reflections in the yellow circle in (b). (df) HAADF mapping images of Ti, Al, and Nb.
Metals 13 00634 g014
Figure 15. (a) High-resolution TEM image of S4 (scanning speed: 900 mm/s). (b) Magnified image corresponding to (a,c,d) inverse Fourier-filtered HRTEM images corresponding to the red rectangle area in Figure 15b.
Metals 13 00634 g015
Table 1. SLM process parameters applied in this study.
SampleLaser Power (W)Scanning Speed (mm/s)Layer Thickness (mm)Hatch Distance (mm)VED (J/mm3)
S11806000.030.1100.0
S21807000.030.185.7
S31808000.030.175.0
S41809000.030.166.7
Disclaimer/Publisher’s Note: The statements, opinions and data contained in all publications are solely those of the individual author(s) and contributor(s) and not of MDPI and/or the editor(s). MDPI and/or the editor(s) disclaim responsibility for any injury to people or property resulting from any ideas, methods, instructions or products referred to in the content.

